Symrise AG · XETR:SY1
Symrise — FY2018 Earnings Presentation
38 slides from Symrise's earnings presentation, Mar 13, 2019
Slide 1: Results for the Financial Year 2018
Results for the Financial Year 2018 Dr. Heinz-Jürgen Bertram (CEO), Olaf Klinger (CFO), Dr. Jean-Yves Parisot (President Nutrition) – Frankfurt, 13 March 2019
Slide 2: Agenda
Agenda Overview — 1 2018 at a glance 2 Financials 2018 3 Acquisition ADF/IDF 4 Outlook 2019 – Long-term objectives 2025 — 2
Slide 3: 2018 at a glance
1 2018 at a glance Dr. Heinz-Jürgen Bertram, CEO 3
Slide 4: Financial Highlights FY 2018
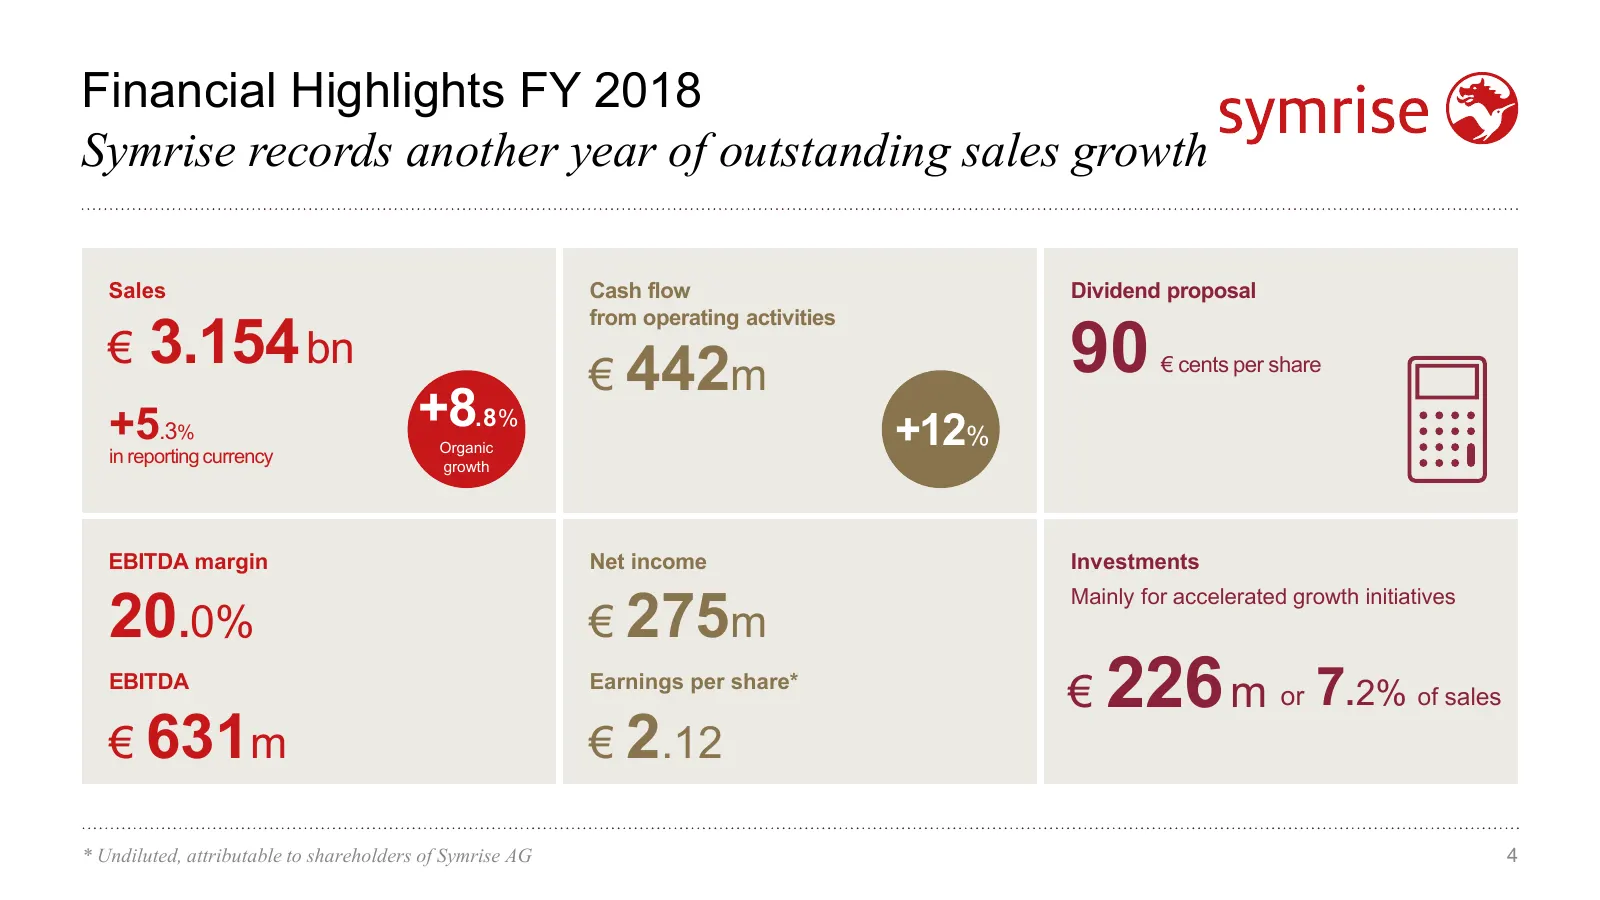
Financial Highlights FY 2018 Symrise records another year of outstanding sales growth Sales Cash flow Dividend proposal € 3.154 bn 90 from operating activities € 442m € cents per share +5.3% +8.8% +12% Organic in reporting currency growth EBITDA margin Net income Investments 20.0% € 275m Mainly for
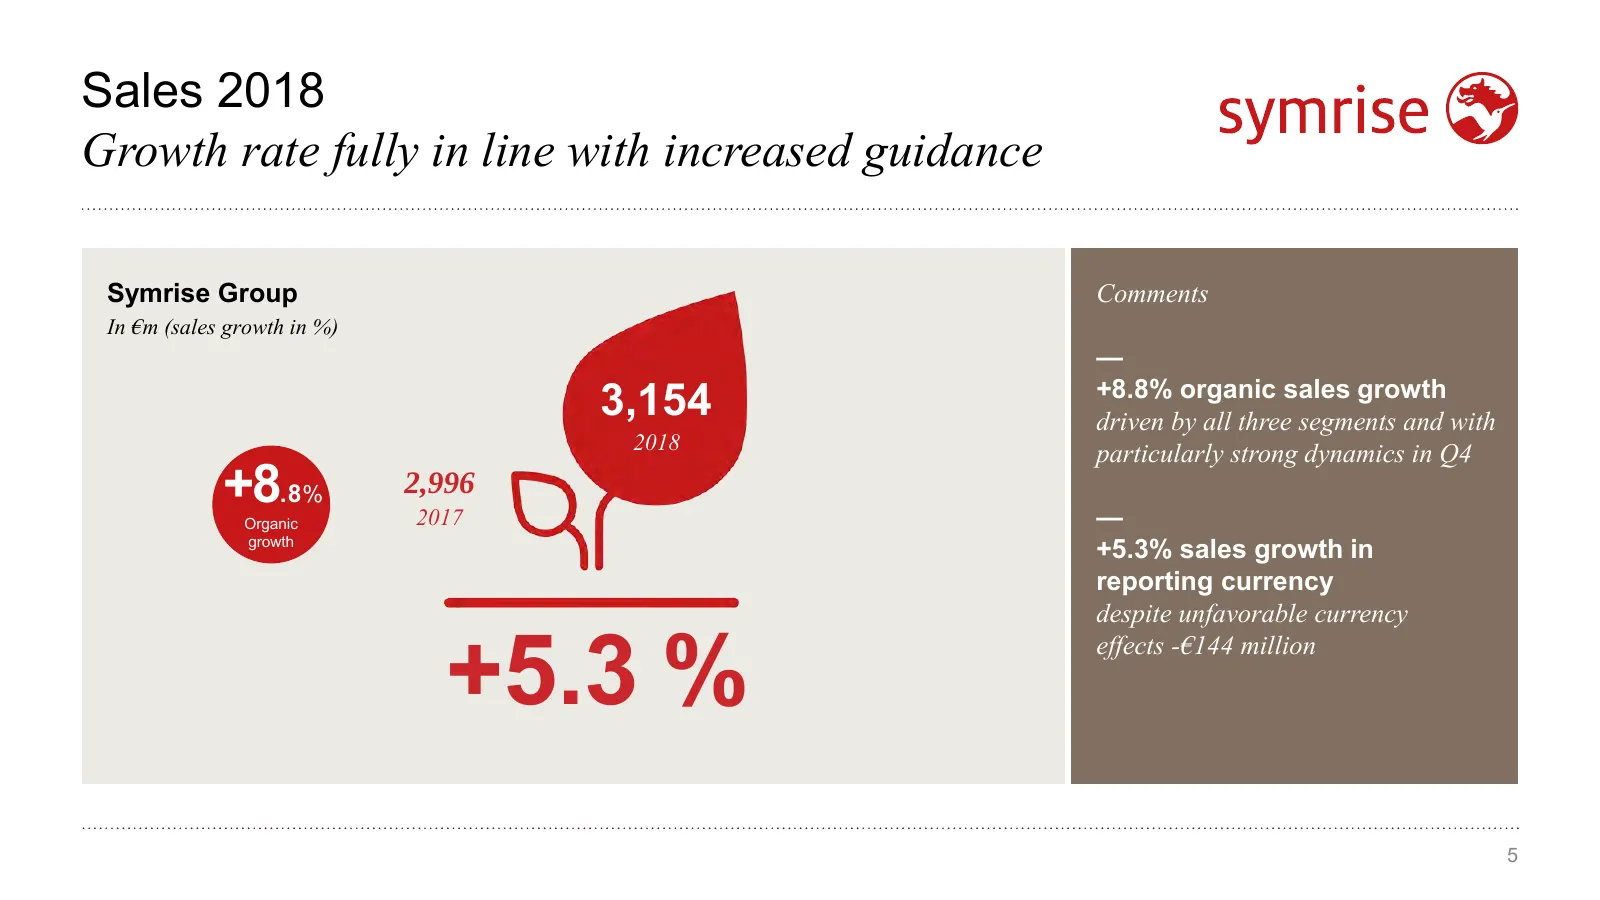
Slide 5: Sales 2018: Growth rate fully in line with increased guidance
Sales 2018 Growth rate fully in line with increased guidance Symrise Group Comments In €m (sales growth in %) — 3,154 +8.8% organic sales growth driven by all three segments and with 2018 particularly strong dynamics in Q4 +8.8% 2,996 2017 — Organic growth +5.3% sales growth in reporting currency de
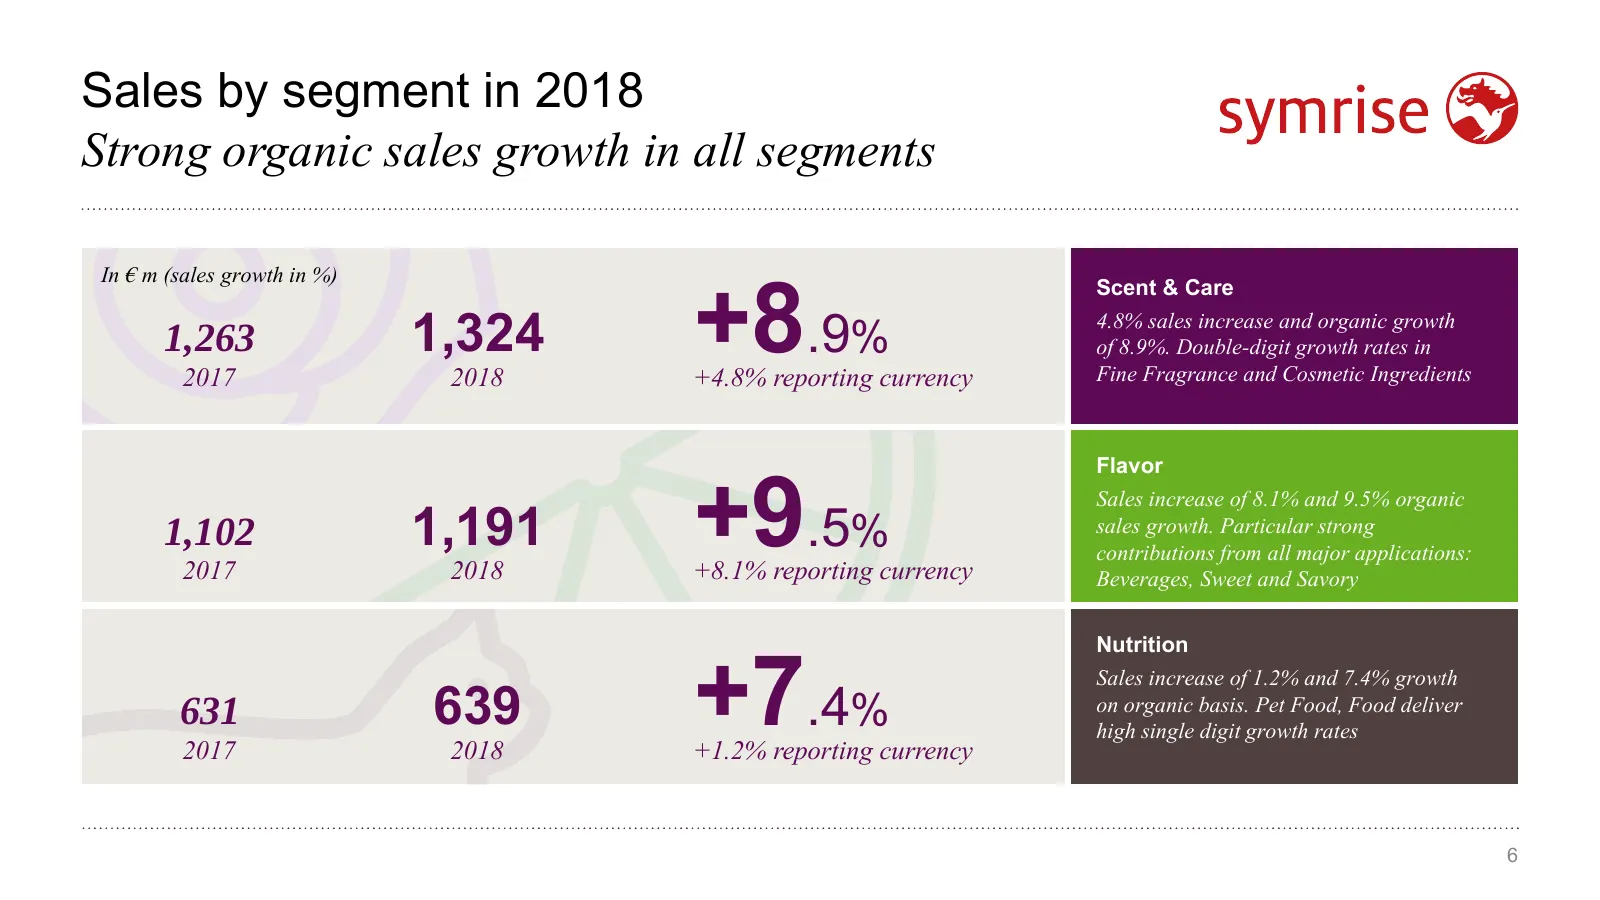
Slide 6: Sales by segment in 2018
Sales by segment in 2018 Strong organic sales growth in all segments +8.9% In € m (sales growth in %) Scent & Care 1,263 1,324 4.8% sales increase and organic growth of 8.9%. Double-digit growth rates in 2017 2018 +4.8% reporting currency Fine Fragrance and Cosmetic Ingredients +9.5% Flavor Sales in
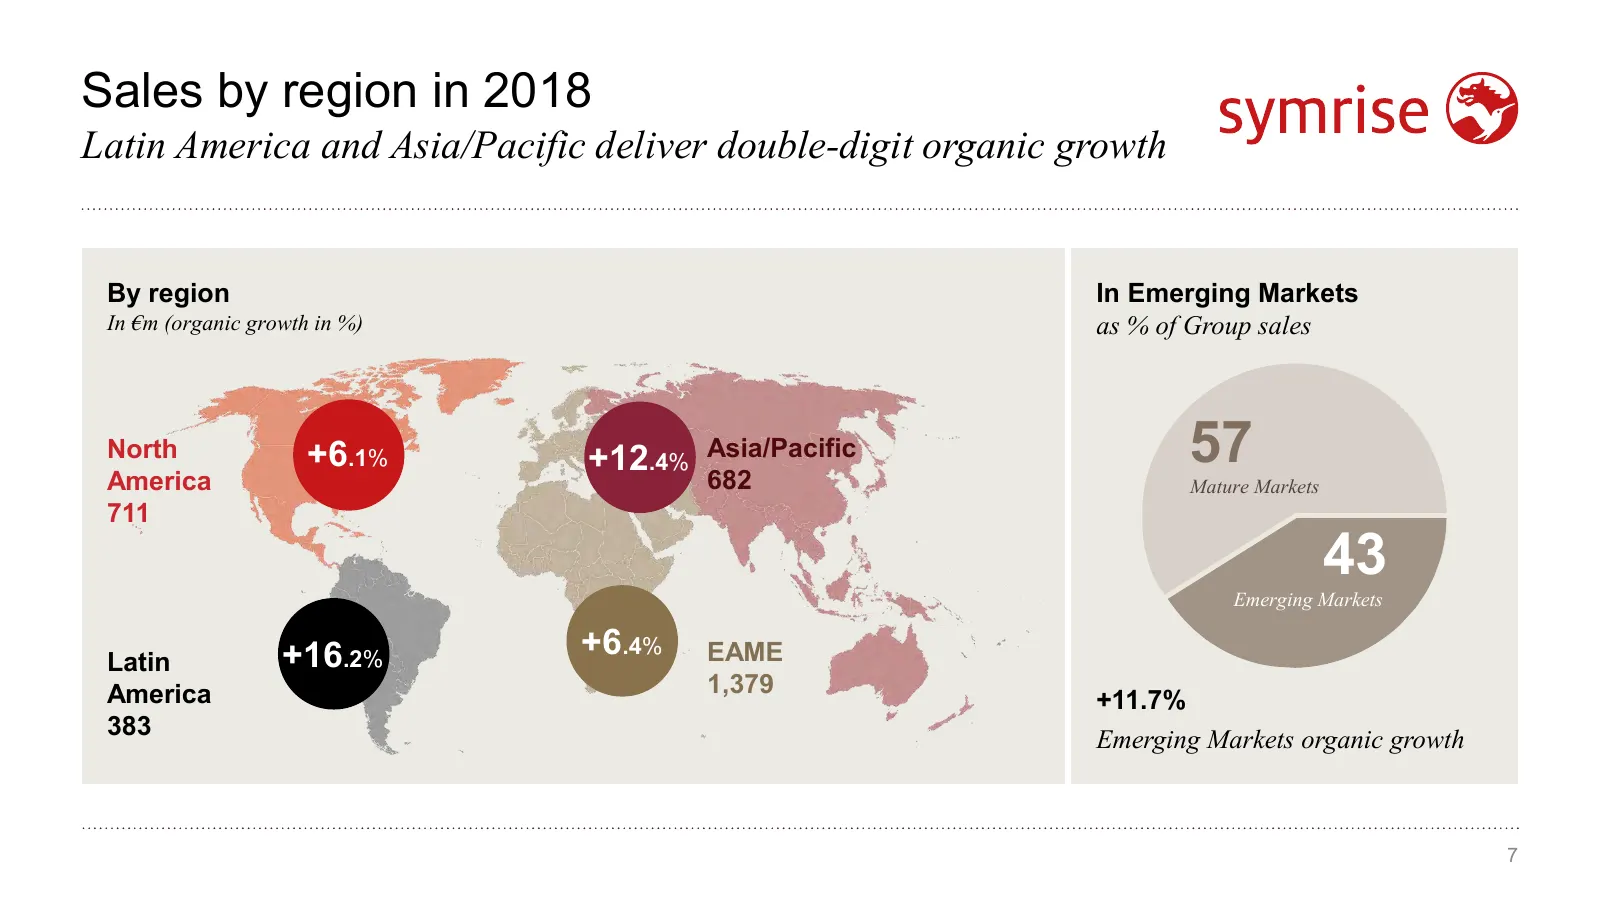
Slide 7: Sales by region in 2018
Sales by region in 2018 Latin America and Asia/Pacific deliver double-digit organic growth By region In Emerging Markets In €m (organic growth in %) as % of Group sales North America +6.1% +12.4% Asia/Pacific 682 57 Mature Markets 711 43 Emerging Markets Latin +16.2% +6.4% EAME America 1,379 +11.7%
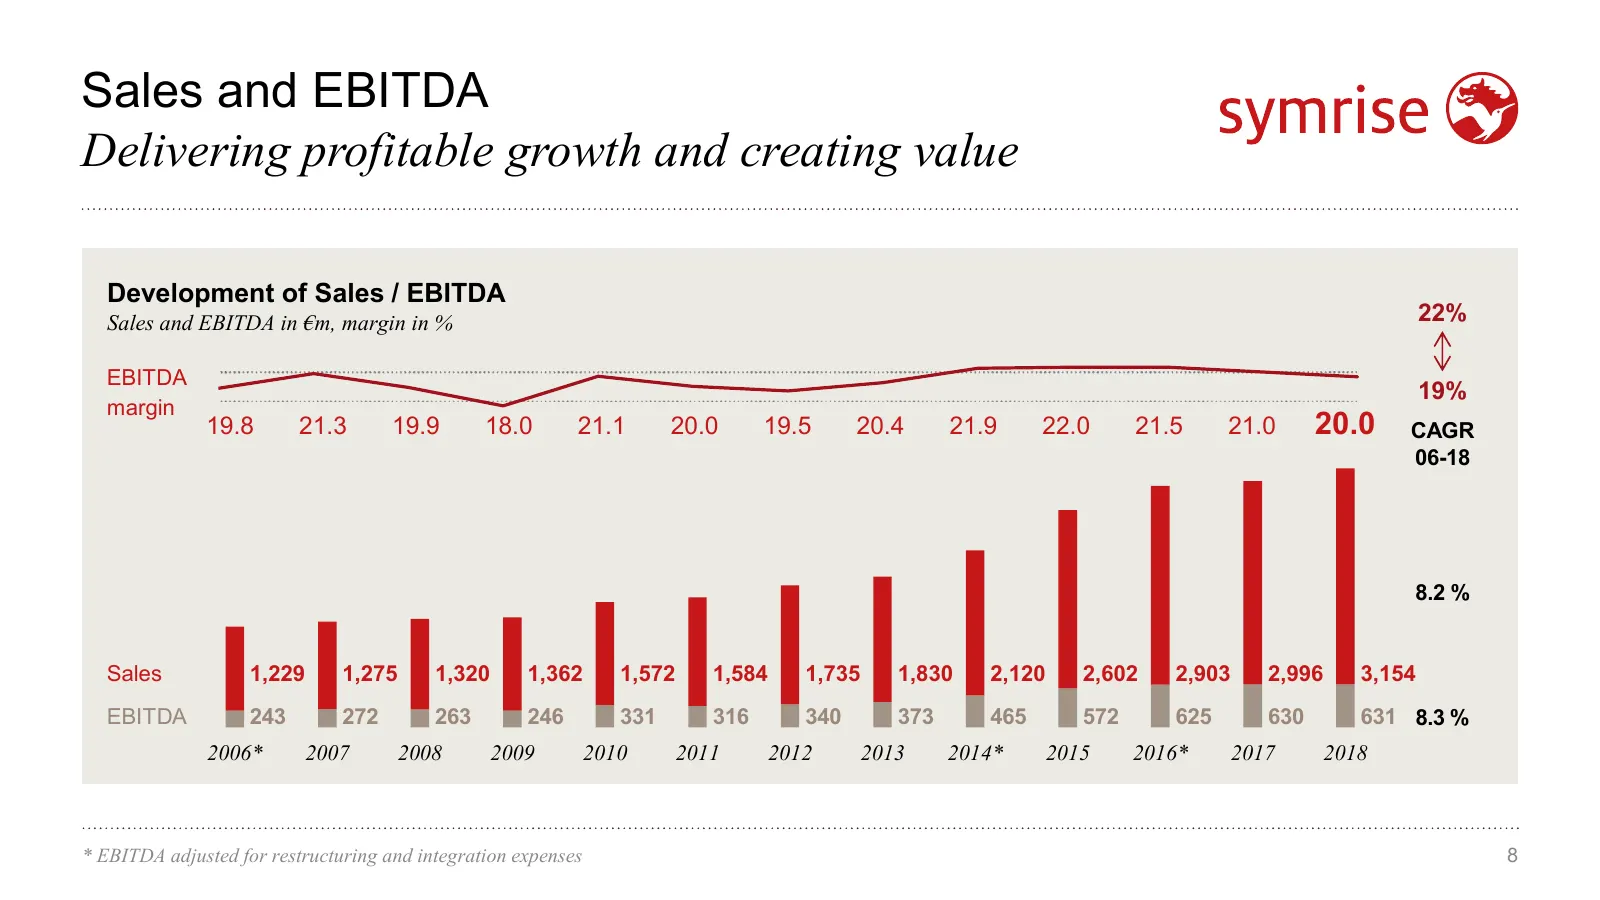
Slide 8: Sales and EBITDA: Delivering profitable growth and creating value
Sales and EBITDA Delivering profitable growth and creating value Development of Sales / EBITDA Sales and EBITDA in €m, margin in % 22% EBITDA 19% margin 19.8 21.3 19.9 18.0 21.1 20.0 19.5 20.4 21.9 22.0 21.5 21.0 20.0 CAGR 06-18 8.2 % Sales 1,229 1,275 1,320 1,362 1,572 1,584 1,735 1,830 2,120 2,602
Slide 9: Share price performance exceeds MDAX
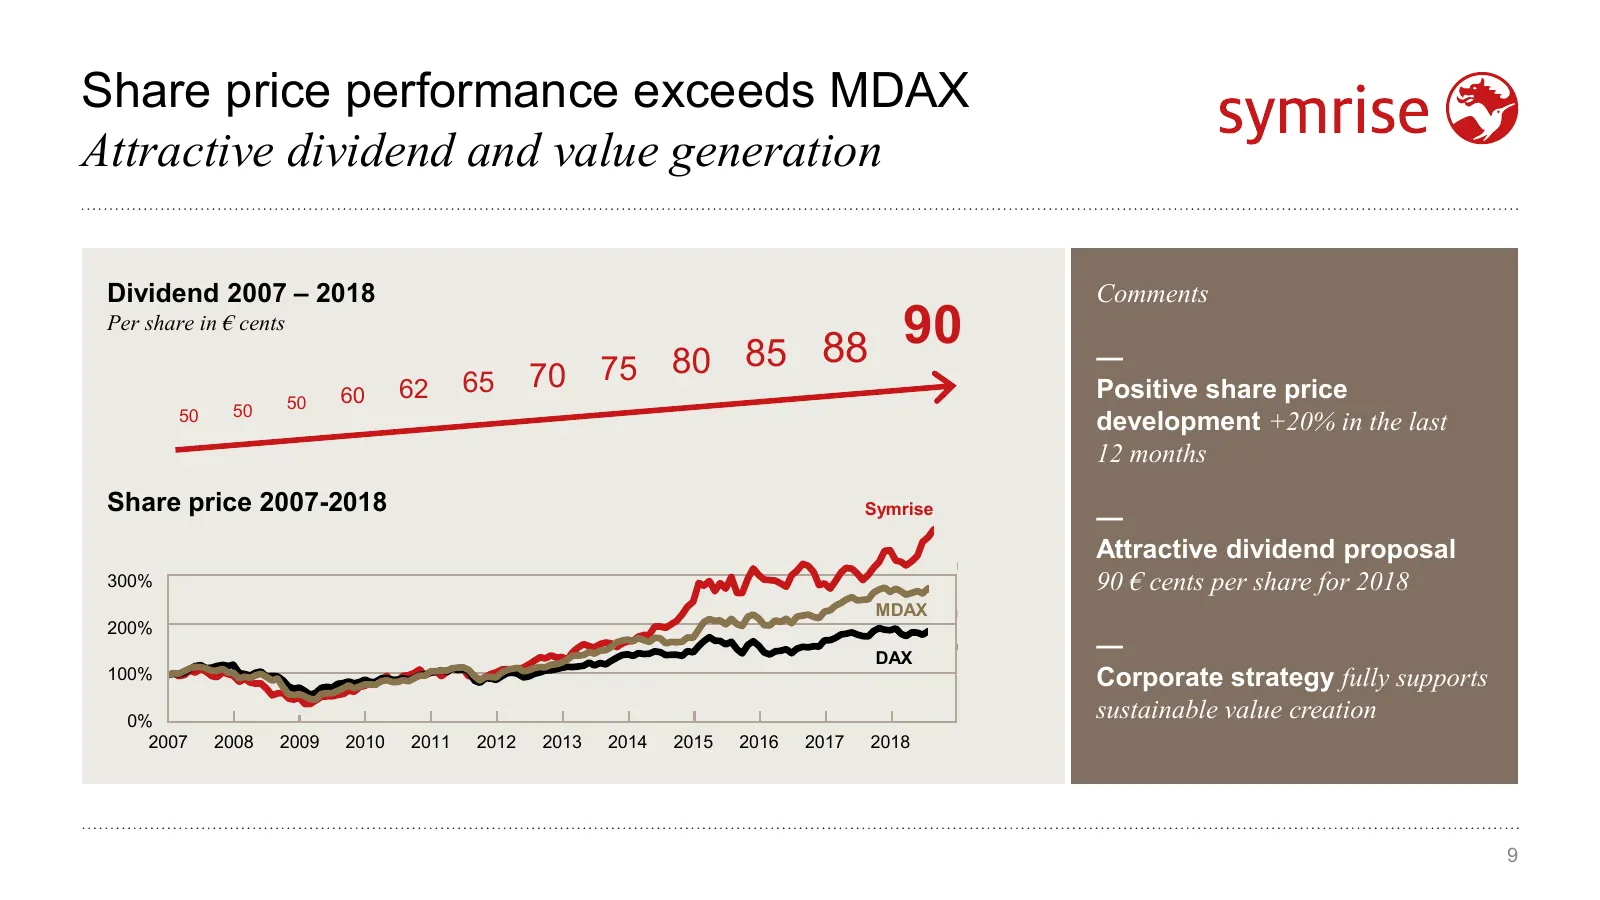
Share price performance exceeds MDAX Attractive dividend and value generation Dividend 2007 – 2018 Comments Per share in € cents 85 88 90 70 75 80 — 60 62 65 Positive share price 50 50 50 development +20% in the last 12 months Share price 2007-2018 Symrise — 400% Attractive dividend proposal 300% 90
Slide 10: Financials 2018
2 Financials 2018 Olaf Klinger, CFO 10
Slide 11: Group 2018: Strongest organic sales growth in the industry
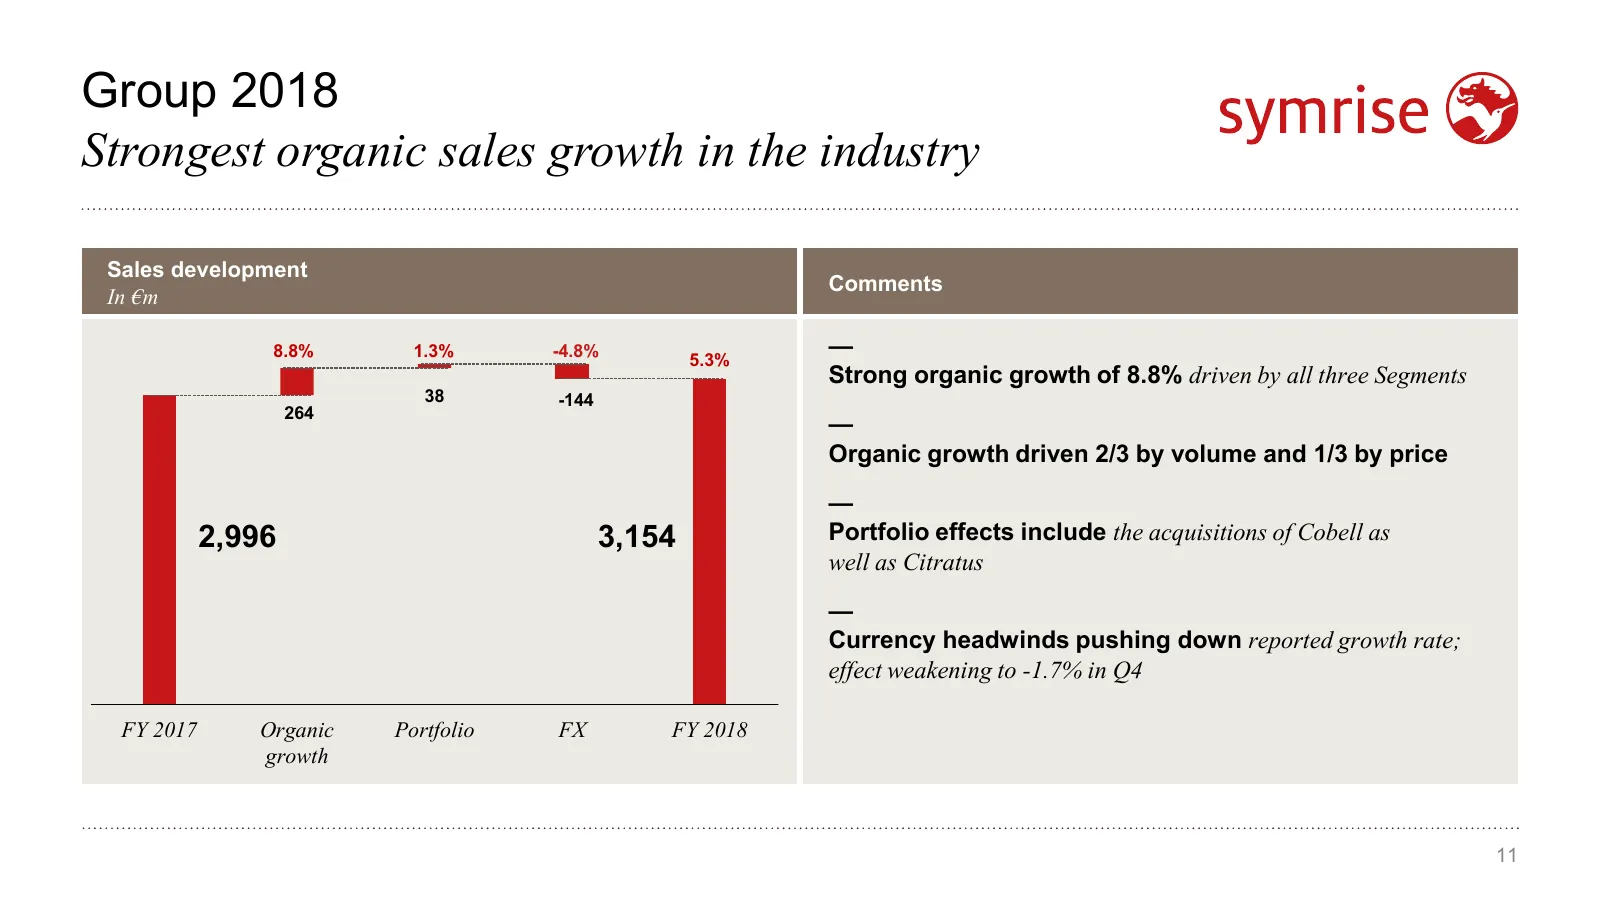
Group 2018 Strongest organic sales growth in the industry Sales development Comments In €m 8.8% 1.3% -4.8% 5.3% — Strong organic growth of 8.8% driven by all three Segments 38 -144 264 — Organic growth driven 2/3 by volume and 1/3 by price — 2,996 3,154 Portfolio effects include the acquisitions of
Slide 12: Group 2018: Stable EBITDA despite higher raw material costs
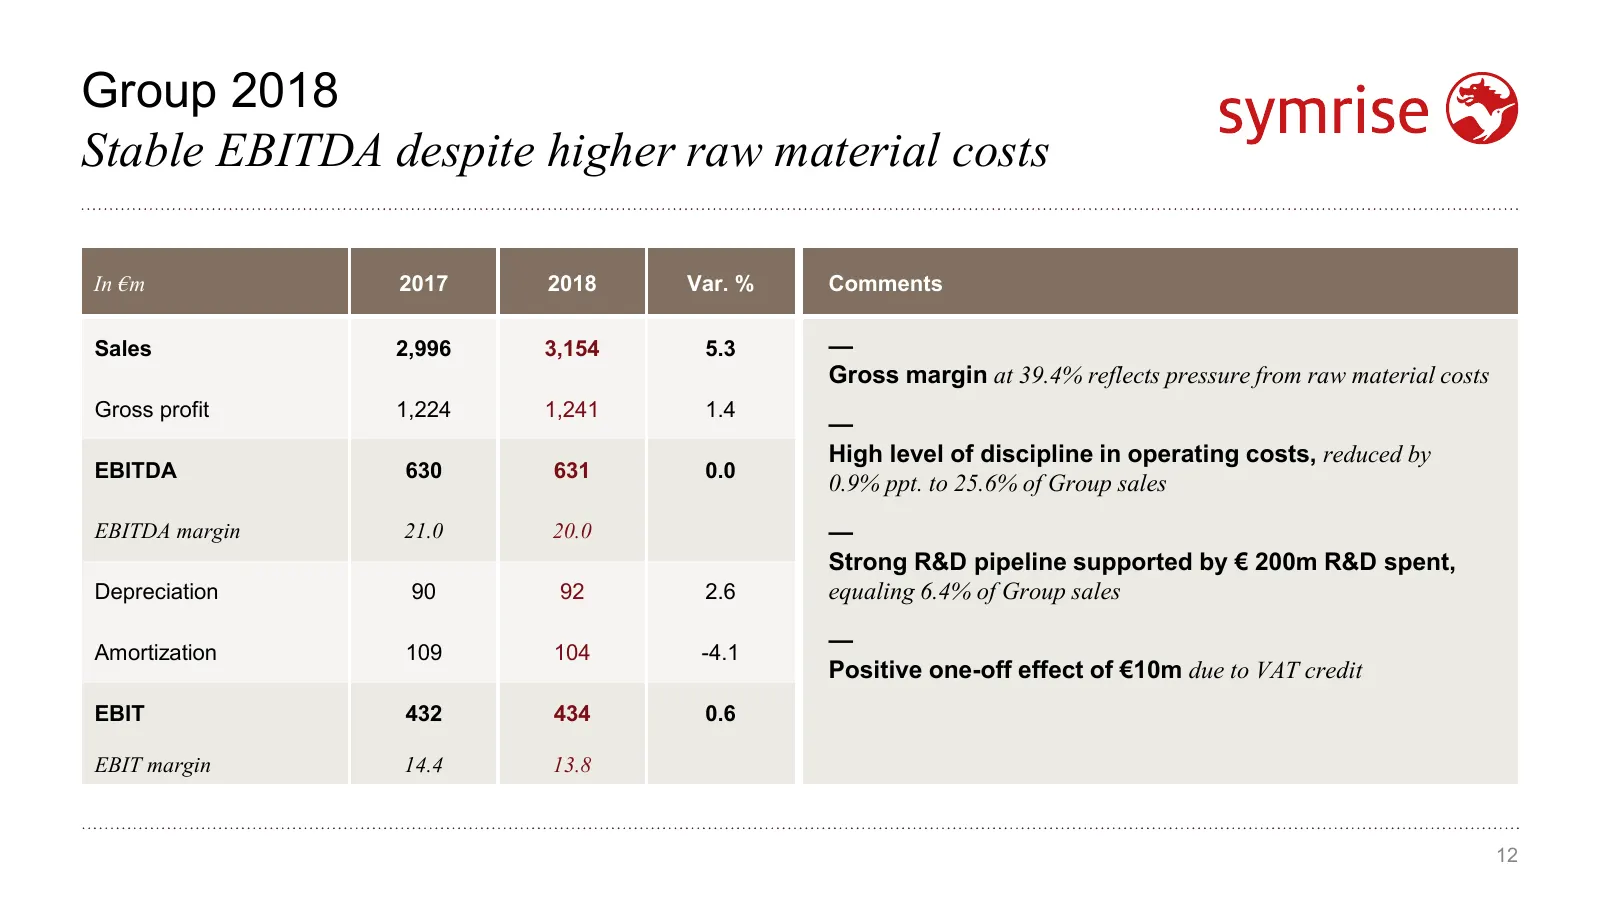
Group 2018 Stable EBITDA despite higher raw material costs In €m 2017 2018 Var. % Comments Sales 2,996 3,154 5.3 — Gross margin at 39.4% reflects pressure from raw material costs Gross profit 1,224 1,241 1.4 — High level of discipline in operating costs, reduced by EBITDA 630 631 0.0 0.9% ppt. to 25
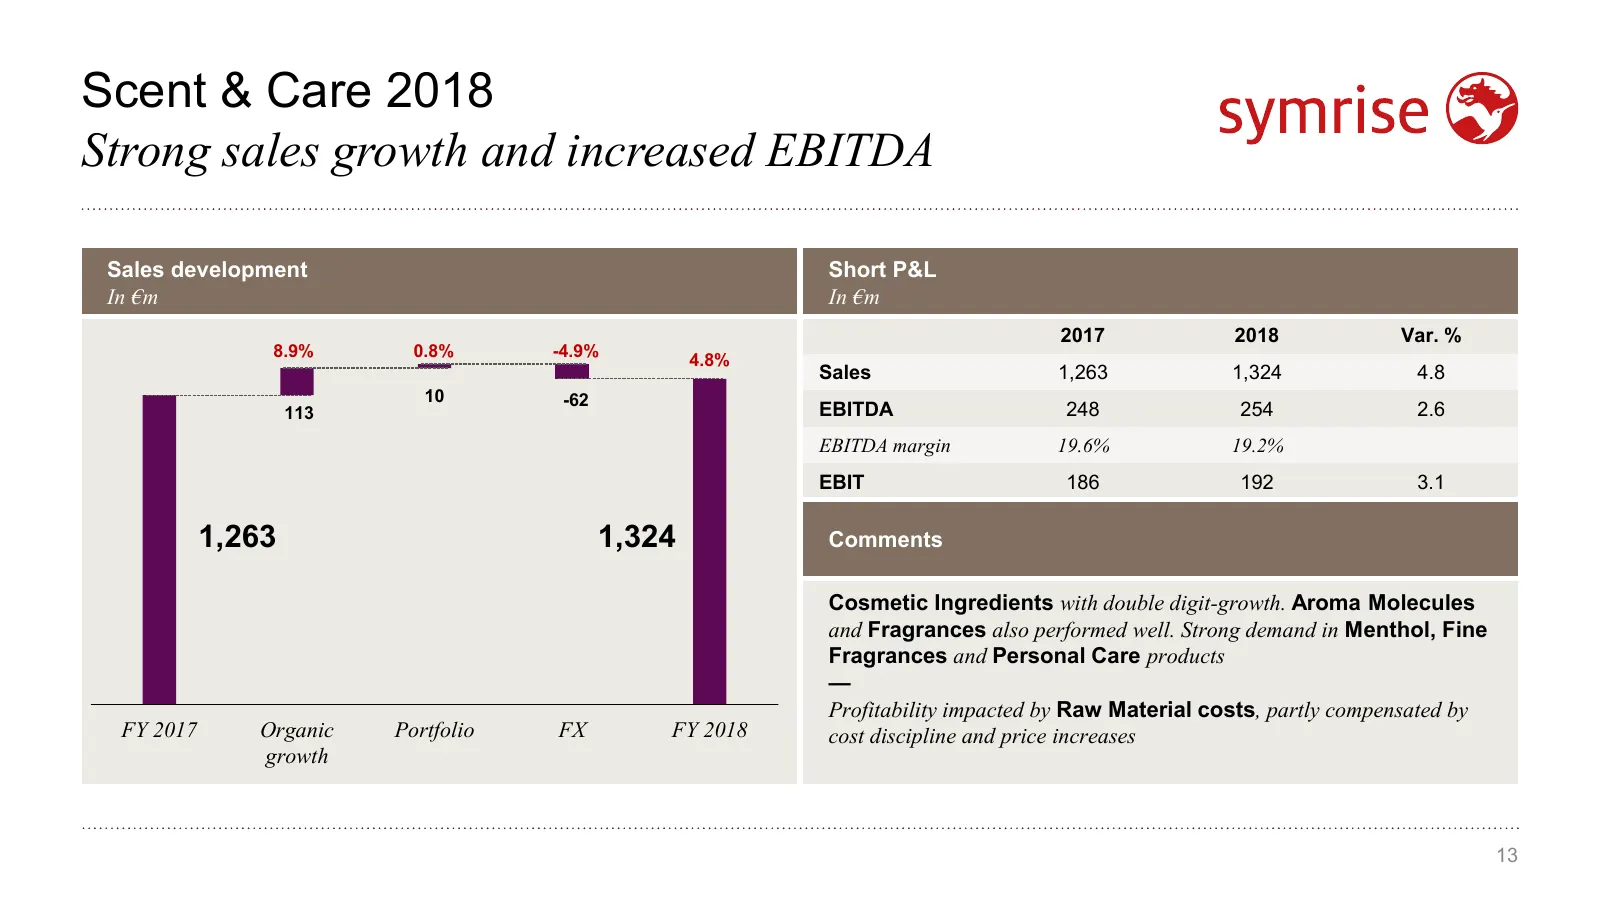
Slide 13: Scent & Care 2018
Scent & Care 2018 Strong sales growth and increased EBITDA Sales development Short P&L In €m In €m 2017 2018 Var. % 8.9% 0.8% -4.9% 4.8% Sales 1,263 1,324 4.8 10 -62 113 EBITDA 248 254 2.6 EBITDA margin 19.6% 19.2% EBIT 186 192 3.1 1,263 1,324 Comments Cosmetic Ingredients with double digit-growth.
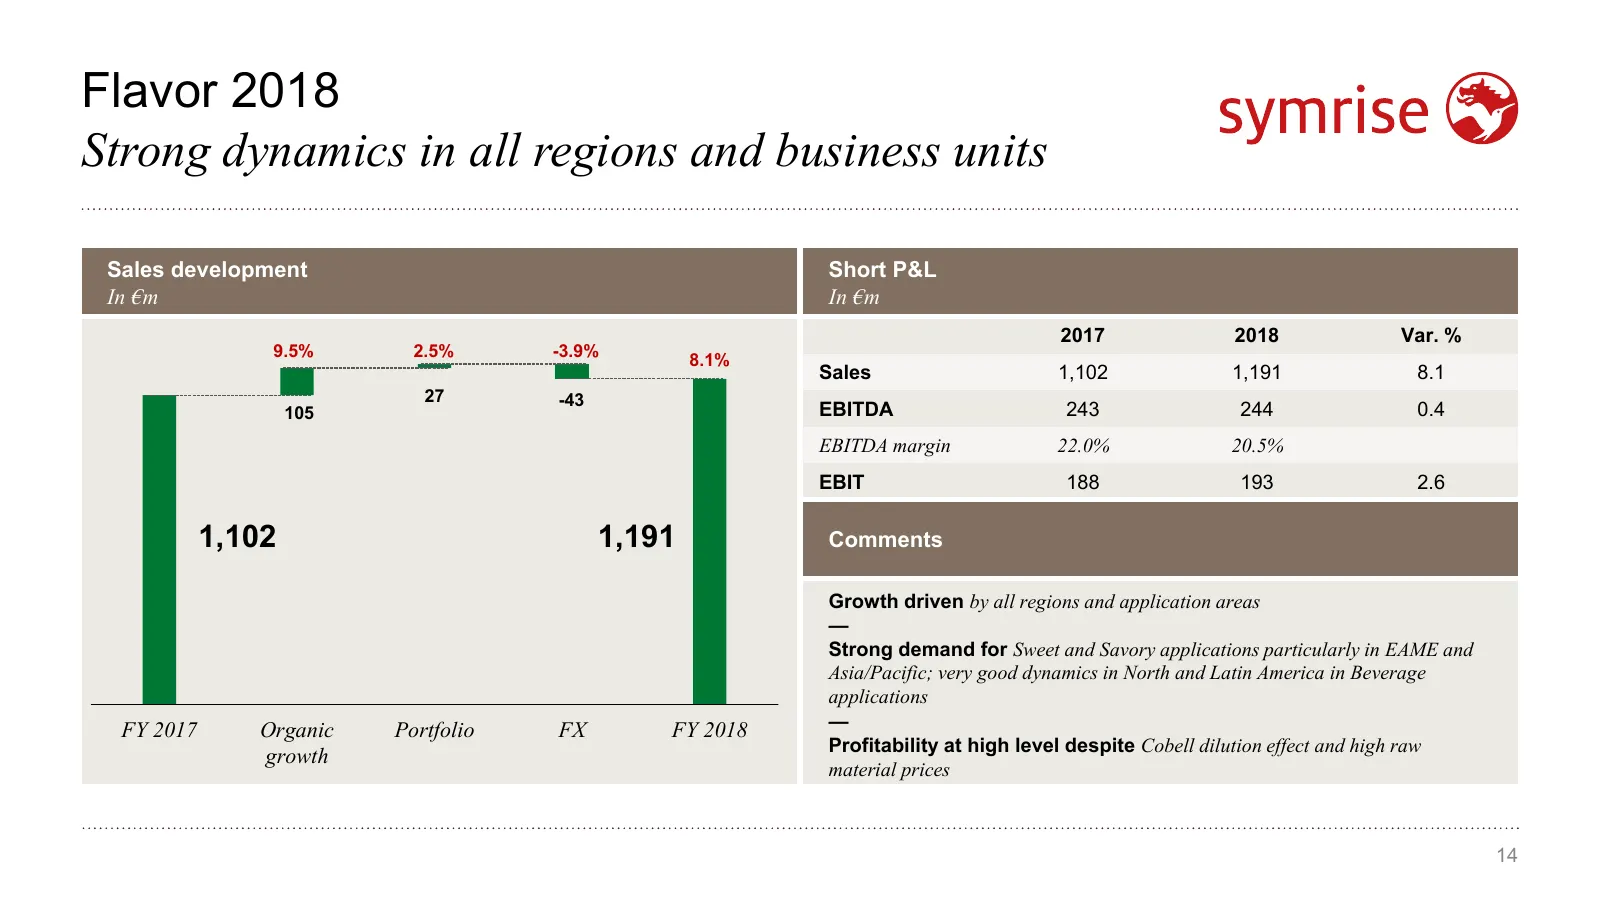
Slide 14: Flavor 2018
Flavor 2018 Strong dynamics in all regions and business units Sales development Short P&L In €m In €m 2017 2018 Var. % 9.5% 2.5% -3.9% 8.1% Sales 1,102 1,191 8.1 27 -43 105 EBITDA 243 244 0.4 EBITDA margin 22.0% 20.5% EBIT 188 193 2.6 1,102 1,191 Comments Growth driven by all regions and application
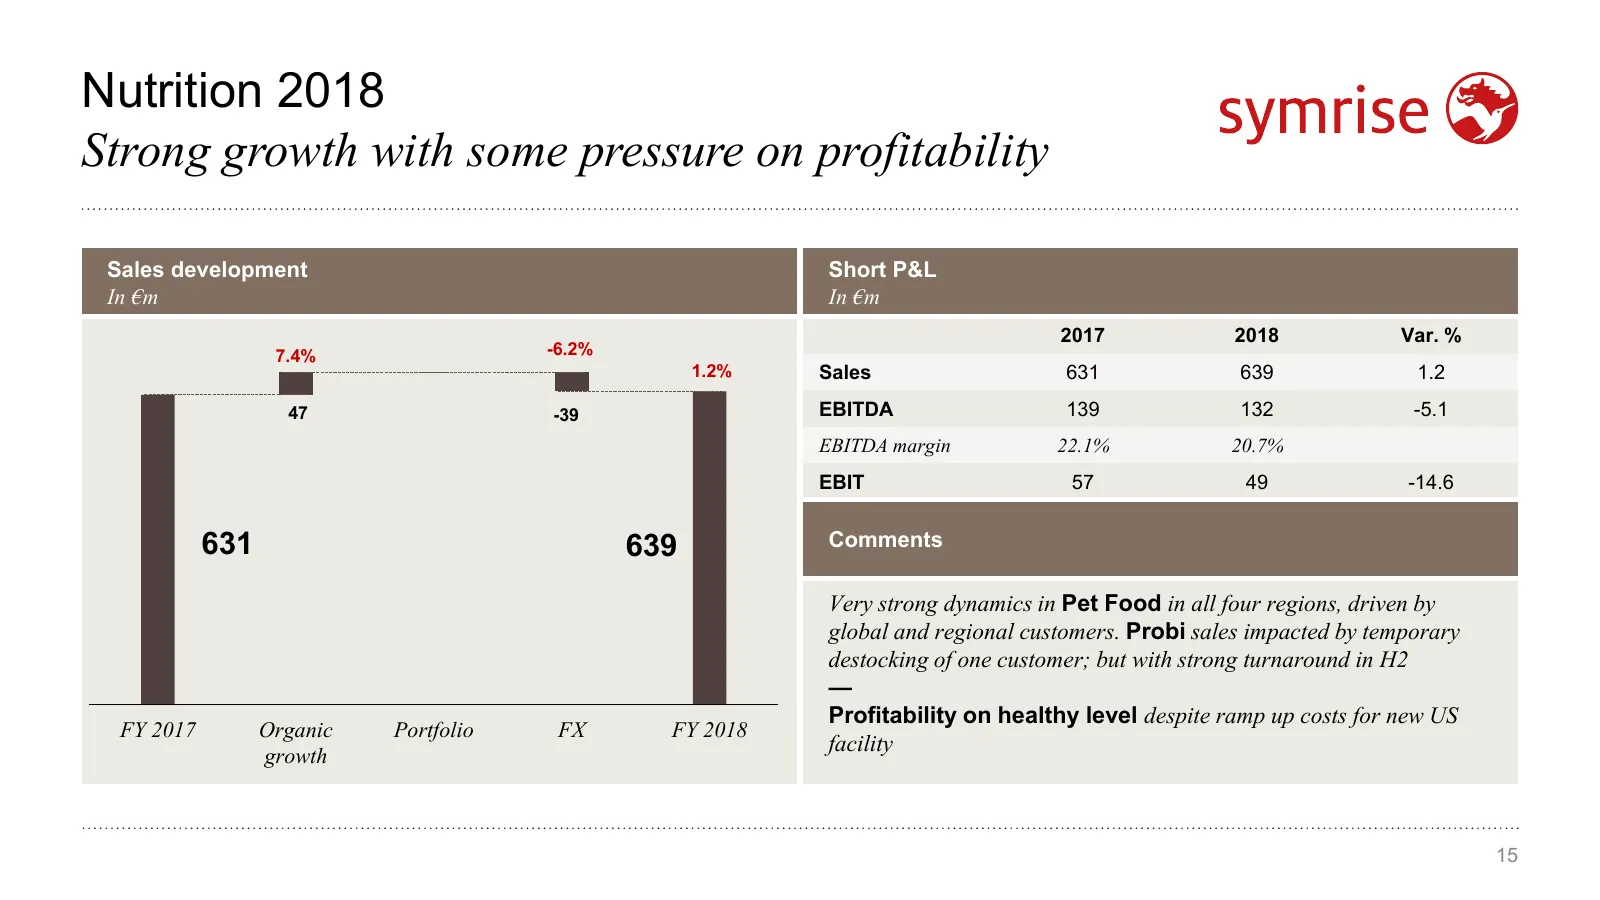
Slide 15: Nutrition 2018
Nutrition 2018 Strong growth with some pressure on profitability Sales development Short P&L In €m In €m 2017 2018 Var. % 7.4% -6.2% 1.2% Sales 631 639 1.2 47 -39 EBITDA 139 132 -5.1 EBITDA margin 22.1% 20.7% EBIT 57 49 -14.6 631 639 Comments Very strong dynamics in Pet Food in all four regions, dri
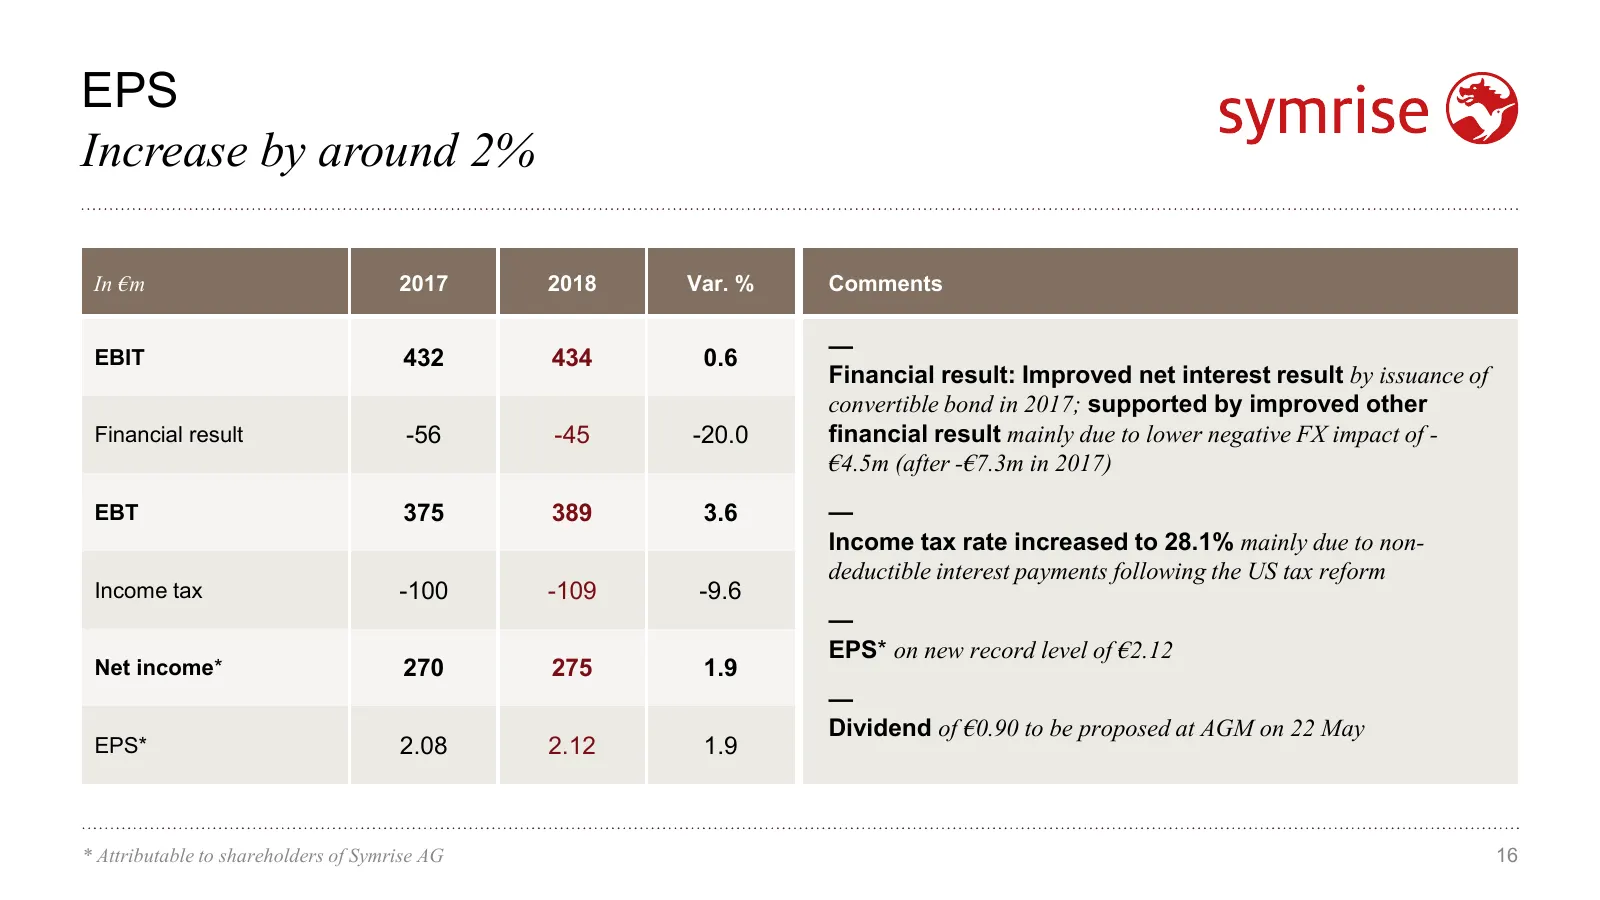
Slide 16: EPS: Increase by around 2%
EPS Increase by around 2% In €m 2017 2018 Var. % Comments EBIT 432 434 0.6 — Financial result: Improved net interest result by issuance of convertible bond in 2017; supported by improved other Financial result -56 -45 -20.0 financial result mainly due to lower negative FX impact of - €4.5m (after -€
Slide 17: Balance Sheet
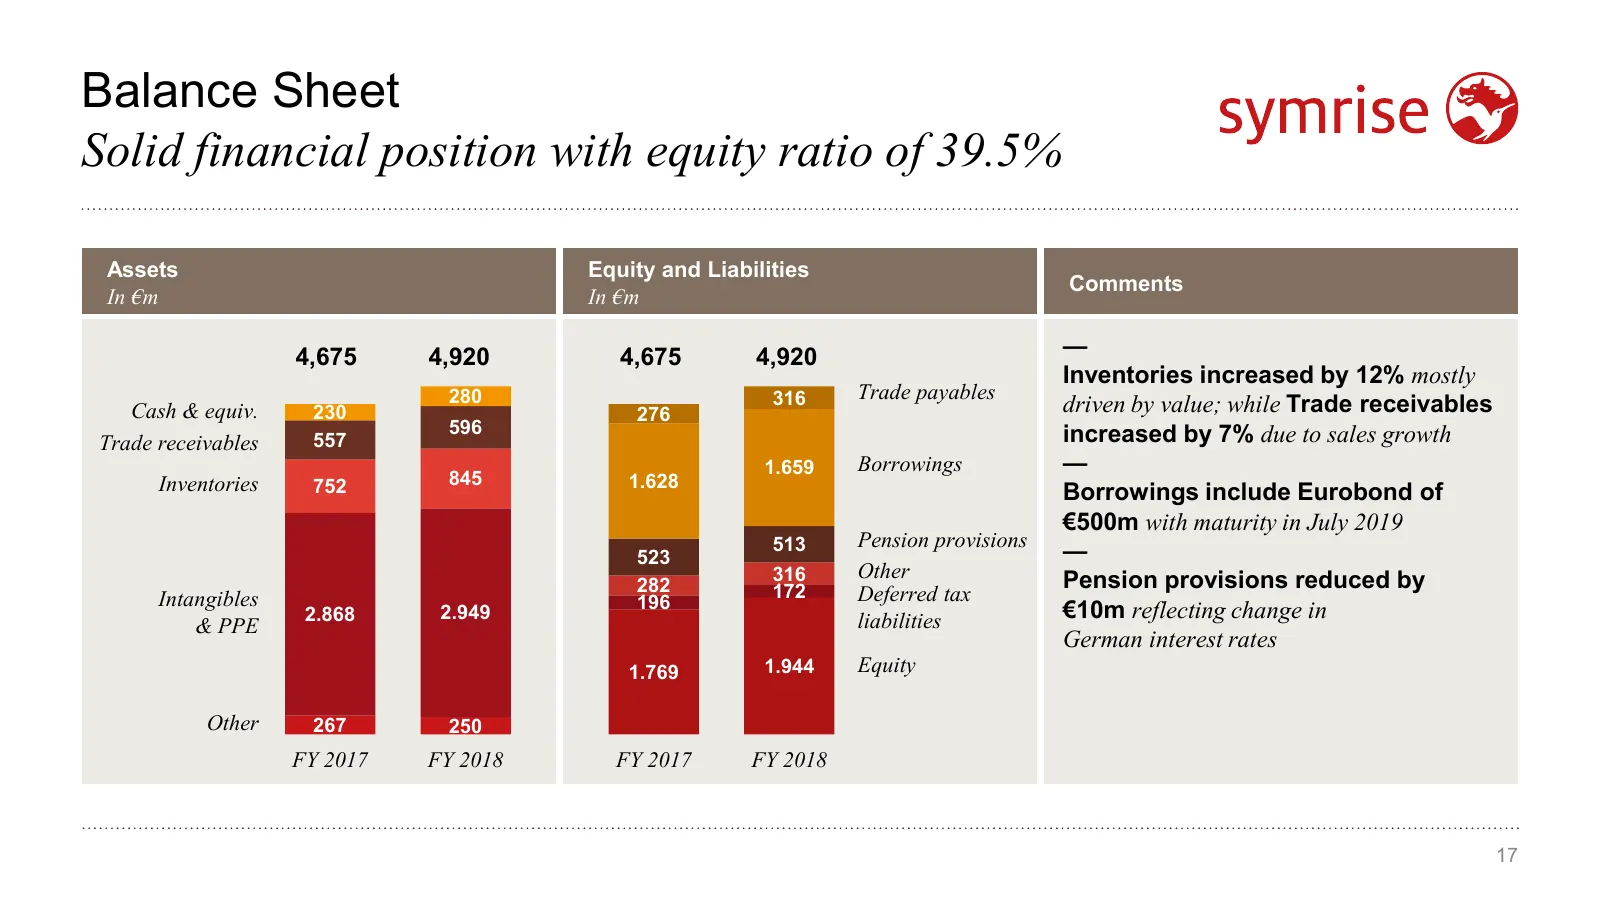
Balance Sheet Solid financial position with equity ratio of 39.5% Assets Equity and Liabilities Comments In €m In €m 4,675 4,920 4,675 4,920 — Inventories increased by 12% mostly 280 316 Trade payables Cash & equiv. 230 276 driven by value; while Trade receivables 596 increased by 7% due to sales gr
Slide 18: Business Free Cash Flow introduced as a new internal KPI
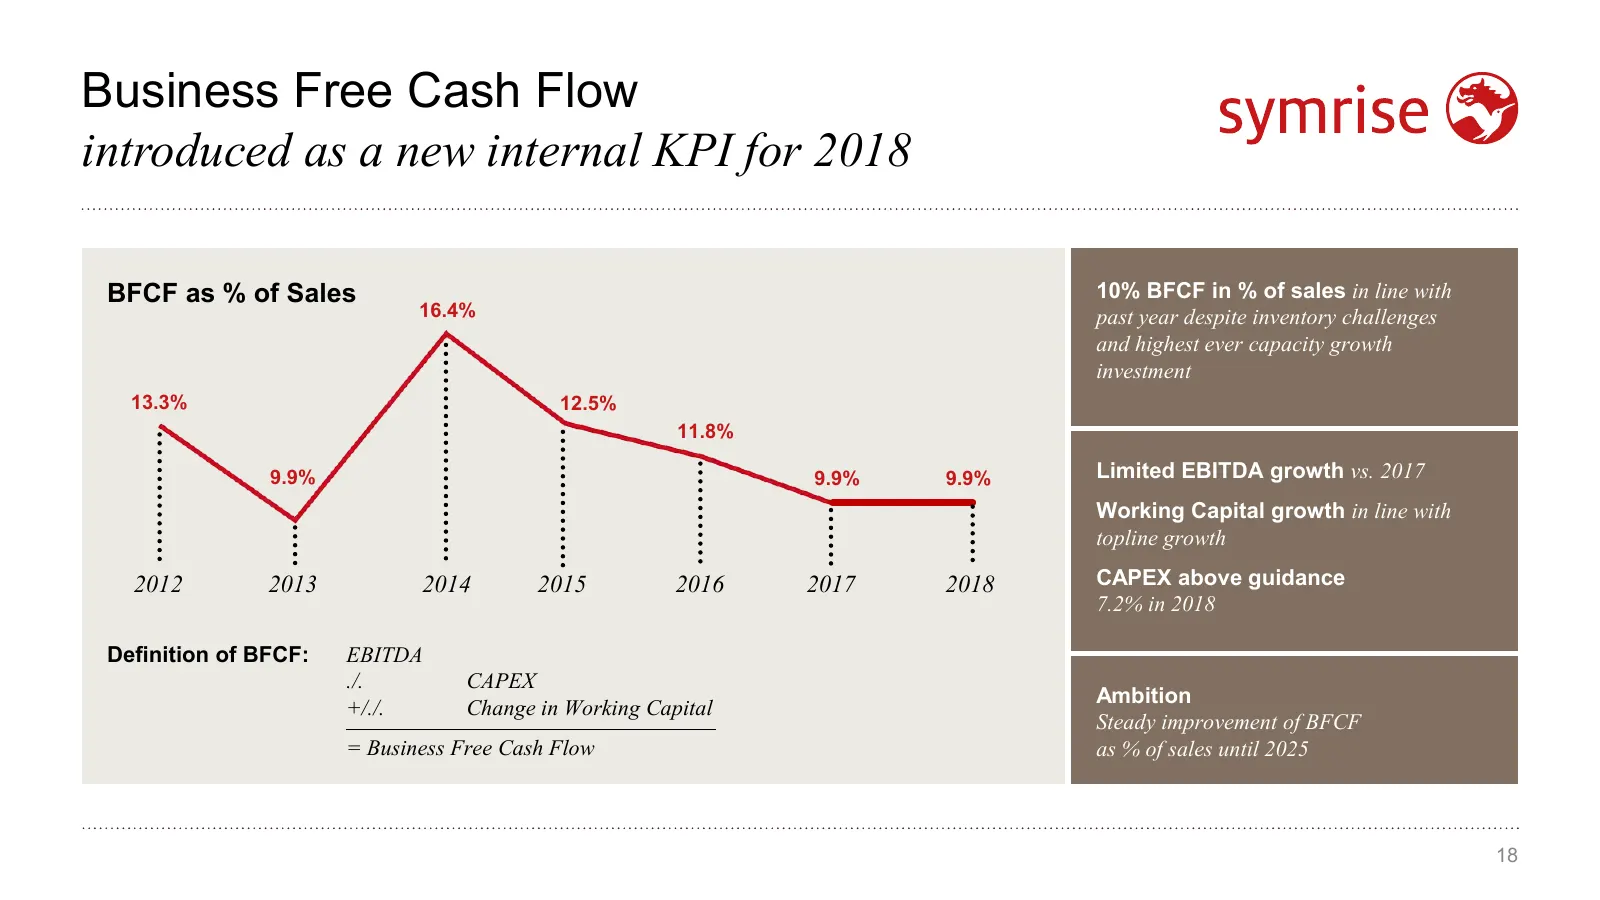
Business Free Cash Flow introduced as a new internal KPI for 2018 BFCF as % of Sales 10% BFCF in % of sales in line with 16.4% past year despite inventory challenges and highest ever capacity growth investment 13.3% 12.5% 11.8% 9.9% 9.9% 9.9% Limited EBITDA growth vs. 2017 Working Capital growth in
Slide 19: Solid Financing Structure
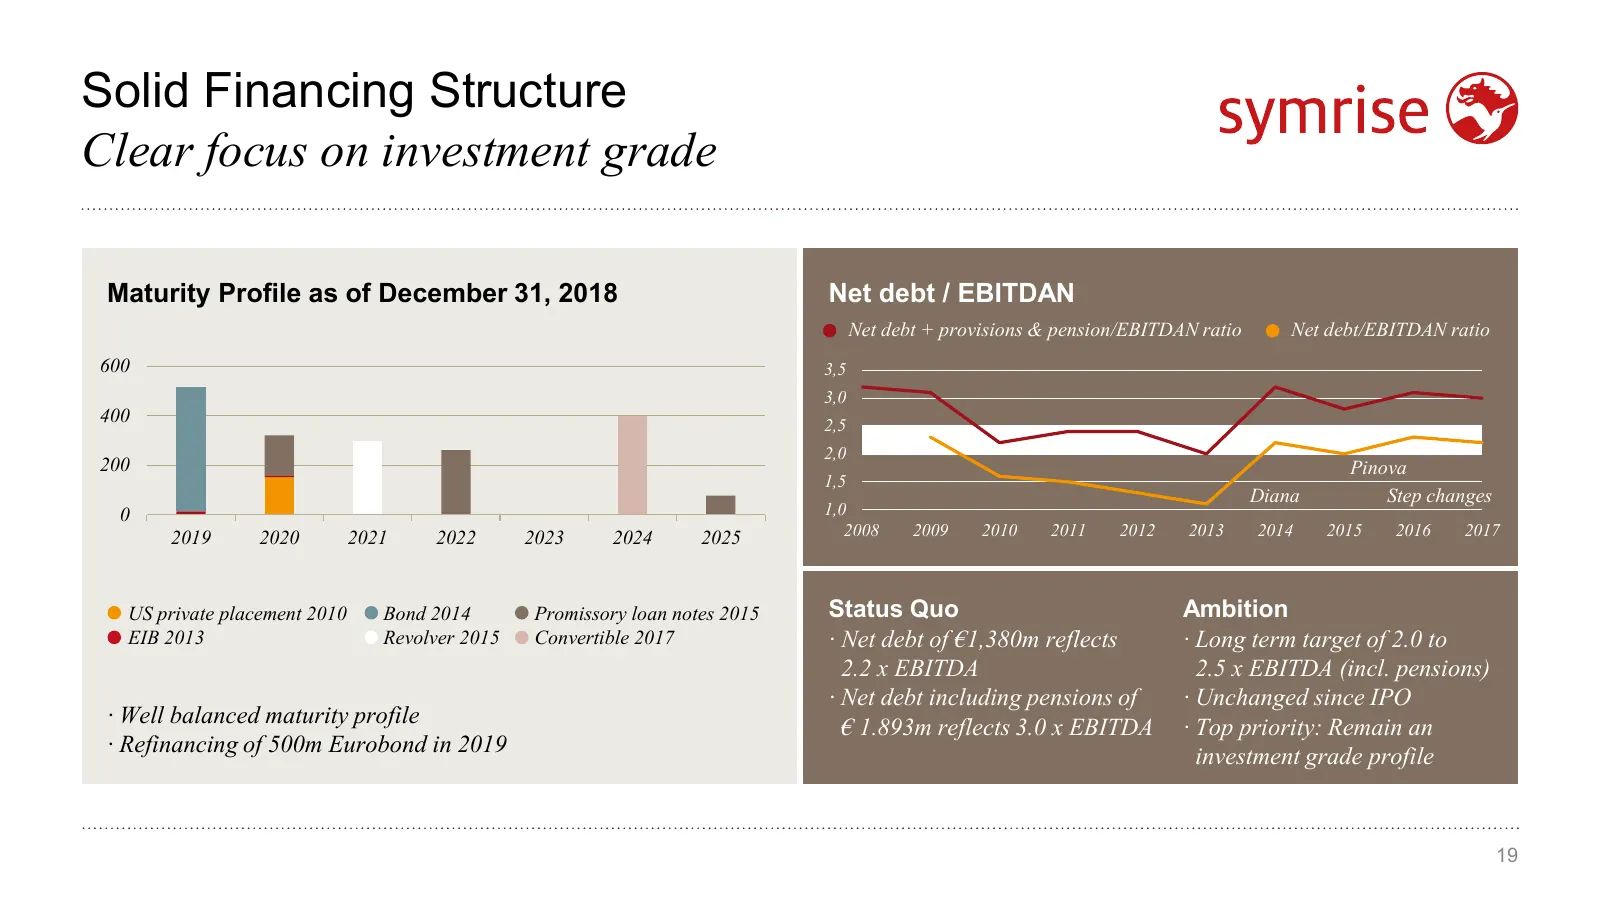
Solid Financing Structure Clear focus on investment grade Maturity Profile as of December 31, 2018 Net debt / EBITDAN Net debt + provisions & pension/EBITDAN ratio Net debt/EBITDAN ratio 600 3,5 3,0 400 2,5 2,0 200 Pinova 1,5 Diana Step changes 0 1,0 2019 2020 2021 2022 2023 2024 2025 2008 2009 2010
Slide 20: Financing structure of proposed acquisition ADF/IDF
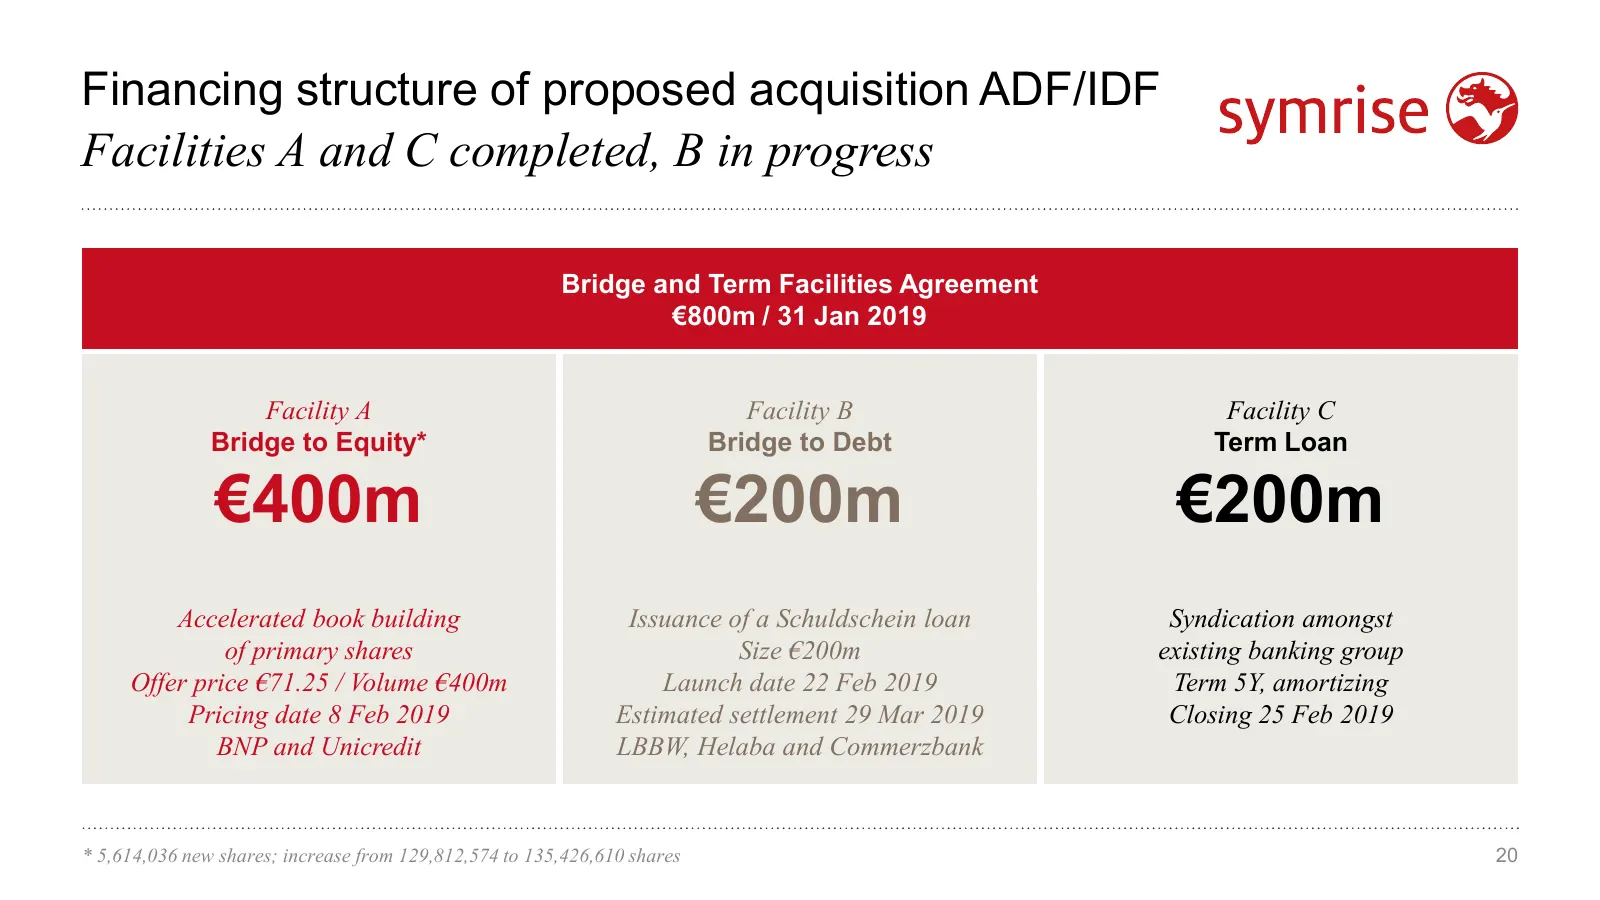
Financing structure of proposed acquisition ADF/IDF Facilities A and C completed, B in progress Bridge and Term Facilities Agreement €800m / 31 Jan 2019 Facility A Facility B Facility C Bridge to Equity* Bridge to Debt Term Loan €400m €200m €200m Accelerated book building Issuance of a Schuldschein
Slide 21: Update: Acquisition ADF/IDF
3 Update: Acquisition ADF/IDF Dr. Jean-Yves Parisot, President Nutrition (Diana) 21
Slide 22: Diana, part of Symrise's Nutrition Division
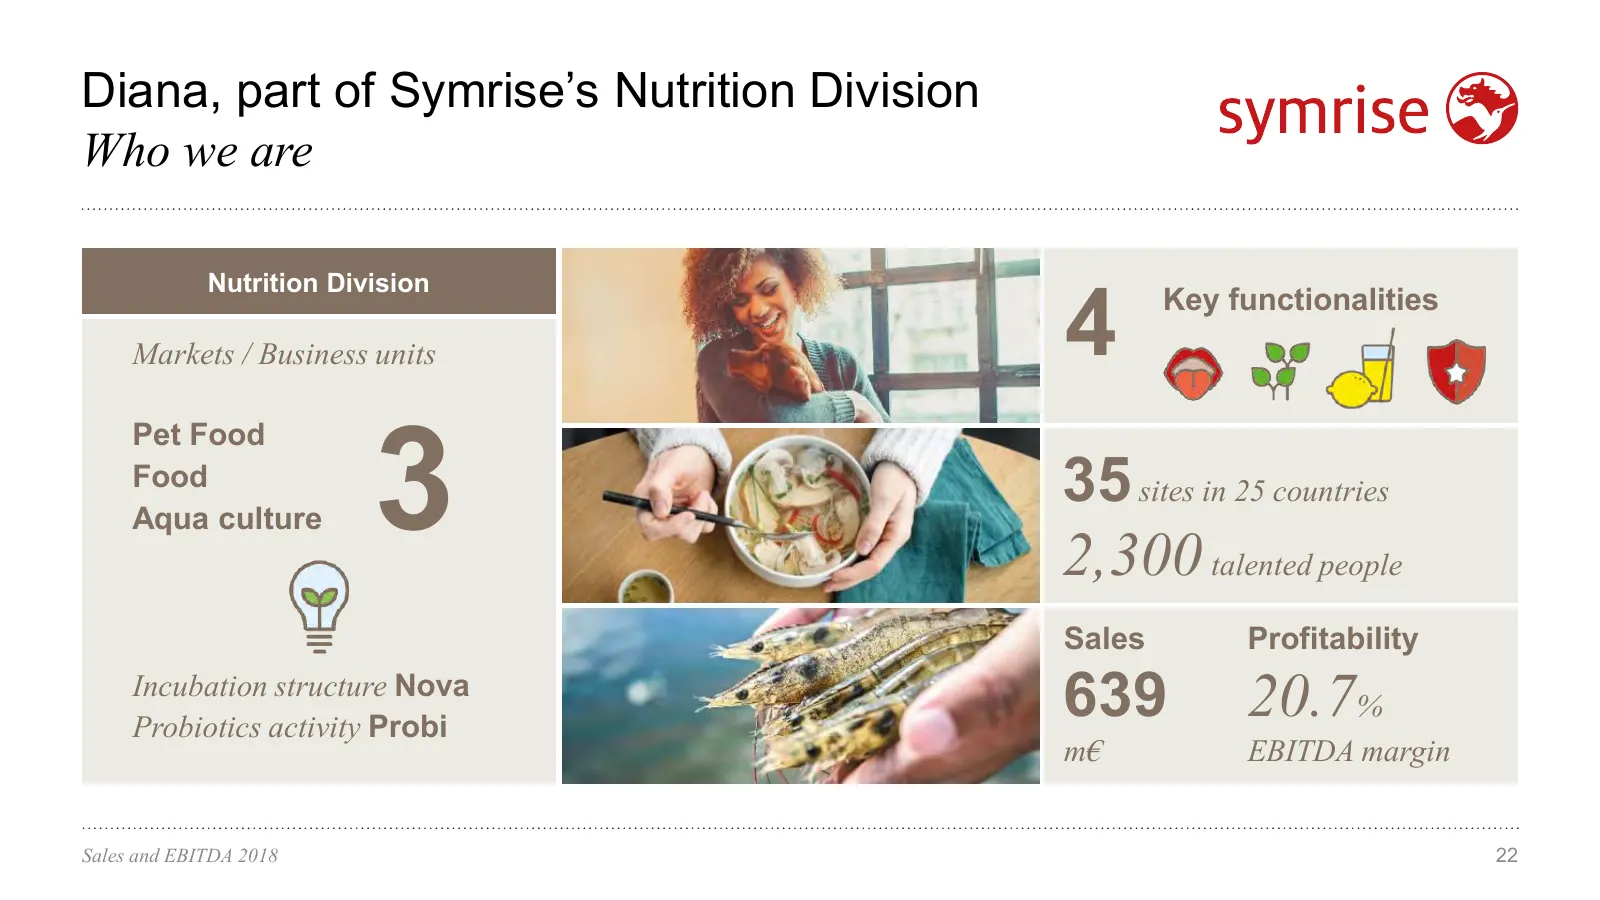
Diana, part of Symrise’s Nutrition Division Who we are 4 Nutrition Division Key functionalities Markets / Business units 3 Pet Food Food Aqua culture 35 sites in 25 countries 2,300 talented people Sales Profitability Incubation structure Nova Probiotics activity Probi 639 20.7% m€ EBITDA margin Sale
Slide 23: Diana's Business Model
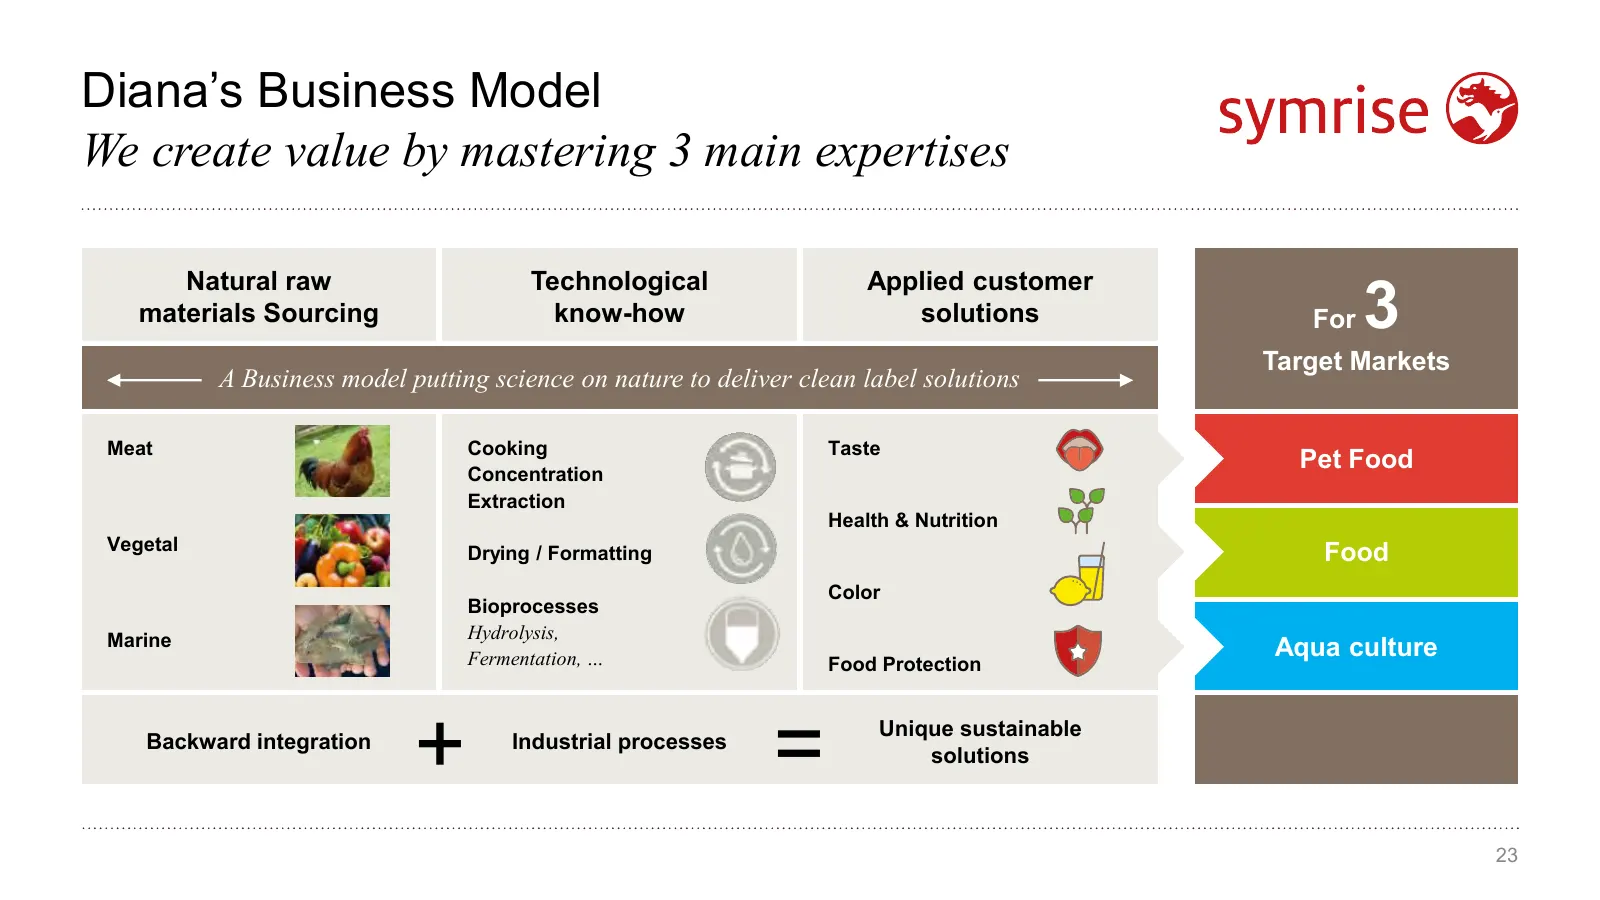
Diana’s Business Model We create value by mastering 3 main expertises 3 Natural raw Technological Applied customer materials Sourcing know-how solutions For Target Markets A Business model putting science on nature to deliver clean label solutions Meat Cooking Taste Pet Food Concentration Extraction
Slide 24: ADF/IDF in a nutshell
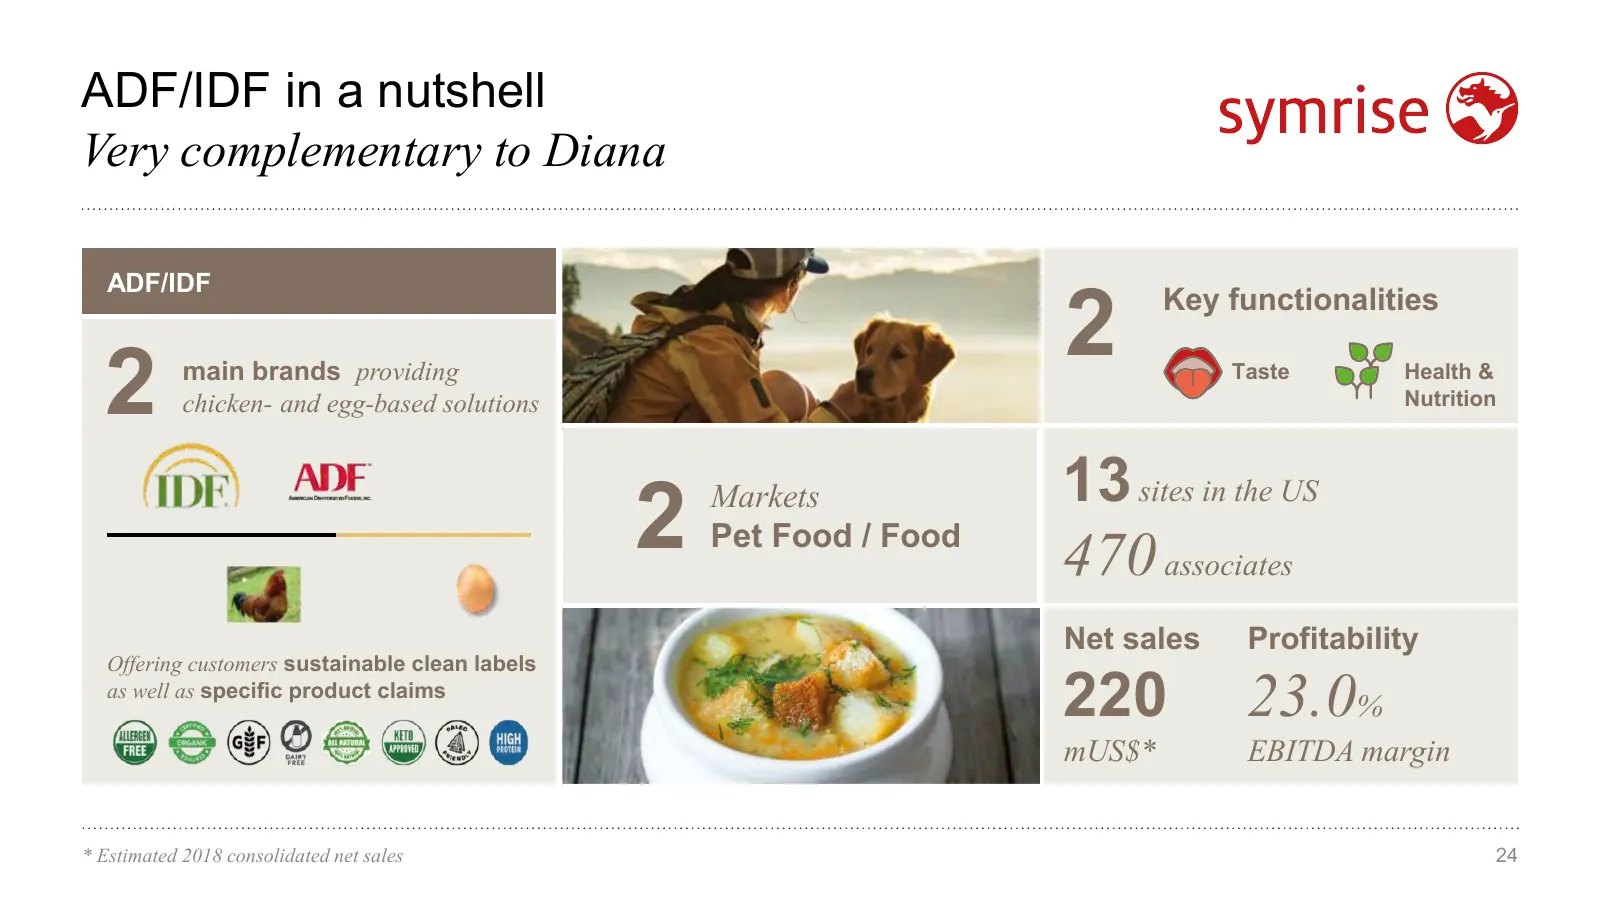
ADF/IDF in a nutshell Very complementary to Diana 2 ADF/IDF Key functionalities 2 main brands providing chicken- and egg-based solutions Taste Health & Nutrition 13 sites in the US 2 Markets Pet Food / Food 470 associates Net sales Profitability Offering customers sustainable clean labels as well as
Slide 25: ADF/IDF Business Model
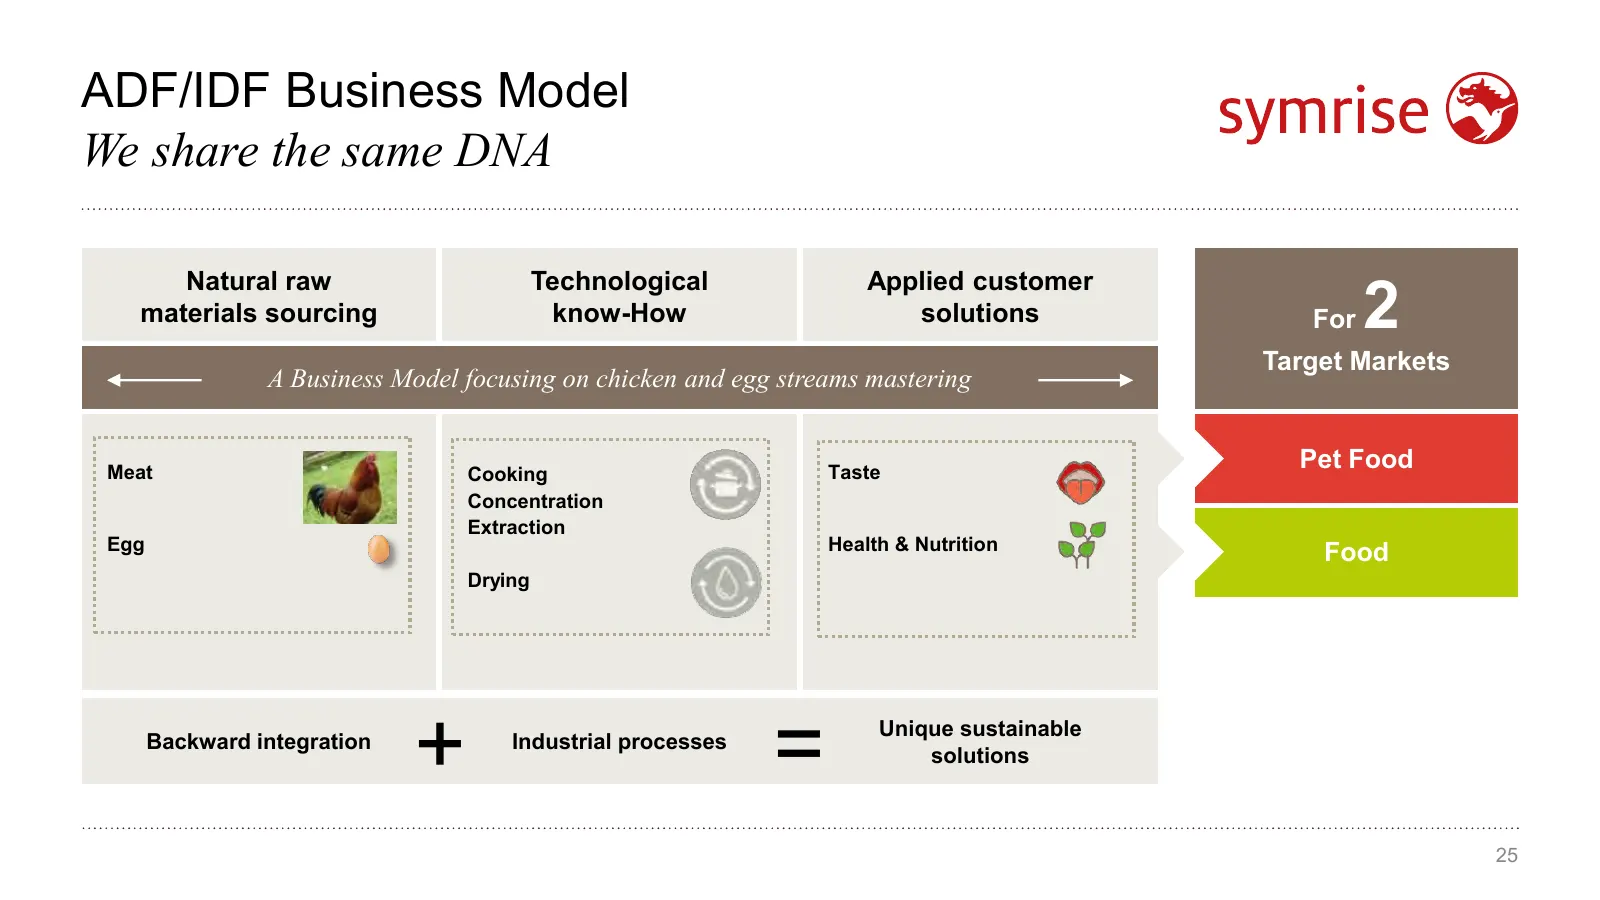
ADF/IDF Business Model We share the same DNA 2 Natural raw Technological Applied customer materials sourcing know-How solutions For Target Markets A Business Model focusing on chicken and egg streams mastering Meat Taste Pet Food Cooking Concentration Extraction Egg Health & Nutrition Food Drying Ba
Slide 26: Strategic rationale of the operation
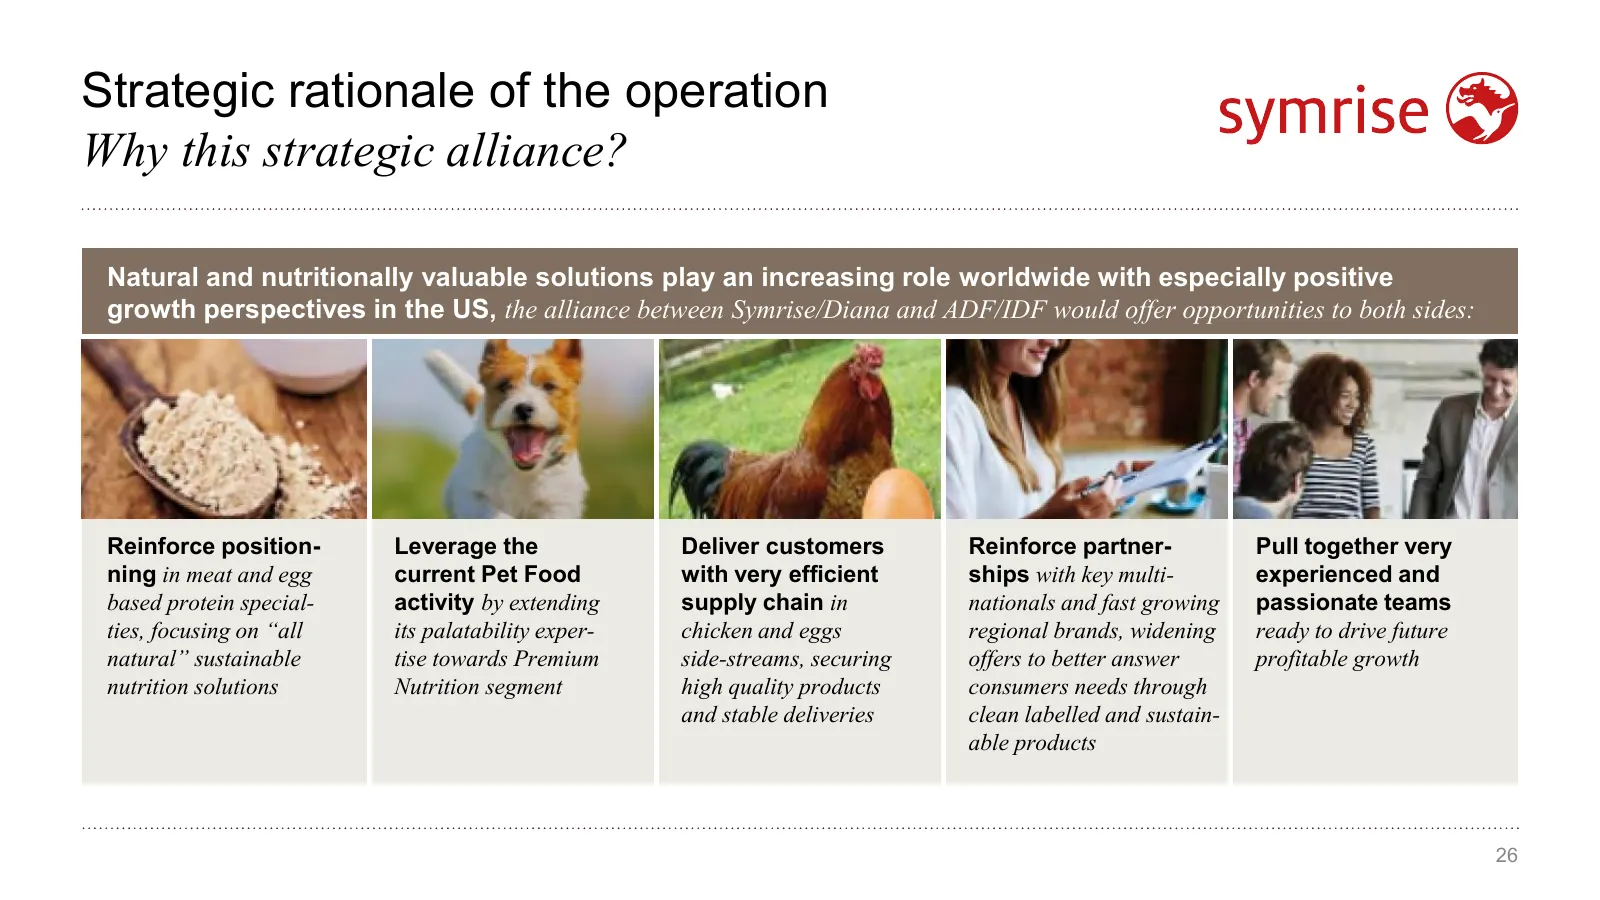
Strategic rationale of the operation Why this strategic alliance? Natural and nutritionally valuable solutions play an increasing role worldwide with especially positive growth perspectives in the US, the alliance between Symrise/Diana and ADF/IDF would offer opportunities to both sides: Reinforce p
Slide 27: ADF/IDF chicken- and egg-based offering
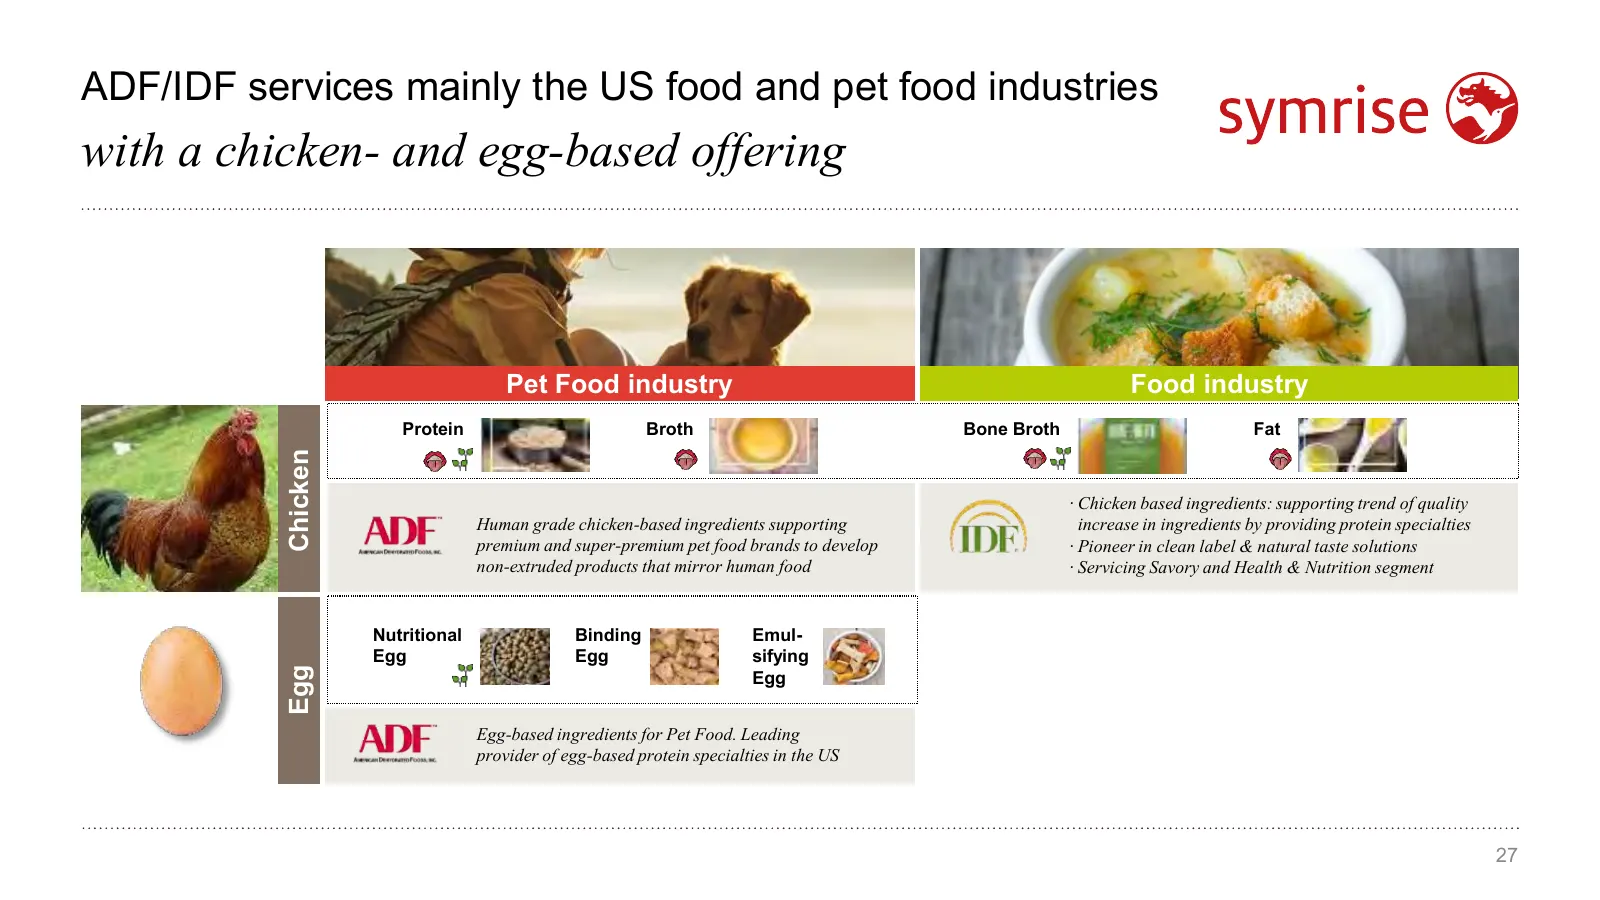
ADF/IDF services mainly the US food and pet food industries with a chicken- and egg-based offering Pet Food industry Food industry Protein Broth Bone Broth Fat Chicken · Chicken based ingredients: supporting trend of quality Human grade chicken-based ingredients supporting increase in ingredients by
Slide 28: Outlook 2019 / Long-term objectives
4 Outlook 2019 / Long-term objectives Dr. Heinz-Jürgen Bertram, CEO 28
Slide 29: Corporate strategy
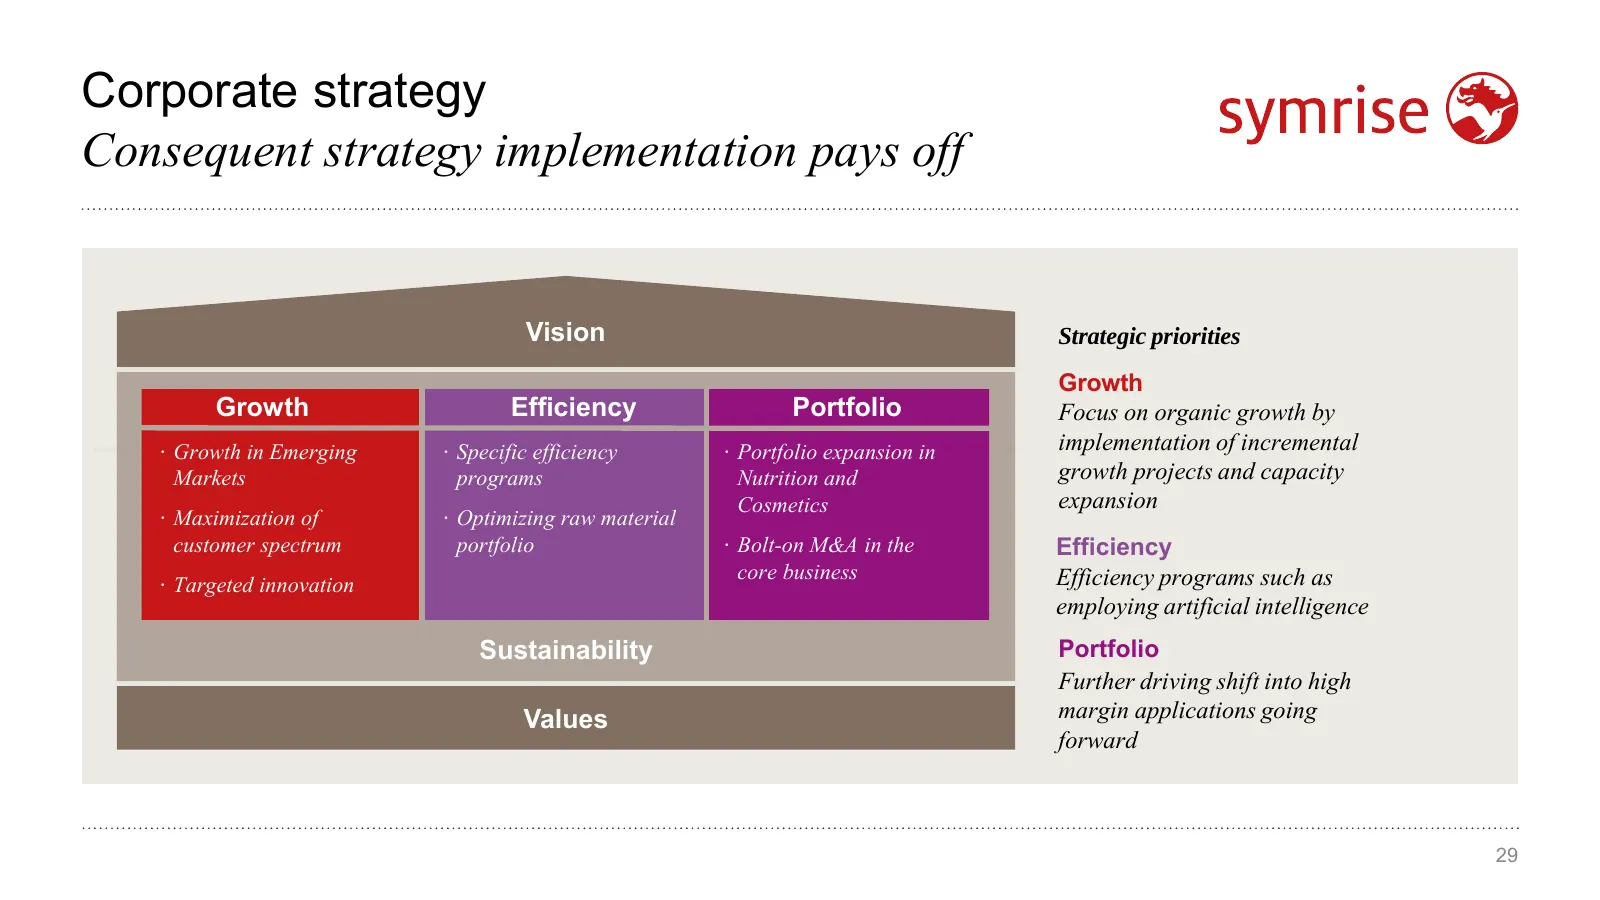
Corporate strategy Consequent strategy implementation pays off Vision Vision Strategic priorities Growth Growth Efficiency Portfolio Focus on organic growth by · Growth in Emerging · Specific efficiency · Portfolio expansion in implementation of incremental Markets programs Nutrition and growth proj
Slide 30: Driving growth through targeted investments
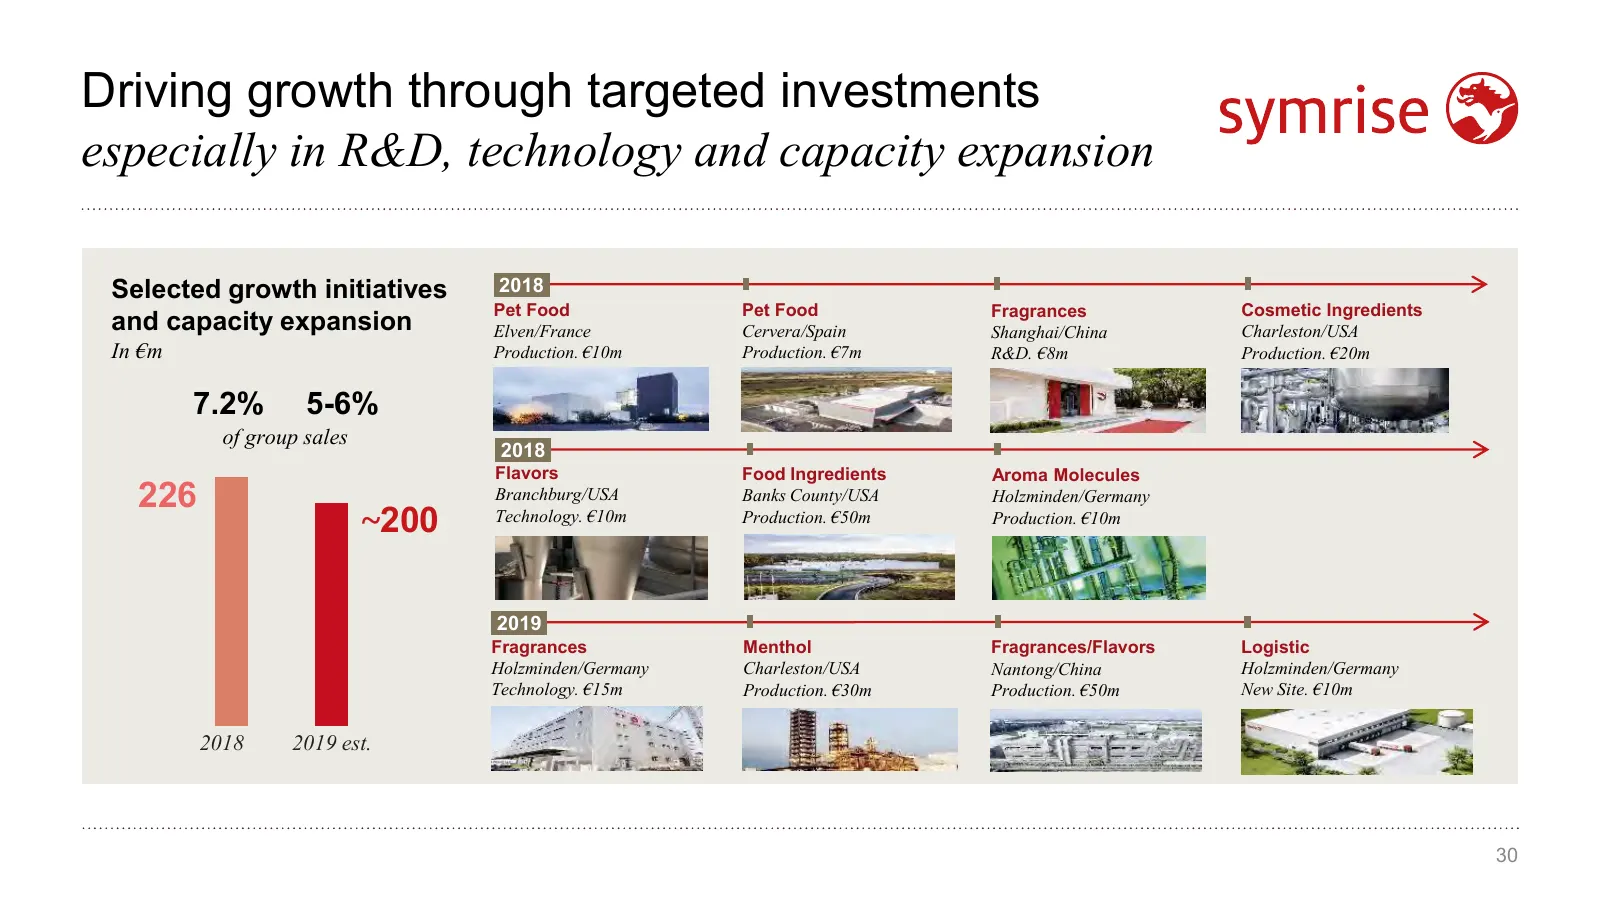
Driving growth through targeted investments especially in R&D, technology and capacity expansion Selected growth initiatives 2018 Pet Food Pet Food Fragrances Cosmetic Ingredients and capacity expansion Elven/France Cervera/Spain Shanghai/China Charleston/USA In €m Production. €10m Production. €7m R
Slide 31: Outlook 2019
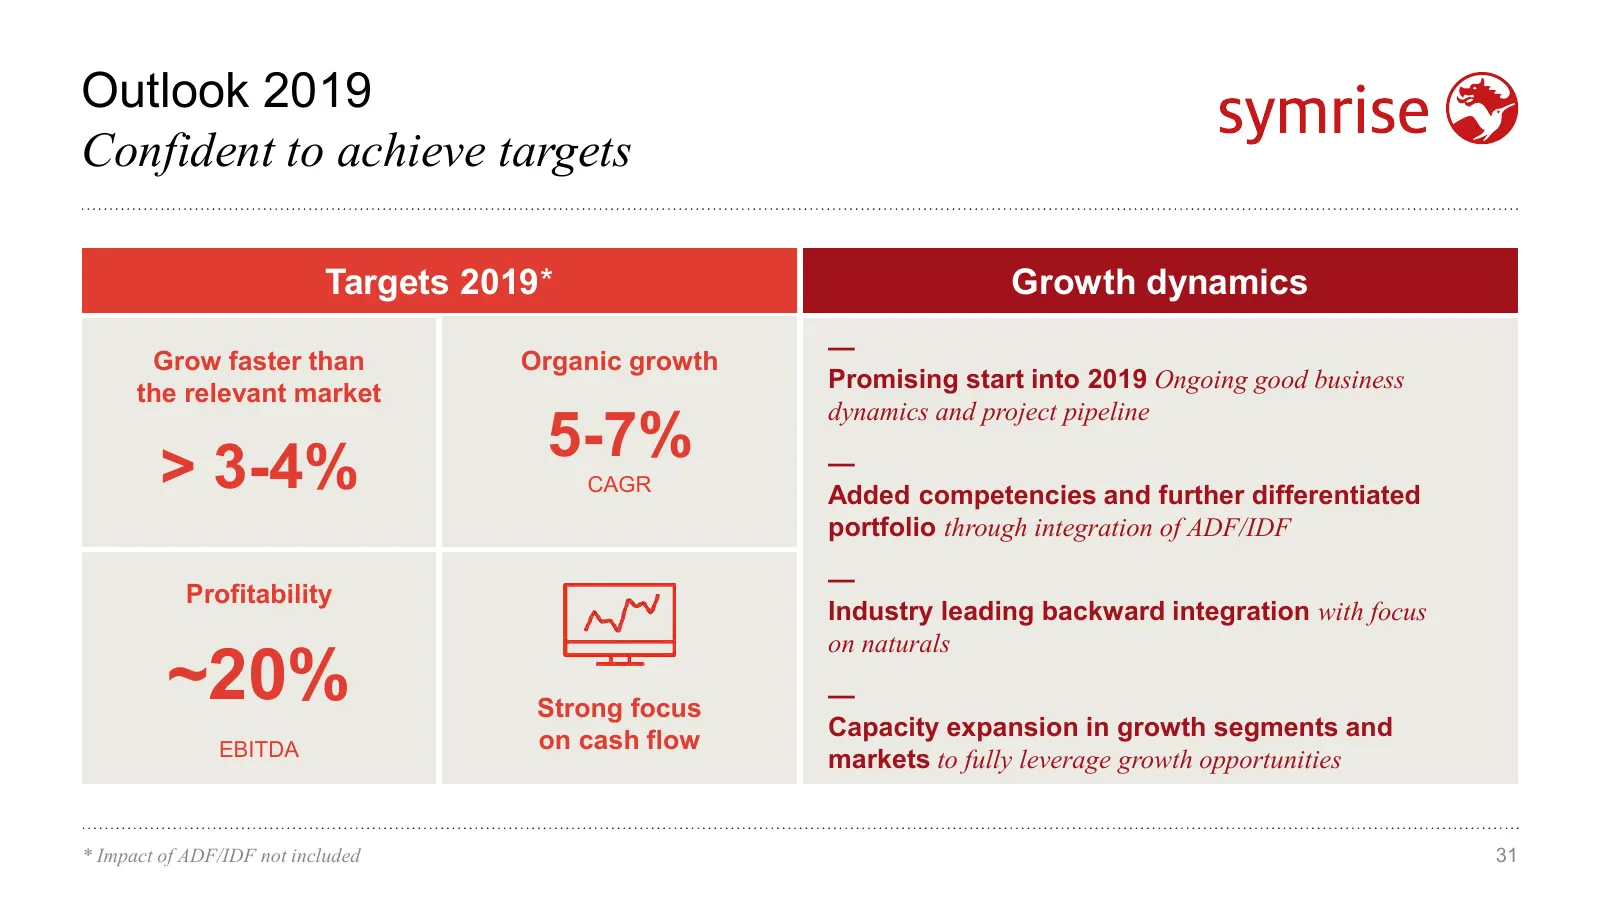
Outlook 2019 Confident to achieve targets Targets 2019* Growth dynamics — Grow faster than Organic growth Promising start into 2019 Ongoing good business the relevant market 5-7% dynamics and project pipeline > 3-4% CAGR — Added competencies and further differentiated portfolio through integration o
Slide 32: Objectives 2025
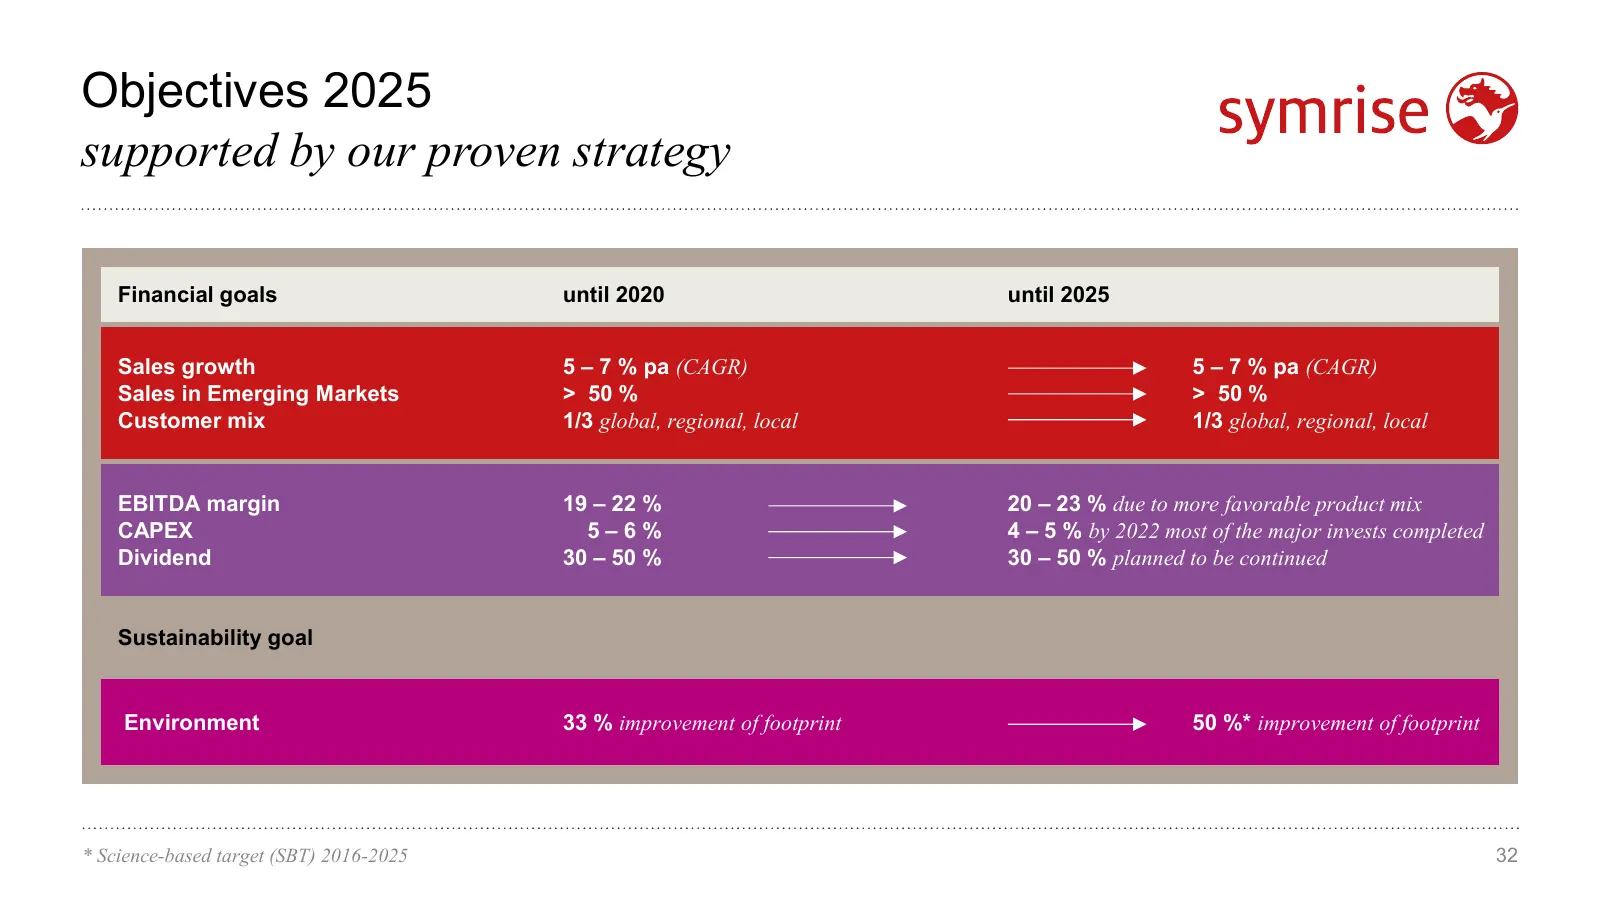
Objectives 2025 supported by our proven strategy Financial goals until 2020 until 2025 Sales growth 5 – 7 % pa (CAGR) 5 – 7 % pa (CAGR) Sales in Emerging Markets > 50 % > 50 % Customer mix 1/3 global, regional, local 1/3 global, regional, local EBITDA margin 19 – 22 % 20 – 23 % due to more favorable
Slide 33: Long-term growth objective 2025
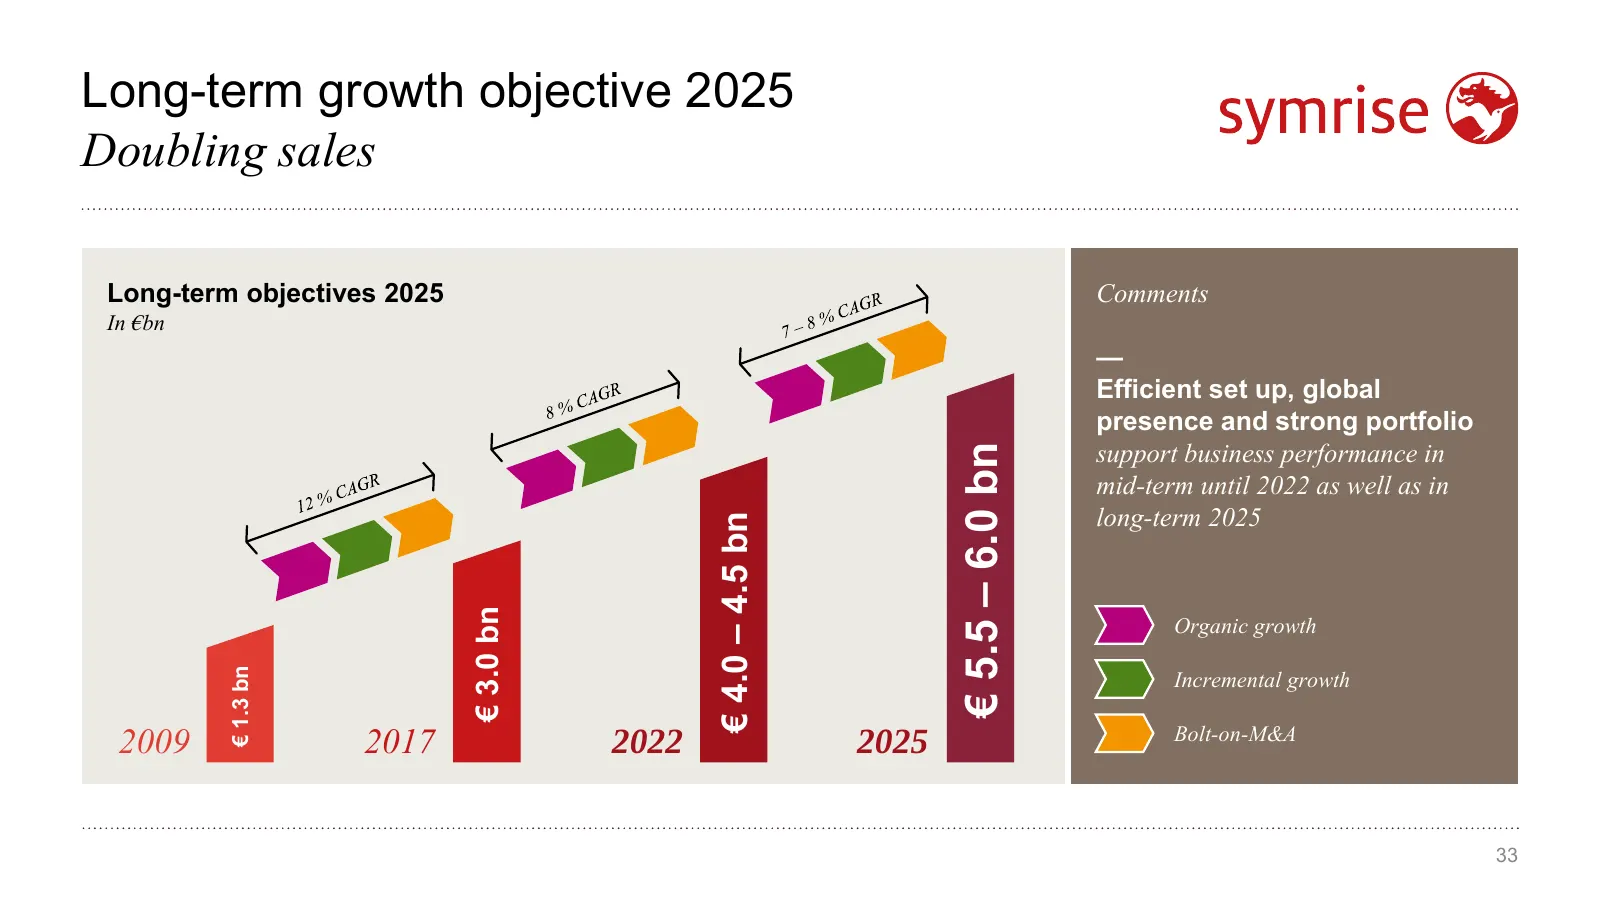
Long-term growth objective 2025 Doubling sales Long-term objectives 2025 Comments In €bn — Efficient set up, global presence and strong portfolio support business performance in € 5.5 – 6.0 bn mid-term until 2022 as well as in long-term 2025 € 4.0 – 4.5 bn € 3.0 bn Organic growth Incremental growth
Slide 34: Symrise AG
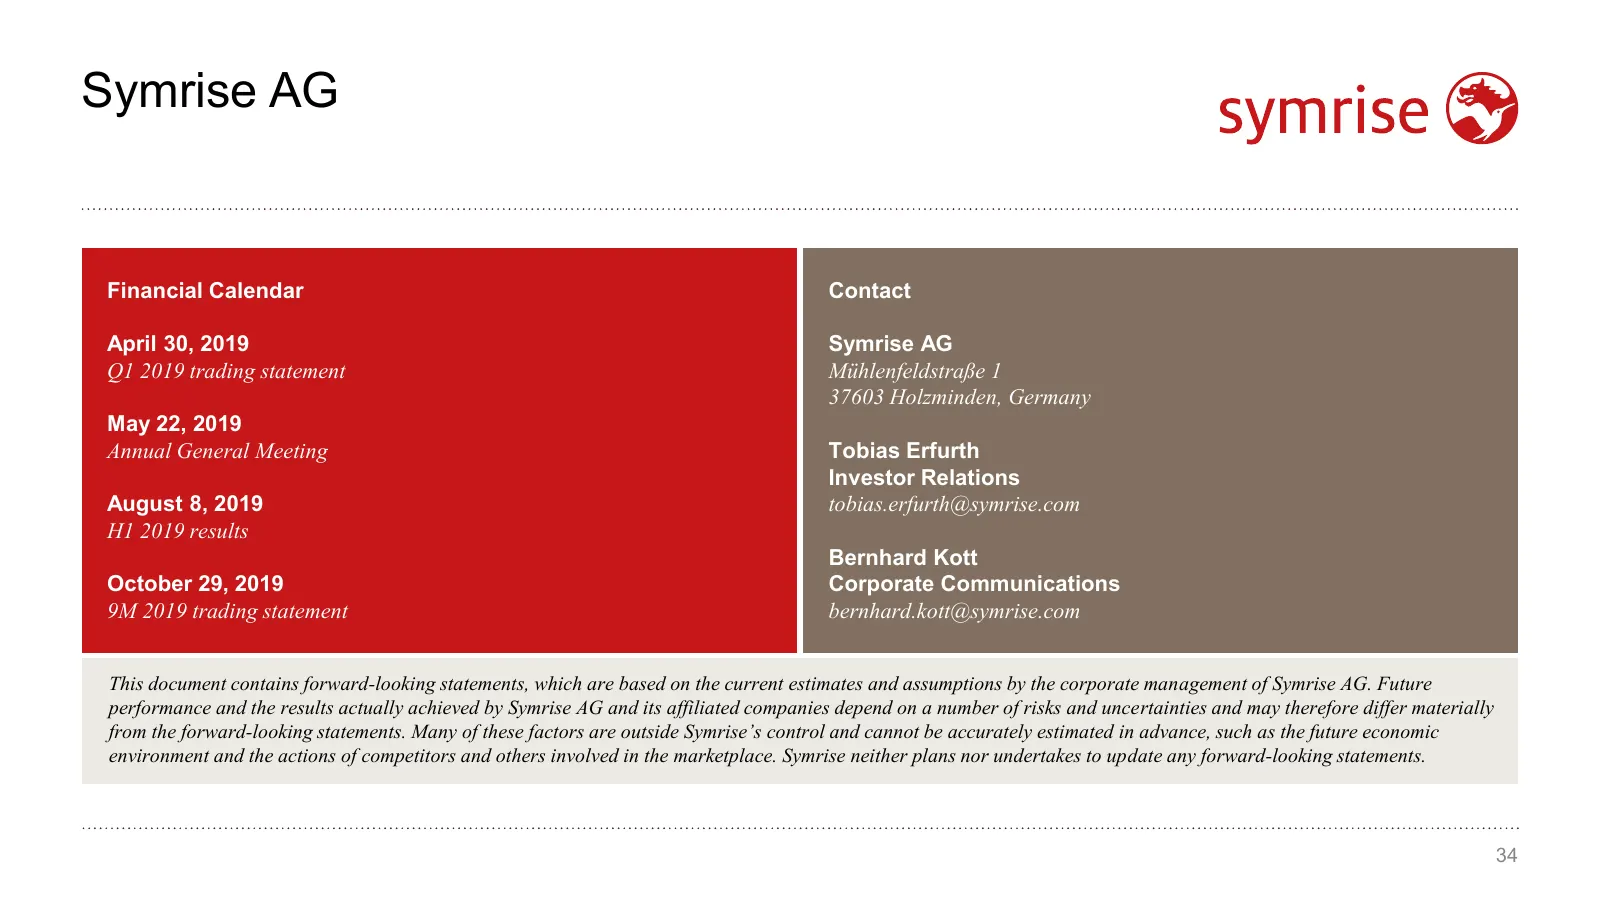
Symrise AG Financial Calendar Contact April 30, 2019 Symrise AG Q1 2019 trading statement Mühlenfeldstraße 1 37603 Holzminden, Germany May 22, 2019 Annual General Meeting Tobias Erfurth Investor Relations August 8, 2019 tobias.erfurth@symrise.com H1 2019 results Bernhard Kott October 29, 2019 Corpor
Slide 35: Q4 2018 Group and S&C
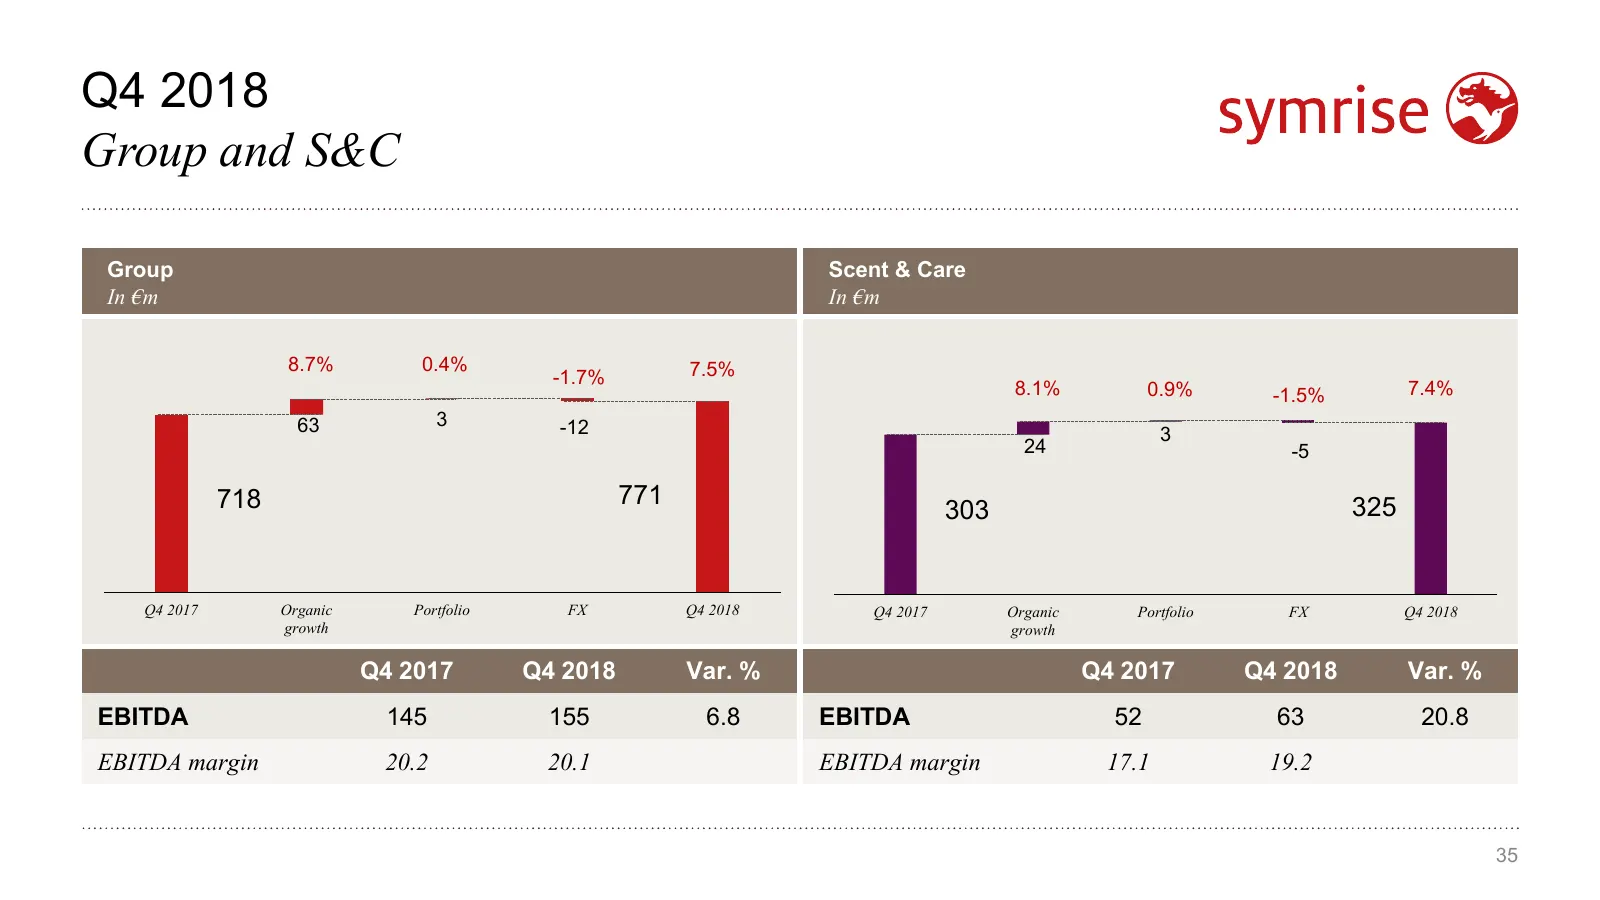
Q4 2018 Group and S&C Group Scent & Care In €m In €m 8.7% 0.4% 7.5% -1.7% 8.1% 0.9% -1.5% 7.4% 63 3 -12 3 24 -5 718 771 325 303 Q4 2017 Organic Portfolio FX Q4 2018 Q4 2017 Organic Portfolio FX Q4 2018 growth growth Q4 2017 Q4 2018 Var. % Q4 2017 Q4 2018 Var. % EBITDA 145 155 6.8 EBITDA 52 63 20.8 E
Slide 36: Q4 2018 Flavor and Nutrition
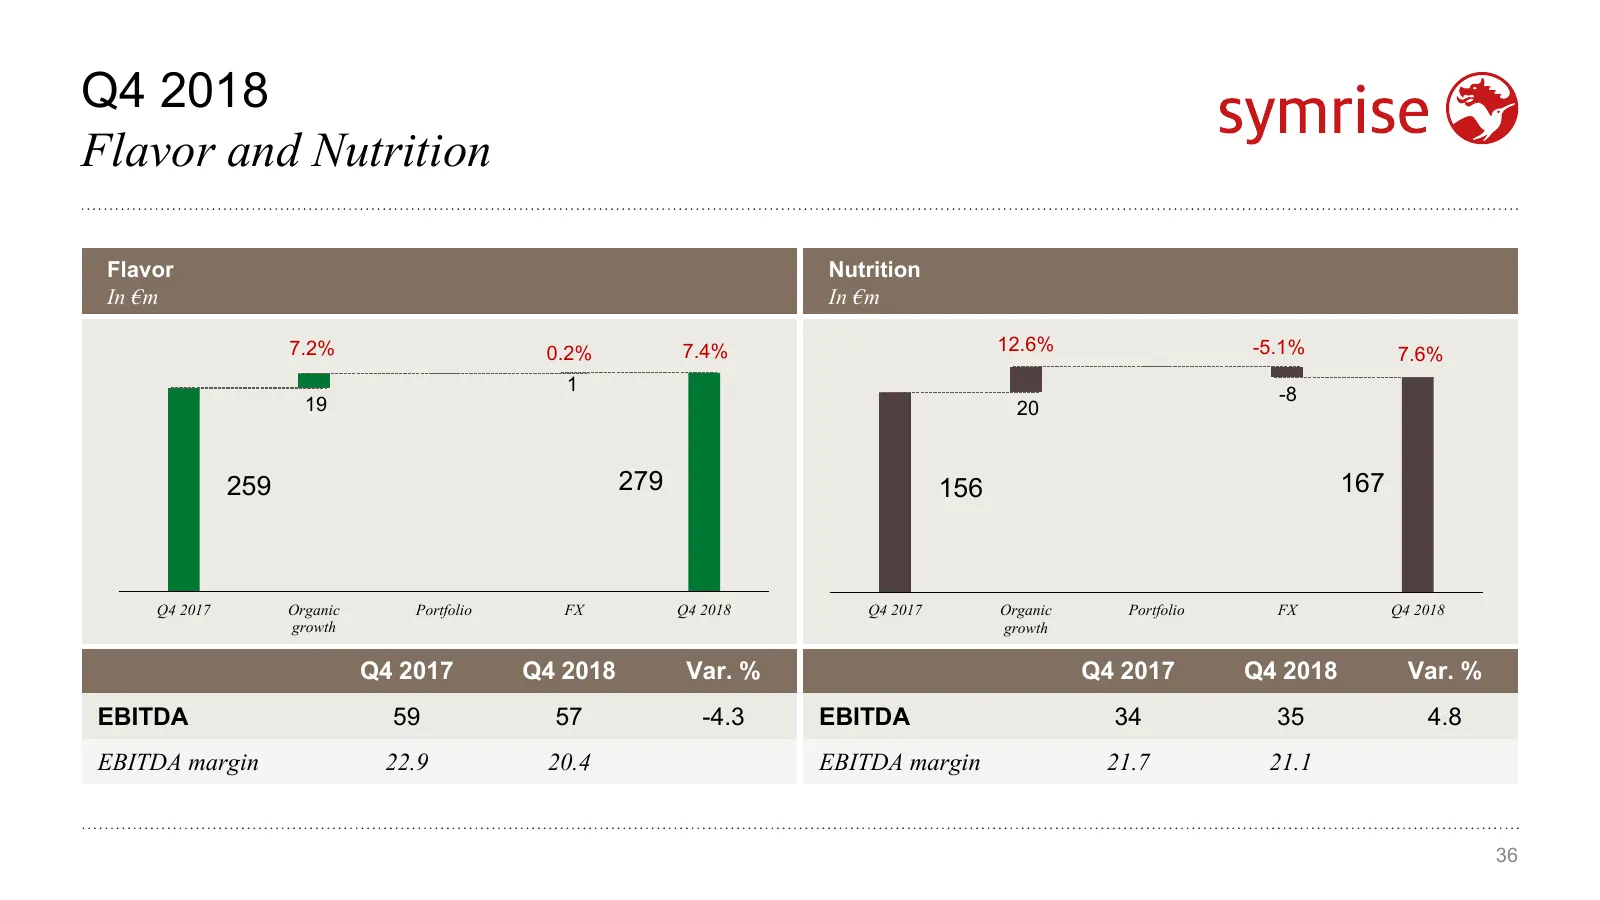
Q4 2018 Flavor and Nutrition Flavor Nutrition In €m In €m 7.2% 0.2% 7.4% 12.6% -5.1% 7.6% 1 -8 19 20 259 279 156 167 Q4 2017 Organic Portfolio FX Q4 2018 Q4 2017 Organic Portfolio FX Q4 2018 growth growth Q4 2017 Q4 2018 Var. % Q4 2017 Q4 2018 Var. % EBITDA 59 57 -4.3 EBITDA 34 35 4.8 EBITDA margin
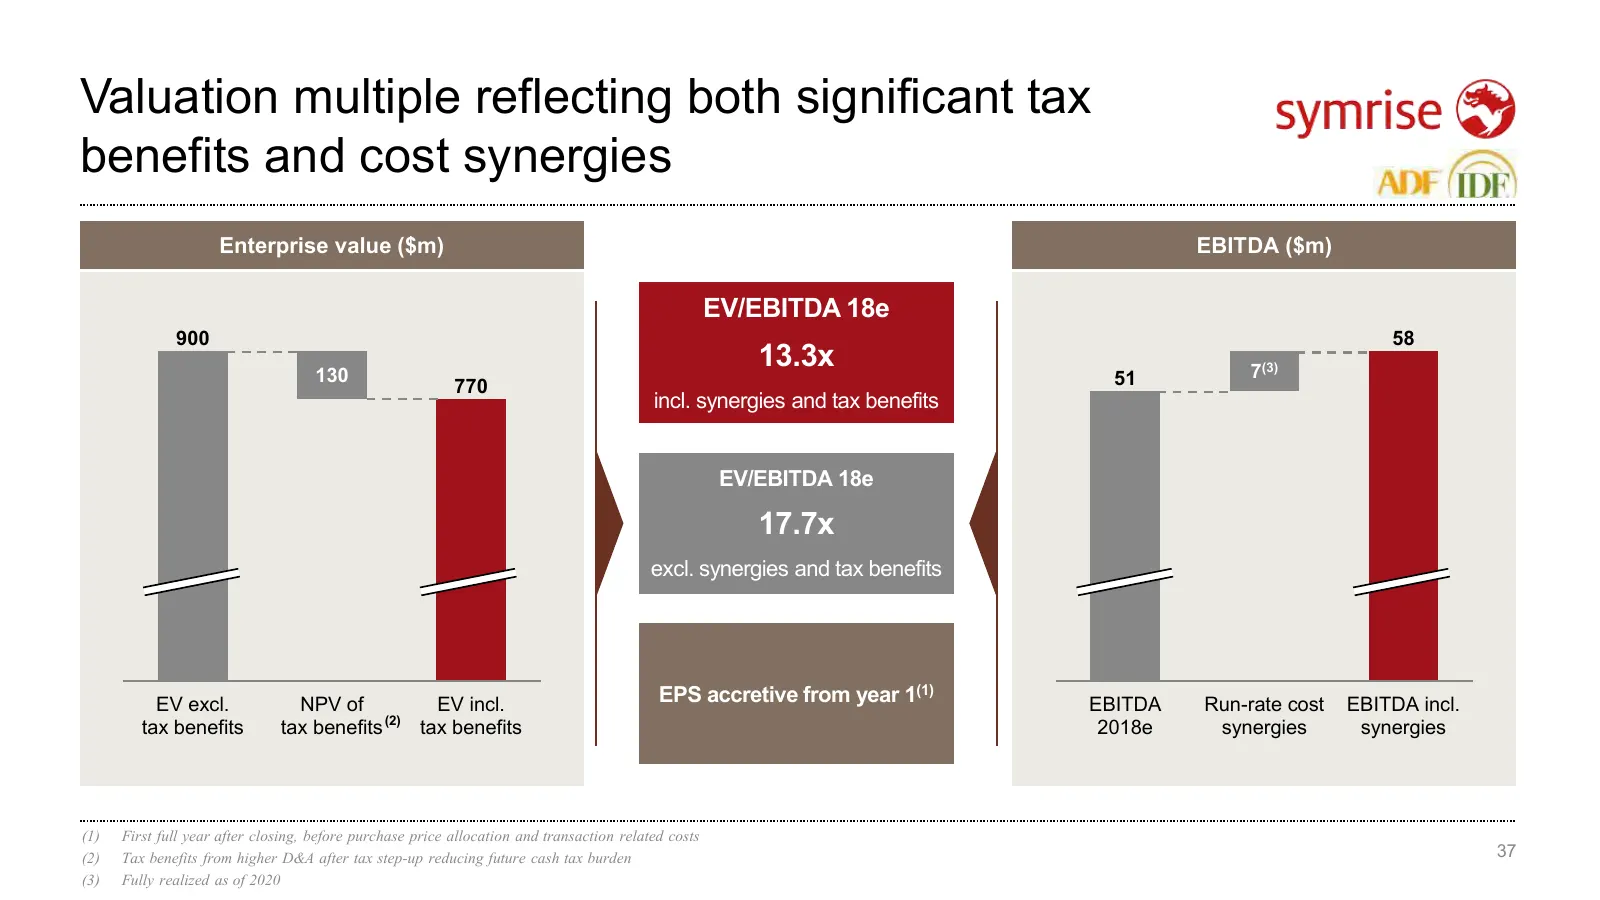
Slide 37: Valuation multiple reflecting tax benefits and cost synergies
Valuation multiple reflecting both significant tax benefits and cost synergies Enterprise value ($m) EBITDA ($m) EV/EBITDA 18e 900 58 130 13.3x 7(3) 770 51 incl. synergies and tax benefits EV/EBITDA 18e 17.7x excl. synergies and tax benefits EV excl. NPV of EV incl. EPS accretive from year 1(1) EBIT
Slide 38: always inspiring more...
always inspiring more... se ~~
Source: Internet Archive copy of symrise.com
More decks from Symrise AG
 Q3 2026 Earnings Presentation22 slides · Oct 28, 2026
 Investor Presentation (October 2026)39 slides · October 2026
 H1 2026 Earnings Presentation25 slides · Jul 30, 2026
 Q2 2026 Earnings Presentation29 slides · Jul 30, 2026
 Shareholder Meeting (May 2026)19 slides · May 6, 2026
 Q1 2026 Earnings Presentation19 slides · Apr 29, 2026