Raute Oyj Class A · OMXHEX:RAUTE
Raute Oyj Class A — H1 2022 Earnings Presentation
18 slides from Raute Oyj Class A's earnings presentation, Jul 22, 2022
Slide 1: Half-year report H1 22
Half-year report H1 22 1.1.−30.6.2022 Petri Strengell, President and CEO 22 July 2022
Slide 2: Business environment and market for Raute
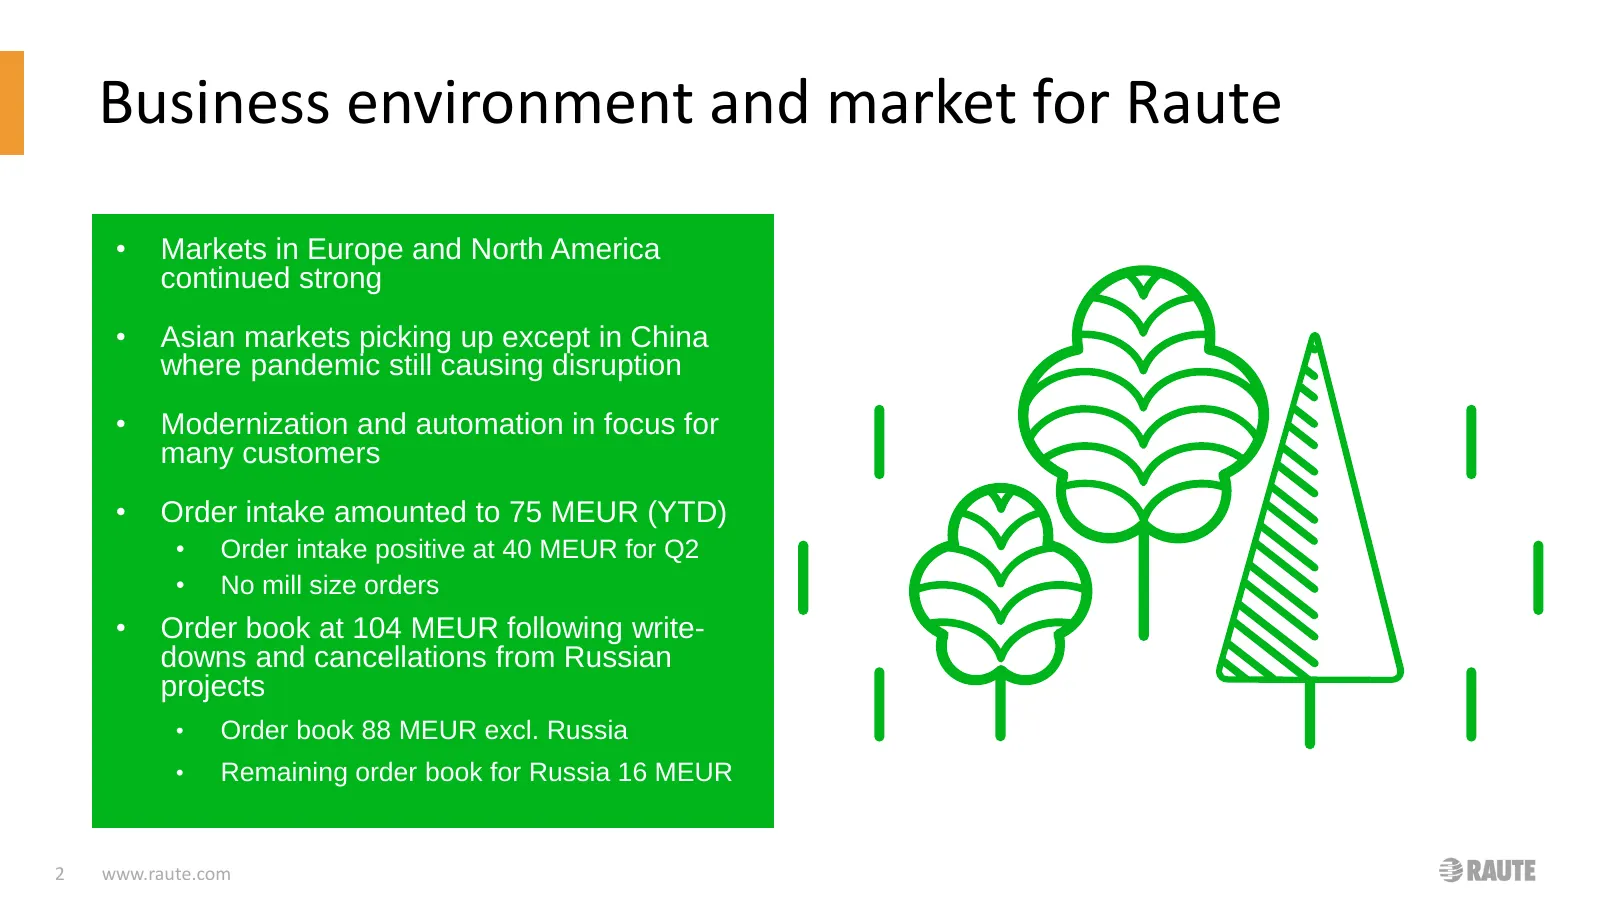
Business environment and market for Raute • Markets in Europe and North America continued strong • Asian markets picking up except in China where pandemic still causing disruption • Modernization and automation in focus for many customers • Order intake amounted to 75 MEUR (YTD) • Order intake posit
Slide 3: Raute H1 / 2022 in brief
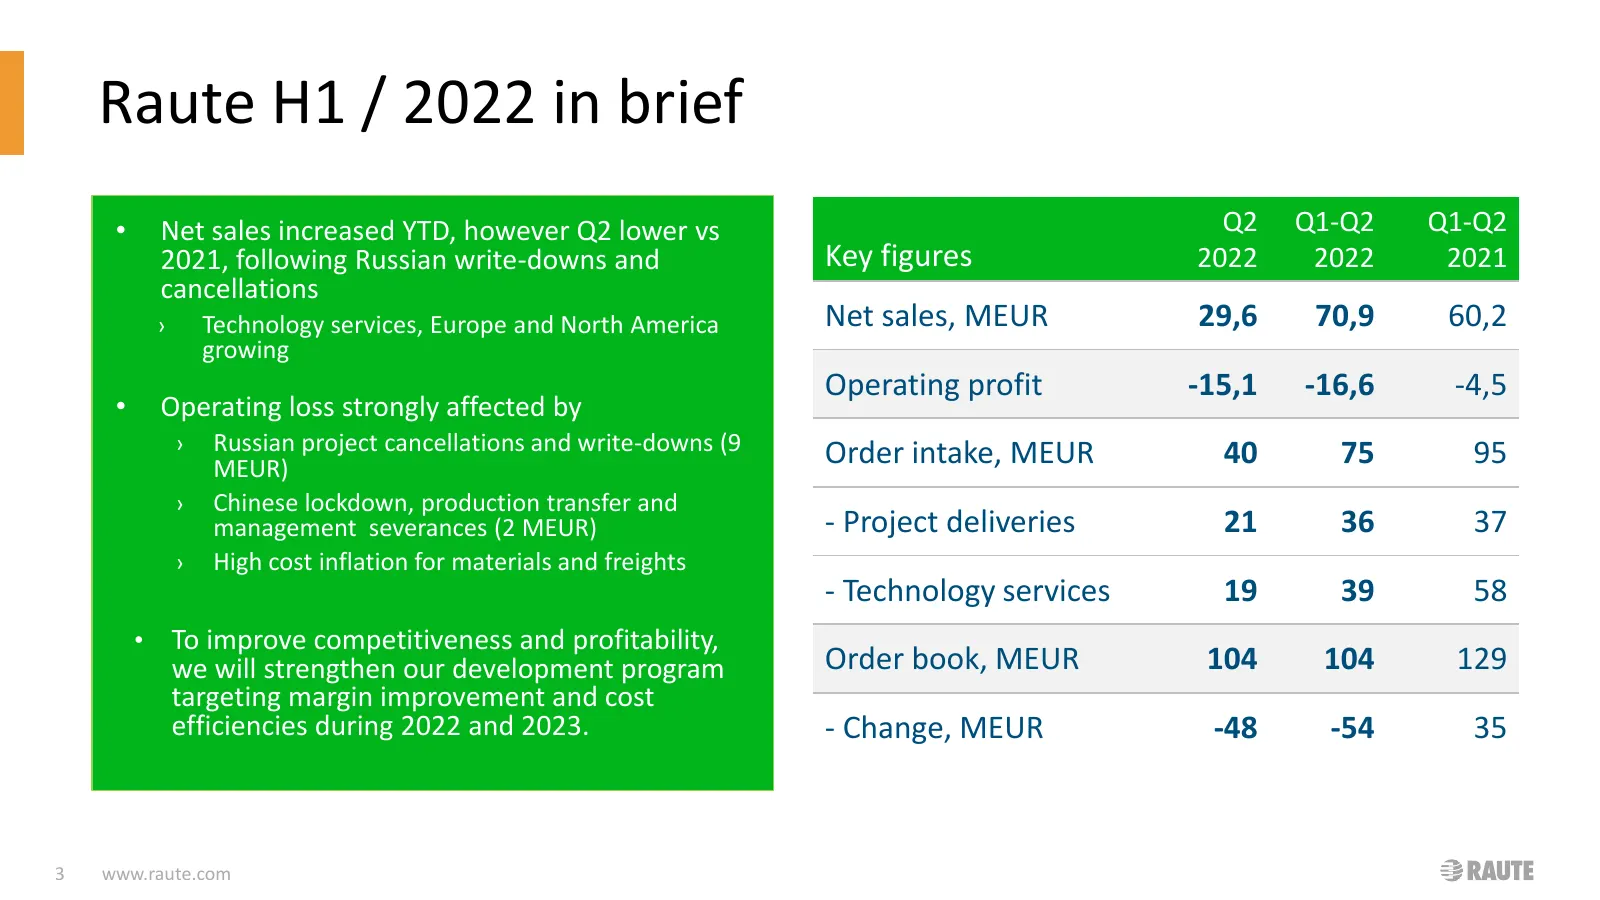
Raute H1 / 2022 in brief • Net sales increased YTD, however Q2 lower vs Q2 Q1-Q2 Q1-Q2 2021, following Russian write-downs and Key figures 2022 2022 2021 cancellations › Technology services, Europe and North America Net sales, MEUR 29,6 70,9 60,2 growing Operating profit -15,1 -16,6 -4,5 • Operating
Slide 4: Order intake
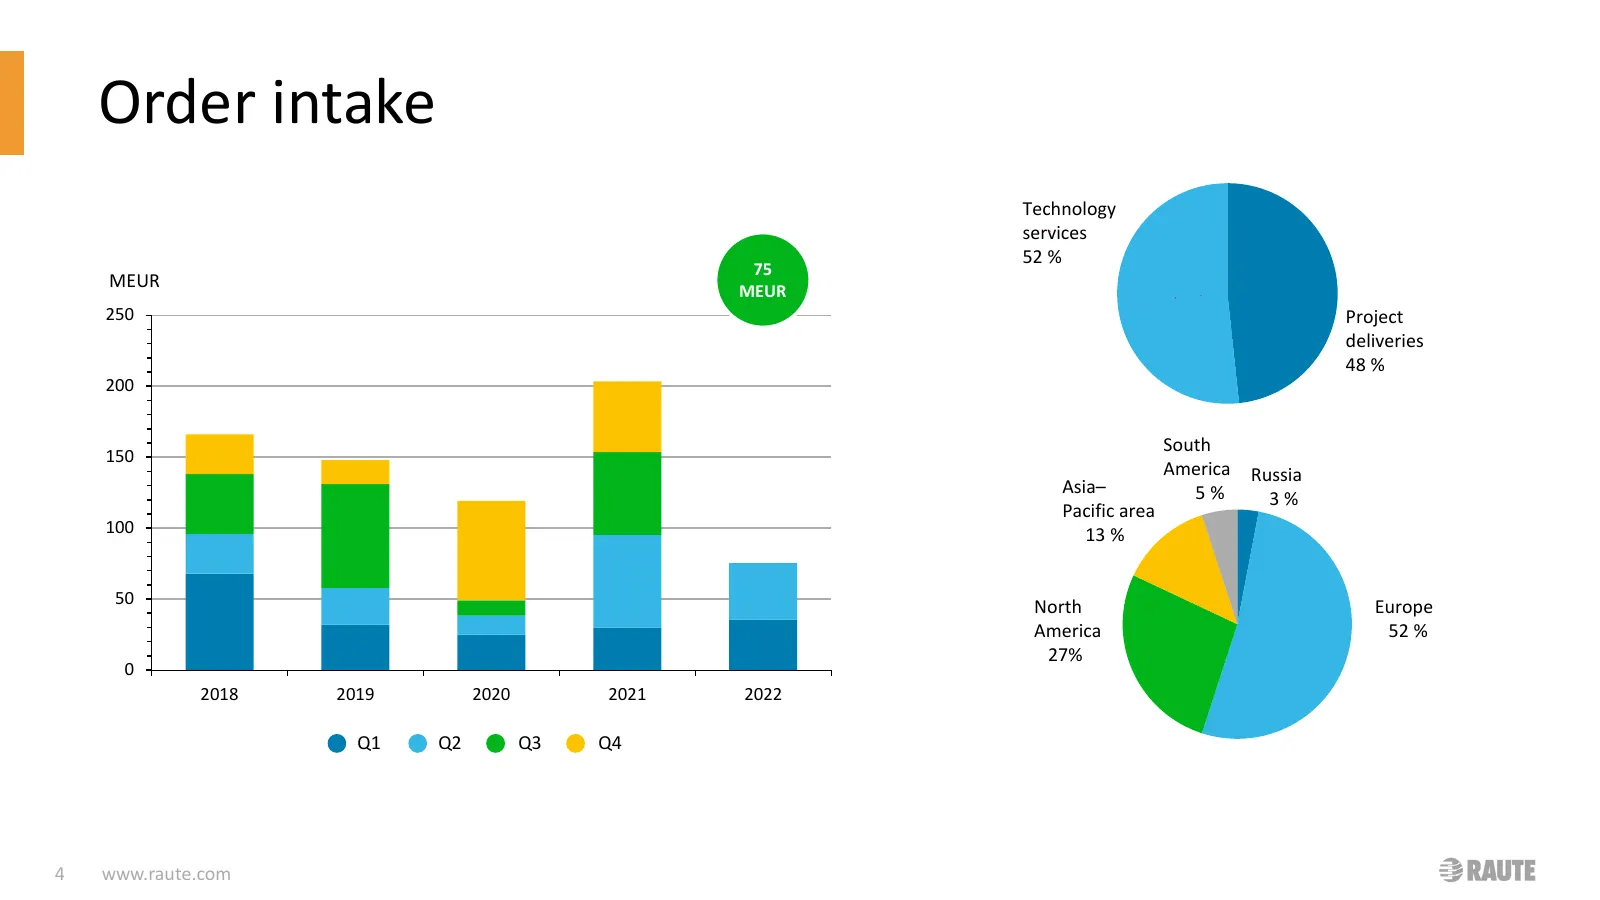
Order intake Technology services 52 % 75 MEUR MEUR 250 Project deliveries 48 % 200 South 150 America Russia Asia– 5% 3% Pacific area 100 13 % 50 North Europe America 52 % 27% 0 2018 2019 2020 2021 2022 Q1 Q2 Q3 Q4 4 www.raute.com
Slide 5: Order book
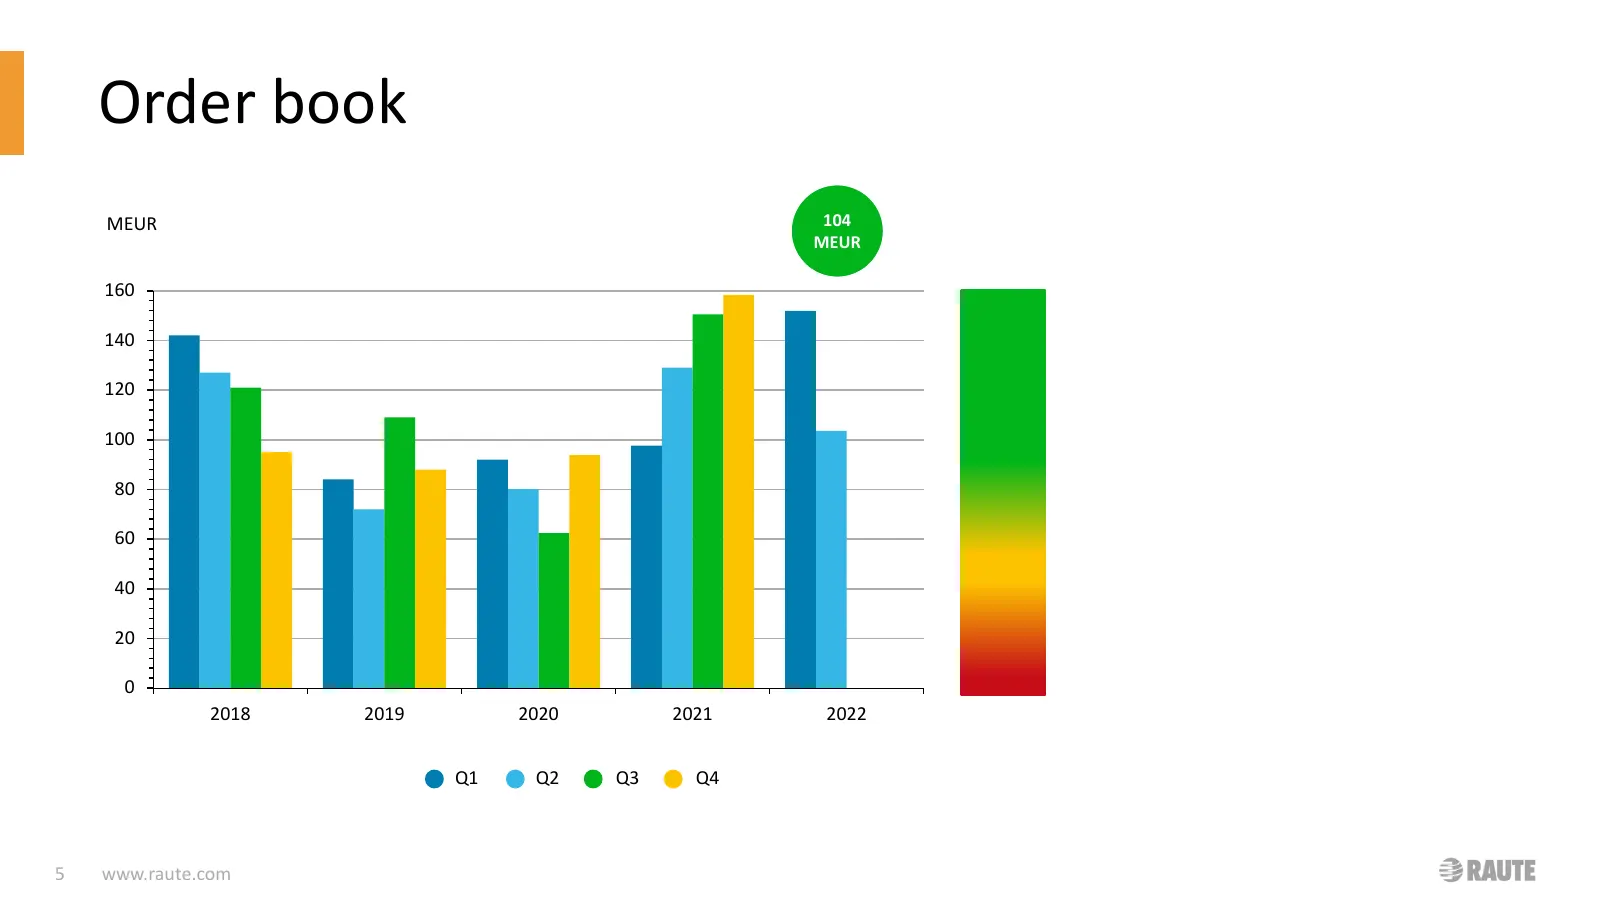
Order book MEUR 104 MEUR 160 140 120 100 80 60 40 20 0 2018 2019 2020 2021 2022 Q1 Q2 Q3 Q4 5 www.raute.com
Slide 6: Net sales
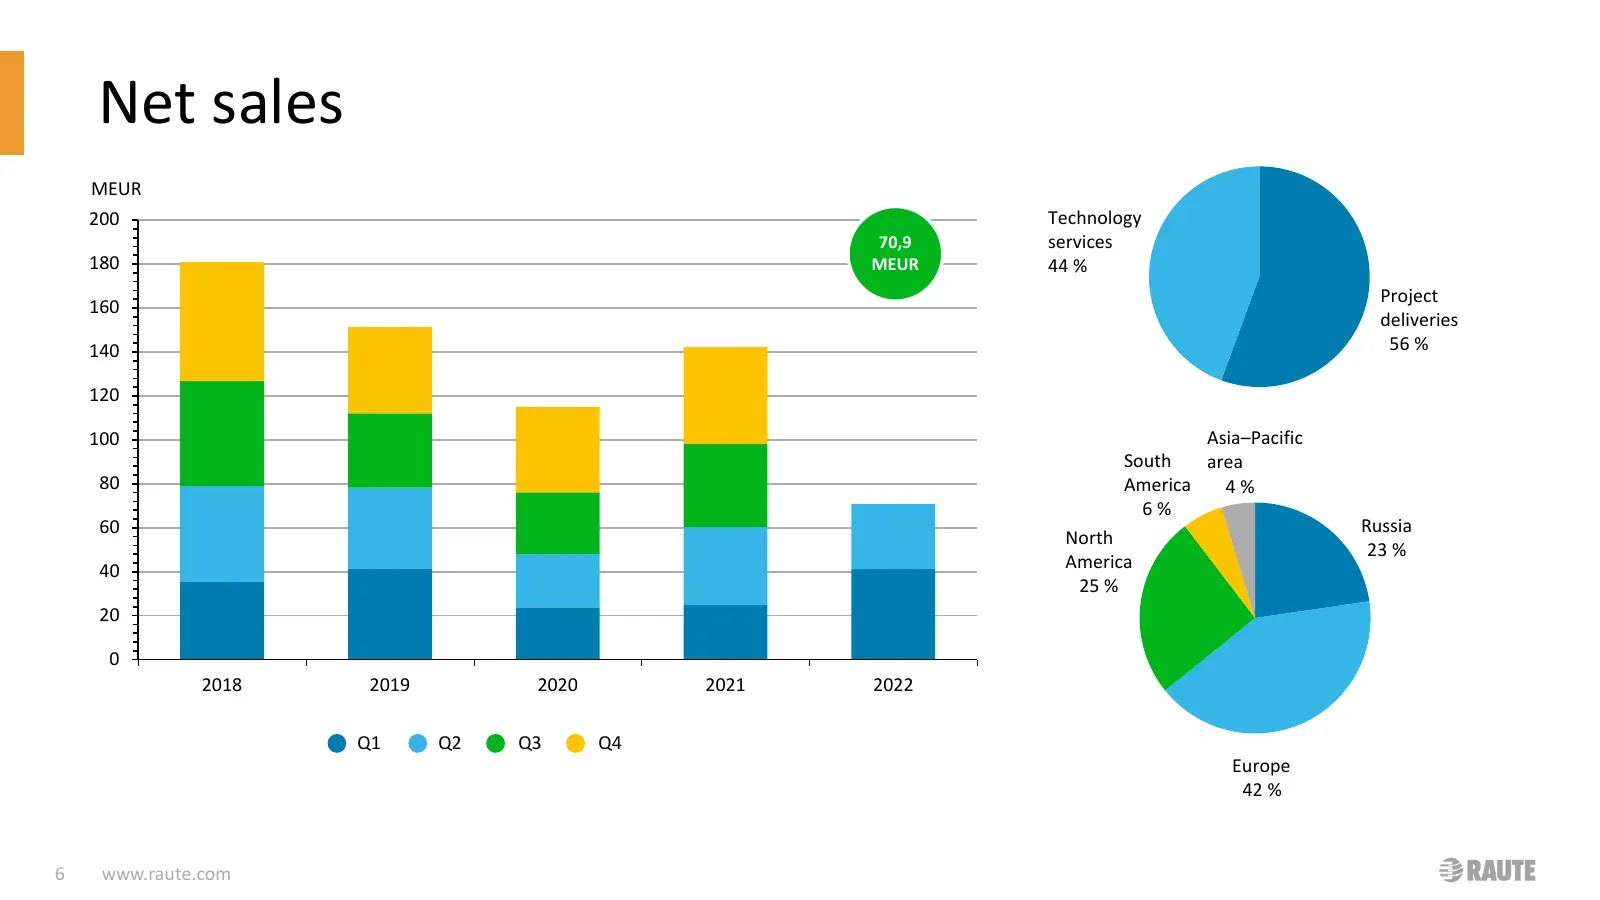
Net sales MEUR 200 Technology 70,9 services 180 MEUR 44 % Project 160 deliveries 140 56 % 120 100 Asia–Pacific South area 80 America 4% 6% 60 Russia North 23 % 40 America 25 % 20 0 2018 2019 2020 2021 2022 Q1 Q2 Q3 Q4 Europe 42 % 6 www.raute.com
Slide 7: Operating profit
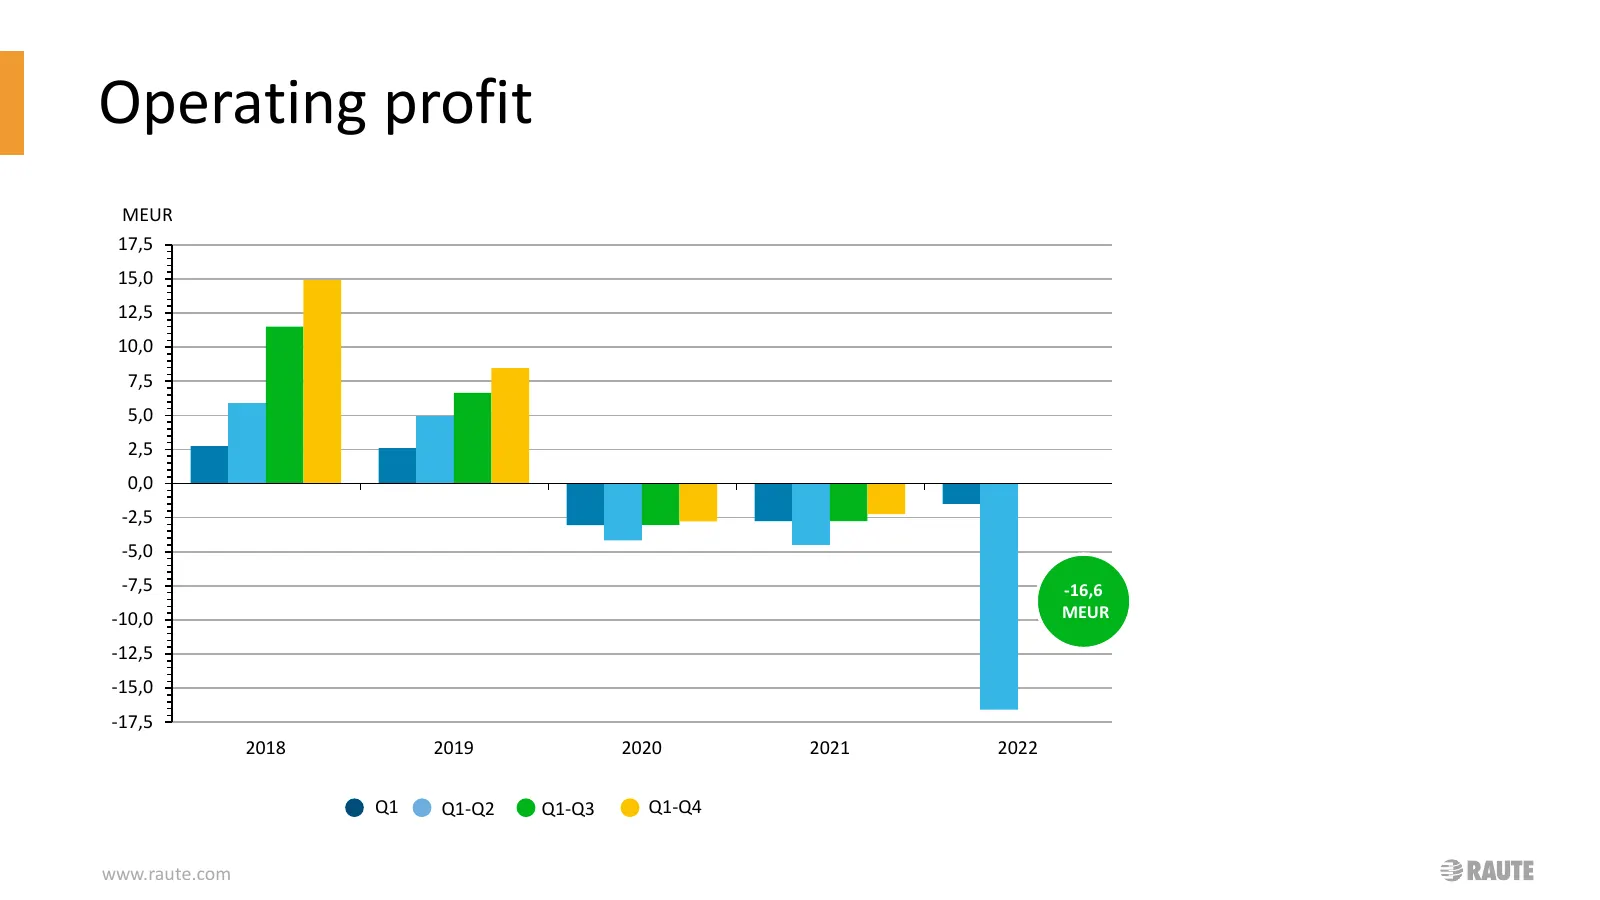
Operating profit MEUR 17,5 15,0 12,5 10,0 7,5 5,0 2,5 0,0 -2,5 -5,0 -7,5 -16,6 -10,0 MEUR -12,5 -15,0 -17,5 2018 2019 2020 2021 2022 Q1 Q1-Q2 Q1-Q3 Q1-Q4 www.raute.com
Slide 8: Income statement, Balance sheet and Key ratios
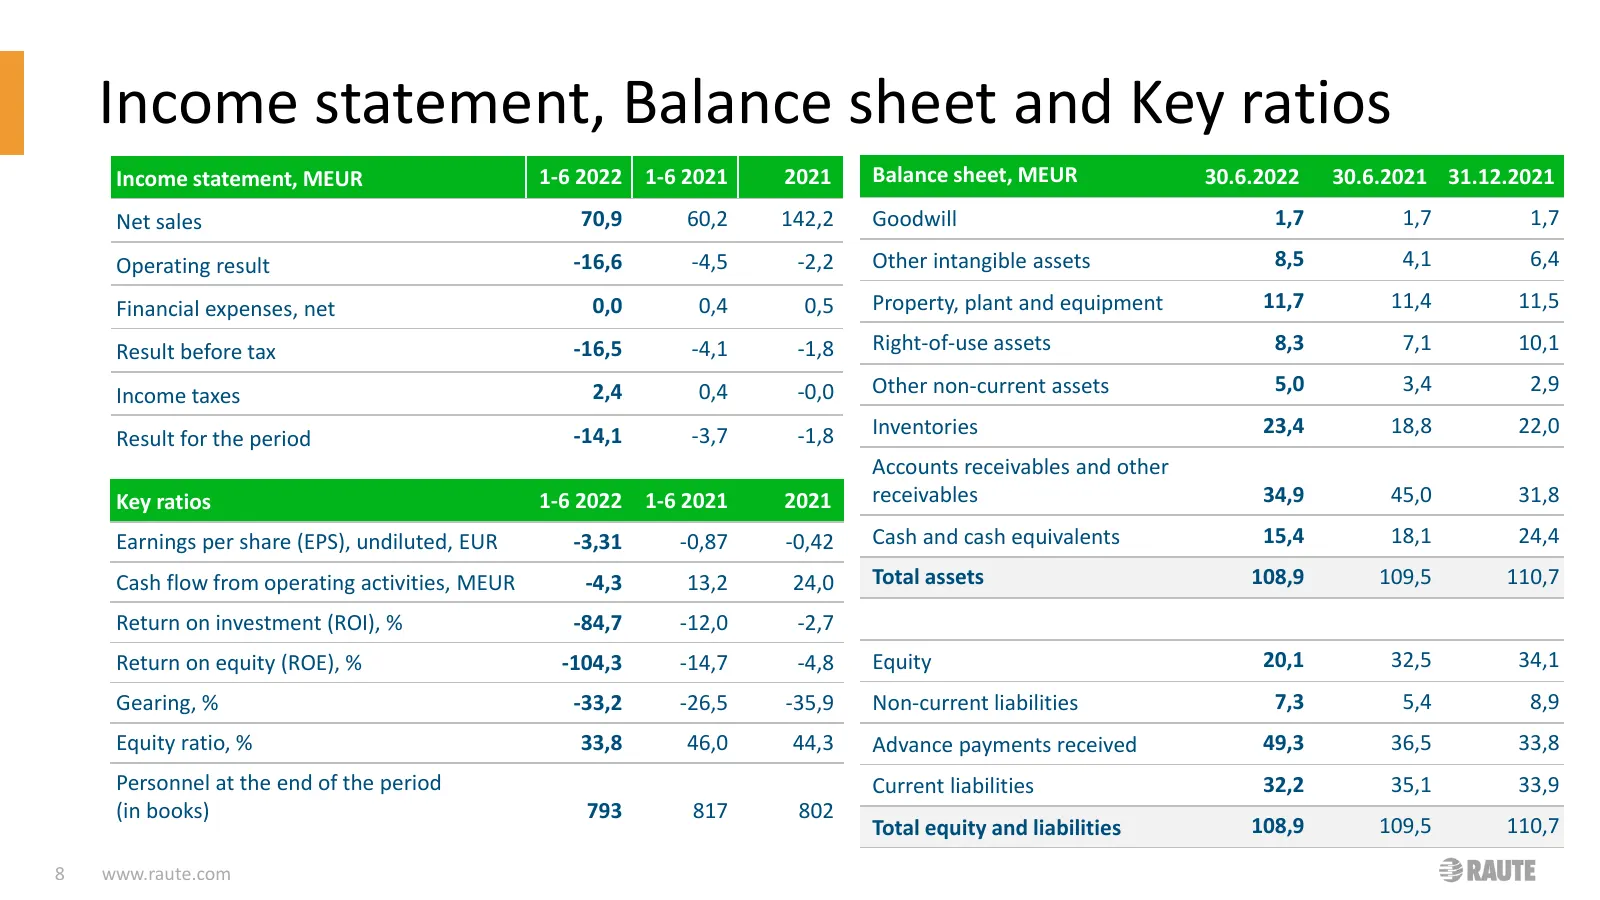
Income statement, Balance sheet and Key ratios Income statement, MEUR 1-6 2022 1-6 2021 2021 Balance sheet, MEUR 30.6.2022 30.6.2021 31.12.2021 Net sales 70,9 60,2 142,2 Goodwill 1,7 1,7 1,7 Operating result -16,6 -4,5 -2,2 Other intangible assets 8,5 4,1 6,4 Financial expenses, net 0,0 0,4 0,5 Prop
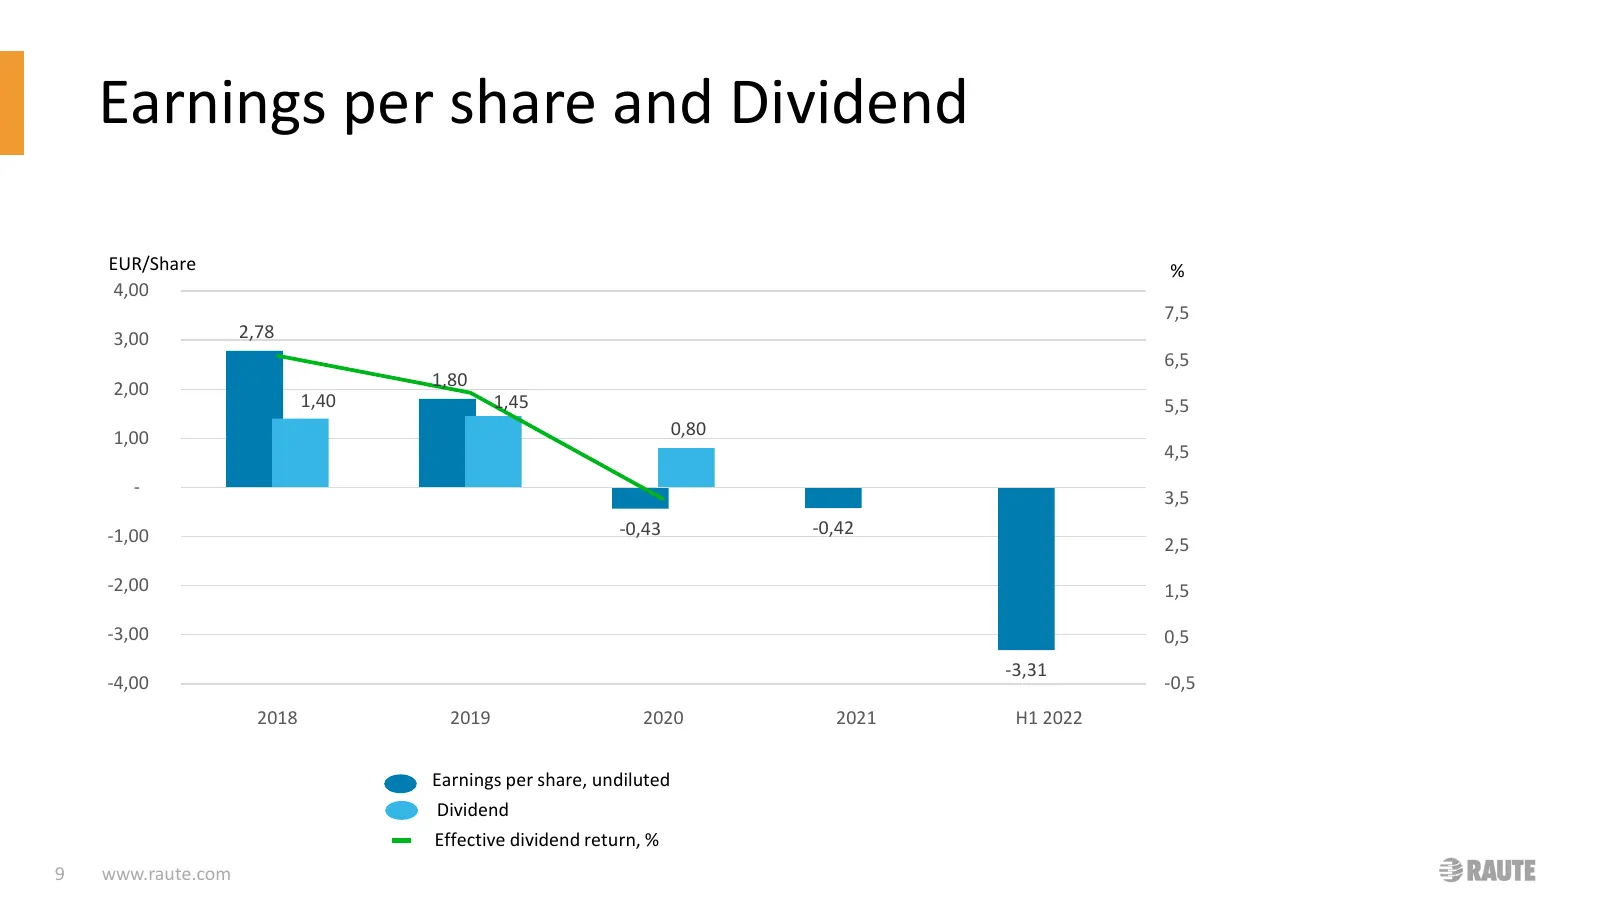
Slide 9: Earnings per share and Dividend
Earnings per share and Dividend EUR/Share % 4,00 7,5 3,00 2,78 6,5 2,00 1,80 1,40 1,45 5,5 1,00 0,80 4,5 - 3,5 -1,00 -0,43 -0,42 2,5 -2,00 1,5 -3,00 0,5 -3,31 -4,00 -0,5 2018 2019 2020 2021 H1 2022 Earnings per share, undiluted Dividend Effective dividend return, % 9 www.raute.com
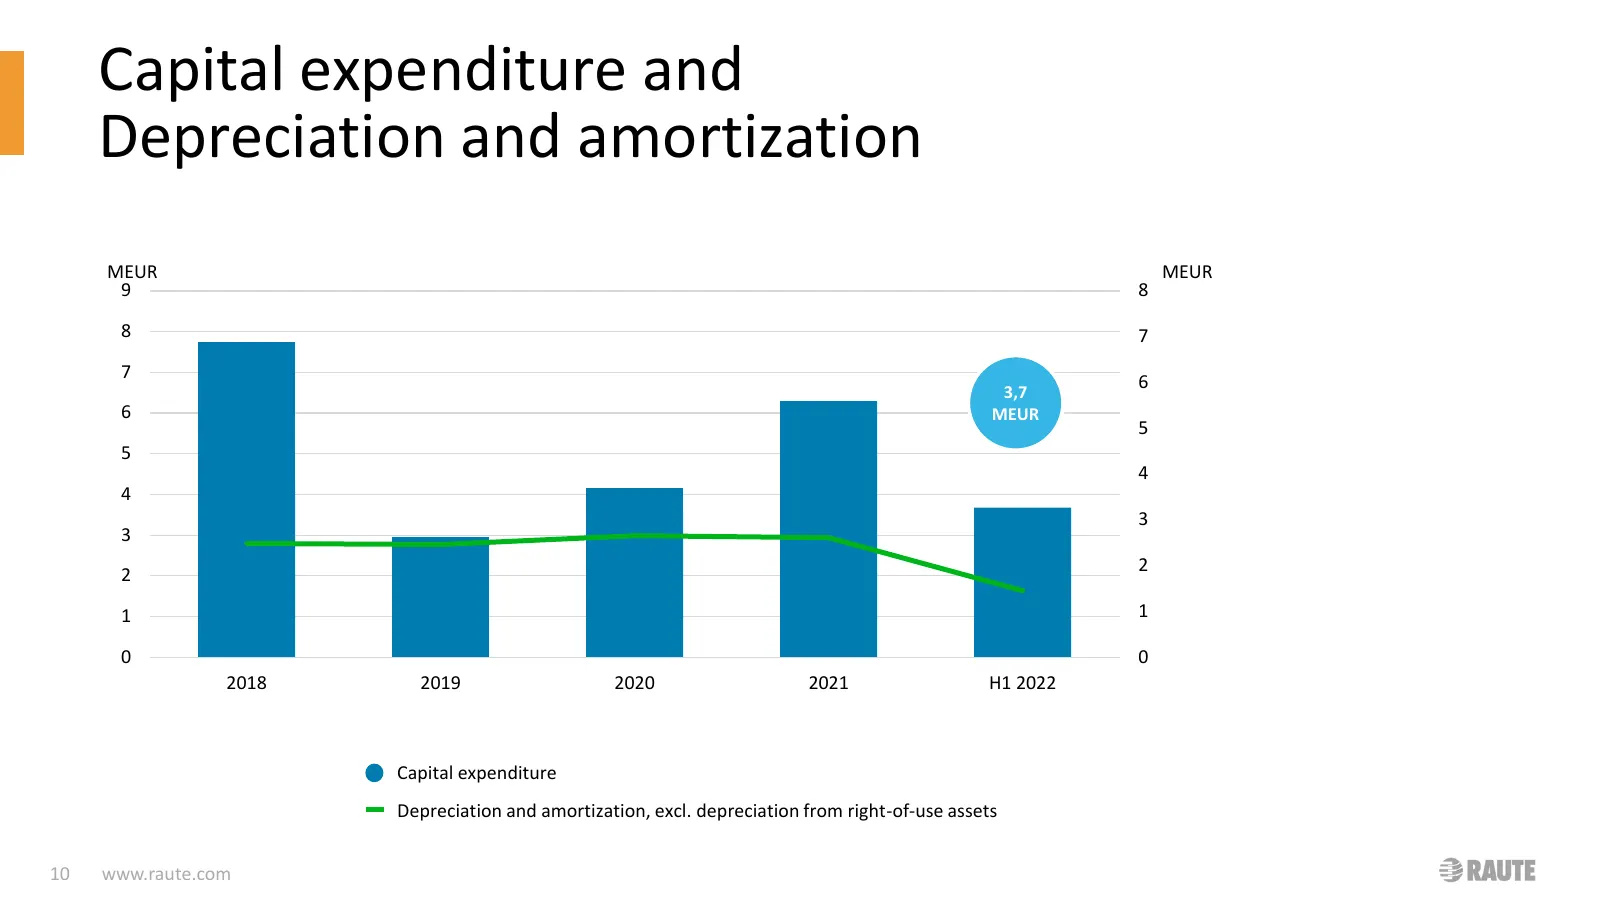
Slide 10: Capital expenditure and Depreciation and amortization
Capital expenditure and Depreciation and amortization MEUR MEUR 9 8 8 7 7 3,7 6 6 MEUR 5 5 4 4 3 3 2 2 1 1 0 0 2018 2019 2020 2021 H1 2022 Capital expenditure Depreciation and amortization, excl. depreciation from right-of-use assets 10 www.raute.com
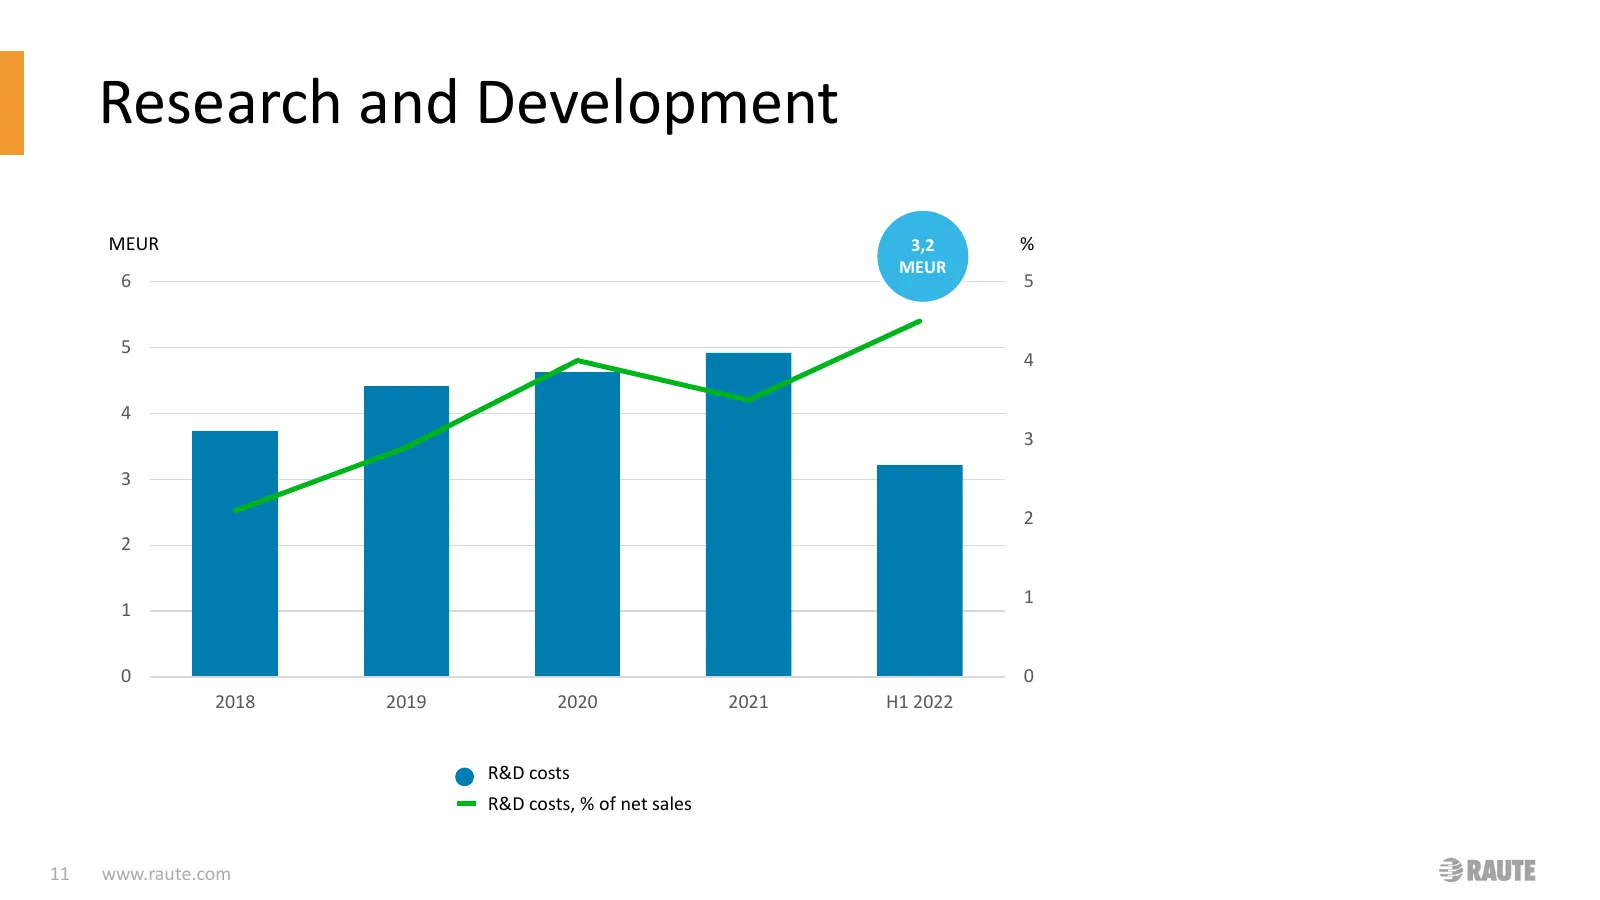
Slide 11: Research and Development
Research and Development MEUR 3,2 % MEUR 6 5 5 4 4 3 3 2 2 1 1 0 0 2018 2019 2020 2021 H1 2022 R&D costs R&D costs, % of net sales 11 www.raute.com
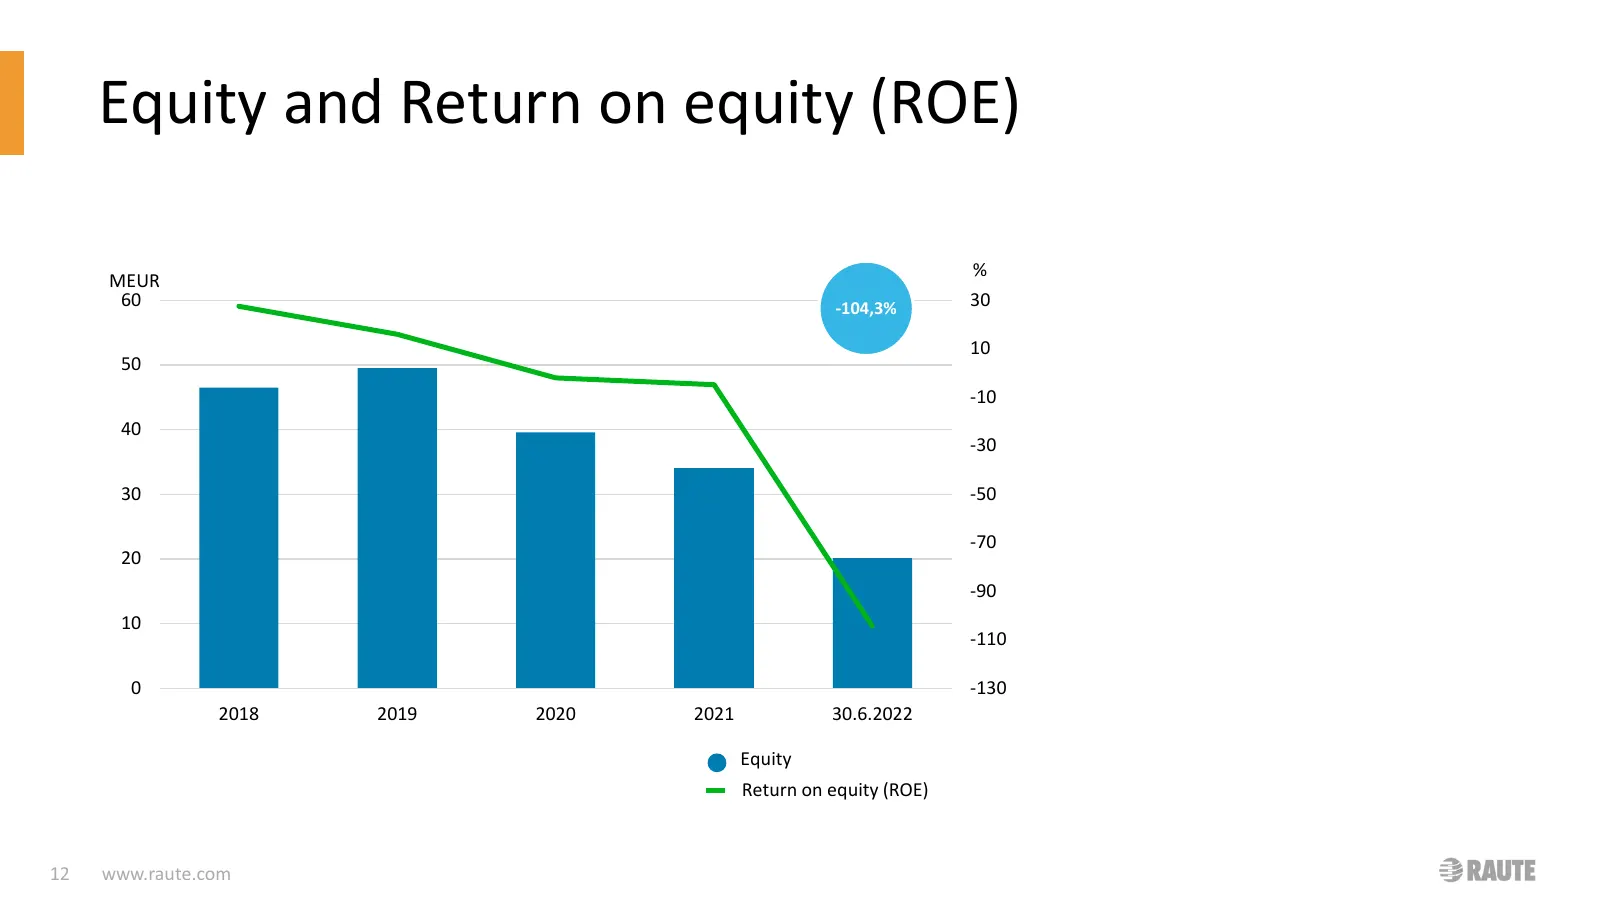
Slide 12: Equity and Return on equity (ROE)
Equity and Return on equity (ROE) % MEUR 60 -104,3% 30 10 50 -10 40 -30 30 -50 -70 20 -90 10 -110 0 -130 2018 2019 2020 2021 30.6.2022 Equity Return on equity (ROE) 12 www.raute.com
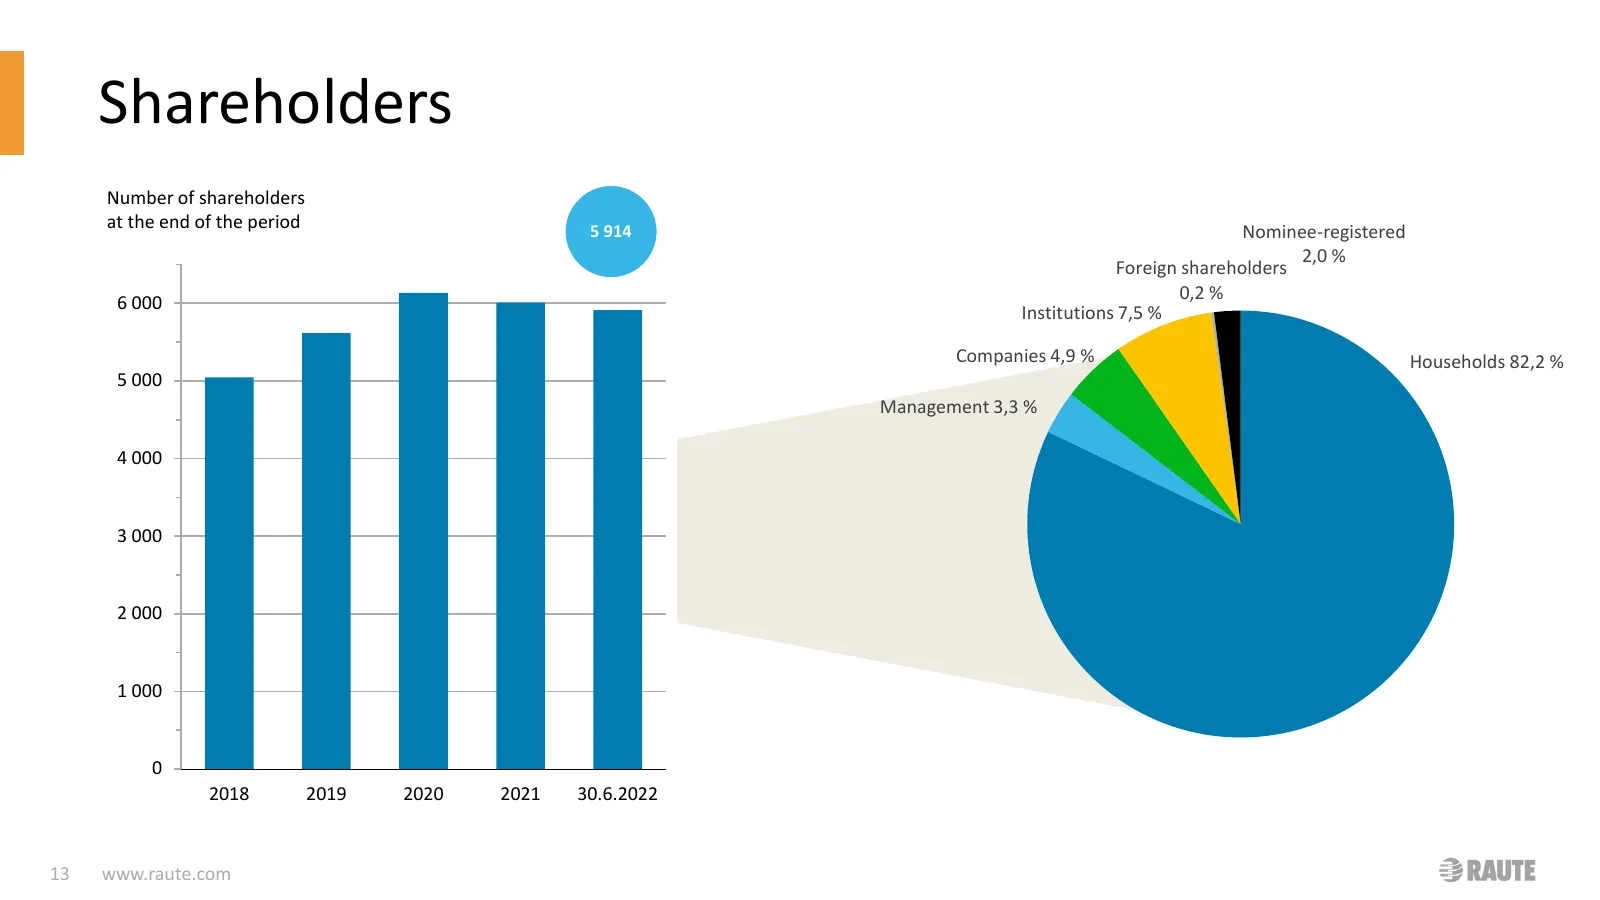
Slide 13: Shareholders
Shareholders Number of shareholders at the end of the period 5 914 Nominee-registered 2,0 % Foreign shareholders 6 000 0,2 % Institutions 7,5 % Companies 4,9 % Households 82,2 % 5 000 Management 3,3 % 4 000 3 000 2 000 1 000 0 2018 2019 2020 2021 30.6.2022 13 www.raute.com
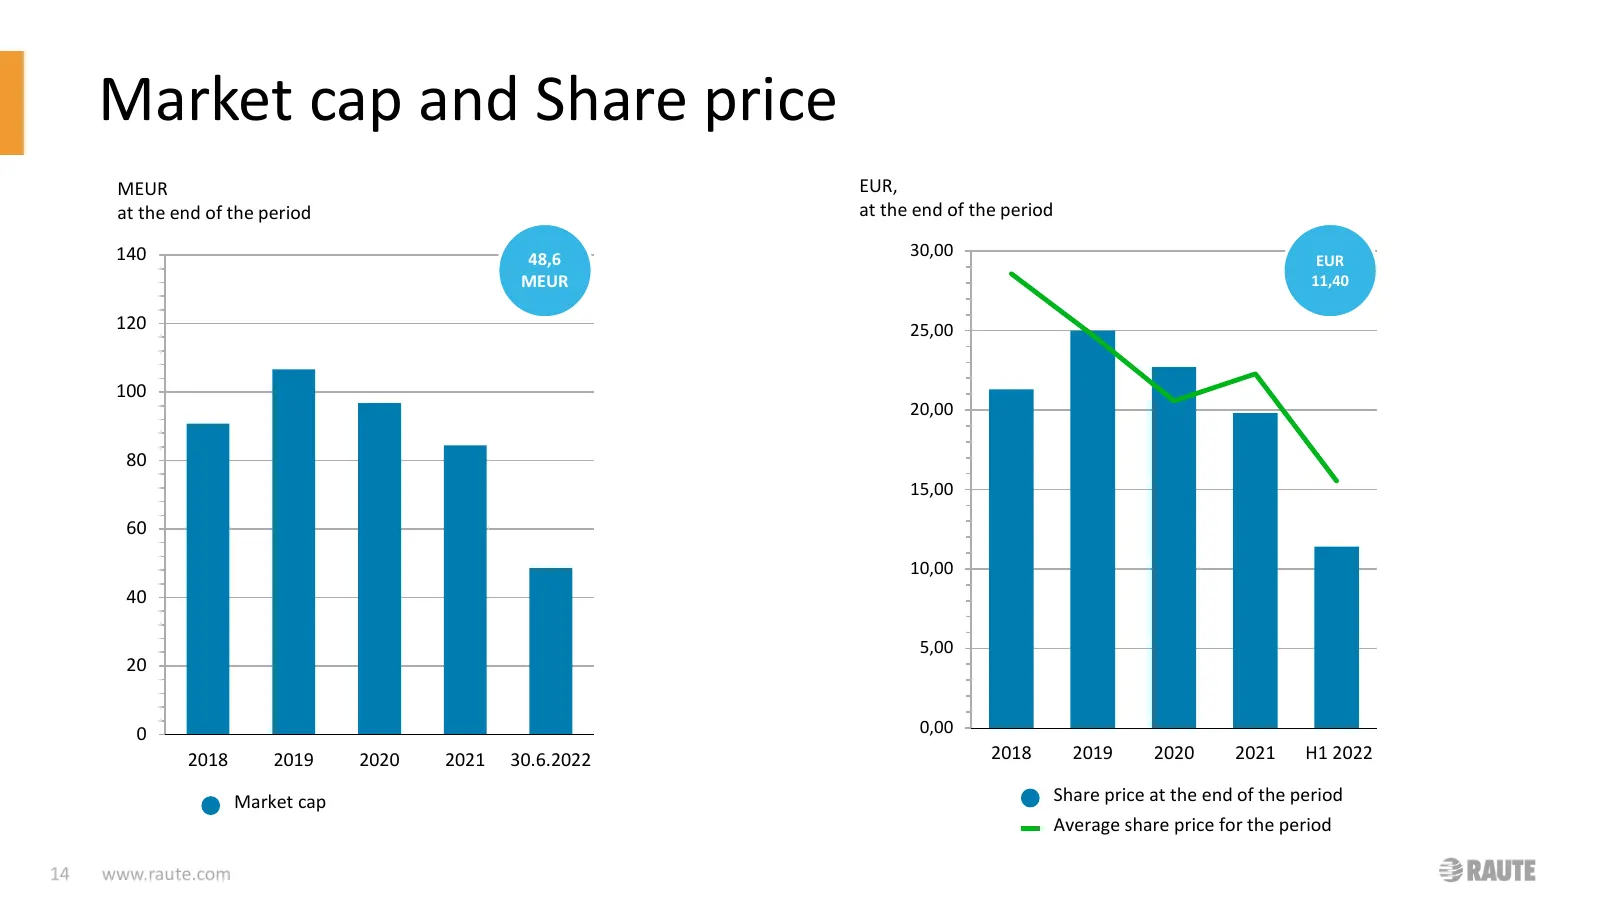
Slide 14: Market cap and Share price
Market cap and Share price MEUR EUR, at the end of the period at the end of the period 140 48,6 30,00 EUR MEUR 11,40 120 25,00 100 20,00 80 15,00 60 10,00 40 5,00 20 0 0,00 2018 2019 2020 2021 30.6.2022 2018 2019 2020 2021 H1 2022 Market cap Share price at the end of the period Average share price f
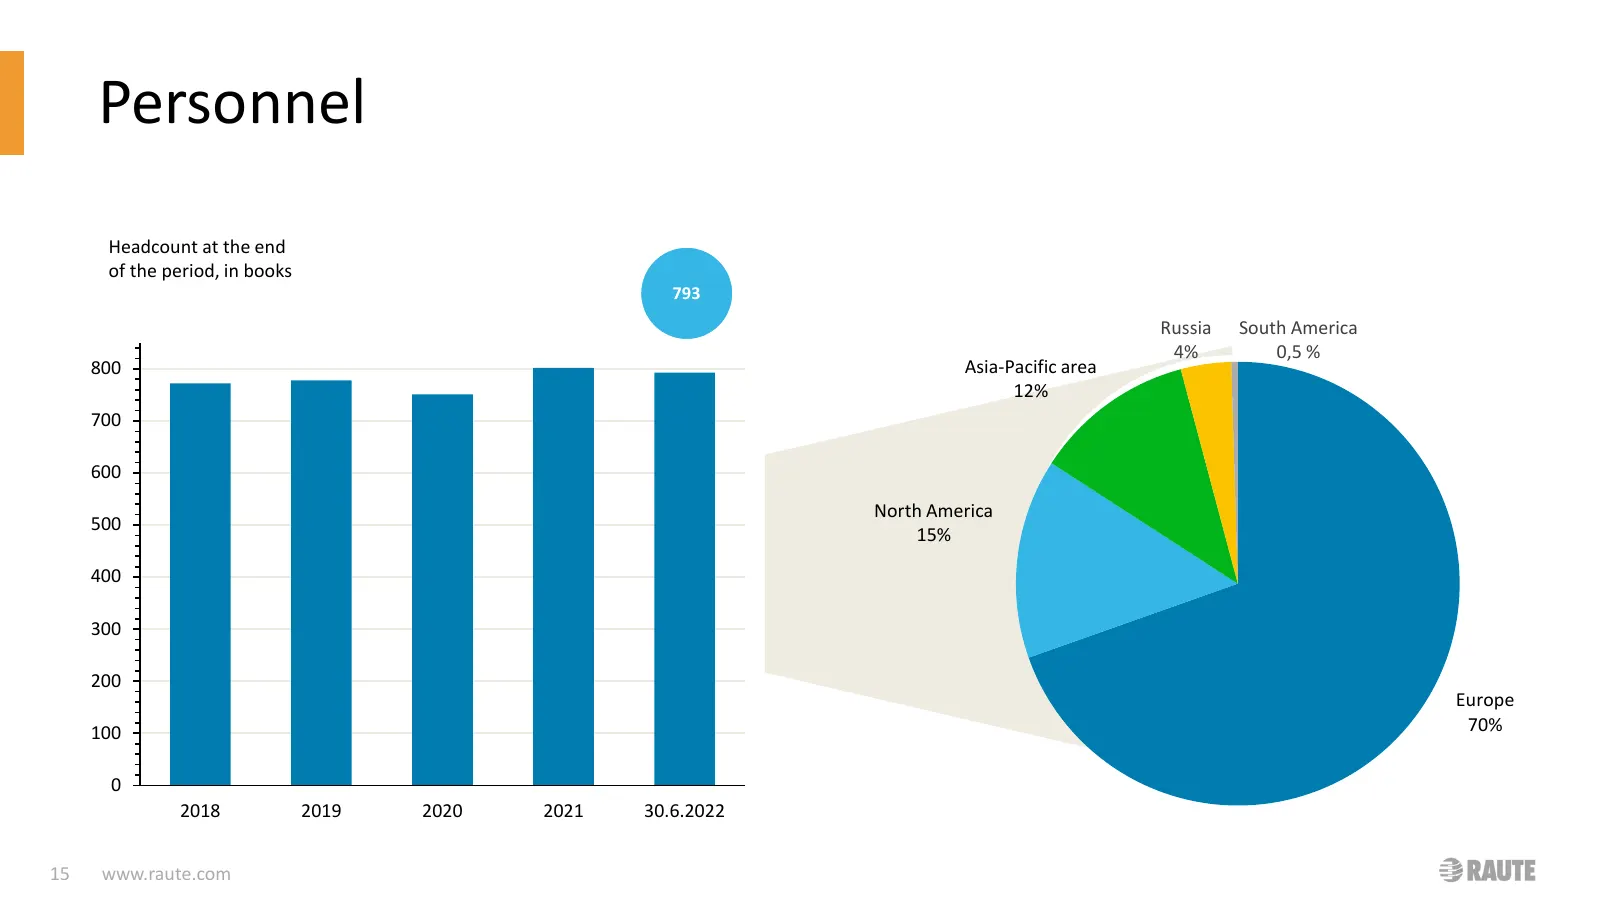
Slide 15: Personnel
Personnel Headcount at the end of the period, in books 793 Russia South America 4% 0,5 % 800 Asia-Pacific area 12% 700 600 North America 500 15% 400 300 200 Europe 100 70% 0 2018 2019 2020 2021 30.6.2022 15 www.raute.com
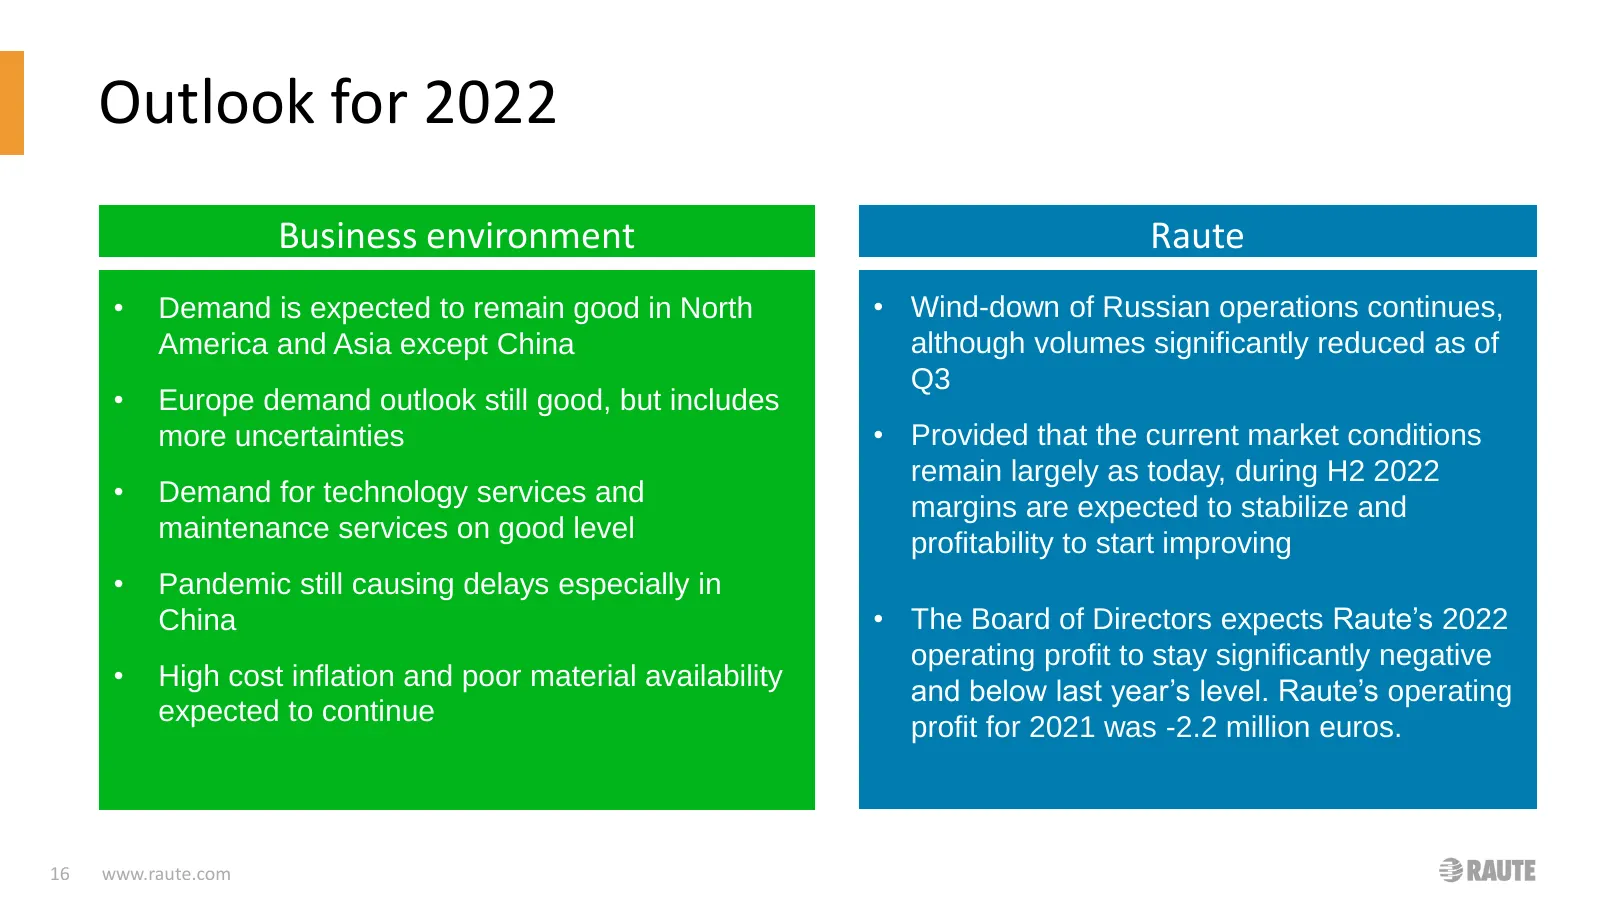
Slide 16: Outlook for 2022
Outlook for 2022 Liiketoimintaympäristö Business environment Raute • Demand is expected to remain good in North • Wind-down of Russian operations continues, America and Asia except China although volumes significantly reduced as of Q3 • Europe demand outlook still good, but includes more uncertainti
Slide 17: Further information
Further information Petri Strengell Interim President and CEO +358 40 7586580 petri.strengell@raute.com Minna Yrjönmäki Interim CFO +358 40 5702067 minna.yrjonmaki@raute.com.com 17 www.raute.com
Slide 18: Thank you for your interest! H1 22
Thank you for H1 22 Follow us online: your interest! www.raute.com Twitter: @RauteCorp LinkedIn: Raute Oyj Youtube: www.youtube.com/RauteMachinery Facebook: Raute Corporation Instagram: @rautecorporation
Source: Internet Archive copy of materials.raute.com
More decks from Raute Oyj Class A
 H1 2026 Earnings Presentation29 slides · Aug 12, 2026
 Q1 2026 Earnings Presentation29 slides · May 7, 2026
 FY2025 Earnings Presentation30 slides · Feb 12, 2026
 Q3 2025 Earnings Presentation29 slides · Oct 30, 2025
 H1 2025 Earnings Presentation29 slides · Aug 12, 2025
 Q1 2025 Earnings Presentation29 slides · May 7, 2025