Southern Union — Non-Deal Roadshow (October 2005)
18 slides from Southern Union's roadshow presentation, Oct 19, 2005
Slide 1: Investor Meetings
NYSE: SUG Investor Meetings October 19, 2005
Slide 2: Safe Harbor
Safe Harbor This presentation and other Company reports and statements issued or made from time to time contain certain “forward-looking statements” concerning projected financial performance, expected plans or future operations. Southern Union Company cautions that actual results and developments m
Slide 3: Widespread Asset Base
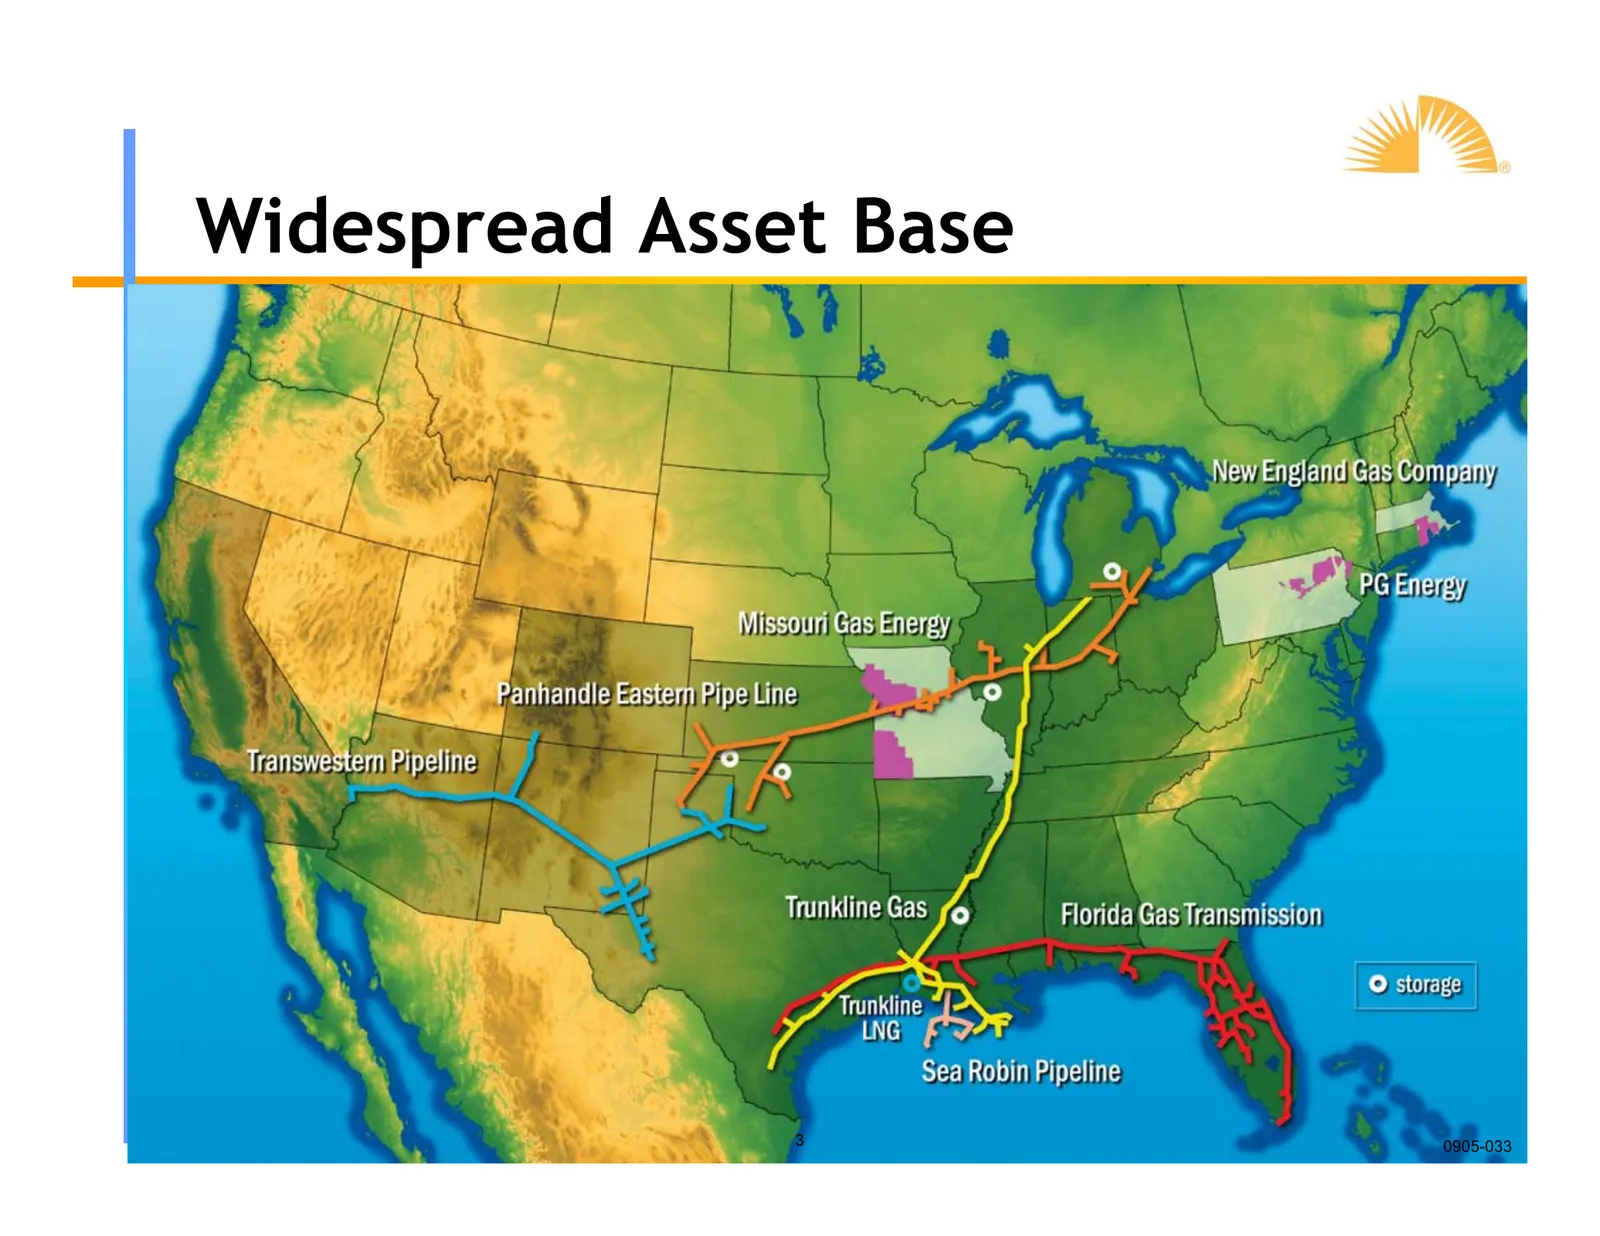
Widespread Asset Base 3 0905-033
Slide 4: Natural Gas Distribution Assets Overview
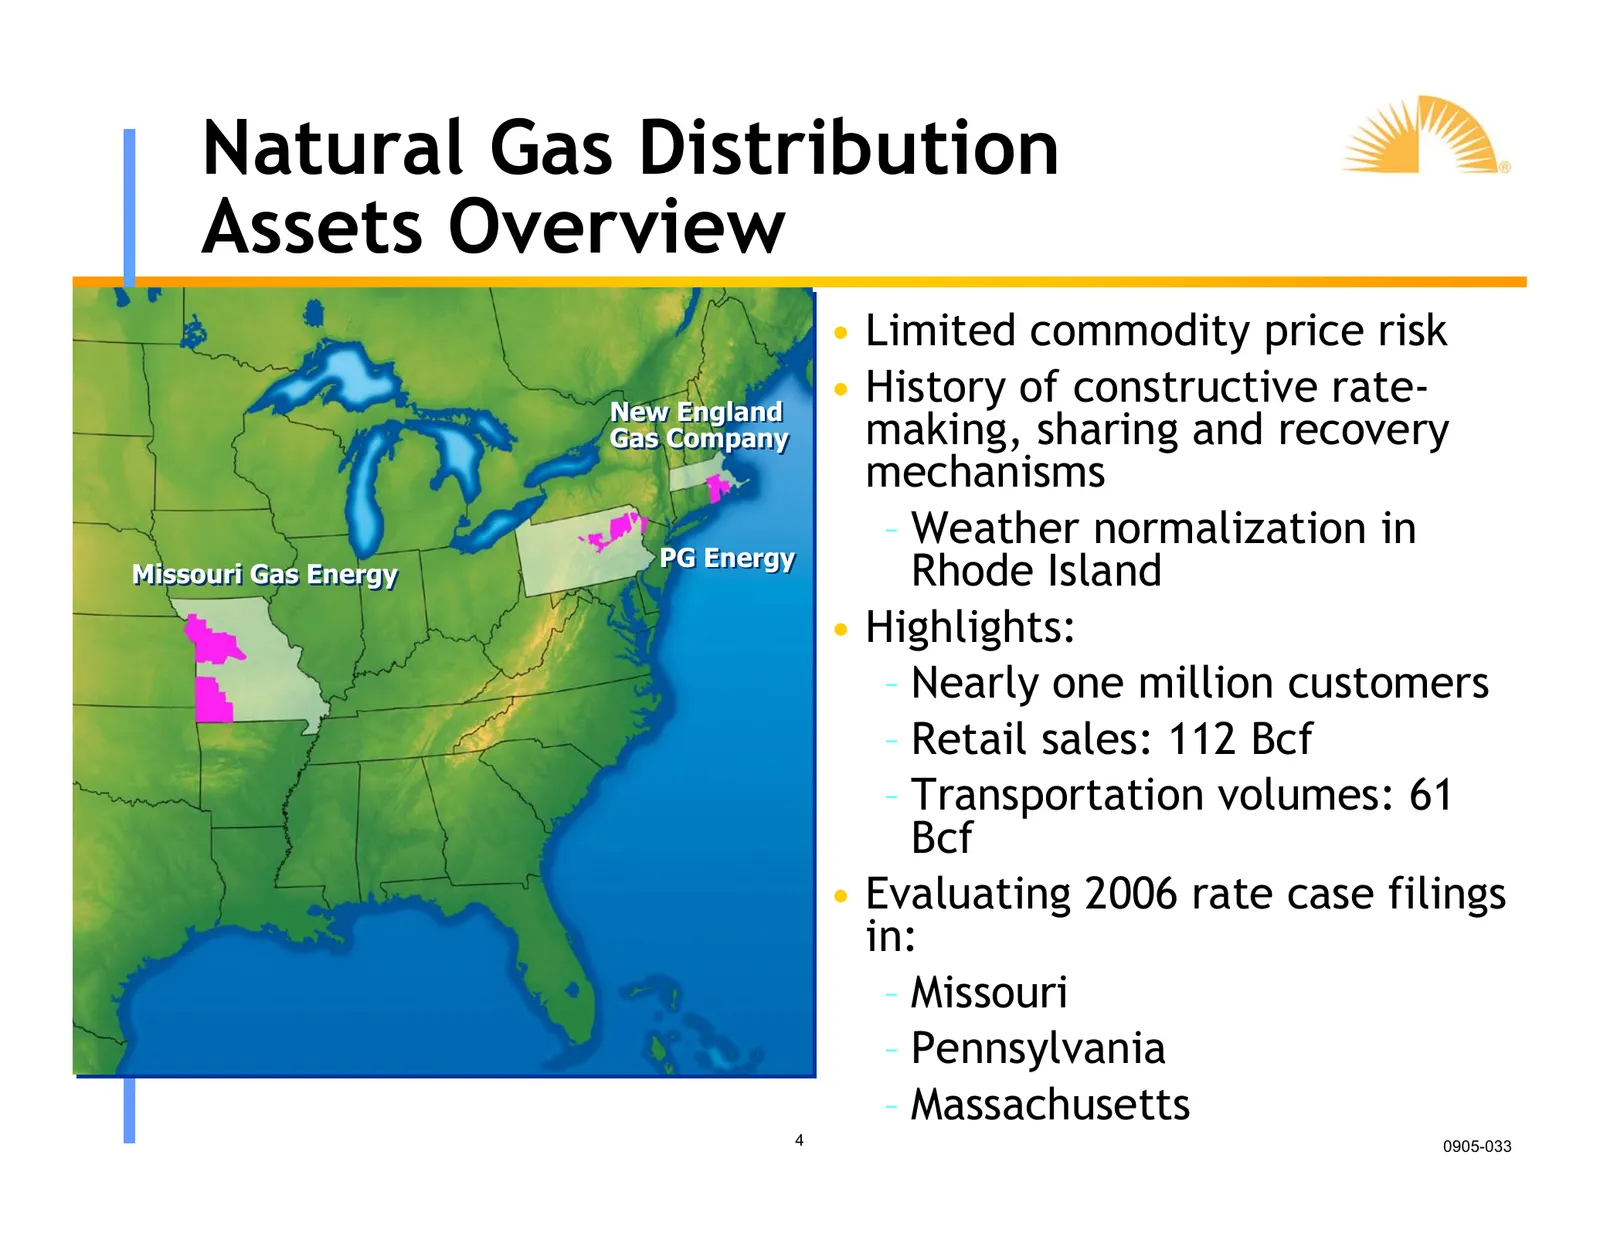
Natural Gas Distribution Assets Overview • Limited commodity price risk New England • History of constructive rate- Gas Company making, sharing and recovery mechanisms – Weather normalization in PG Energy Missouri Gas Energy Rhode Island • Highlights: – Nearly one million customers – Retail sales: 1
Slide 5: Geographic Diversification Unified by Strong Operations
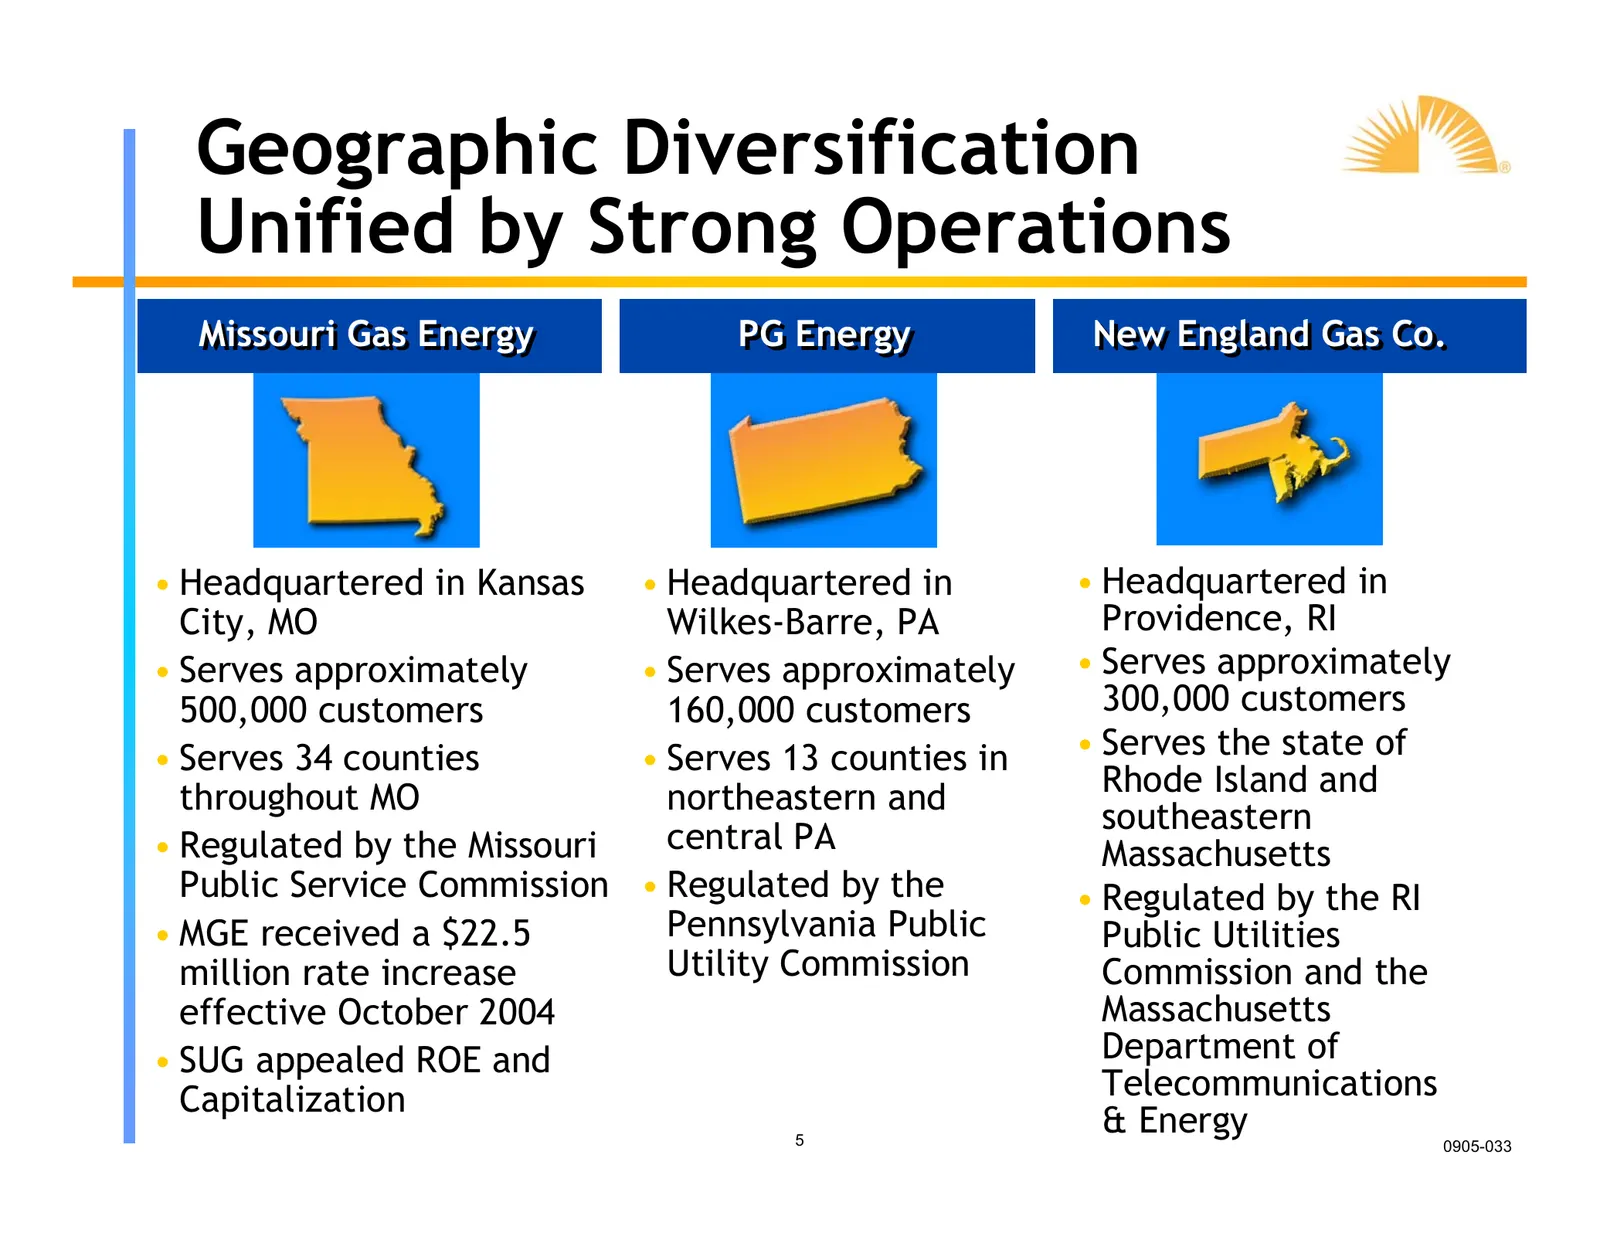
Geographic Diversification Unified by Strong Operations Missouri Missouri Gas Gas Energy Energy PG PG Energy Energy New New England England Gas Gas Co. Co. • Headquartered in Kansas • Headquartered in • Headquartered in City, MO Wilkes-Barre, PA Providence, RI • Serves approximately • Serves approxi
Slide 6: Panhandle Assets
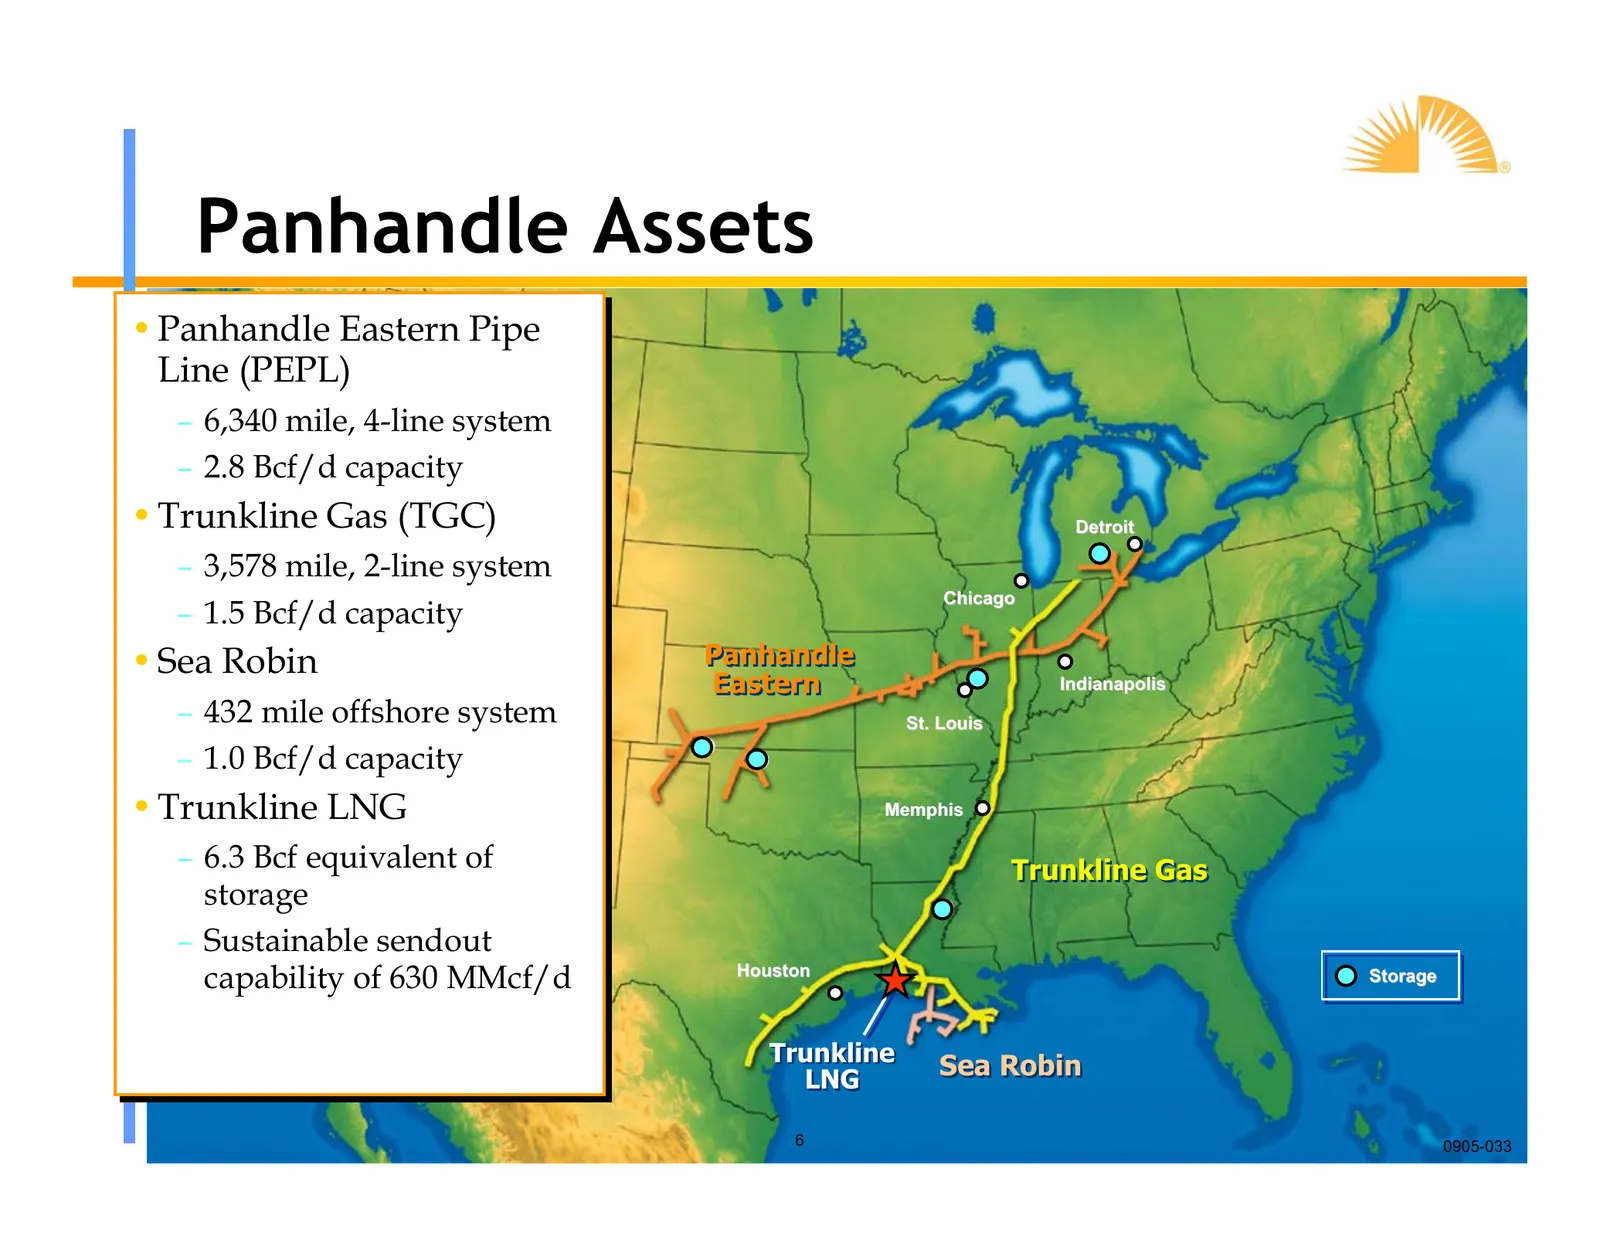
Panhandle Assets ••Panhandle Panhandle Eastern Eastern Pipe Pipe Line Line (PEPL) (PEPL) –– 6,340 6,340 mile, mile, 4-line 4-line system system –– 2.8 2.8 Bcf/d Bcf/d capacity capacity ••Trunkline Trunkline Gas Gas (TGC) (TGC) Detroit –– 3,578 3,578 mile, mile, 2-line 2-line system system Chicago ––
Slide 7: CrossCountry Assets
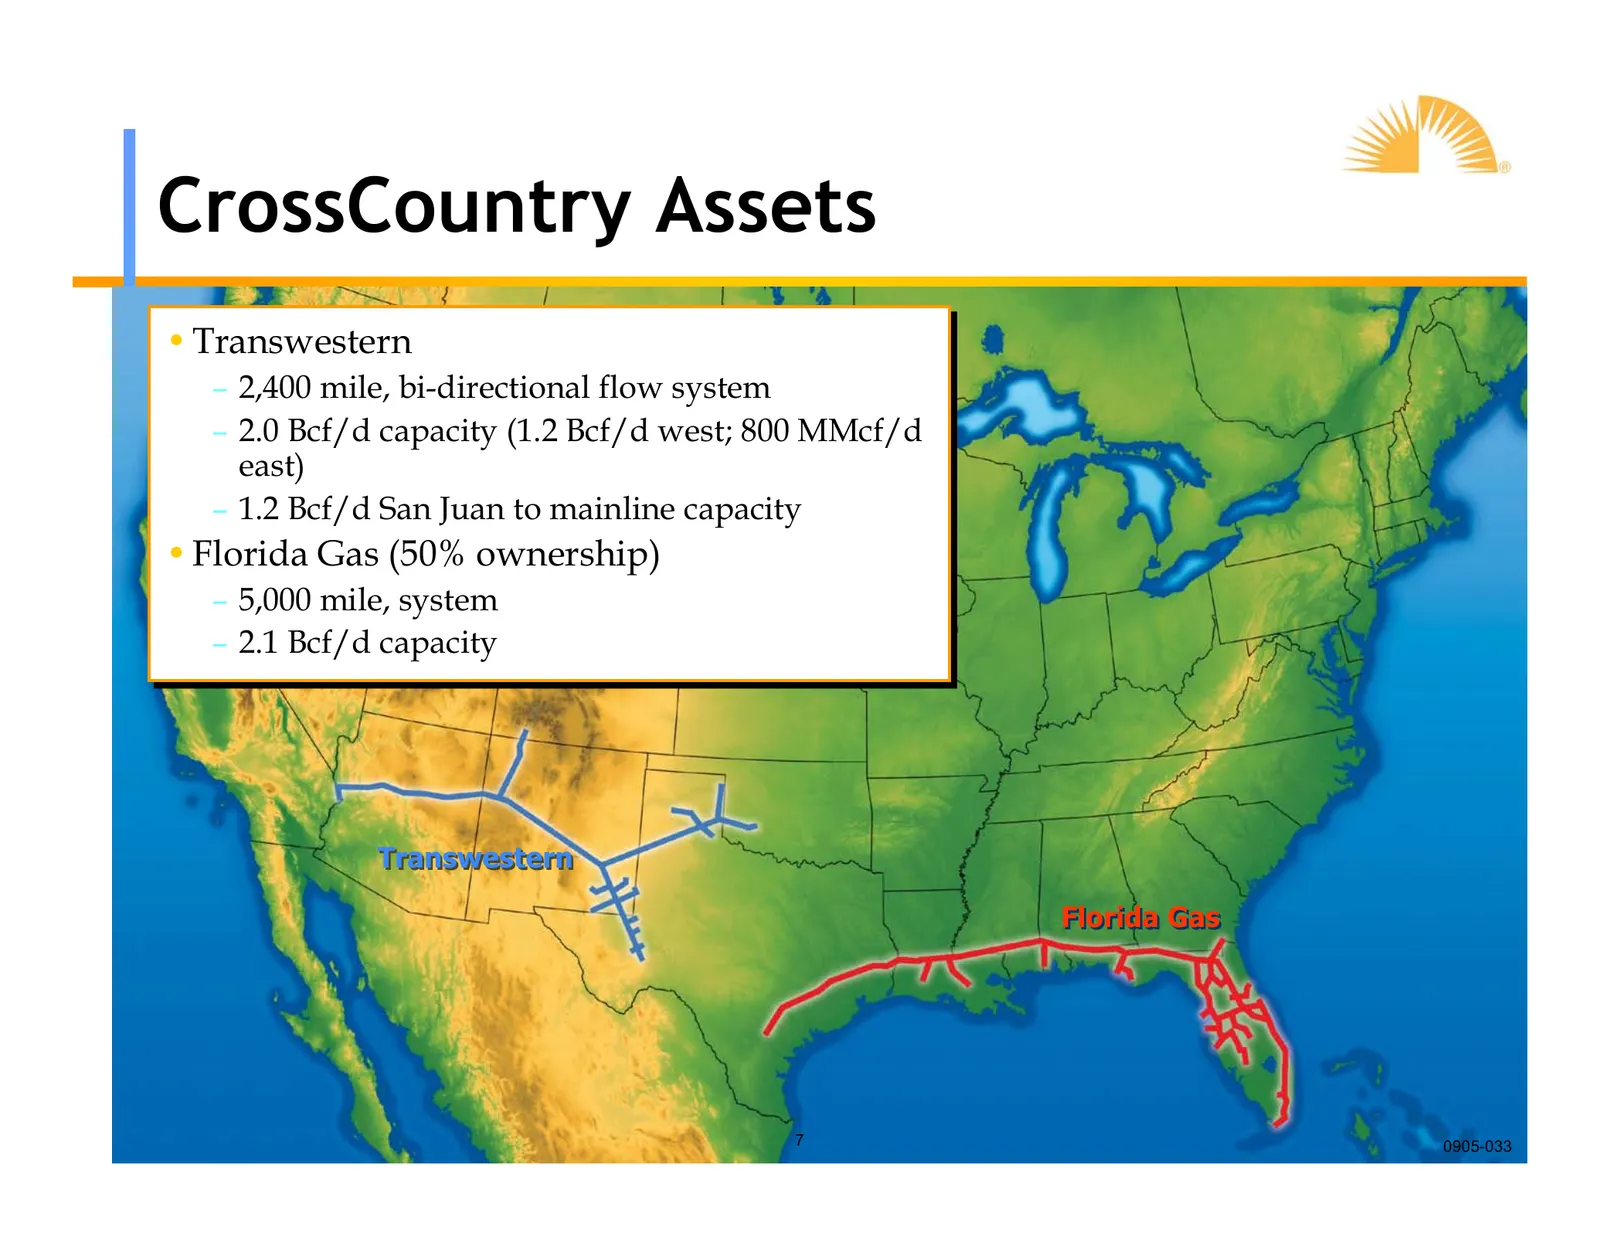
CrossCountry Assets ••Transwestern Transwestern –– 2,400 2,400 mile, mile, bi-directional bi-directional flow flow system system –– 2.0 2.0 Bcf/d Bcf/d capacity capacity (1.2 (1.2 Bcf/d Bcf/d west; west; 800 800 MMcf/d MMcf/d east) east) –– 1.2 1.2 Bcf/d Bcf/d San San Juan Juan to to mainline mainli

Slide 8: Growth Opportunities
yl”, Growth Opportunities
Slide 9: LNG Expansion Projects
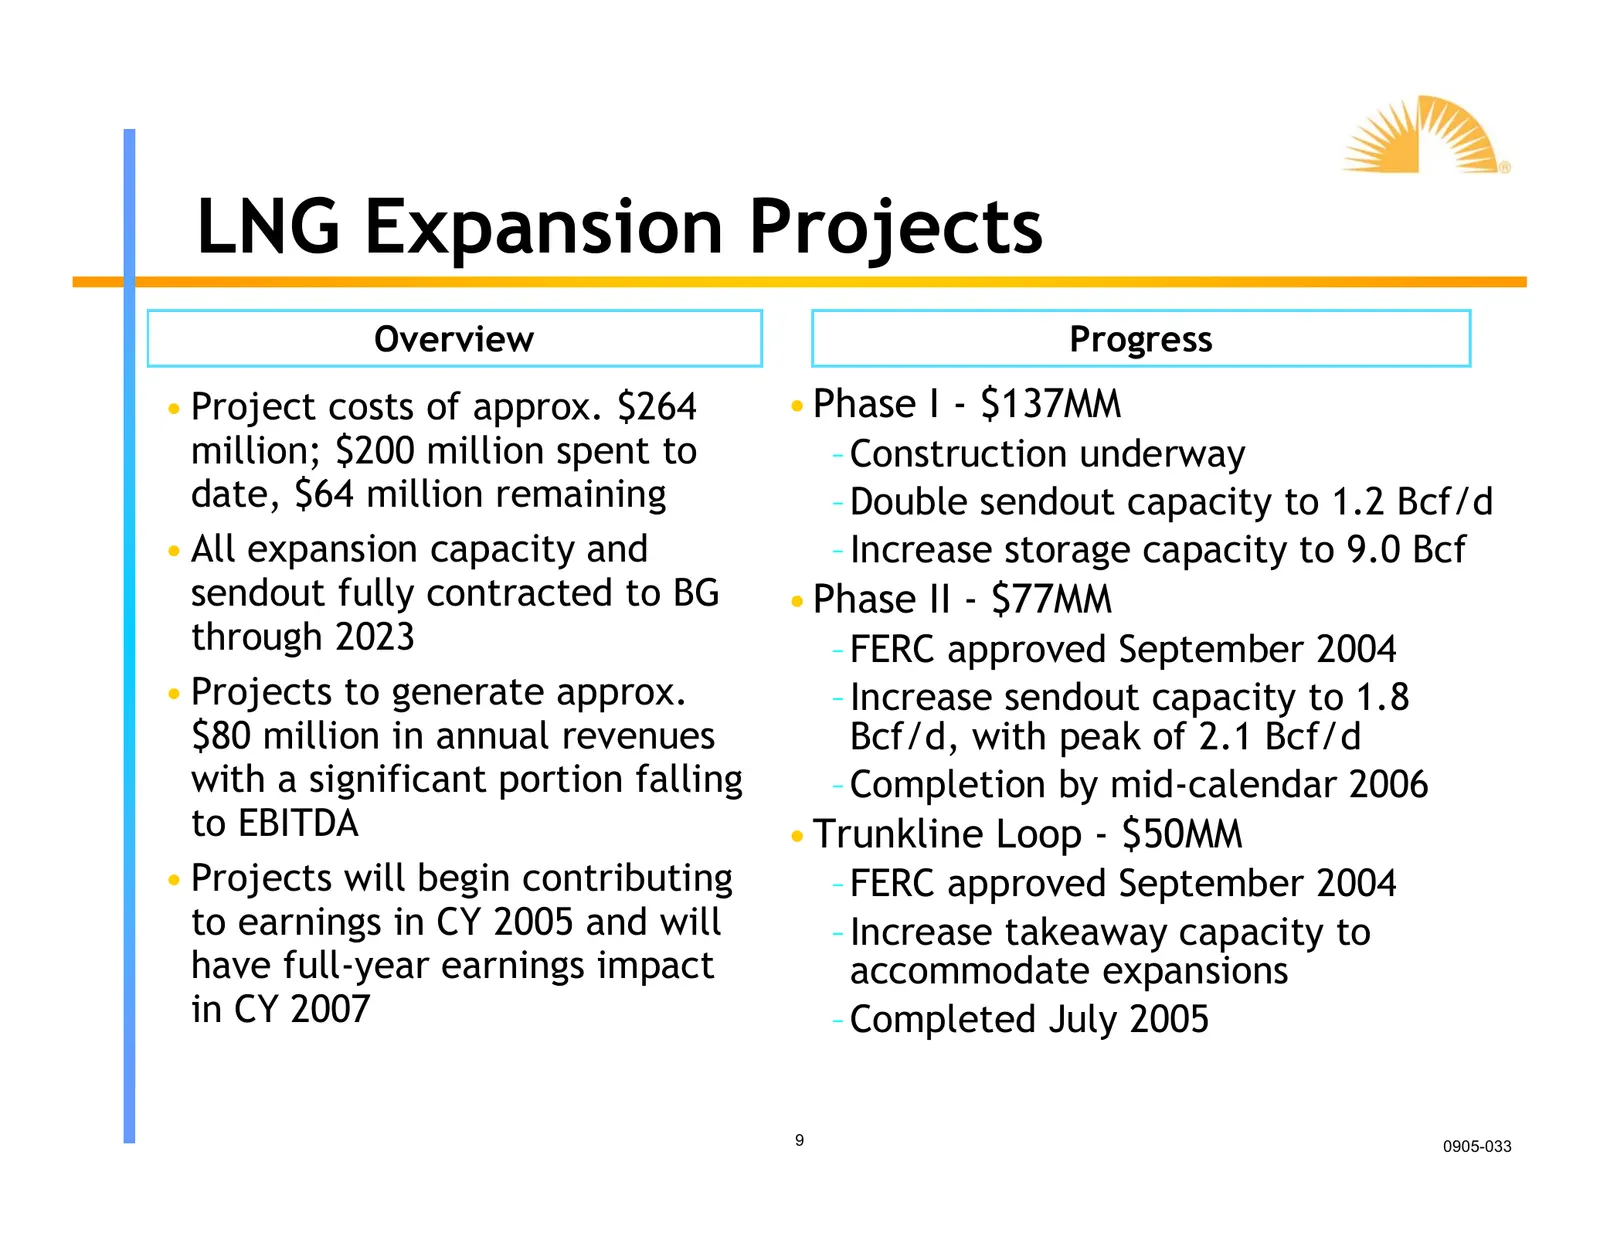
LNG Expansion Projects Overview Progress • Project costs of approx. $264 • Phase I - $137MM million; $200 million spent to – Construction underway date, $64 million remaining – Double sendout capacity to 1.2 Bcf/d • All expansion capacity and – Increase storage capacity to 9.0 Bcf sendout fully cont
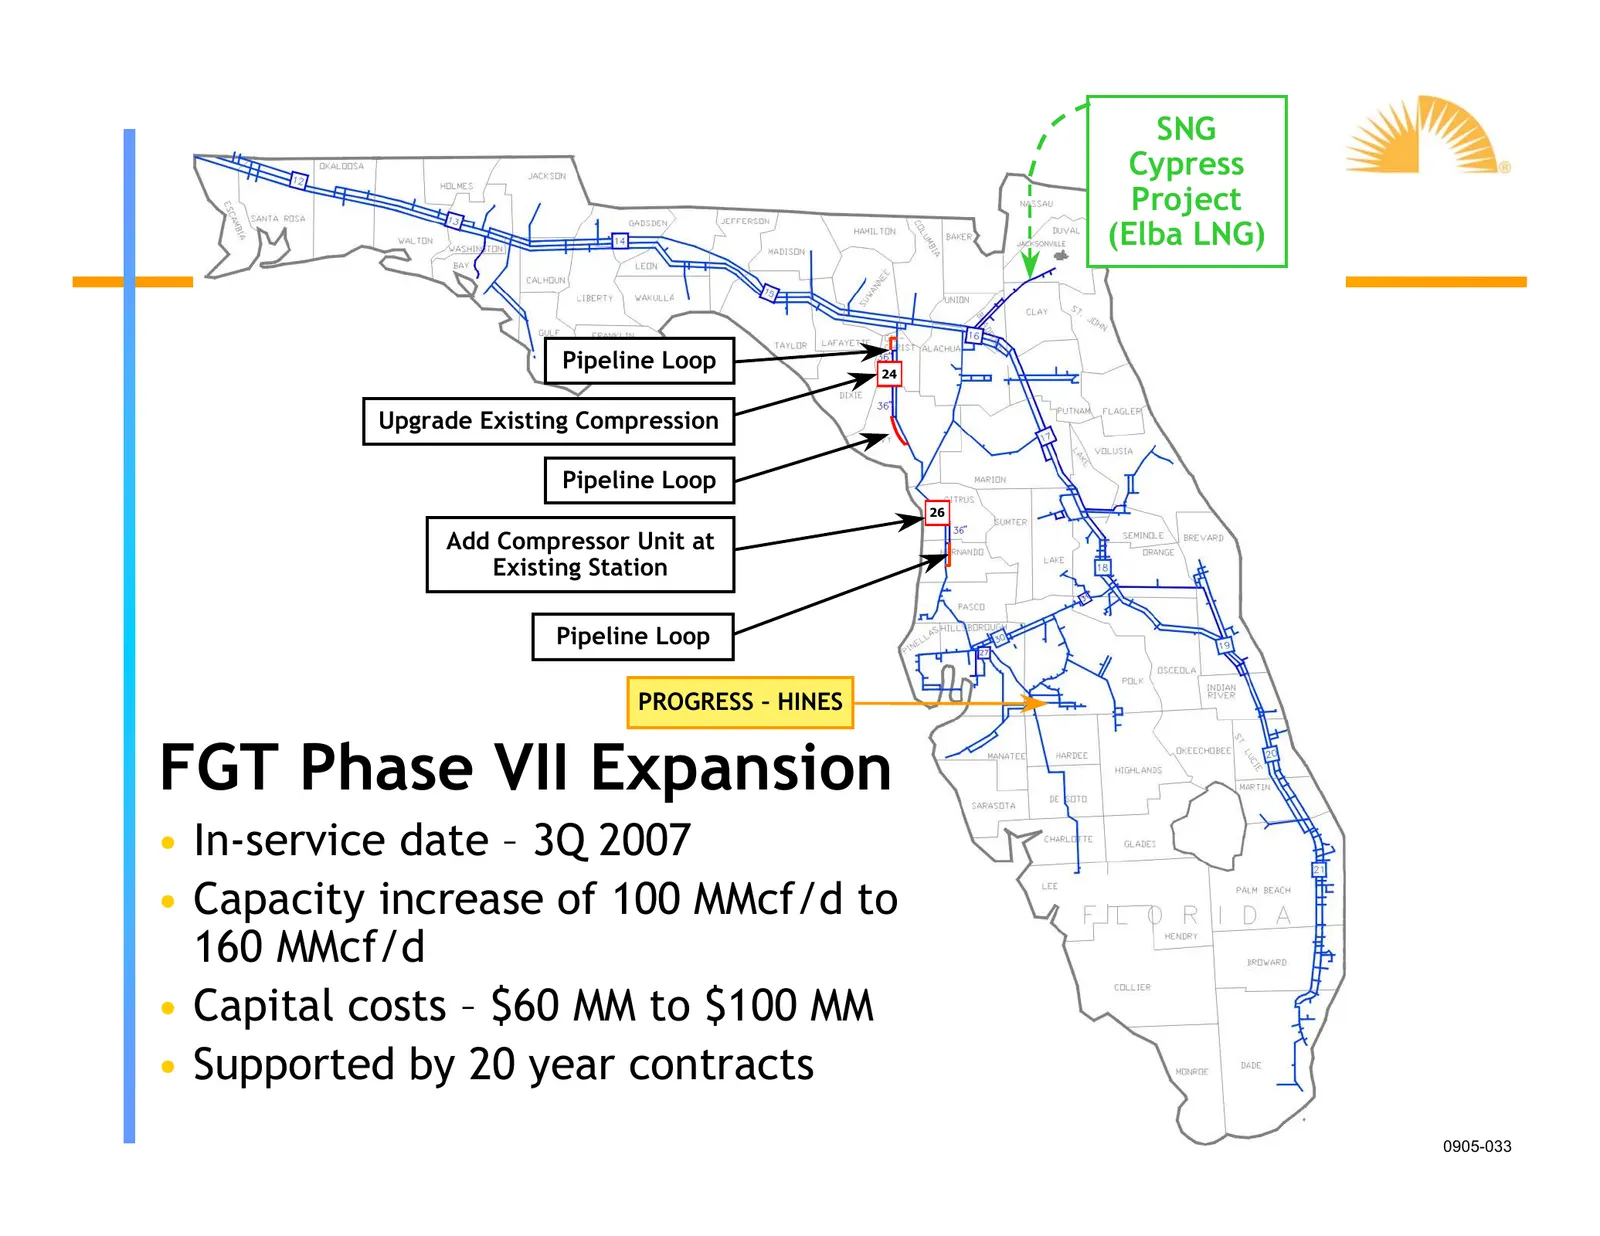
Slide 10: FGT Phase VII Expansion
SNG Cypress Project (Elba LNG) Pipeline Loop 24 Upgrade Existing Compression Pipeline Loop 26 Add Compressor Unit at Existing Station Pipeline Loop PROGRESS – HINES FGT Phase VII Expansion • In-service date – 3Q 2007 • Capacity increase of 100 MMcf/d to 160 MMcf/d • Capital costs – $60 MM to $100 MM
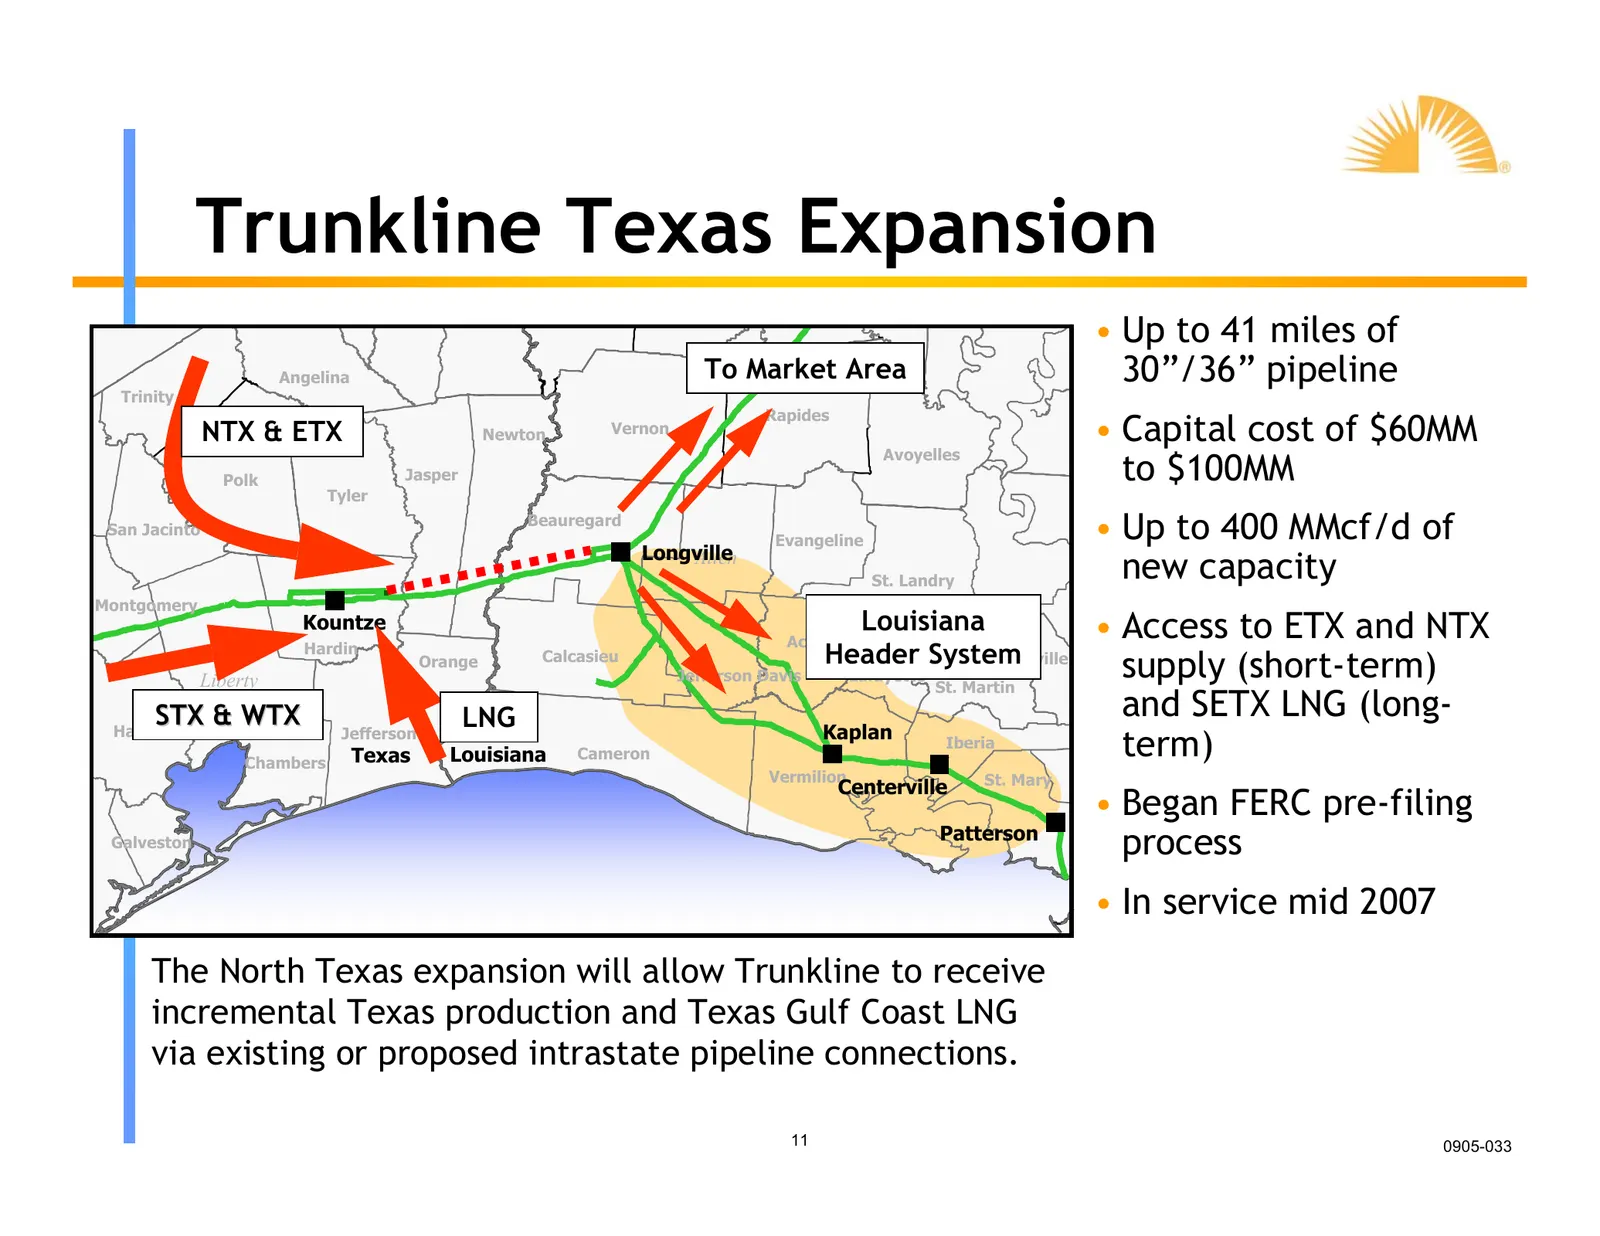
Slide 11: Trunkline Texas Expansion
Trunkline Texas Expansion • Up to 41 miles of Angelina To Market Area 30”/36” pipeline Trinity Rapides NTX & ETX Newton Vernon • Capital cost of $60MM Avoyelles Polk Jasper to $100MM Tyler San Jacinto Beauregard Evangeline • Up to 400 MMcf/d of Longville Allen St. Landry new capacity Montgomery Koun
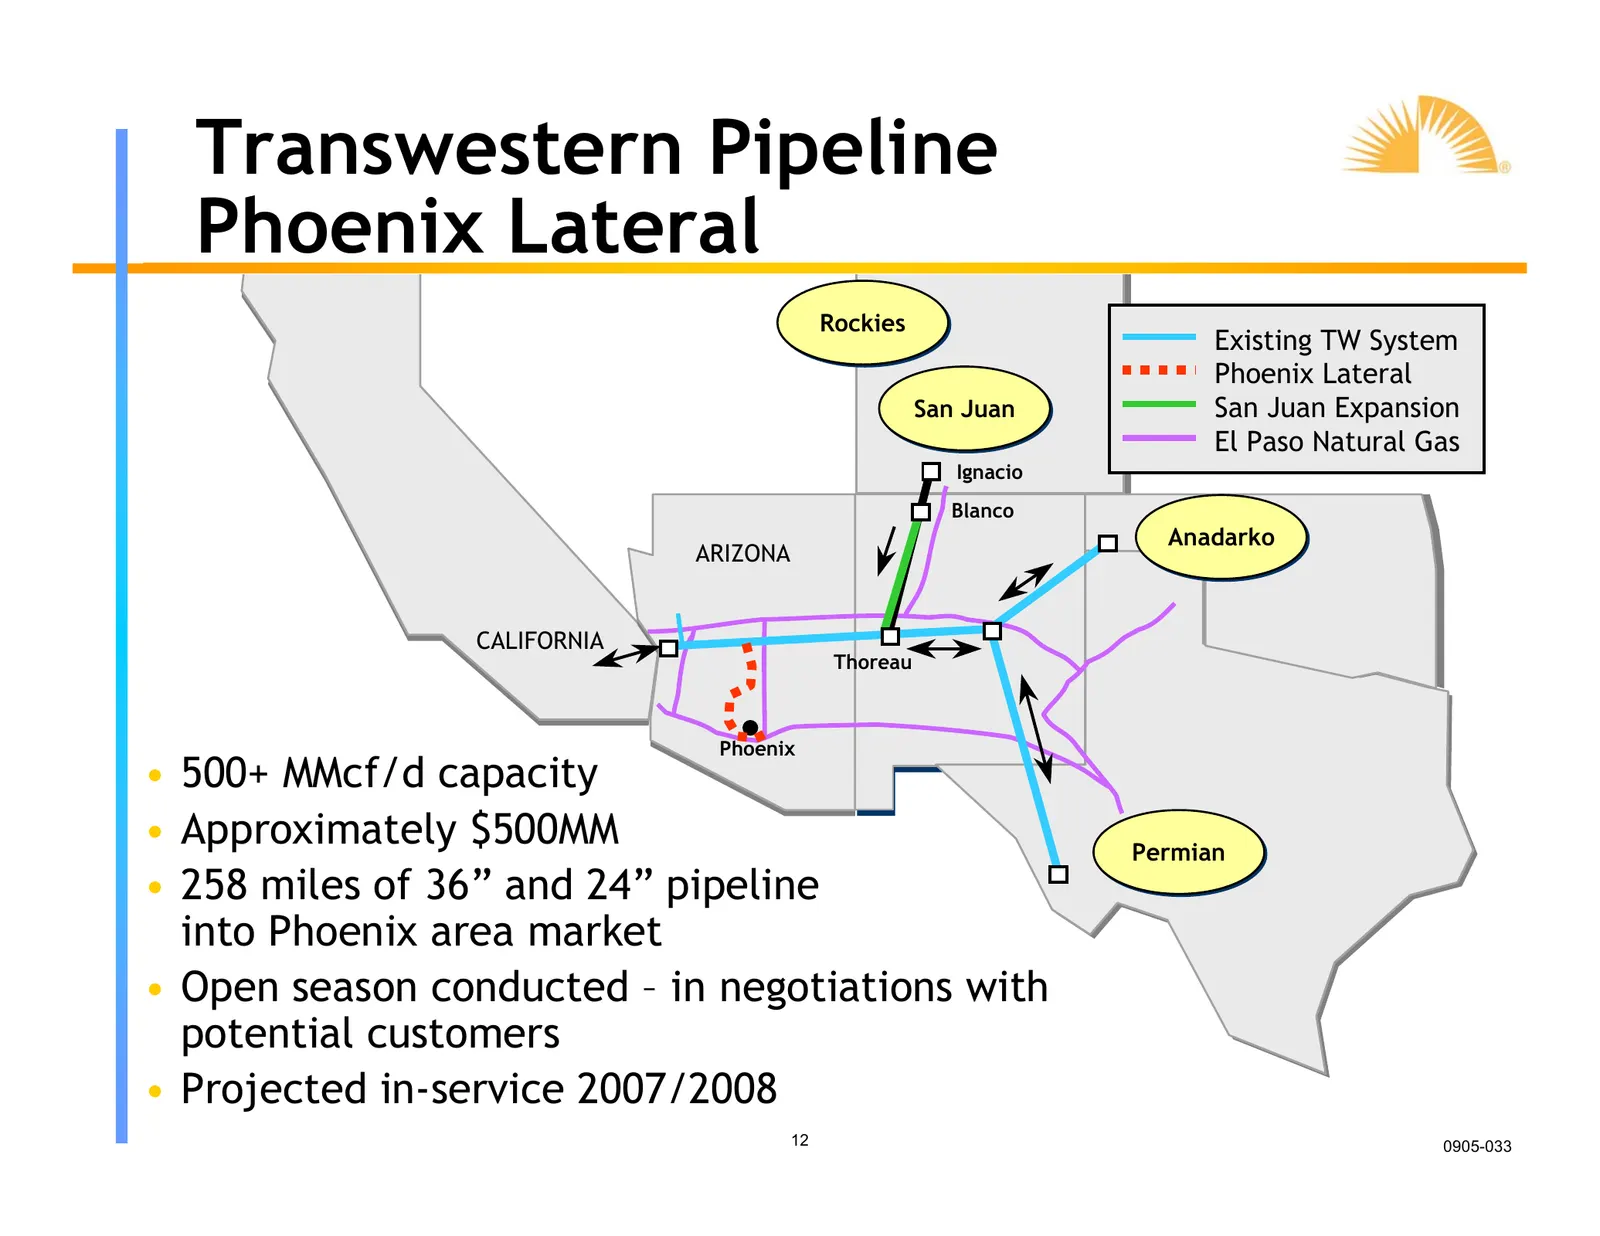
Slide 12: Transwestern Pipeline Phoenix Lateral
Transwestern Pipeline Phoenix Lateral Rockies Existing TW System Phoenix Lateral San Juan San Juan Expansion El Paso Natural Gas Ignacio Blanco Anadarko ARIZONA CALIFORNIA Thoreau Phoenix • 500+ MMcf/d capacity • Approximately $500MM Permian • 258 miles of 36” and 24” pipeline into Phoenix area mark

Slide 13: Financial Highlights
yl”, Financial Highlights
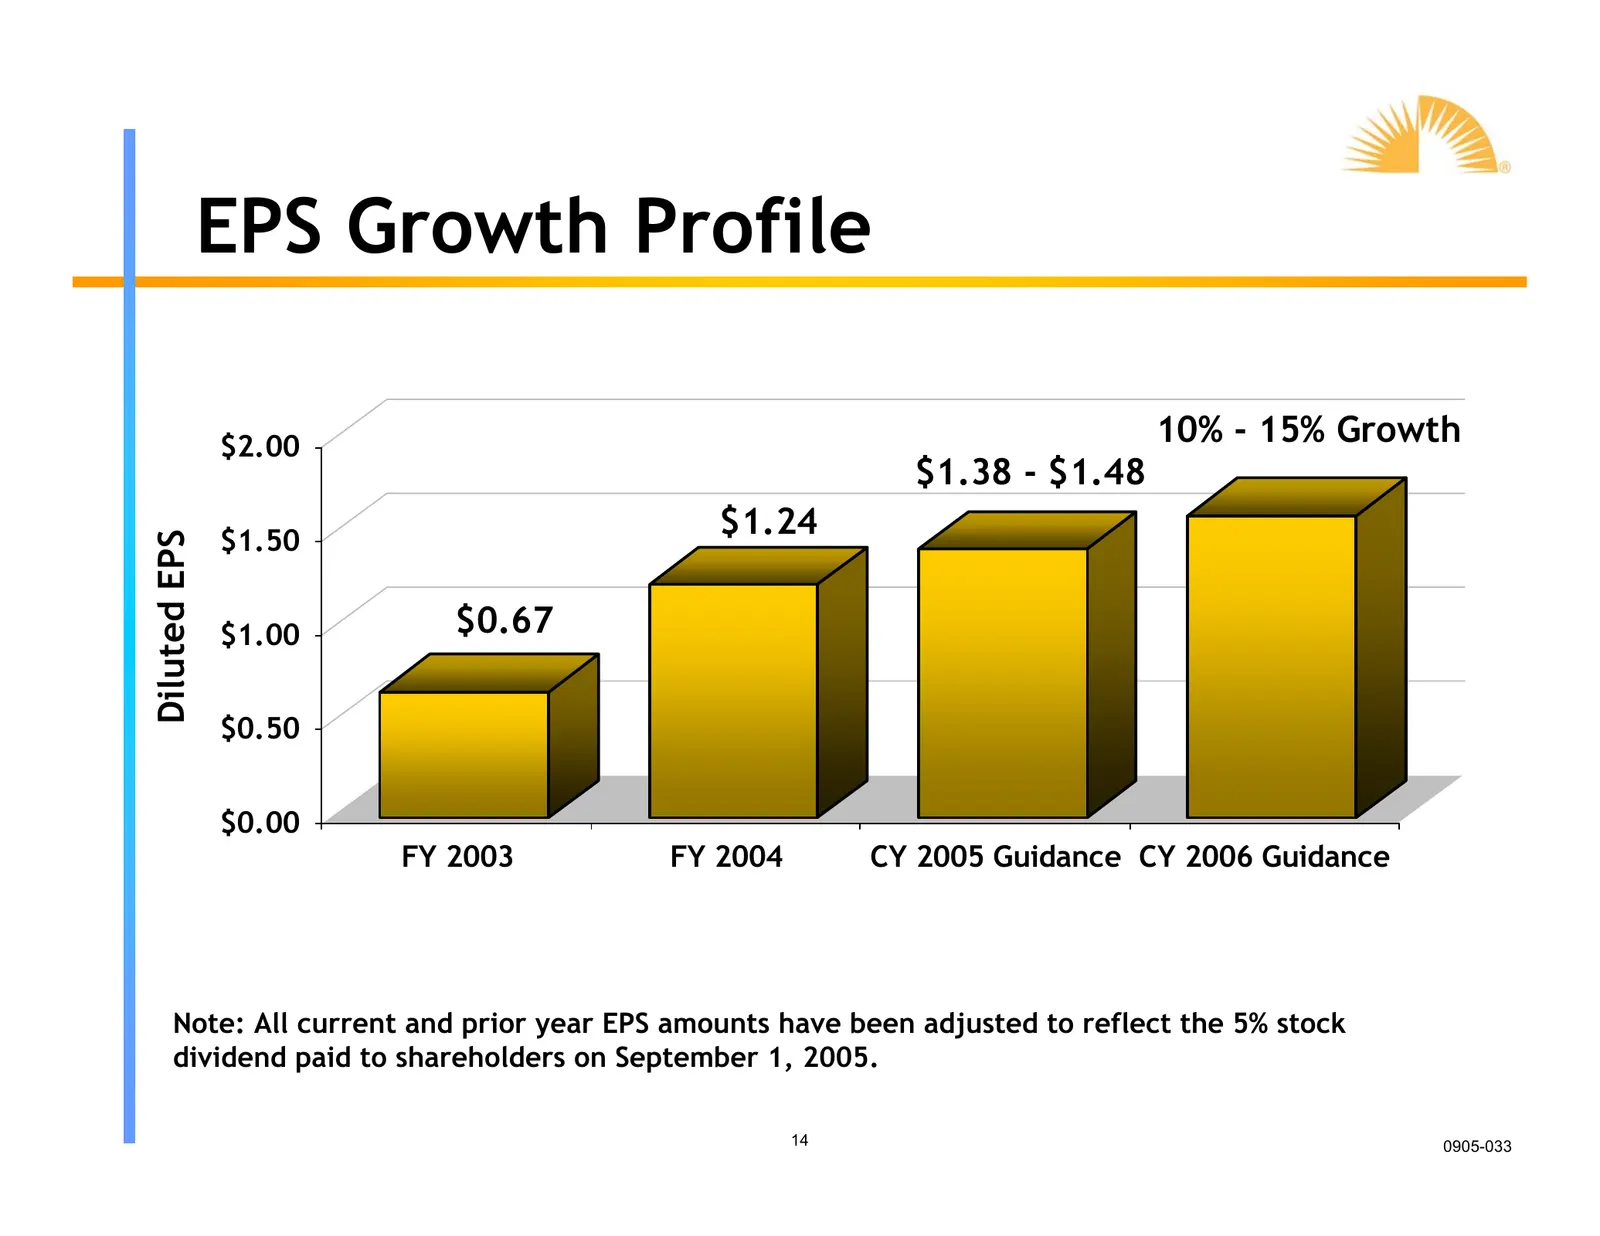
Slide 14: EPS Growth Profile
EPS Growth Profile $2.00 10% - 15% Growth $1.38 - $1.48 $1.50 $1.24 Diluted EPS $1.00 $0.67 $0.50 $0.00 FY 2003 FY 2004 CY 2005 Guidance CY 2006 Guidance Note: All current and prior year EPS amounts have been adjusted to reflect the 5% stock dividend paid to shareholders on September 1, 2005. 14 090
Slide 15: Strong Earnings Potential
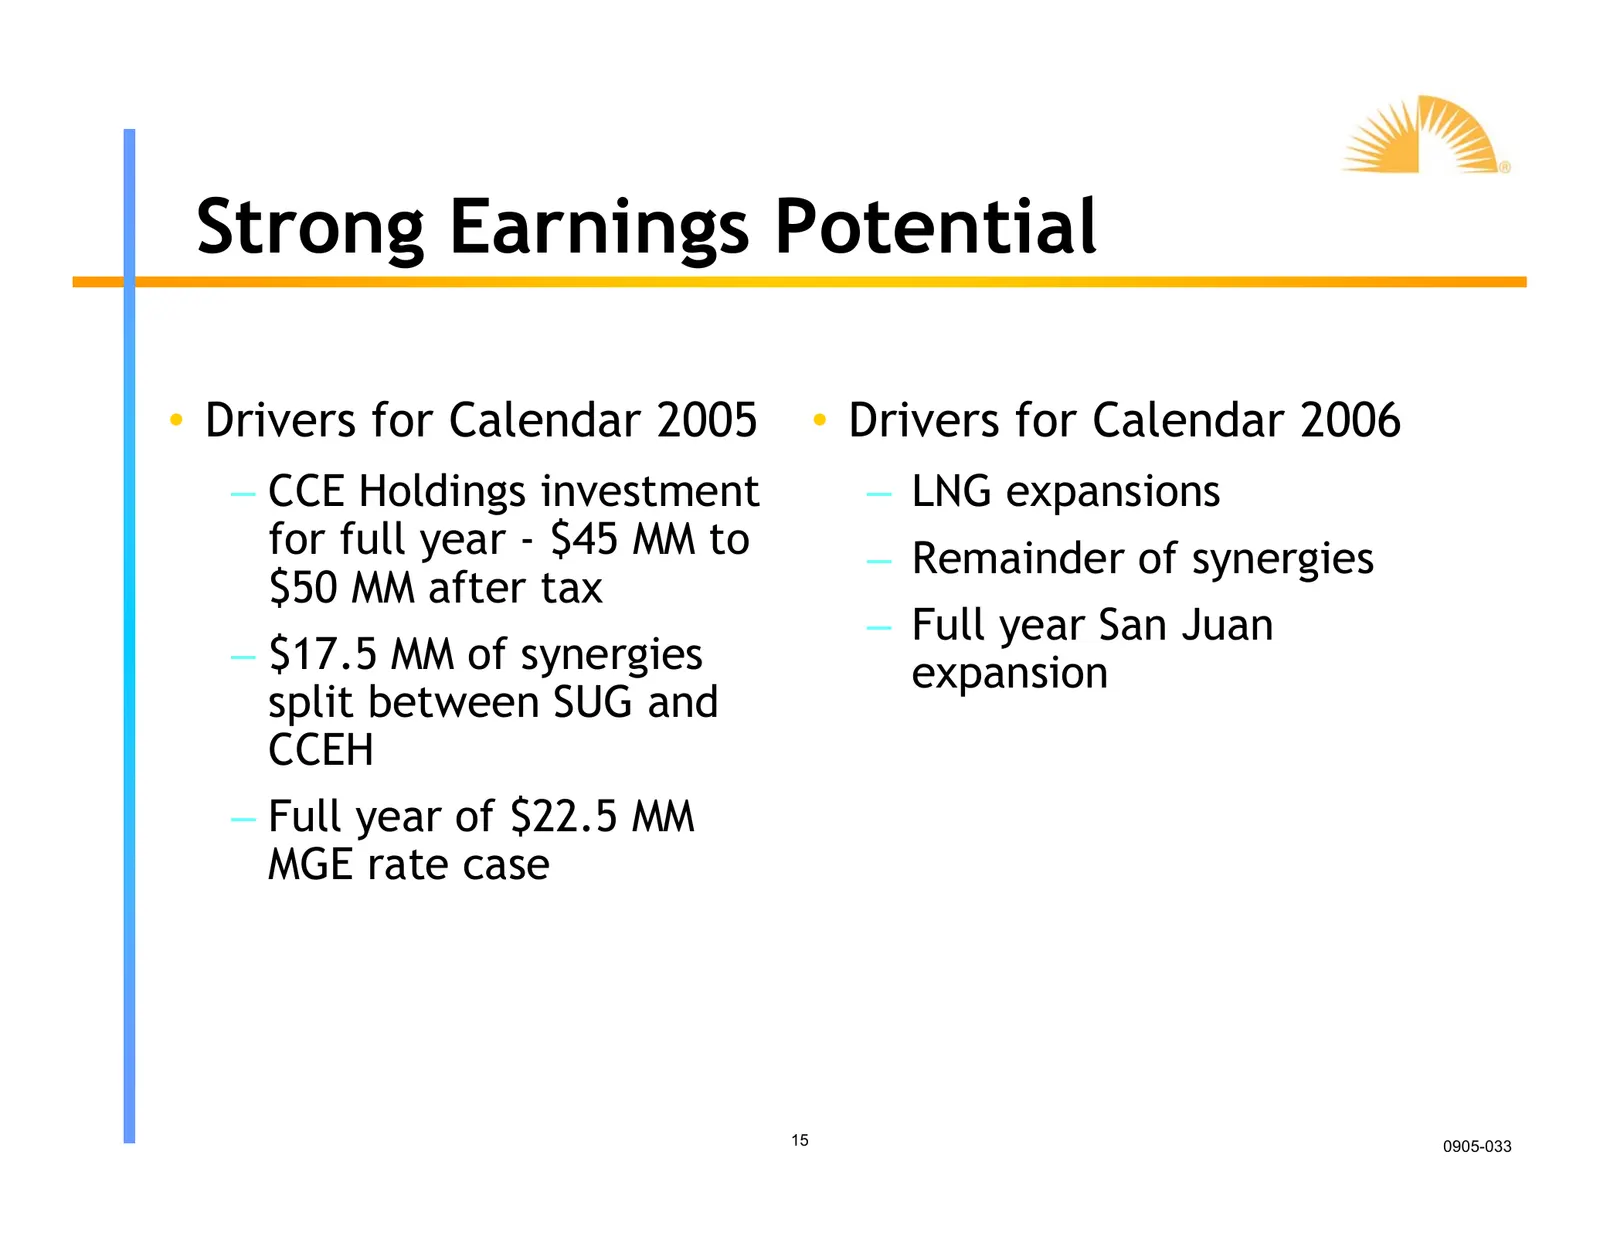
Strong Earnings Potential • Drivers for Calendar 2005 • Drivers for Calendar 2006 – CCE Holdings investment – LNG expansions for full year - $45 MM to – Remainder of synergies $50 MM after tax – Full year San Juan – $17.5 MM of synergies expansion split between SUG and CCEH – Full year of $22.5 MM M
Slide 16: Segment Operating Income
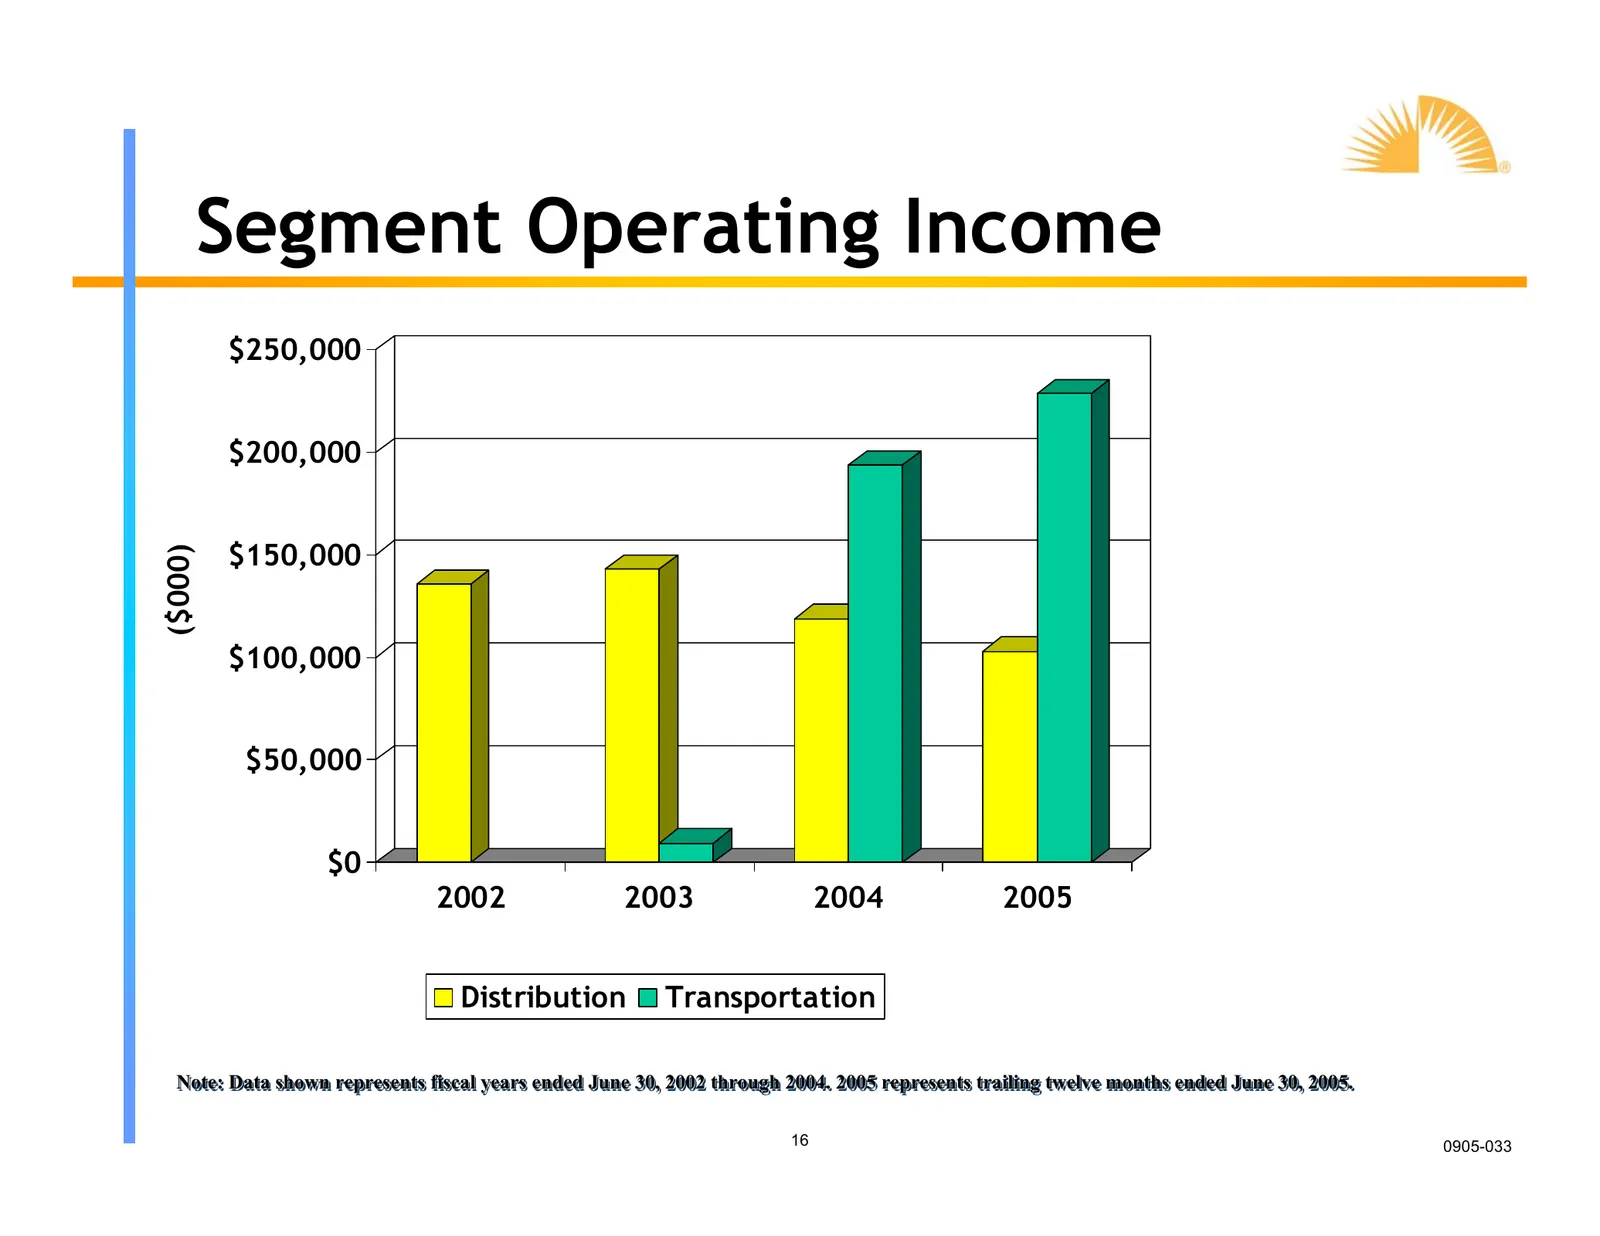
Segment Operating Income $250,000 $200,000 $150,000 ($000) $100,000 $50,000 $0 2002 2003 2004 2005 Distribution Transportation Note: Note: Data shown shown represents represents fiscal years ended June 30, 2002 through through 2004. 2005 represents trailing trailing twelve twelve months months ended
Slide 17: Respect for the Balance Sheet
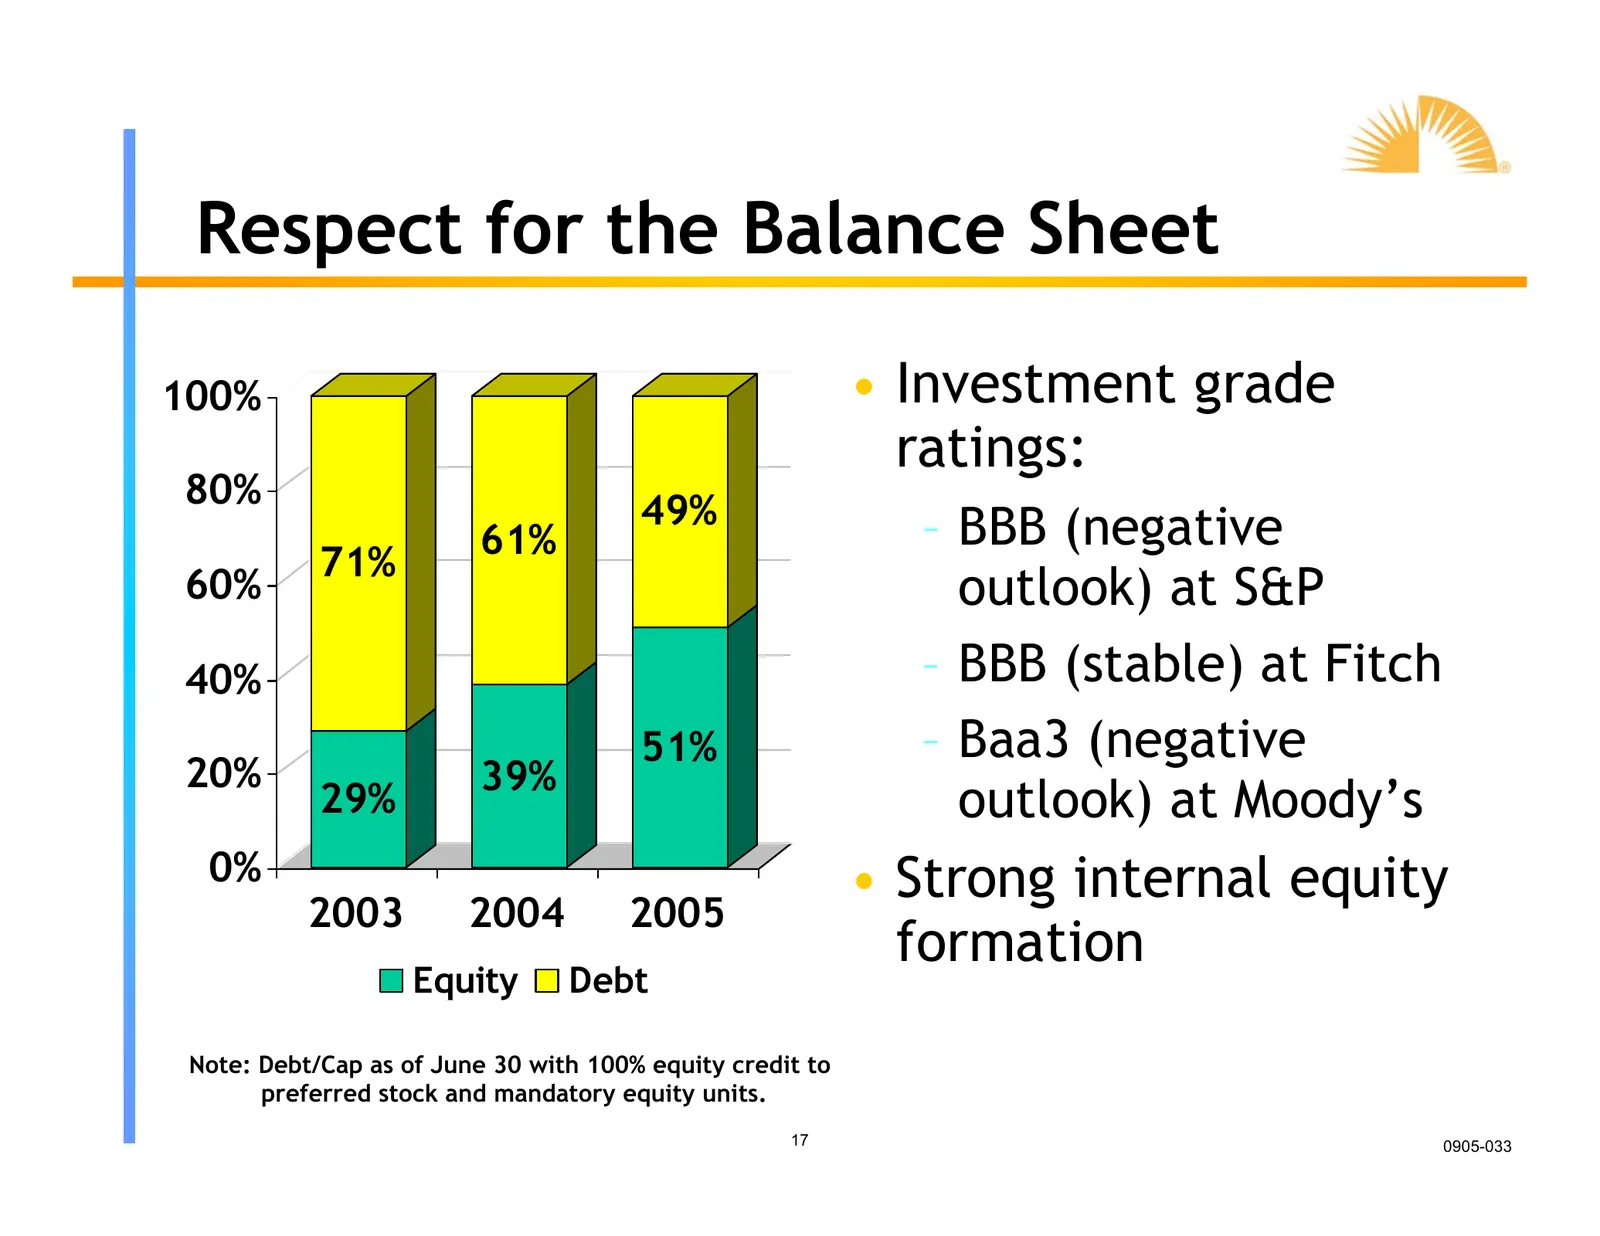
Respect for the Balance Sheet 100% • Investment grade ratings: 80% 49% – BBB (negative 61% 71% 60% outlook) at S&P 40% – BBB (stable) at Fitch 51% – Baa3 (negative 20% 39% 29% outlook) at Moody’s 0% • Strong internal equity 2003 2004 2005 formation Equity Debt Note: Debt/Cap as of June 30 with 100%
Slide 18: Investment Thesis
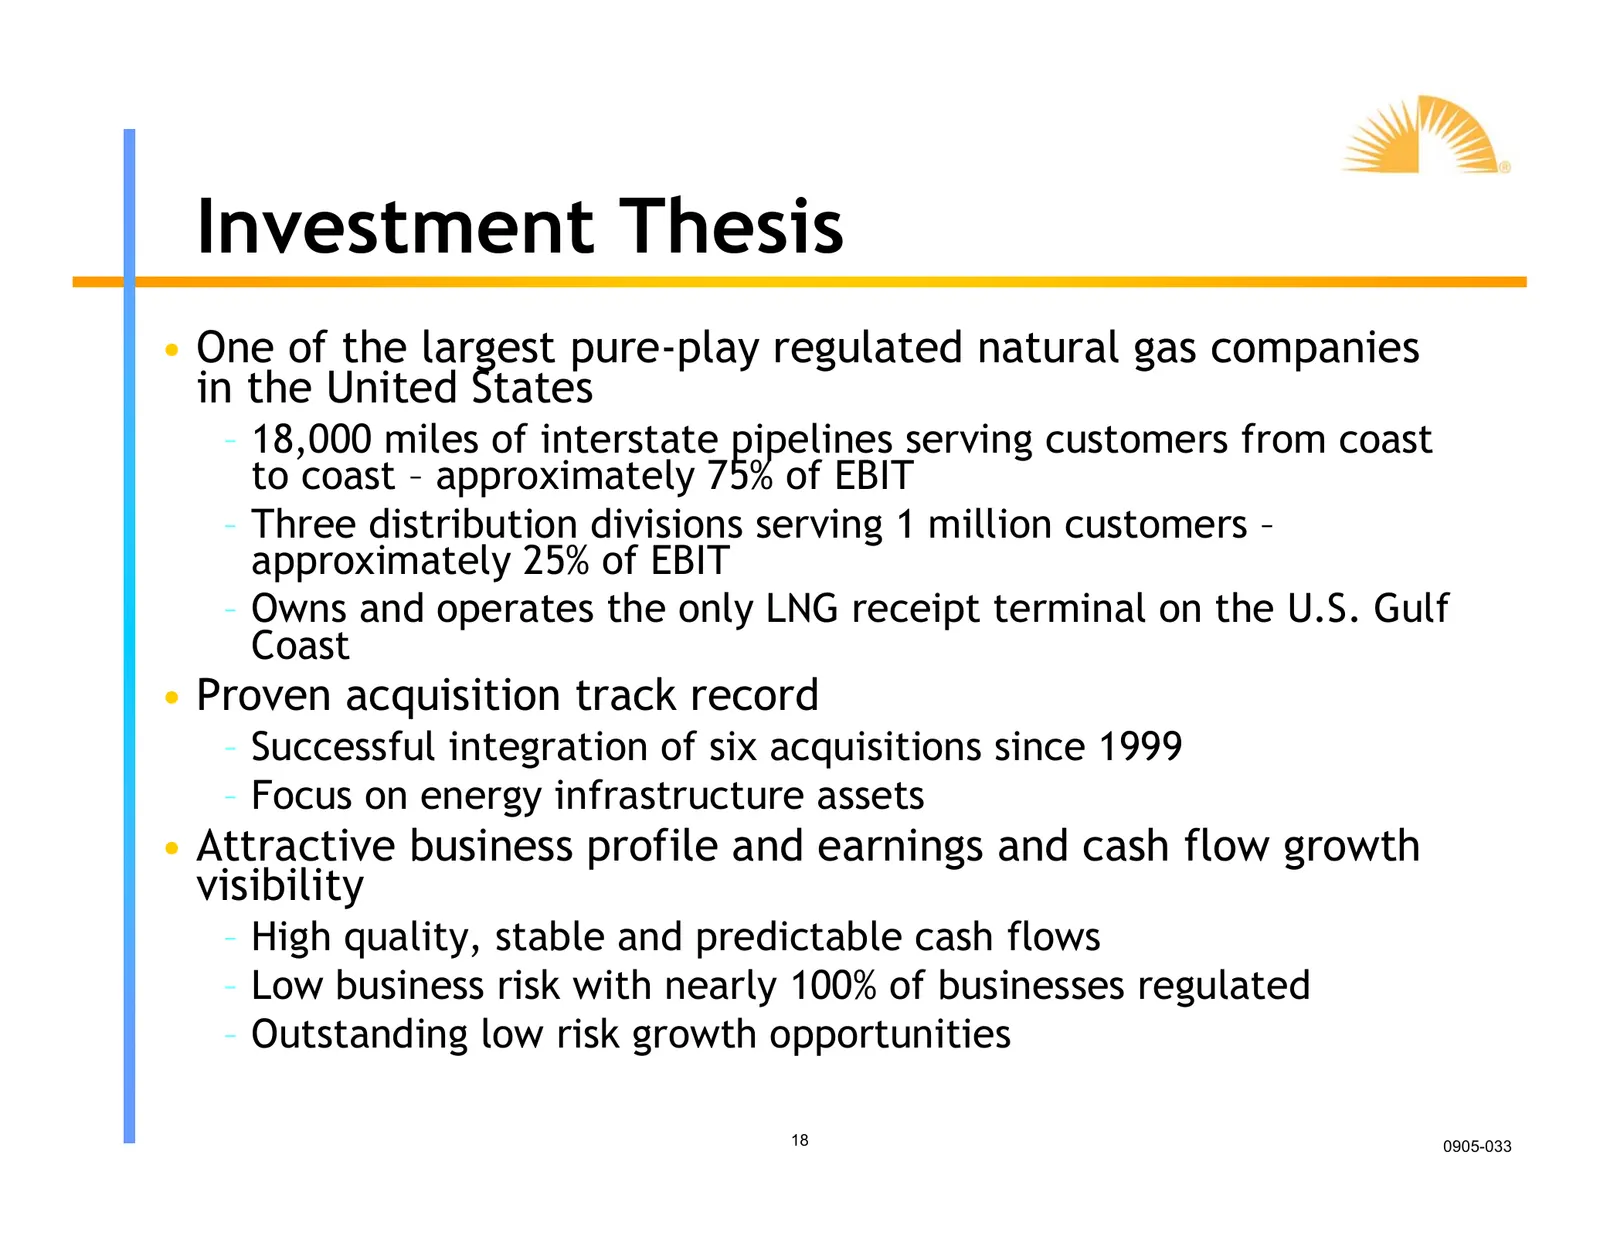
Investment Thesis • One of the largest pure-play regulated natural gas companies in the United States – 18,000 miles of interstate pipelines serving customers from coast to coast – approximately 75% of EBIT – Three distribution divisions serving 1 million customers – approximately 25% of EBIT – Owns
Source: SEC EDGAR · 8-K filed Oct 19, 2005
More decks from Southern Union Co
 Barclays Capital Investment Grade Energy and Pipeline Conference 201232 slides · Mar 8, 2012
 Debt Investor Presentation (February 2012)33 slides · Feb 22, 2012
 Merger or Acquisition (July 2011)11 slides · Jul 5, 2011
 Merger or Acquisition (June 2011)22 slides · Jun 16, 2011
 Investor Presentation (February 2011)37 slides · Feb 25, 2011
 BMO Capital Markets 2010 Utilities and Pipelines Day23 slides · Nov 30, 2010