Boyd Group Services Inc · TSX:BYD
Boyd Group Services — Investor Presentation (May 2022)
33 slides from Boyd Group Services's investor presentation, May 2022
Slide 1: Boyd Group Services Inc. Investor Presentation May 2022
BOYD GROUP SERVICES INC. Investor Presentation May 2022 1
Slide 2: Forward-Looking Statements
Forward-Looking Statements This presentation contains forward-looking statements, other than historical facts, which reflect the view of the Company's management with respect to future events. Such forward-looking statements reflect the current views of the Company's management and are made on the b
Slide 3: Capital Markets Profile (as at May 16, 2022)
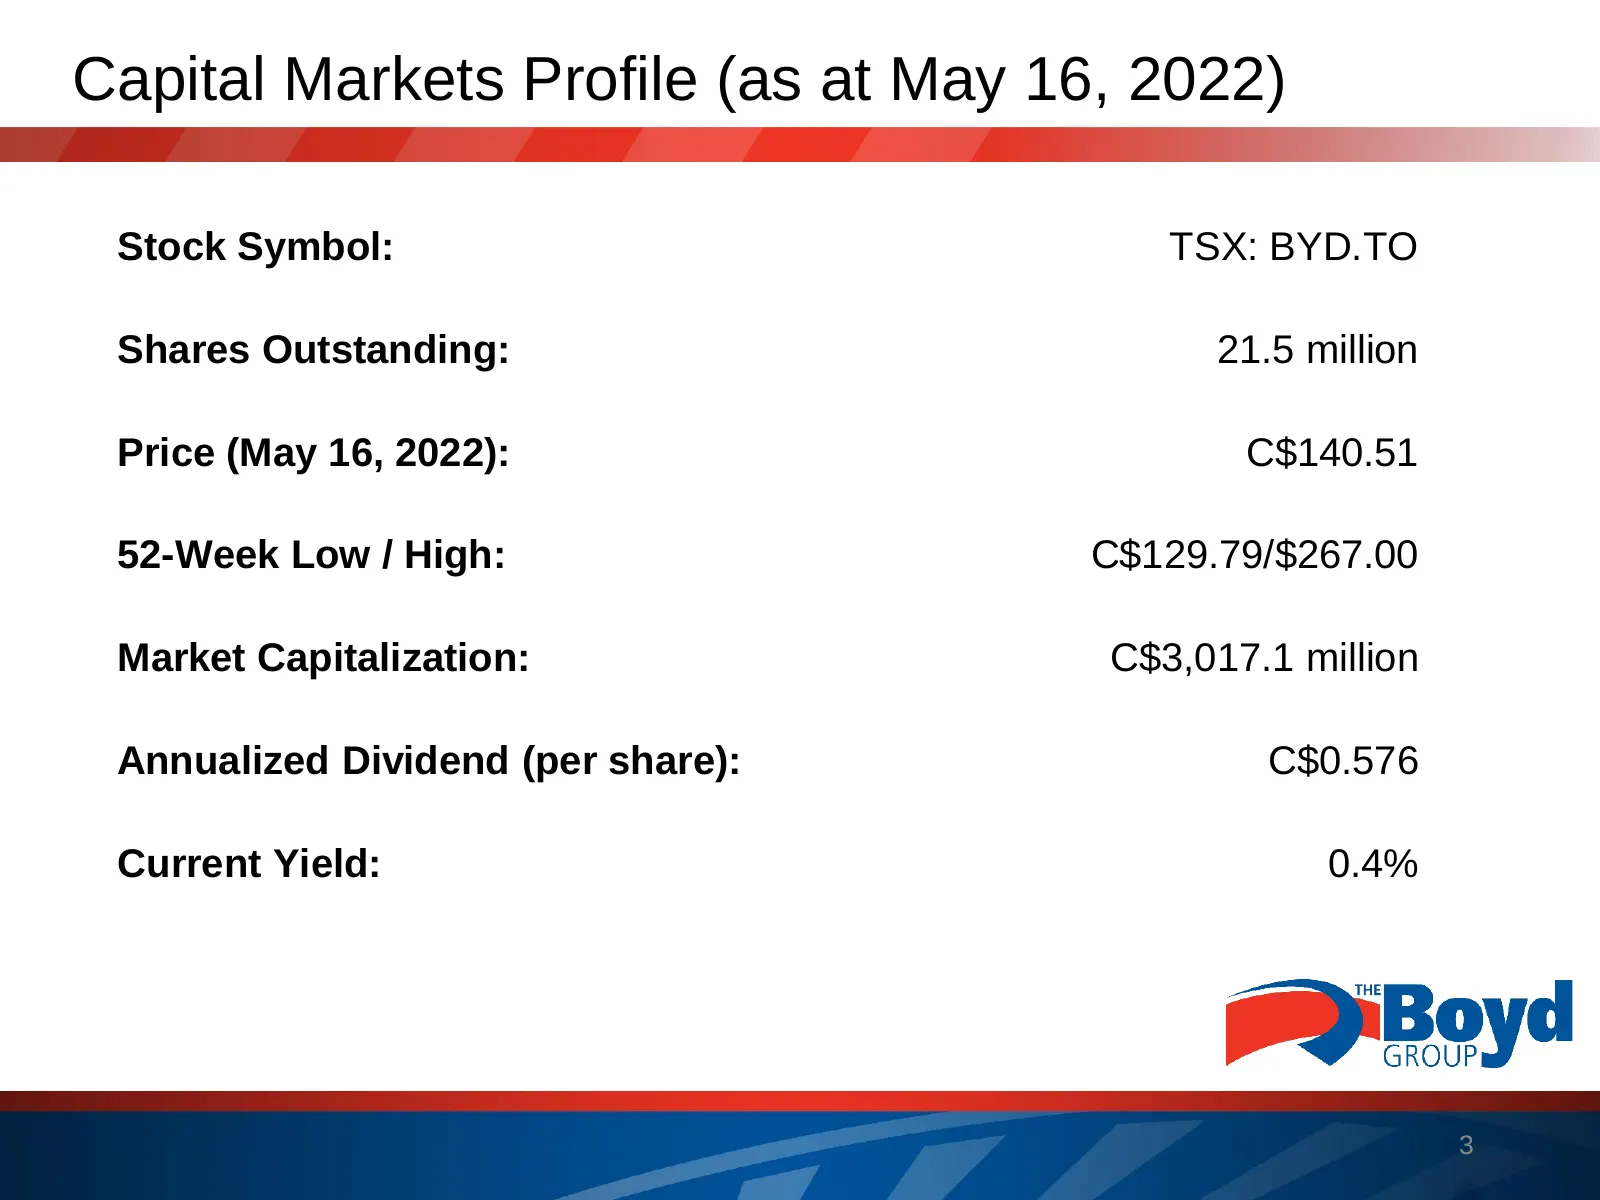
Capital Markets Profile (as at May 16, 2022) Stock Symbol: TSX: BYD.TO Shares Outstanding: 21.5 million Price (May 16, 2022): C$140.51 52-Week Low / High: C$129.79/$267.00 Market Capitalization: C$3,017.1 million Annualized Dividend (per share): C$0.576 Current Yield: 0.4% 3
Slide 4: Company Overview
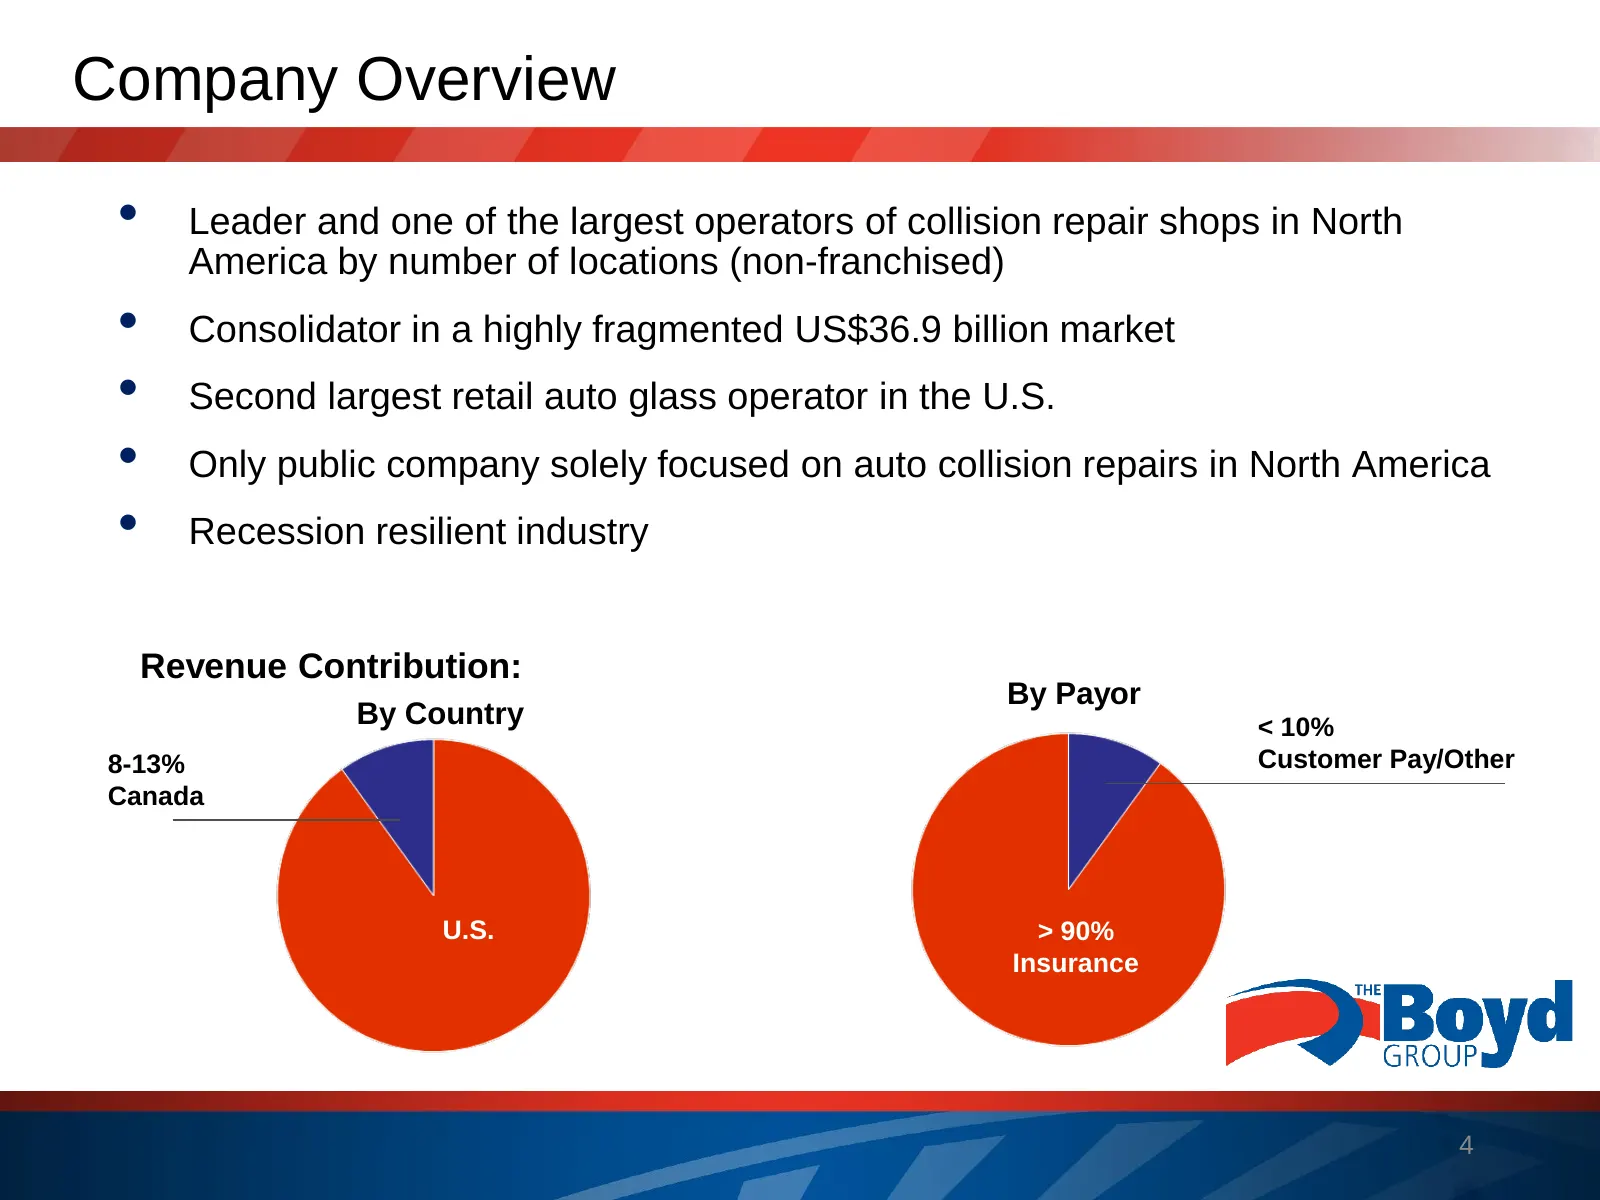
Company Overview • Leader and one of the largest operators of collision repair shops in North America by number of locations (non-franchised) • Consolidator in a highly fragmented US$36.9 billion market • Second largest retail auto glass operator in the U.S. • Only public company solely focused on a
Slide 5: Collision Operations
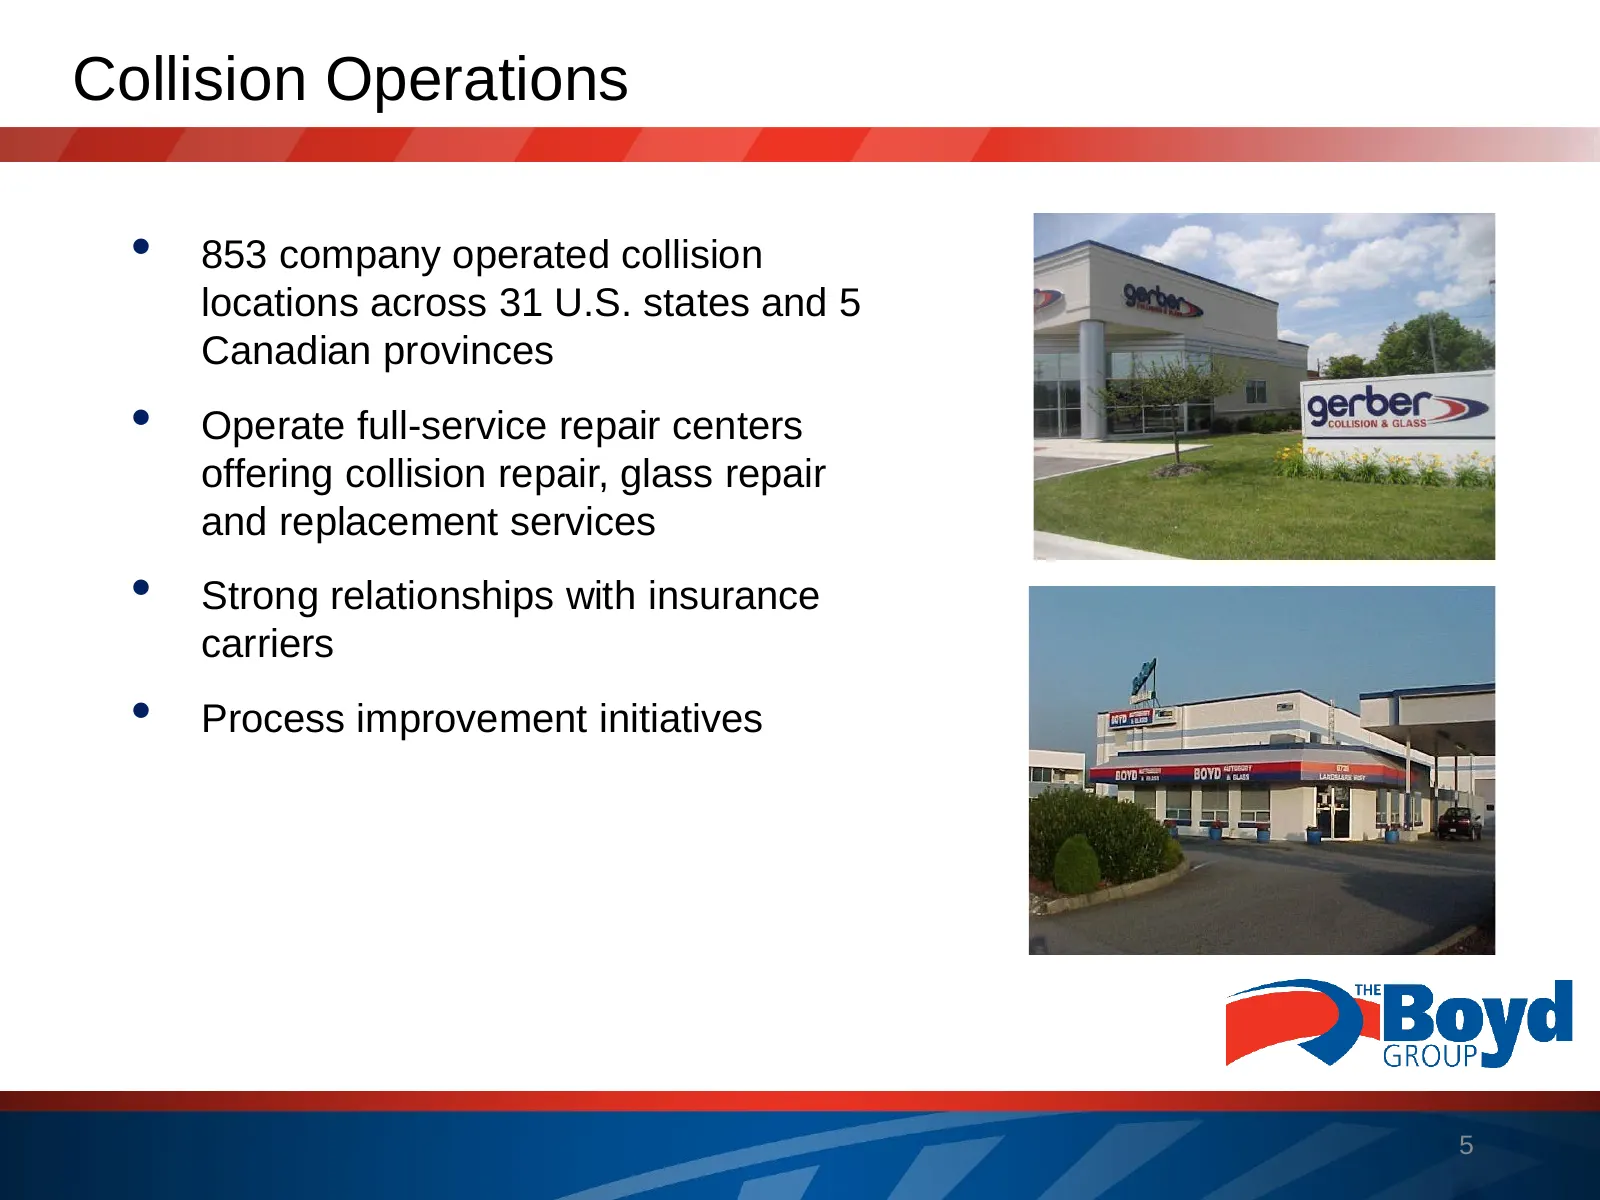
Collision Operations • 853 company operated collision locations across 31 U.S. states and 5 Canadian provinces • Operate full-service repair centers offering collision repair, glass repair and replacement services • Strong relationships with insurance carriers • Process improvement initiatives 5
Slide 6: North American Collision Repair Footprint
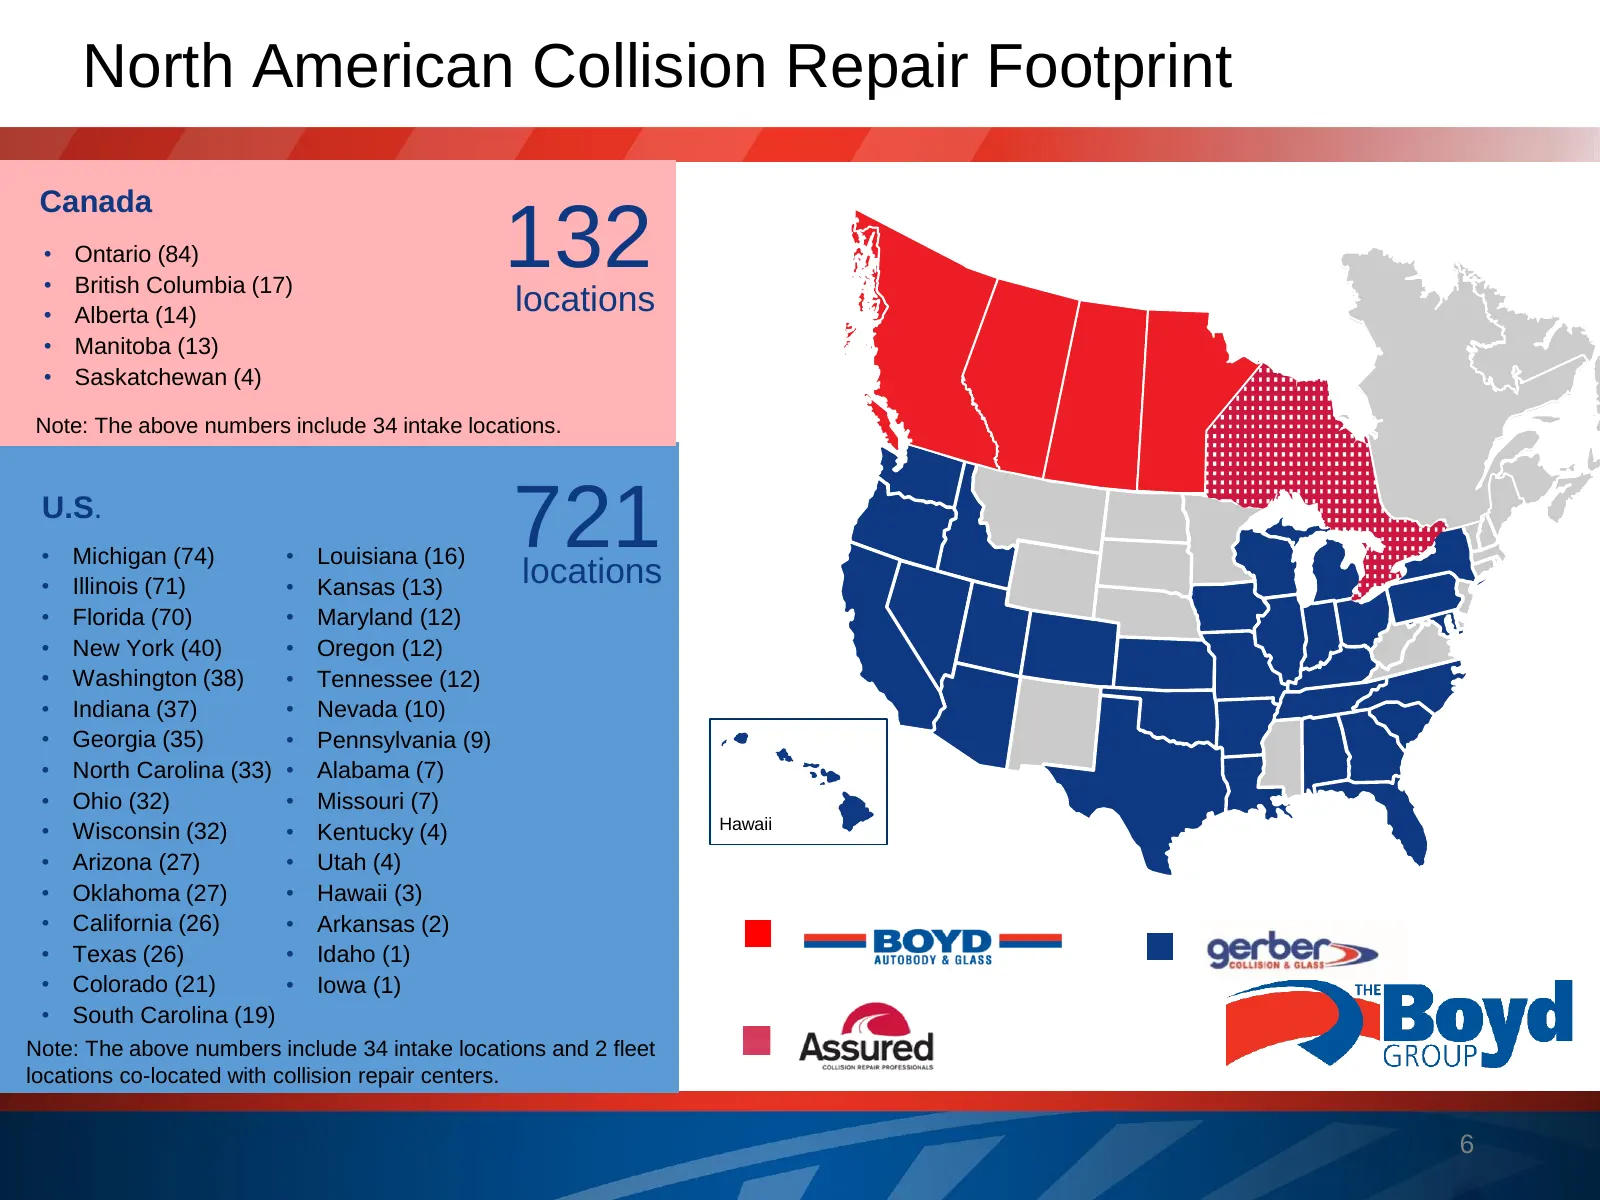
North American Collision Repair Footprint Canada • • Ontario (84) British Columbia (17) 132 locations • Alberta (14) • Manitoba (13) • Saskatchewan (4) Note: The above numbers include 34 intake locations. U.S. • Michigan (74) • Louisiana (16) 721 locations • Illinois (71) • Kansas (13) • Florida (70
Slide 7: Glass Operations
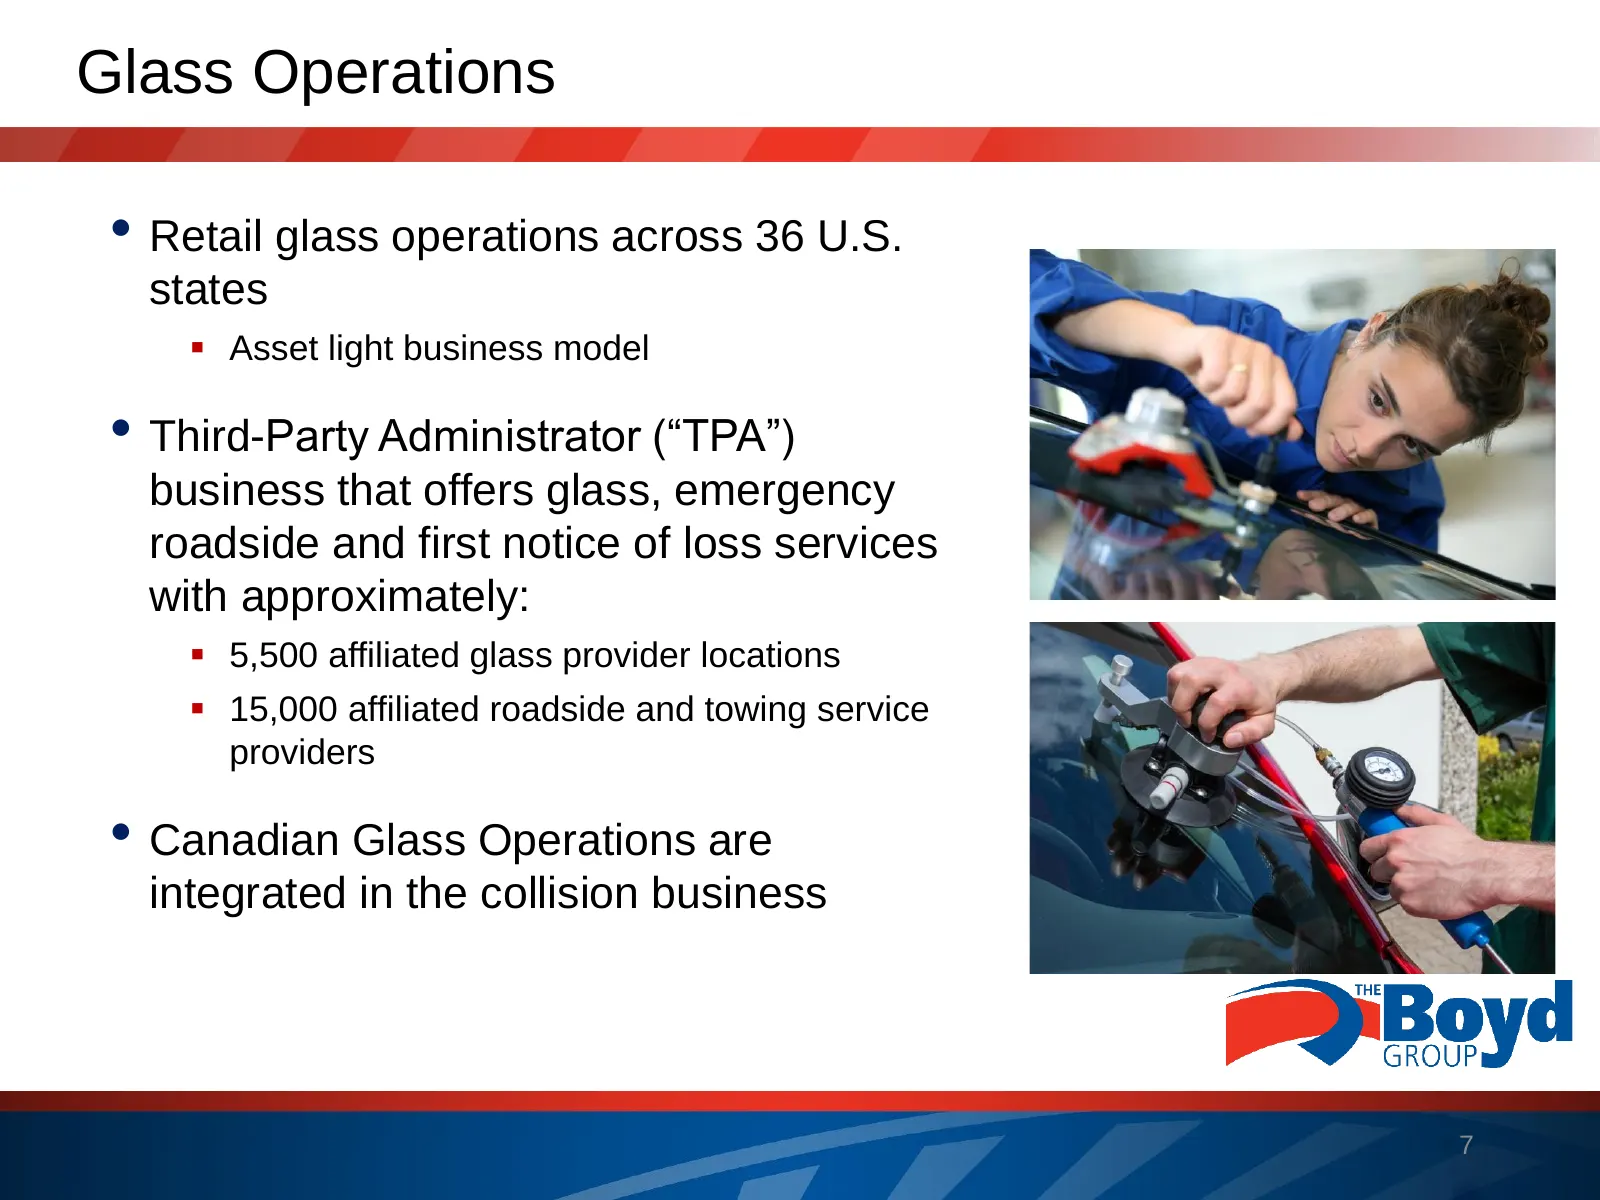
Glass Operations • Retail glass operations across 36 U.S. states ▪ Asset light business model • Third-Party Administrator (“TPA”) business that offers glass, emergency roadside and first notice of loss services with approximately: ▪ 5,500 affiliated glass provider locations ▪ 15,000 affiliated roads
Slide 8: North American Glass Footprint
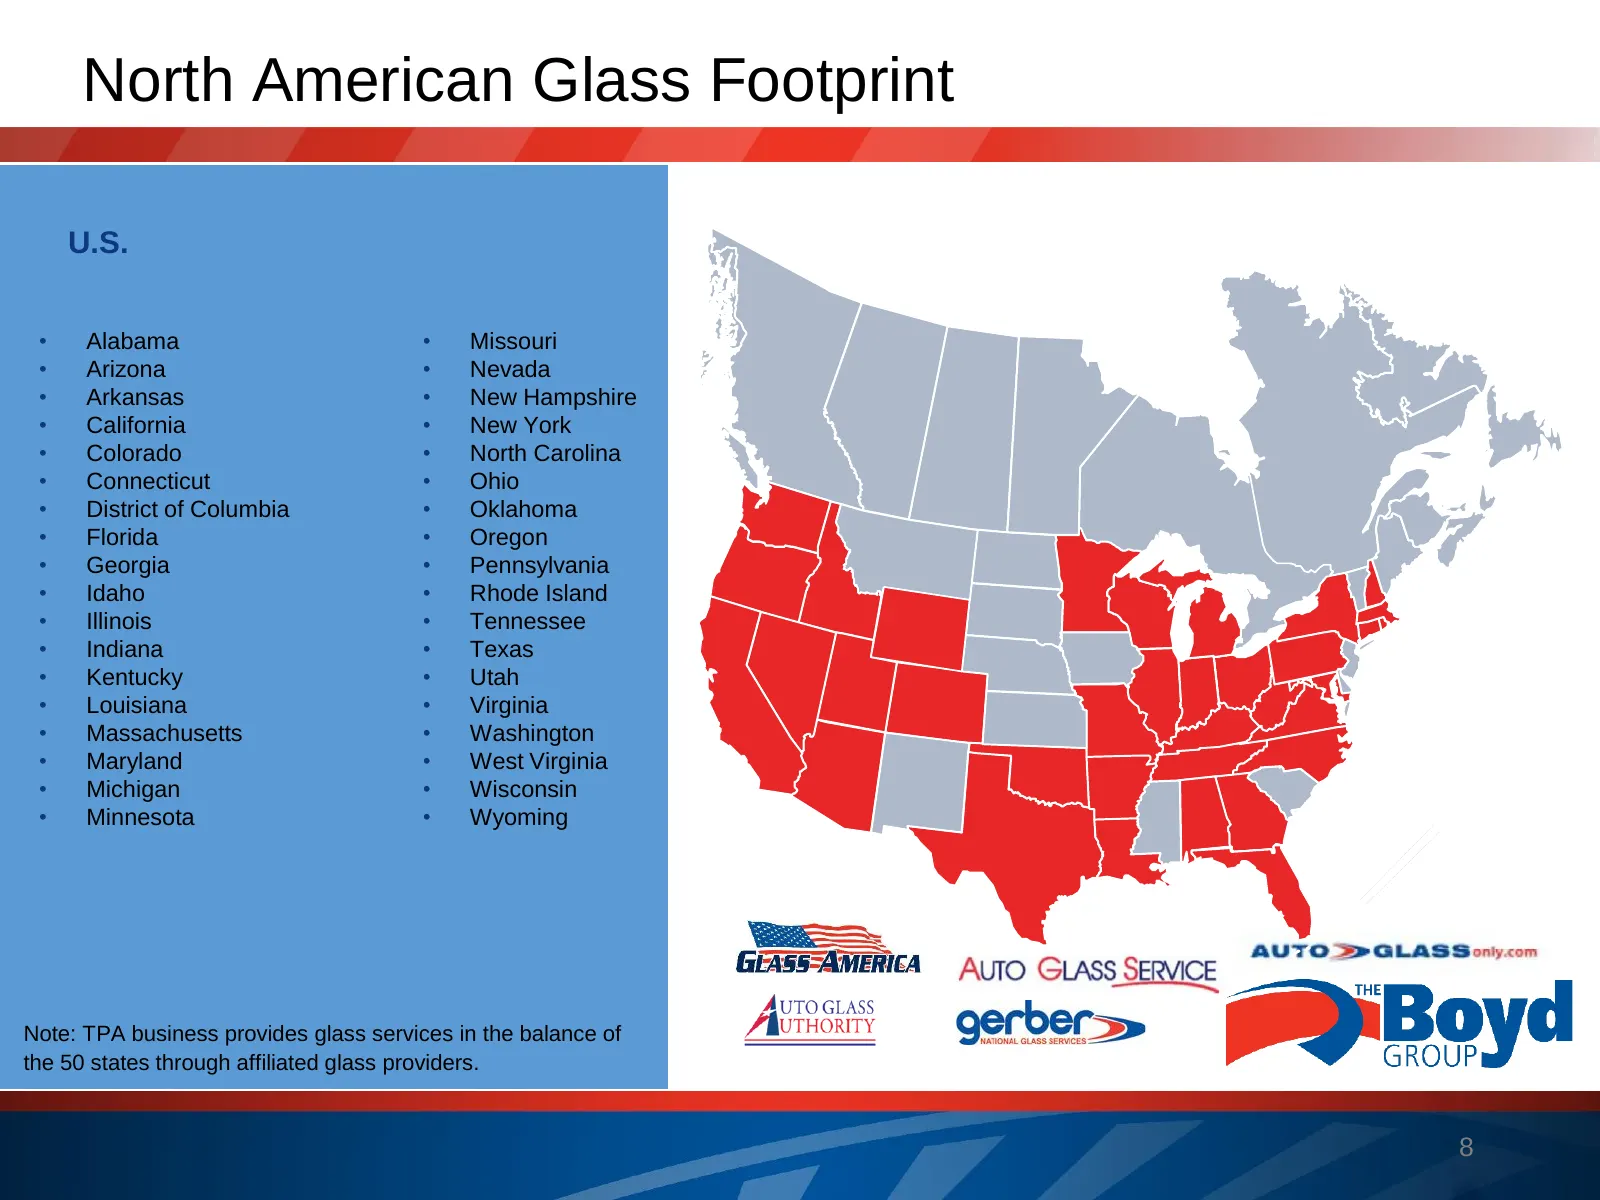
North American Glass Footprint U.S. • Alabama • Missouri • Arizona • Nevada • Arkansas • New Hampshire • California • New York • Colorado • North Carolina • Connecticut • Ohio • District of Columbia • Oklahoma • Florida • Oregon • Georgia • Pennsylvania • Idaho • Rhode Island • Illinois • Tennessee
Slide 9: Market Overview & Business Strategy
Market Overview & Business Strategy 9
Slide 10: Large, Fragmented Market
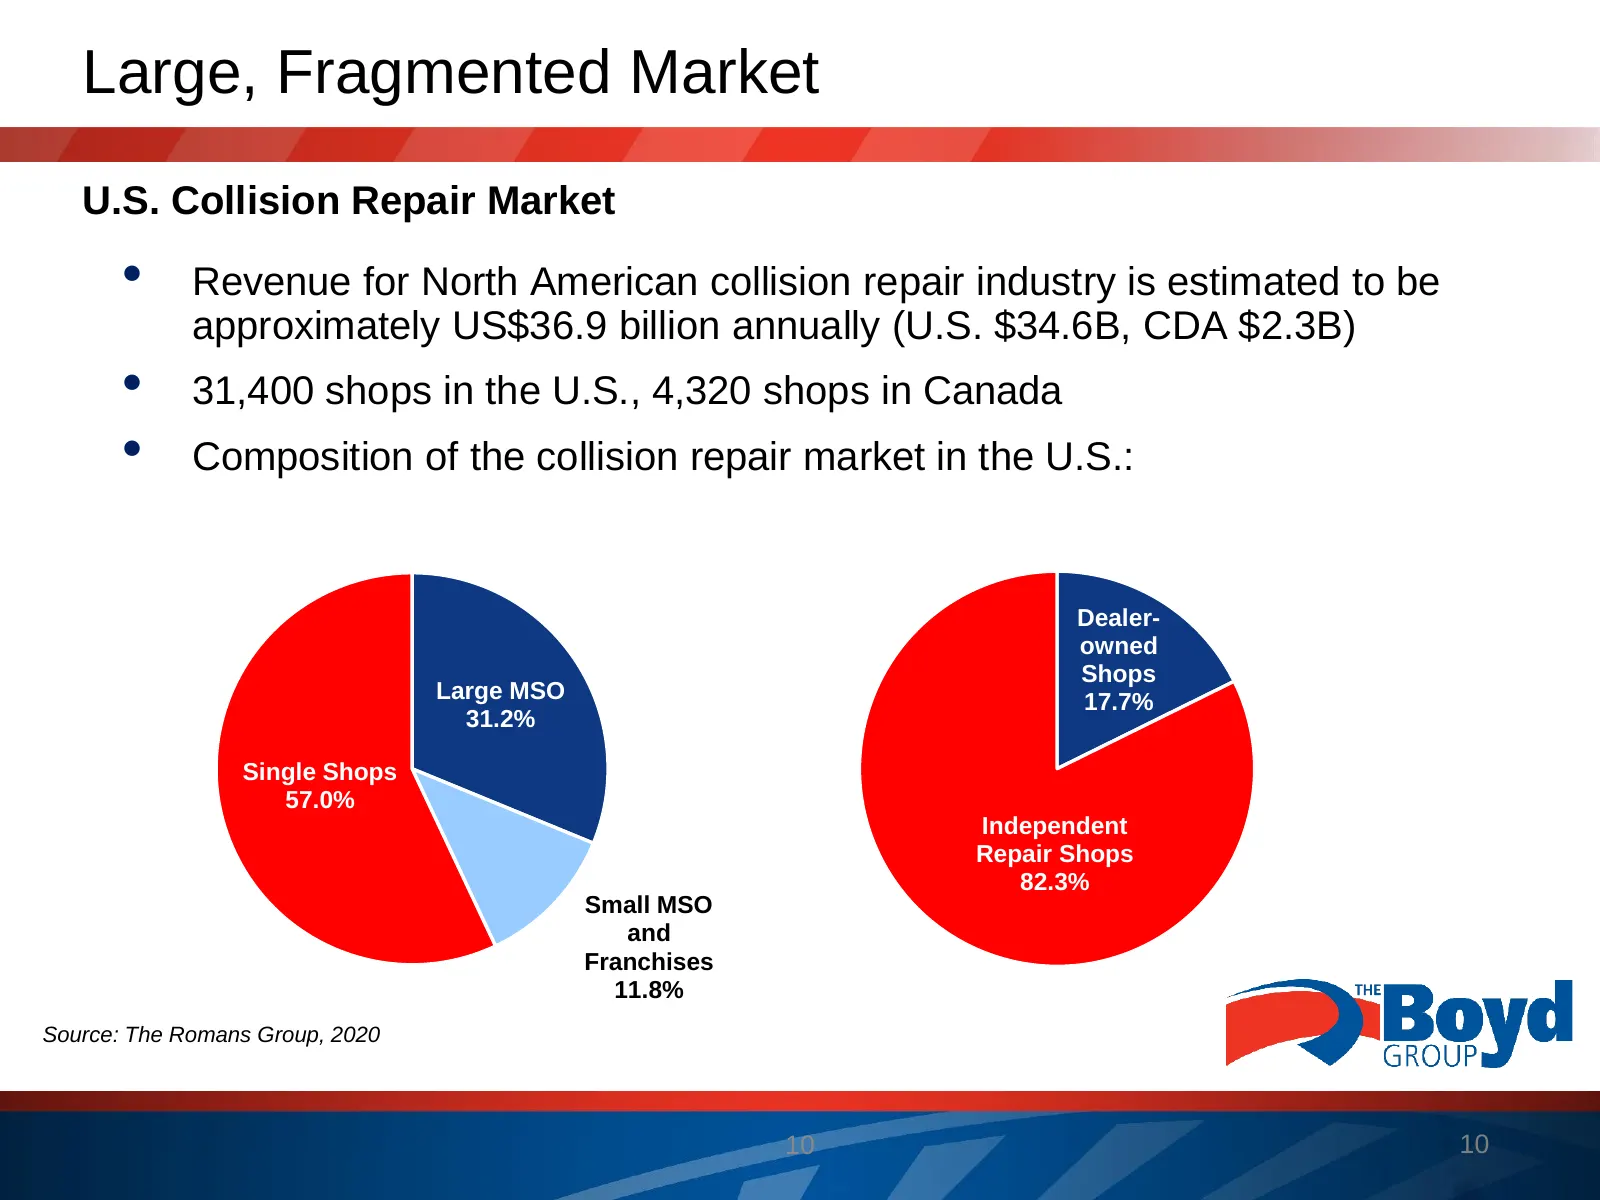
Large, Fragmented Market U.S. Collision Repair Market • Revenue for North American collision repair industry is estimated to be approximately US$36.9 billion annually (U.S. $34.6B, CDA $2.3B) • 31,400 shops in the U.S., 4,320 shops in Canada • Composition of the collision repair market in the U.S.:
Slide 11: Evolving Collision Repair Market
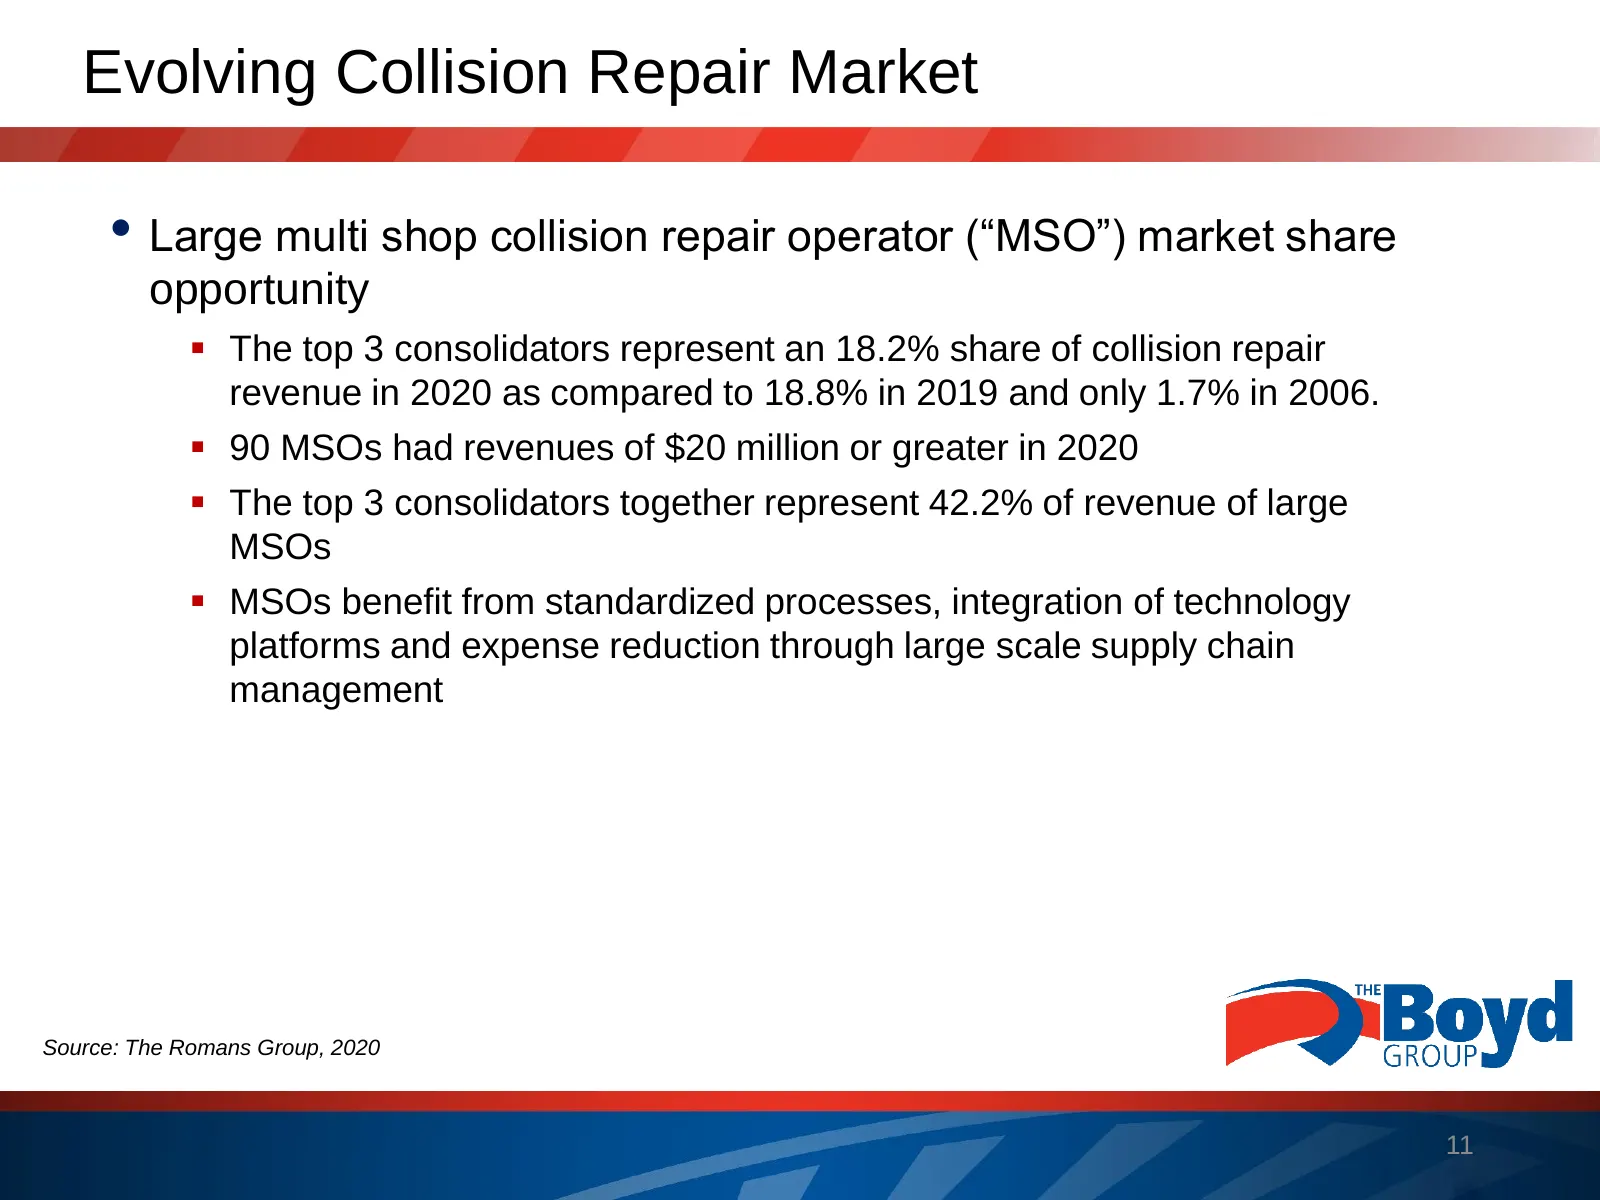
Evolving Collision Repair Market • Large multi shop collision repair operator (“MSO”) market share opportunity ▪ The top 3 consolidators represent an 18.2% share of collision repair revenue in 2020 as compared to 18.8% in 2019 and only 1.7% in 2006. ▪ 90 MSOs had revenues of $20 million or greater i
Slide 12: Strong Relationships with Insurance Companies through DRPs
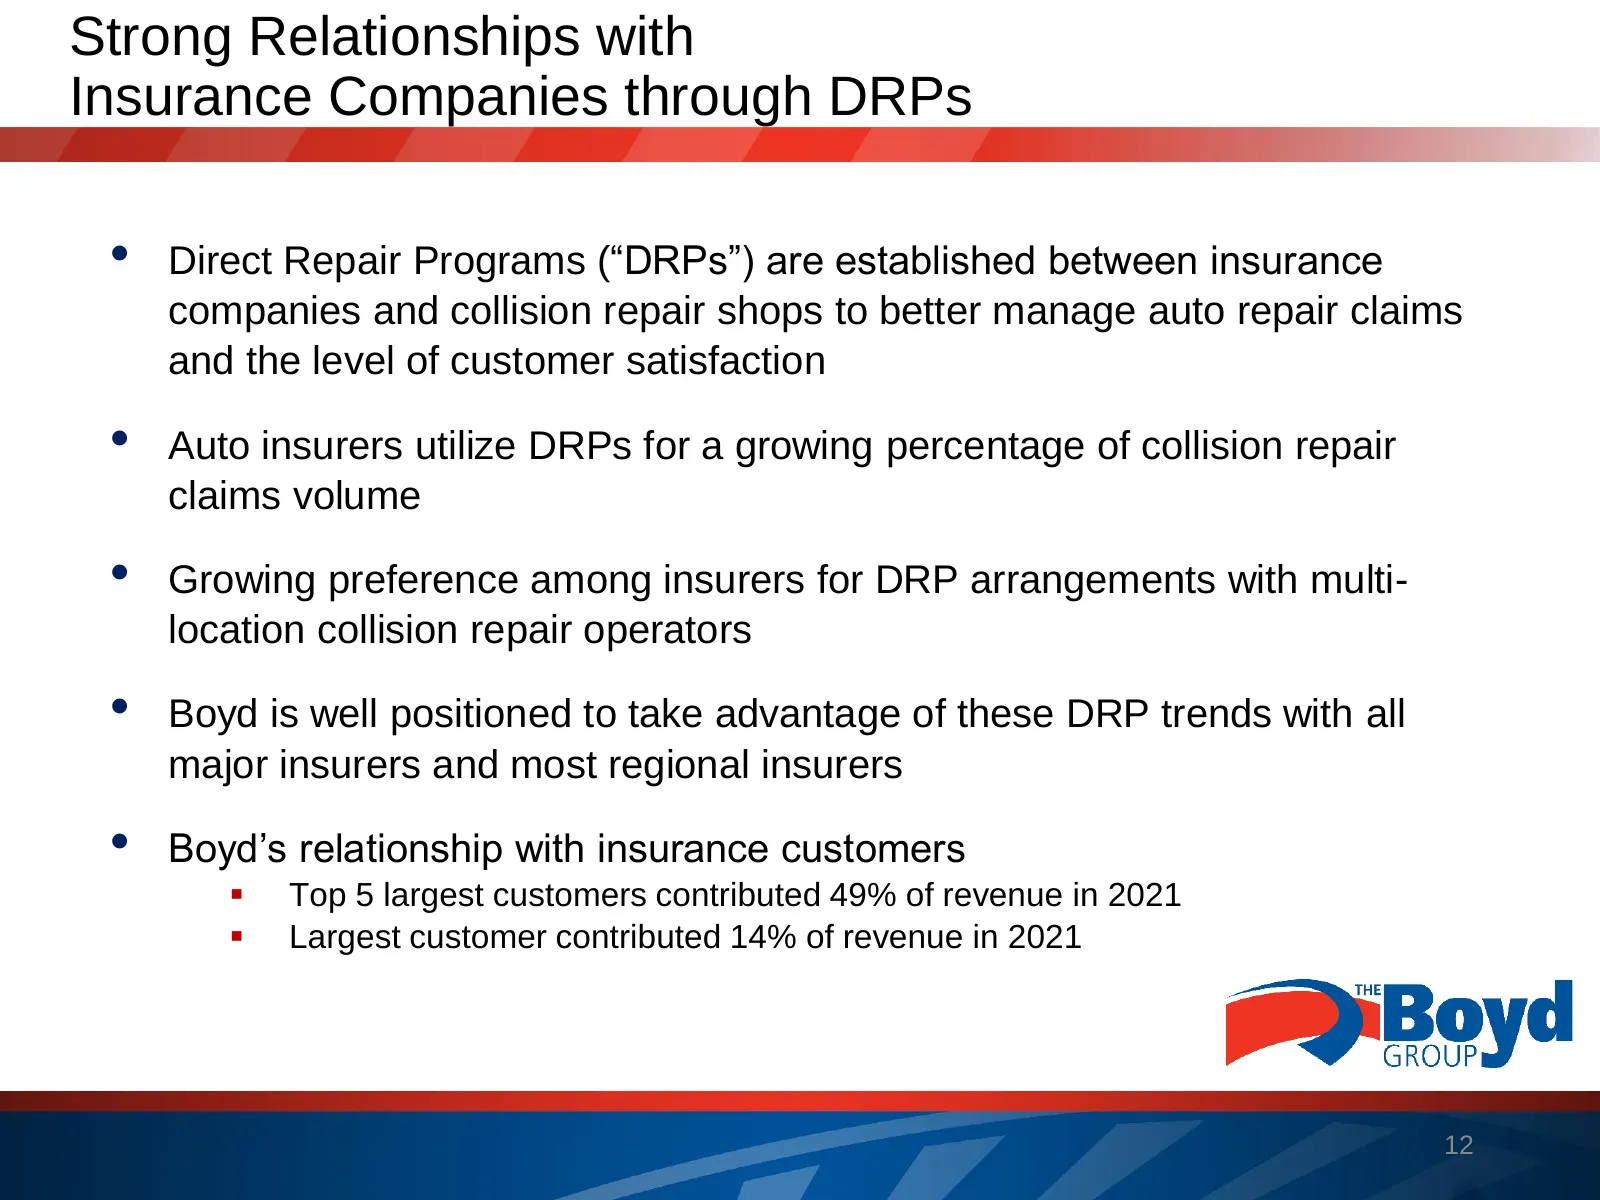
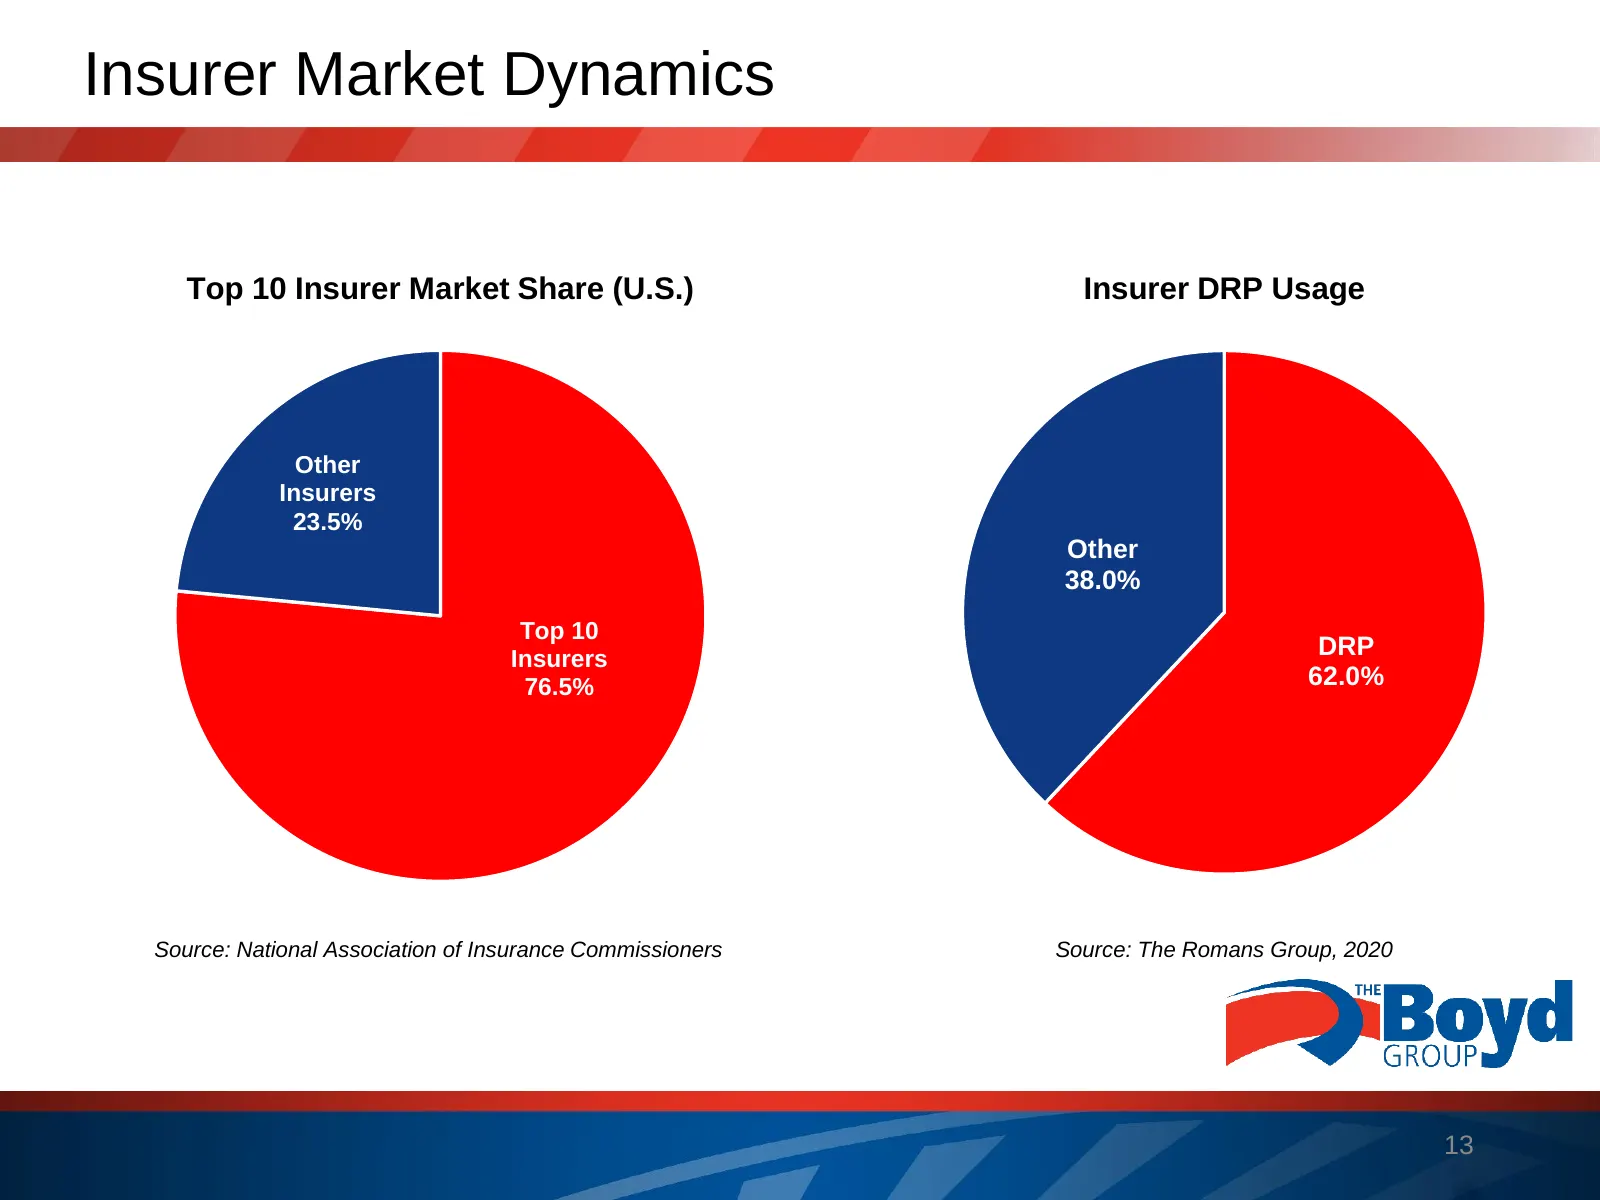
Strong Relationships with Insurance Companies through DRPs • Direct Repair Programs (“DRPs”) are established between insurance companies and collision repair shops to better manage auto repair claims and the level of customer satisfaction • Auto insurers utilize DRPs for a growing percentage of coll
Slide 13: Insurer Market Dynamics
Insurer Market Dynamics Top 10 Insurer Market Share (U.S.) Insurer DRP Usage Other Insurers 23.5% Other 38.0% Top 10 Insurers DRP 76.5% 62.0% Source: National Association of Insurance Commissioners Source: The Romans Group, 2020 13
Slide 14: Impact of Collision Avoidance Systems
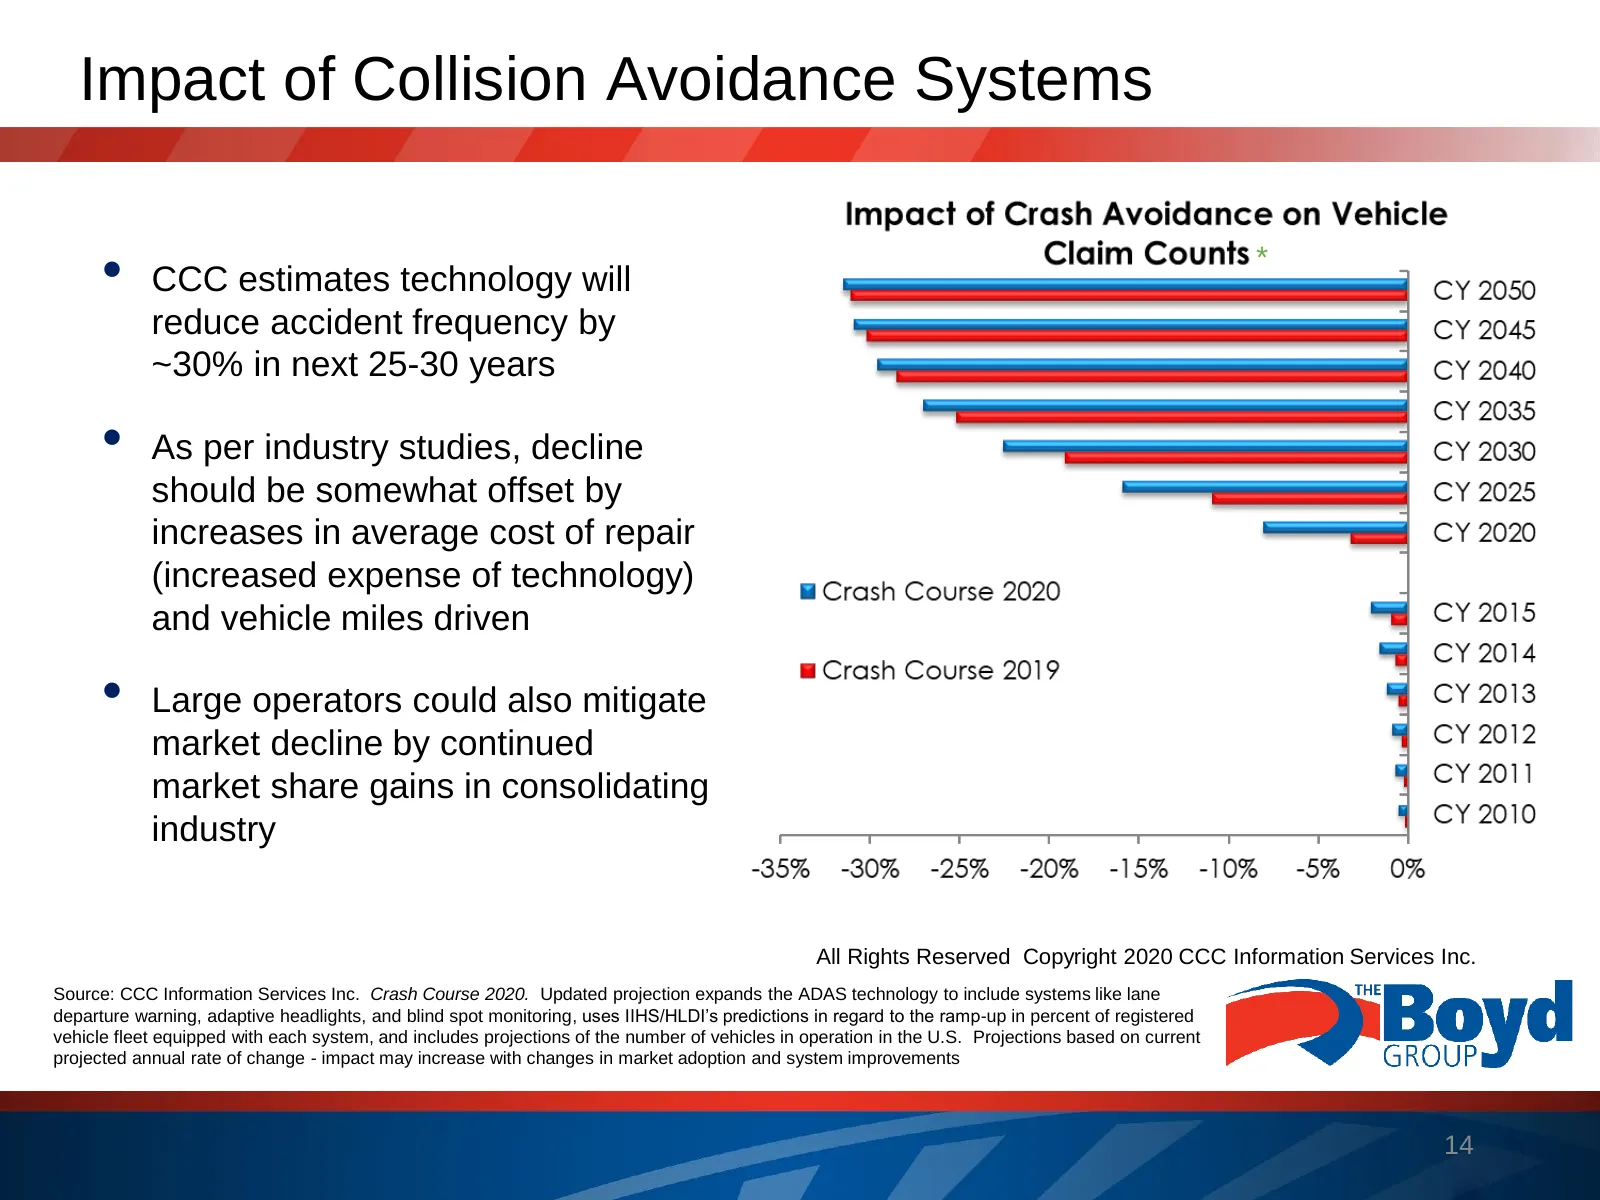
Impact of Collision Avoidance Systems • CCC estimates technology will * reduce accident frequency by ~30% in next 25-30 years • As per industry studies, decline should be somewhat offset by increases in average cost of repair (increased expense of technology) and vehicle miles driven • Large operato
Slide 15: Business Strategy
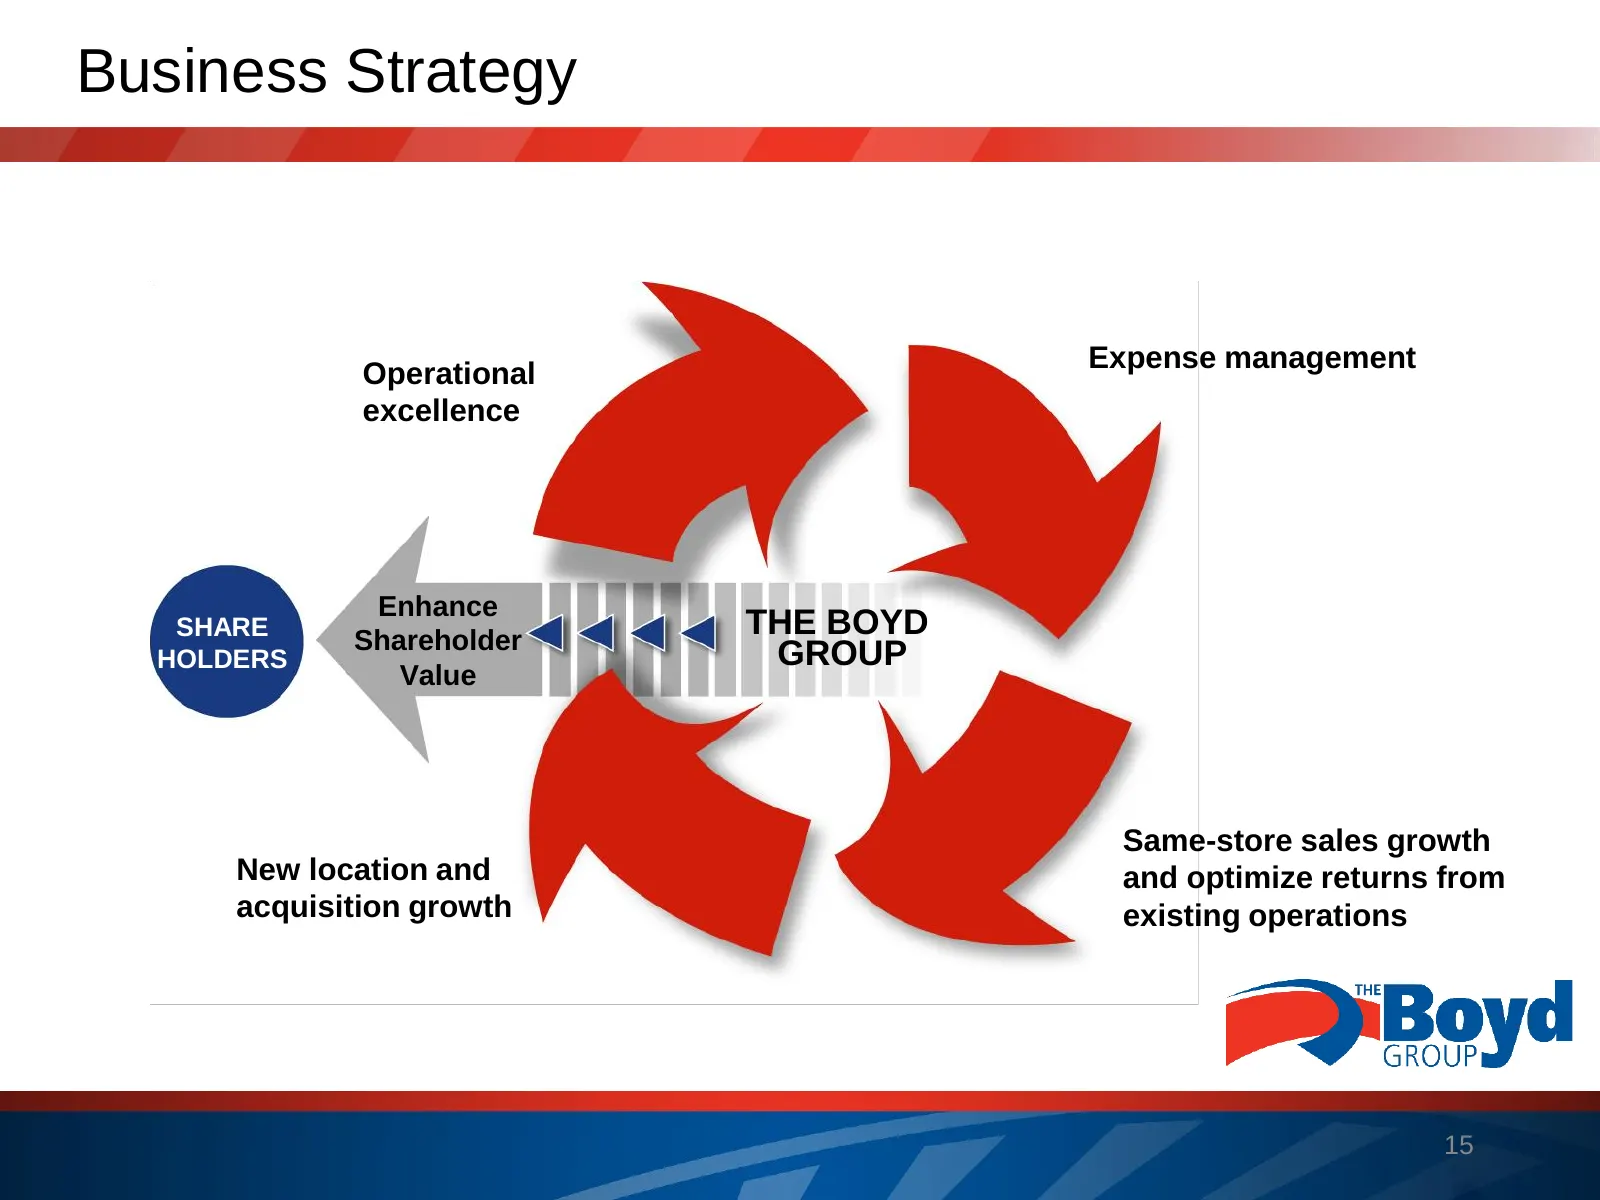
Business Strategy Expense management Operational excellence Enhance SHARE Shareholder THE BOYD HOLDERS GROUP Value Same-store sales growth New location and and optimize returns from acquisition growth existing operations 15
Slide 16: Operational Excellence
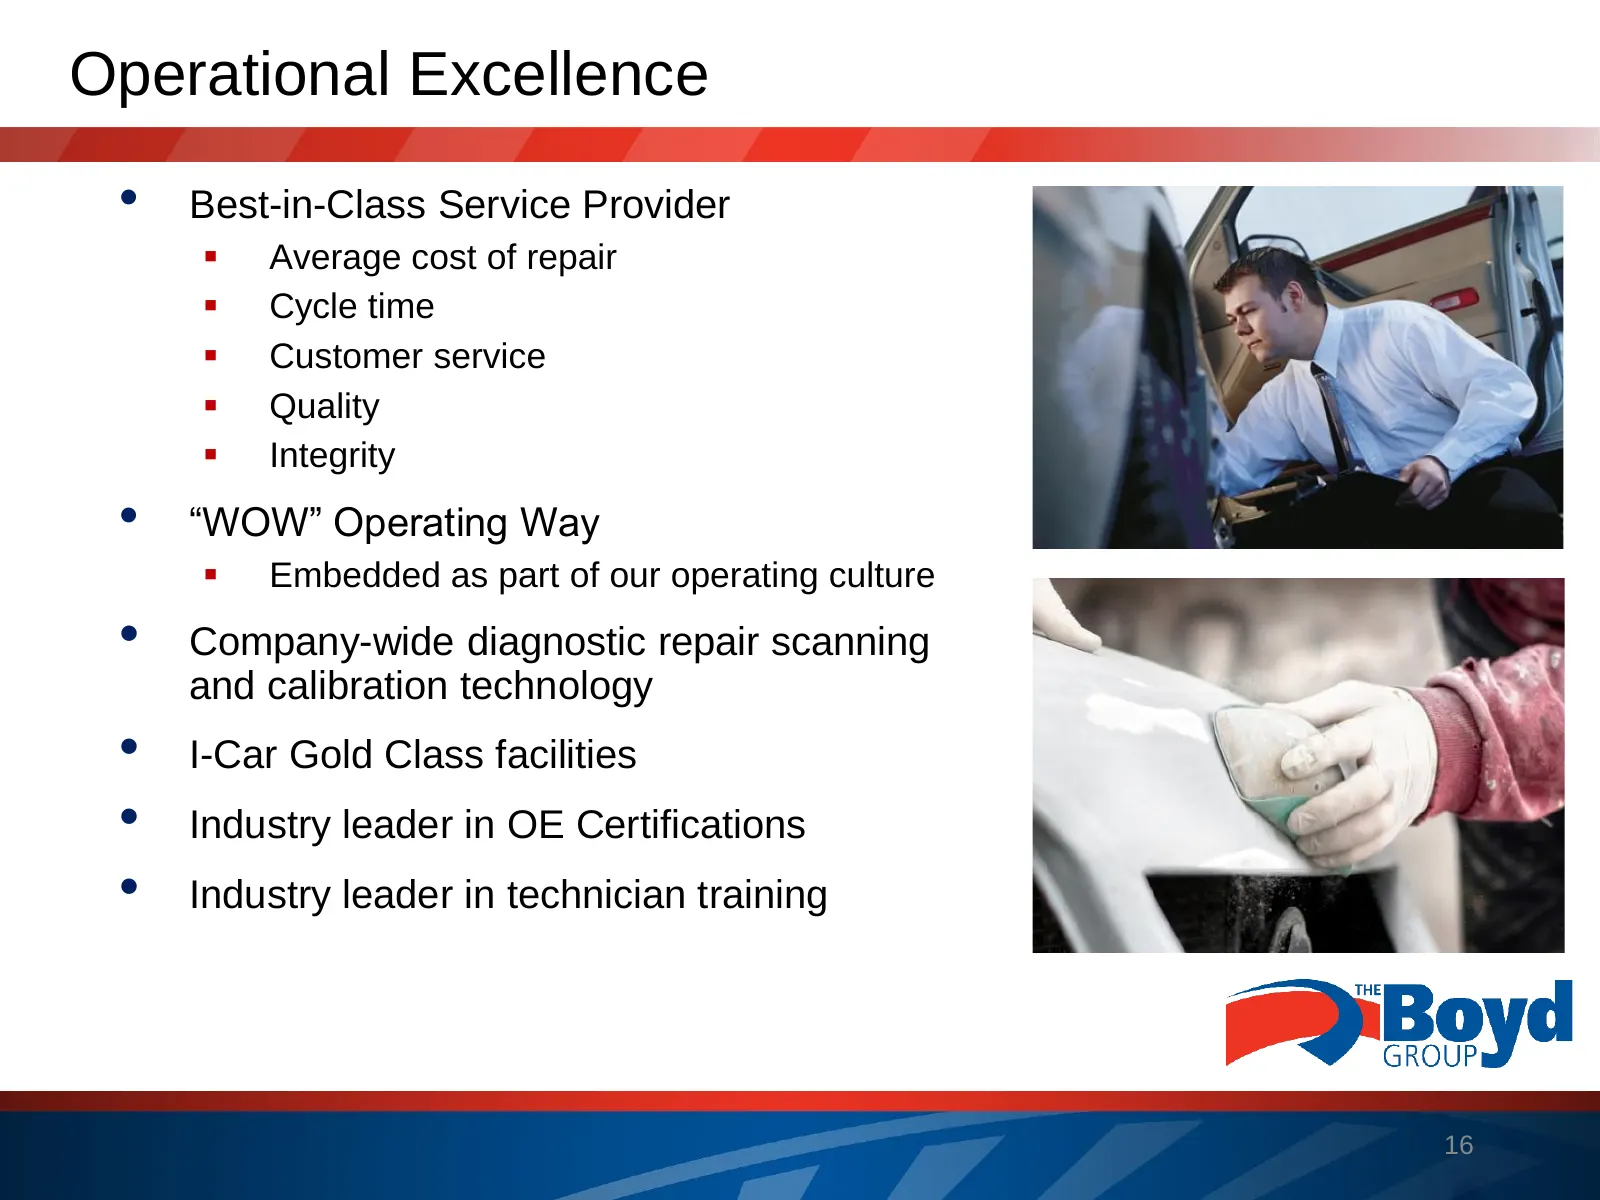
Operational Excellence • Best-in-Class Service Provider ▪ Average cost of repair ▪ Cycle time ▪ Customer service ▪ Quality ▪ Integrity • “WOW” Operating Way ▪ Embedded as part of our operating culture • Company-wide diagnostic repair scanning and calibration technology • I-Car Gold Class facilities
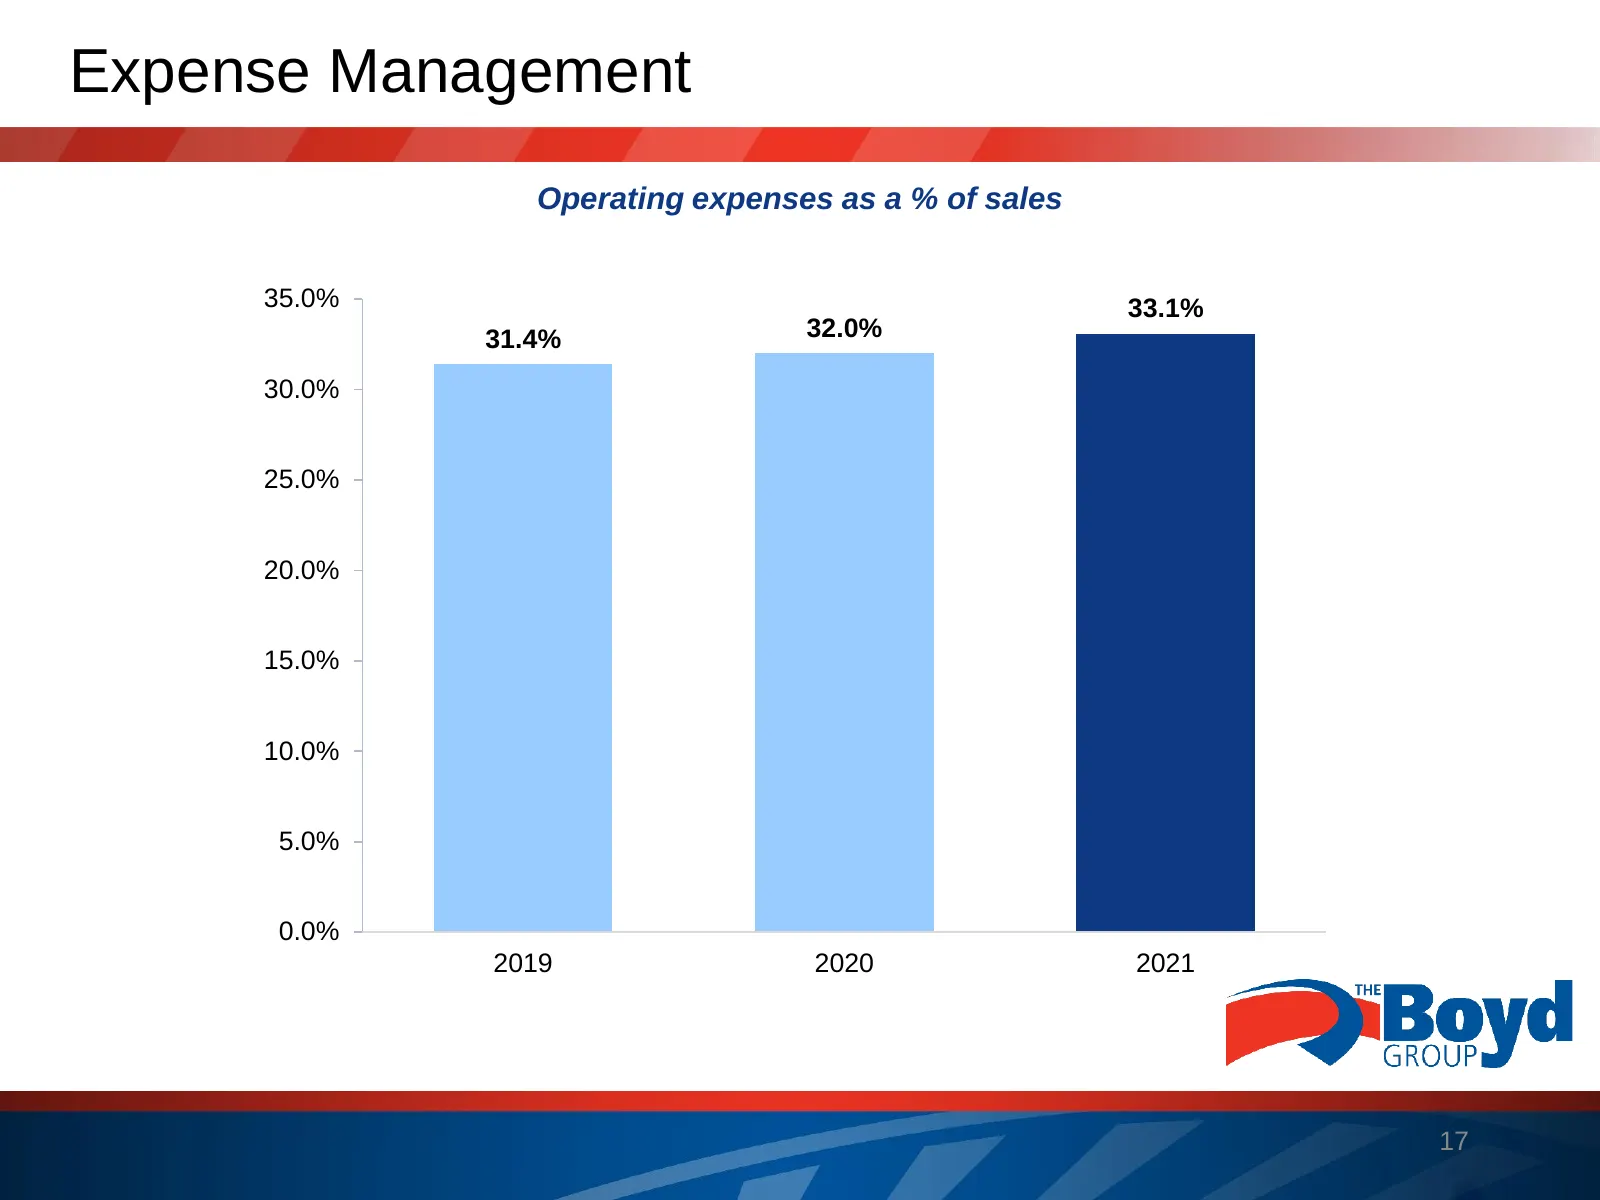
Slide 17: Expense Management
Expense Management Operating expenses as a % of sales 35.0% 33.1% 31.4% 32.0% 30.0% 25.0% 20.0% 15.0% 10.0% 5.0% 0.0% 2019 2020 2021 17
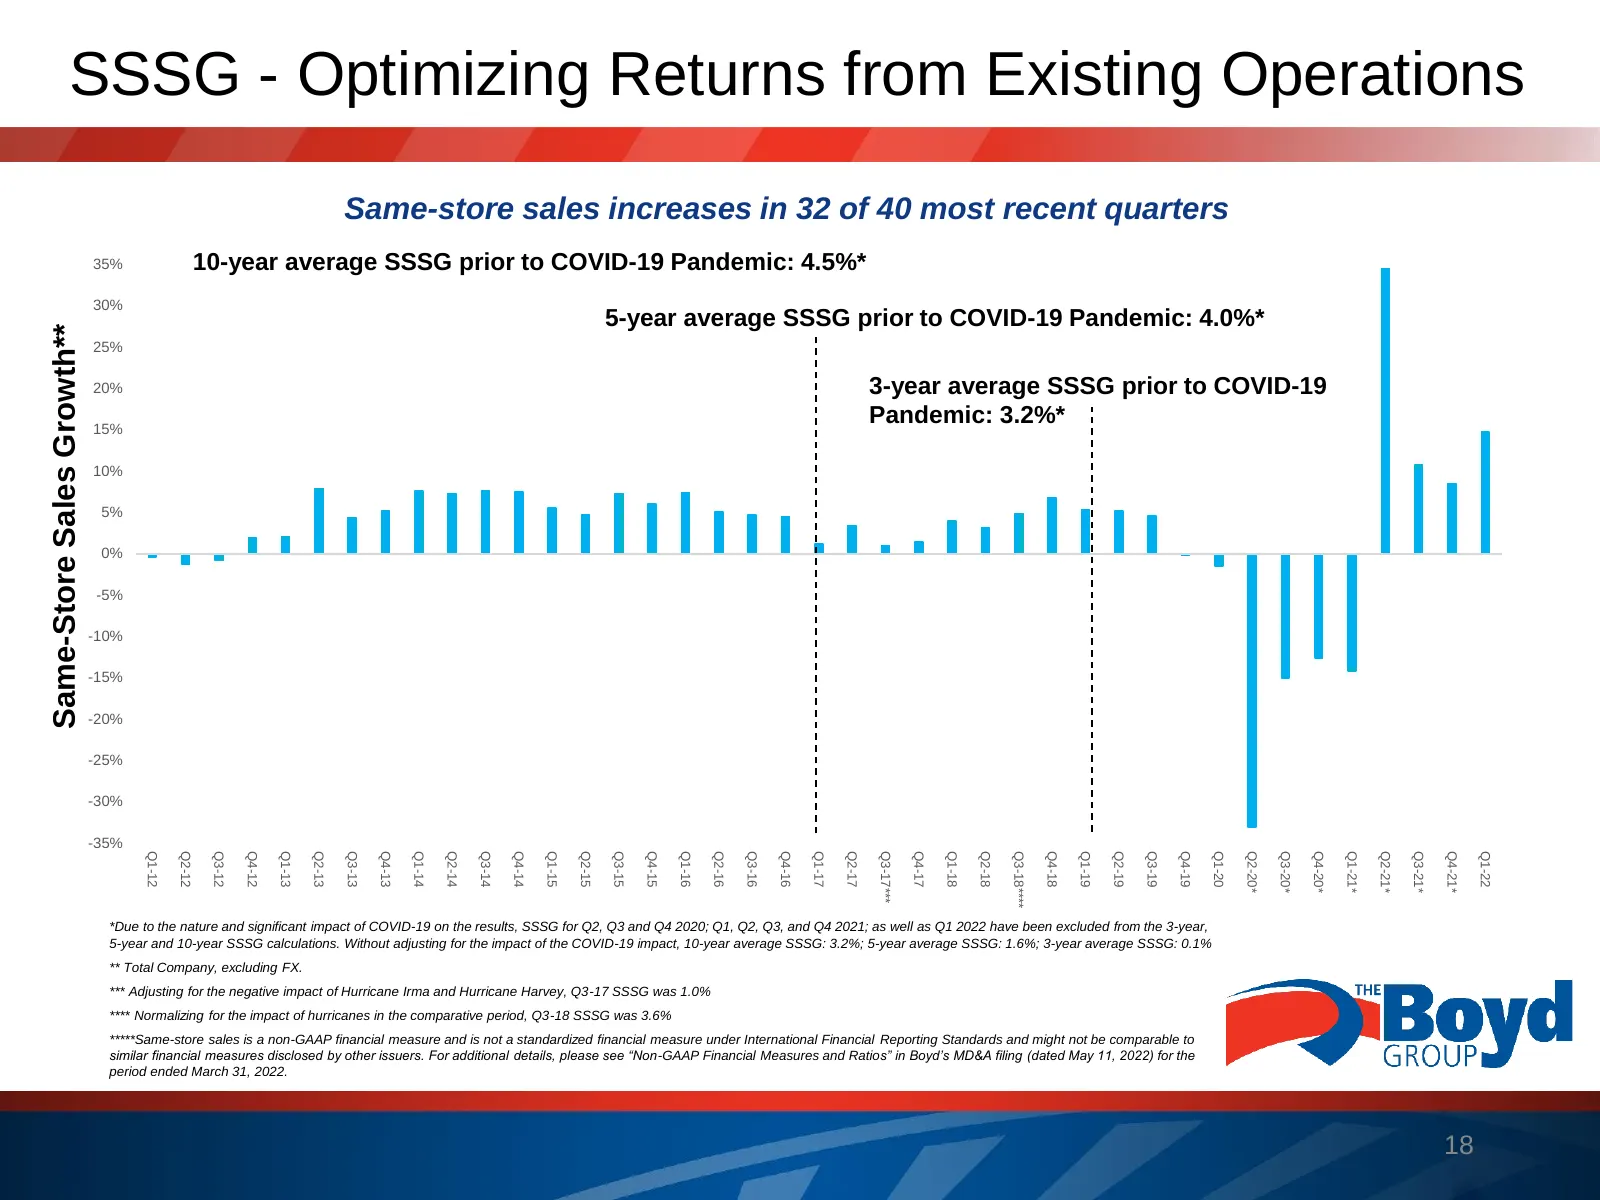
Slide 18: Same-Store Sales Growth
SSSG - Optimizing Returns from Existing Operations Same-store sales increases in 32 of 40 most recent quarters 35% 10-year average SSSG prior to COVID-19 Pandemic: 4.5%* 30% 5-year average SSSG prior to COVID-19 Pandemic: 4.0%* Same-Store Sales Growth** 25% 20% 3-year average SSSG prior to COVID-19
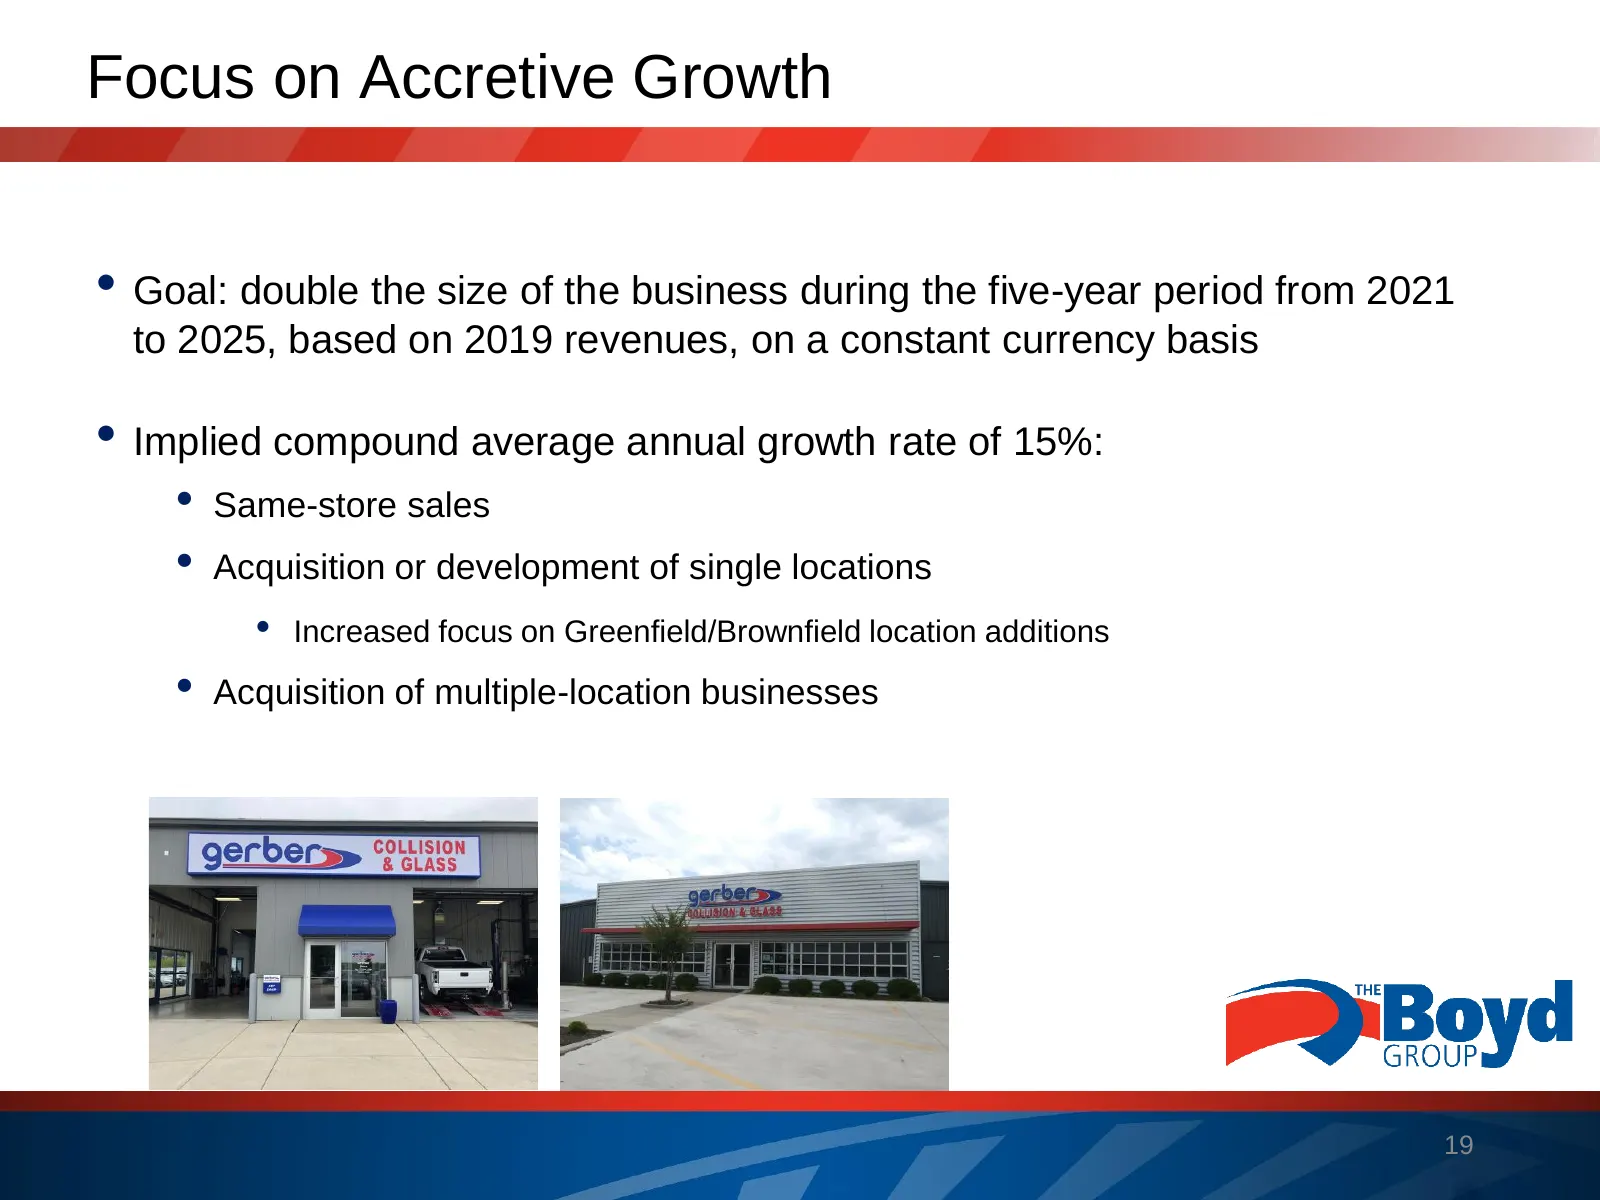
Slide 19: Focus on Accretive Growth
Focus on Accretive Growth • Goal: double the size of the business during the five-year period from 2021 to 2025, based on 2019 revenues, on a constant currency basis • Implied compound average annual growth rate of 15%: • Same-store sales • Acquisition or development of single locations • Increased
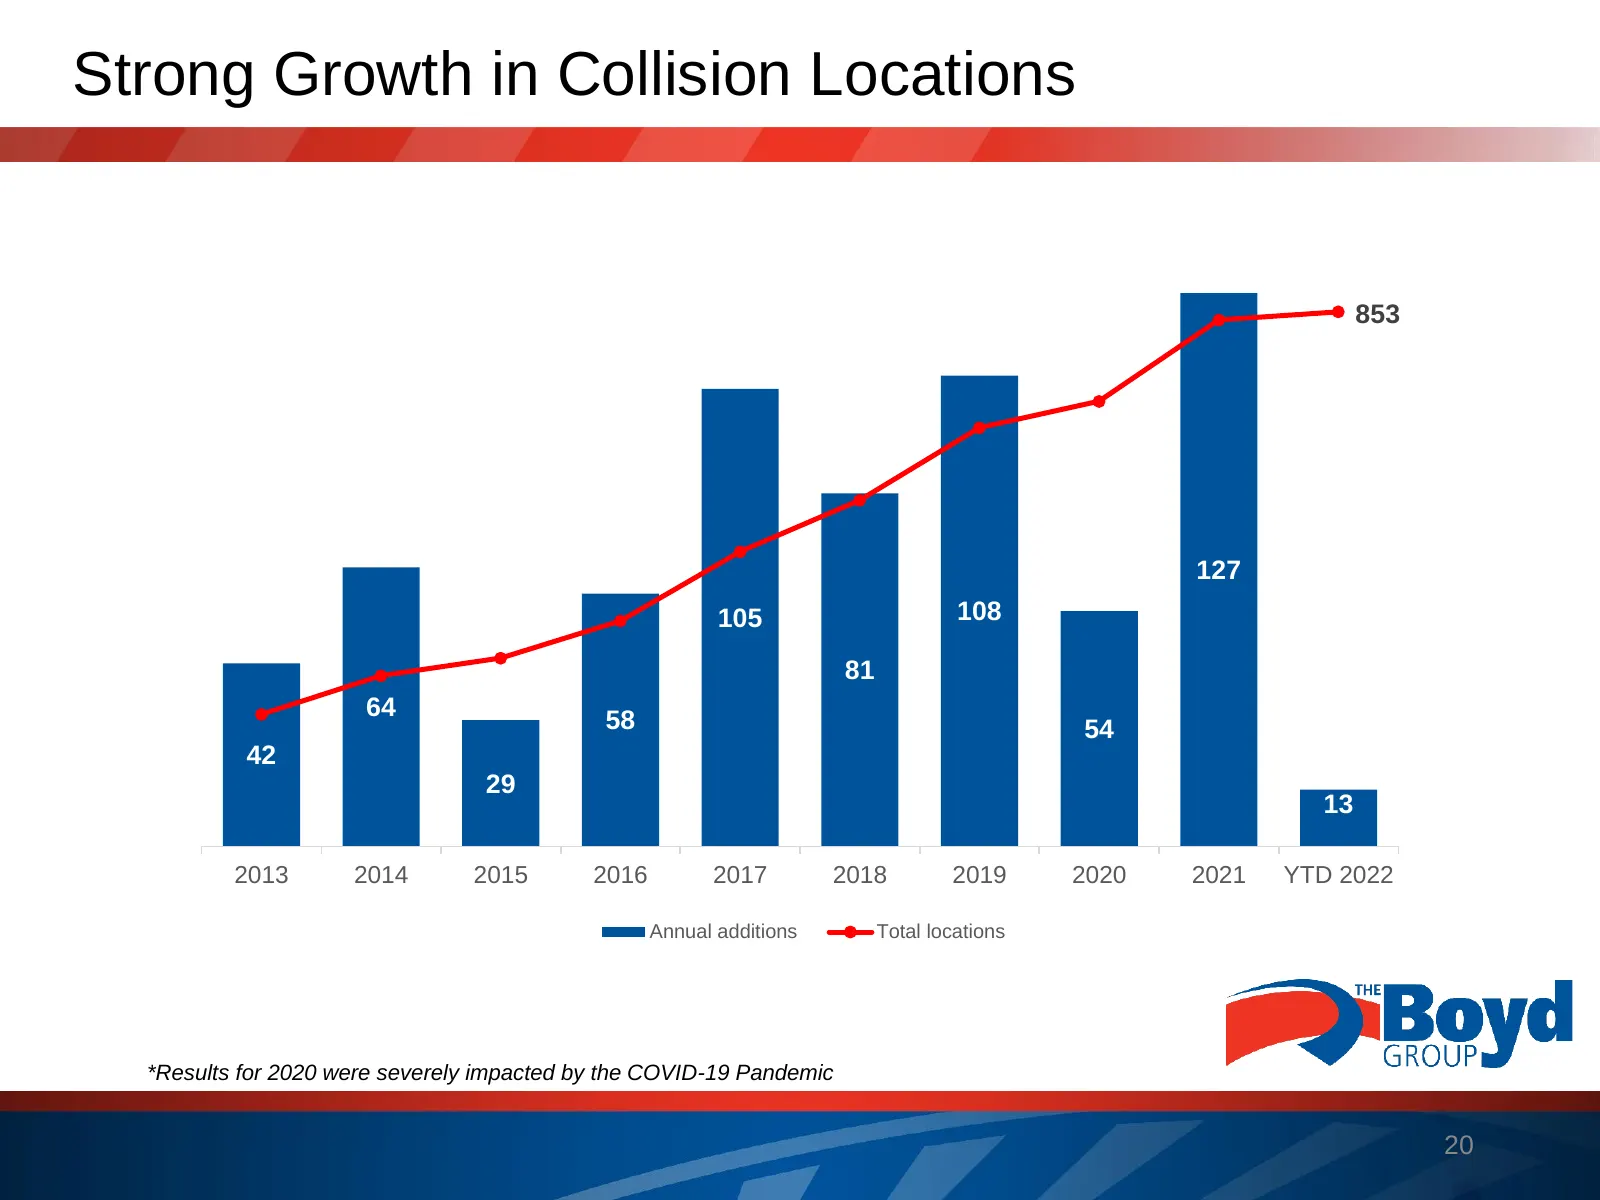
Slide 20: Strong Growth in Collision Locations
Strong Growth in Collision Locations 130 900 853 800 110 700 90 600 70 500 127 105 108 400 50 81 300 30 64 58 54 42 200 29 10 13 100 2013 2014 2015 2016 2017 2018 2019 2020 2021 YTD 2022 -10 0 Annual additions Total locations *Results for 2020 were severely impacted by the COVID-19 Pandemic 20
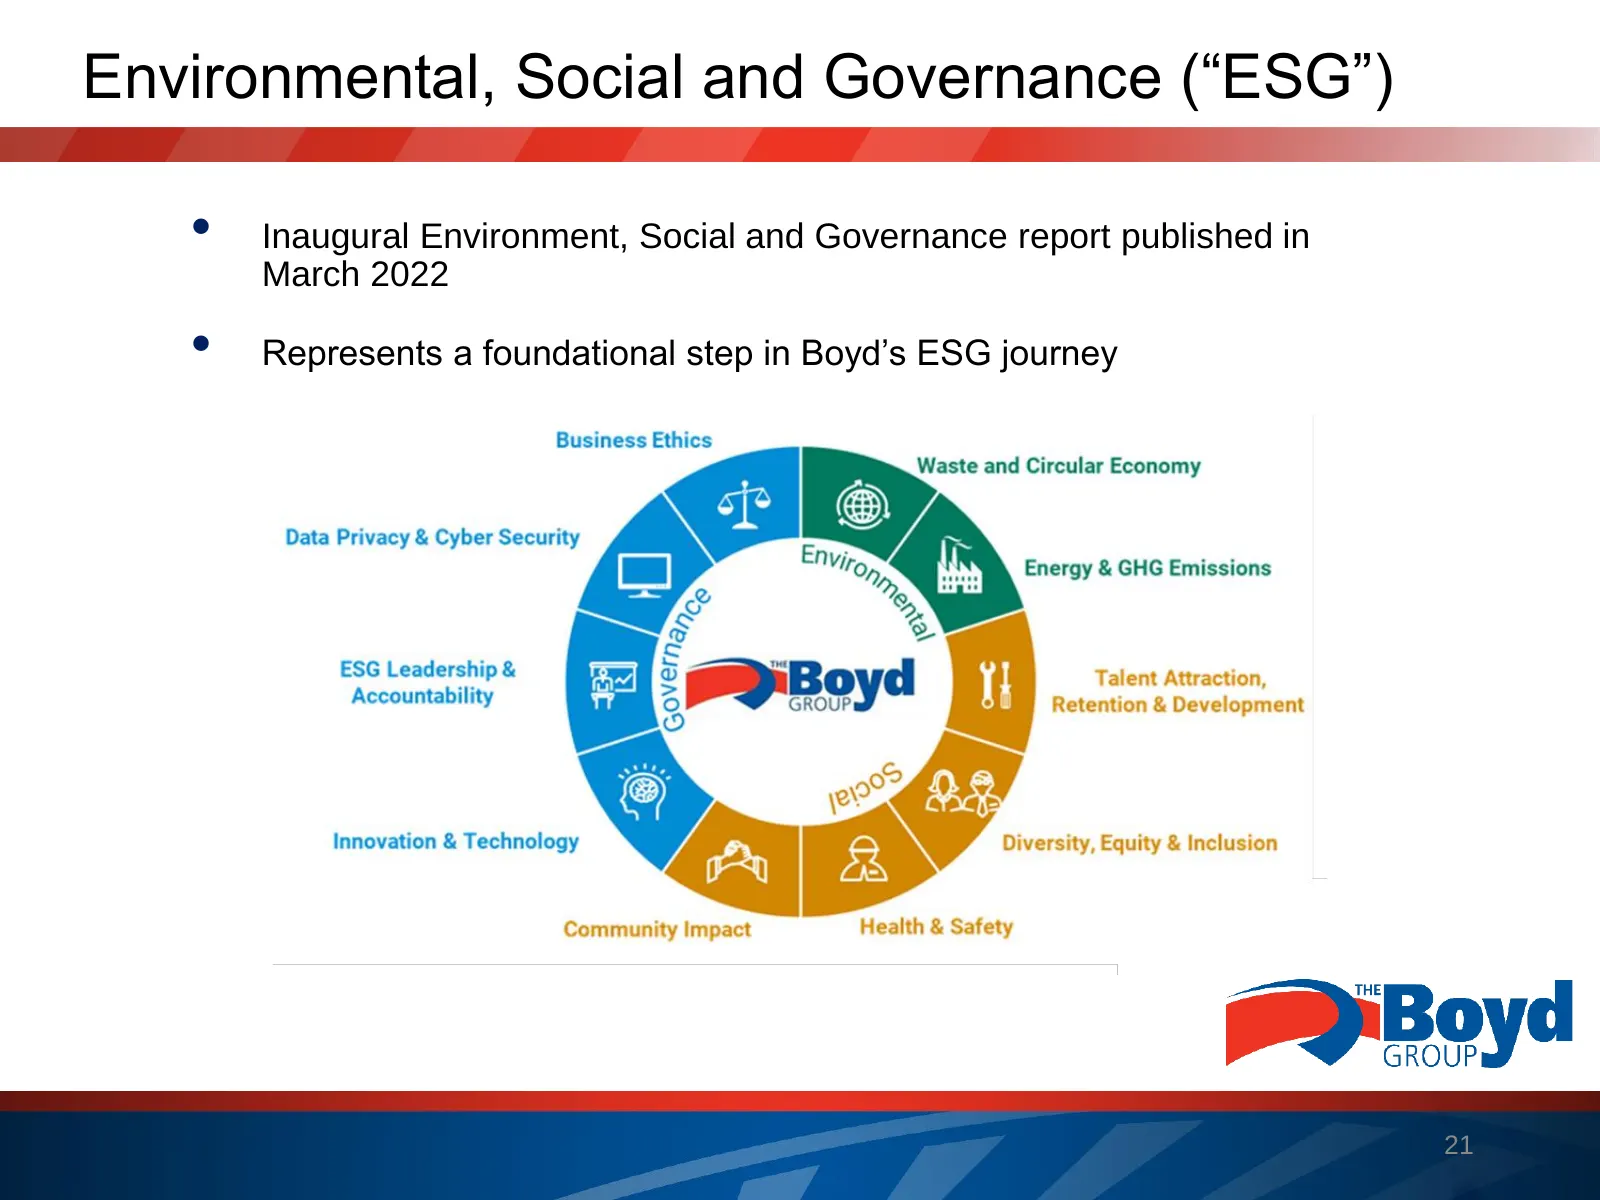
Slide 21: Environmental, Social and Governance ("ESG")
Environmental, Social and Governance (“ESG”) • Inaugural Environment, Social and Governance report published in March 2022 • Represents a foundational step in Boyd’s ESG journey 21
Slide 22: Financial Review
Financial Review THE pp Boyd GROUP
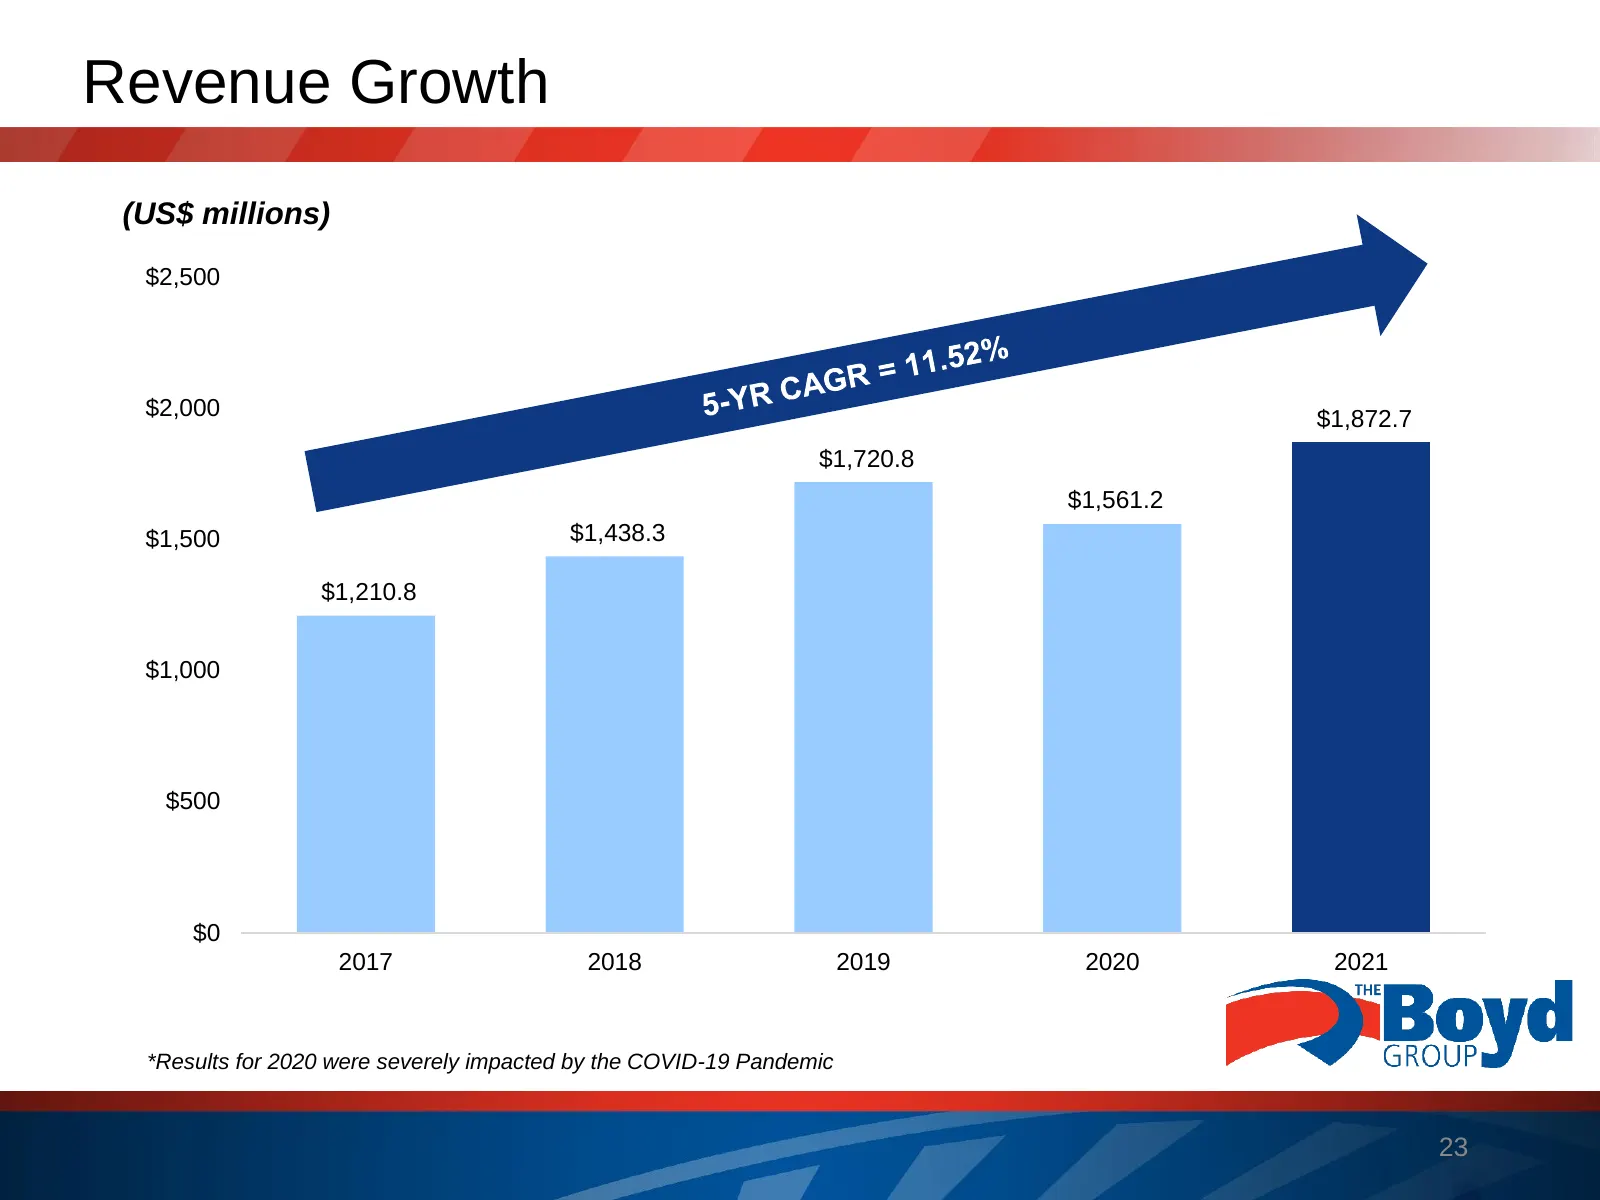
Slide 23: Revenue Growth
Revenue Growth (US$ millions) $2,500 $2,000 $1,872.7 $1,720.8 $1,561.2 $1,500 $1,438.3 $1,210.8 $1,000 $500 $0 2017 2018 2019 2020 2021 *Results for 2020 were severely impacted by the COVID-19 Pandemic 23
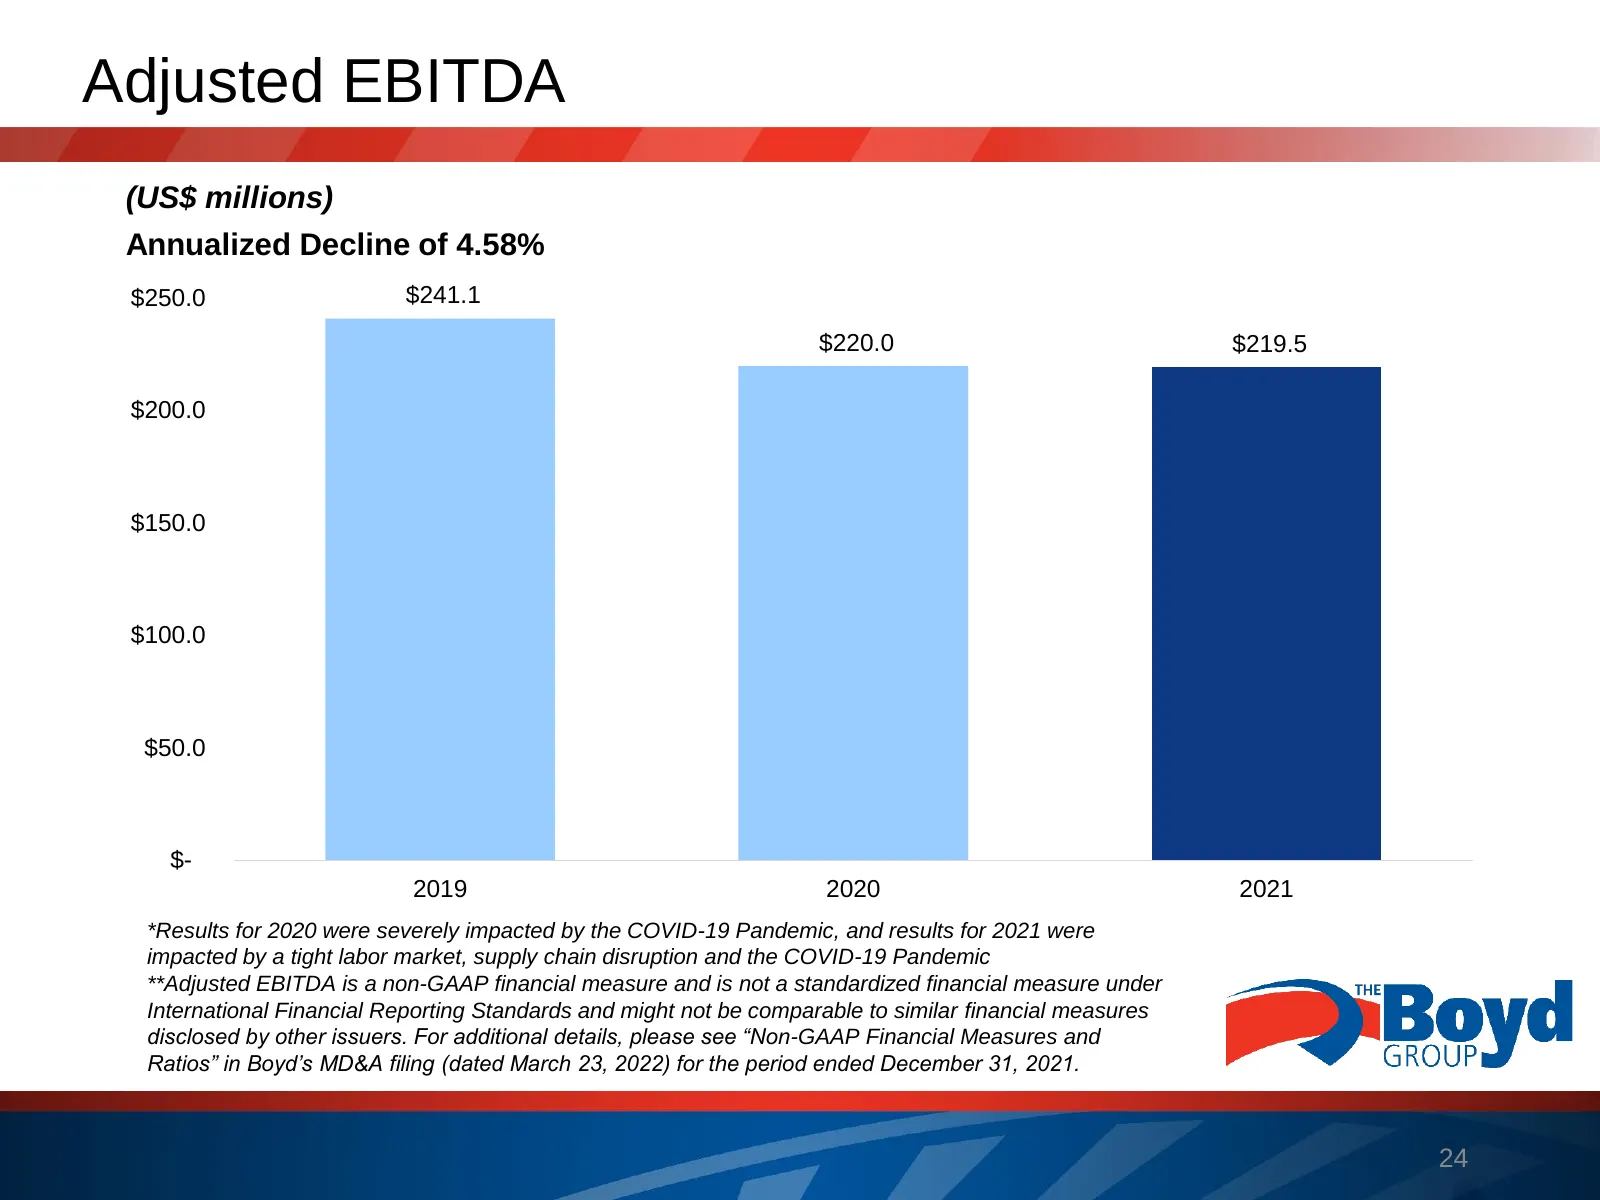
Slide 24: Adjusted EBITDA
Adjusted EBITDA (US$ millions) Annualized Decline of 4.58% $250.0 $241.1 $220.0 $219.5 $200.0 $150.0 $100.0 $50.0 $- 2019 2020 2021 *Results for 2020 were severely impacted by the COVID-19 Pandemic, and results for 2021 were impacted by a tight labor market, supply chain disruption and the COVID-19
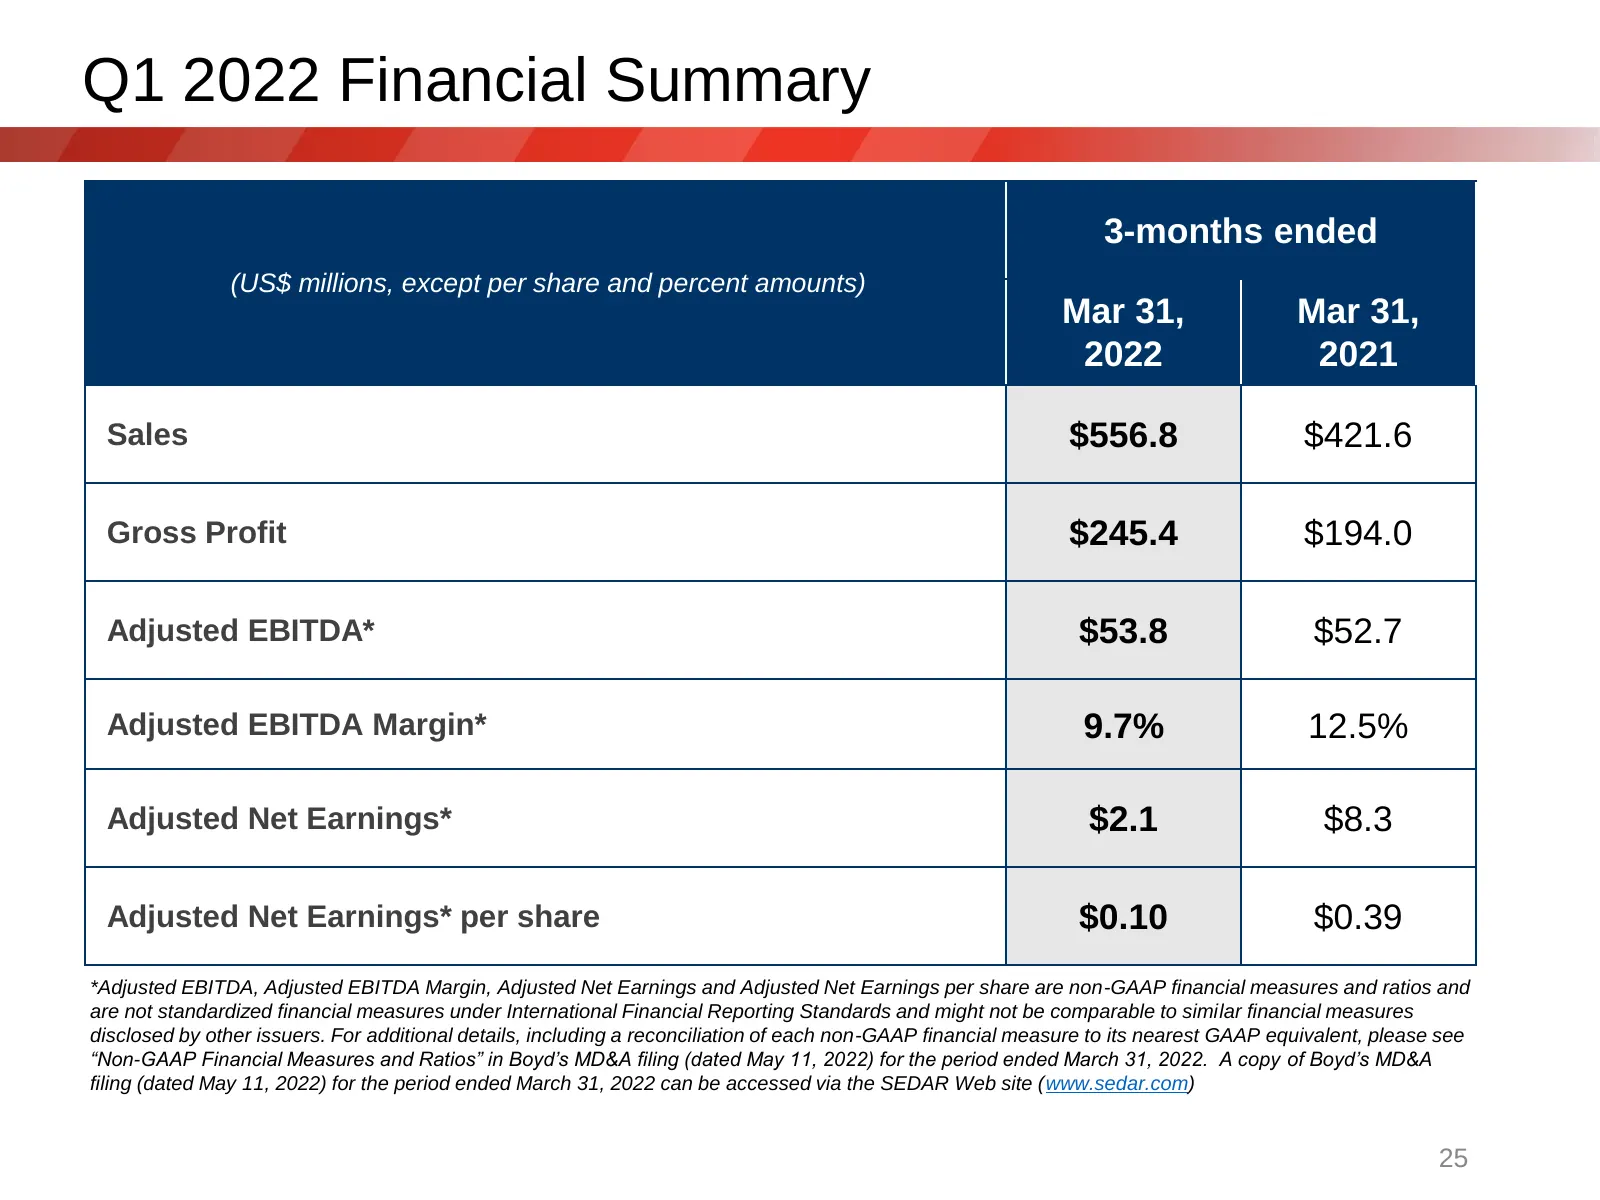
Slide 25: Q1 2022 Financial Summary
Q1 2022 Financial Summary 3-months ended (US$ millions, except per share and percent amounts) Mar 31, Mar 31, 2022 2021 Sales $556.8 $421.6 Gross Profit $245.4 $194.0 Adjusted EBITDA* $53.8 $52.7 Adjusted EBITDA Margin* 9.7% 12.5% Adjusted Net Earnings* $2.1 $8.3 Adjusted Net Earnings* per share $0.
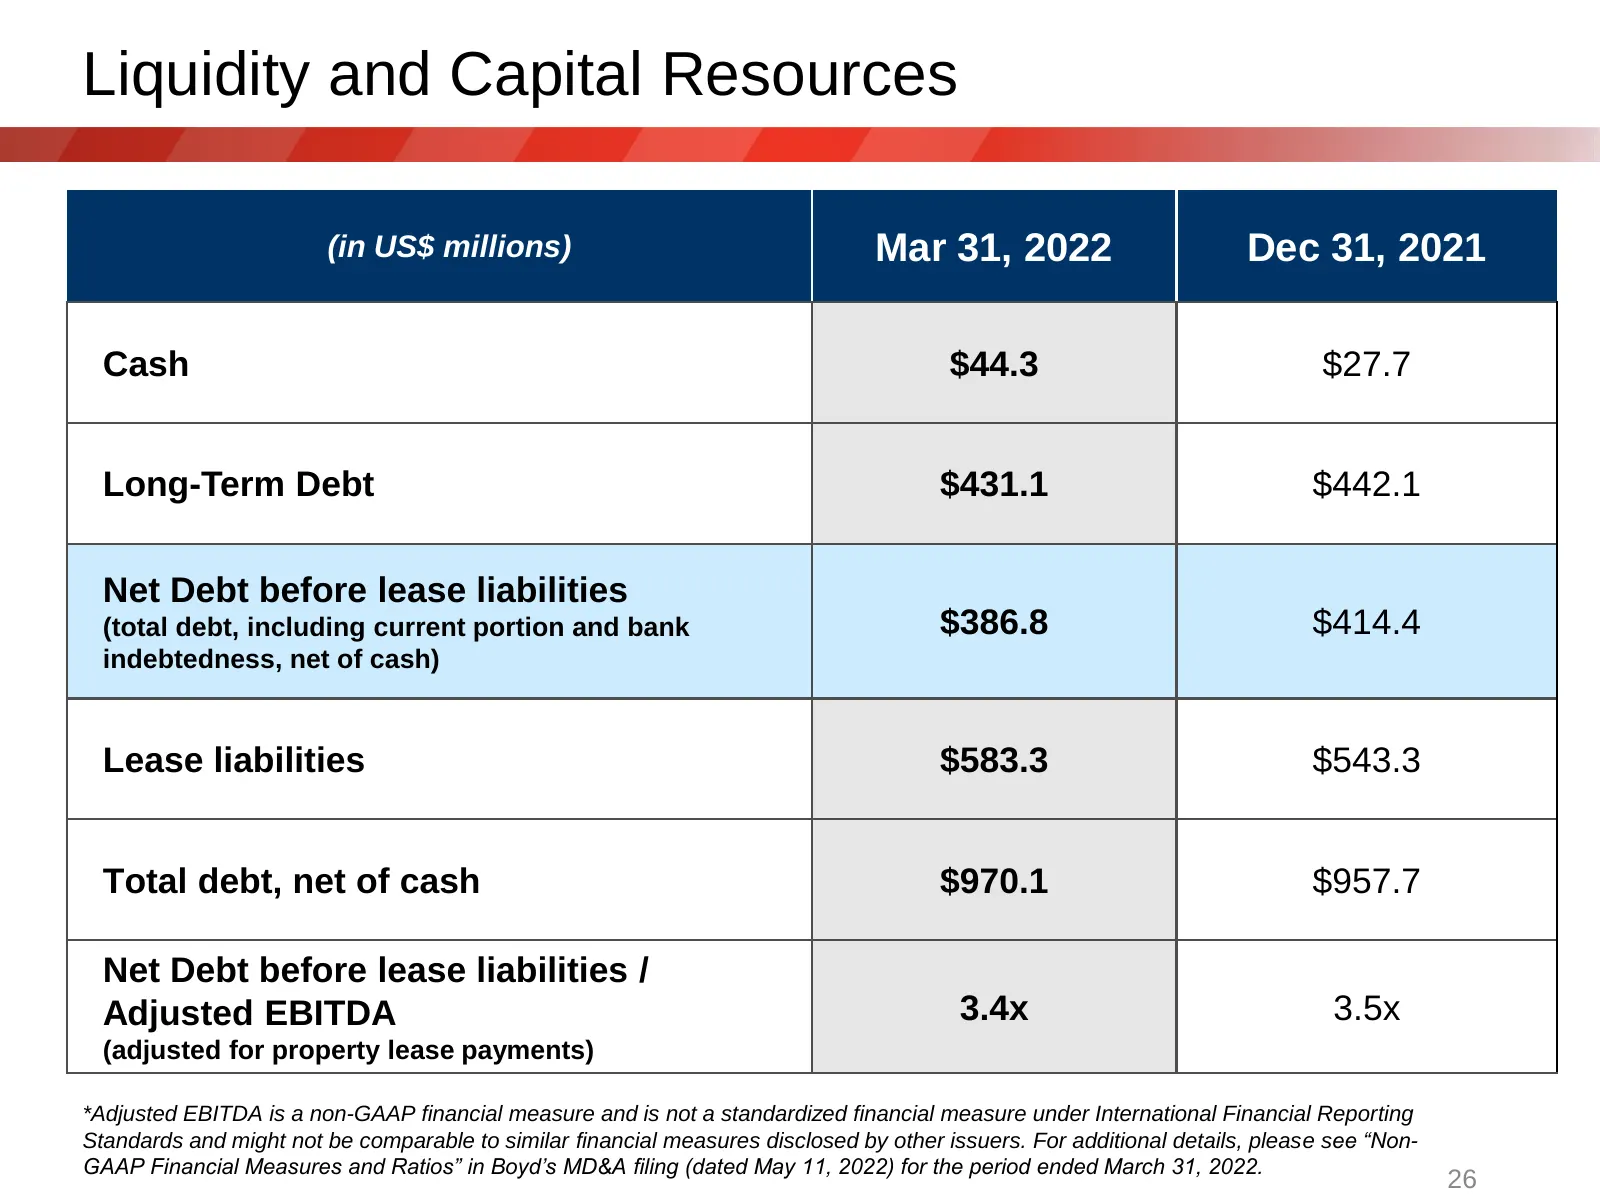
Slide 26: Liquidity and Capital Resources
Liquidity and Capital Resources (in US$ millions) Mar 31, 2022 Dec 31, 2021 Cash $44.3 $27.7 Long-Term Debt $431.1 $442.1 Net Debt before lease liabilities (total debt, including current portion and bank $386.8 $414.4 indebtedness, net of cash) Lease liabilities $583.3 $543.3 Total debt, net of cash
Slide 27: Financial Flexibility
Financial Flexibility • Cash of US$44.3 million • Net Debt to EBITDA TTM ratio of 3.4x • Over US$500 million in cash and available credit, subject to EBITDA performance • Only public company in the industry: access to all capital markets *Adjusted EBITDA is a non-GAAP financial measure and is not a
Slide 28: Dividends
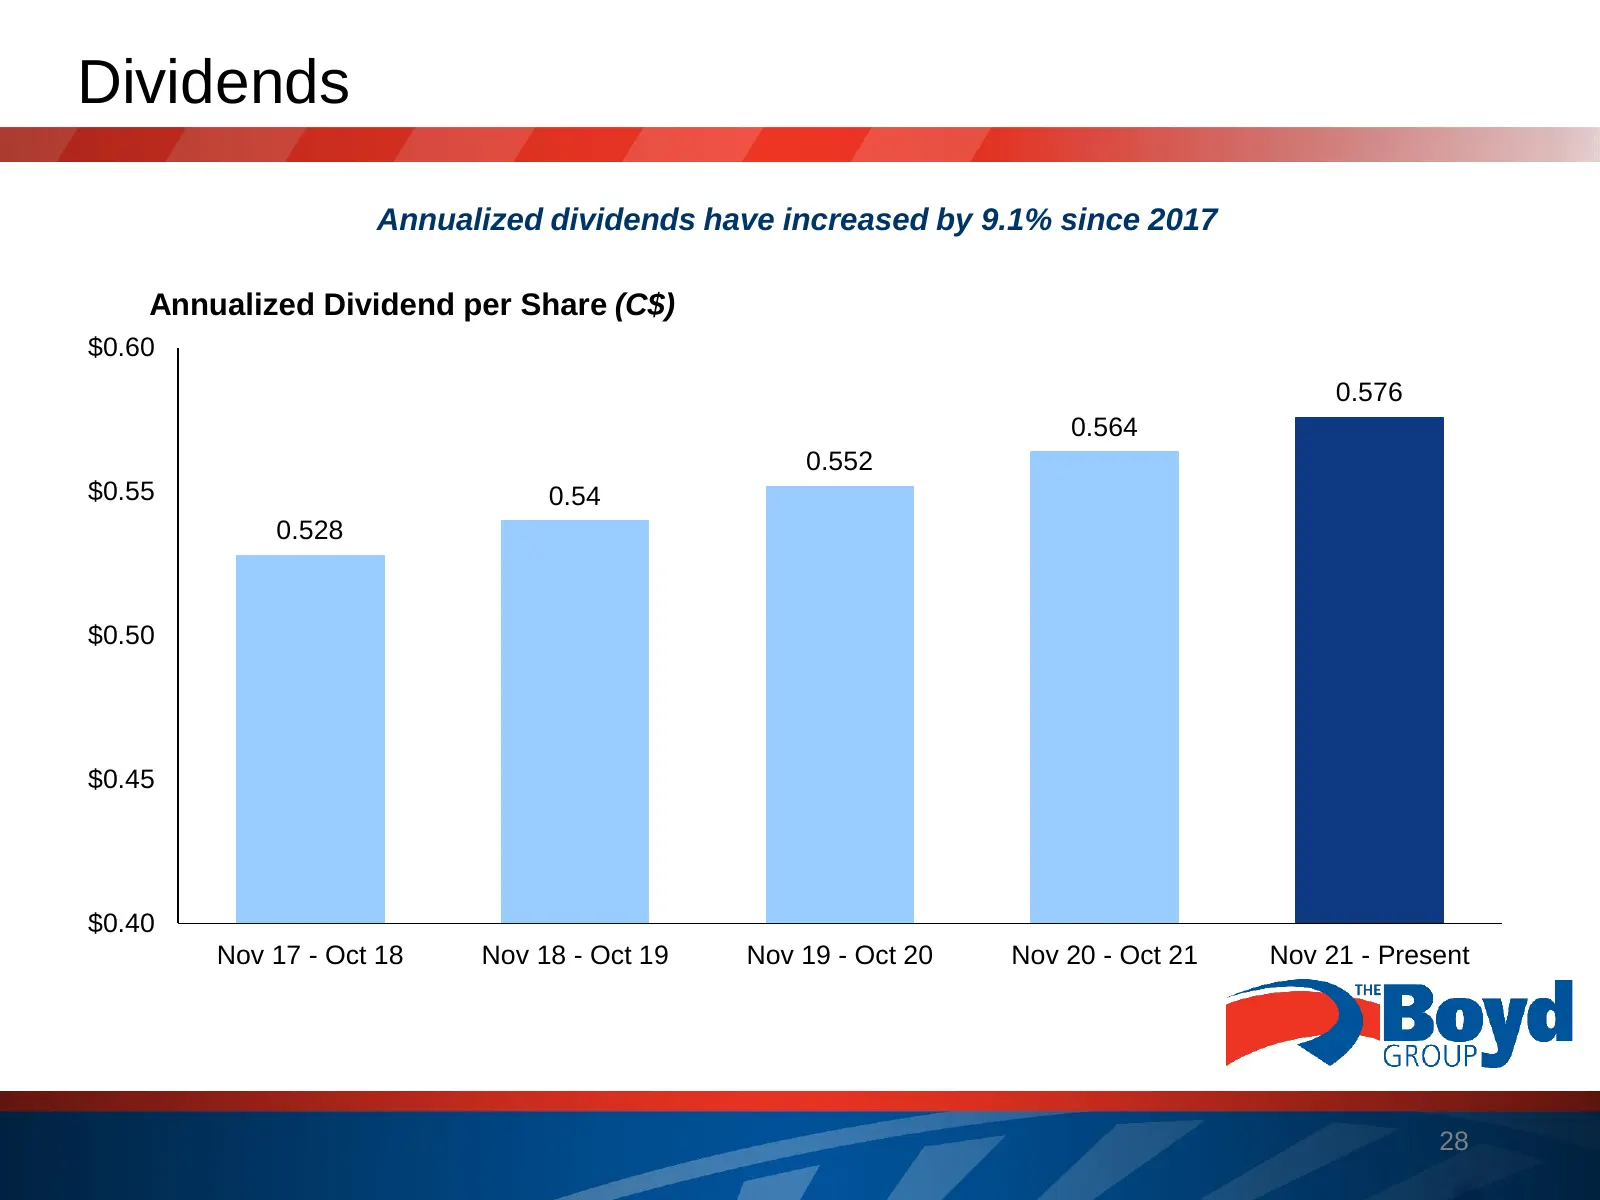
Dividends Annualized dividends have increased by 9.1% since 2017 Annualized Dividend per Share (C$) $0.60 0.576 0.564 0.552 $0.55 0.54 0.528 $0.50 $0.45 $0.40 Nov 17 - Oct 18 Nov 18 - Oct 19 Nov 19 - Oct 20 Nov 20 - Oct 21 Nov 21 - Present 28
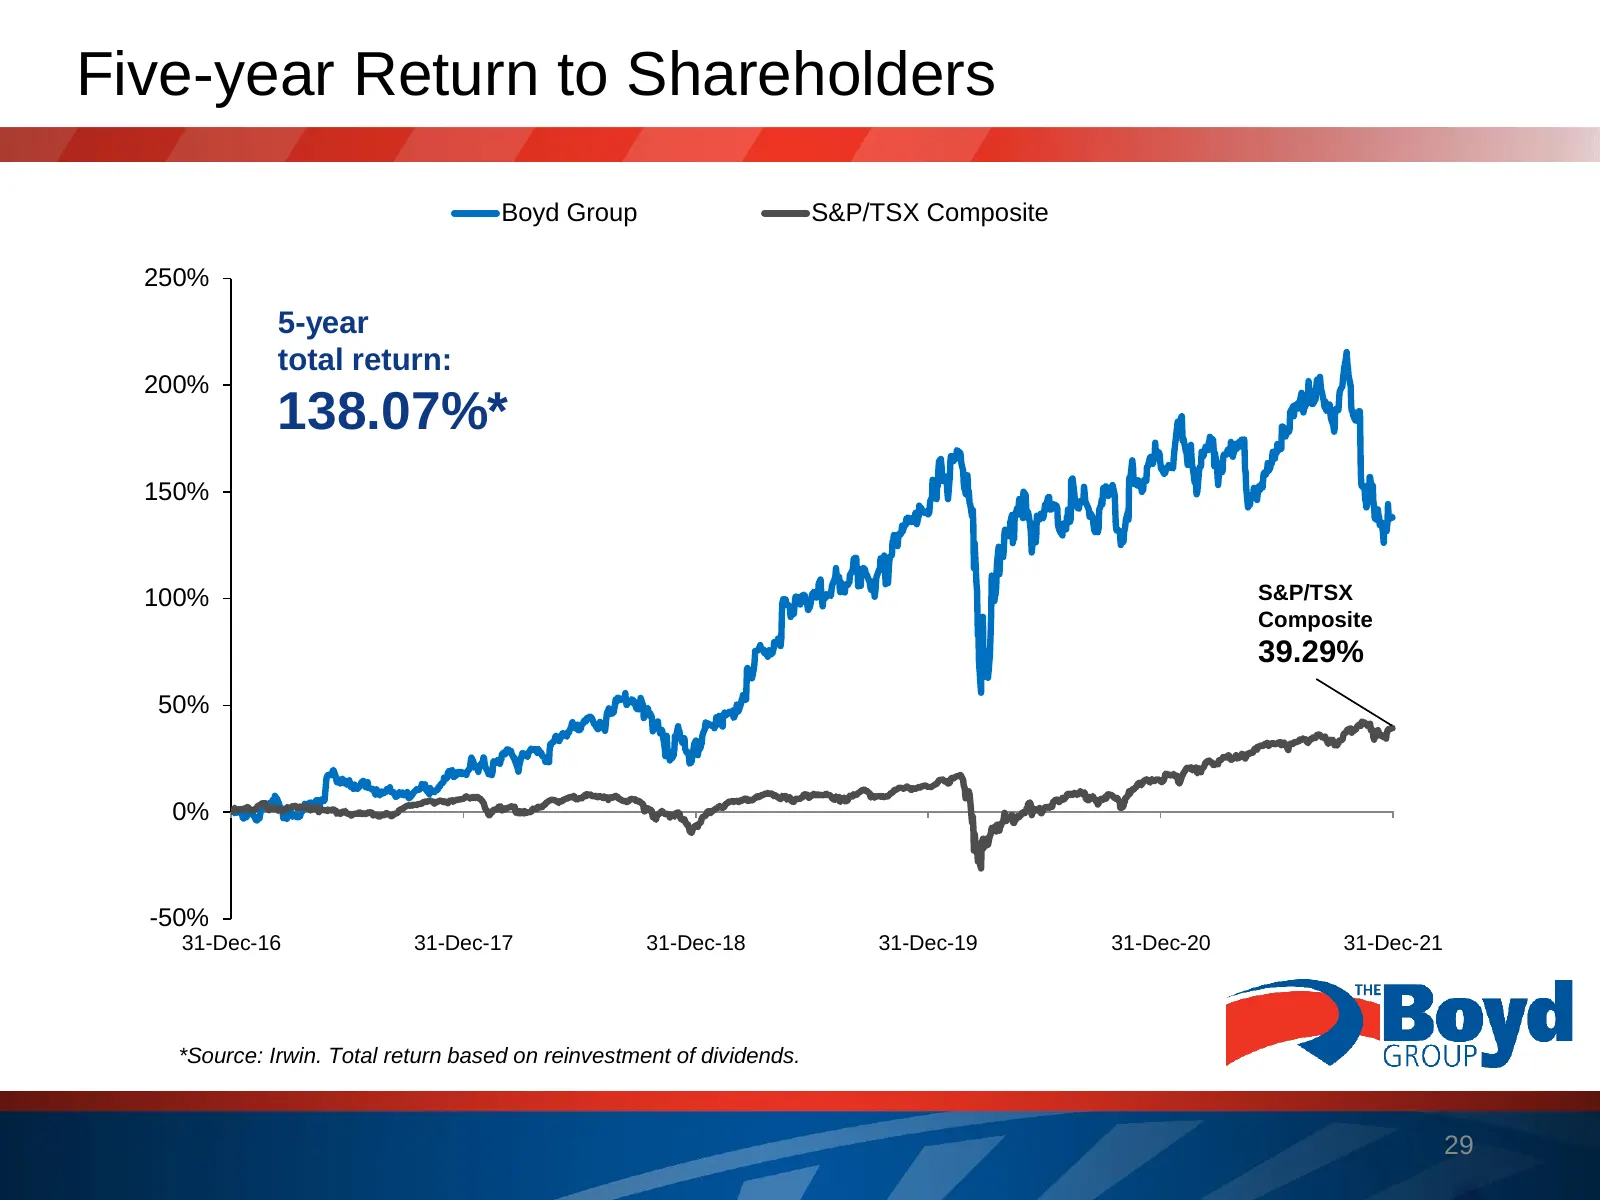
Slide 29: Five-year Return to Shareholders
Five-year Return to Shareholders Boyd Group S&P/TSX Composite 250% 5-year total return: 200% 138.07%* 150% 100% S&P/TSX Composite 39.29% 50% 0% -50% 31-Dec-16 31-Dec-17 31-Dec-18 31-Dec-19 31-Dec-20 31-Dec-21 *Source: Irwin. Total return based on reinvestment of dividends. 29
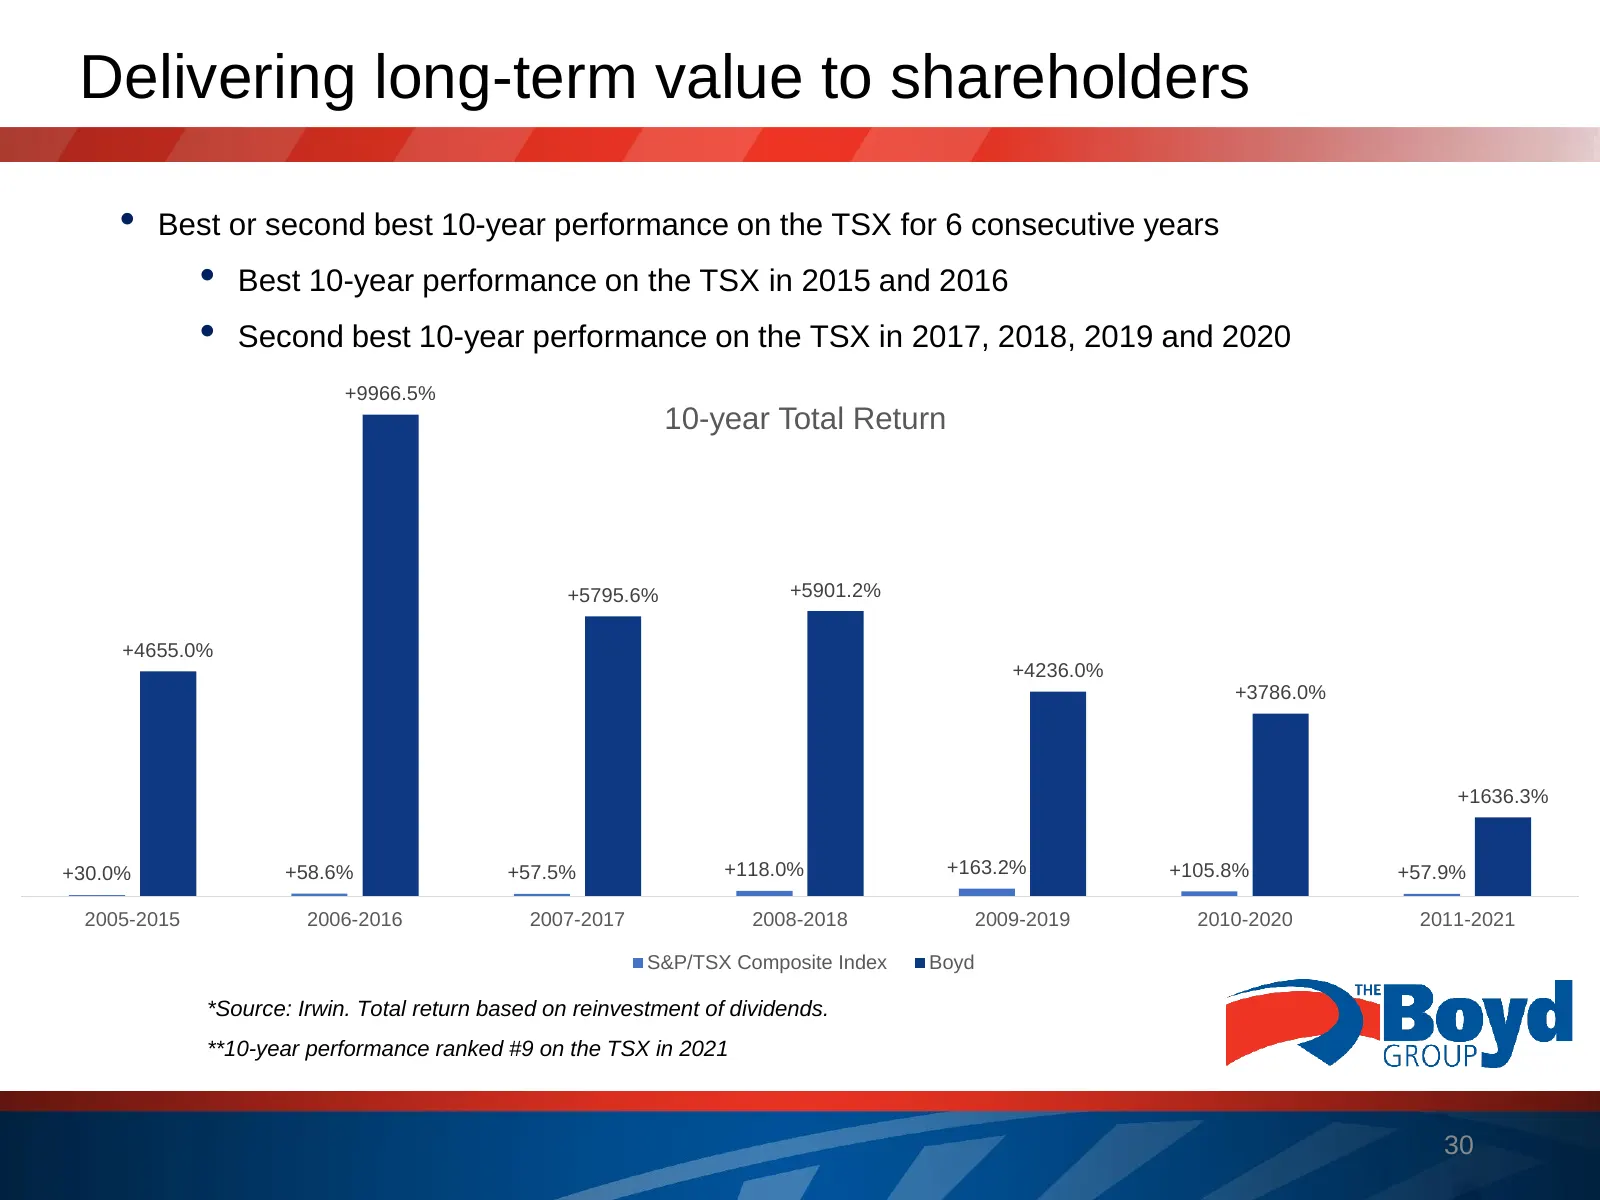
Slide 30: Delivering long-term value to shareholders
Delivering long-term value to shareholders • Best or second best 10-year performance on the TSX for 6 consecutive years • Best 10-year performance on the TSX in 2015 and 2016 • Second best 10-year performance on the TSX in 2017, 2018, 2019 and 2020 +9966.5% 10-year Total Return +5795.6% +5901.2% +46
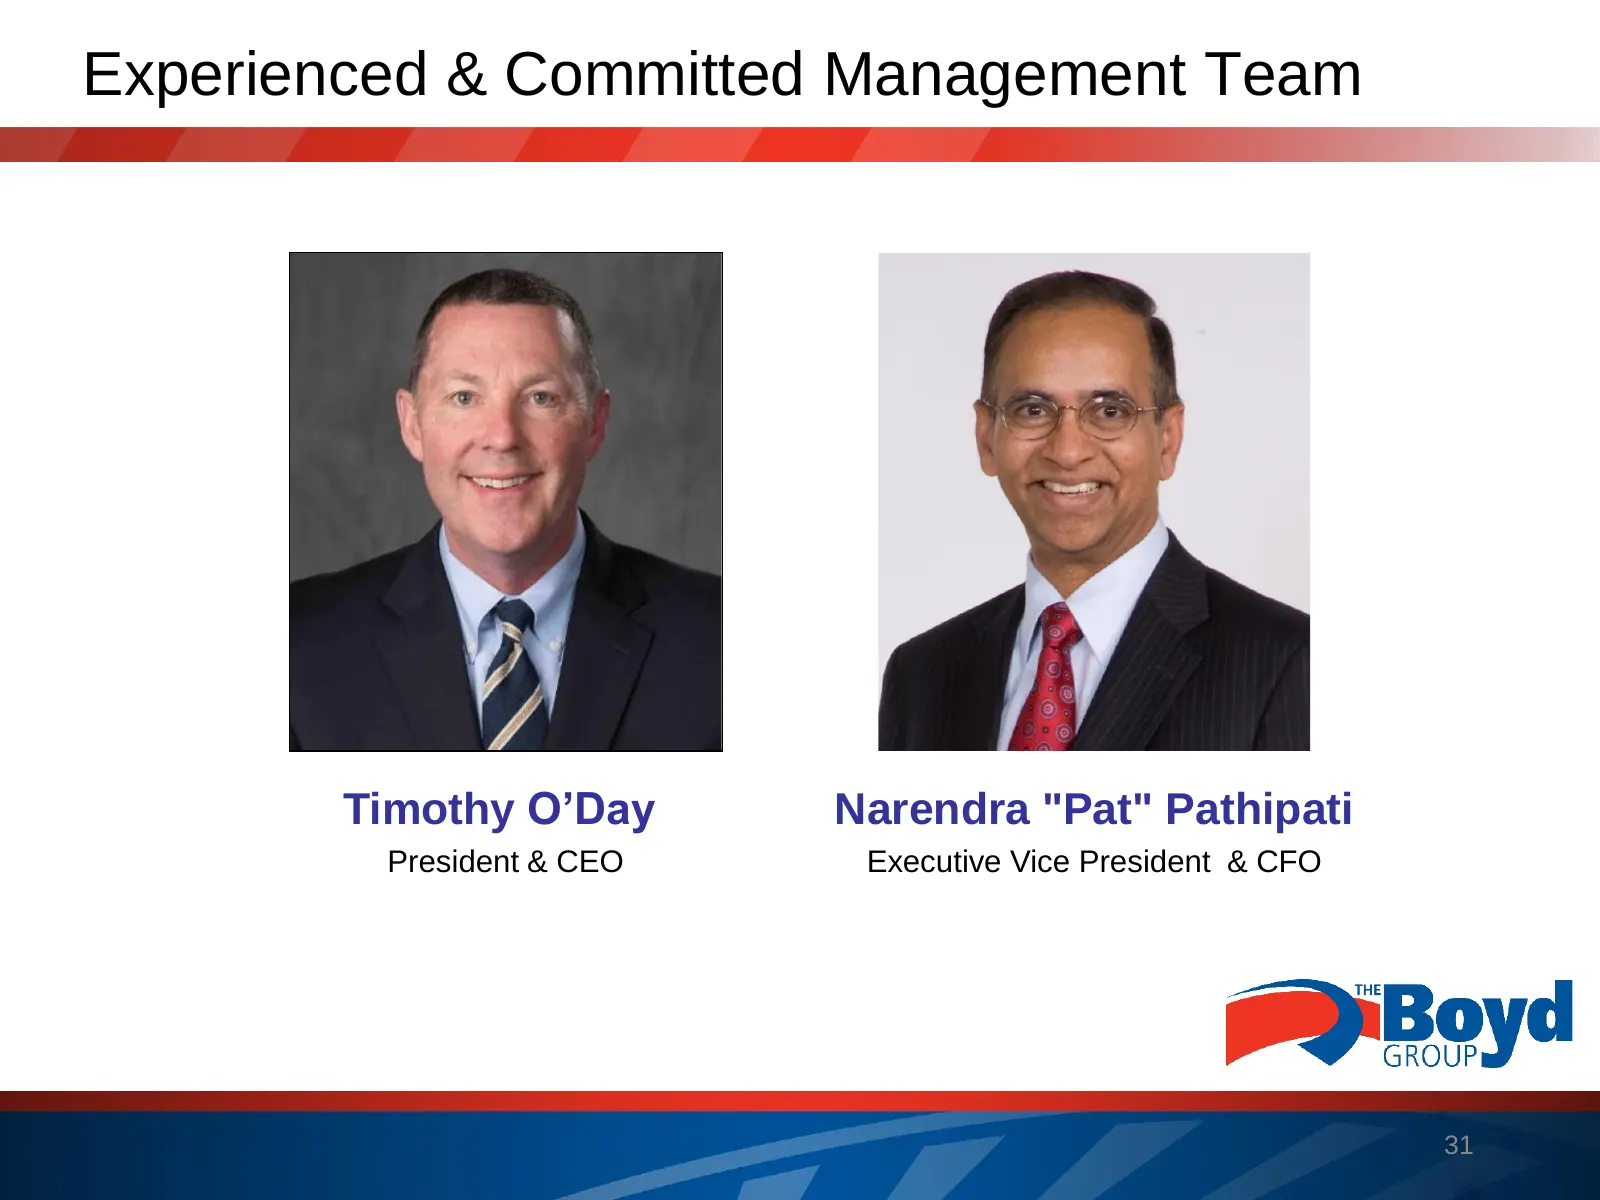
Slide 31: Experienced & Committed Management Team
Experienced & Committed Management Team Timothy O’Day Narendra "Pat" Pathipati President & CEO Executive Vice President & CFO 31
Slide 32: Outlook
Outlook • Boyd has taken specific actions to address the sales and margin challenges, including: • Investing in and doubling our Technician Development Program • Increasing recruitment support staff to improve lead generation and follow-up • Proactively evaluating compensation levels and making appr
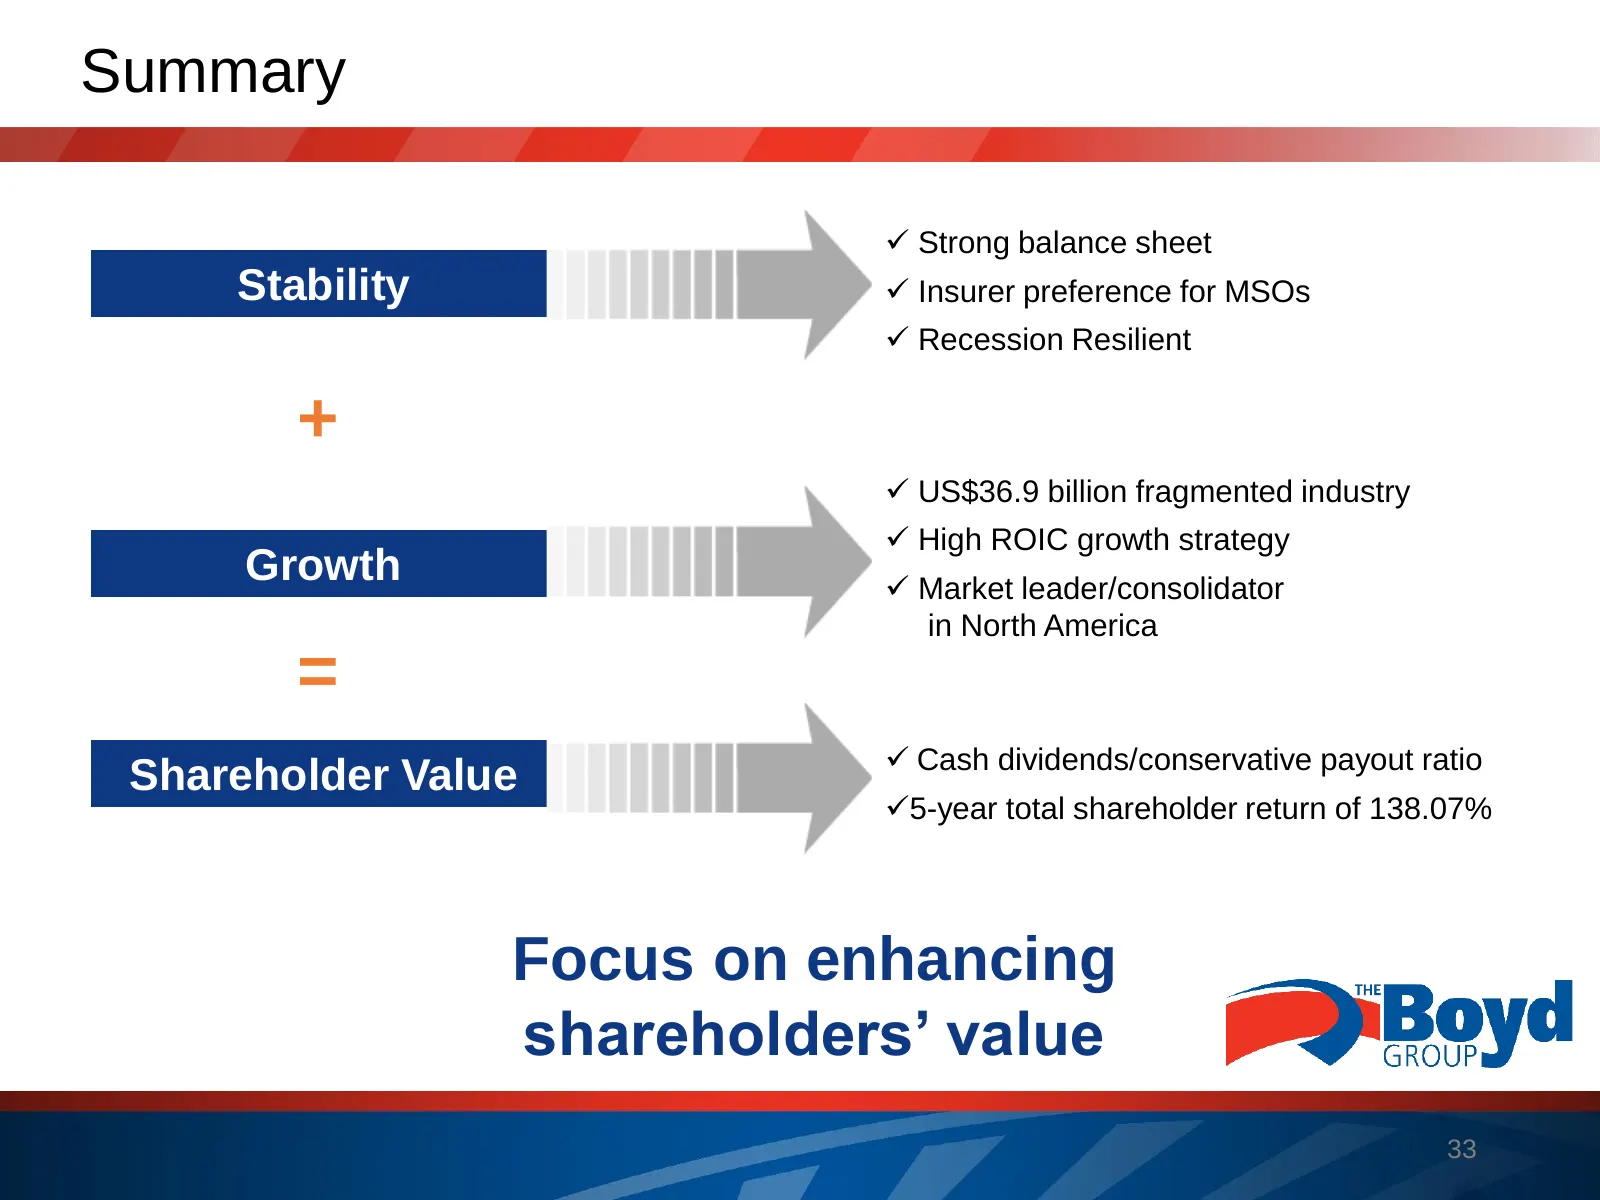
Slide 33: Summary
Summary ✓ Strong balance sheet Stability ✓ Insurer preference for MSOs ✓ Recession Resilient + ✓ US$36.9 billion fragmented industry ✓ High ROIC growth strategy Growth ✓ Market leader/consolidator in North America = ✓ Cash dividends/conservative payout ratio Shareholder Value ✓5-year total sharehold
Source: Internet Archive copy of boydgroup.com
More decks from Boyd Group Services Inc
 Investor Presentation (September 2026)28 slides · September 2026
 Q1 2026 Earnings Presentation24 slides · May 13, 2026
 Investor Presentation (May 2026)23 slides · May 2026
 Investor Presentation (February 2026)25 slides · February 2026
 Q1 2024 Earnings Presentation38 slides · May 2024
 Investor Presentation (January 2024)33 slides · January 2024