SGL Carbon SE · XETR:SGL
SGL Carbon — FY2019 Earnings Presentation
55 slides from SGL Carbon's earnings presentation, Mar 12, 2020
Slide 1: Year-end 2019 Analyst Conference
Year-end 2019 Analyst Conference Dr. Michael Majerus Spokesman of the Board of Management and CFO Frankfurt am Main, 12 March 2020 1 SGL Carbon | Investor Relations Presentation

Slide 2: Agenda
Agenda. 1. Review 2019 2. Detailed financials 2019 3. Outlook 2020 4. Forward strategy 5. New mid term plan 6. Summary 2 SGL Carbon | Investor Relations Presentation

Slide 3: 1 Review 2019
1 Review 2019 3 SGL Carbon | Investor Relations Presentation
Slide 4: Review fiscal year 2019. Light and Shadow
Review fiscal year 2019. Light and Shadow • Contrasting developments in the two business units • GMS with record sales and EBIT • Disappointing development in CFM albeit in businesses that have limited strategic significance in the medium term – €75m impairment charge recorded in Q3/2019 relating to
Slide 5: Review fiscal year 2019. Light and Shadow
Review fiscal year 2019. Light and Shadow • Financial performance masks strategic advances in key markets Automotive and Aerospace − GMS: growth in key strategic markets and fuel cell components as new growth driver in Battery & other Energy − CFM: globalization of business model through new orders
Slide 6: 2 Detailed financials 2019
2 Detailed financials 2019 6 SGL Carbon | Investor Relations Presentation
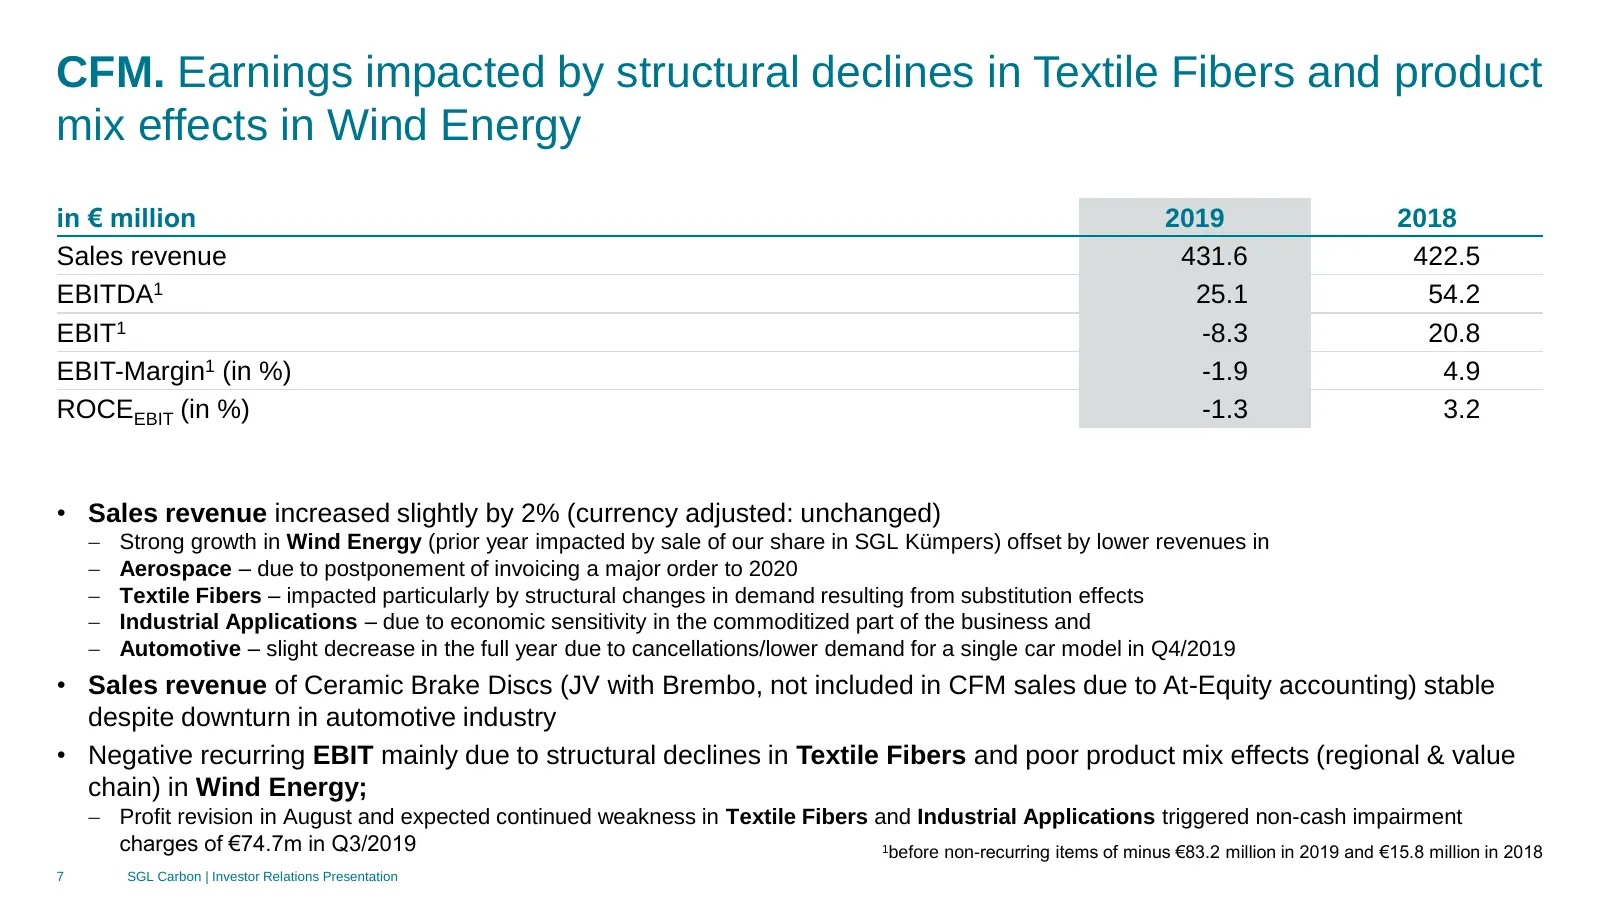
Slide 7: CFM. Earnings impacted by structural declines in Textile Fibers
CFM. Earnings impacted by structural declines in Textile Fibers and product mix effects in Wind Energy in € million 2019 2018 Sales revenue 431.6 422.5 EBITDA1 25.1 54.2 EBIT1 -8.3 20.8 EBIT-Margin1 (in %) -1.9 4.9 ROCEEBIT (in %) -1.3 3.2 • Sales revenue increased slightly by 2% (currency adjusted:
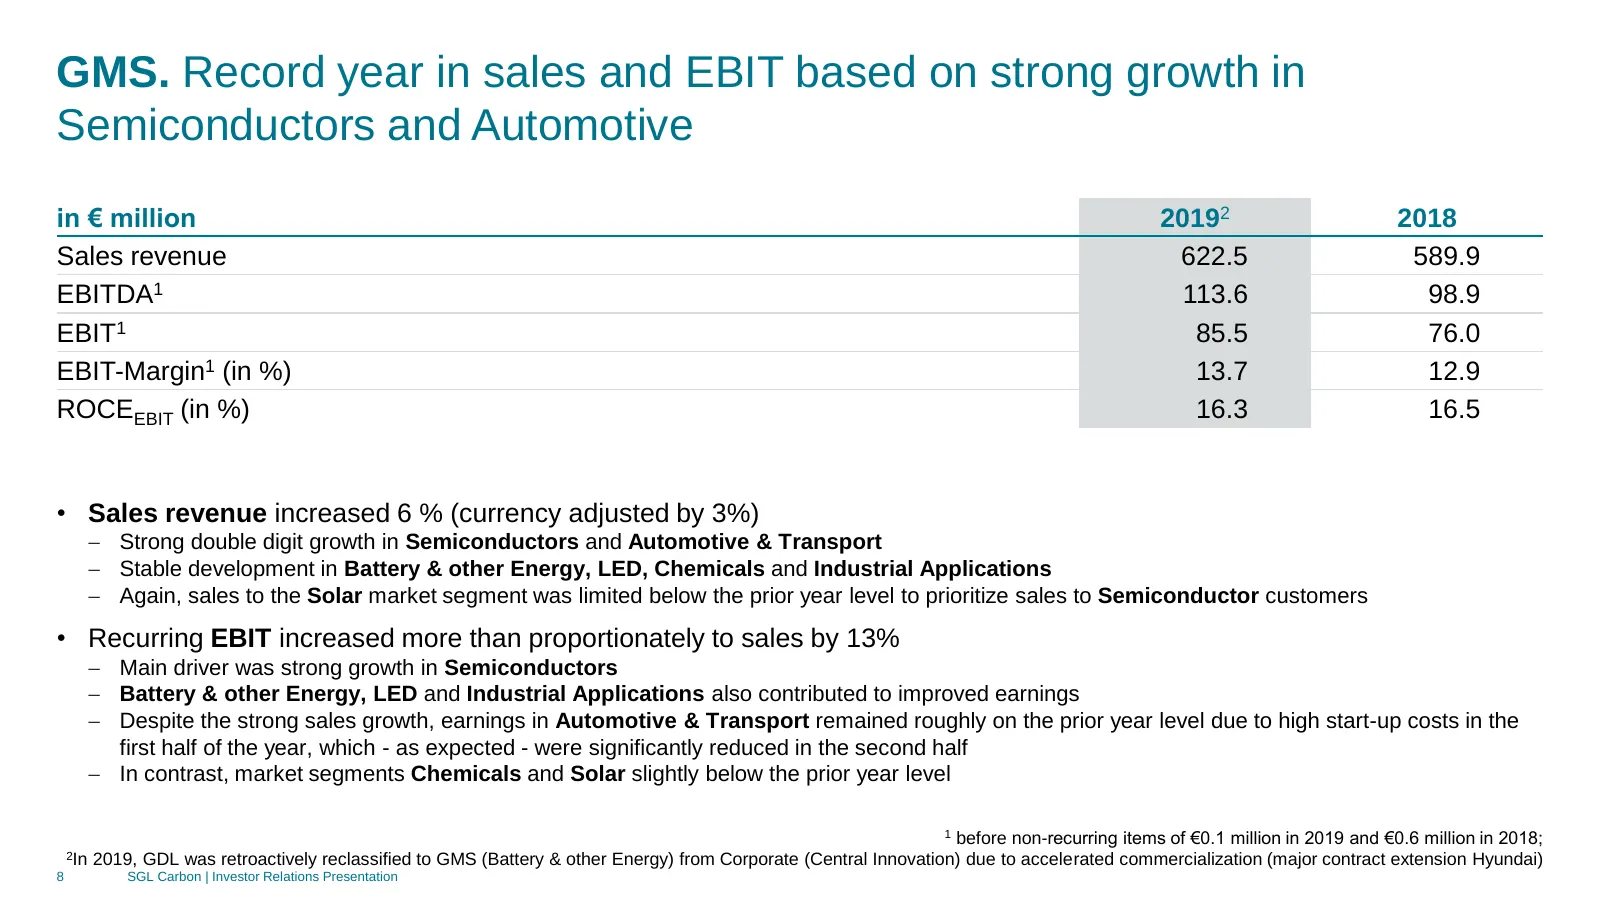
Slide 8: GMS. Record year in sales and EBIT
GMS. Record year in sales and EBIT based on strong growth in Semiconductors and Automotive in € million 20192 2018 Sales revenue 622.5 589.9 EBITDA1 113.6 98.9 EBIT1 85.5 76.0 EBIT-Margin1 (in %) 13.7 12.9 ROCEEBIT (in %) 16.3 16.5 • Sales revenue increased 6 % (currency adjusted by 3%) − Strong dou
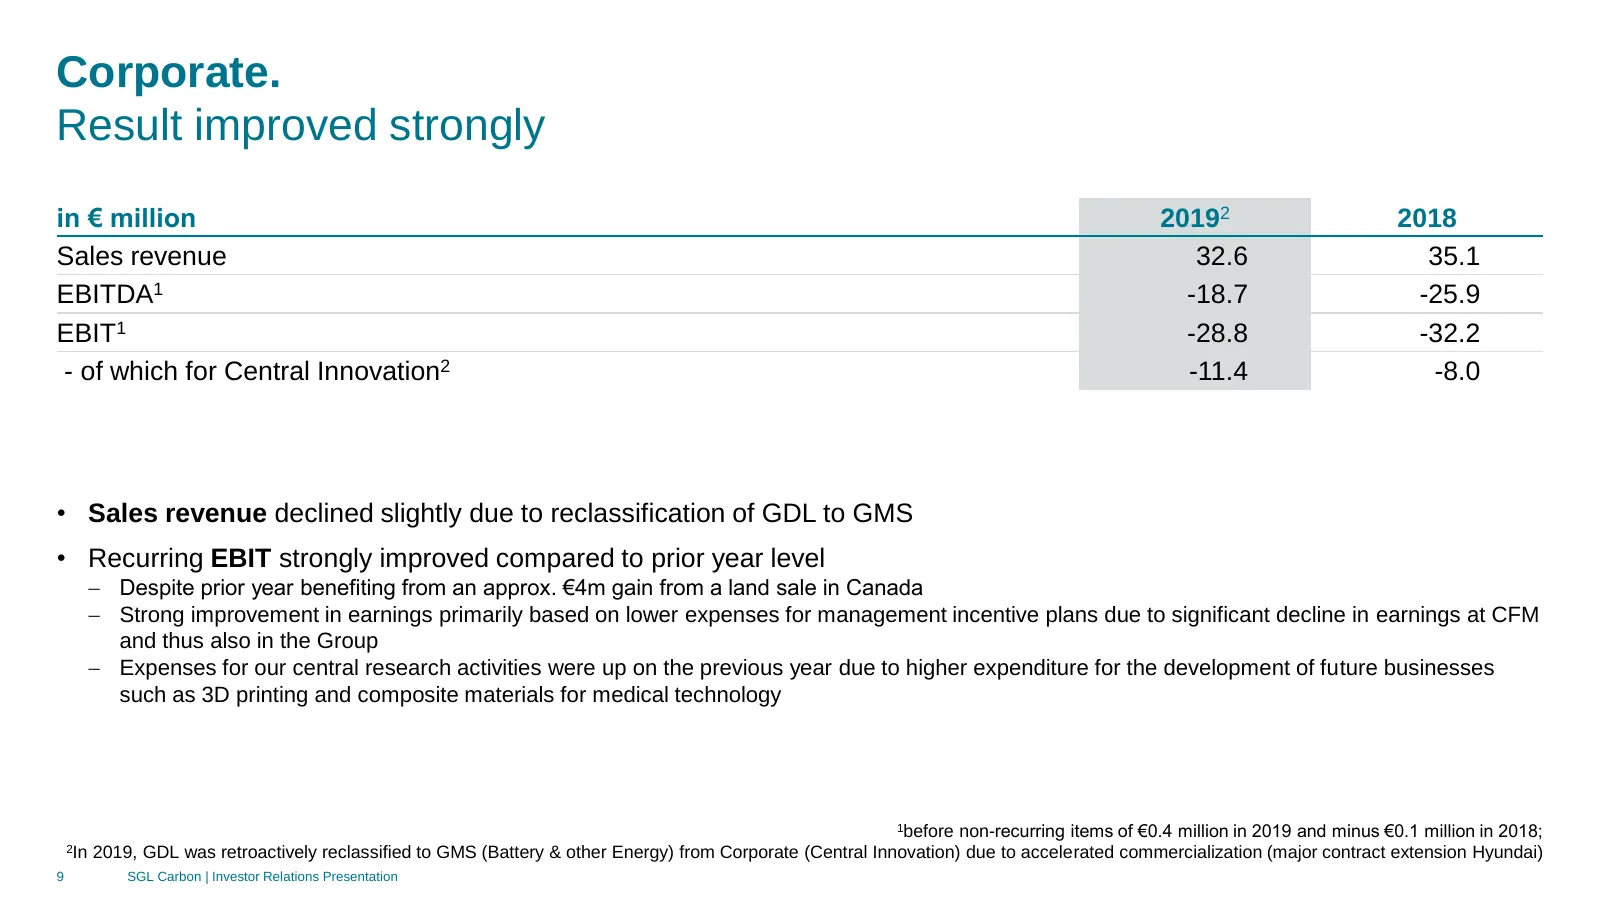
Slide 9: Corporate. Result improved strongly
Corporate. Result improved strongly in € million 20192 2018 Sales revenue 32.6 35.1 EBITDA1 -18.7 -25.9 EBIT1 -28.8 -32.2 - of which for Central Innovation2 -11.4 -8.0 • Sales revenue declined slightly due to reclassification of GDL to GMS • Recurring EBIT strongly improved compared to prior year le
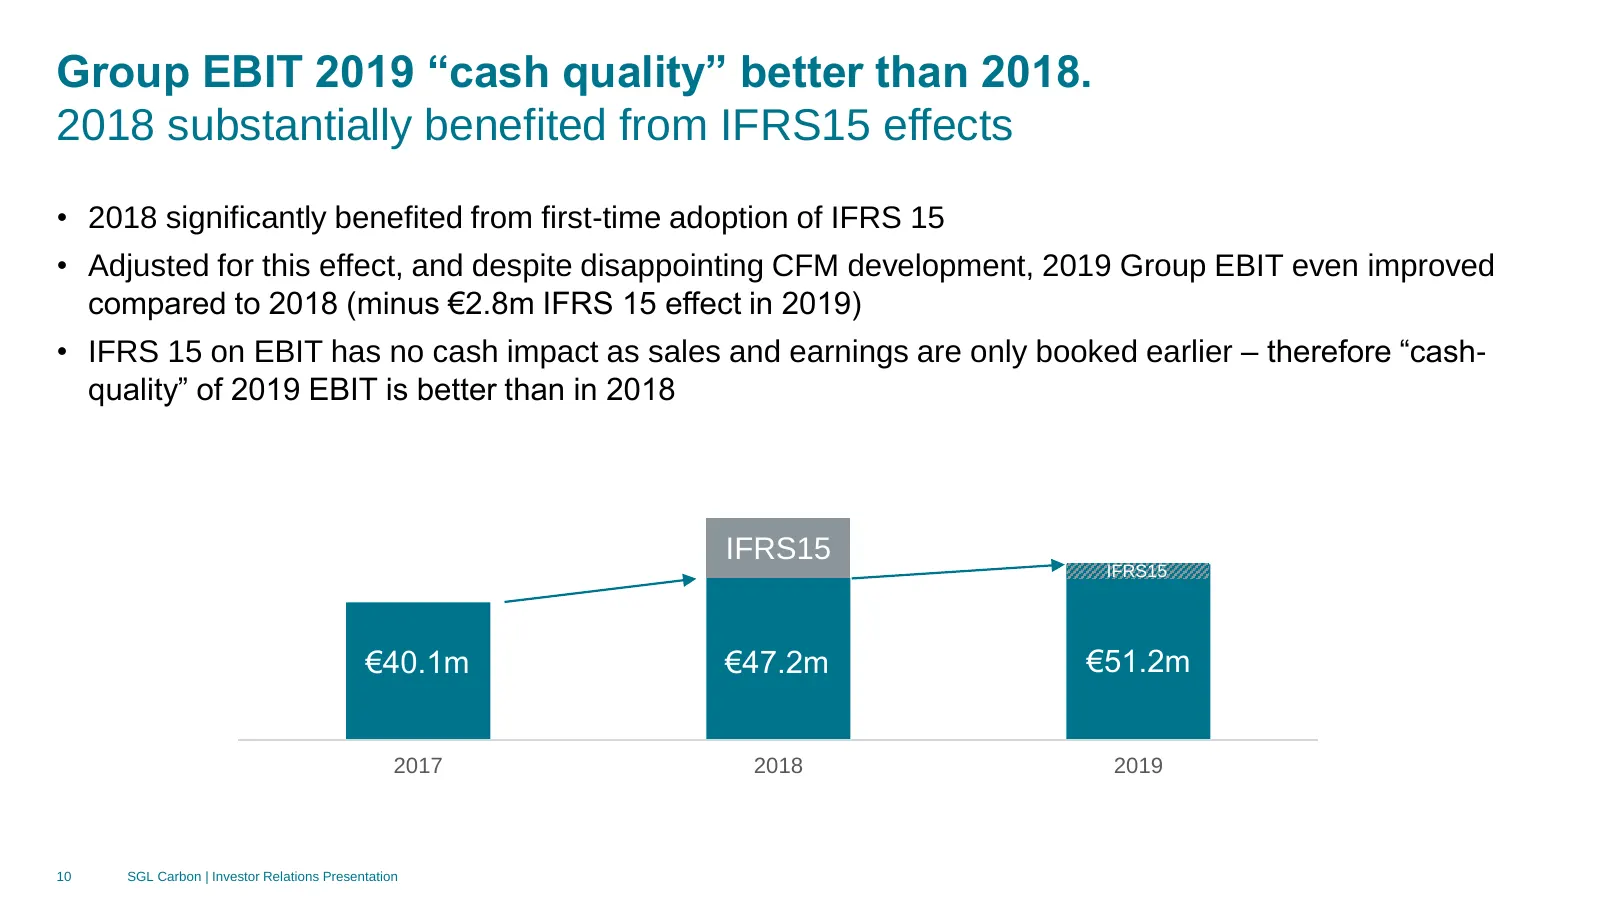
Slide 10: Group EBIT 2019 cash quality better than 2018
Group EBIT 2019 “cash quality” better than 2018. 2018 substantially benefited from IFRS15 effects • 2018 significantly benefited from first-time adoption of IFRS 15 • Adjusted for this effect, and despite disappointing CFM development, 2019 Group EBIT even improved compared to 2018 (minus €2.8m IFRS
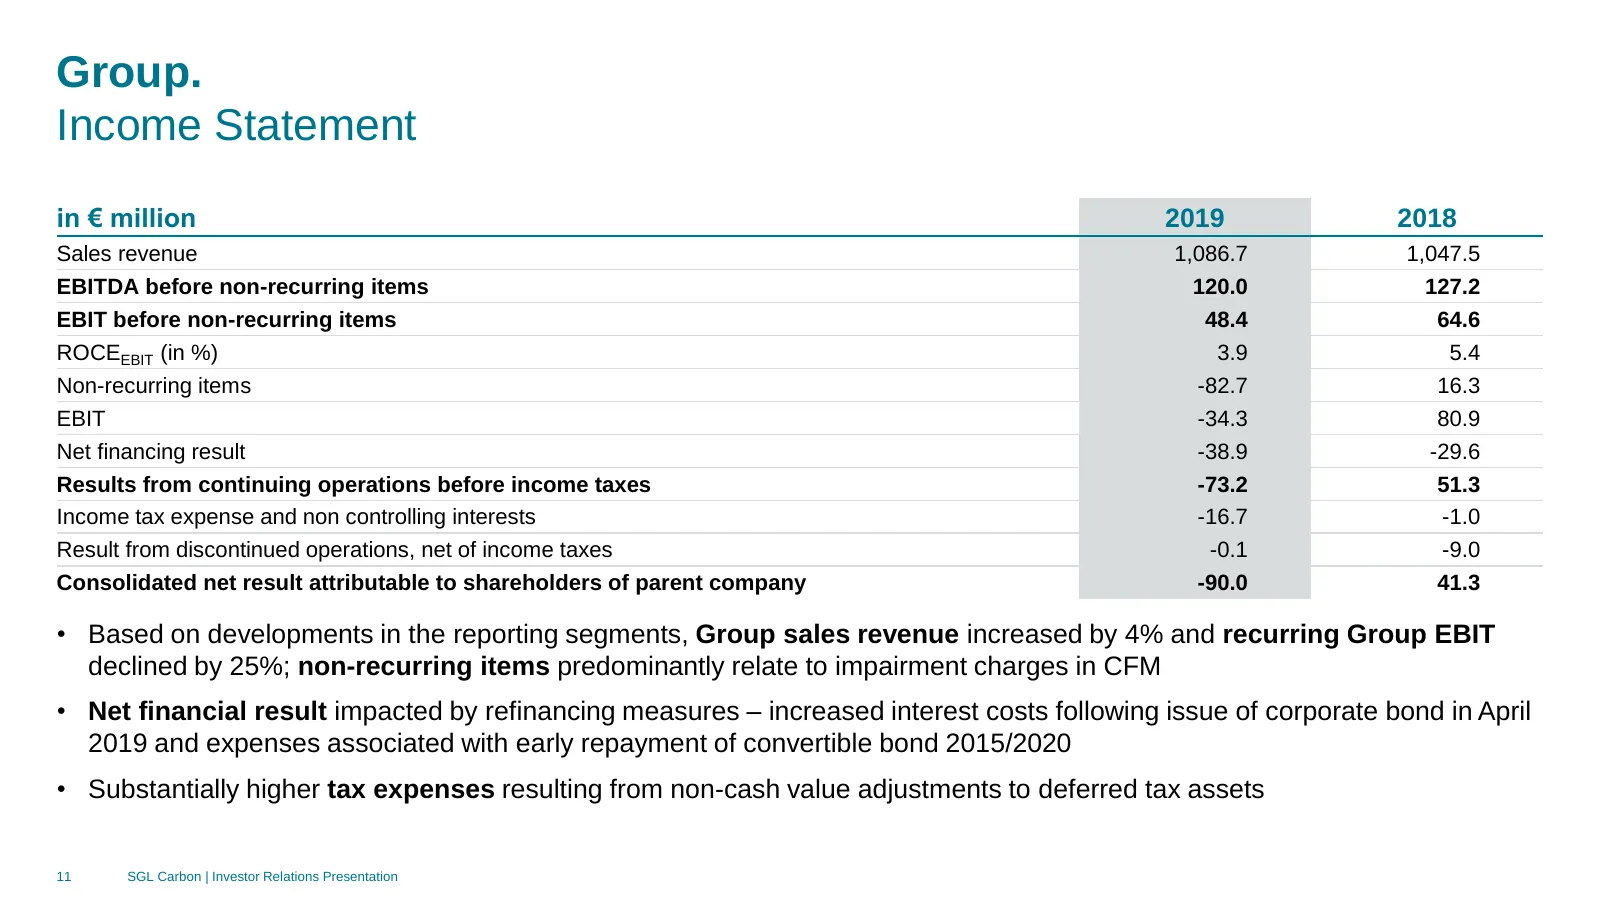
Slide 11: Group. Income Statement
Group. Income Statement in € million 2019 2018 Sales revenue 1,086.7 1,047.5 EBITDA before non-recurring items 120.0 127.2 EBIT before non-recurring items 48.4 64.6 ROCEEBIT (in %) 3.9 5.4 Non-recurring items -82.7 16.3 EBIT -34.3 80.9 Net financing result -38.9 -29.6 Results from continuing operati
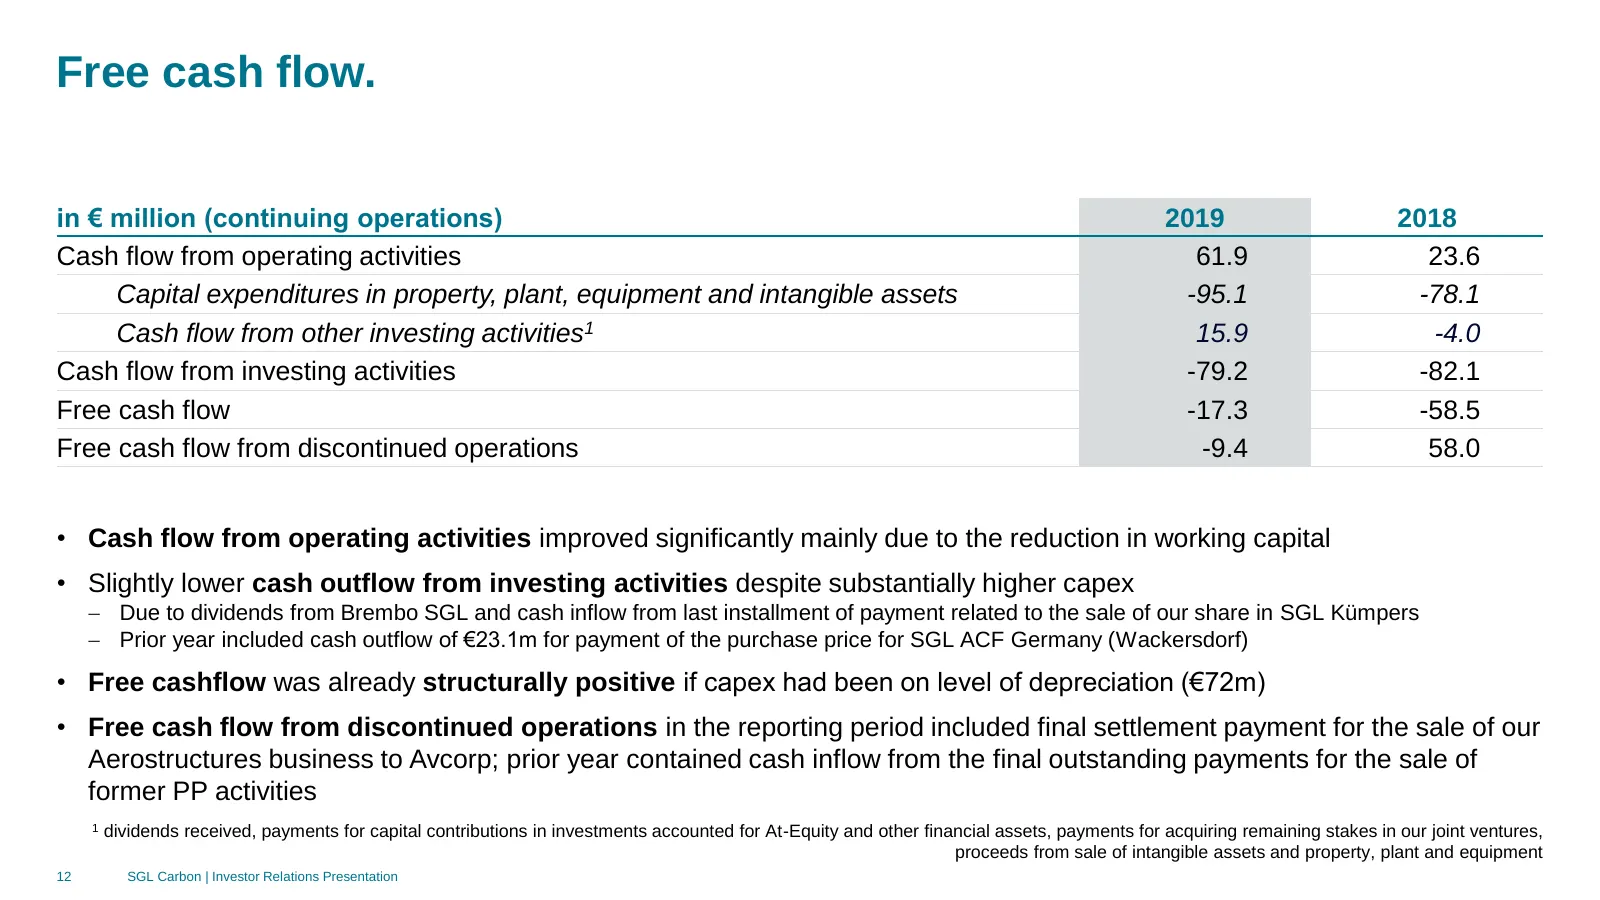
Slide 12: Free cash flow
Free cash flow. in € million (continuing operations) 2019 2018 Cash flow from operating activities 61.9 23.6 Capital expenditures in property, plant, equipment and intangible assets -95.1 -78.1 Cash flow from other investing activities1 15.9 -4.0 Cash flow from investing activities -79.2 -82.1 Free
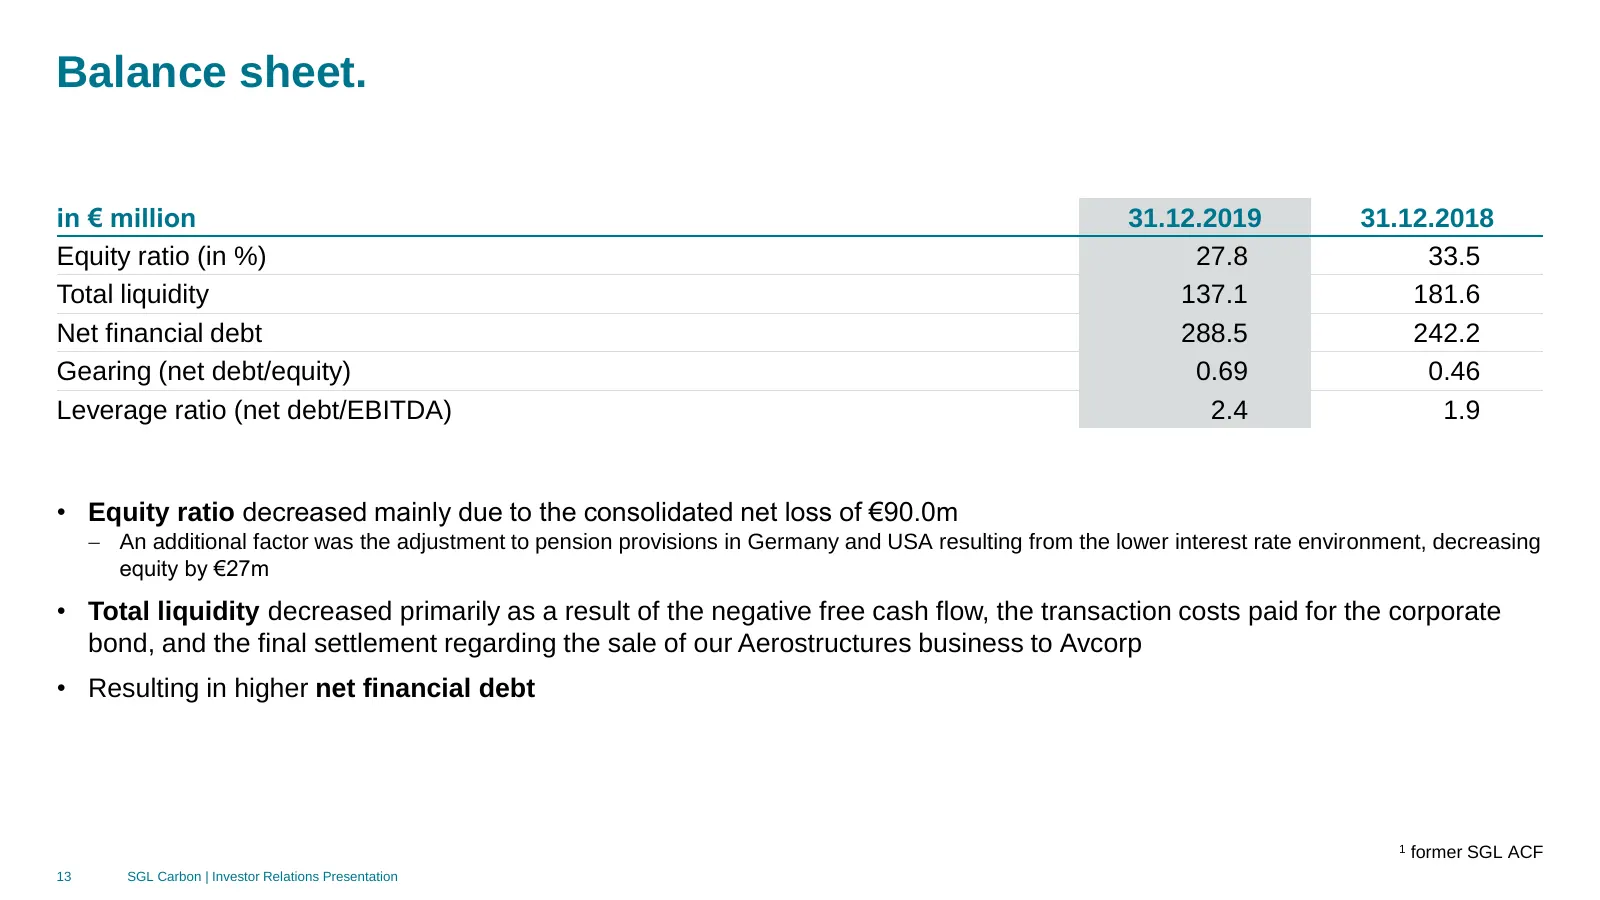
Slide 13: Balance sheet
Balance sheet. in € million 31.12.2019 31.12.2018 Equity ratio (in %) 27.8 33.5 Total liquidity 137.1 181.6 Net financial debt 288.5 242.2 Gearing (net debt/equity) 0.69 0.46 Leverage ratio (net debt/EBITDA) 2.4 1.9 • Equity ratio decreased mainly due to the consolidated net loss of €90.0m − An addi

Slide 14: 3 Outlook 2020
3 Outlook 2020 14 SGL Carbon | Investor Relations Presentation
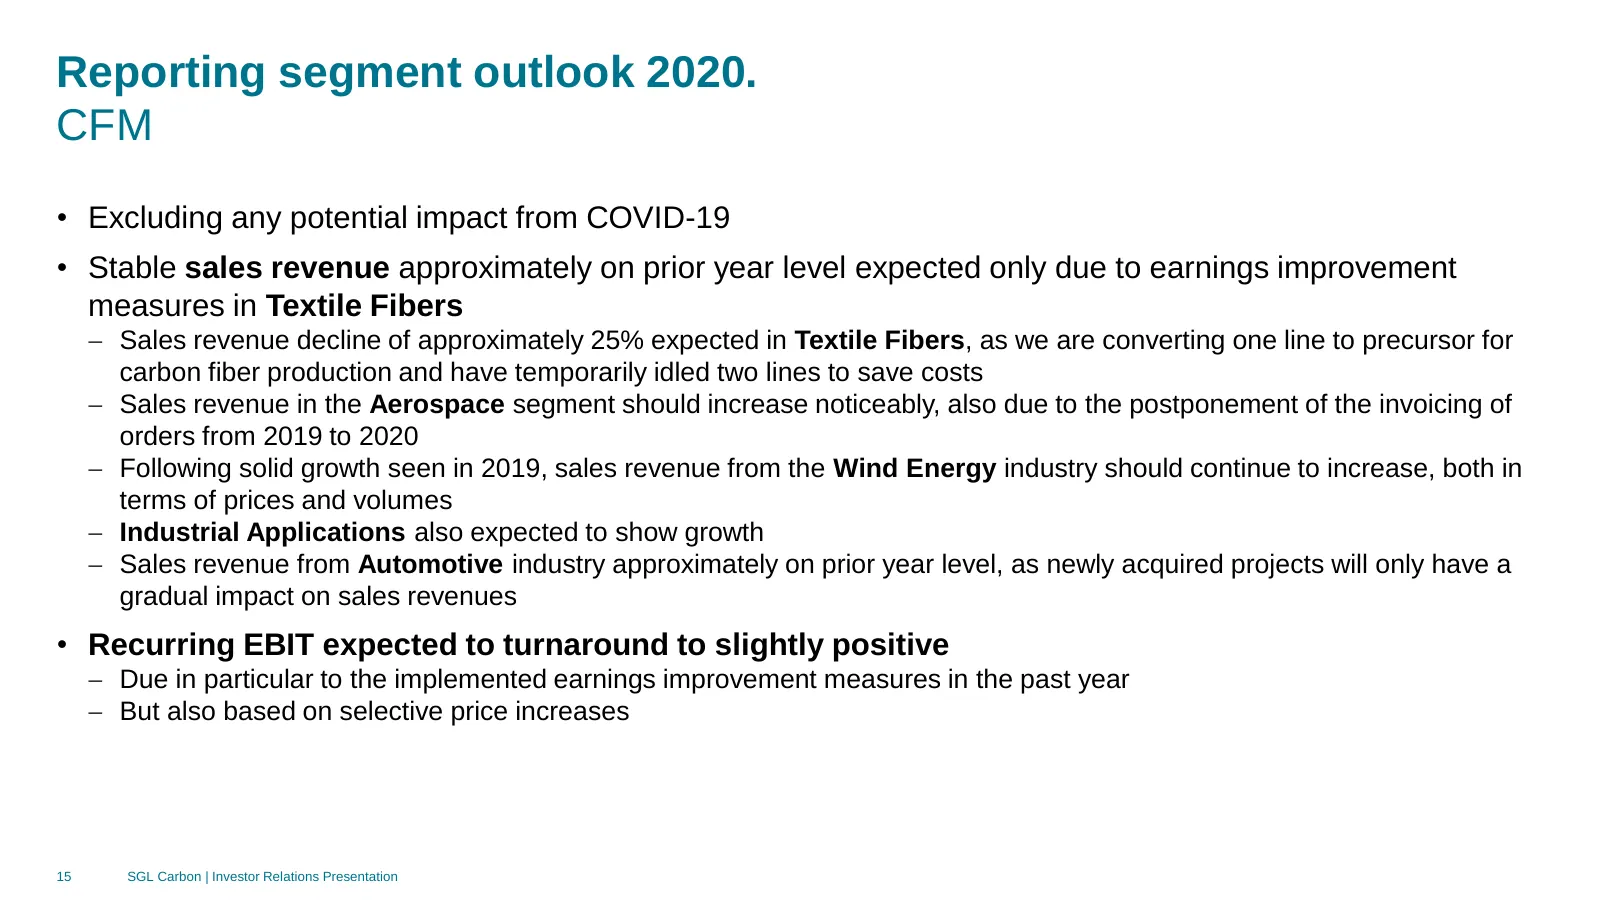
Slide 15: Reporting segment outlook 2020. CFM
Reporting segment outlook 2020. CFM • Excluding any potential impact from COVID-19 • Stable sales revenue approximately on prior year level expected only due to earnings improvement measures in Textile Fibers − Sales revenue decline of approximately 25% expected in Textile Fibers, as we are converti
Slide 16: Reporting segment outlook 2020. GMS
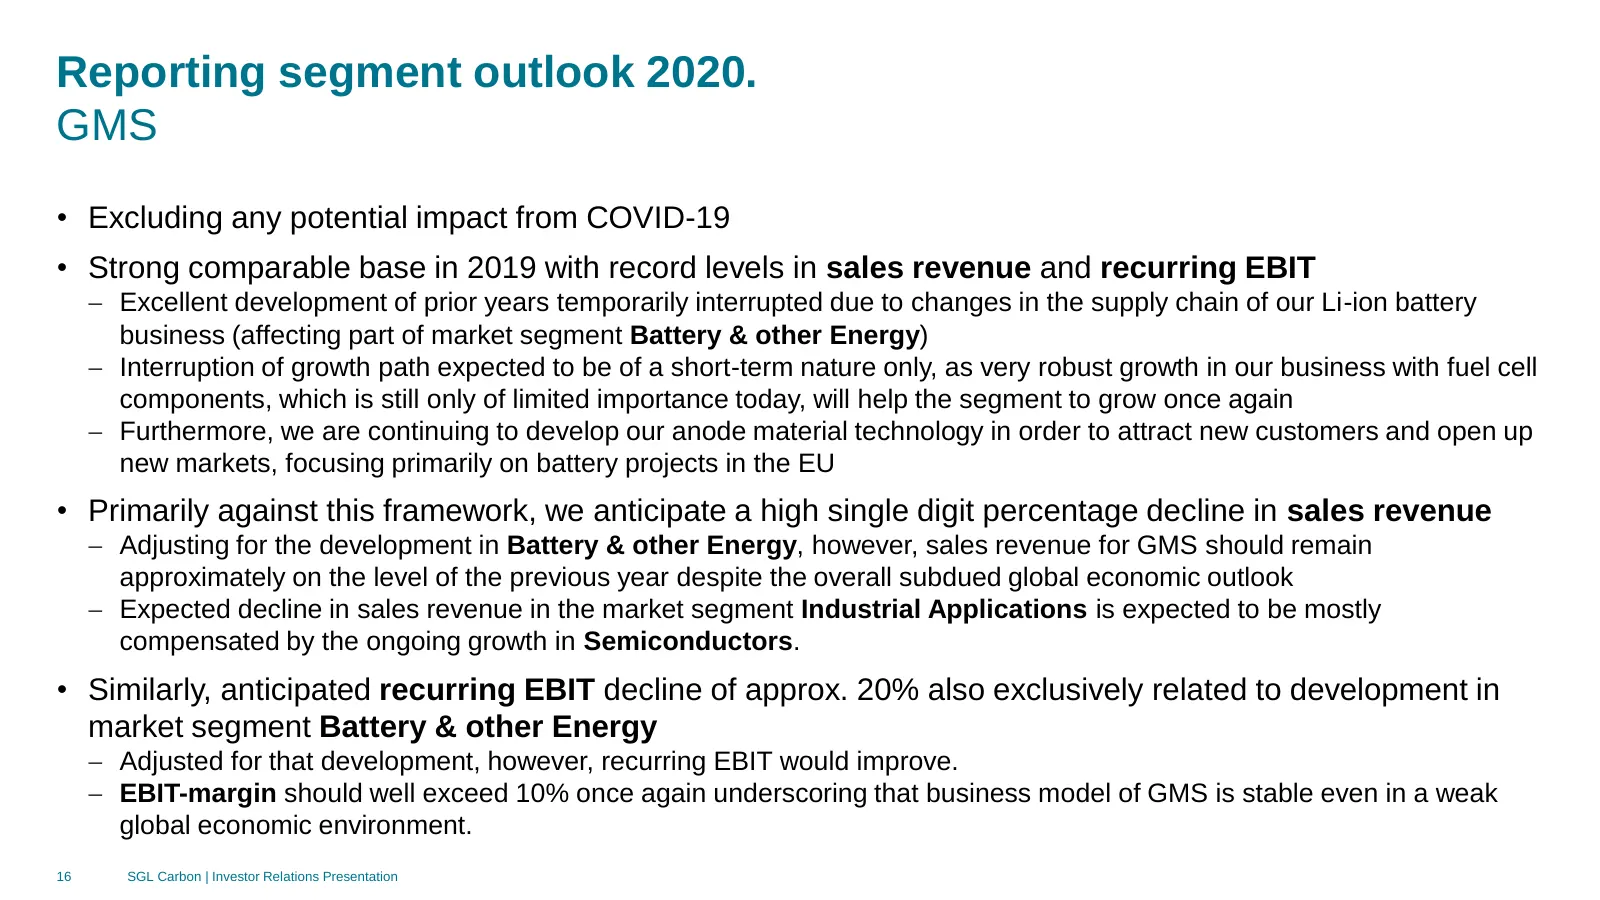
Reporting segment outlook 2020. GMS • Excluding any potential impact from COVID-19 • Strong comparable base in 2019 with record levels in sales revenue and recurring EBIT − Excellent development of prior years temporarily interrupted due to changes in the supply chain of our Li-ion battery business
Slide 17: Reporting segment outlook 2020. Corporate
Reporting segment outlook 2020. Corporate • Excluding any potential impact from COVID-19 • Expected substantial deterioration in recurring EBIT can mainly be attributed to the prior year benefiting from lower expenses for management incentive plans. 17 SGL Carbon | Investor Relations Presentation
Slide 18: Group outlook 2020. Confirmation of initial guidance
Group outlook 2020. Confirmation of initial guidance in October 2019 • Excluding any potential impact from COVID-19 • Full year Group sales expected to slightly decline • Group recurring EBIT expected 10-15% below prior year level − Note that previous year benefitted from lower expenses for manageme
Slide 19: Group outlook 2020
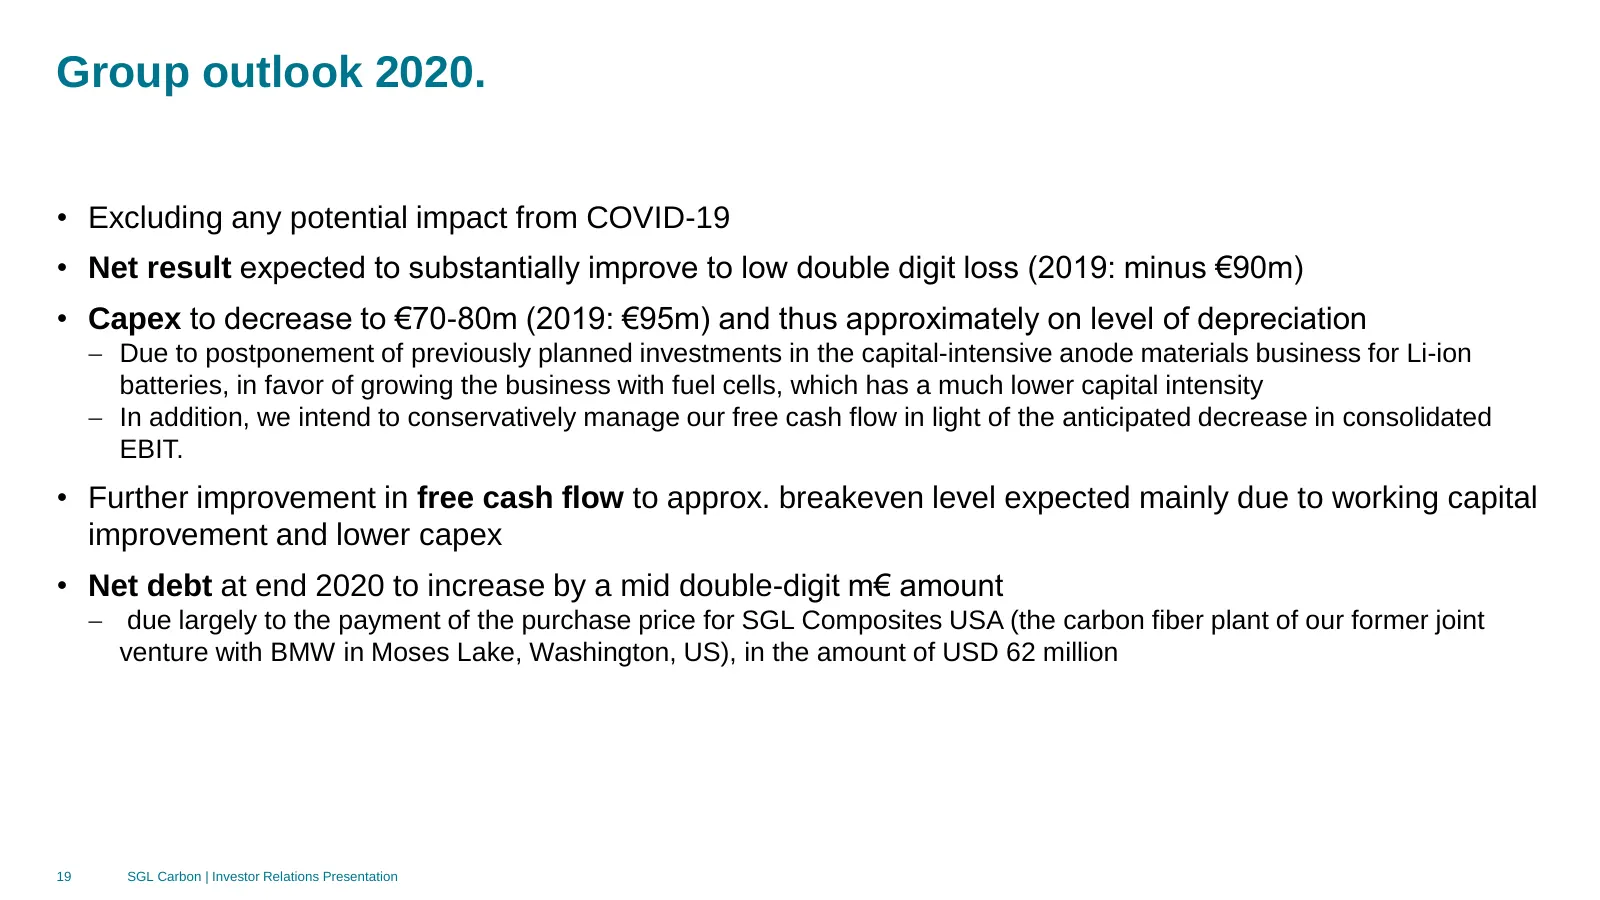
Group outlook 2020. • Excluding any potential impact from COVID-19 • Net result expected to substantially improve to low double digit loss (2019: minus €90m) • Capex to decrease to €70-80m (2019: €95m) and thus approximately on level of depreciation − Due to postponement of previously planned invest
Slide 20: Sneak preview on Q1/2020
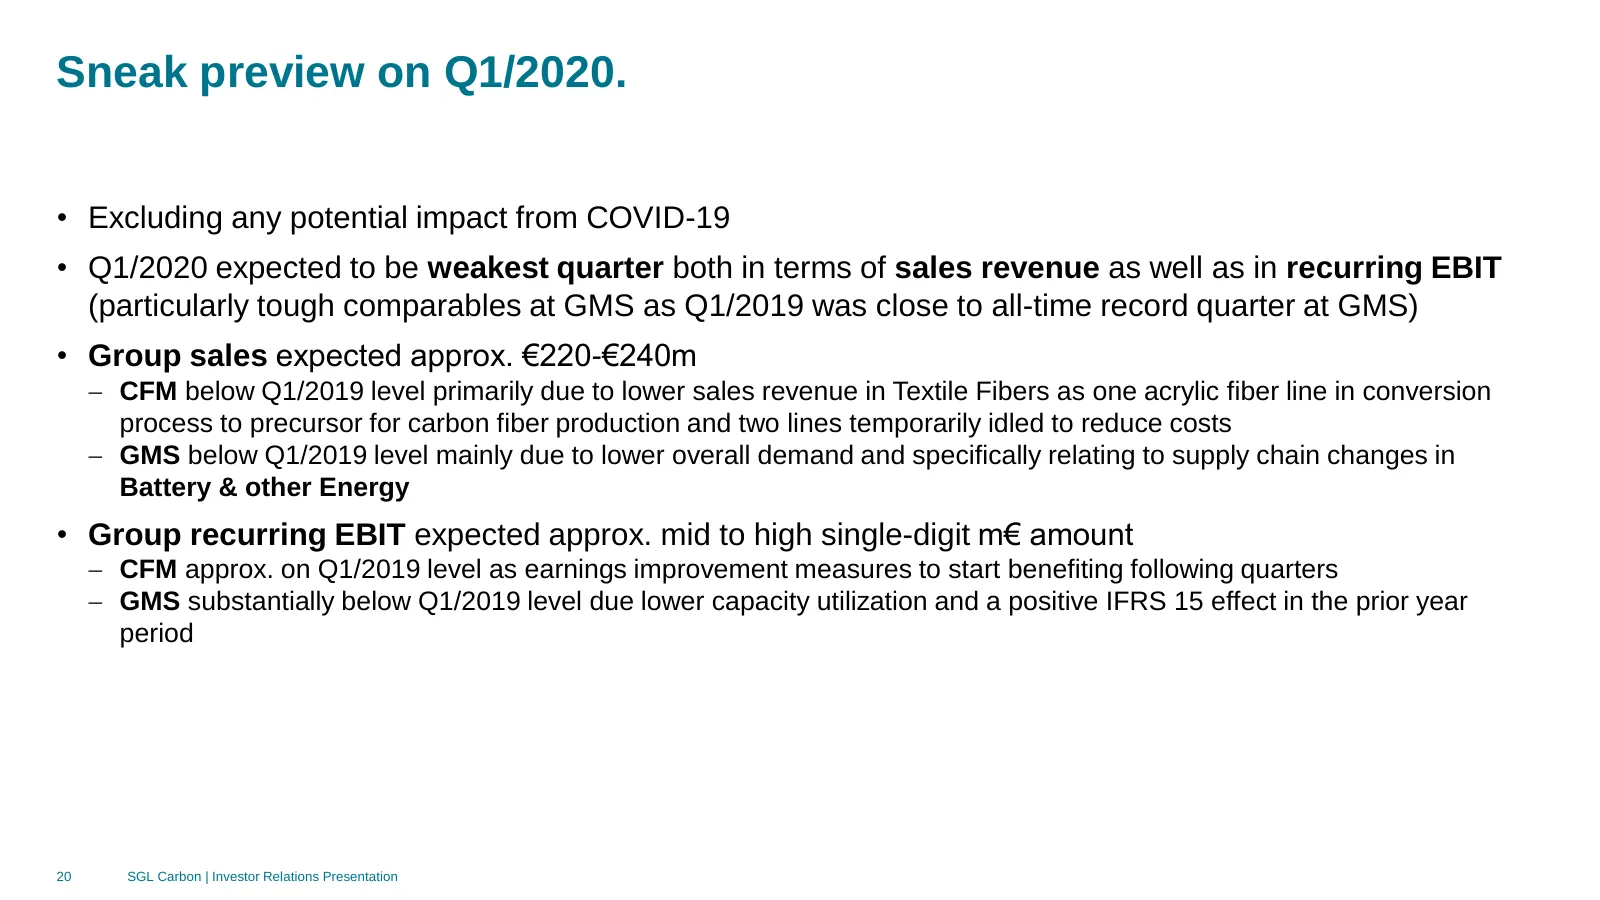
Sneak preview on Q1/2020. • Excluding any potential impact from COVID-19 • Q1/2020 expected to be weakest quarter both in terms of sales revenue as well as in recurring EBIT (particularly tough comparables at GMS as Q1/2019 was close to all-time record quarter at GMS) • Group sales expected approx.
Slide 21: 4 Forward strategy
4 Forward strategy 21 SGL Carbon | Investor Relations Presentation
Slide 22: Focus on key growth markets
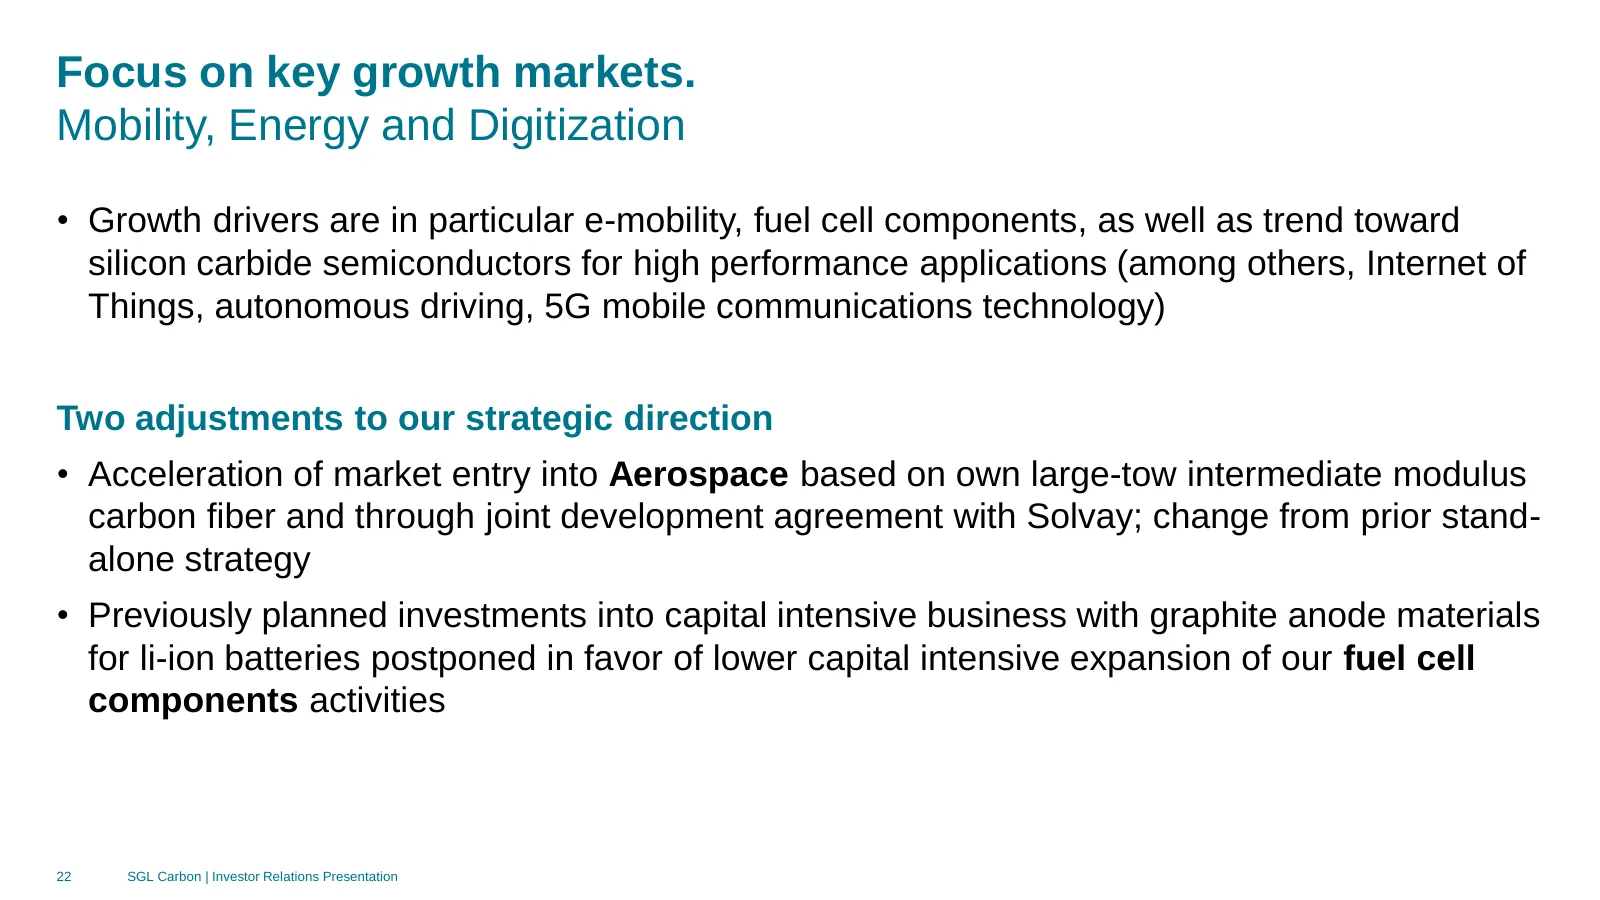
Focus on key growth markets. Mobility, Energy and Digitization • Growth drivers are in particular e-mobility, fuel cell components, as well as trend toward silicon carbide semiconductors for high performance applications (among others, Internet of Things, autonomous driving, 5G mobile communications
Slide 23: Forward strategy explained by examples
4 Forward strategy explained by examples • Aerospace • E-mobility • Fuel cell components 23 SGL Carbon | Investor Relations Presentation
Slide 24: Attainment of Group profitability targets depends on CFM
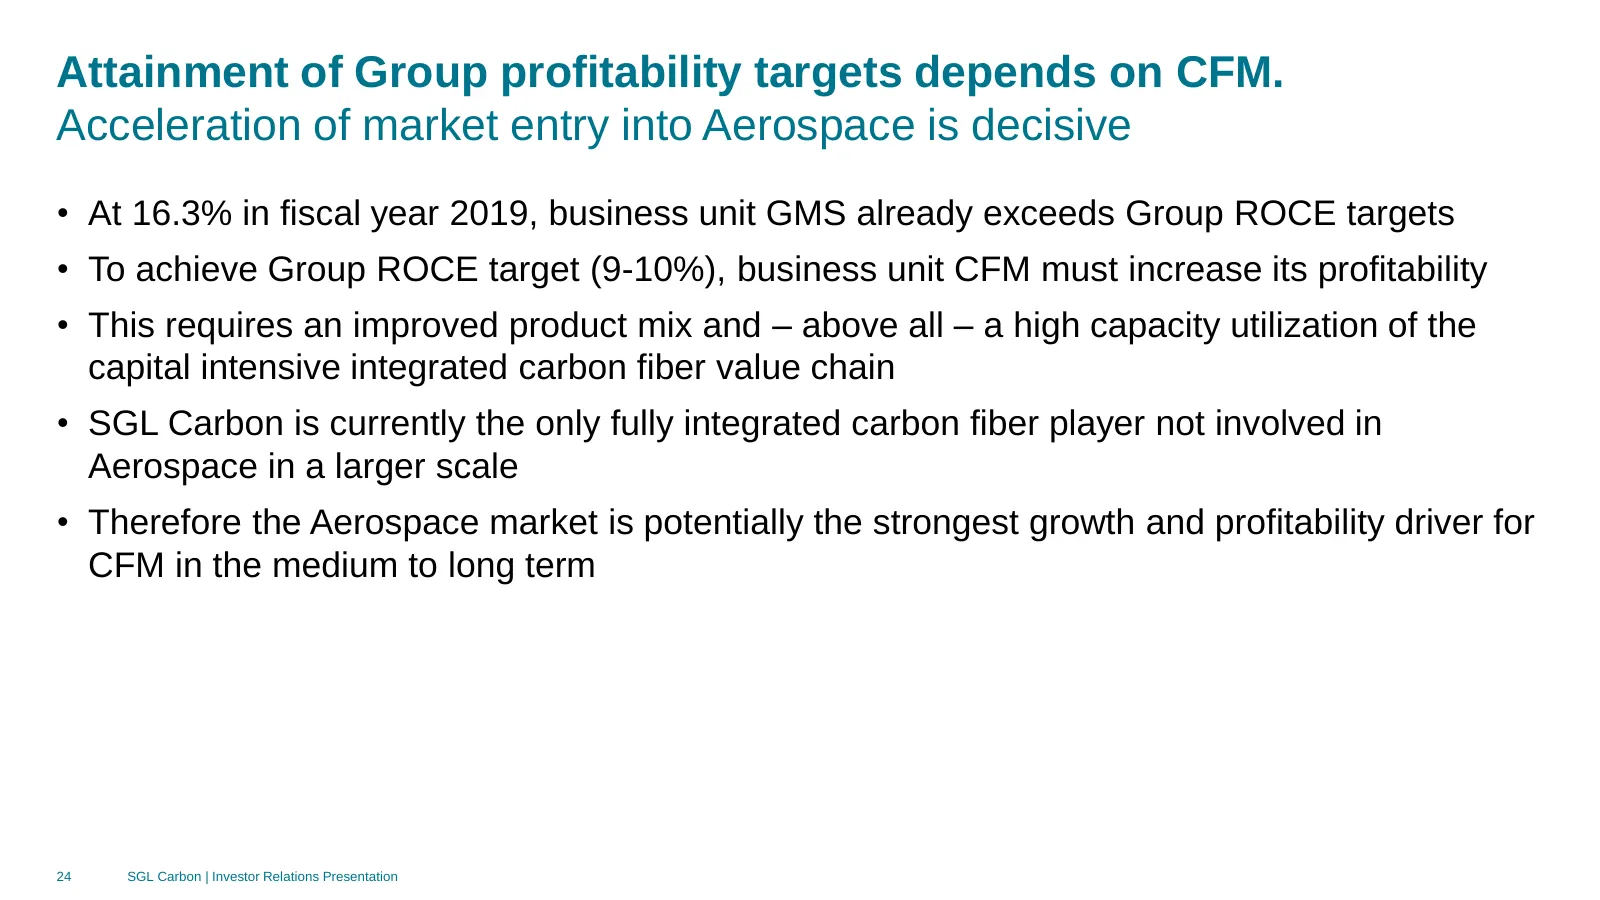
Attainment of Group profitability targets depends on CFM. Acceleration of market entry into Aerospace is decisive • At 16.3% in fiscal year 2019, business unit GMS already exceeds Group ROCE targets • To achieve Group ROCE target (9-10%), business unit CFM must increase its profitability • This requ
Slide 25: Aerospace is the largest and most profitable carbon fiber market
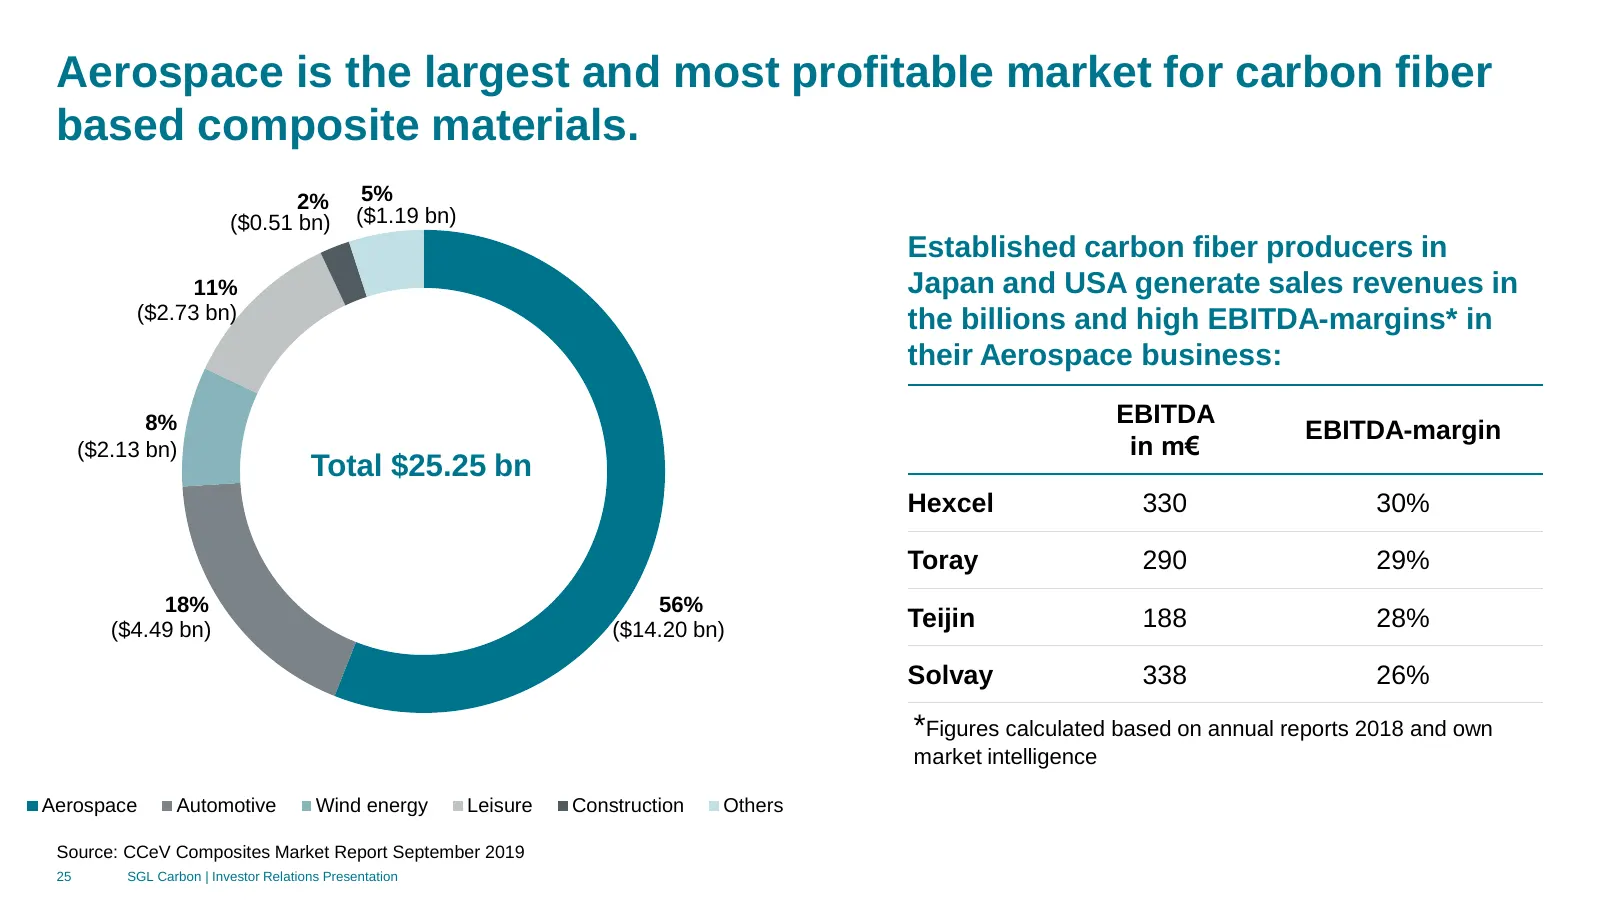
Aerospace is the largest and most profitable market for carbon fiber based composite materials. 2% 5% ($0.51 bn) ($1.19 bn) Established carbon fiber producers in 11% Japan and USA generate sales revenues in ($2.73 bn) the billions and high EBITDA-margins* in their Aerospace business: 8% EBITDA EBITD
Slide 26: Within Aerospace, commercial aircrafts and regional jets are largest
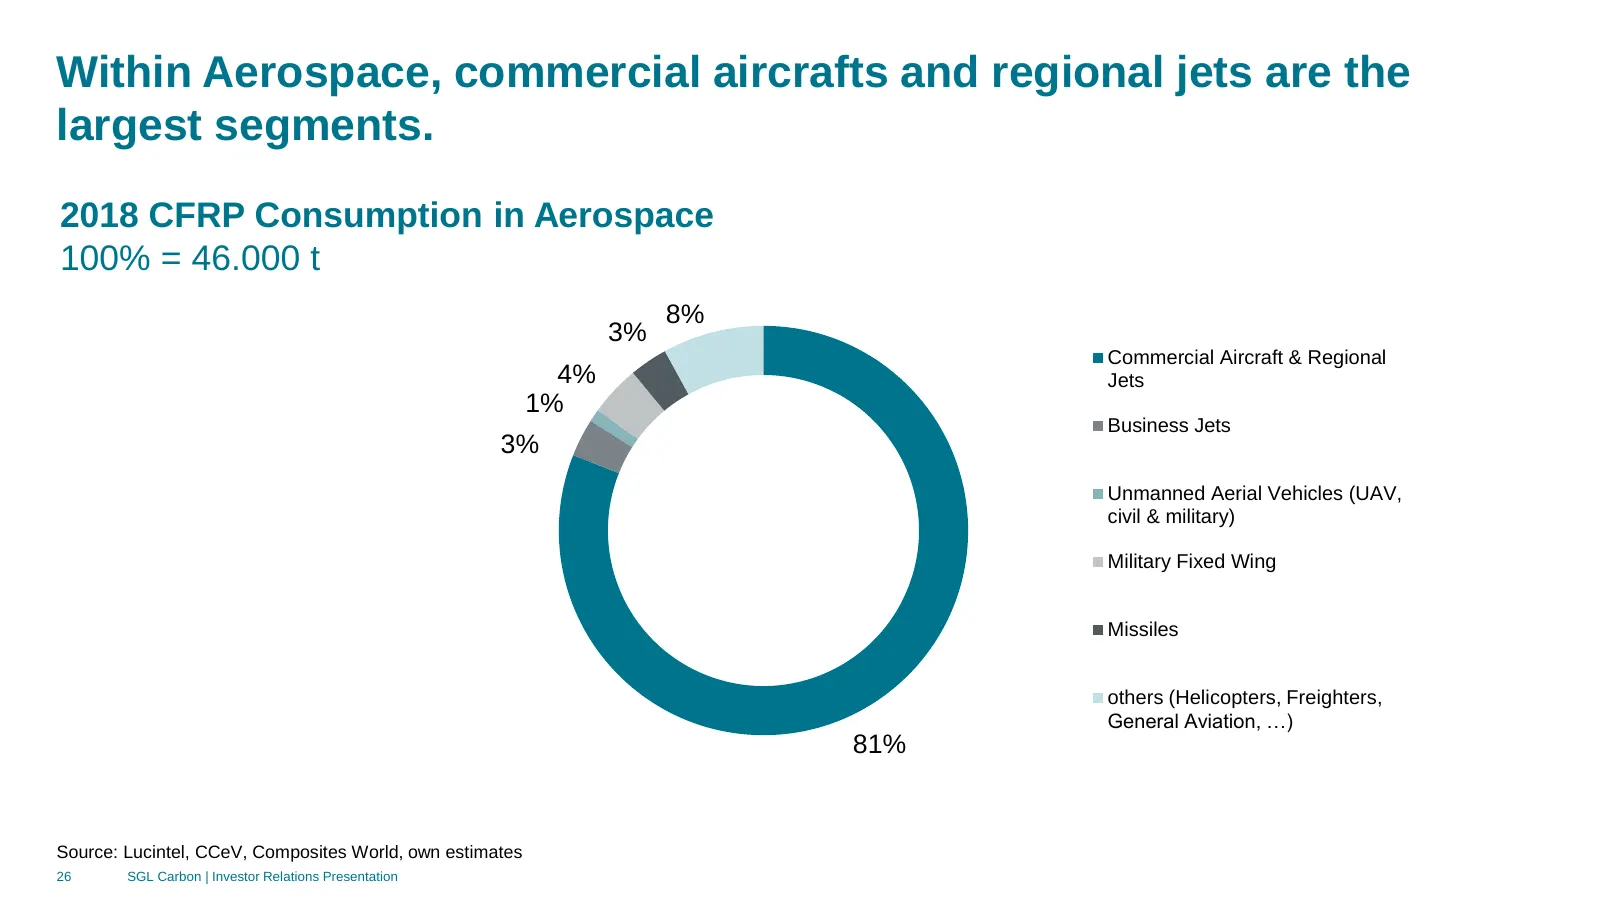
Within Aerospace, commercial aircrafts and regional jets are the largest segments. 2018 CFRP Consumption in Aerospace 100% = 46.000 t 8% 3% Commercial Aircraft & Regional 4% Jets 1% Business Jets 3% Unmanned Aerial Vehicles (UAV, civil & military) Military Fixed Wing Missiles others (Helicopters, Fr
Slide 27: New 50k IM carbon fiber and partnership with Solvay
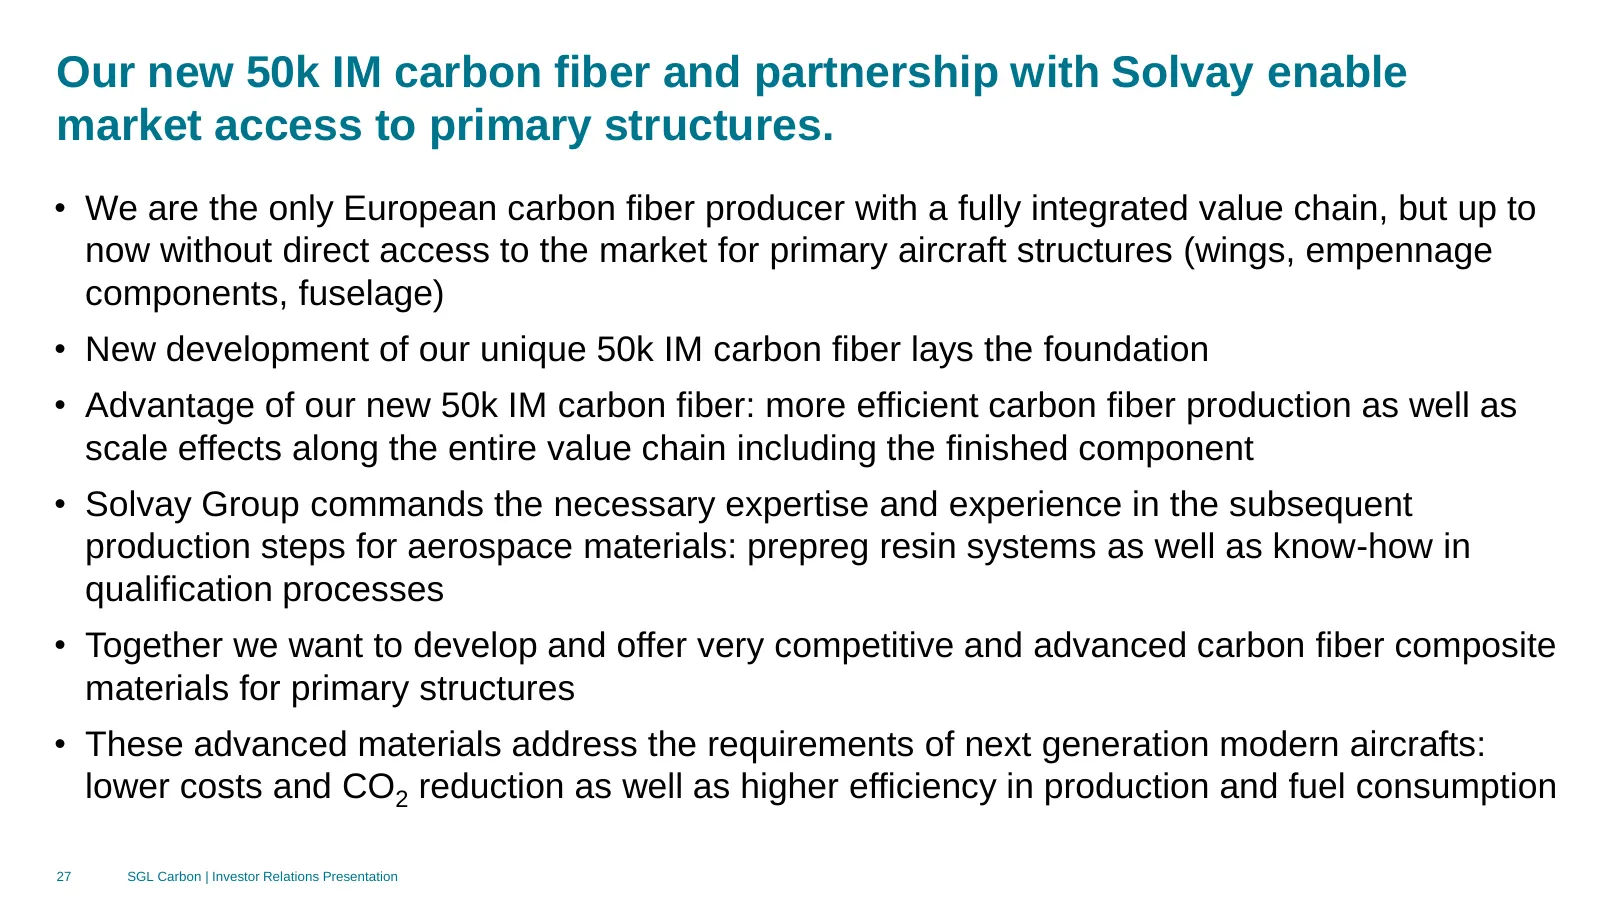
Our new 50k IM carbon fiber and partnership with Solvay enable market access to primary structures. • We are the only European carbon fiber producer with a fully integrated value chain, but up to now without direct access to the market for primary aircraft structures (wings, empennage components, fu
Slide 28: Higher build rates require new material systems and process technologies
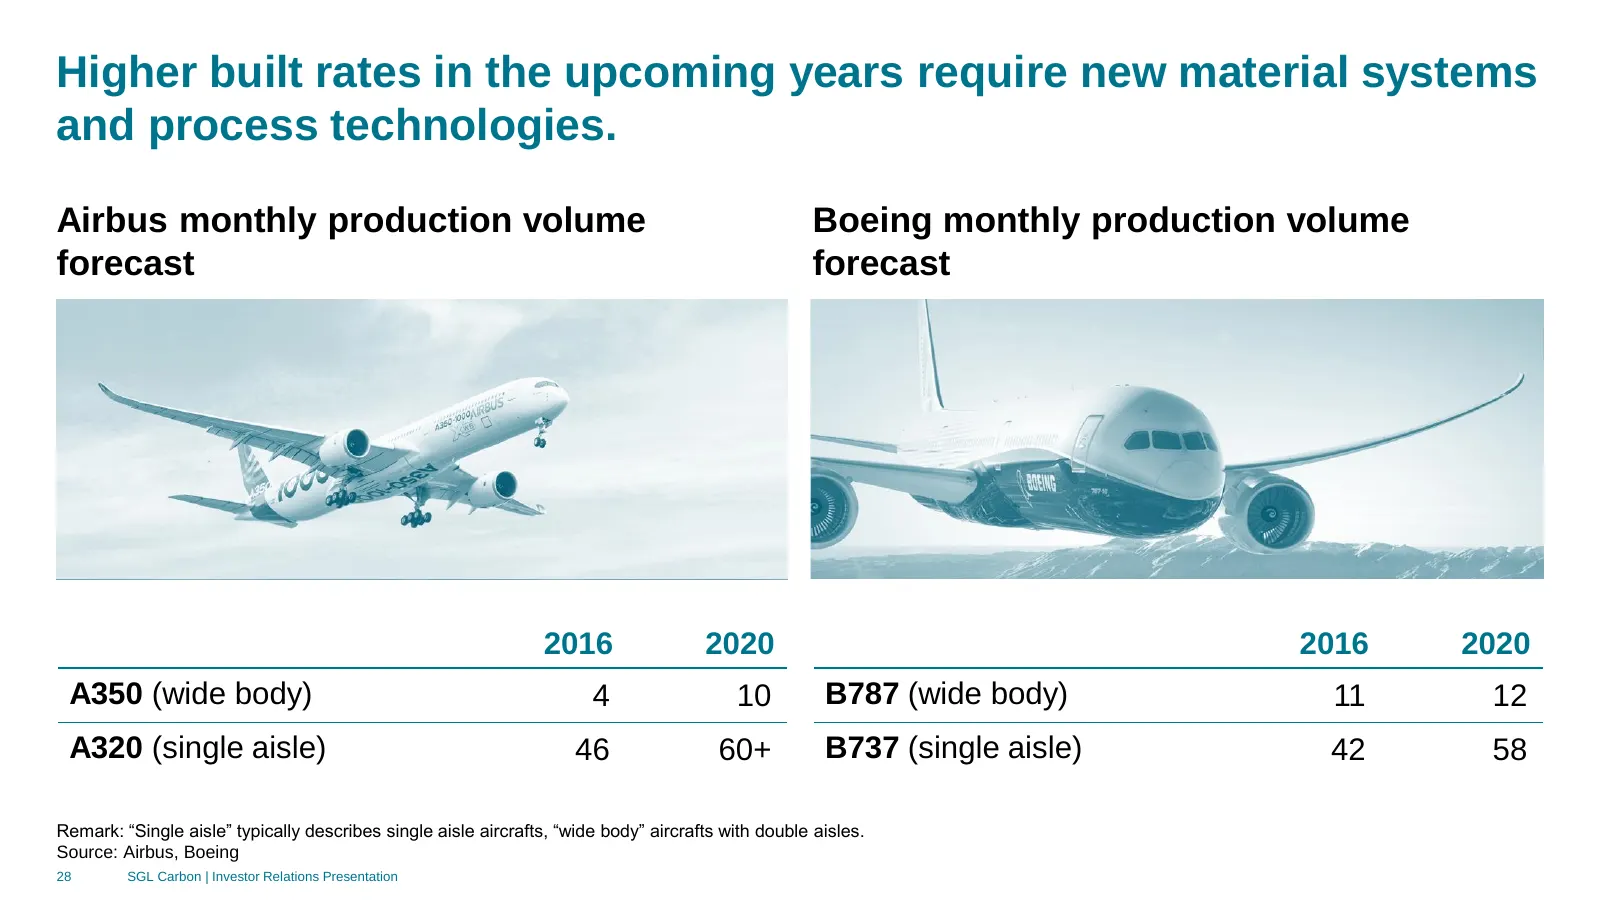
Higher built rates in the upcoming years require new material systems and process technologies. Airbus monthly production volume Boeing monthly production volume forecast forecast 2016 2020 2016 2020 A350 (wide body) 4 10 B787 (wide body) 11 12 A320 (single aisle) 46 60+ B737 (single aisle) 42 58 Re
Slide 29: Different carbon fiber grades address various structural components
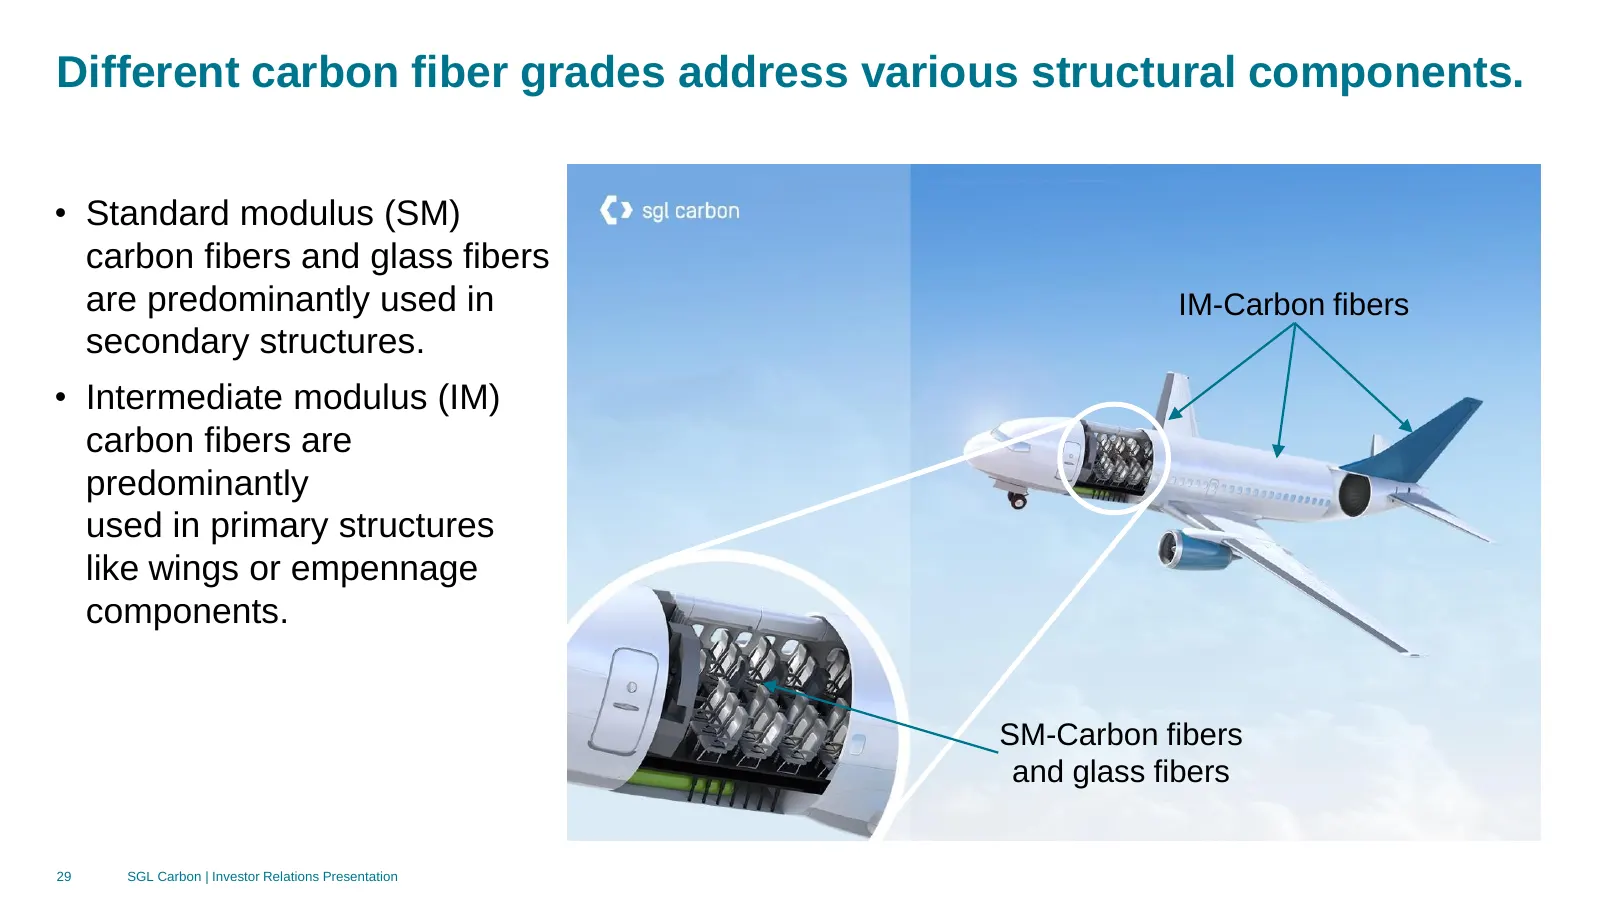
Different carbon fiber grades address various structural components. • Standard modulus (SM) carbon fibers and glass fibers are predominantly used in IM-Carbon fibers secondary structures. • Intermediate modulus (IM) carbon fibers are predominantly used in primary structures like wings or empennage
Slide 30: Development cooperation with Solvay
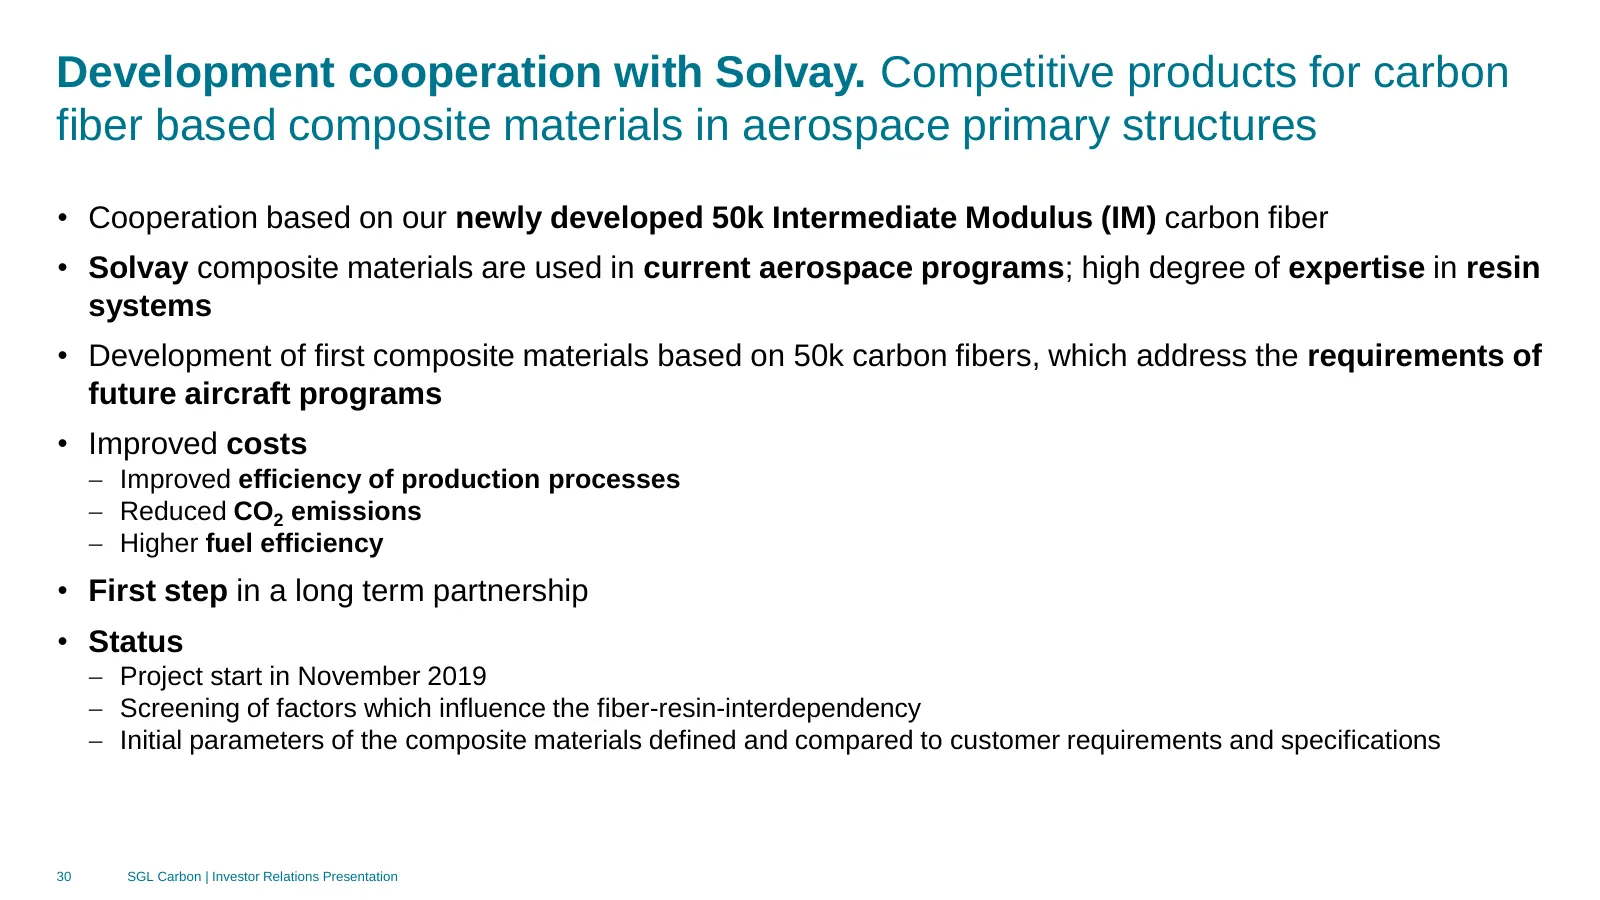
Development cooperation with Solvay. Competitive products for carbon fiber based composite materials in aerospace primary structures • Cooperation based on our newly developed 50k Intermediate Modulus (IM) carbon fiber • Solvay composite materials are used in current aerospace programs; high degree
Slide 31: Usually 5+ years required for introduction of new materials
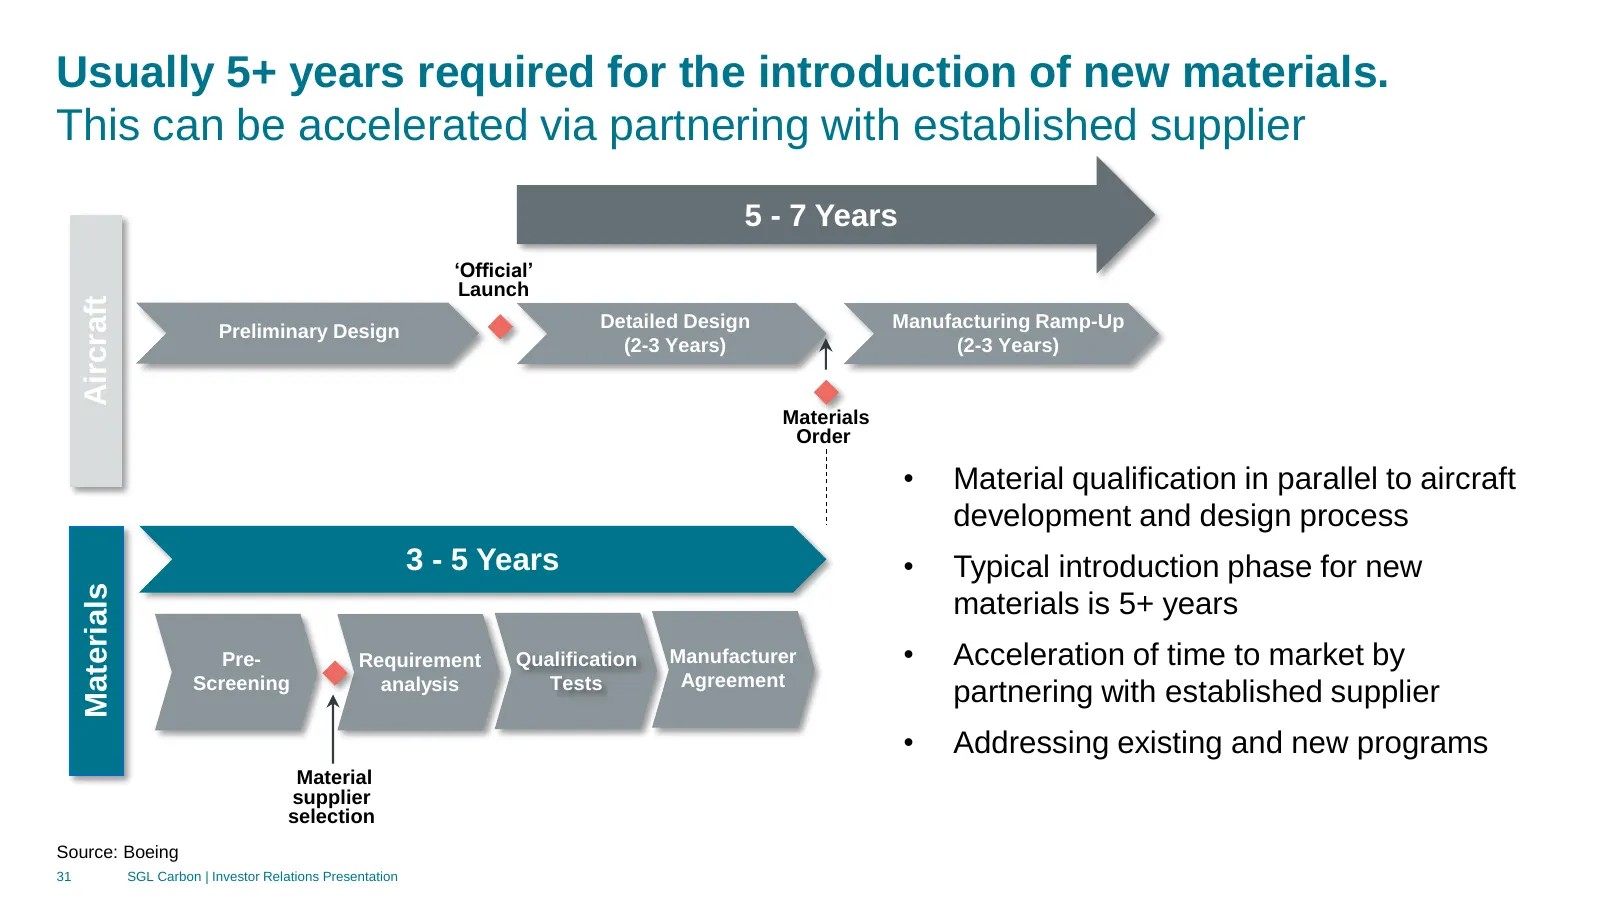
Usually 5+ years required for the introduction of new materials. This can be accelerated via partnering with established supplier 5 - 7 Years ‘Official’ Launch Aircraft Detailed Design Manufacturing Ramp-Up Preliminary Design (2-3 Years) (2-3 Years) Materials Order • Material qualification in parall
Slide 32: Our key aerospace markets
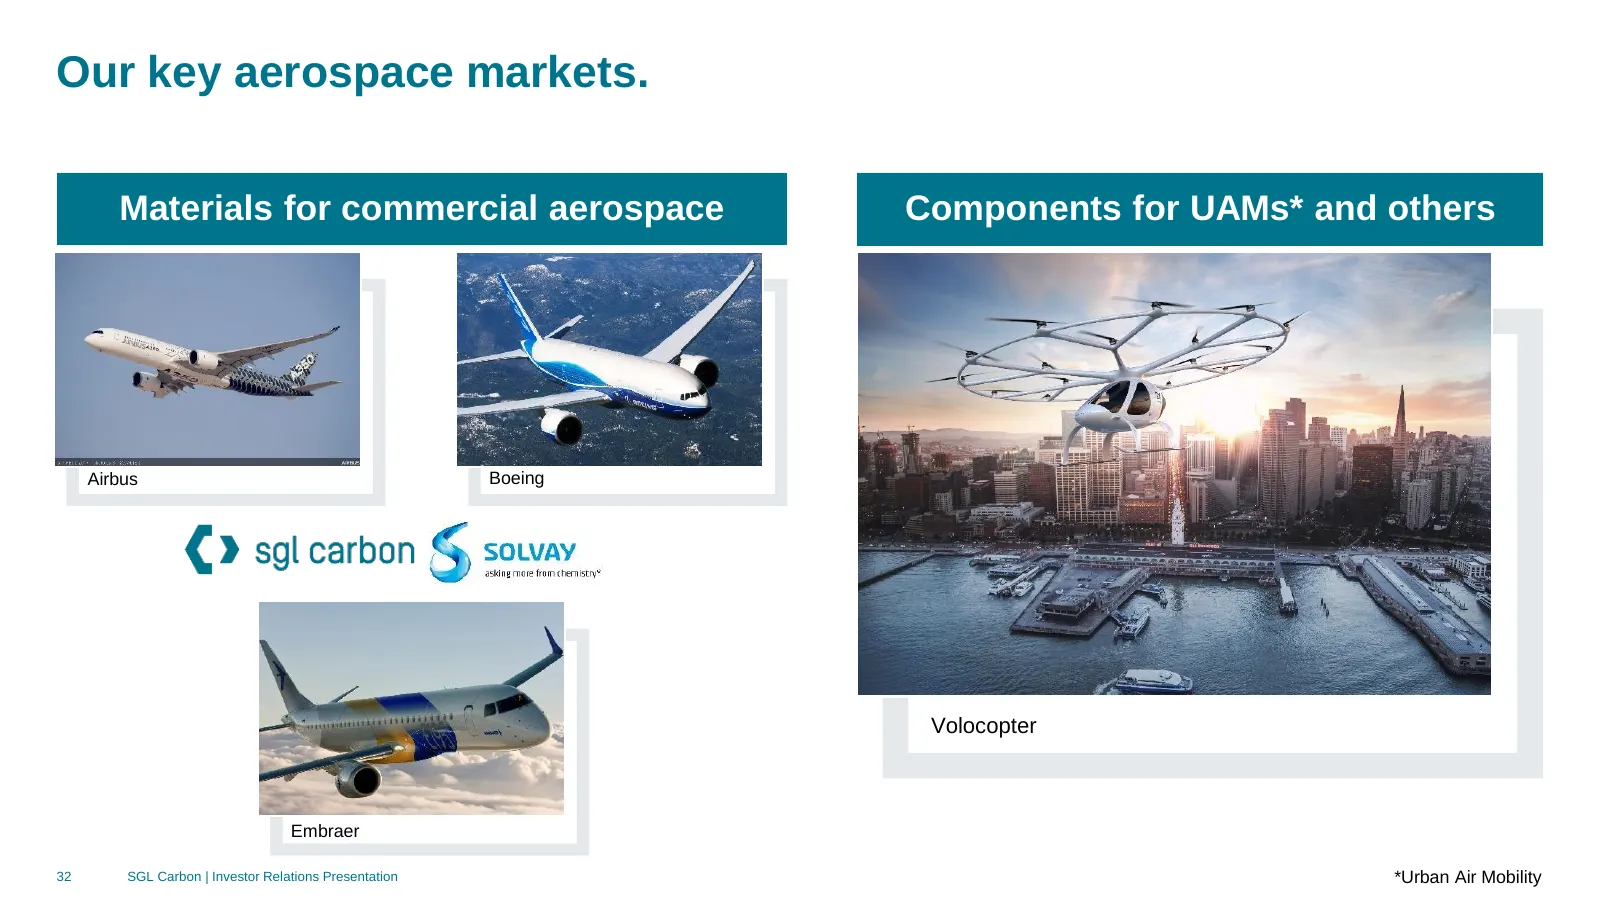
Our key aerospace markets. Materials for commercial aerospace Components for UAMs* and others Airbus Boeing Volocopter Embraer 32 SGL Carbon | Investor Relations Presentation *Urban Air Mobility
Slide 33: Forward strategy explained by examples
4 Forward strategy explained by examples • Aerospace • E-mobility • Fuel cell components 33 SGL Carbon | Investor Relations Presentation
Slide 34: Automotive is second largest market for composite materials
Automotive is second largest market for composite materials. E-mobility drives growth • Automotive is second largest market for composite materials after Aerospace • Following initial high expectations with the launch of BMW i3 with an entire carbon composites chassis, the number and scope of carbon
Slide 35: Major projects won for composite battery cases
Major projects won for composite battery cases. Customized solutions and serial production competence • Battery cases based on composite materials address weight aspects as well as specific requirements • These in particular include: high stiffness to support driving dynamics, underbody protection f
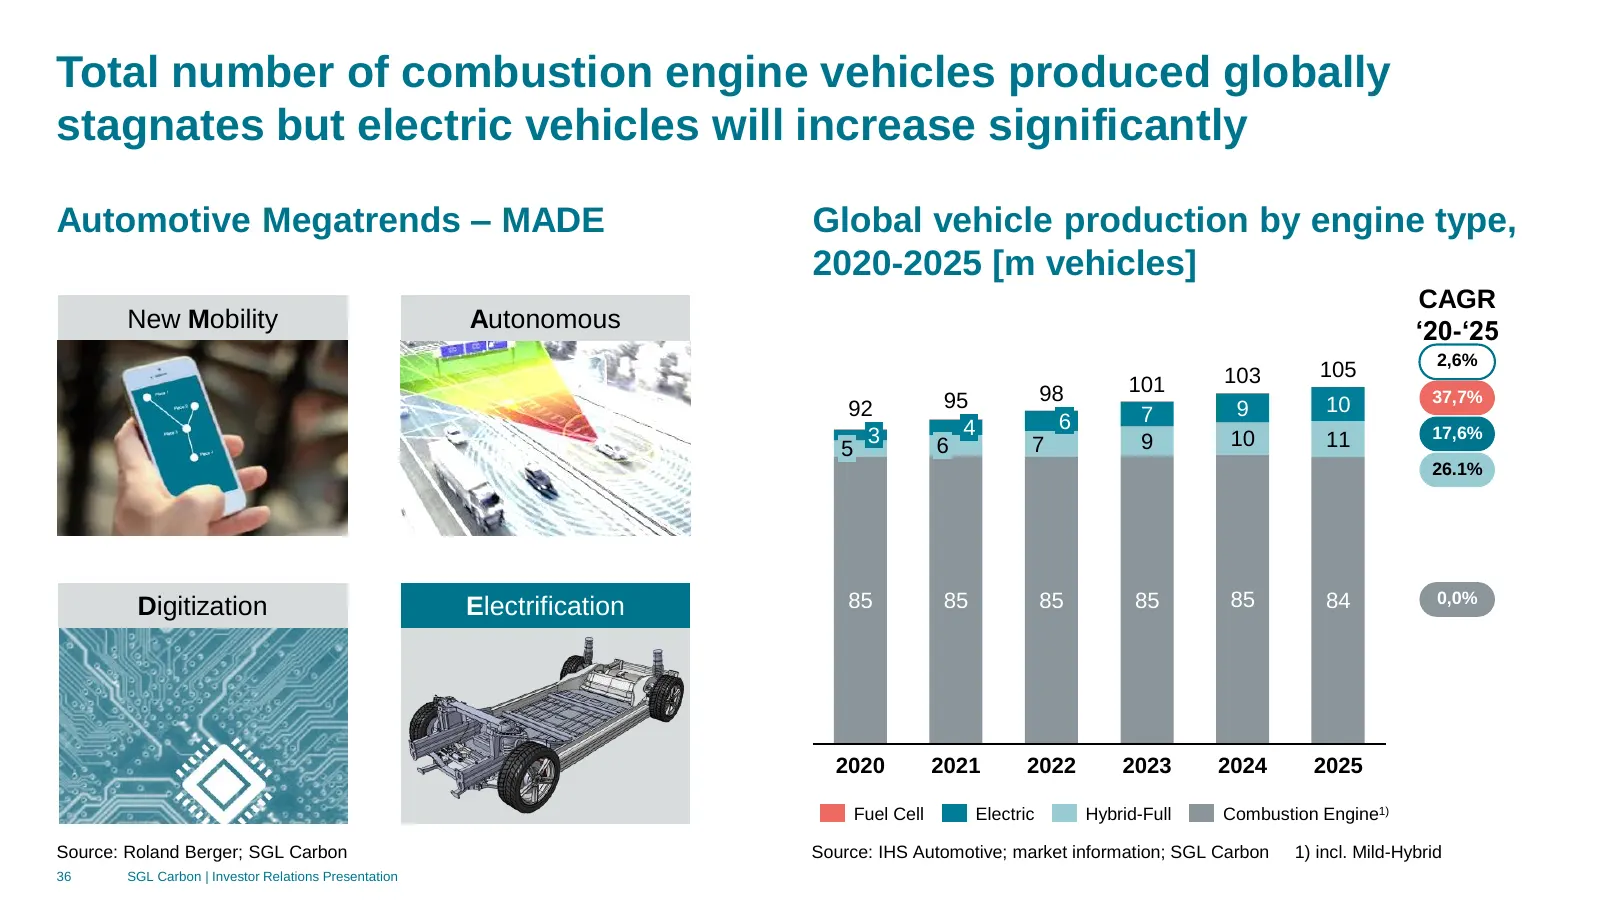
Slide 36: Combustion vehicles stagnate but electric vehicles increase significantly
Total number of combustion engine vehicles produced globally stagnates but electric vehicles will increase significantly Automotive Megatrends – MADE Global vehicle production by engine type, 2020-2025 [m vehicles] CAGR New Mobility Autonomous ‘20-‘25 2,6% 103 105 98 101 37,7% 92 95 9 10 6 7 3 4 17,
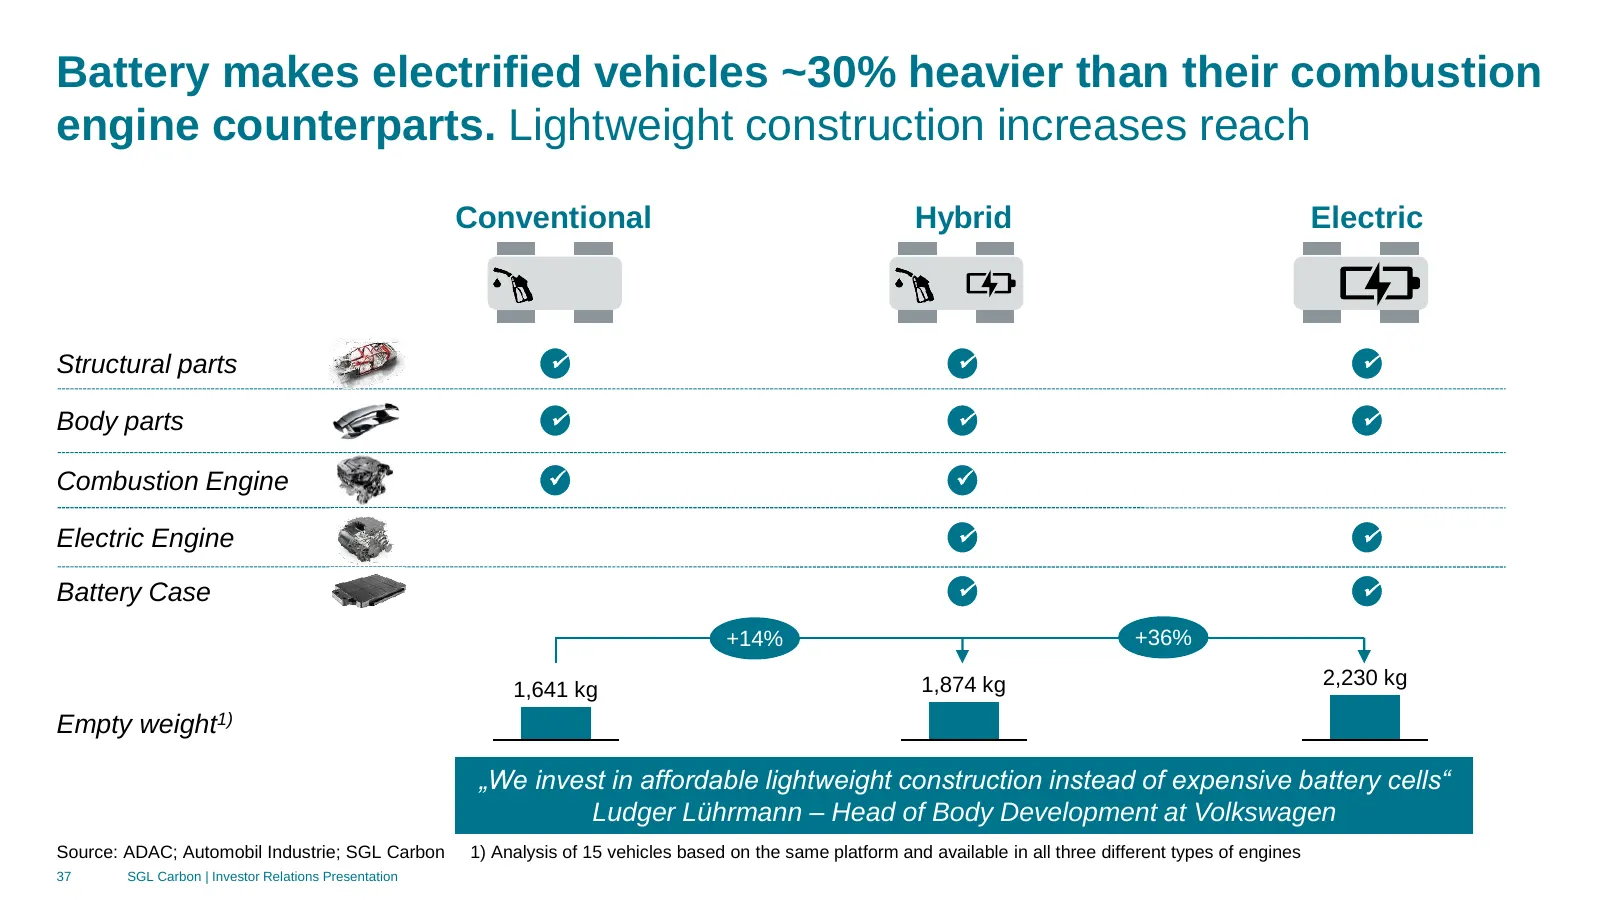
Slide 37: Battery makes electrified vehicles ~30% heavier
Battery makes electrified vehicles ~30% heavier than their combustion engine counterparts. Lightweight construction increases reach Conventional Hybrid Electric Structural parts ✓ ✓ ✓ Body parts ✓ ✓ ✓ Combustion Engine ✓ ✓ Electric Engine ✓ ✓ Battery Case ✓ ✓ +14% +36% 1,874 kg 2,230 kg 1,641 kg Emp
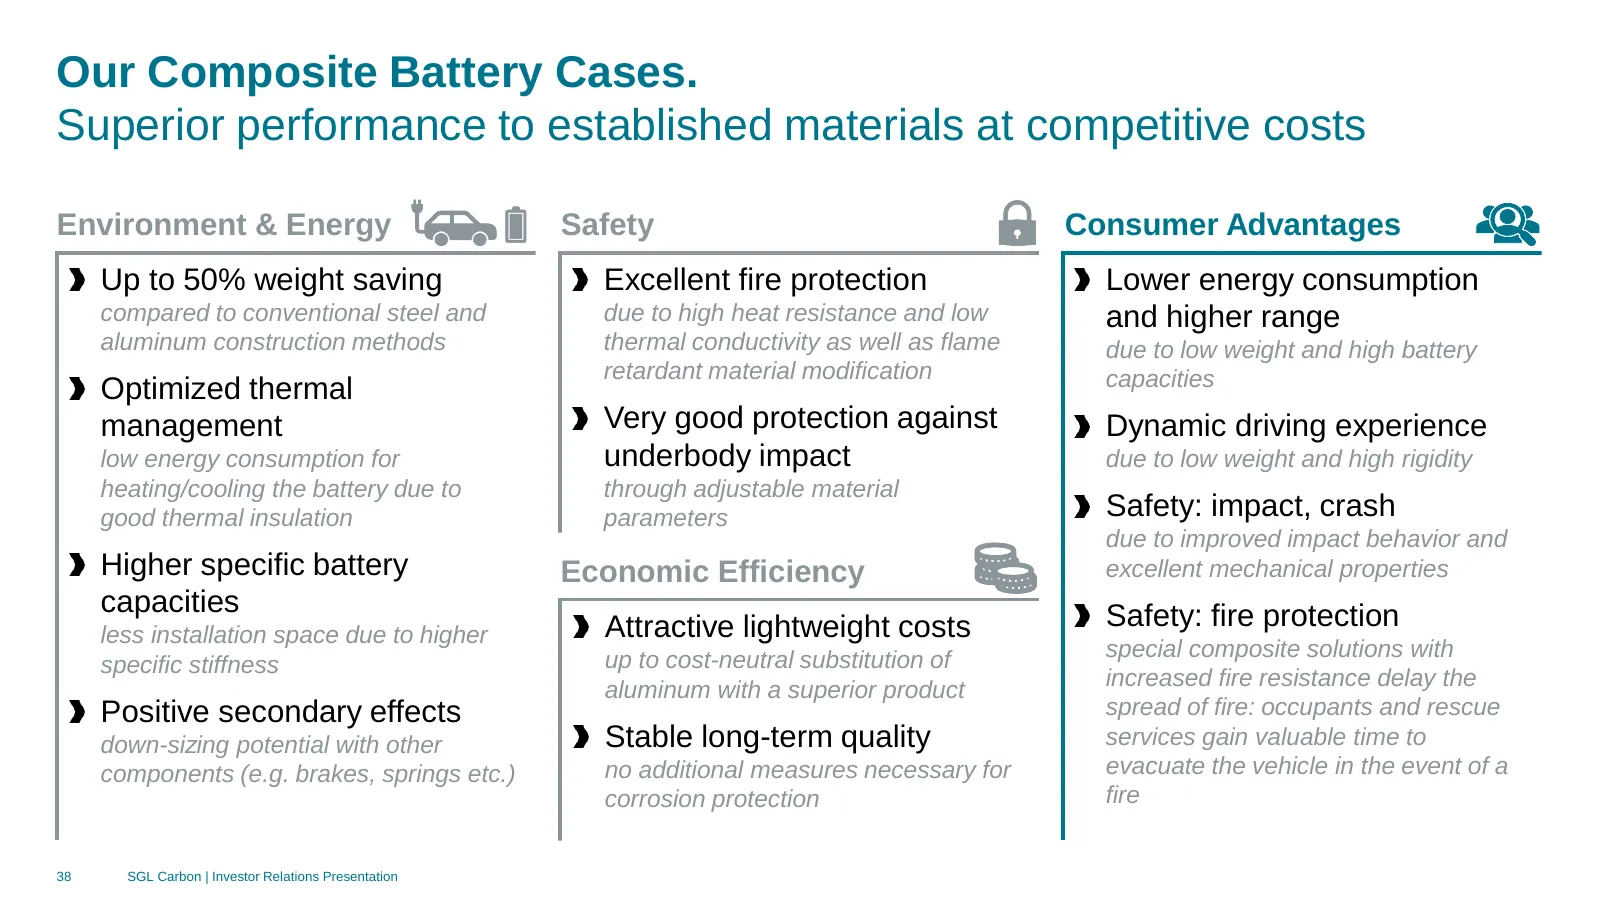
Slide 38: Our Composite Battery Cases
Our Composite Battery Cases. Superior performance to established materials at competitive costs Environment & Energy Safety Consumer Advantages Up to 50% weight saving Excellent fire protection Lower energy consumption compared to conventional steel and due to high heat resistance and low and higher
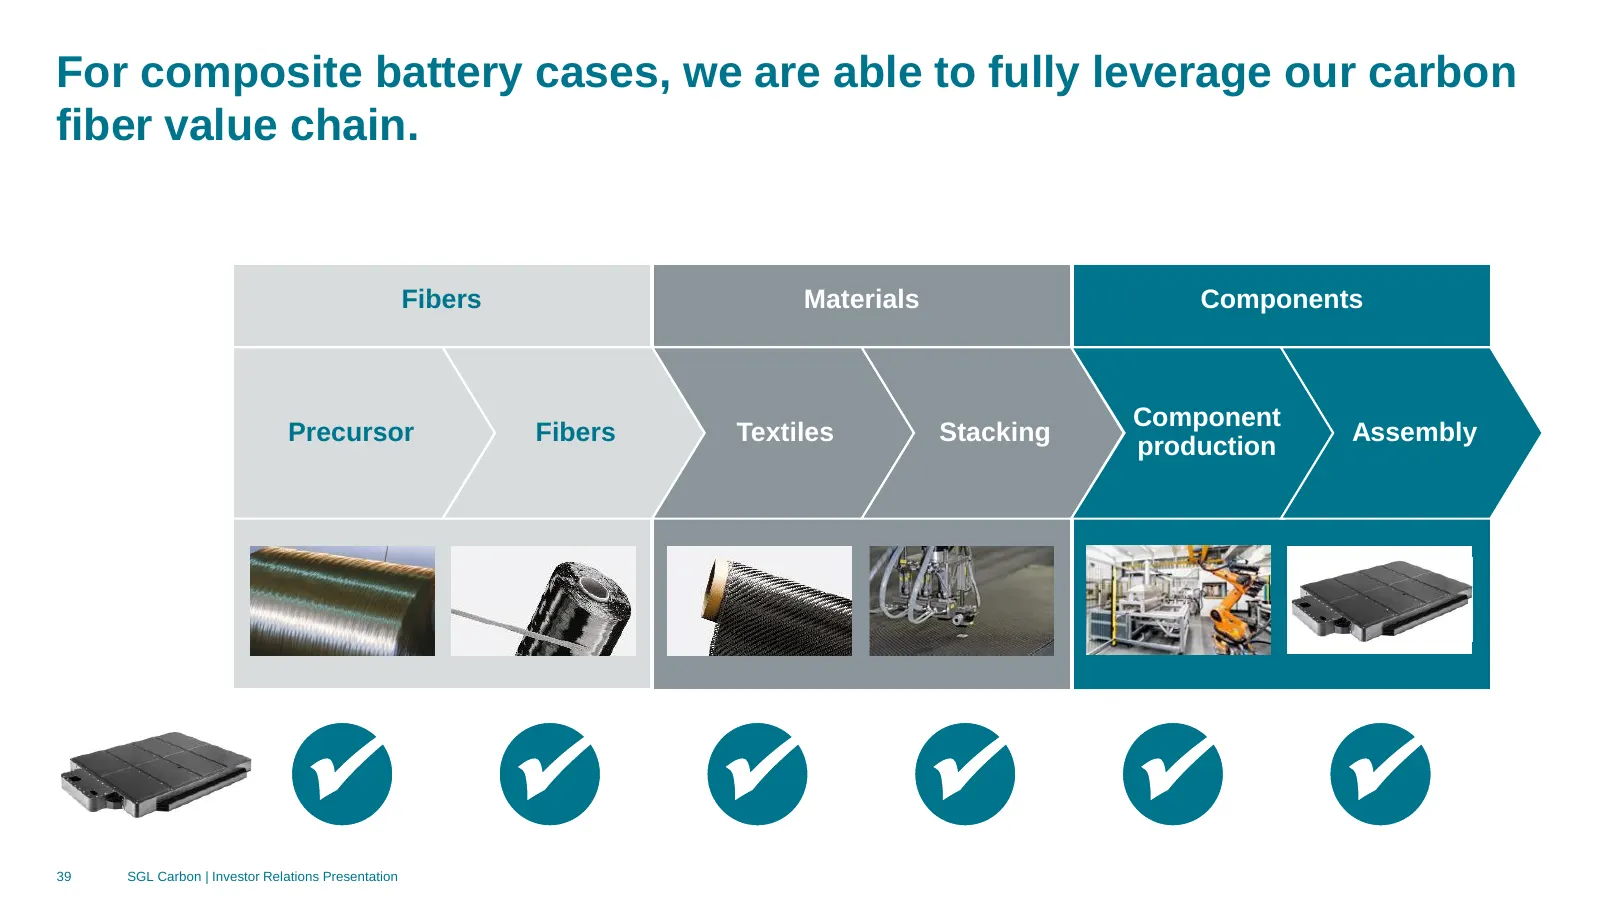
Slide 39: Composite battery cases leverage our carbon fiber value chain
For composite battery cases, we are able to fully leverage our carbon fiber value chain. Fibers Materials Components Component Precursor Fibers Textiles Stacking Assembly production ✓ ✓ ✓ ✓ ✓ ✓ 39 SGL Carbon | Investor Relations Presentation
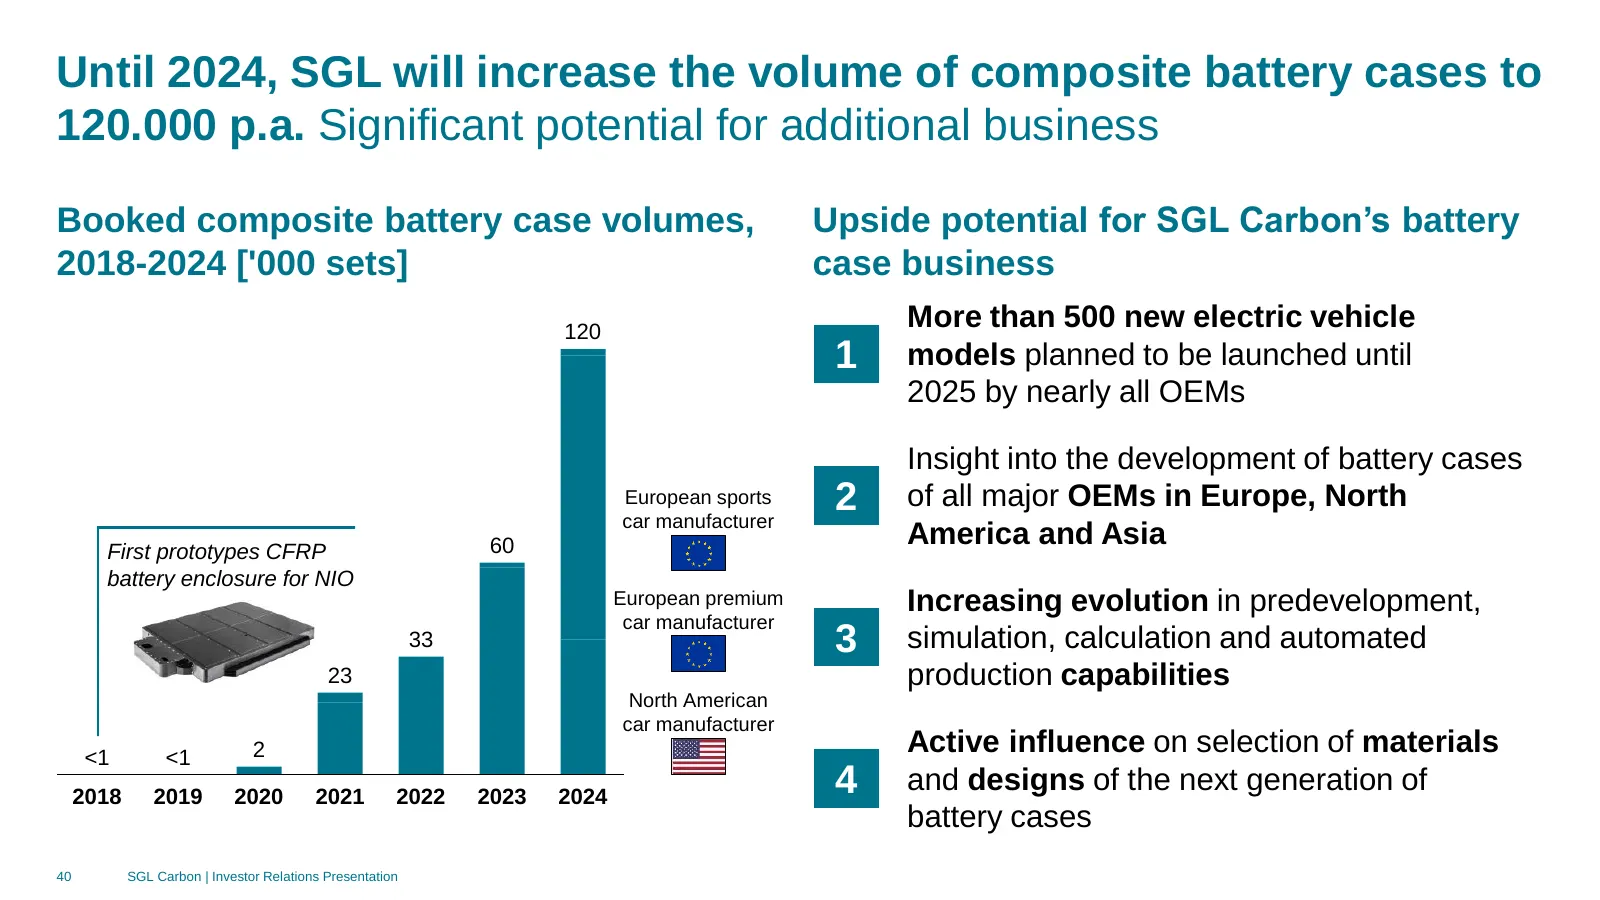
Slide 40: Until 2024, SGL will increase composite battery case volume to 120,000 p.a.
Until 2024, SGL will increase the volume of composite battery cases to 120.000 p.a. Significant potential for additional business Booked composite battery case volumes, Upside potential for SGL Carbon’s battery 2018-2024 ['000 sets] case business 120 More than 500 new electric vehicle 1 models plann
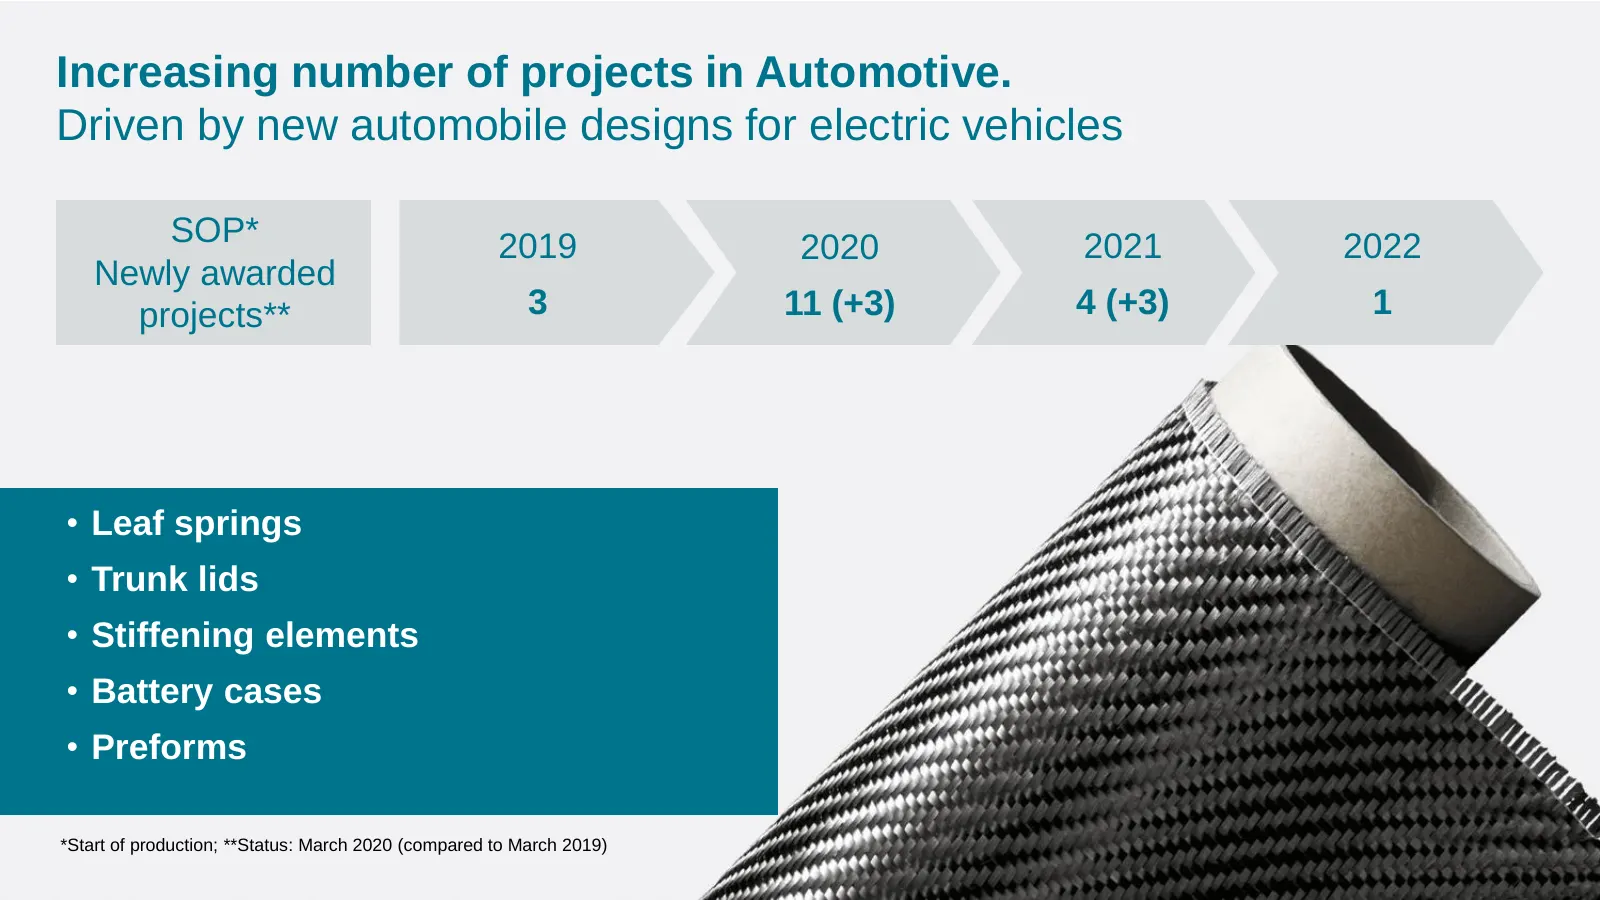
Slide 41: Increasing number of projects in Automotive
Increasing number of projects in Automotive. Driven by new automobile designs for electric vehicles SOP* 2019 2020 2021 2022 Newly awarded projects** 3 11 (+3) 4 (+3) 1 • Leaf springs • Trunk lids • Stiffening elements • Battery cases • Preforms *Start of production; **Status: March 2020 (compared t
Slide 42: Forward strategy explained by examples
4 Forward strategy explained by examples • Aerospace • E-mobility • Fuel cell components 42 SGL Carbon | Investor Relations Presentation
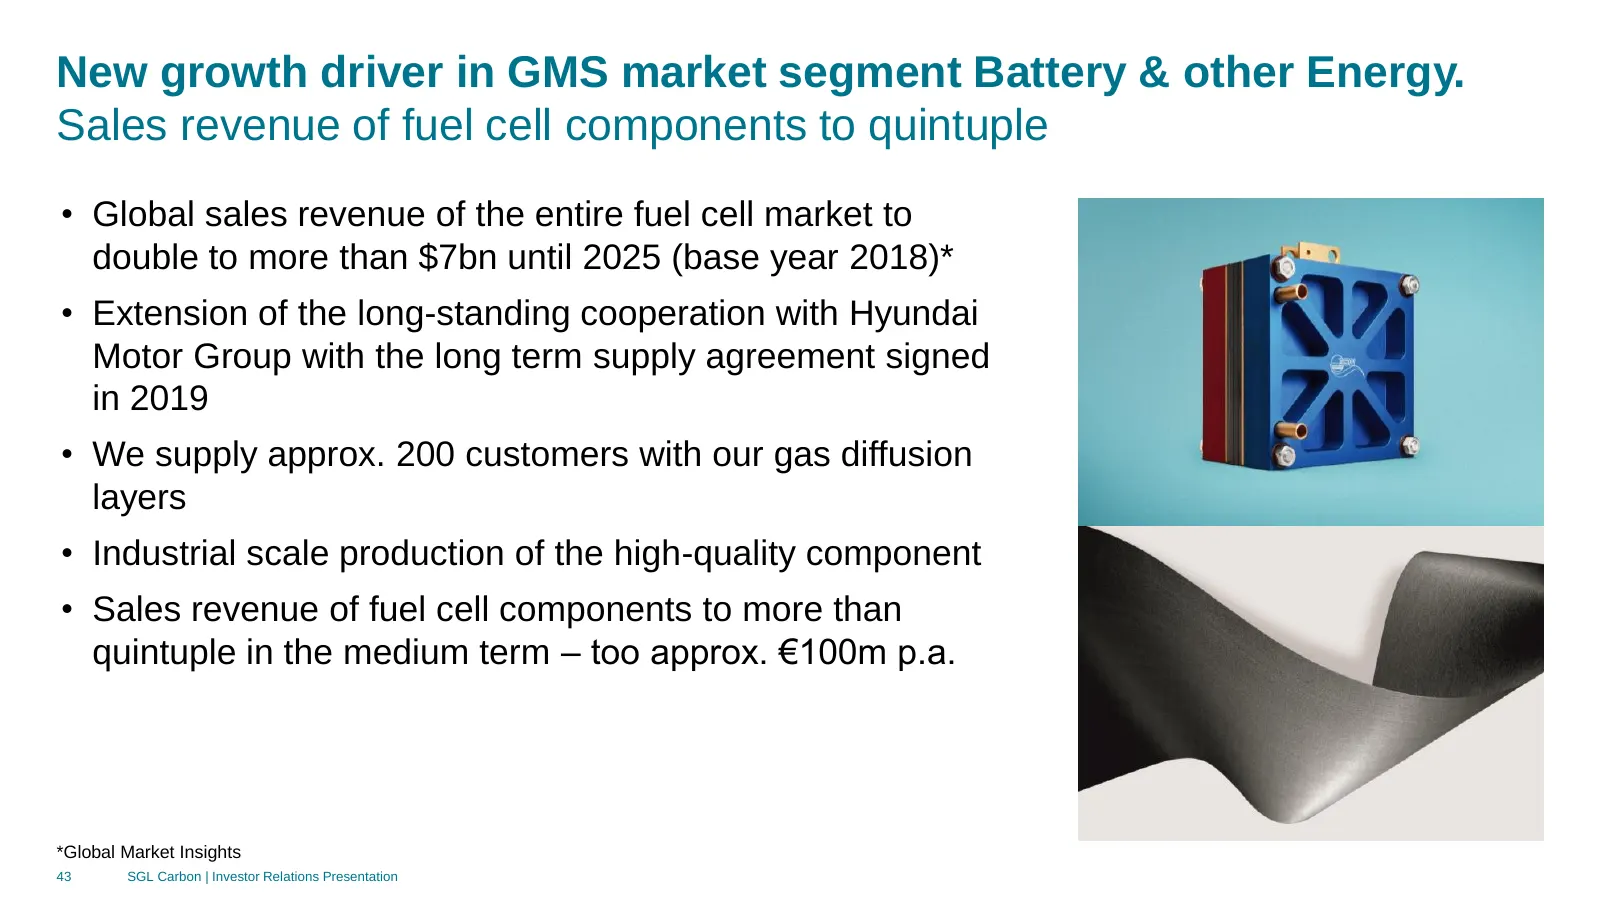
Slide 43: New growth driver in GMS: fuel cell components sales to quintuple
New growth driver in GMS market segment Battery & other Energy. Sales revenue of fuel cell components to quintuple • Global sales revenue of the entire fuel cell market to double to more than $7bn until 2025 (base year 2018)* • Extension of the long-standing cooperation with Hyundai Motor Group with
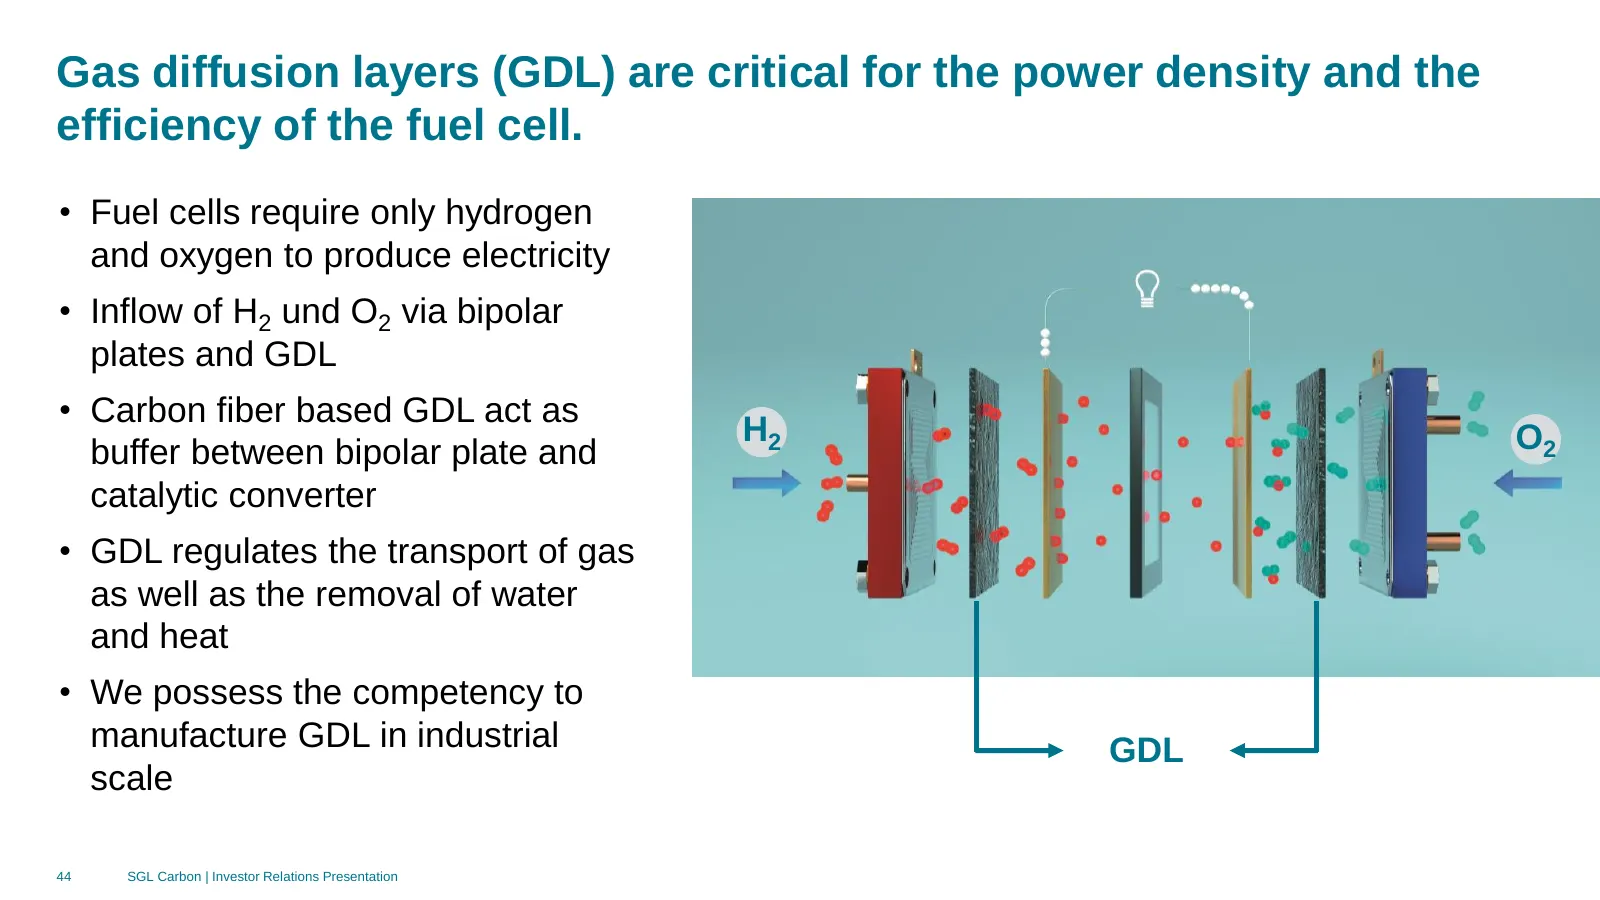
Slide 44: Gas diffusion layers are critical for fuel cell efficiency
Gas diffusion layers (GDL) are critical for the power density and the efficiency of the fuel cell. • Fuel cells require only hydrogen and oxygen to produce electricity • Inflow of H2 und O2 via bipolar plates and GDL • Carbon fiber based GDL act as H2 O2 buffer between bipolar plate and catalytic co
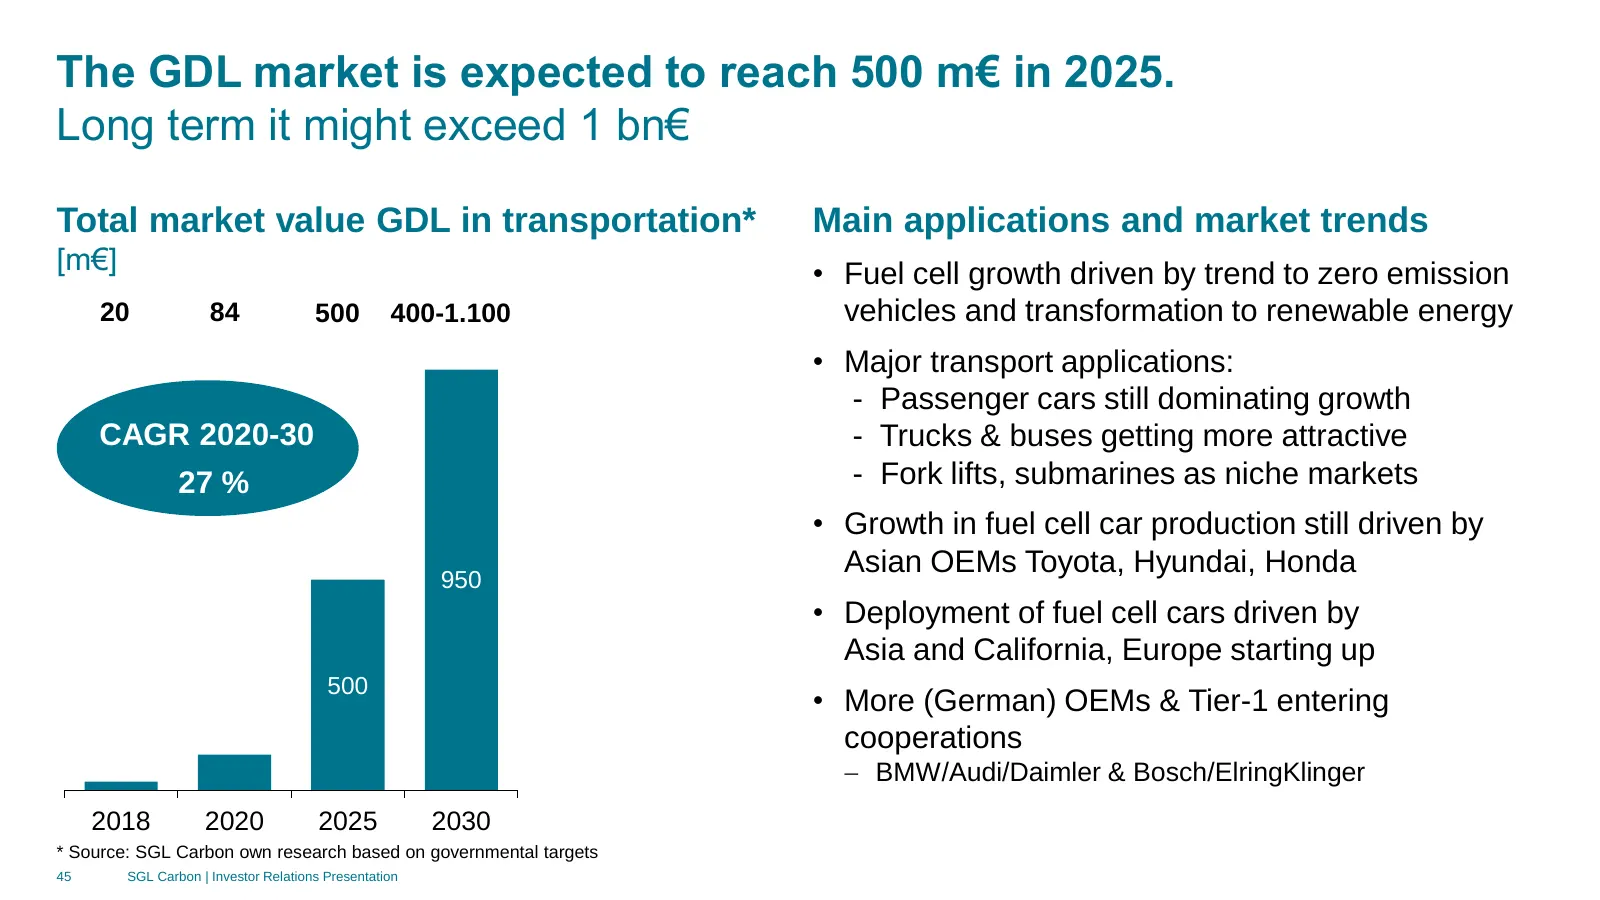
Slide 45: The GDL market is expected to reach 500 m€ in 2025
The GDL market is expected to reach 500 m€ in 2025. Long term it might exceed 1 bn€ Total market value GDL in transportation* Main applications and market trends [m€] • Fuel cell growth driven by trend to zero emission 20 84 500 400-1.100 vehicles and transformation to renewable energy • Major trans
Slide 46: Expansion of fuel cell components and graphite anode focus
Expansion of fuel cell components activities and focus on technology advancement of graphite anode materials for li-ion batteries • Postponement of previously planned investments for capital intensive anode materials business for li-ion batteries in favor of less capital intensive expansion of our a

Slide 47: 5 New mid term plan
5 New mid term plan 47 SGL Carbon | Investor Relations Presentation
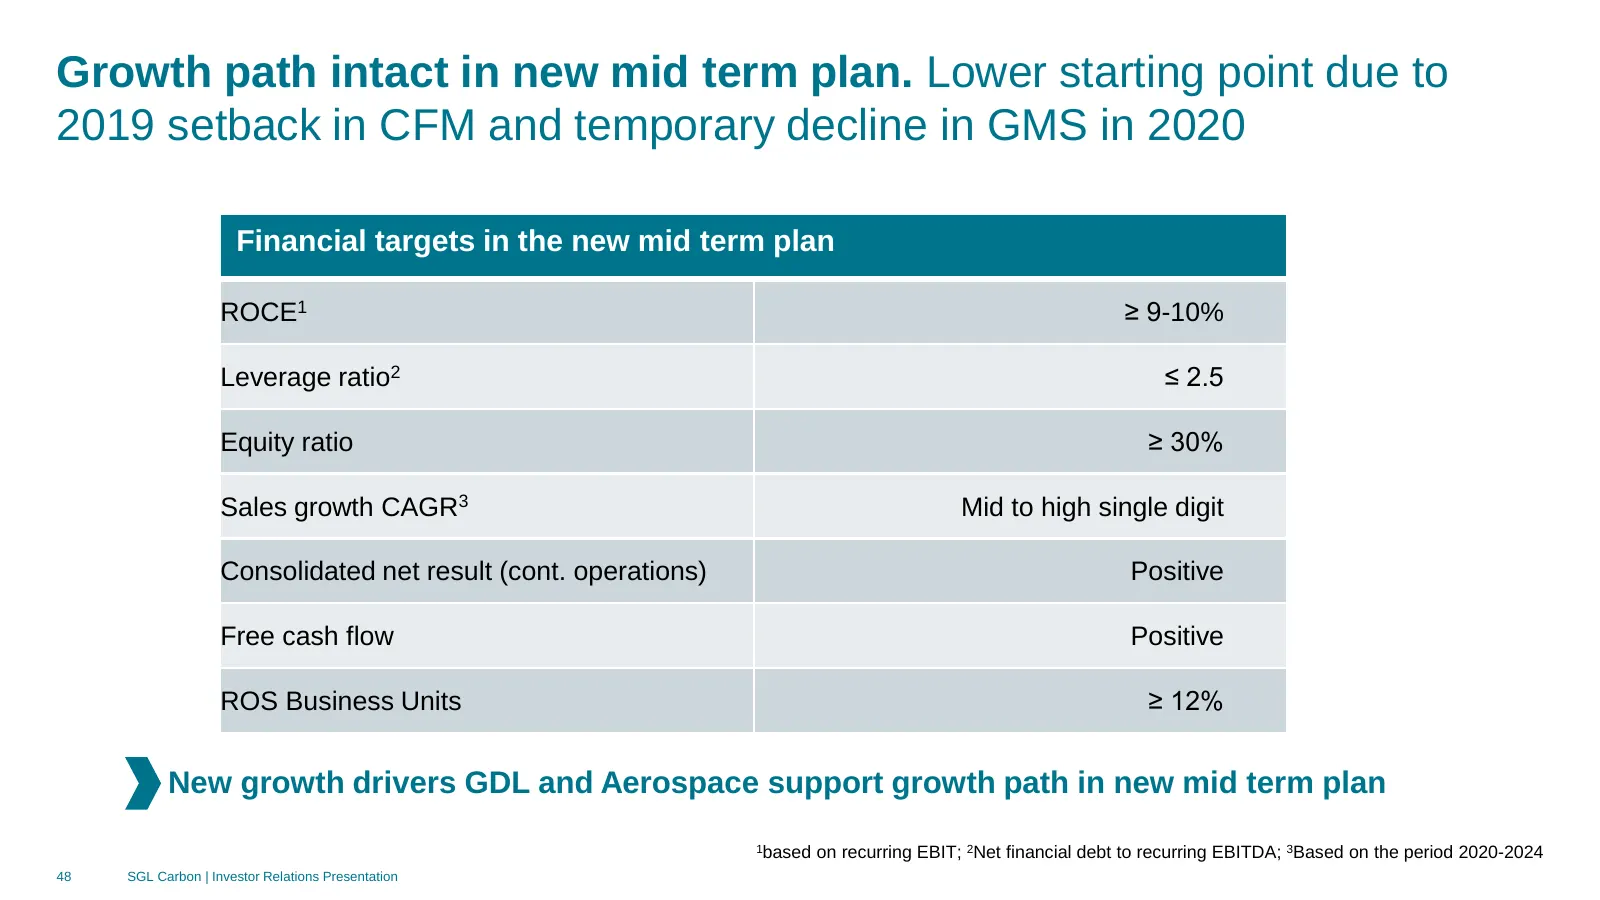
Slide 48: Growth path intact in new mid term plan
Growth path intact in new mid term plan. Lower starting point due to 2019 setback in CFM and temporary decline in GMS in 2020 Financial targets in the new mid term plan ROCE1 ≥ 9-10% Leverage ratio2 ≤ 2.5 Equity ratio ≥ 30% Sales growth CAGR3 Mid to high single digit Consolidated net result (cont. o
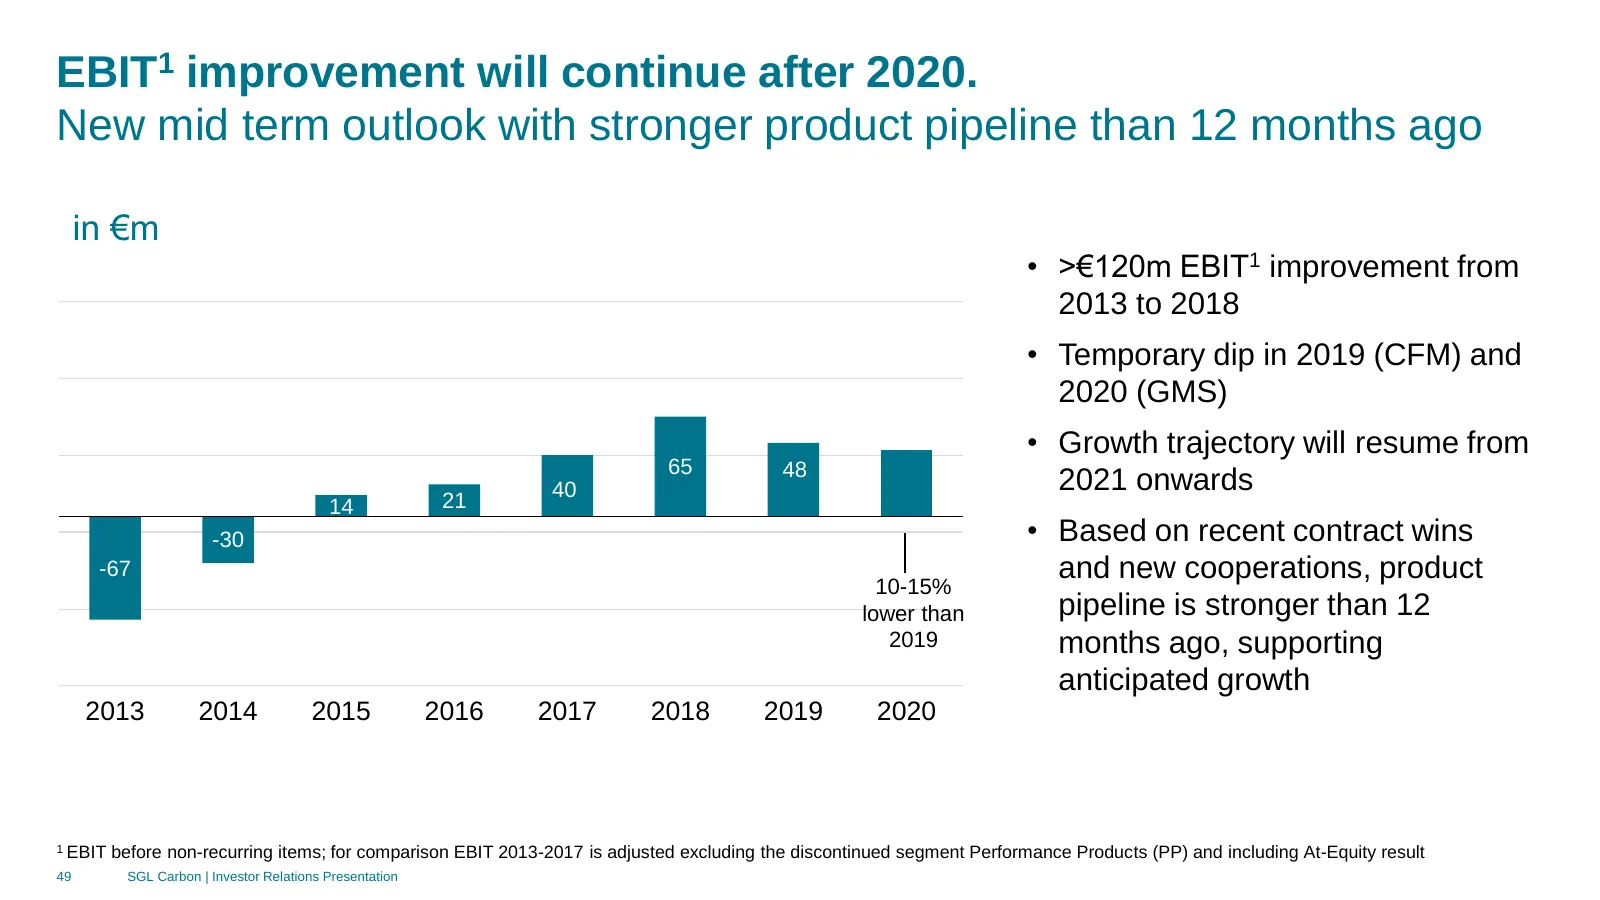
Slide 49: EBIT improvement will continue after 2020
EBIT1 improvement will continue after 2020. New mid term outlook with stronger product pipeline than 12 months ago in €m • >€120m EBIT1 improvement from 2013 to 2018 • Temporary dip in 2019 (CFM) and 2020 (GMS) • Growth trajectory will resume from 65 48 40 2021 onwards 14 21 -30 • Based on recent co

Slide 50: Summary
5 Summary 50 SGL Carbon | Investor Relations Presentation
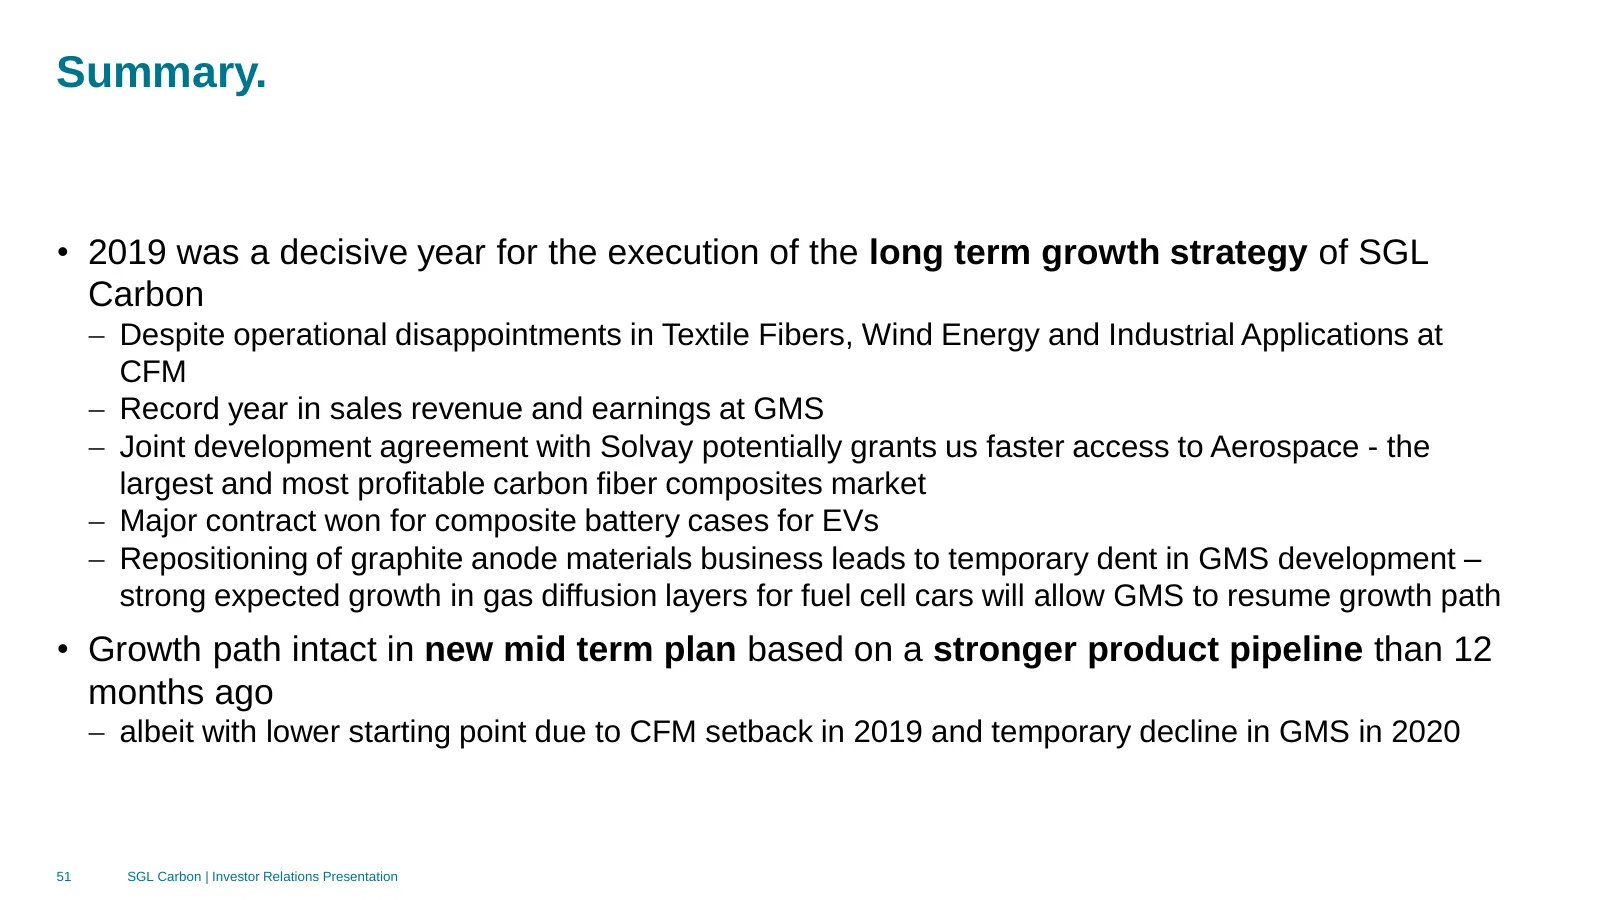
Slide 51: Summary
Summary. • 2019 was a decisive year for the execution of the long term growth strategy of SGL Carbon − Despite operational disappointments in Textile Fibers, Wind Energy and Industrial Applications at CFM − Record year in sales revenue and earnings at GMS − Joint development agreement with Solvay po

Slide 52: Q&A
Q&A 52 SGL Carbon | Investor Relations Presentation

Slide 53: Appendix
Appendix 53 SGL Carbon | Investor Relations Presentation
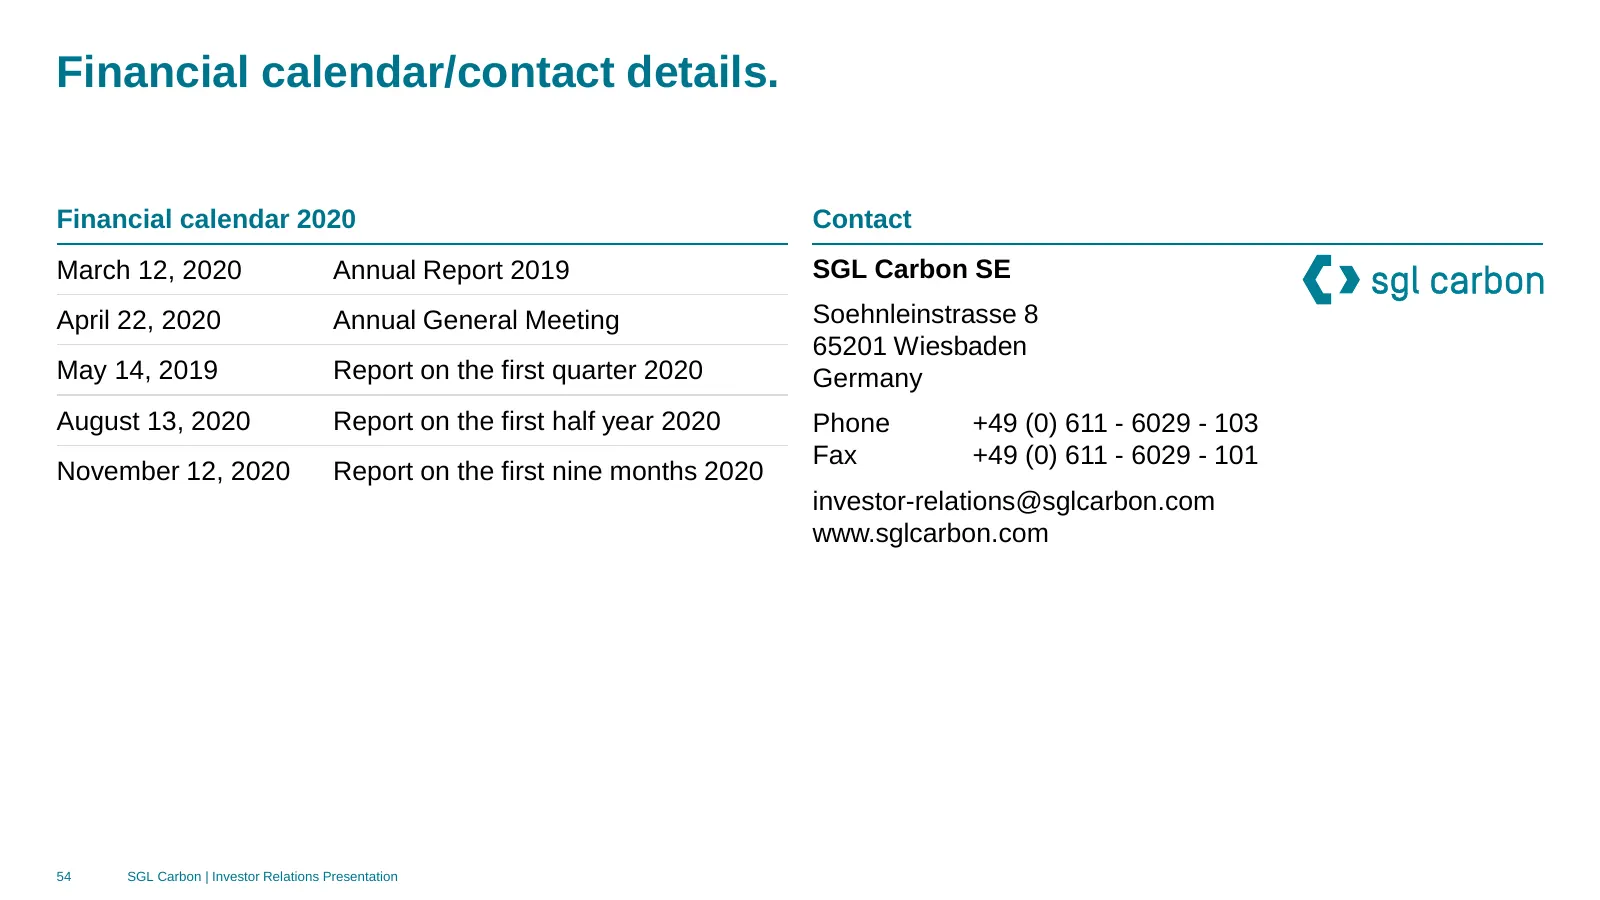
Slide 54: Financial calendar/contact details
Financial calendar/contact details. Financial calendar 2020 Contact March 12, 2020 Annual Report 2019 SGL Carbon SE April 22, 2020 Annual General Meeting Soehnleinstrasse 8 65201 Wiesbaden May 14, 2019 Report on the first quarter 2020 Germany August 13, 2020 Report on the first half year 2020 Phone
Slide 55: Important note
Important note. Important note: This presentation contains statements relating to certain projections and business trends that are forward-looking, including statements with respect to SGL Carbon’s outlook and business development, including developments in SGL Carbon’s Composites - Fibers & Materia
Source: Internet Archive copy of sglcarbon.com
More decks from SGL Carbon SE
 9M 2026 Earnings Presentation30 slides · Nov 5, 2026
 9M 2026 Earnings Presentation17 slides · Nov 5, 2026
 Q3 2024 Earnings Presentation28 slides · Nov 7, 2024
 H1 2024 Earnings Presentation18 slides · Aug 8, 2024
 Q1 2024 Earnings Presentation19 slides · May 8, 2024
 ESG Presentation (March 2024)7 slides · Mar 22, 2024