WellCare Health Plans — Merger or Acquisition (May 2019)
34 slides from WellCare Health Plans's merger presentation, May 14, 2019
Slide 1: Investor Update May 2019
Investor Update May 2019
Slide 2: Cautionary Statement on Forward-Looking Statements
Cautionary Statement on Forward-Looking StatementsAll statements, other than statements of current or historical fact, contained in this communication are forward-looking statements. Without limiting the foregoing, forward-looking statements often use words such as “believe,” “anticipate,” “plan,” “
Slide 3: Important Additional Information and Where to Find It
This list of important factors is not intended to be exhaustive. We discuss certain of these matters more fully, as well as certain other factors that may affect Centene’s business operations, financial condition and results of operations, in Centene’s filings with the Securities and Exchange Commis
Slide 4: Centene + WellCare: A Compelling Combination to Continue Building Shareholder Value
Centene + WellCare:A Compelling Combination to Continue Building Shareholder Value
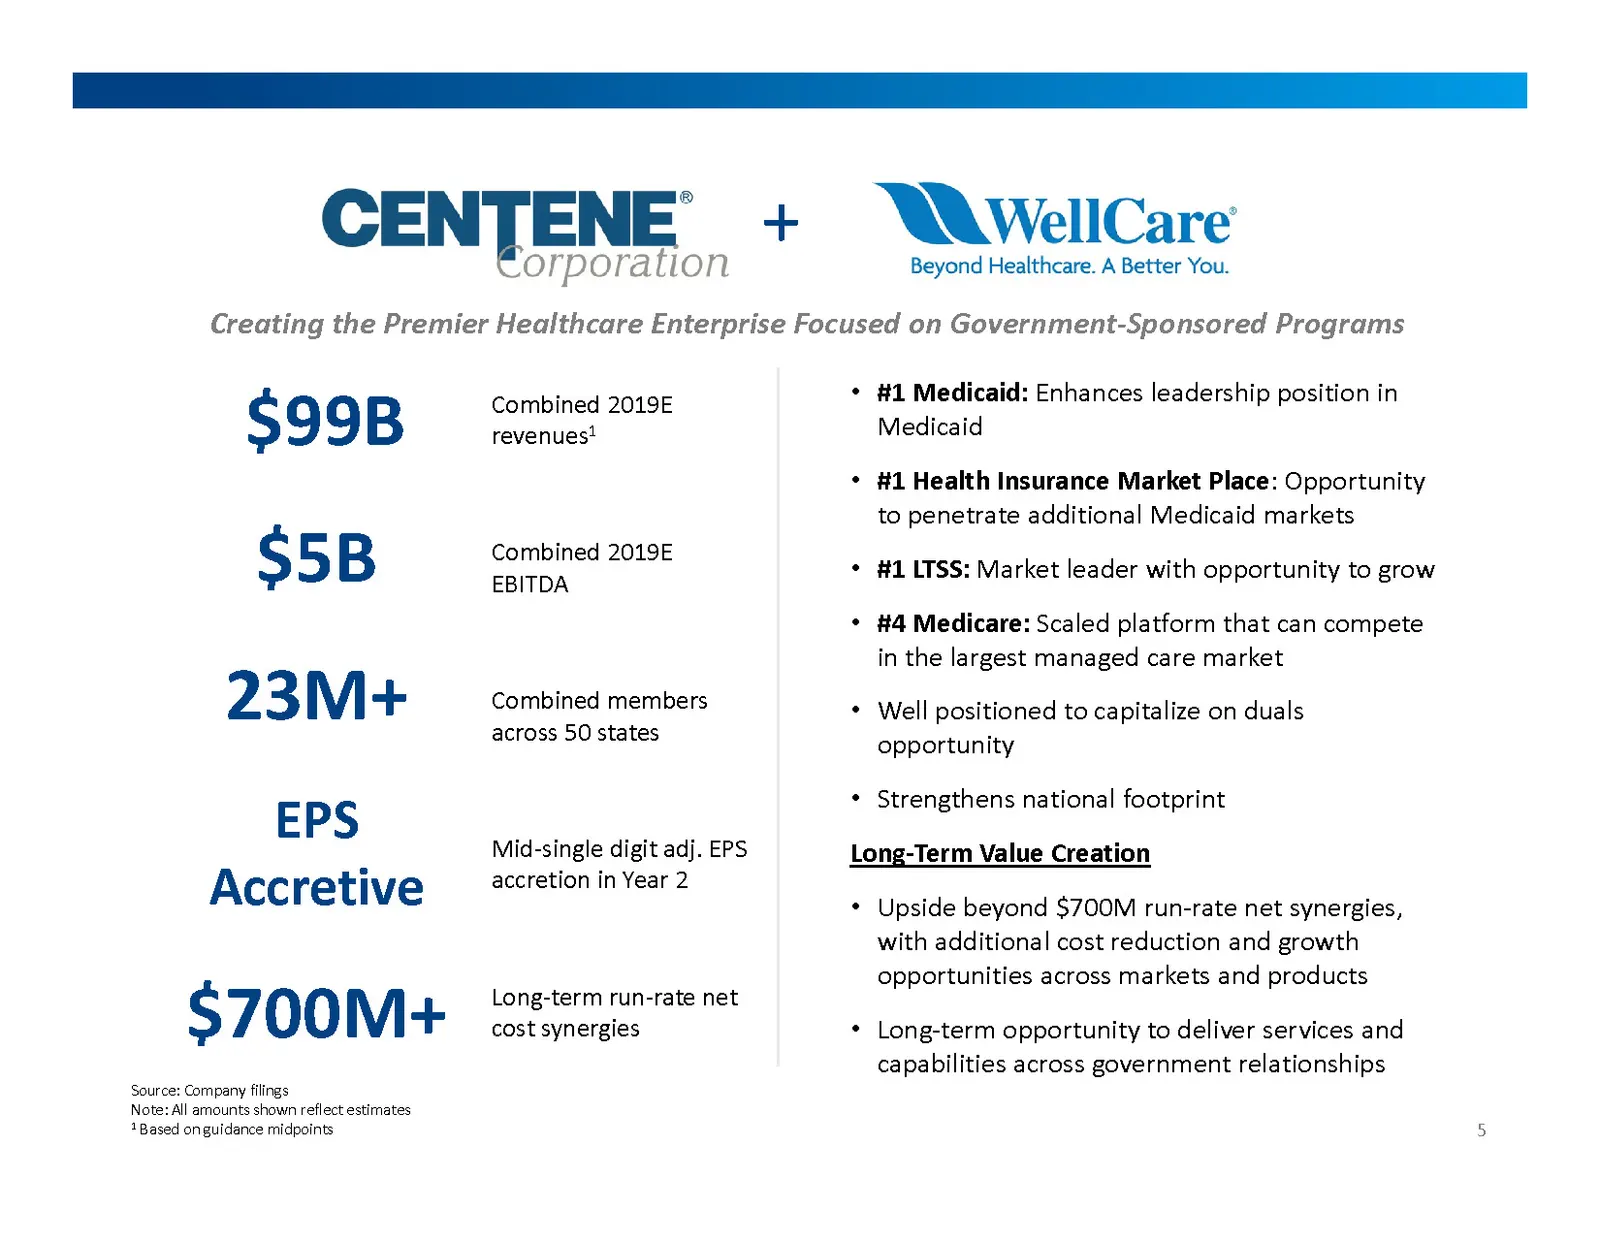
Slide 5: Creating the Premier Healthcare Enterprise
5 $700M+ Long-term run-rate net cost synergies EPSAccretive Mid-single digit adj. EPS accretion in Year 2 Combined 2019E revenues1 Combined 2019E EBITDA 23M+ Combined members across 50 states $99B $5B #1 Medicaid: Enhances leadership position in Medicaid#1 Health Insurance Market Place: Opportunity
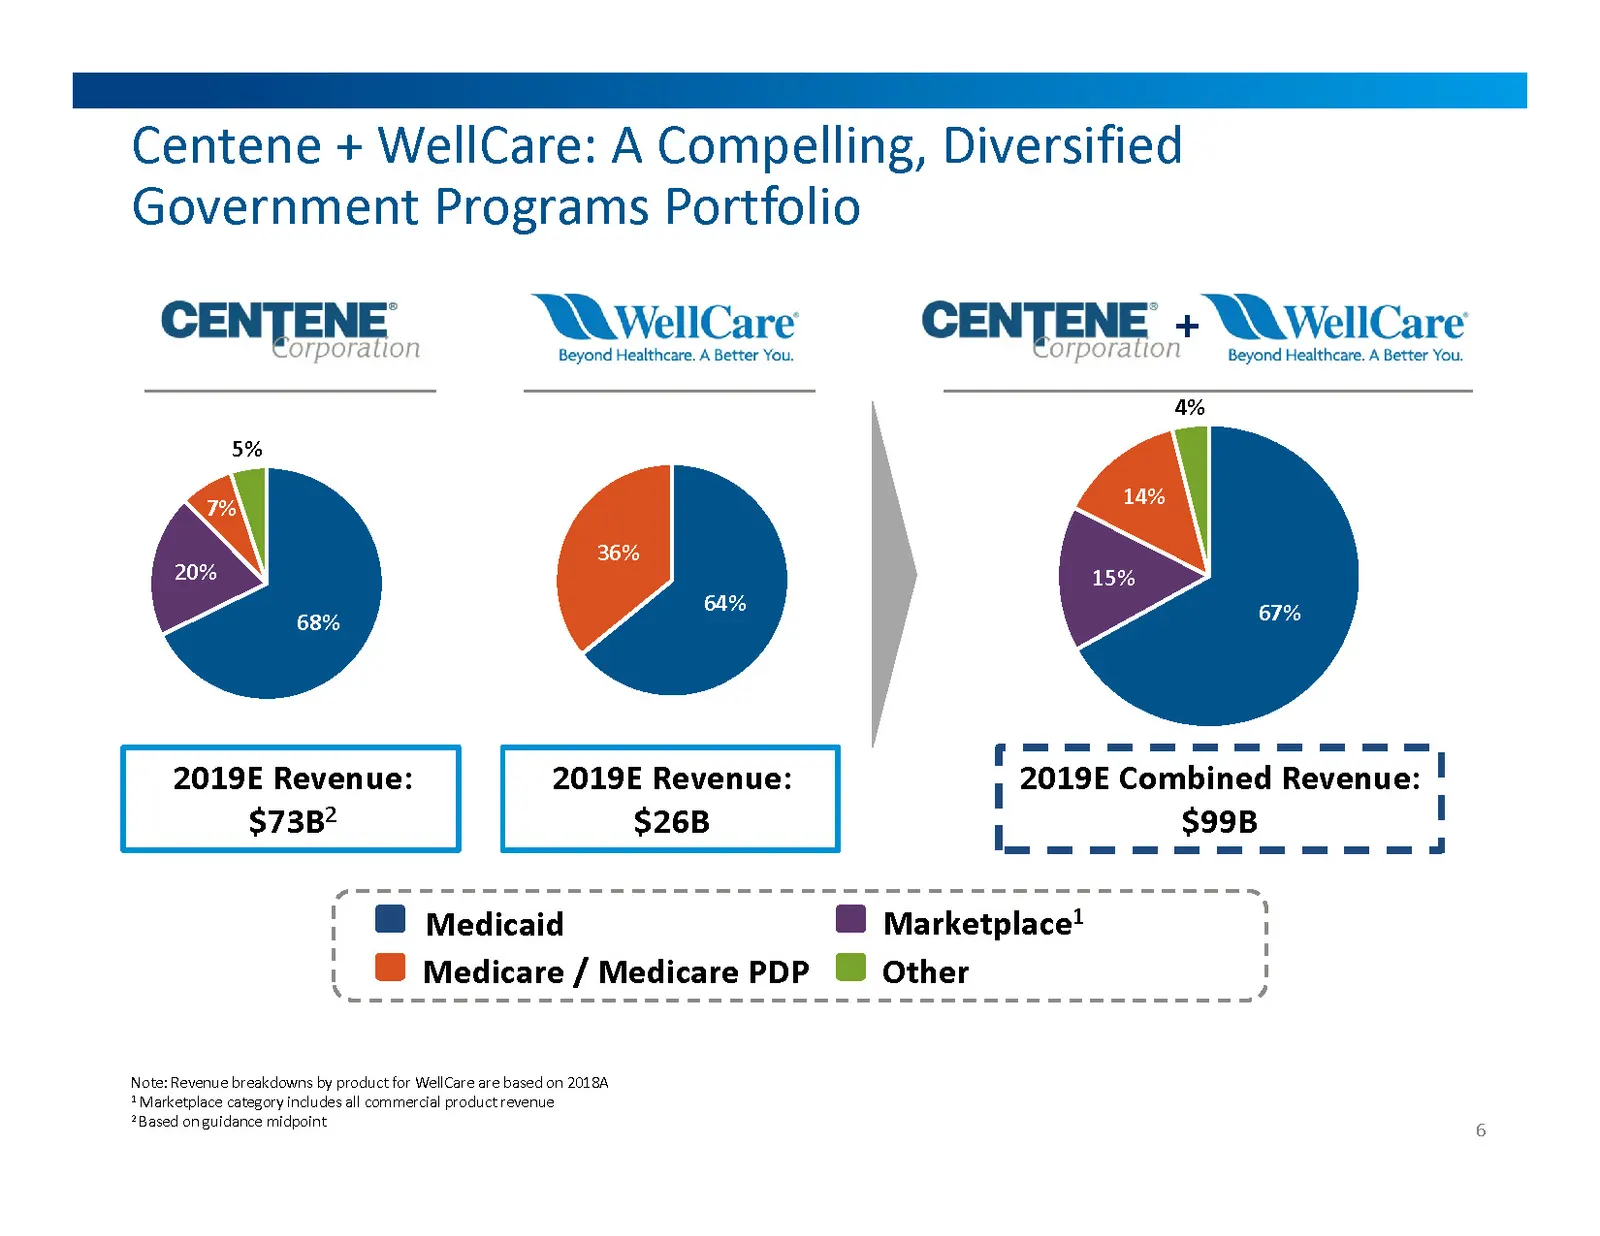
Slide 6: A Compelling, Diversified Government Programs Portfolio
Marketplace1 Medicaid Medicare / Medicare PDP Other 2019E Combined Revenue: $99B + Note: Revenue breakdowns by product for WellCare are based on 2018A1 Marketplace category includes all commercial product revenue2 Based on guidance midpoint 2019E Revenue: $73B2 2019E Revenue: $26B 6 Centene + WellCa
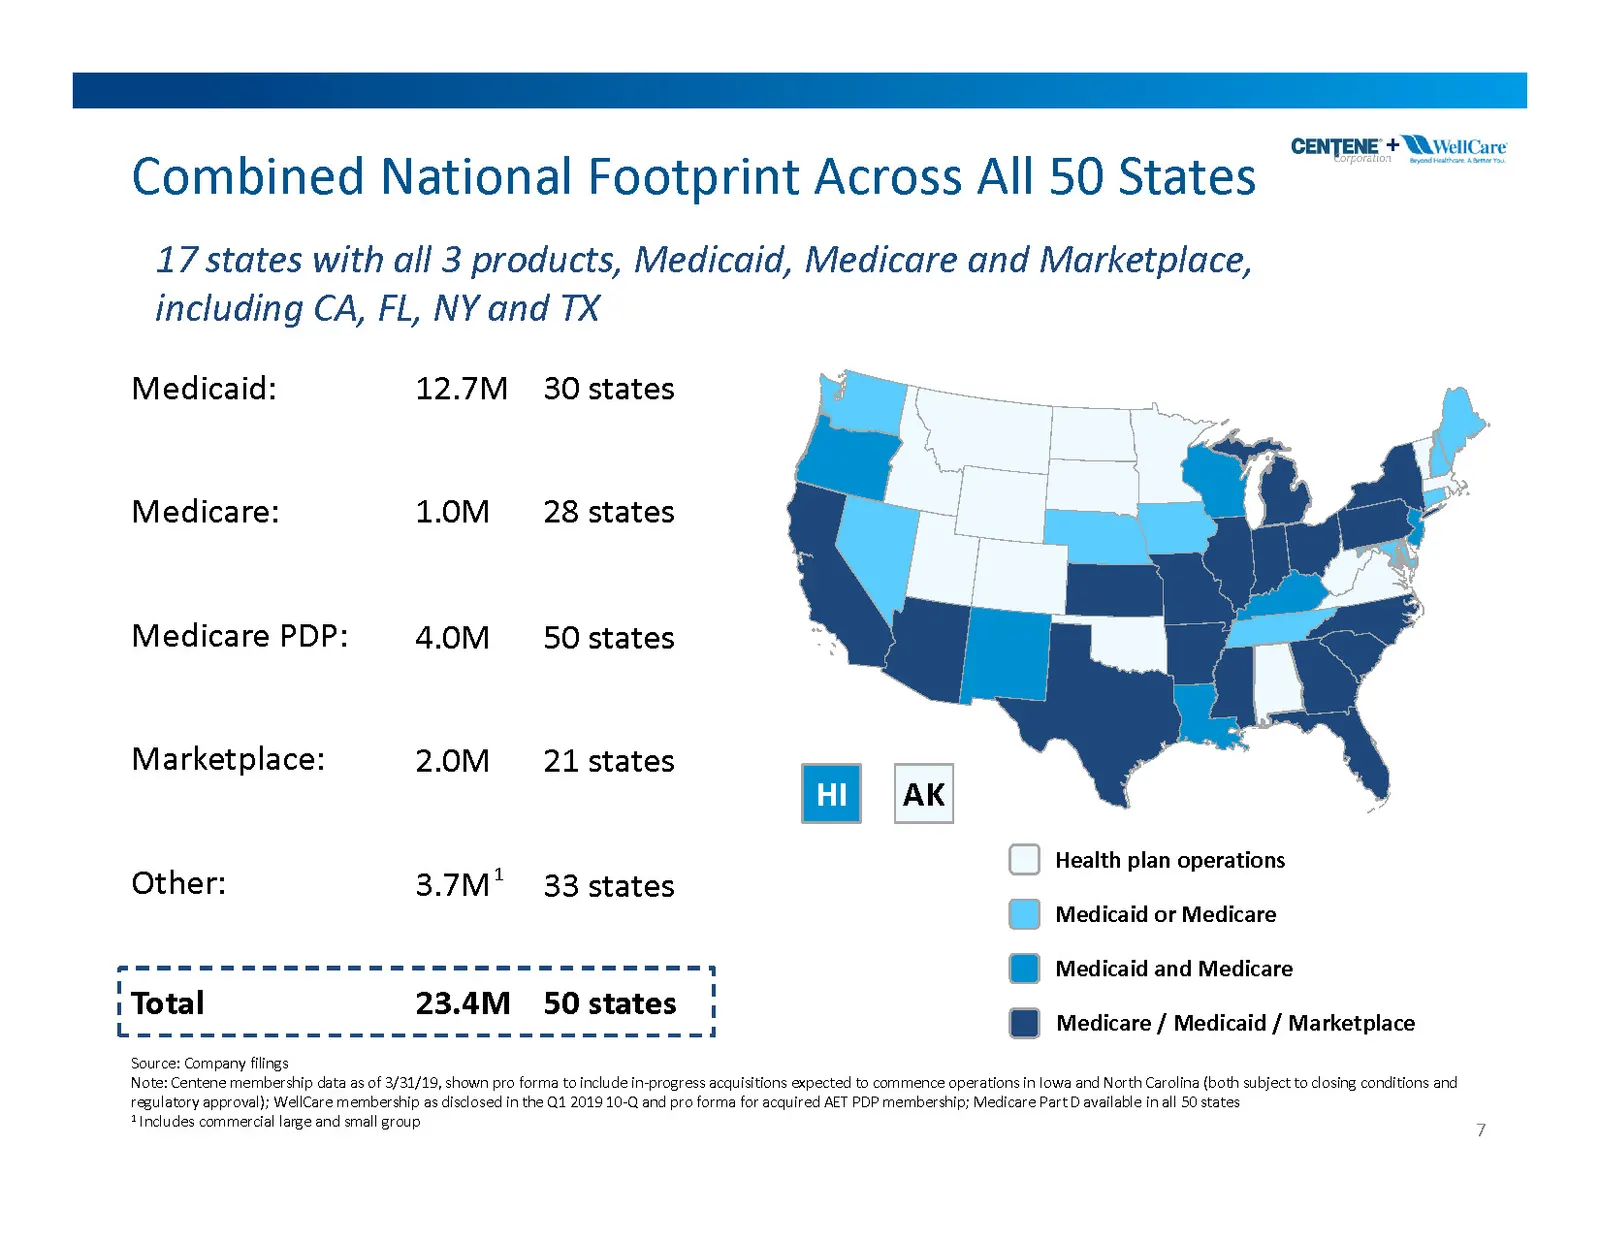
Slide 7: Combined National Footprint Across All States
Combined National Footprint Across All 50 States 7 33 states 50 states Source: Company filingsNote: Centene membership data as of 3/31/19, shown pro forma to include in-progress acquisitions expected to commence operations in Iowa and North Carolina (both subject to closing conditions and regulatory
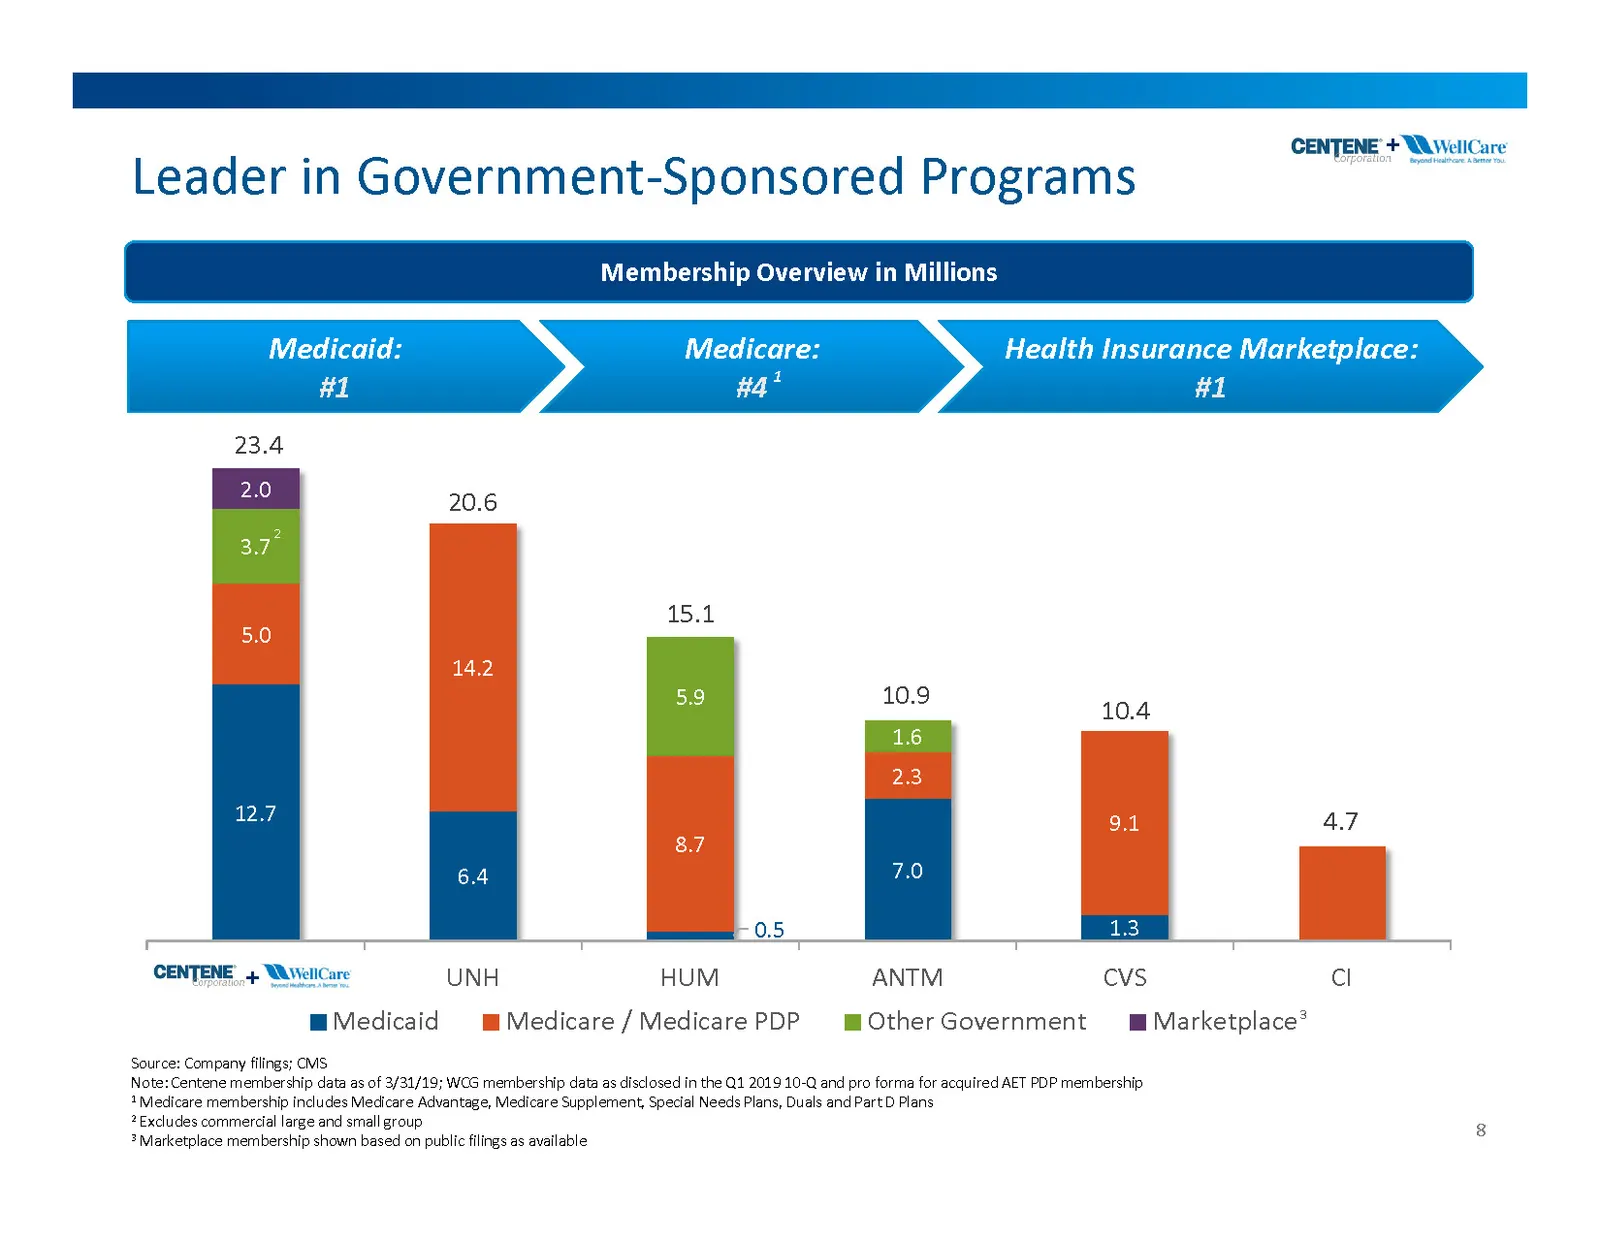
Slide 8: Leader in Government-Sponsored Programs
Leader in Government-Sponsored Programs 8 Membership Overview in Millions 23.4 20.6 15.1 10.9 10.4 4.7 Medicaid:#1 Medicare:#4 Health Insurance Marketplace:#1 Source: Company filings; CMSNote: Centene membership data as of 3/31/19; WCG membership data as disclosed in the Q1 2019 10-Q and pro forma f
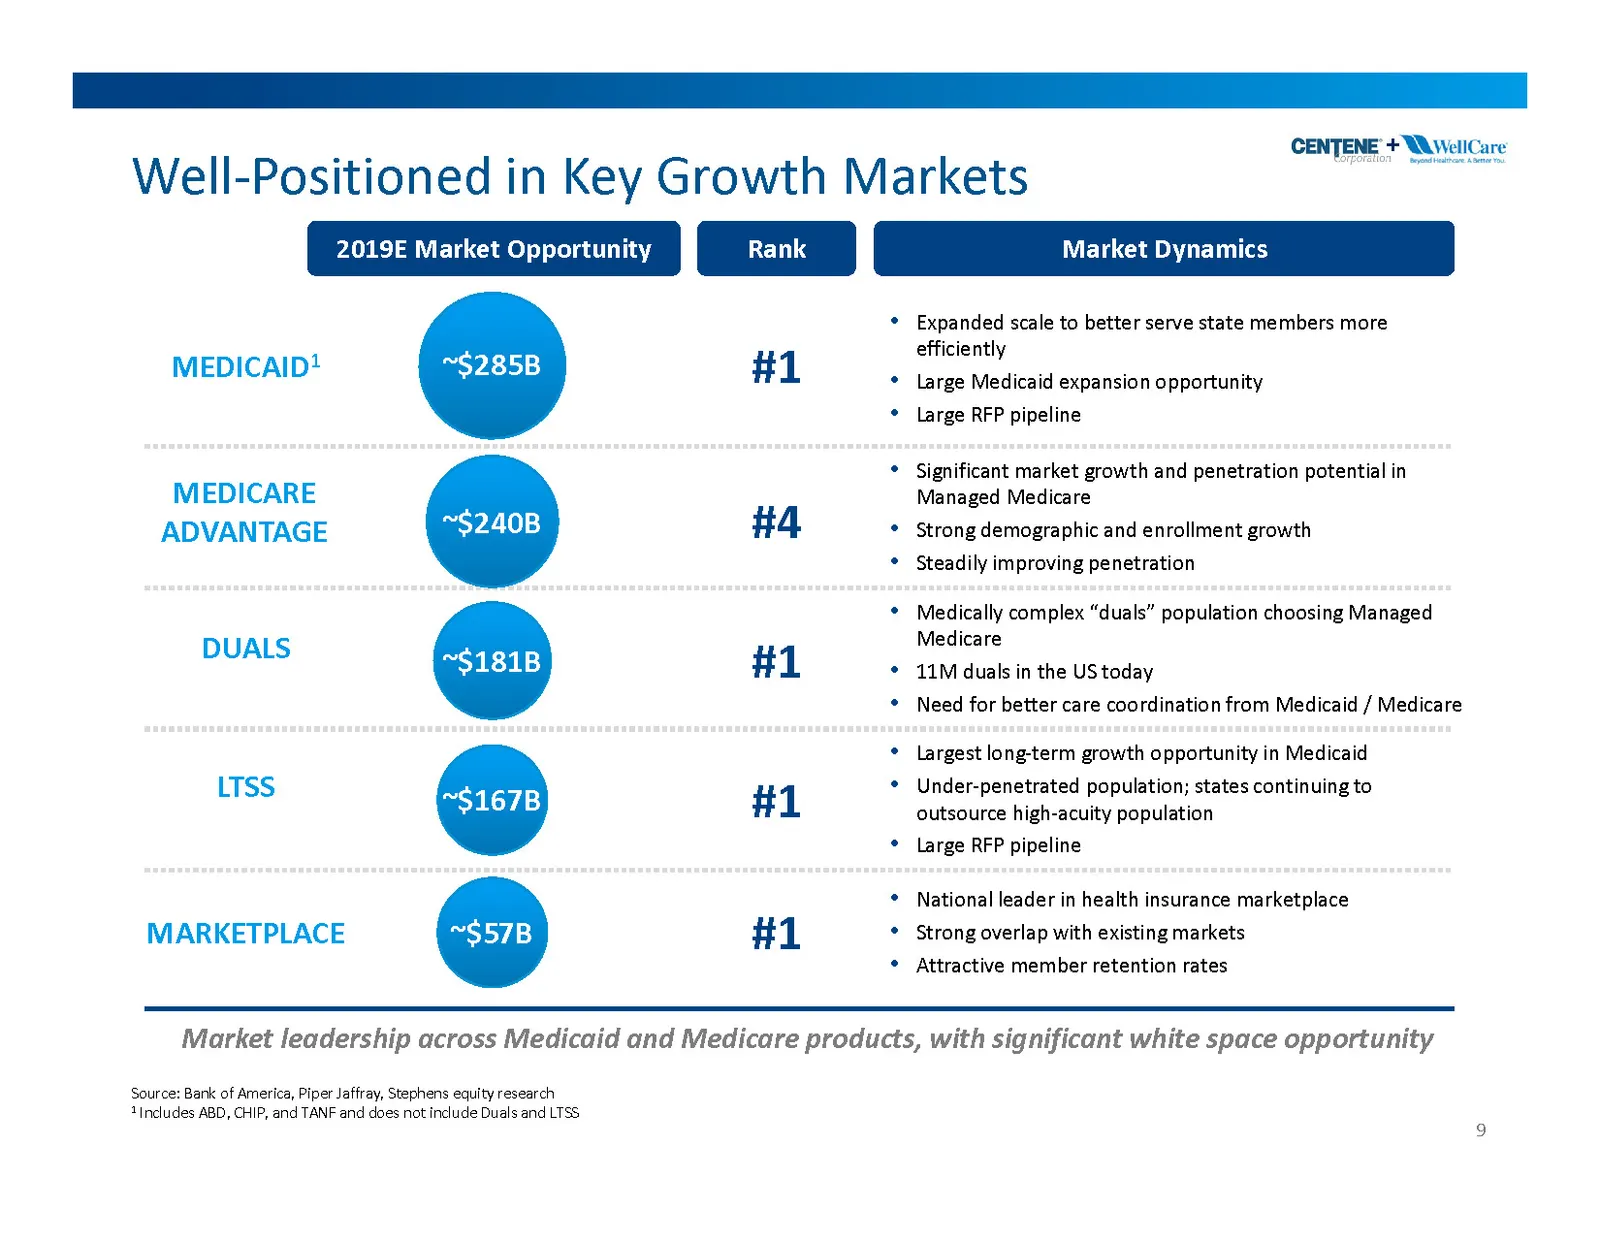
Slide 9: Well-Positioned in Key Growth Markets
Well-Positioned in Key Growth Markets 9 Source: Bank of America, Piper Jaffray, Stephens equity research1 Includes ABD, CHIP, and TANF and does not include Duals and LTSS Market Dynamics 2019E Market Opportunity Rank MEDICAID1 MEDICAREADVANTAGE DUALS LTSS Expanded scale to better serve state members
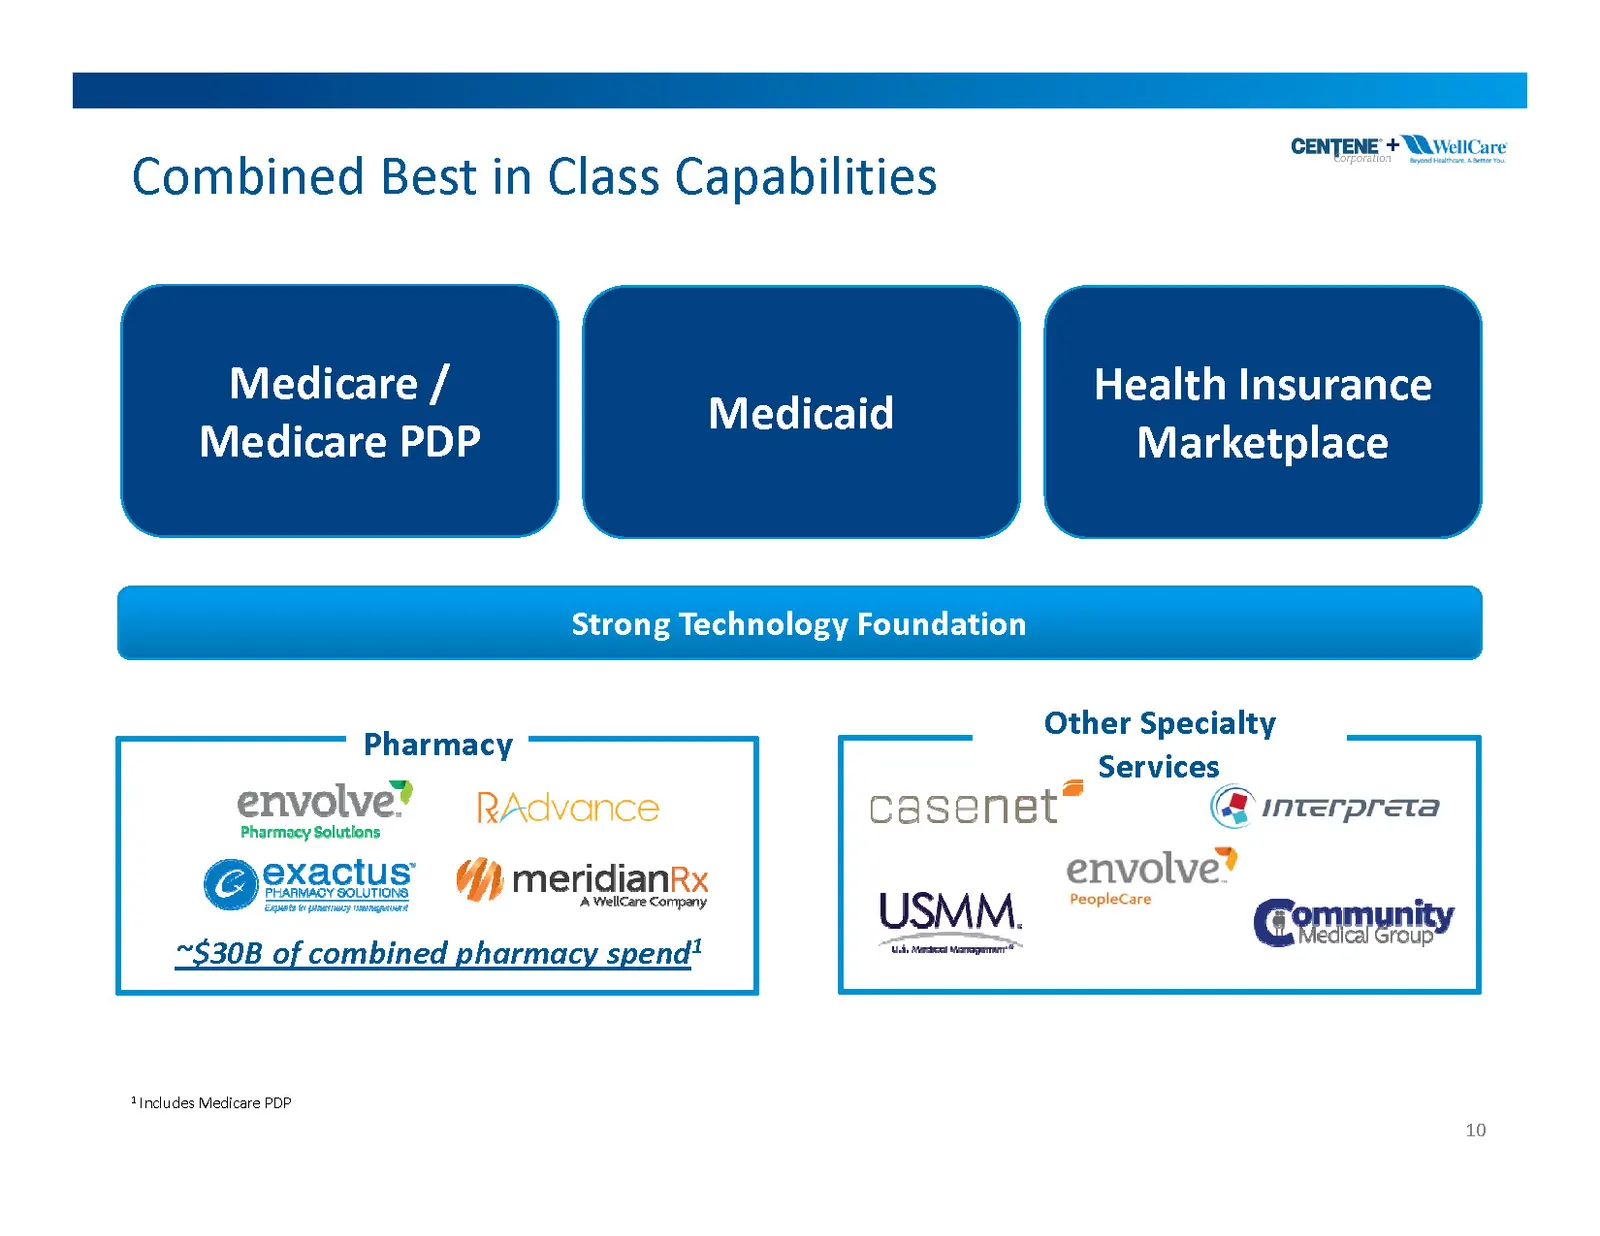
Slide 10: Combined Best in Class Capabilities
Combined Best in Class Capabilities 10 Strong Technology Foundation Pharmacy Medicare /Medicare PDP Medicaid Health Insurance Marketplace Other Specialty Services ~$30B of combined pharmacy spend1 1 Includes Medicare PDP +
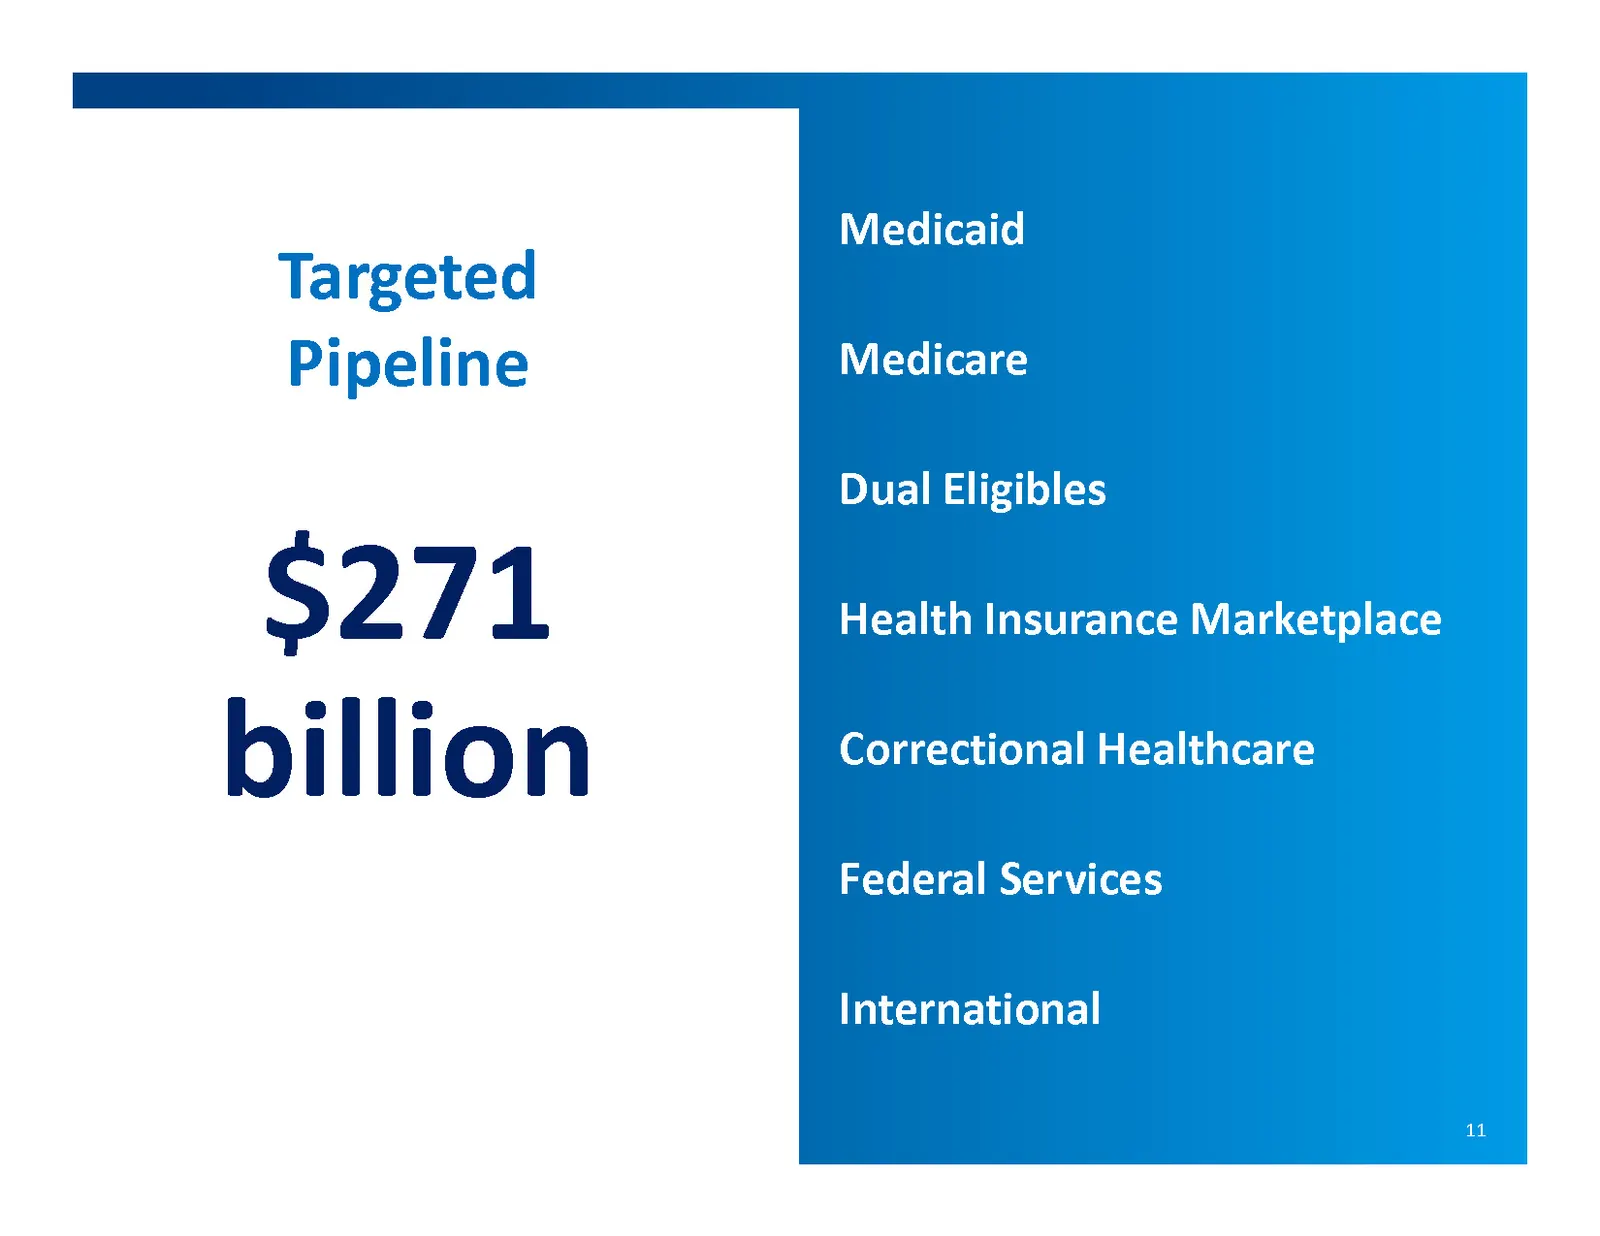
Slide 11: $271 billion Targeted Pipeline
$271billion TargetedPipeline 11 Correctional Healthcare Health Insurance Marketplace Federal Services Medicaid Medicare International Dual Eligibles
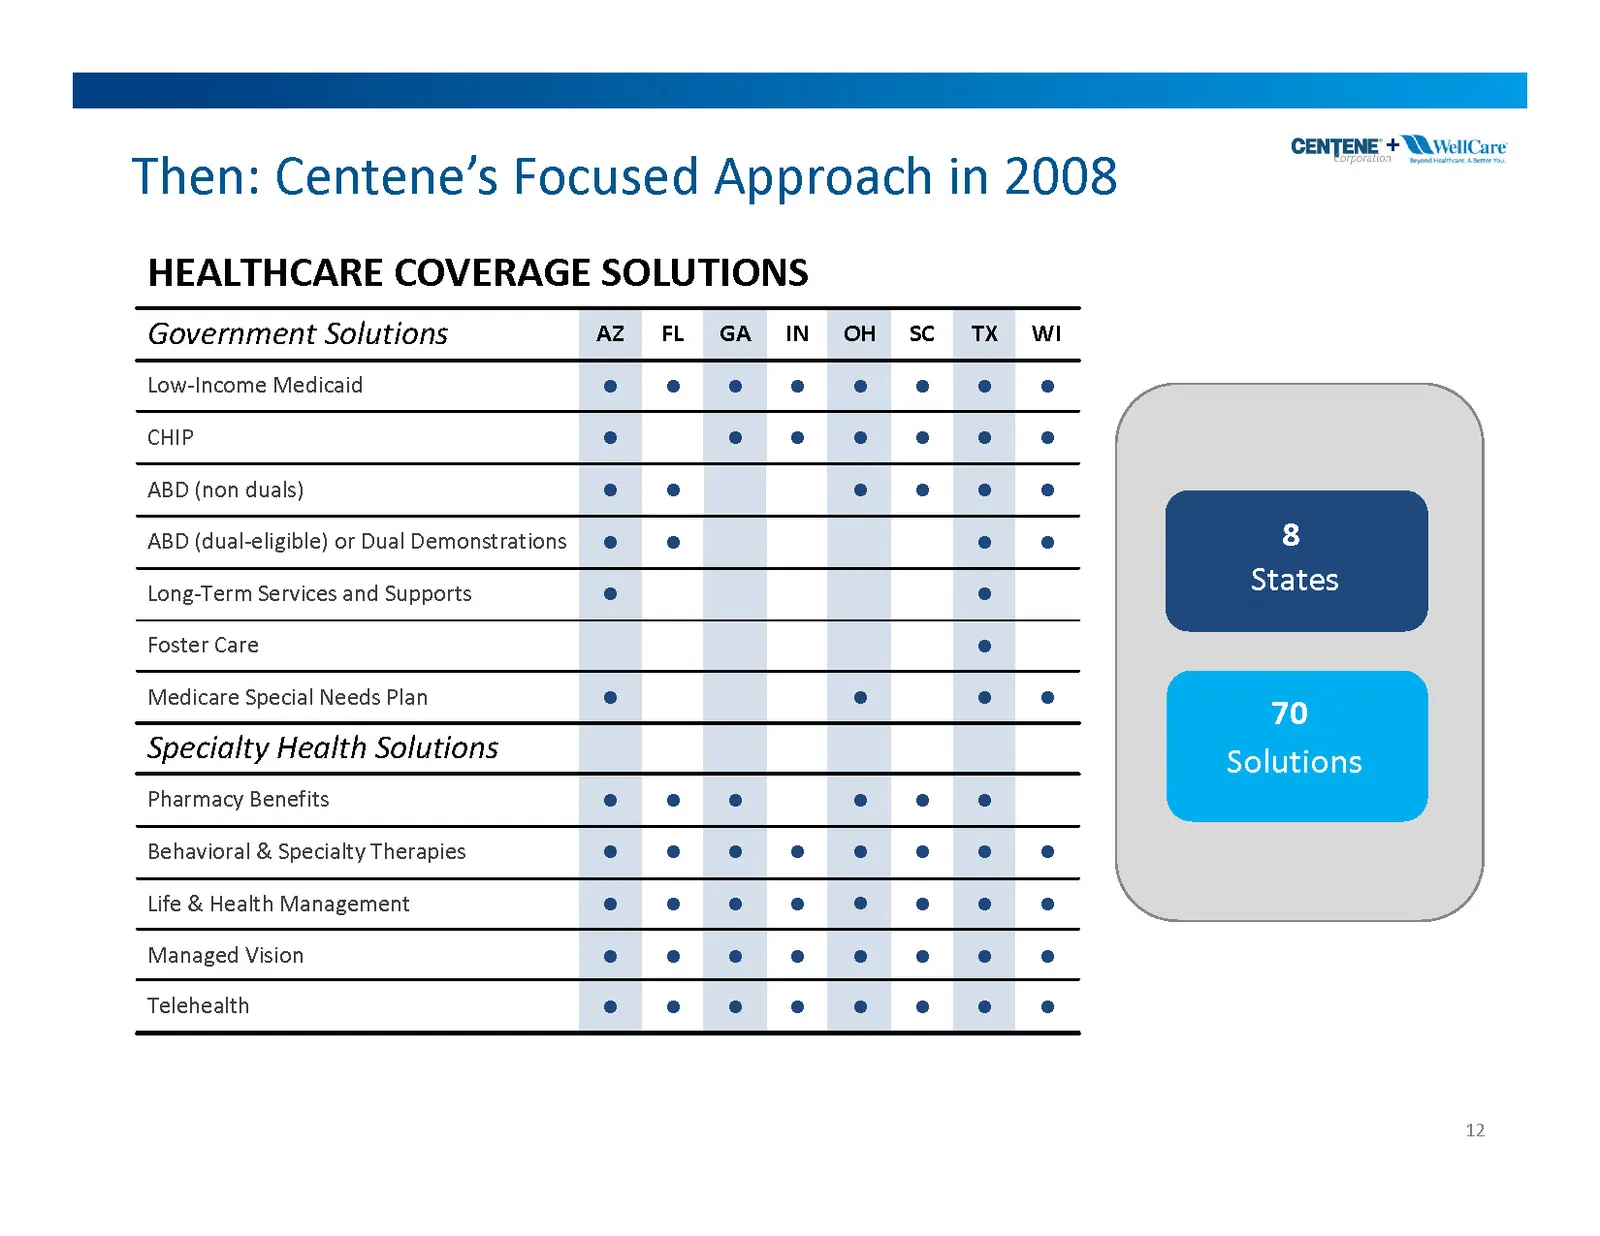
Slide 12: Centene's Focused Approach in 2008 and Then
States 70 Solutions 8 Then: Centene’s Focused Approach in 2008 12 +
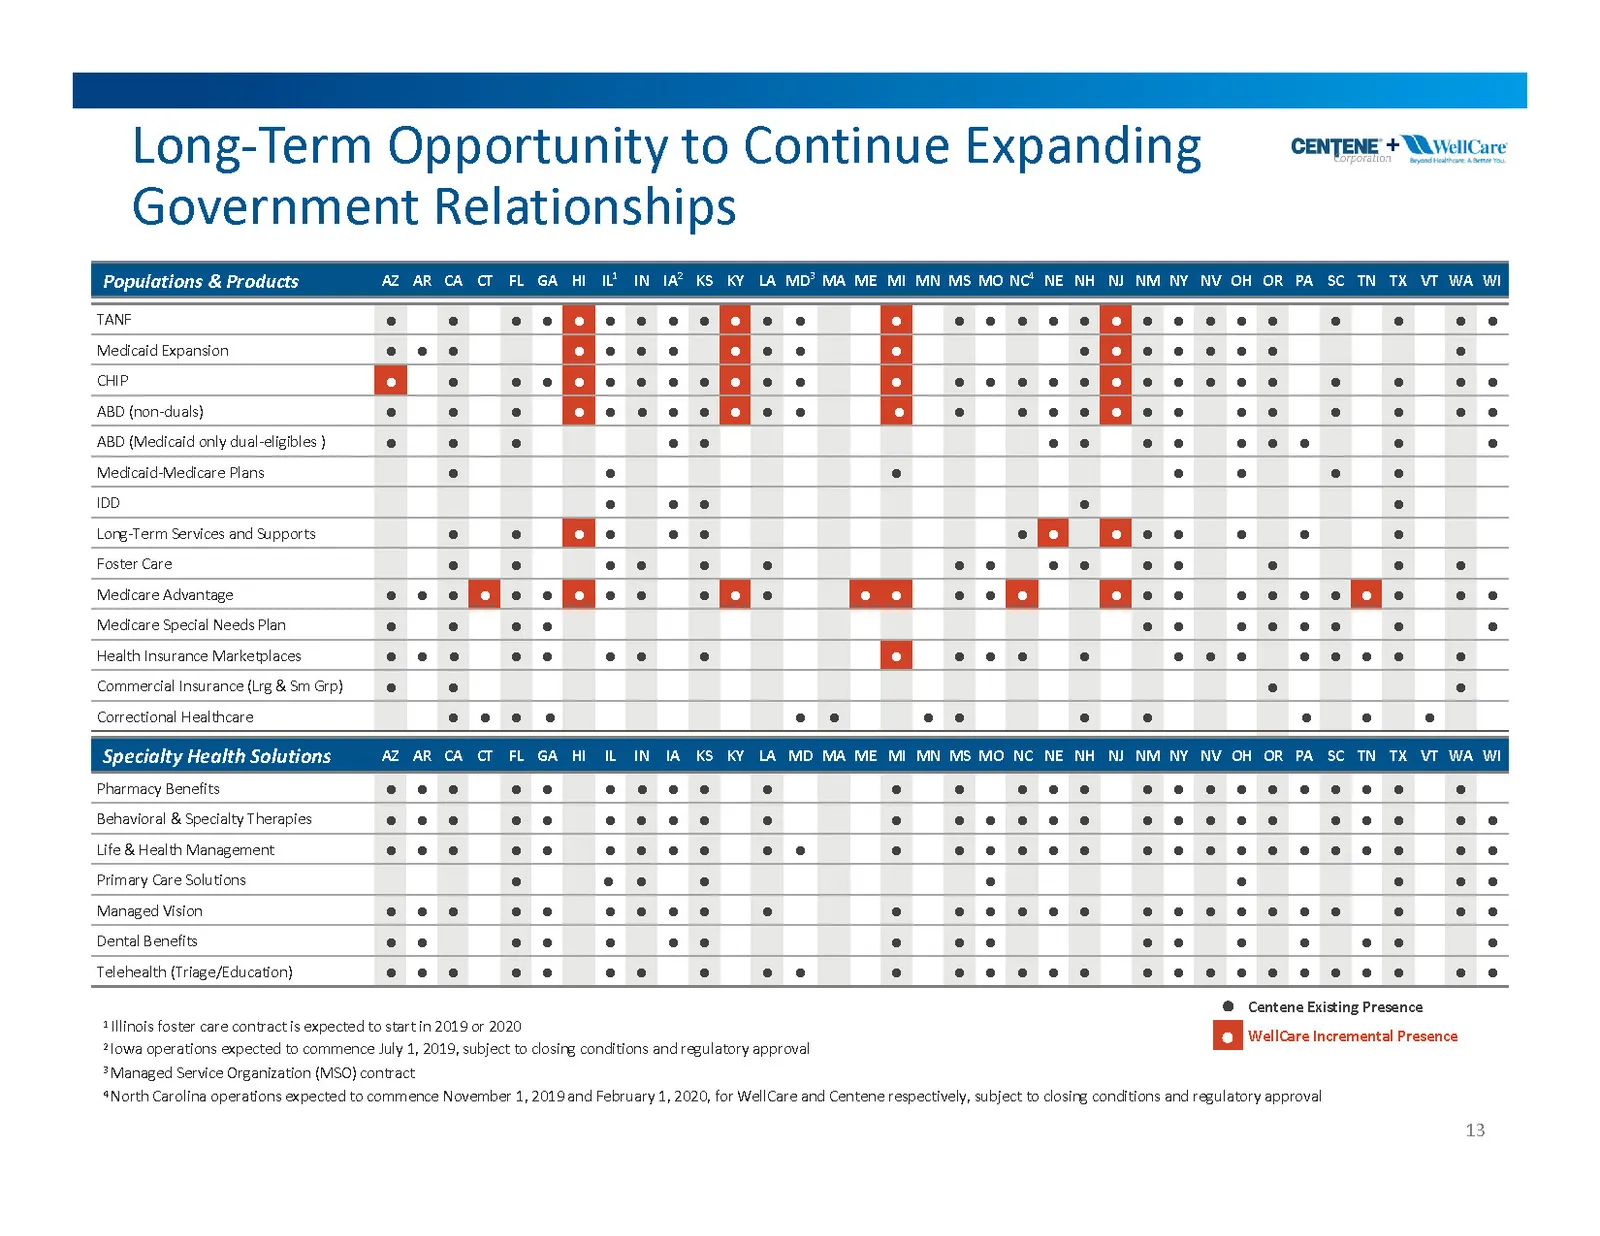
Slide 13: Long-Term Opportunity to Continue Expanding Government Relationships
Long-Term Opportunity to Continue Expanding Government Relationships Populations & Products AZ AR CA CT FL GA HI IL1 IN IA2 KS KY LA MD3 MA ME MI MN MS MO NC4 NE NH NJ NM NY NV OH OR PA SC TN TX VT WA WI TANF ● ● ● ● ● ● ● ● ● ● ● ● ● ● ● ● ● ● ● ● ● ● ● ● ● ● ● ● Medicaid Expansion ● ● ● ● ● ● ● ●
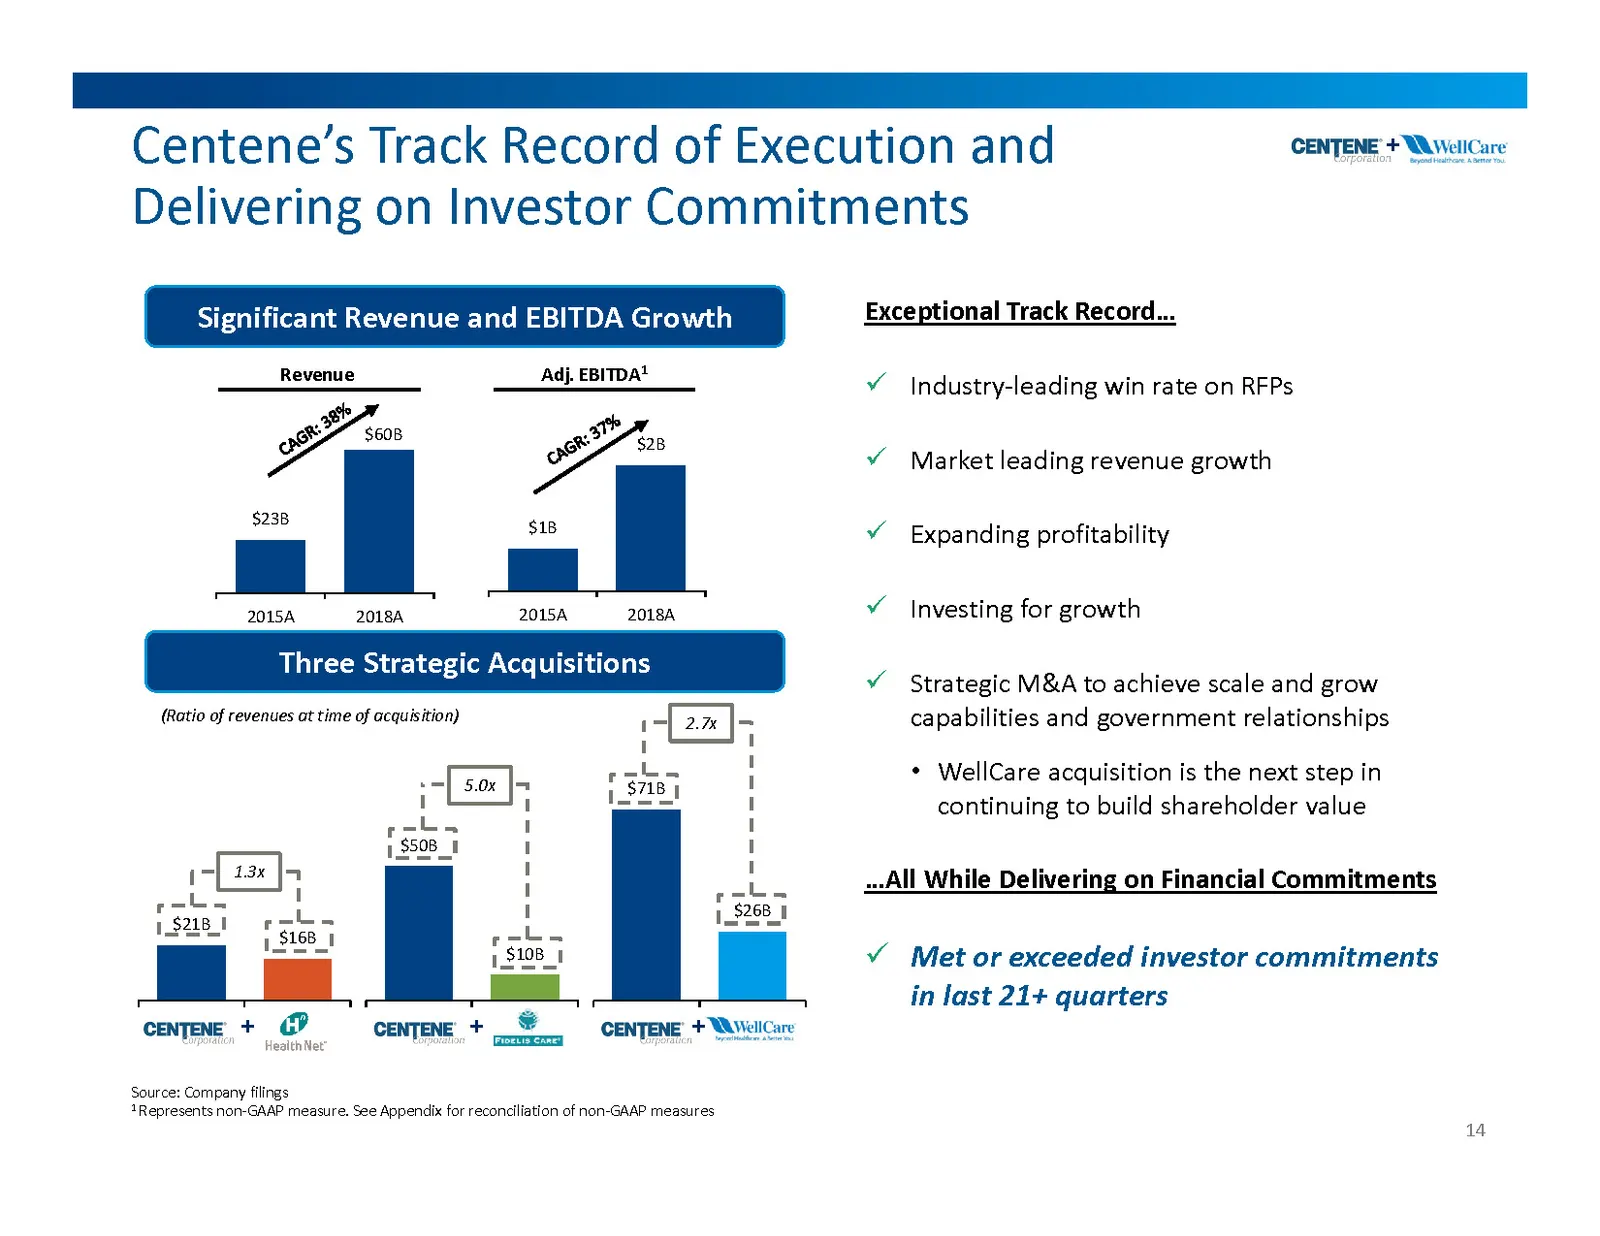
Slide 14: Centene's Track Record of Execution and Delivering on Investor Commitments
14 Centene’s Track Record of Execution and Delivering on Investor Commitments Exceptional Track Record…Industry-leading win rate on RFPsMarket leading revenue growthExpanding profitabilityInvesting for growthStrategic M&A to achieve scale and grow capabilities and government relationshipsWellCare ac
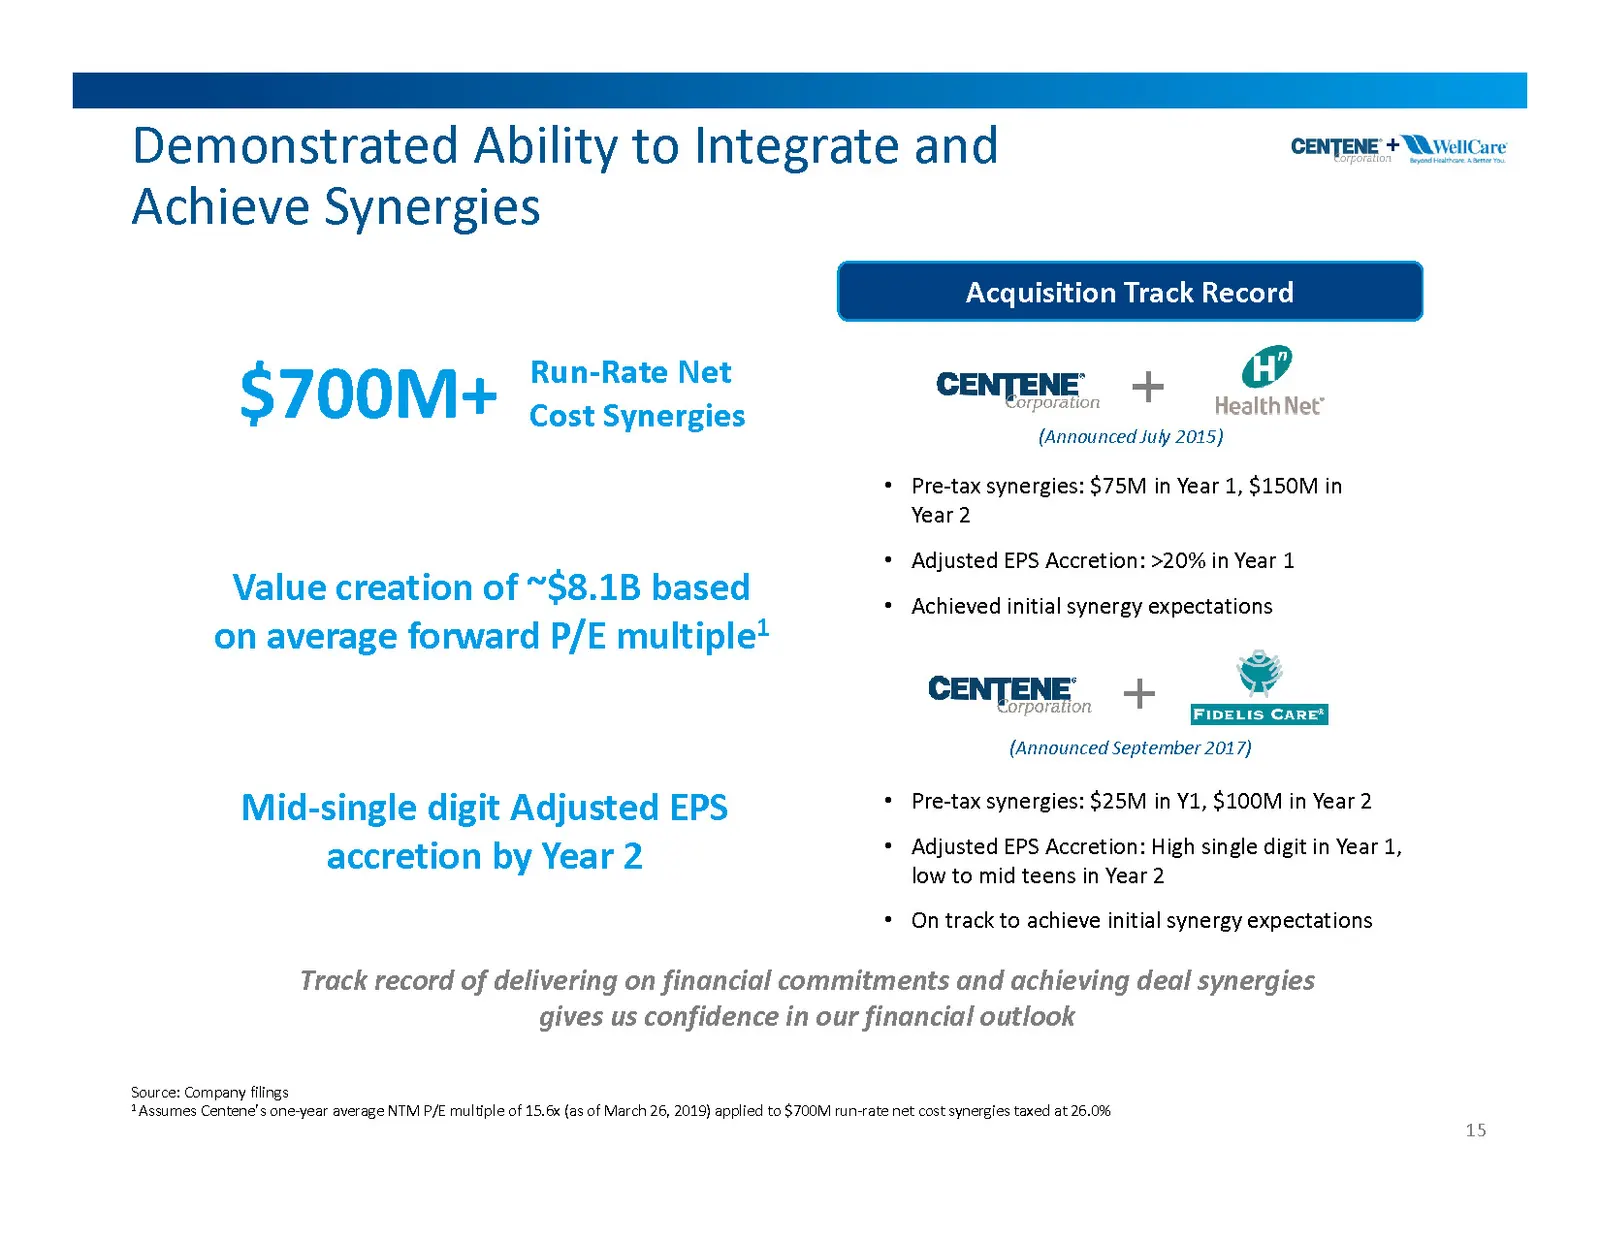
Slide 15: Demonstrated Ability to Integrate and Achieve Synergies
Demonstrated Ability to Integrate and Achieve Synergies 15 Source: Company filings1 Assumes Centene’s one-year average NTM P/E multiple of 15.6x (as of March 26, 2019) applied to $700M run-rate net cost synergies taxed at 26.0% Track record of delivering on financial commitments and achieving deal s
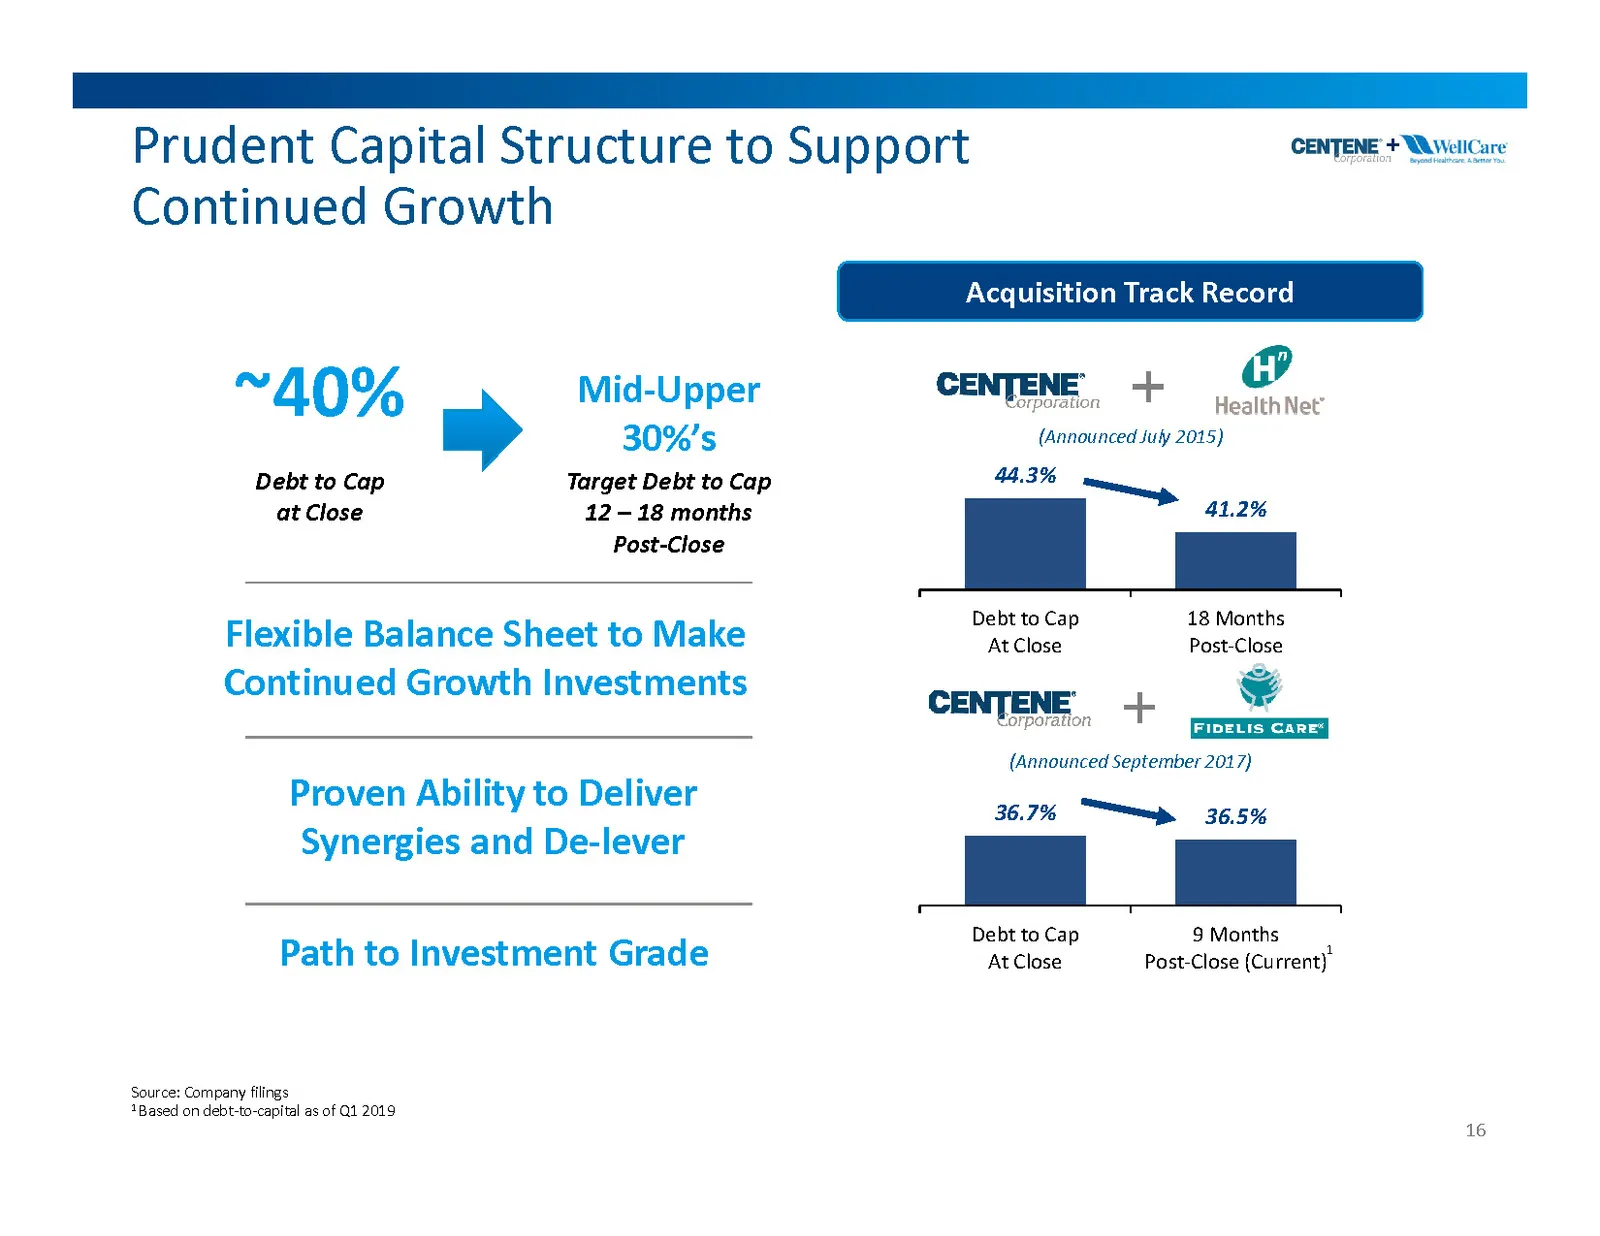
Slide 16: Prudent Capital Structure to Support Continued Growth
Prudent Capital Structure to SupportContinued Growth 16 Health Net Close: March 24, 2016Health Net Debt to Cap based on Q1 2016 and Q1 2017 10KFidelis Close: July 2, 2018Fidelis Debt to Cap based on Q3 2018 and Q1 2019 (6 months) Path to Investment Grade Debt to Cap at Close ~40% Mid-Upper 30%’s Tar
Slide 17: Strong Track Record of Operational and Financial Performance
Strong Track Record of Operational and Financial Performance
Slide 18: Track Record of Consistent Outperformance and Disciplined Growth
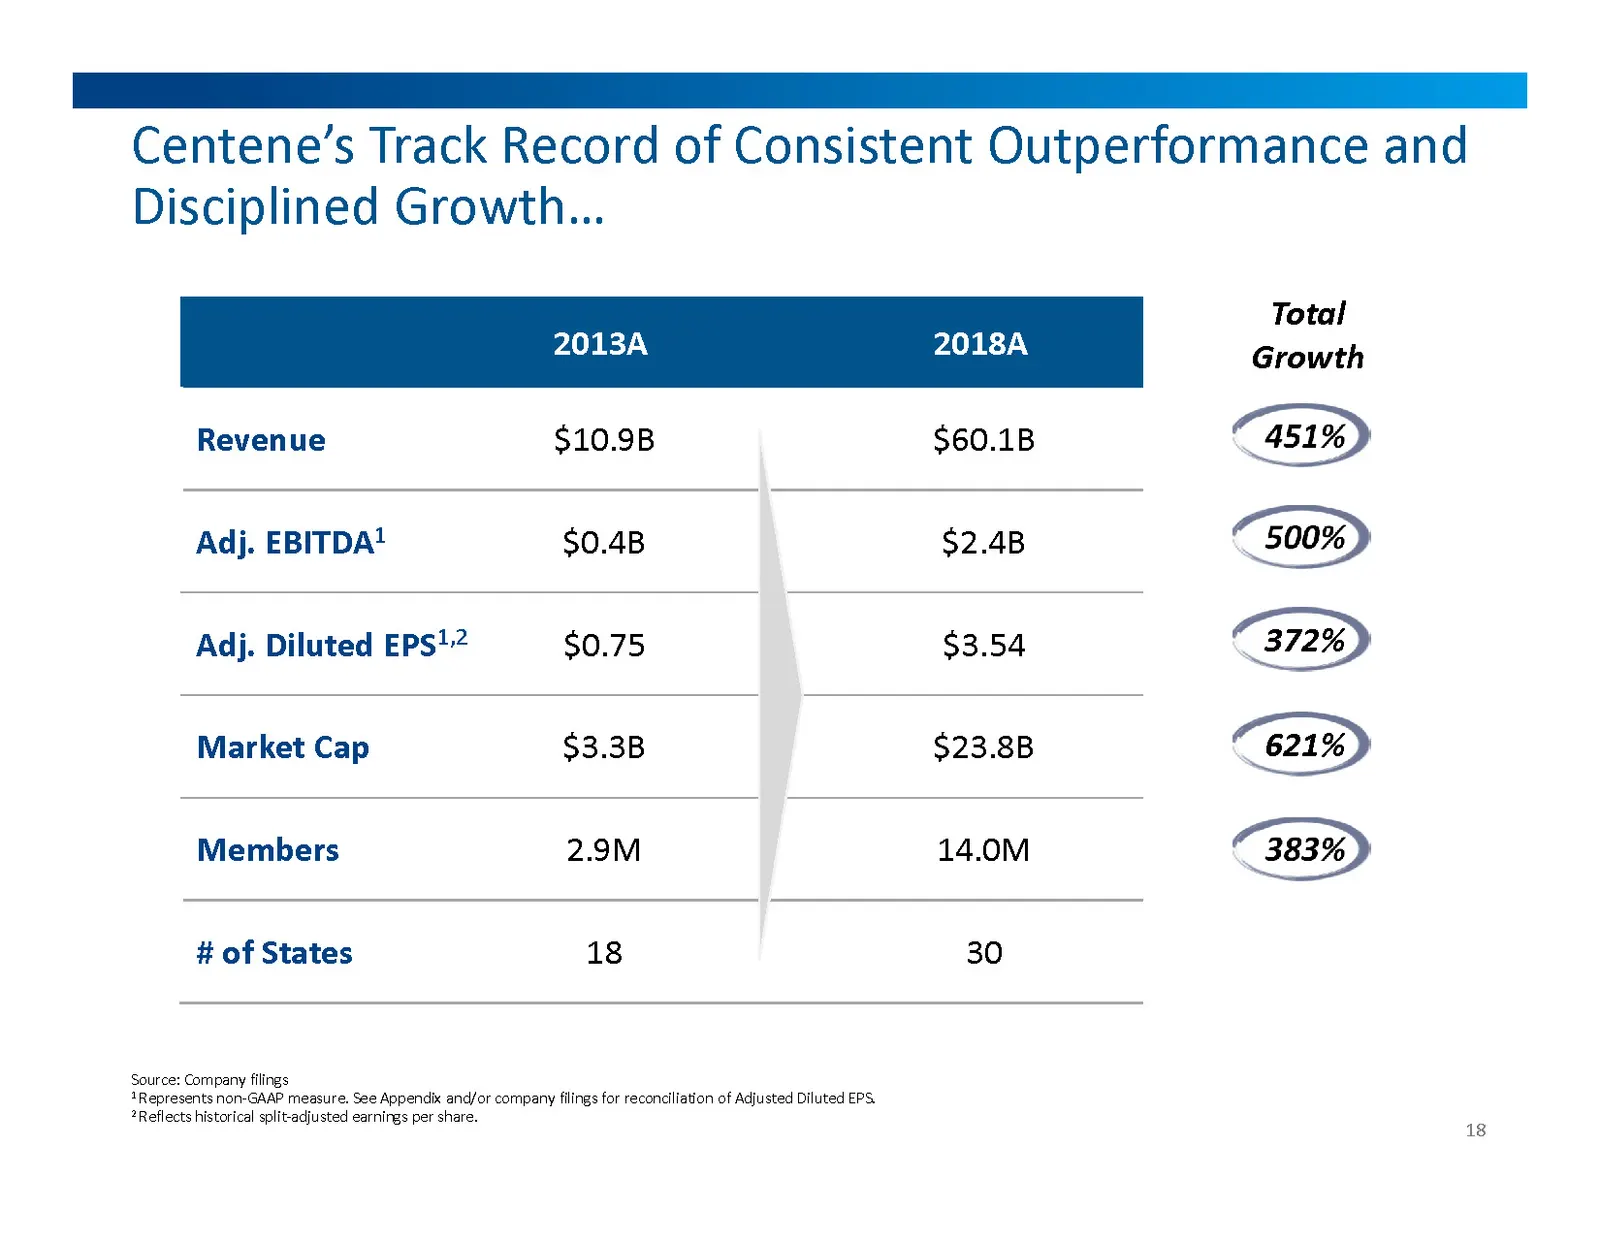
Centene’s Track Record of Consistent Outperformance and Disciplined Growth… 18 2013A 2018A Revenue $10.9B $60.1B Adj. EBITDA1 $0.4B $2.4B Adj. Diluted EPS1,2 $0.75 $3.54 Market Cap $3.3B $23.8B Members 2.9M 14.0M # of States 18 30 Total Growth 40.7% 43.1% 31.4% CAGR 451% 500% 621% 383% Source: Compa
Slide 19: And Shareholder Returns
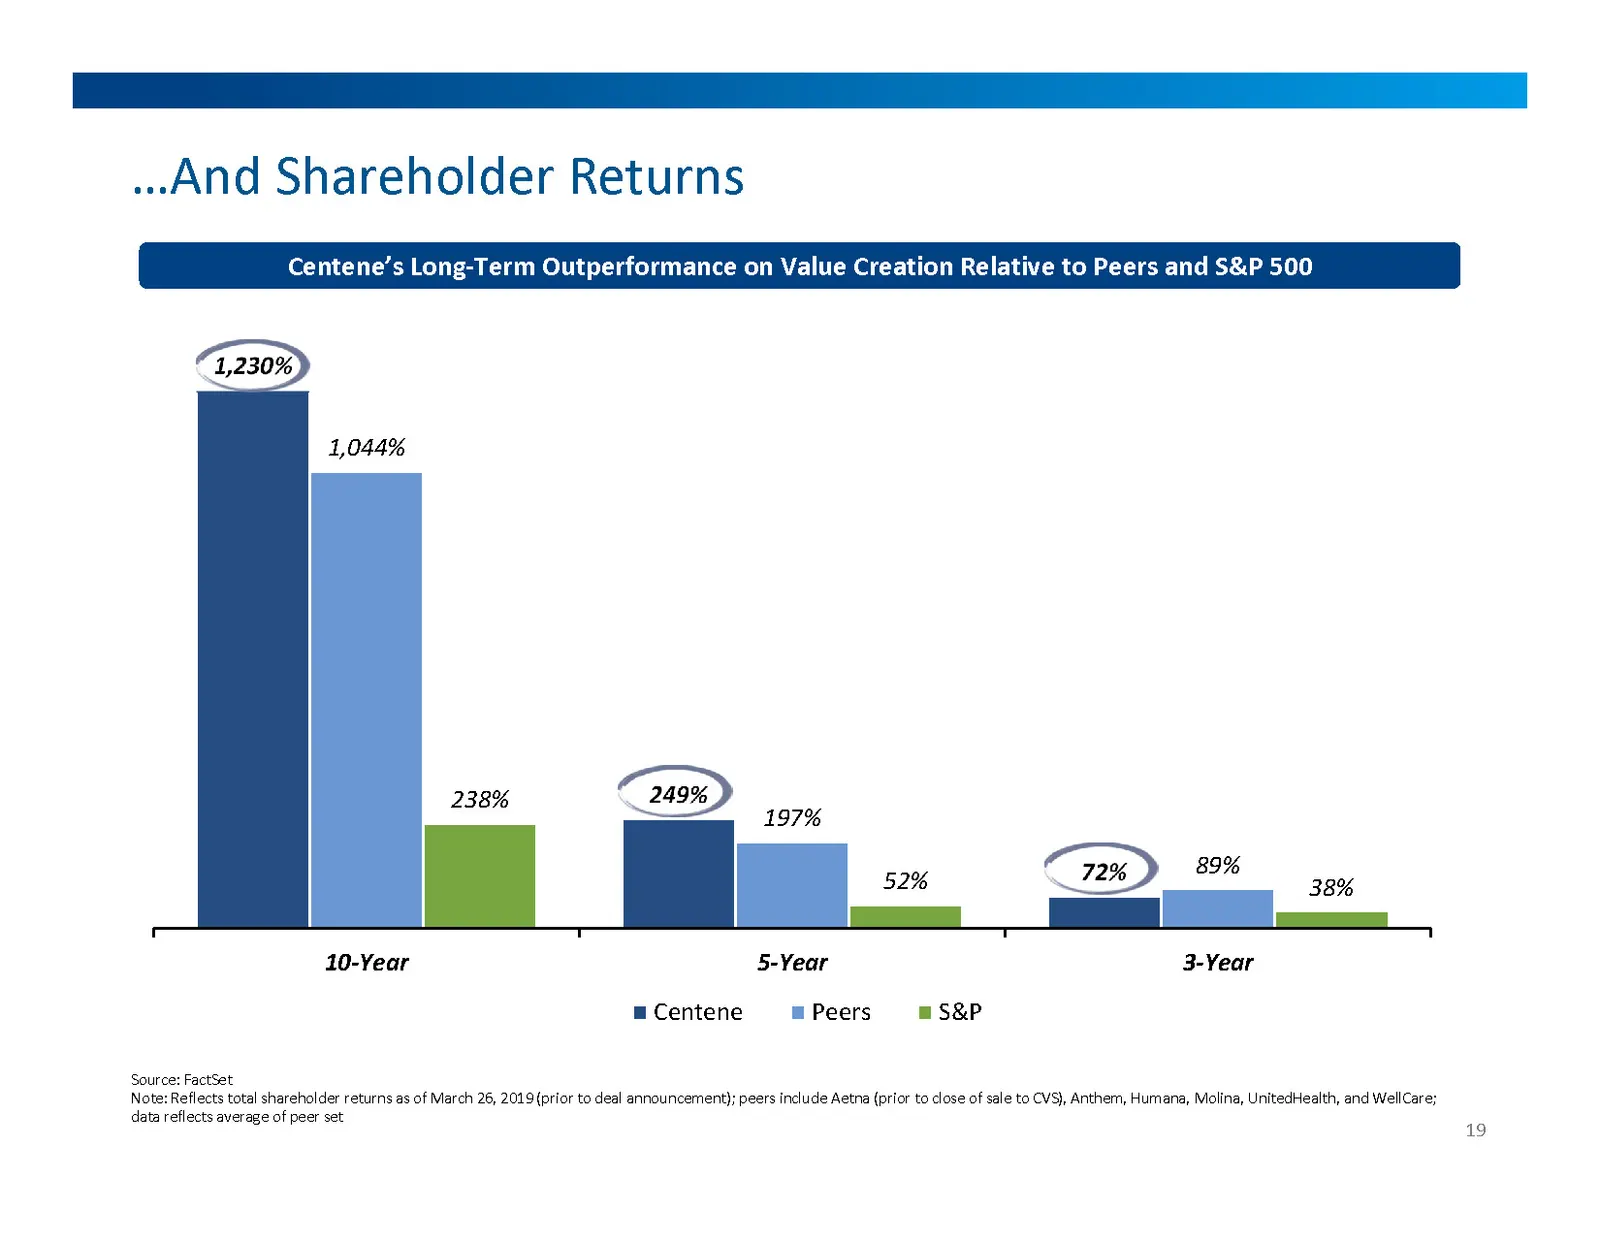
…And Shareholder Returns Centene’s Long-Term Outperformance on Value Creation Relative to Peers and S&P 500 19 Source: FactSetNote: Reflects total shareholder returns as of March 26, 2019 (prior to deal announcement); peers include Aetna (prior to close of sale to CVS), Anthem, Humana, Molina, Unite
Slide 20: Strong Financial Performance
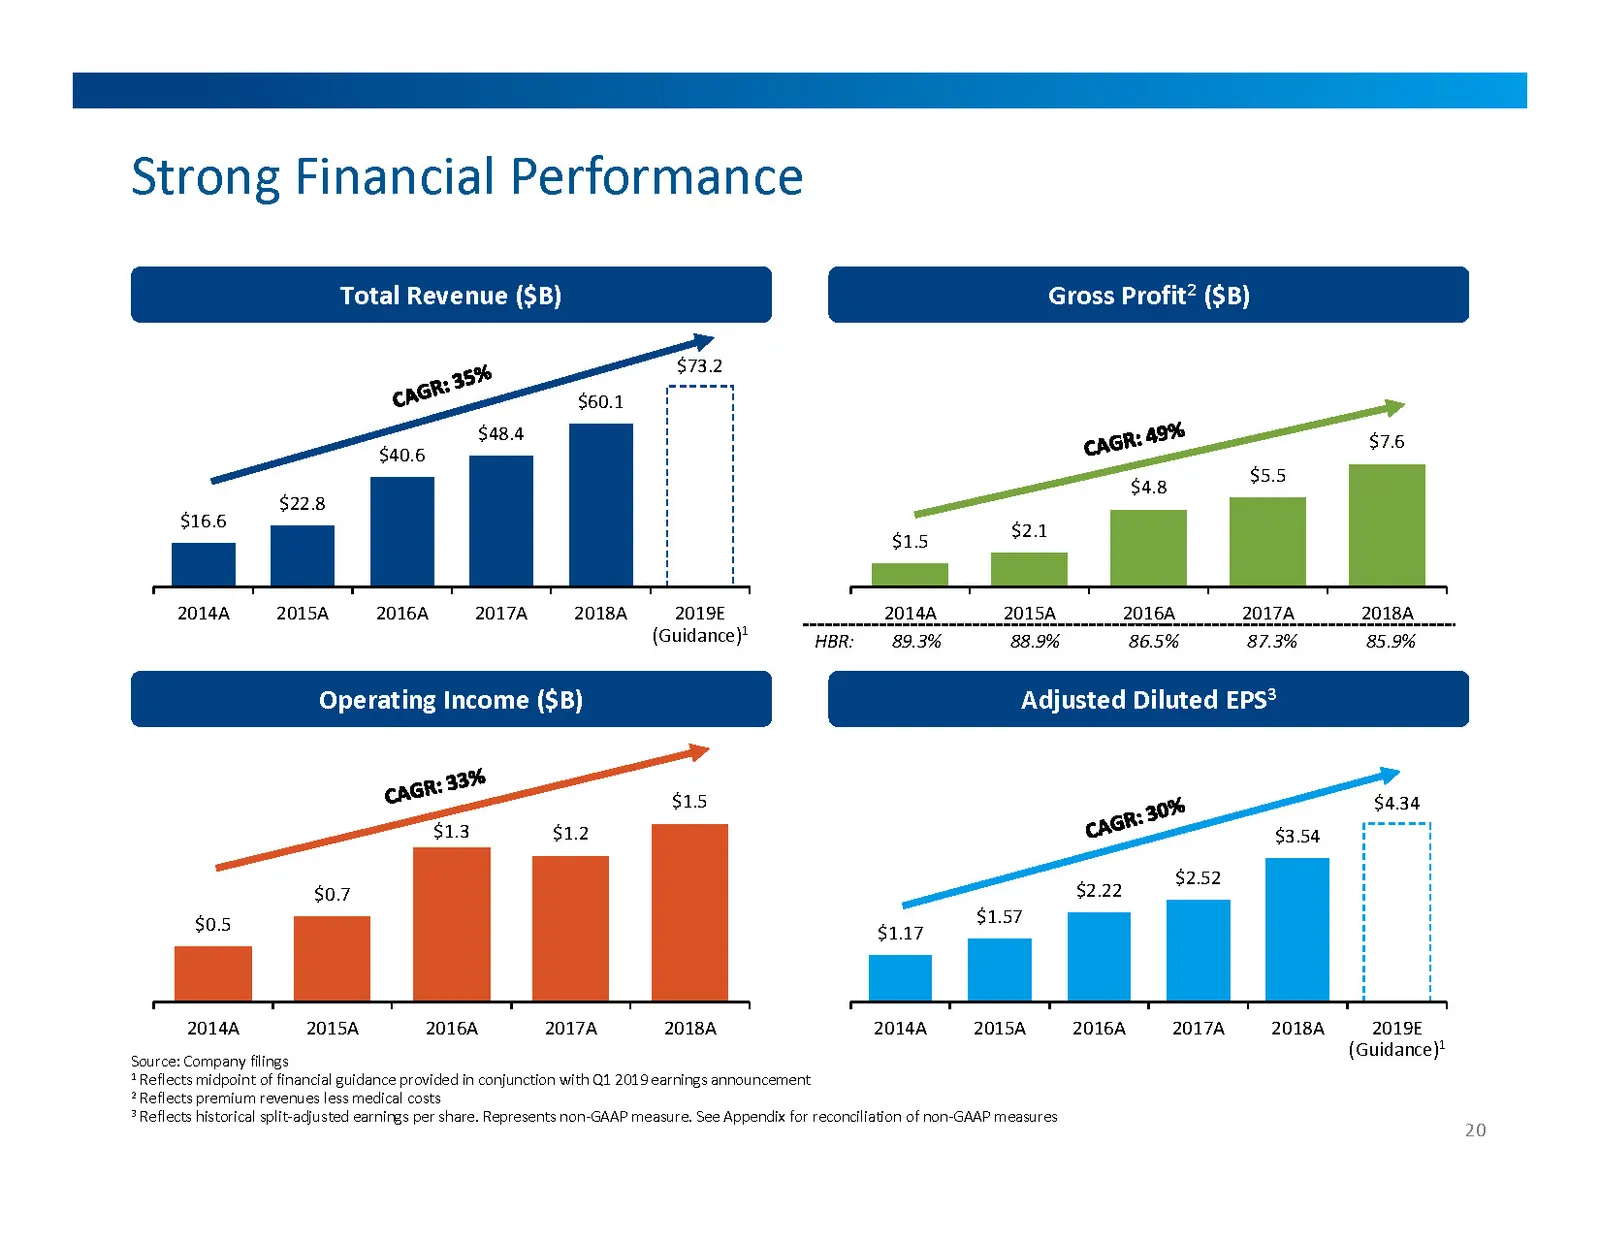
Strong Financial Performance 20 Source: Company filings1 Reflects midpoint of financial guidance provided in conjunction with Q1 2019 earnings announcement2 Reflects premium revenues less medical costs3 Reflects historical split-adjusted earnings per share. Represents non-GAAP measure. See Appendix
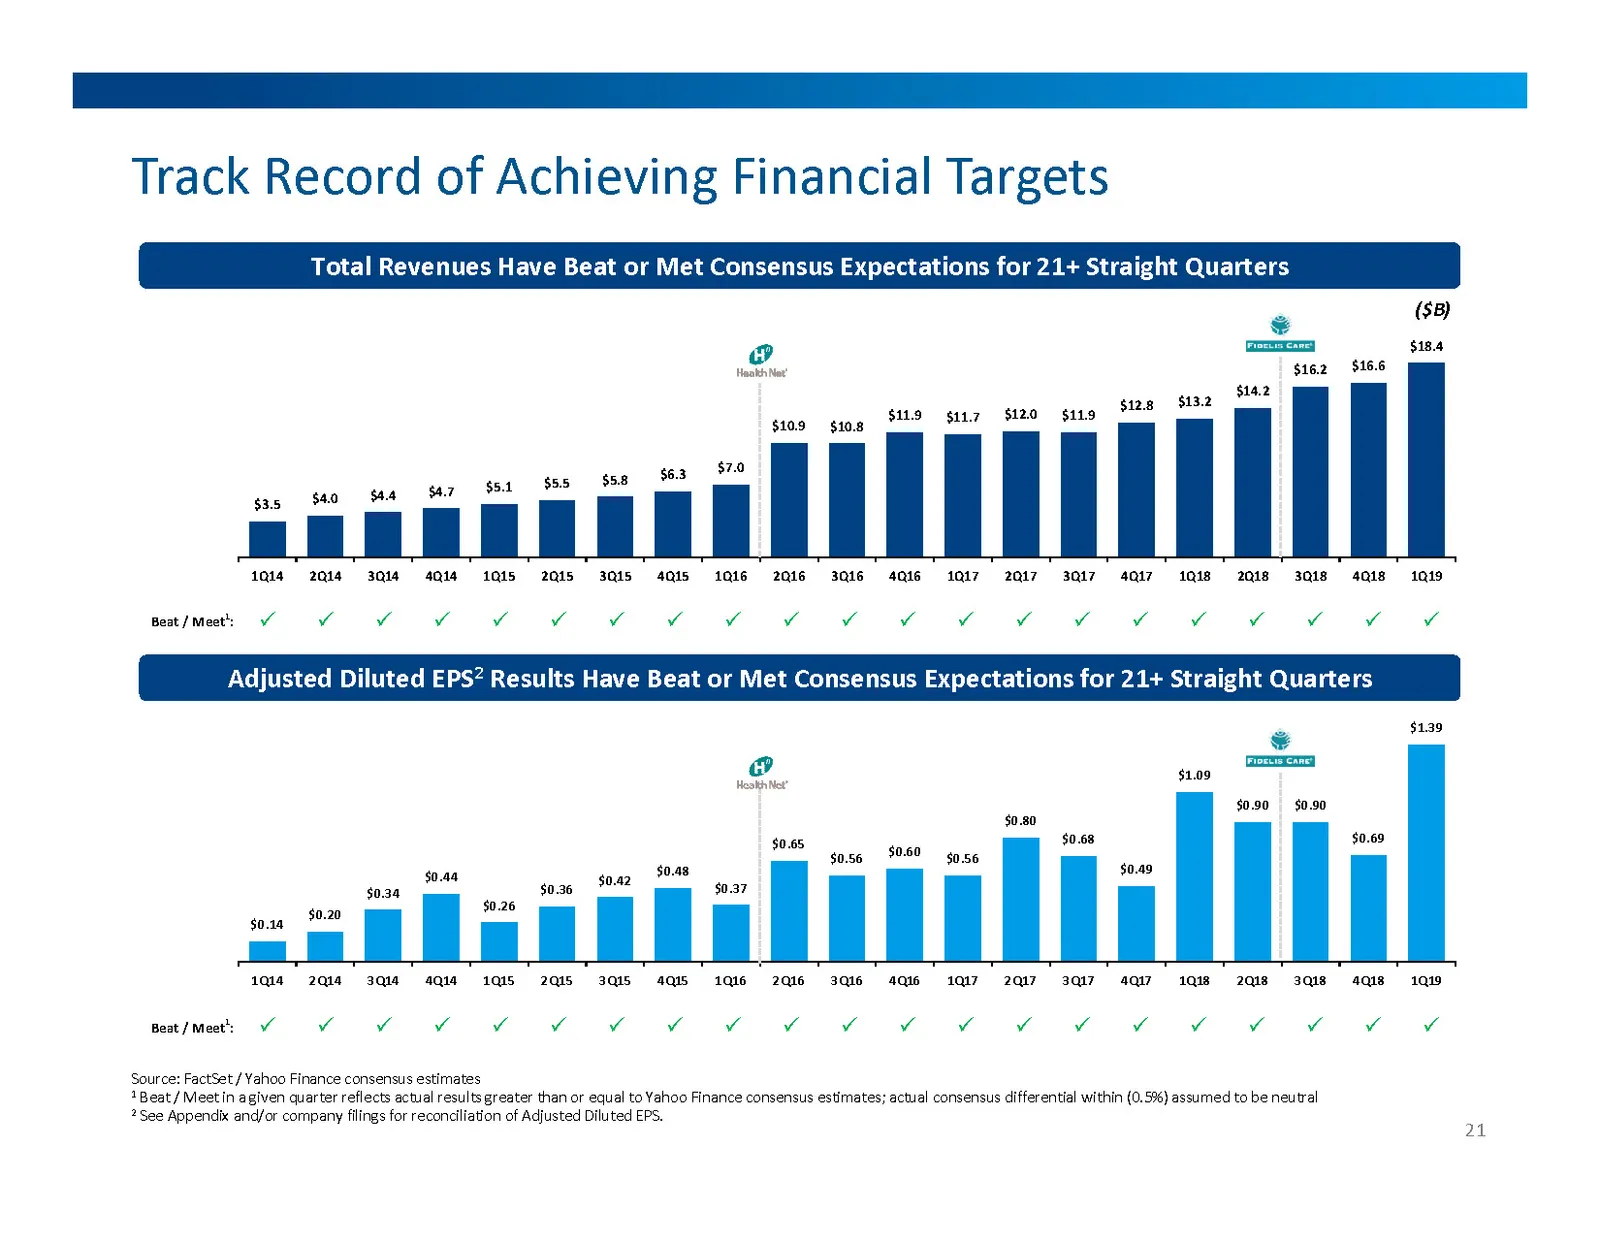
Slide 21: Track Record of Achieving Financial Targets
Track Record of Achieving Financial Targets 21 Source: FactSet / Yahoo Finance consensus estimates1 Beat / Meet in a given quarter reflects actual results greater than or equal to Yahoo Finance consensus estimates; actual consensus differential within (0.5%) assumed to be neutral2 See Appendix and/o
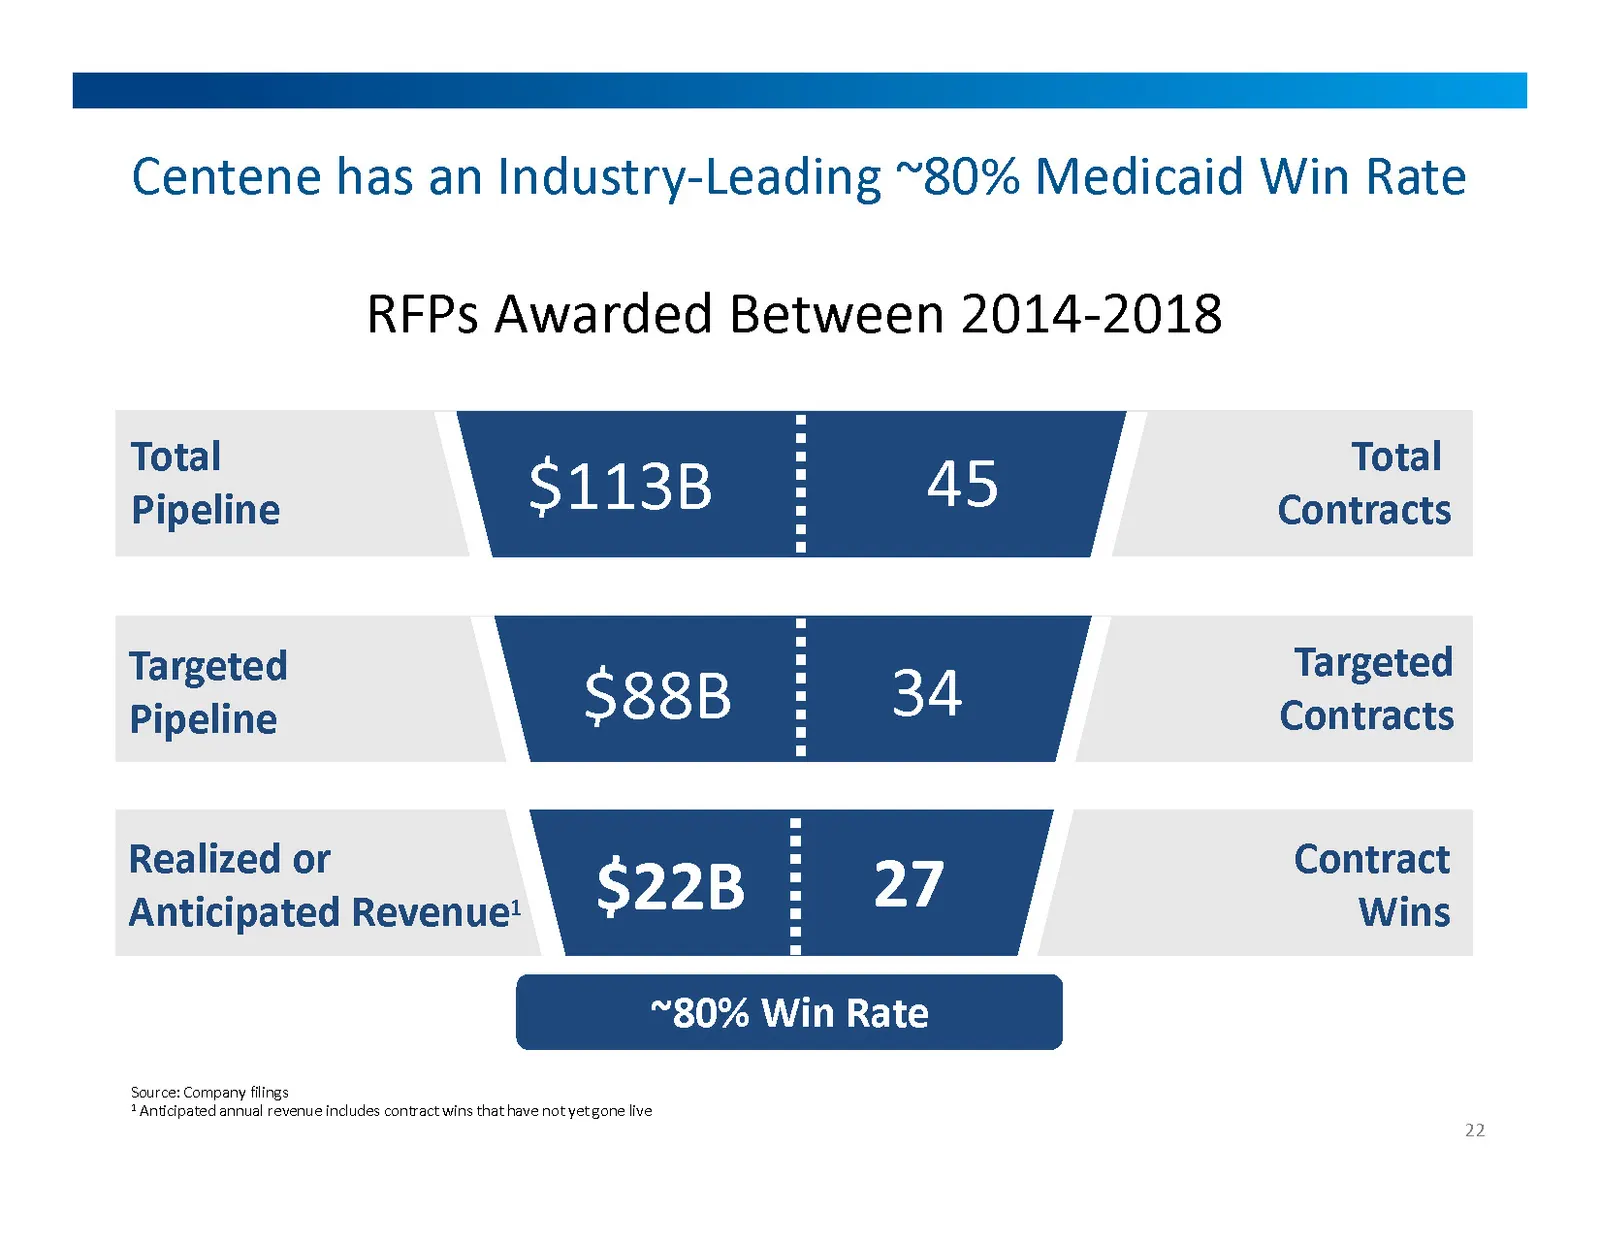
Slide 22: Industry-Leading ~80% Medicaid Win Rate
Total Pipeline Total Contracts $113B Targeted Pipeline TargetedContracts $88B Realized or Anticipated Revenue1 ContractWins $22B RFPs Awarded Between 2014-2018 45 34 27 ~80% Win Rate Centene has an Industry-Leading ~80% Medicaid Win Rate 22 Source: Company filings1 Anticipated annual revenue include
Slide 23: Path Toward Integration
nn CENTENE orporation Path Toward Integration
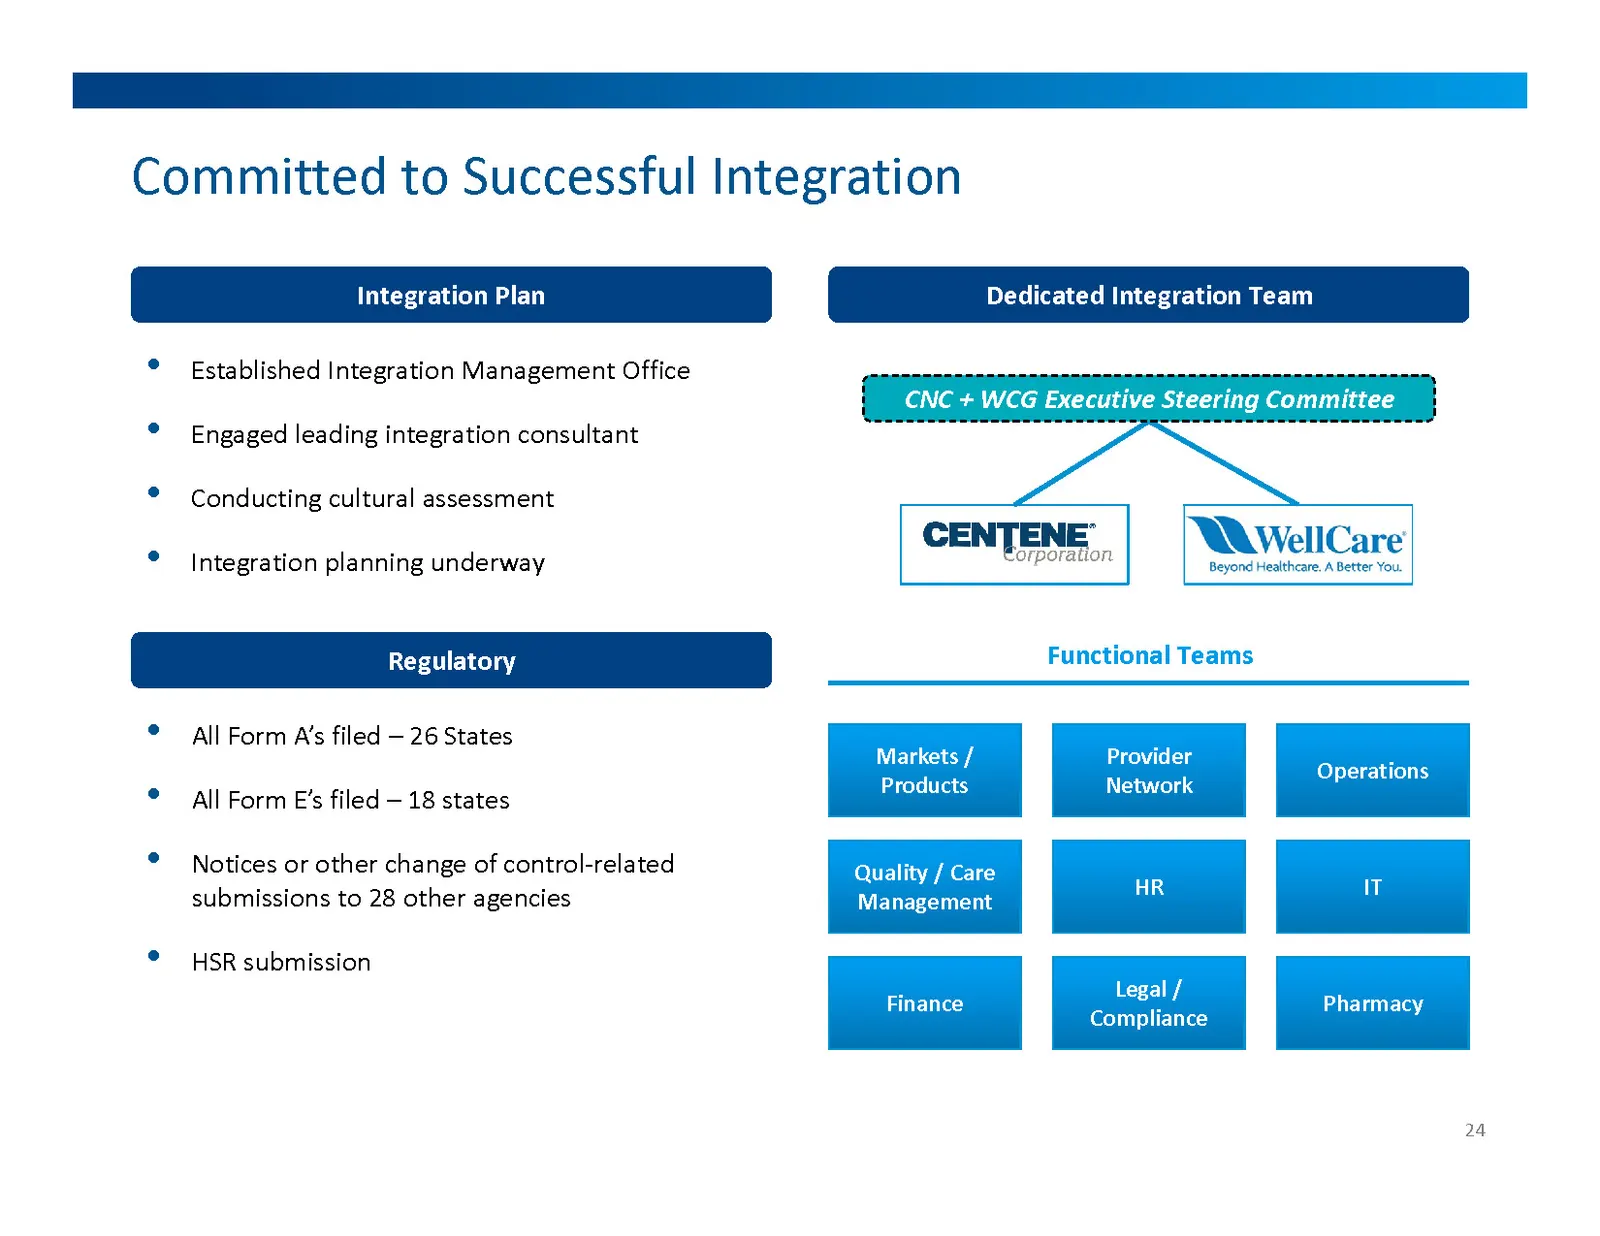
Slide 24: Committed to Successful Integration
Committed to Successful Integration 24 Established Integration Management OfficeEngaged leading integration consultantConducting cultural assessmentIntegration planning underway Integration Plan Dedicated Integration Team Functional Teams Markets / Products Provider Network Operations Quality / Care
Slide 25: Significant Value Creation
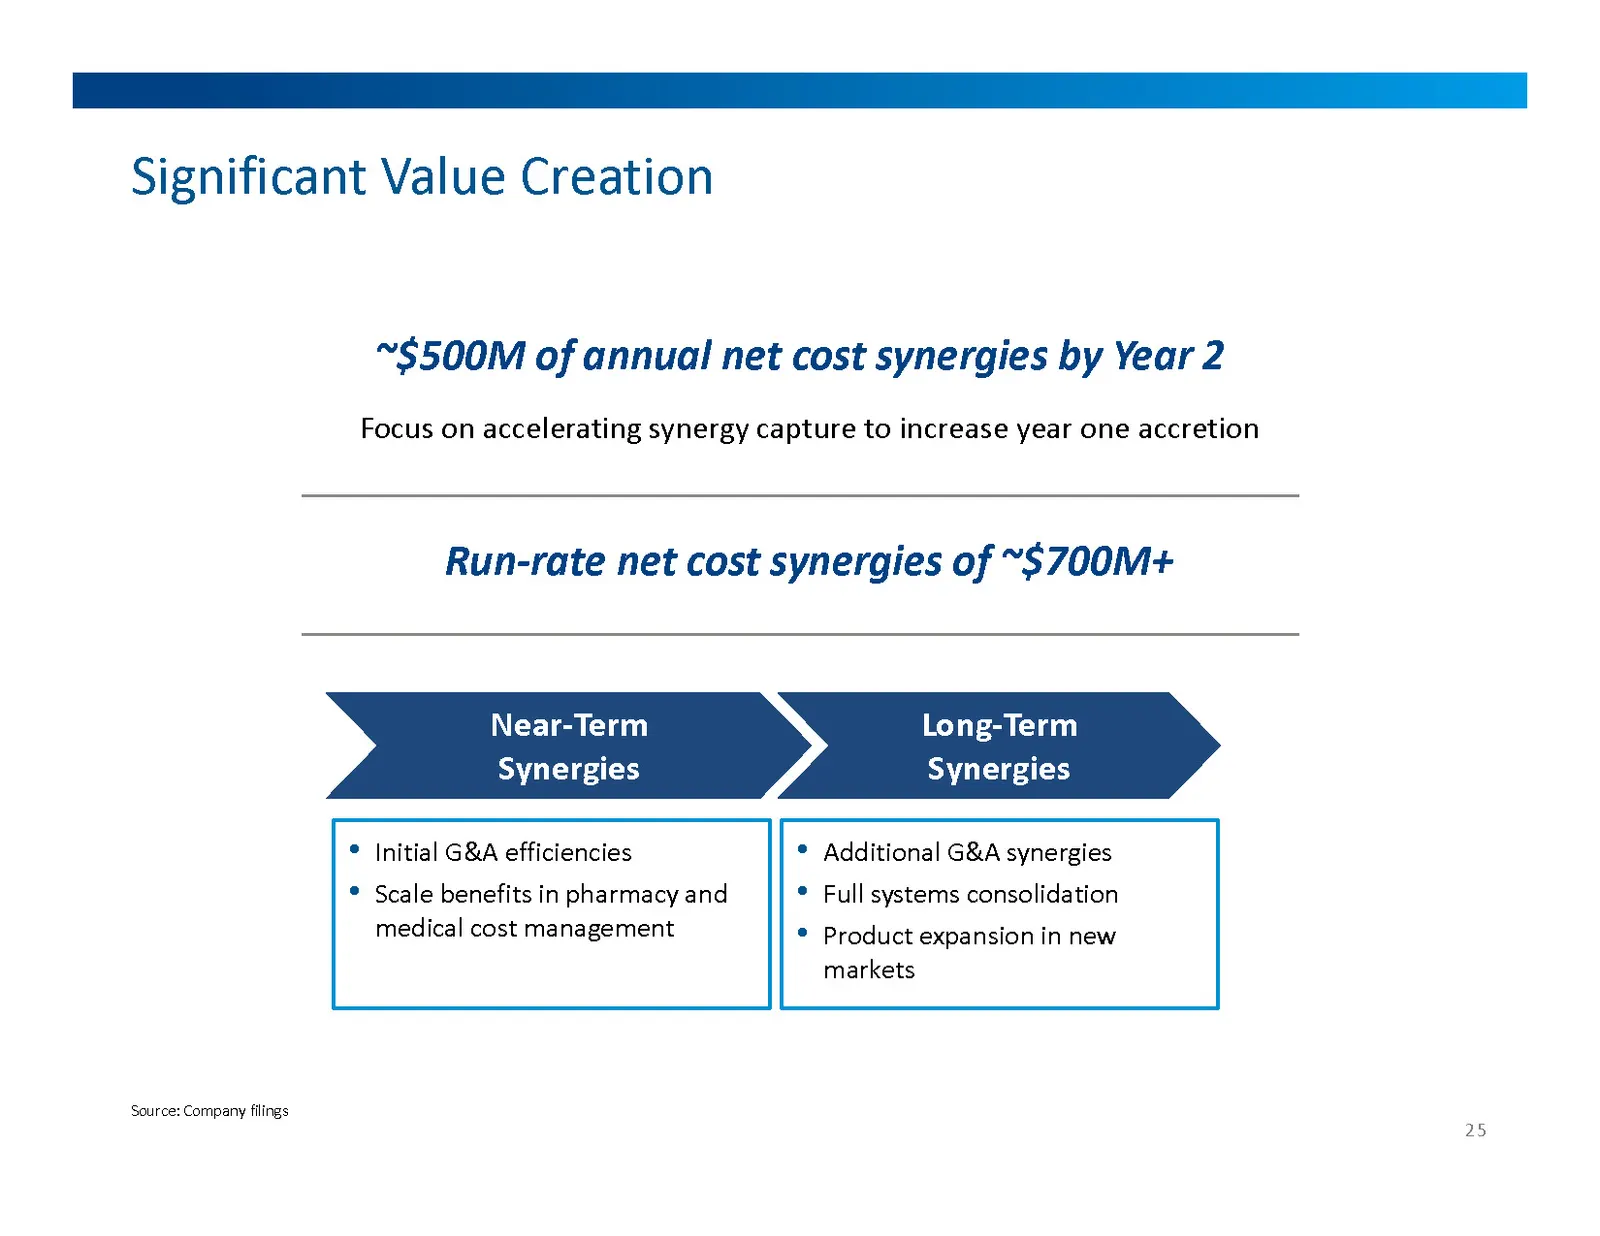
Significant Value Creation 25 ~$500M of annual net cost synergies by Year 2 Focus on accelerating synergy capture to increase year one accretion Run-rate net cost synergies of ~$700M+ Near-TermSynergies Long-Term Synergies Initial G&A efficienciesScale benefits in pharmacy and medical cost managemen
Slide 26: Well Positioned for Continued Long-Term Growth
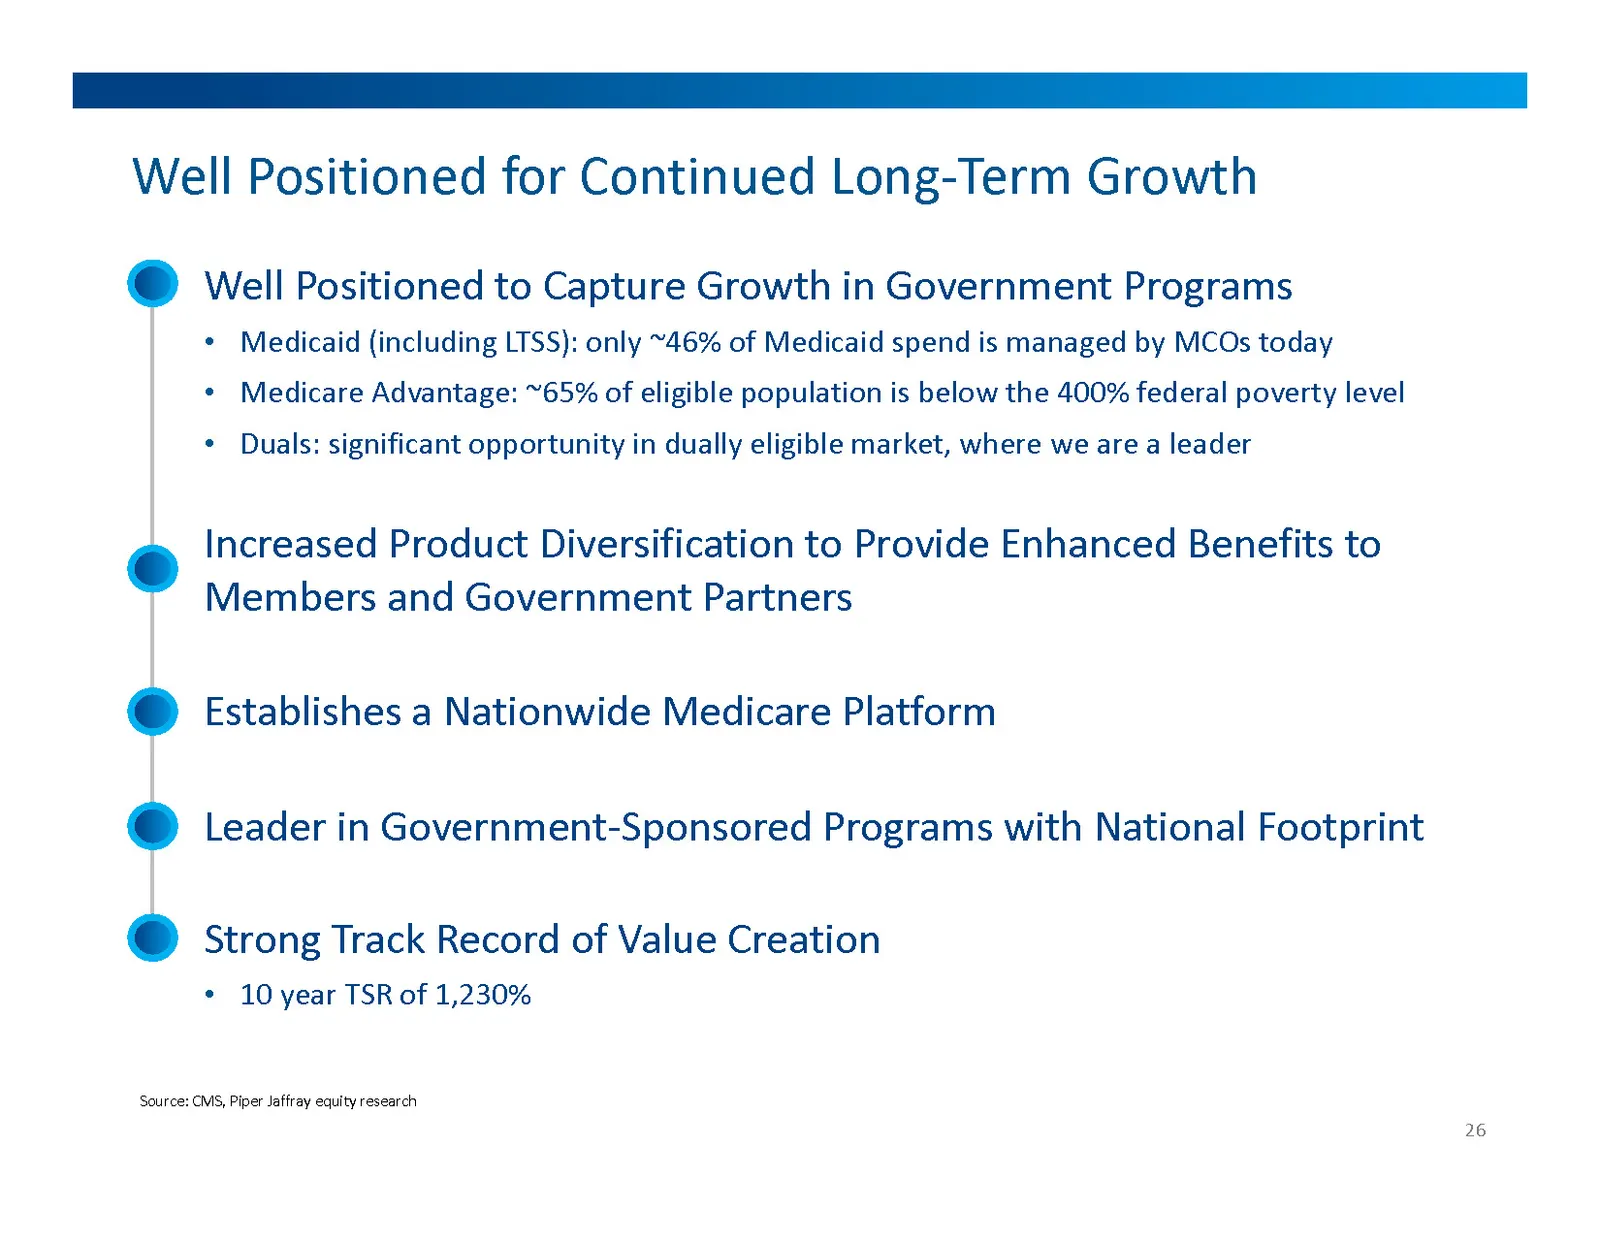
Well Positioned for Continued Long-Term Growth 26 Increased Product Diversification to Provide Enhanced Benefits to Members and Government Partners Leader in Government-Sponsored Programs with National Footprint Establishes a Nationwide Medicare Platform Well Positioned to Capture Growth in Governme
Slide 27: Shared Commitment to Local Communities
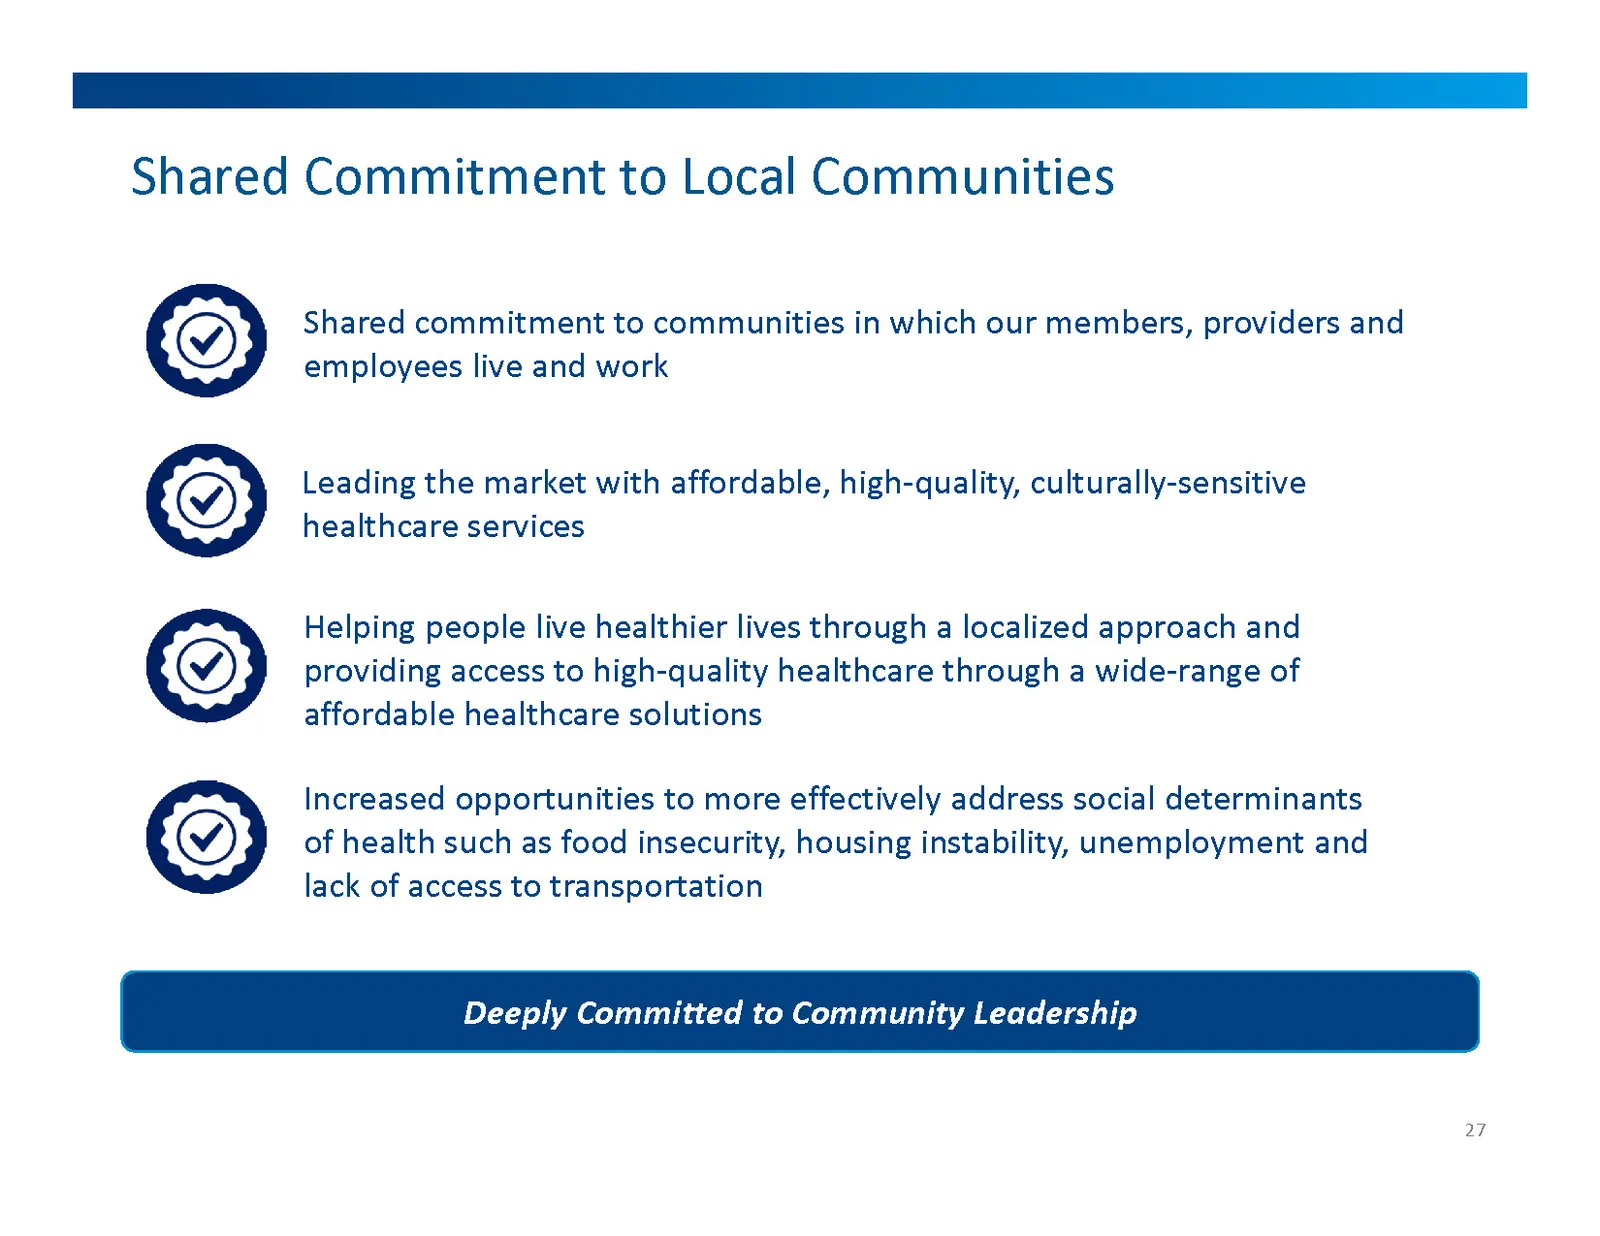
Shared Commitment to Local Communities 27 Shared commitment to communities in which our members, providers and employees live and work Helping people live healthier lives through a localized approach and providing access to high-quality healthcare through a wide-range of affordable healthcare soluti
Slide 28: Appendix
Se CENTENE orporation Appendix
Slide 29: Transaction Overview
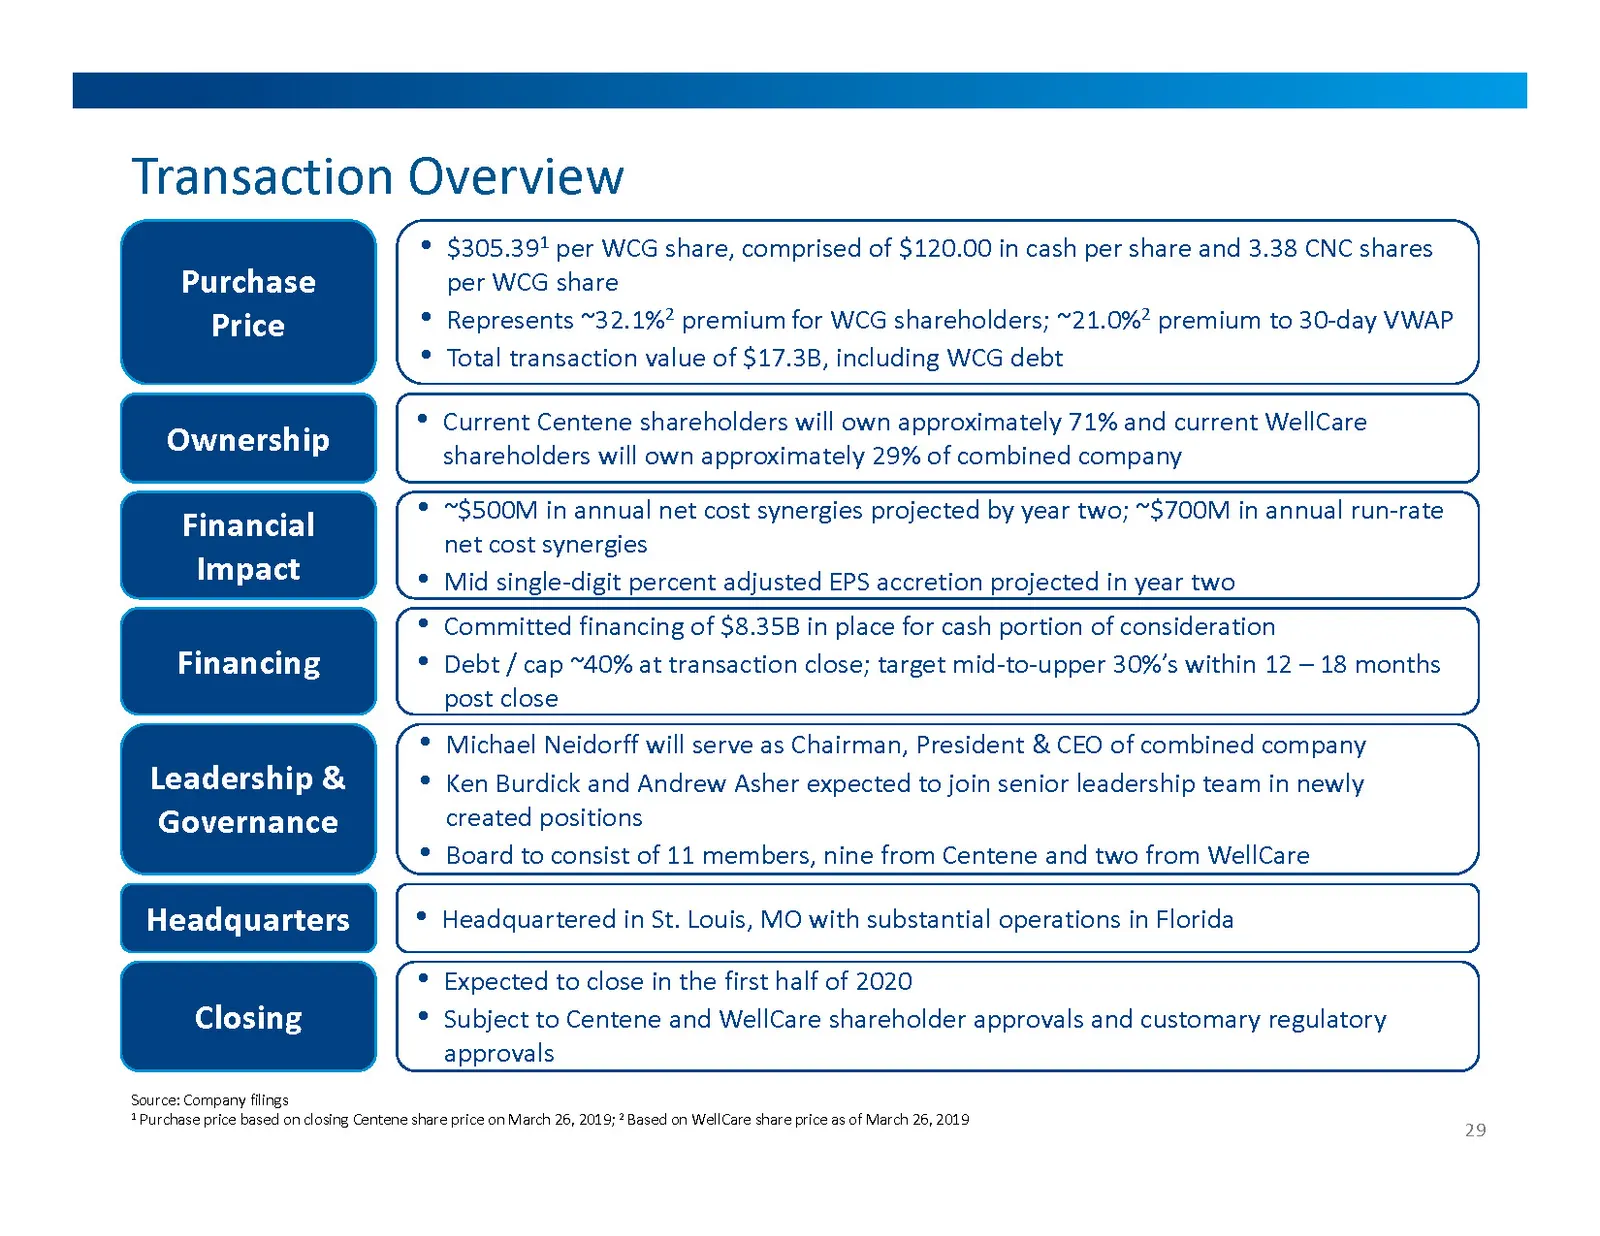
Transaction Overview 29 Purchase Price Ownership Financing $305.391 per WCG share, comprised of $120.00 in cash per share and 3.38 CNC shares per WCG share Represents ~32.1%2 premium for WCG shareholders; ~21.0%2 premium to 30-day VWAPTotal transaction value of $17.3B, including WCG debt Financial I
Slide 30: An Experienced and Proven Board
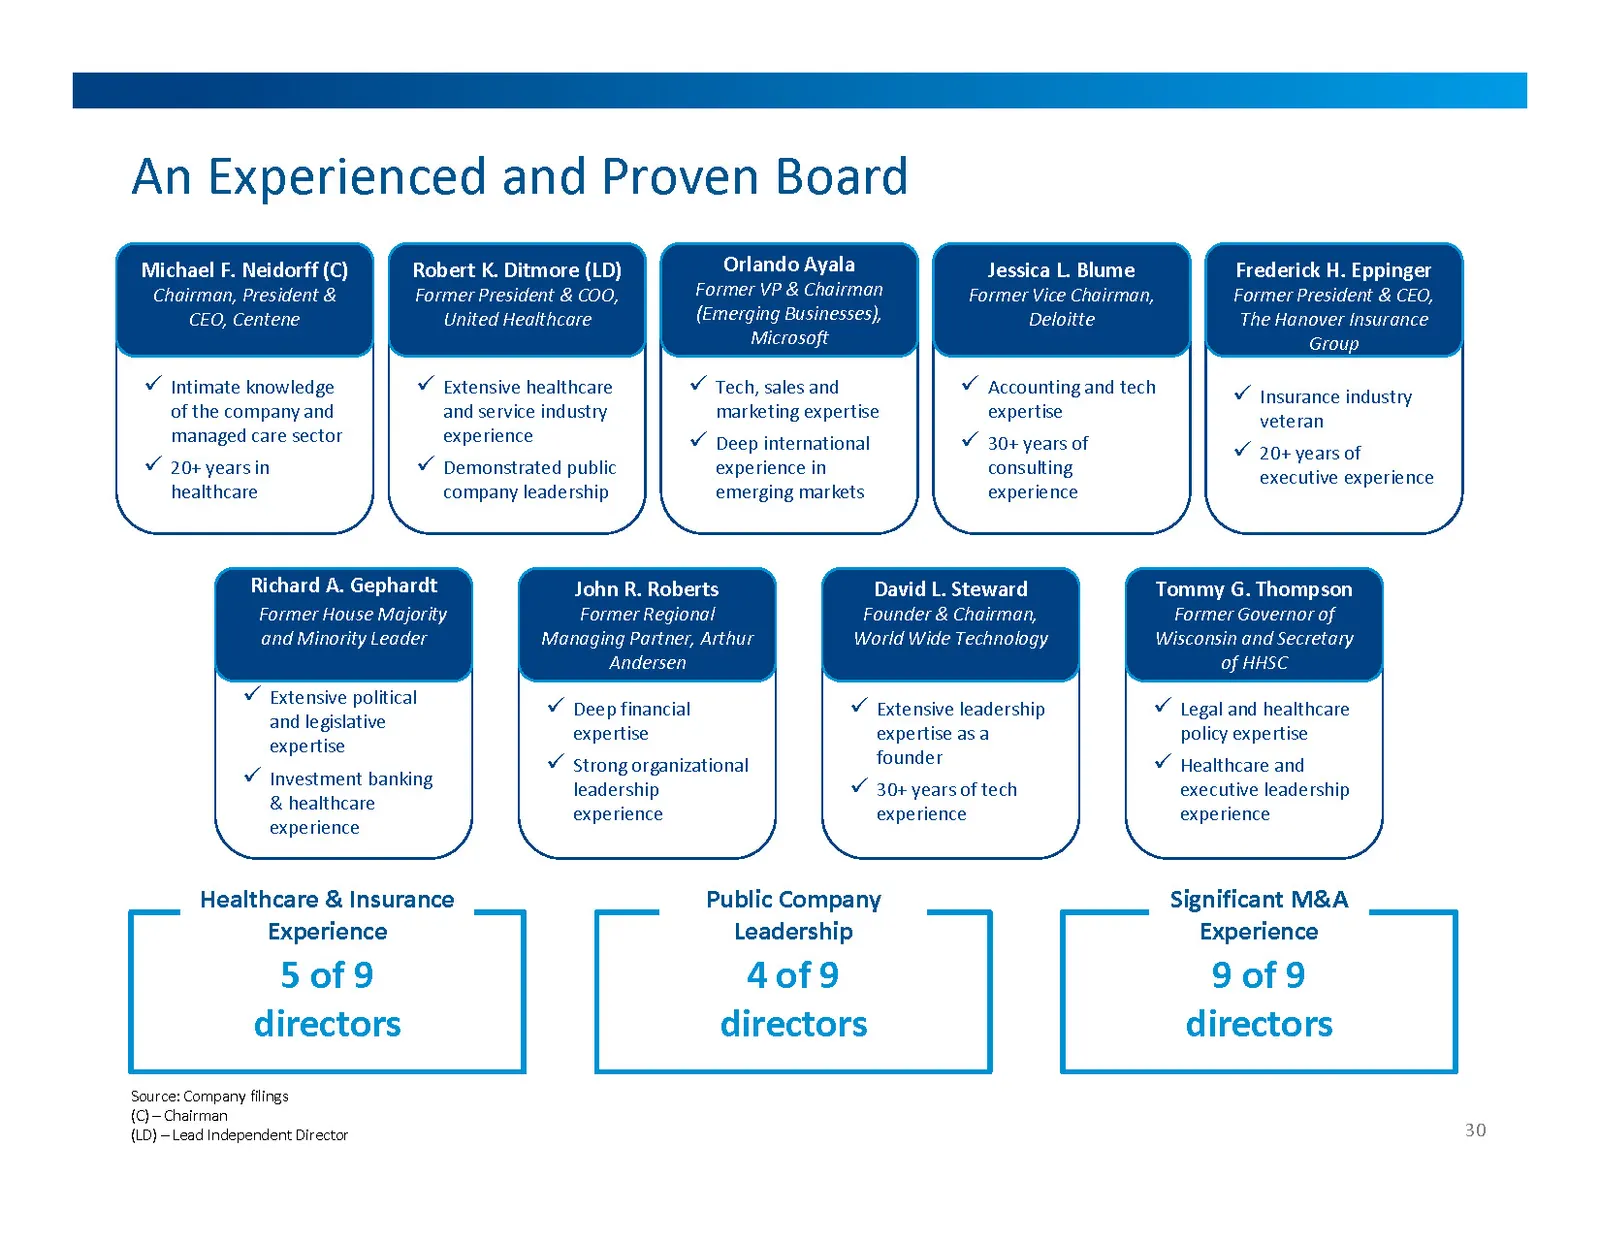
Intimate knowledge of the company and managed care sector20+ years in healthcare Michael F. Neidorff (C)Chairman, President & CEO, Centene An Experienced and Proven Board 30 5 of 9directors Healthcare & Insurance Experience 4 of 9directors Public Company Leadership 9 of 9directors Significant M&A Ex
Slide 31: Value Opportunity for Centene Shareholders Recognized by Research Community
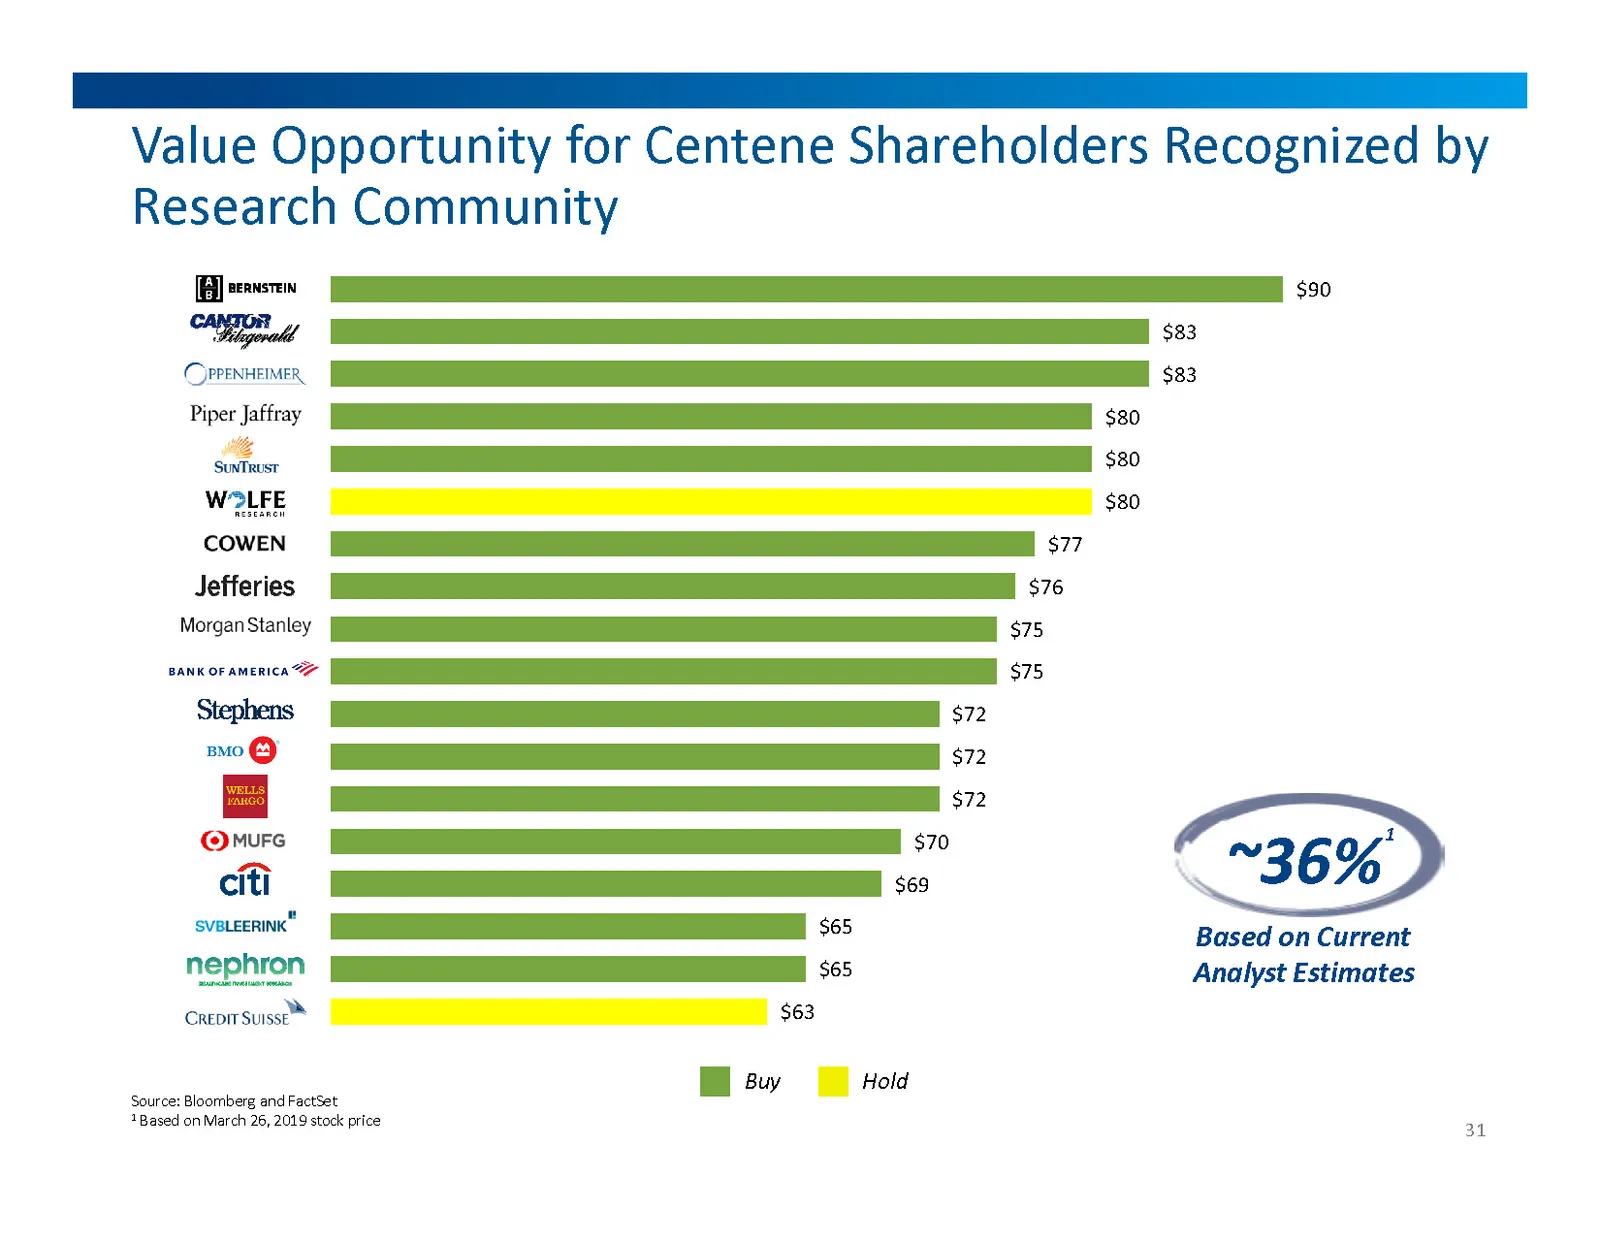
31 ~36%Based on Current Analyst Estimates Buy Hold Value Opportunity for Centene Shareholders Recognized by Research Community Source: Bloomberg and FactSet1 Based on March 26, 2019 stock price 1
Slide 32: Research Community is Positive on Combination
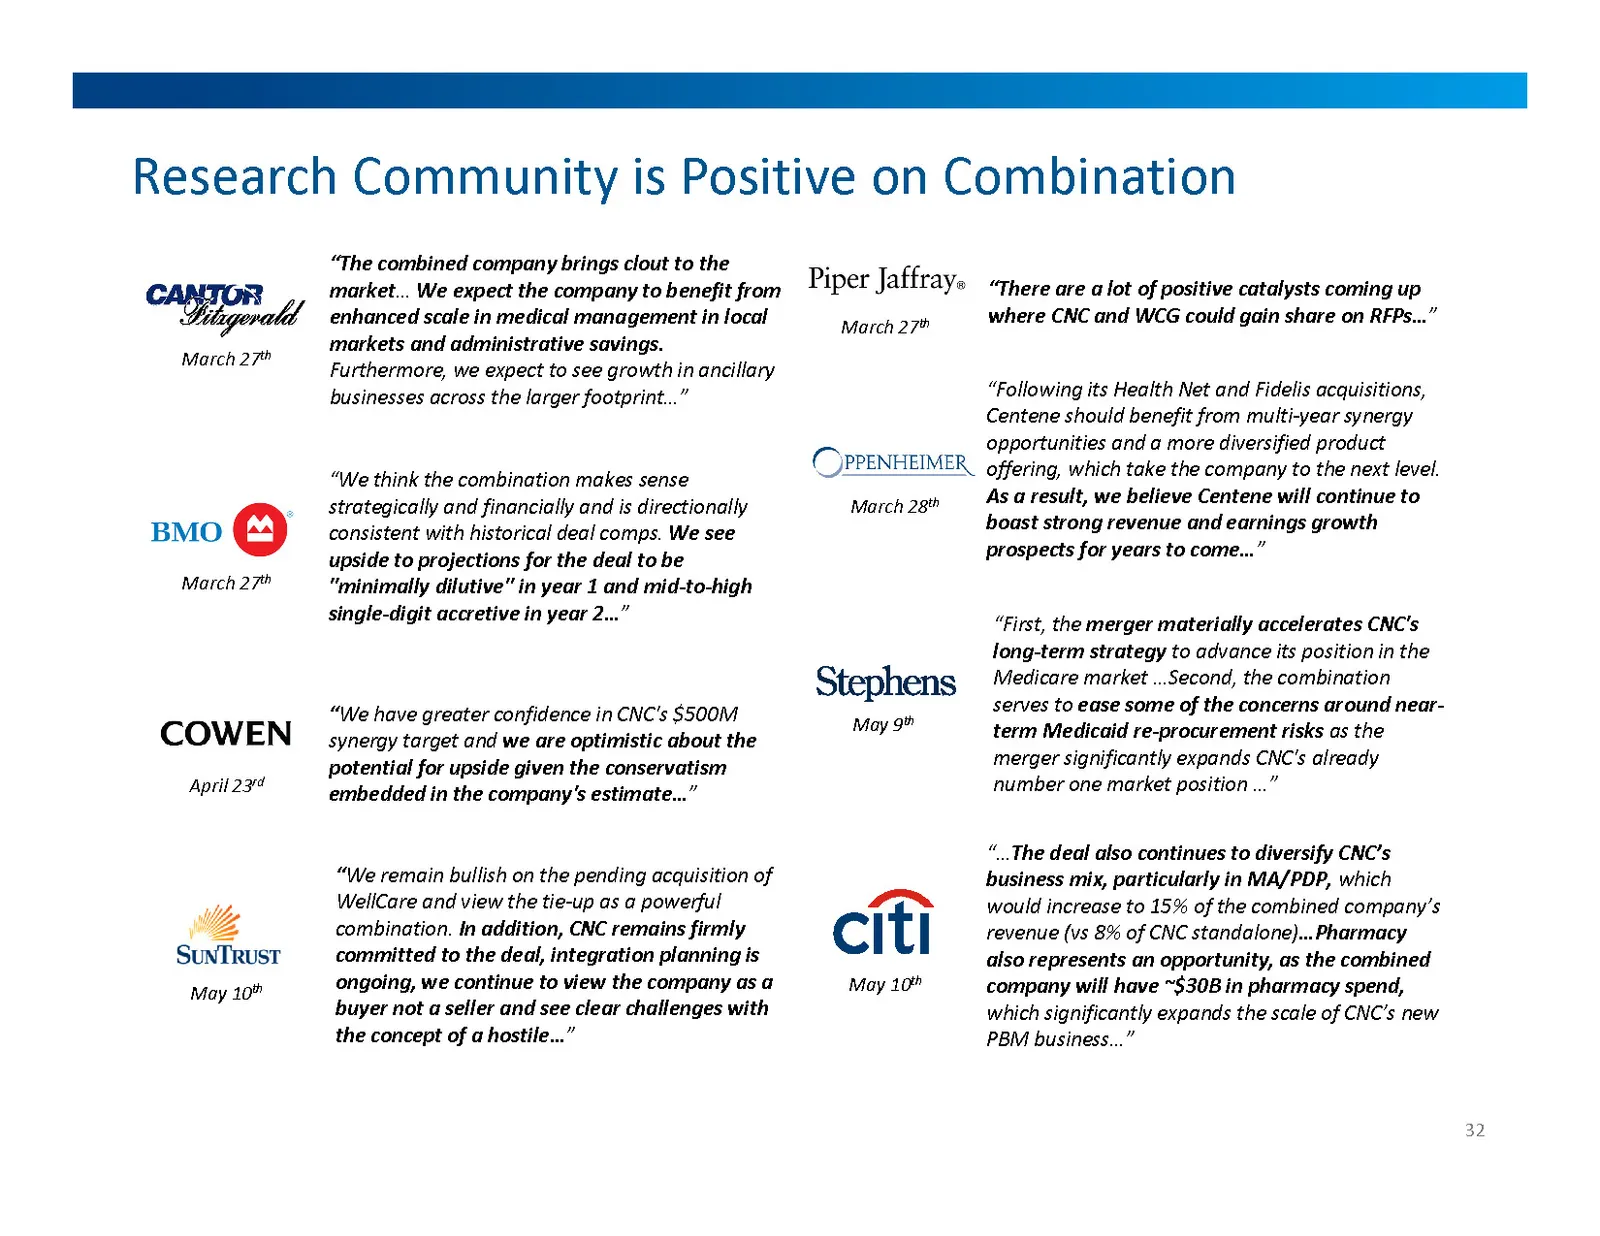
Research Community is Positive on Combination 32 “We think the combination makes sense strategically and financially and is directionally consistent with historical deal comps. We see upside to projections for the deal to be "minimally dilutive" in year 1 and mid-to-high single-digit accretive in ye
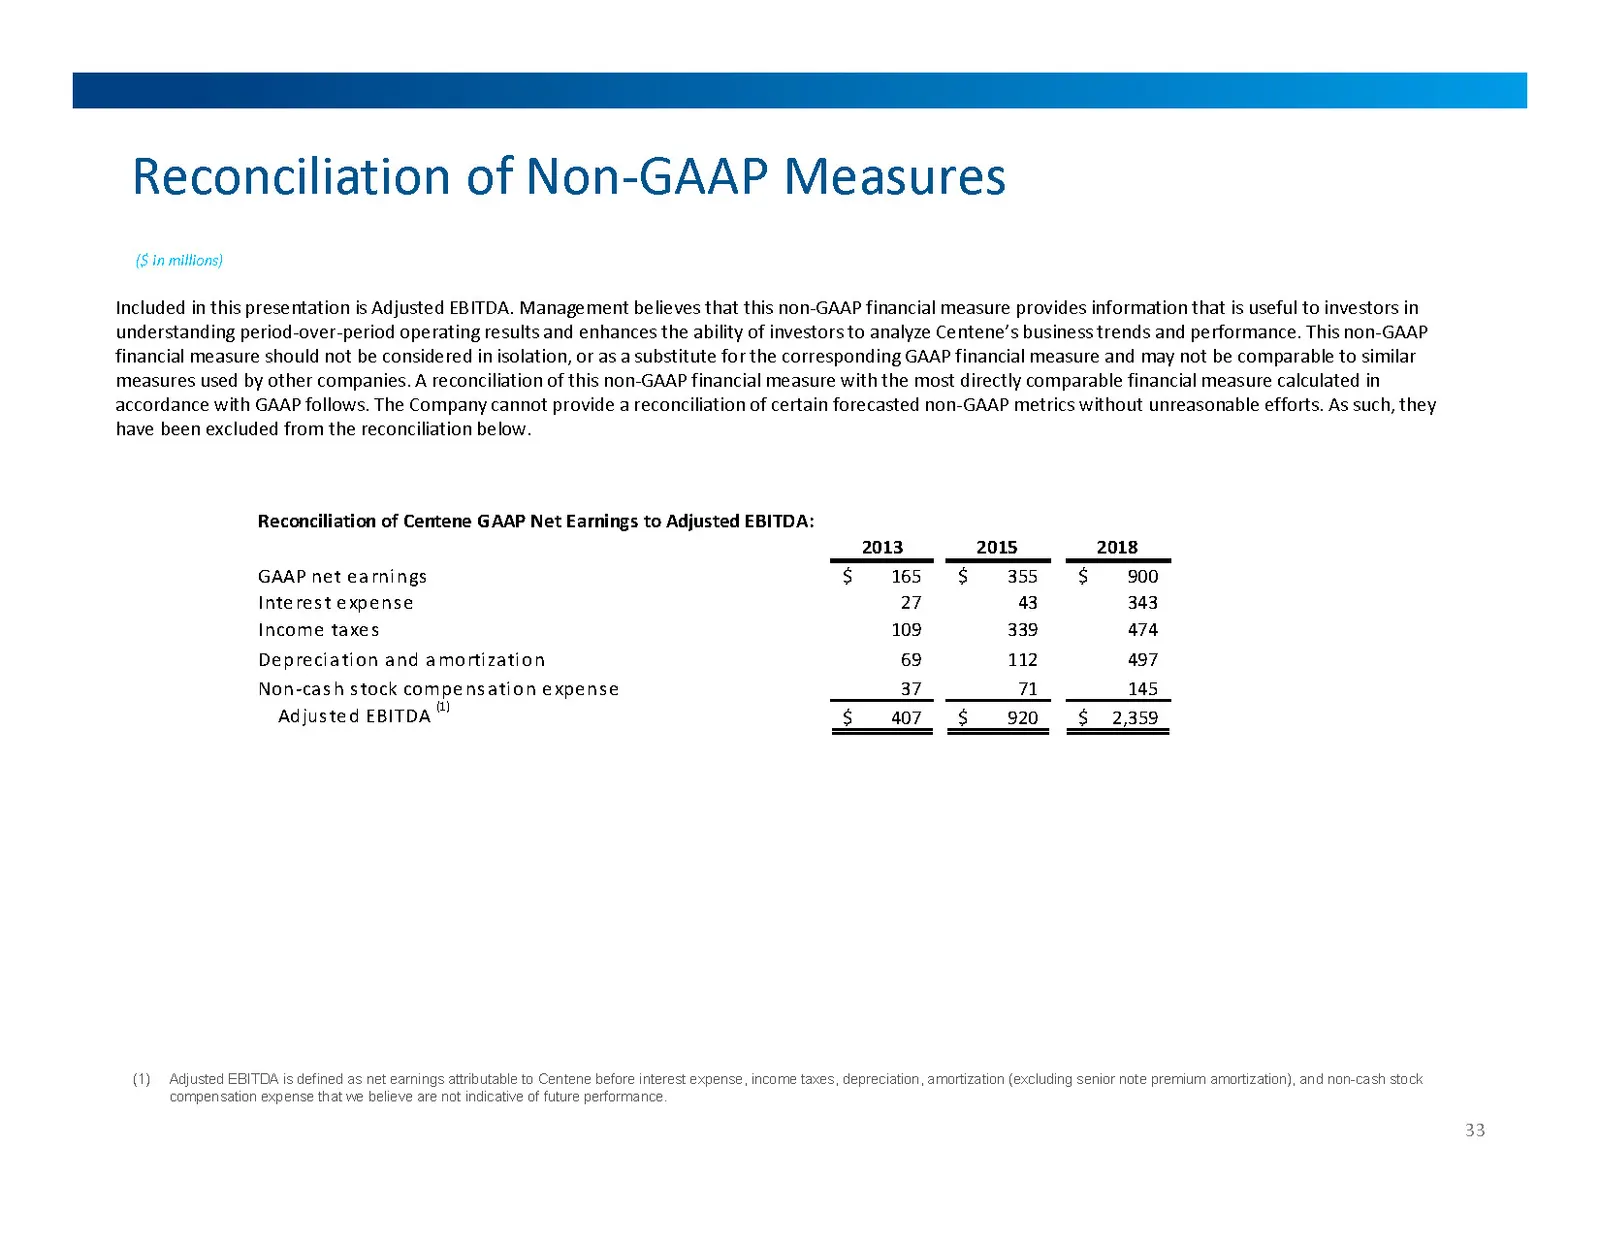
Slide 33: Reconciliation of Non-GAAP Measures: Adjusted EBITDA
Reconciliation of Non-GAAP Measures ($ in millions) Included in this presentation is Adjusted EBITDA. Management believes that this non-GAAP financial measure provides information that is useful to investors in understanding period-over-period operating results and enhances the ability of investors
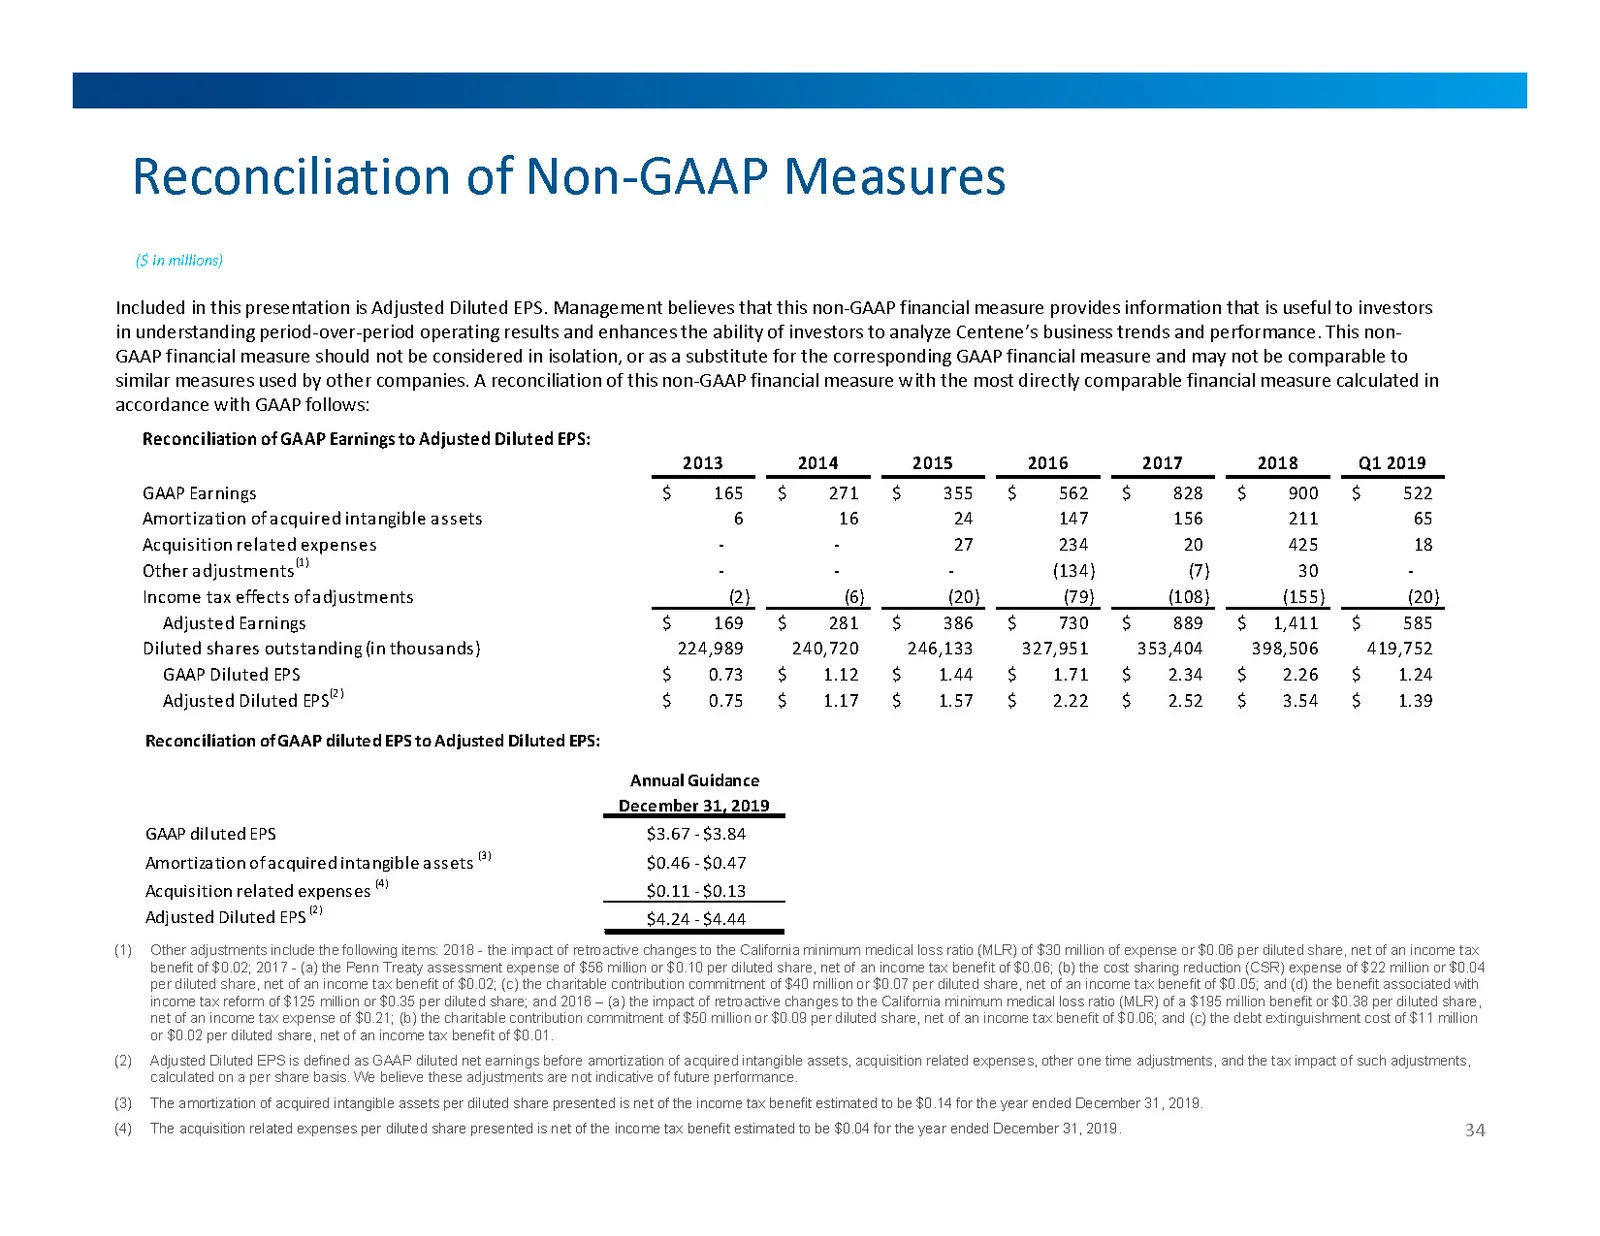
Slide 34: Reconciliation of Non-GAAP Measures: Adjusted Diluted EPS
Reconciliation of Non-GAAP Measures ($ in millions) Included in this presentation is Adjusted Diluted EPS. Management believes that this non-GAAP financial measure provides information that is useful to investors in understanding period-over-period operating results and enhances the ability of inves
Source: SEC EDGAR · 425 filed May 14, 2019
More decks from WellCare Health Plans Inc
 Wellcare — Investor Presentation (2026)13 slides · Oct 29, 2026
 WellCare of Kentucky — Provider Summit 202618 slides · Apr 3, 2026
 Wellcare — Investor Presentation (September 2025)13 slides · September 2025
 Wellcare — Investor Presentation (2025)78 slides · Jun 12, 2025
 Wellcare — Investor Presentation (2025)13 slides · Feb 8, 2025
 Wellcare — Investor Presentation (2025)13 slides · 2025