Aspen Group, Inc. · OTC:ASPU
Aspen — Q2 FY2021 Earnings Presentation
18 slides from Aspen's earnings presentation, Dec 15, 2020

Slide 1: Second Quarter Fiscal Year 2021 Earnings Slides
Second Quarter Fiscal Year 2021 Earnings Slides Michael Mathews, Chairman & Chief Executive Officer CREATING VALUE BY Frank J. Cotroneo, Chief Financial Officer TRANSFORMING THE COLLEGE Robert Alessi, Chief Accounting Officer December 15, 2020 EDUCATION EXPERIENCE Nasdaq: ASPU
Slide 2: Safe Harbor Statement
SAFE HARBOR STATEMENT Certain statements in this presentation and responses to various questions include forward-looking statements within the meaning of the Private Securities Litigation Reform Act of 1995, including statements regarding expected further campus expansion, expected expansion of USU
Slide 3: Key Takeaways For Q2 FY'21 Financial Results
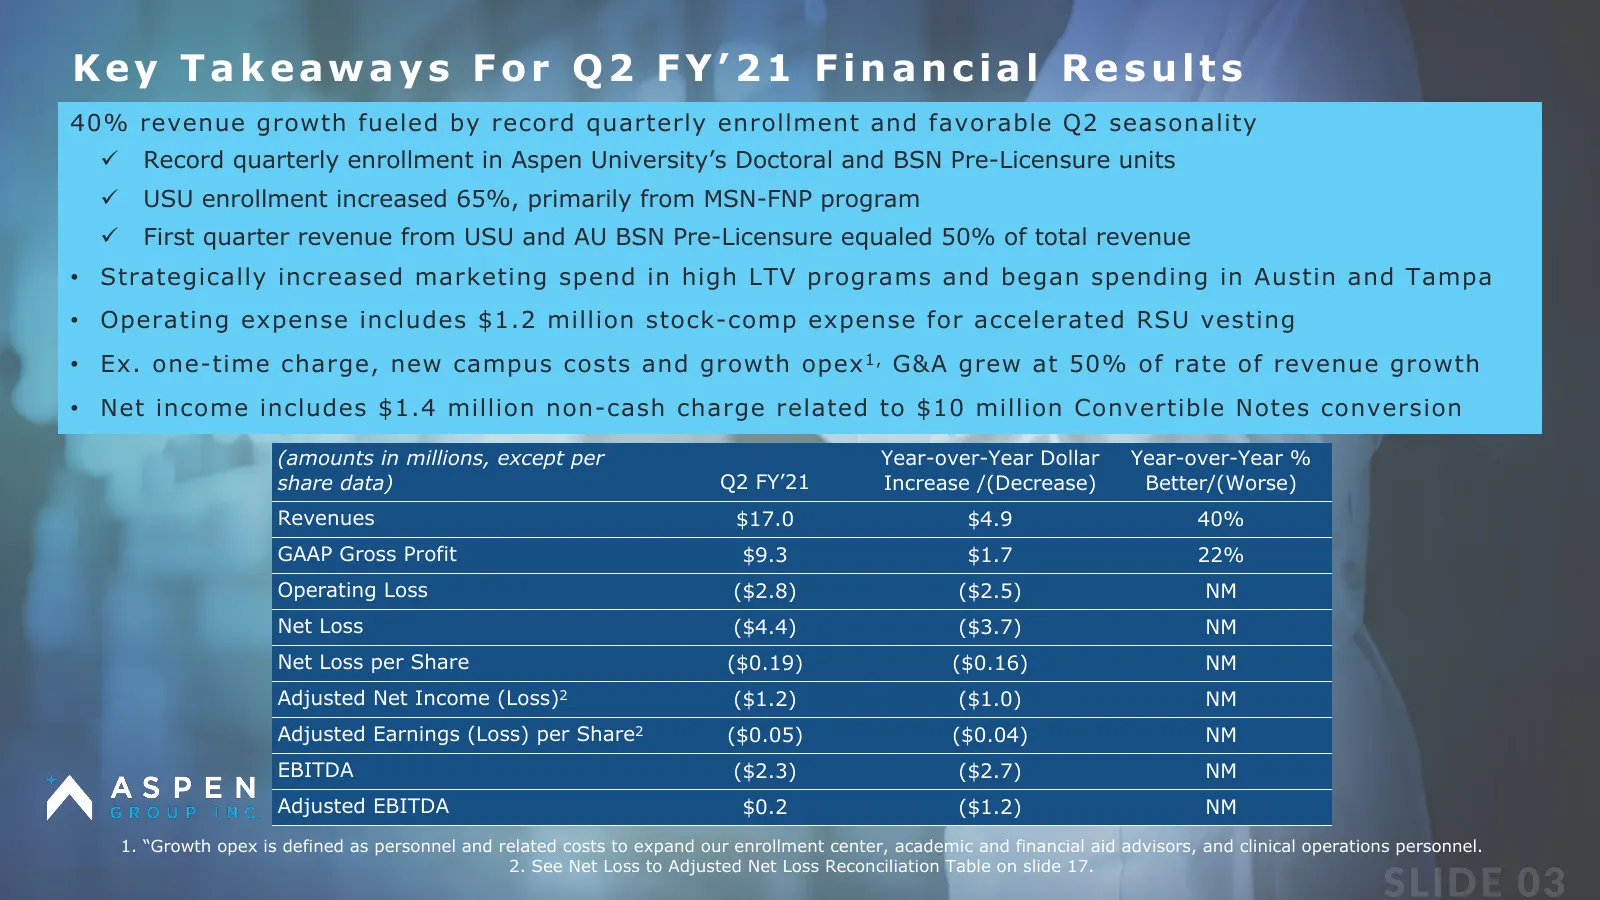
Key Takeaways For Q2 FY’21 Financial Results 40% revenue growth fueled by record quarterly enrollment and favorable Q2 seasonality ü Record quarterly enrollment in Aspen University’s Doctoral and BSN Pre-Licensure units ü USU enrollment increased 65%, primarily from MSN-FNP program ü First quarter r
Slide 4: Second Quarter Fiscal Year 2021 Operating Metrics
Aspen Group, Inc. Second Quarter Fiscal Year 2021 Operating Metrics
Slide 5: AGI Active Student Body Grew by 24% to 13,238 in Q2 FY'21
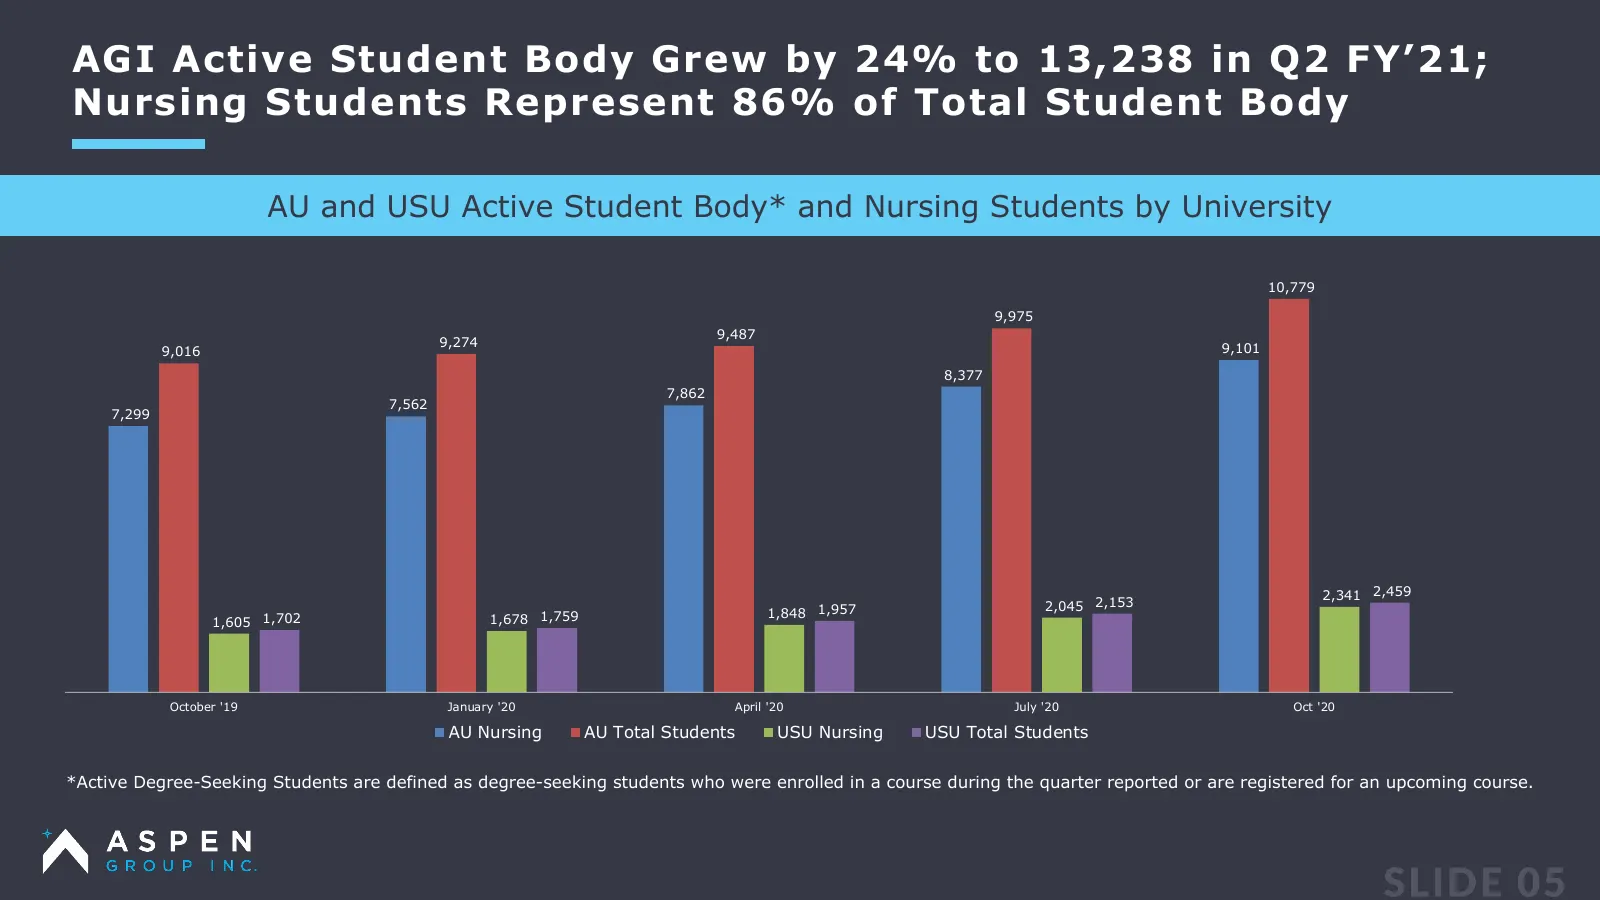
AGI Active Student Body Grew by 24% to 13,238 in Q2 FY’21; Nursing Students Represent 86% of Total Student Body AU and USU Active Student Body* and Nursing Students by University 10,779 9,975 9,487 9,274 9,101 9,016 8,377 7,862 7,562 7,299 2,341 2,459 2,045 2,153 1,678 1,759 1,848 1,957 1,605 1,702
Slide 6: Aspen University Marketing Efficiency Ratio Above 13X for Both Universities
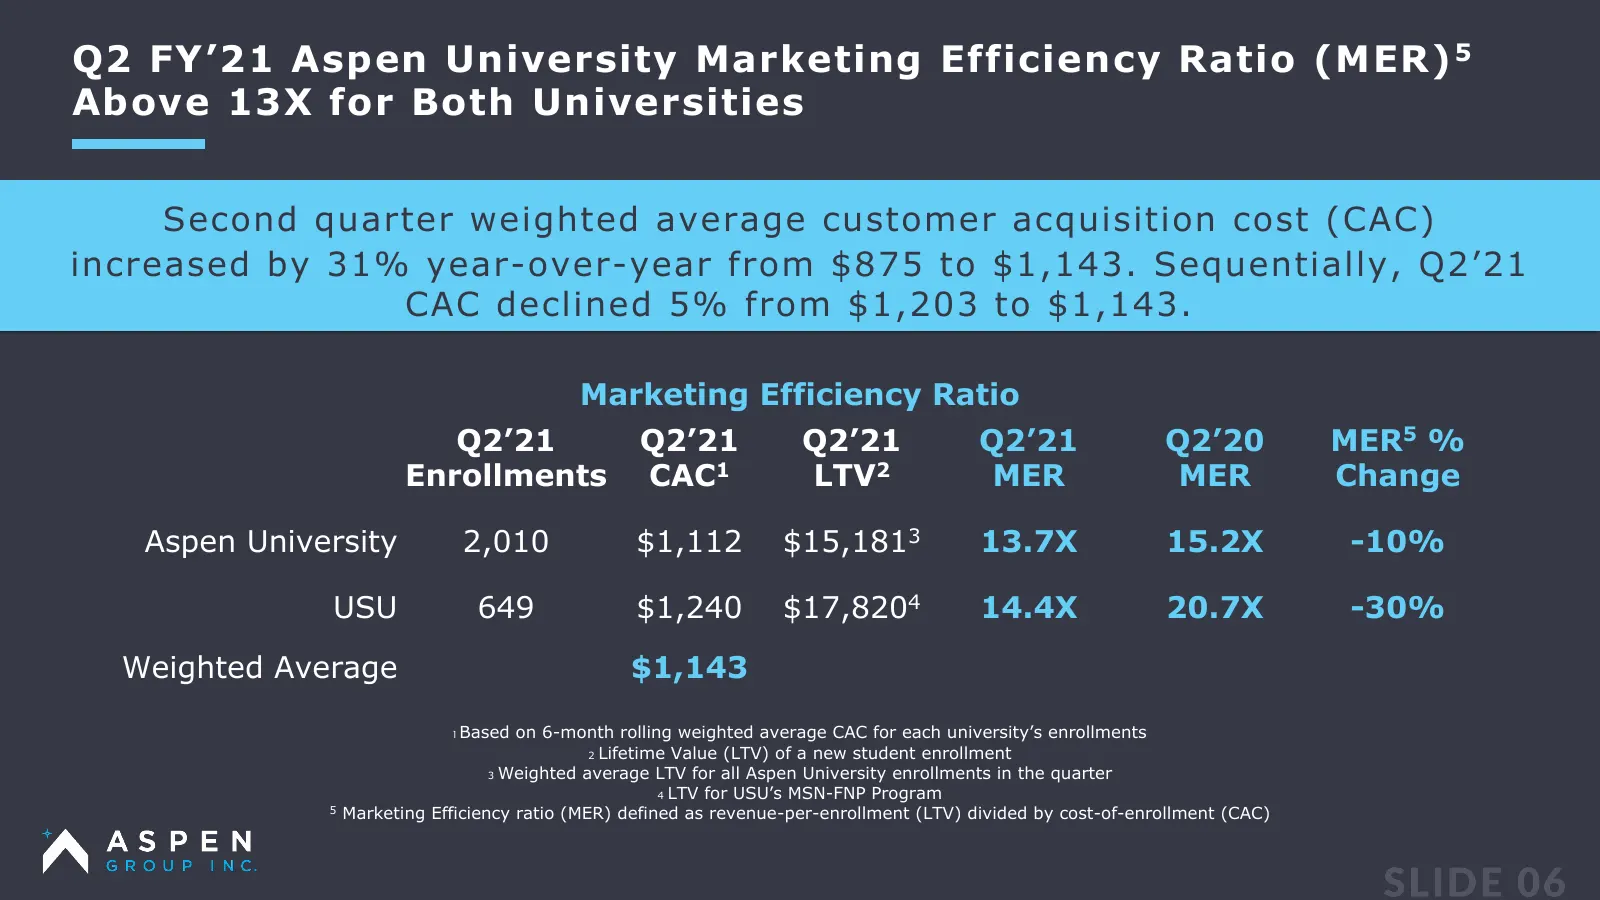
Q2 FY’21 Aspen University Marketing Efficiency Ratio (MER) 5 Above 13X for Both Universities Second quarter weighted average customer acquisition cost (CAC) increased by 31% year-over-year from $875 to $1,143. Sequentially, Q2’21 CAC declined 5% from $1,203 to $1,143. Marketing Efficiency Ratio Q2’2
Slide 7: High LTV Enrollment Growth Lifted Bookings By 34%, ARPU Growth 12%
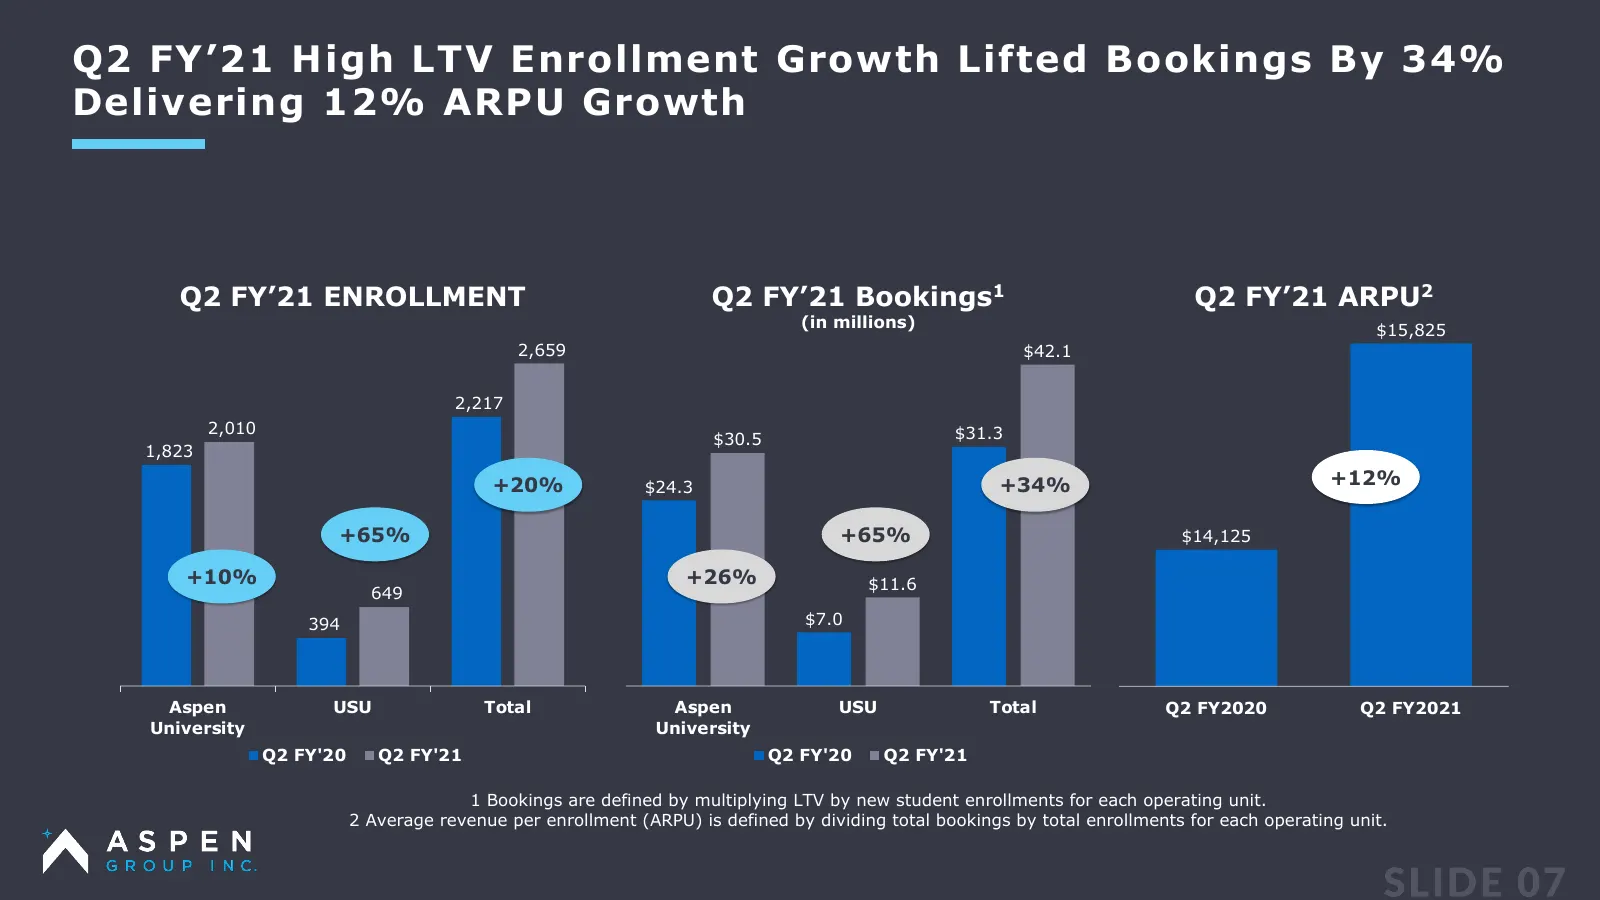
Q2 FY’21 High LTV Enrollment Growth Lifted Bookings By 34% Delivering 12% ARPU Growth Q2 FY’21 ENROLLMENT Q2 FY’21 Bookings1 Q2 FY’21 ARPU2 (in millions) $15,825 2,659 $42.1 2,217 2,010 $31.3 $30.5 1,823 +20% $24.3 +34% +12% +65% +65% $14,125 +10% +26% $11.6 649 394 $7.0 Aspen USU Total Aspen USU To
Slide 8: Gross Profit Reflects Strategic Spending Increase to Support Future Growth
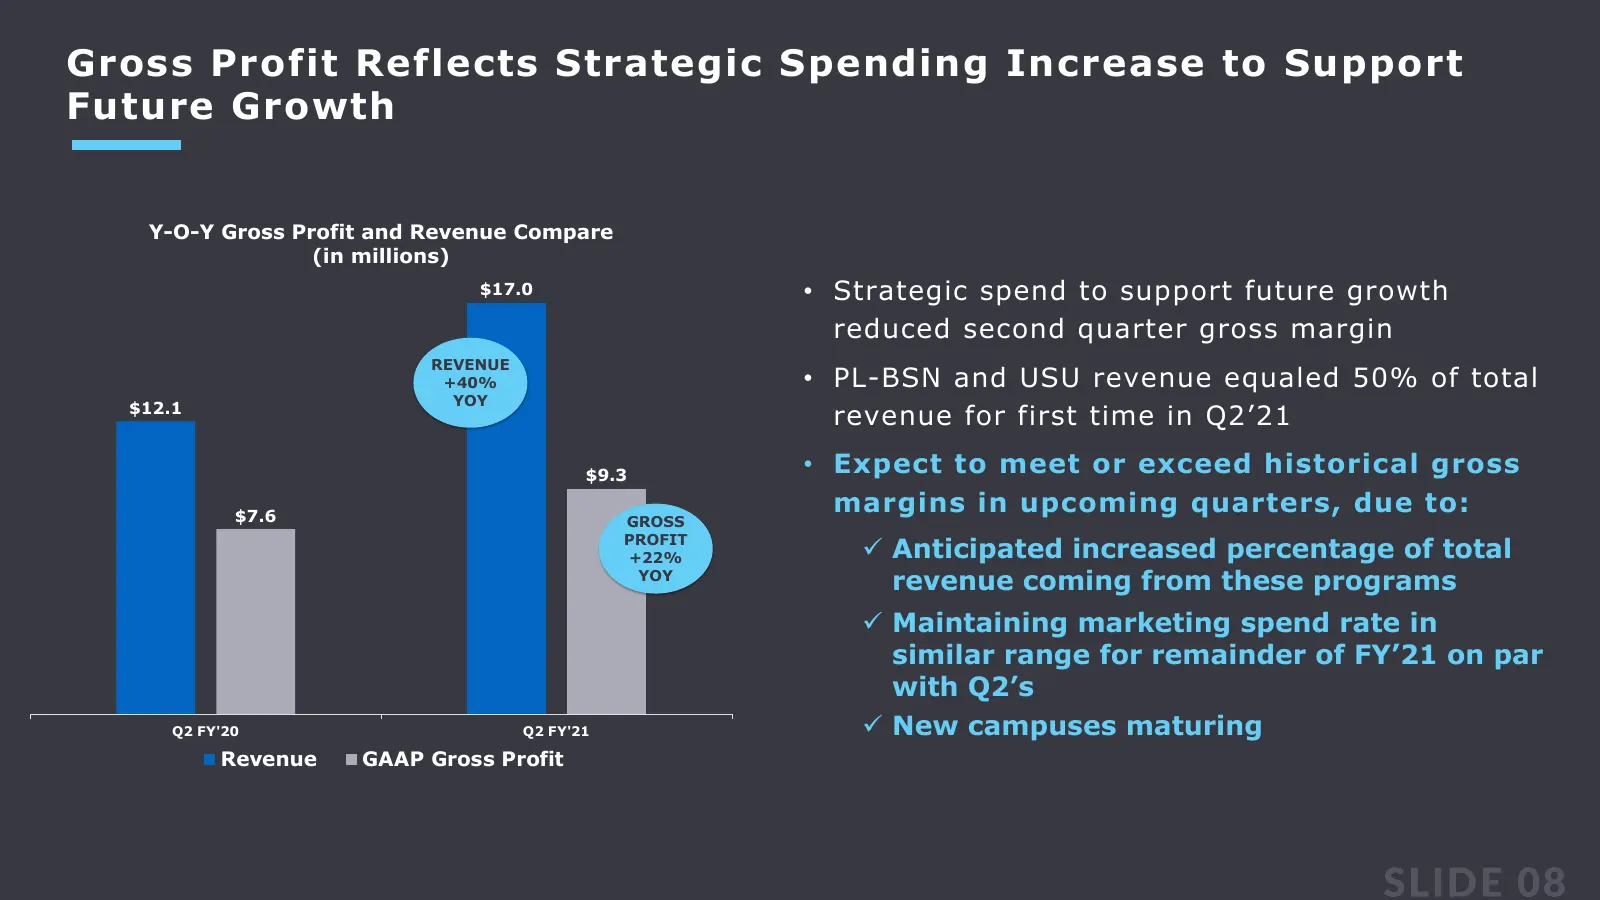
Gross Profit Reflects Strategic Spending Increase to Support Future Growth Y-O-Y Gross Profit and Revenue Compare (in millions) $17.0 • Strategic spend to support future growth reduced second quarter gross margin REVENUE +40% • PL-BSN and USU revenue equaled 50% of total YOY $12.1 revenue for first
Slide 9: Trend G&A Grew at 50% of Rate of Revenue Growth
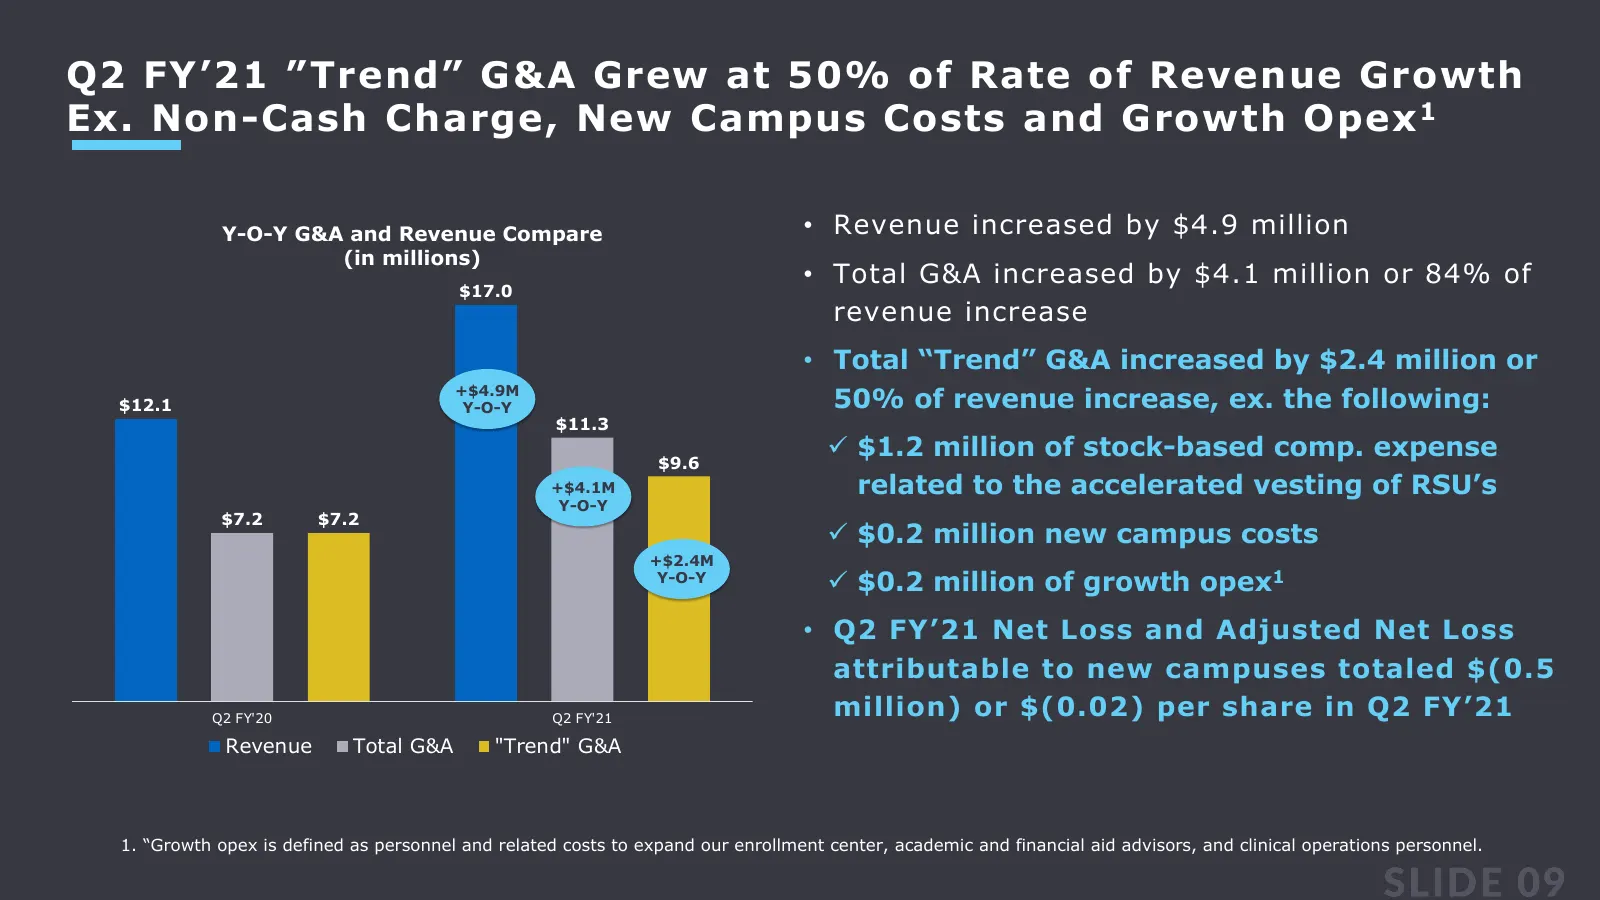
Q2 FY’21 ”Trend” G&A Grew at 50% of Rate of Revenue Growth Ex. Non-Cash Charge, New Campus Costs and Growth Opex 1 Y-O-Y G&A and Revenue Compare • Revenue increased by $4.9 million (in millions) • Total G&A increased by $4.1 million or 84% of $17.0 revenue increase • Total “Trend” G&A increased by $
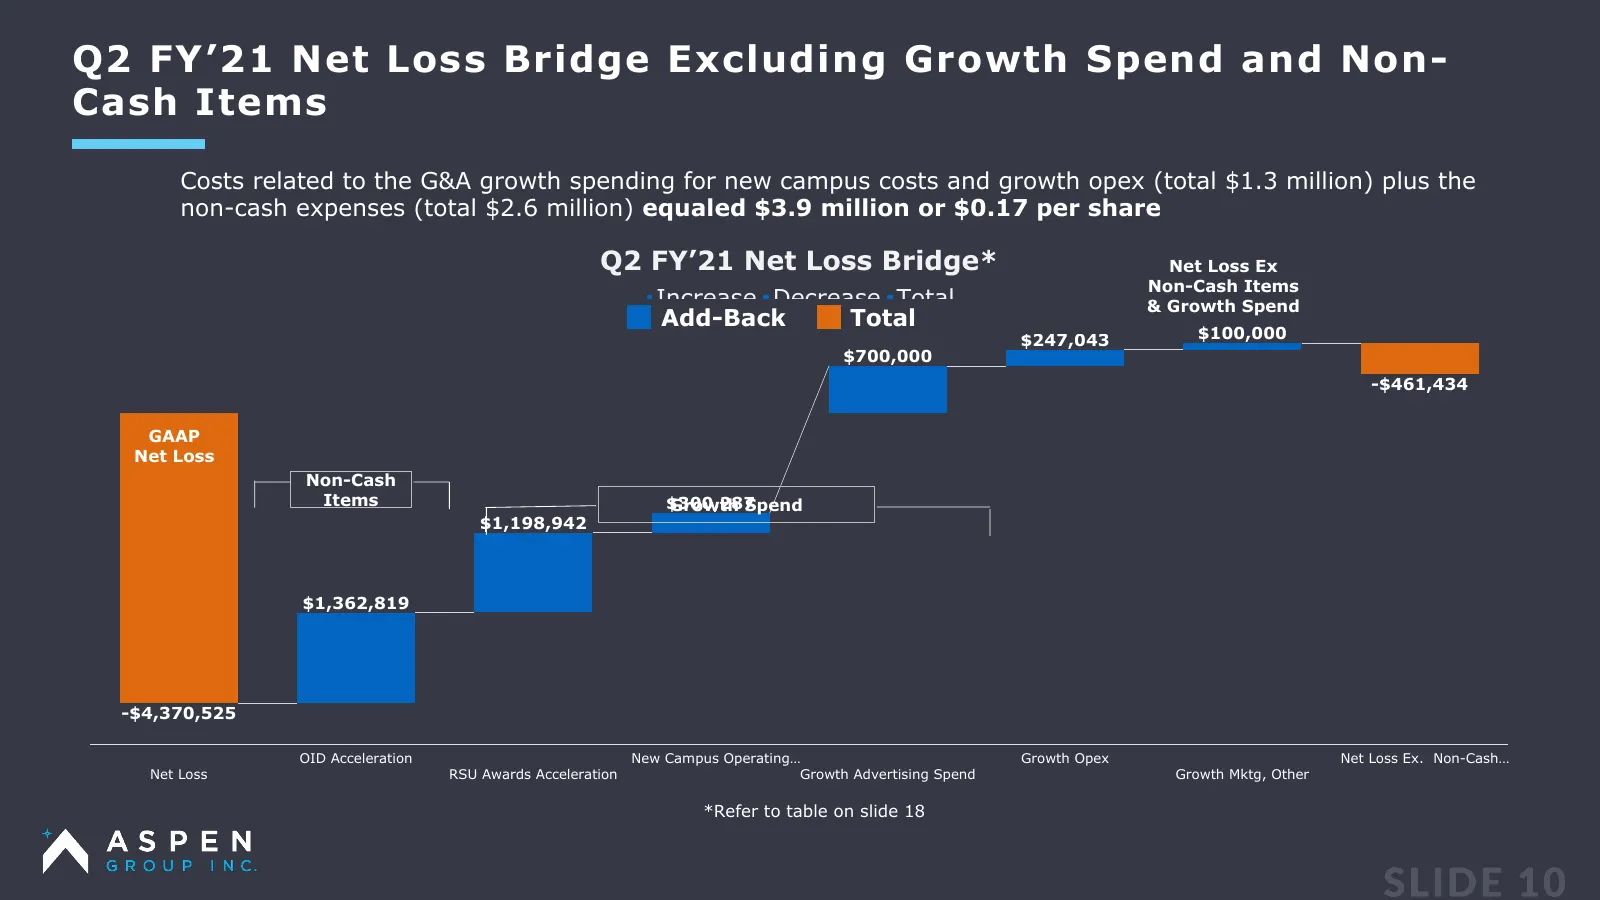
Slide 10: Net Loss Bridge Excluding Growth Spend and Non-Cash Items
Q2 FY’21 Net Loss Bridge Excluding Growth Spend and Non- Cash Items Costs related to the G&A growth spending for new campus costs and growth opex (total $1.3 million) plus the non-cash expenses (total $2.6 million) equaled $3.9 million or $0.17 per share Q2 FY’21 Net Loss Bridge* Net Loss Ex Non-Cas
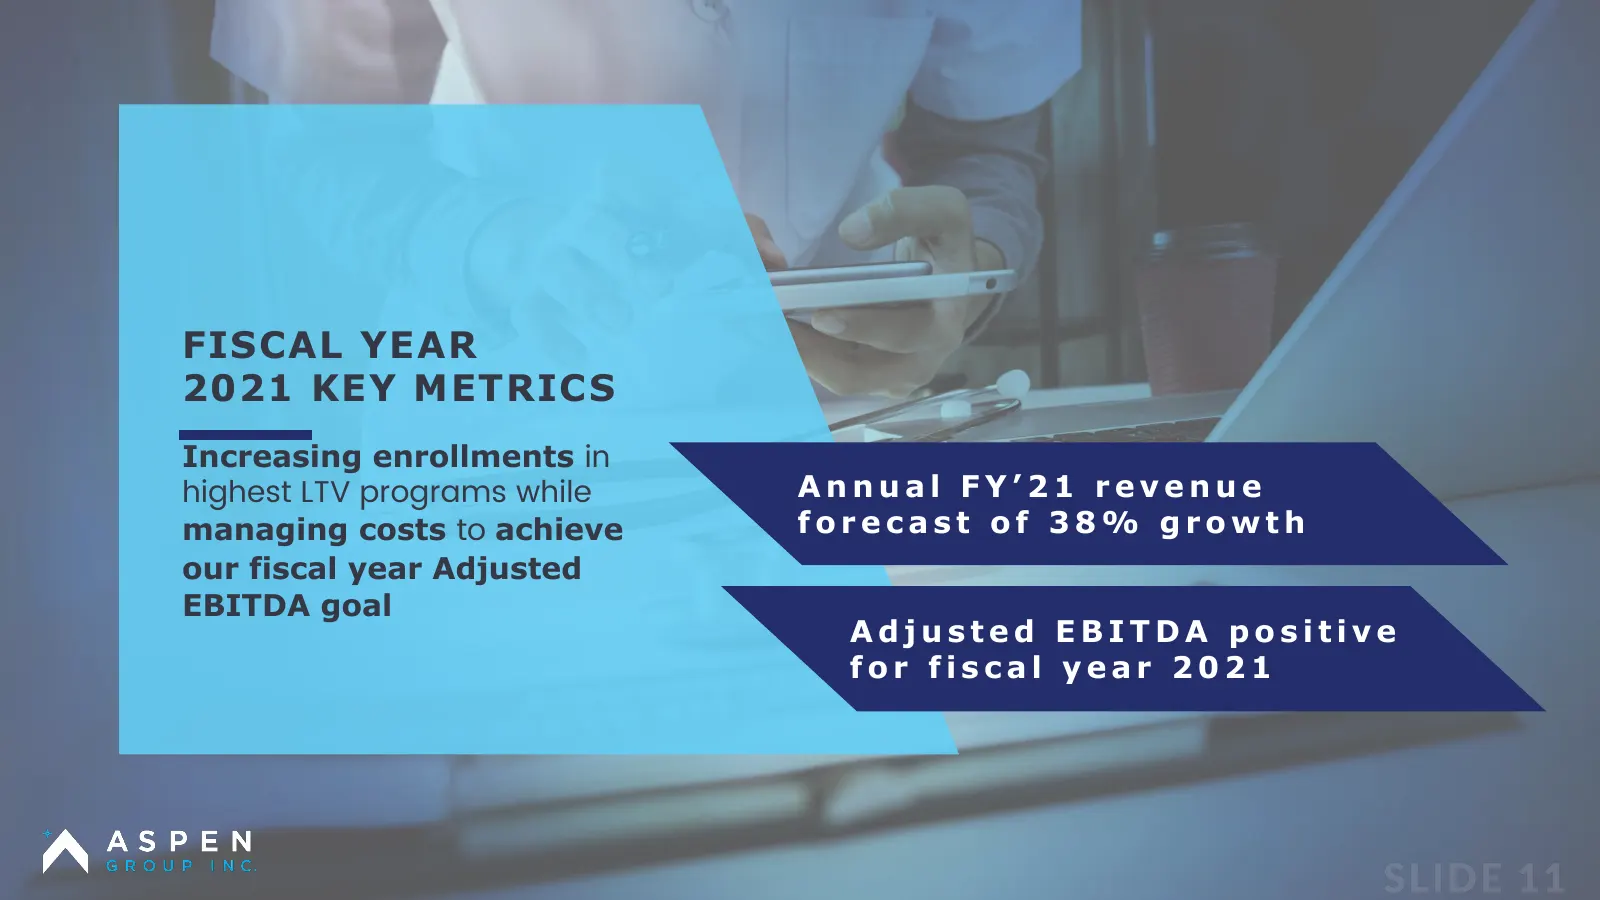
Slide 11: Fiscal Year 2021 Key Metrics
FISCAL YEAR 2021 KEY METRICS Increasing enrollments in highest LTV programs while Annual FY’21 revenue managing costs to achieve forecast of 38% growth our fiscal year Adjusted EBITDA goal Adjusted EBITDA positive for fiscal year 2021

Slide 12: Second Quarter Fiscal Year 2021 Financial Results
Aspen Group, Inc. Second Quarter Fiscal Year 2021 Financial Results
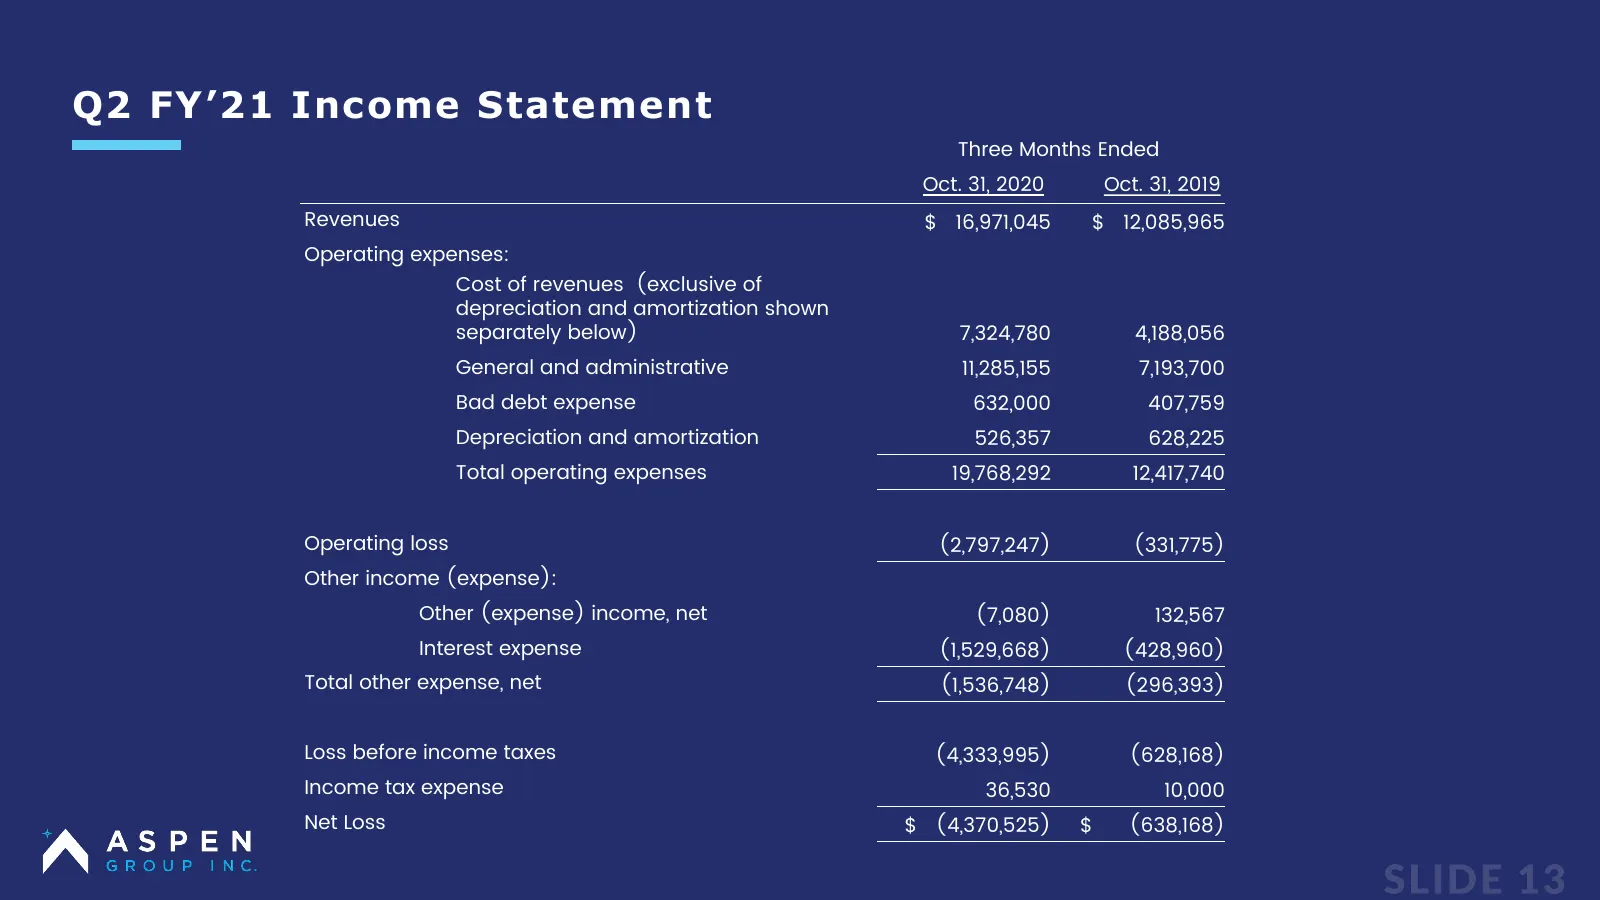
Slide 13: Income Statement
Q2 FY’21 Income Statement Three Months Ended Oct. 31, 2020 Oct. 31, 2019 Revenues $ 16,971,045 $ 12,085,965 Operating expenses: Cost of revenues (exclusive of depreciation and amortization shown separately below) 7,324,780 4,188,056 General and administrative 11,285,155 7,193,700 Bad debt expense 63
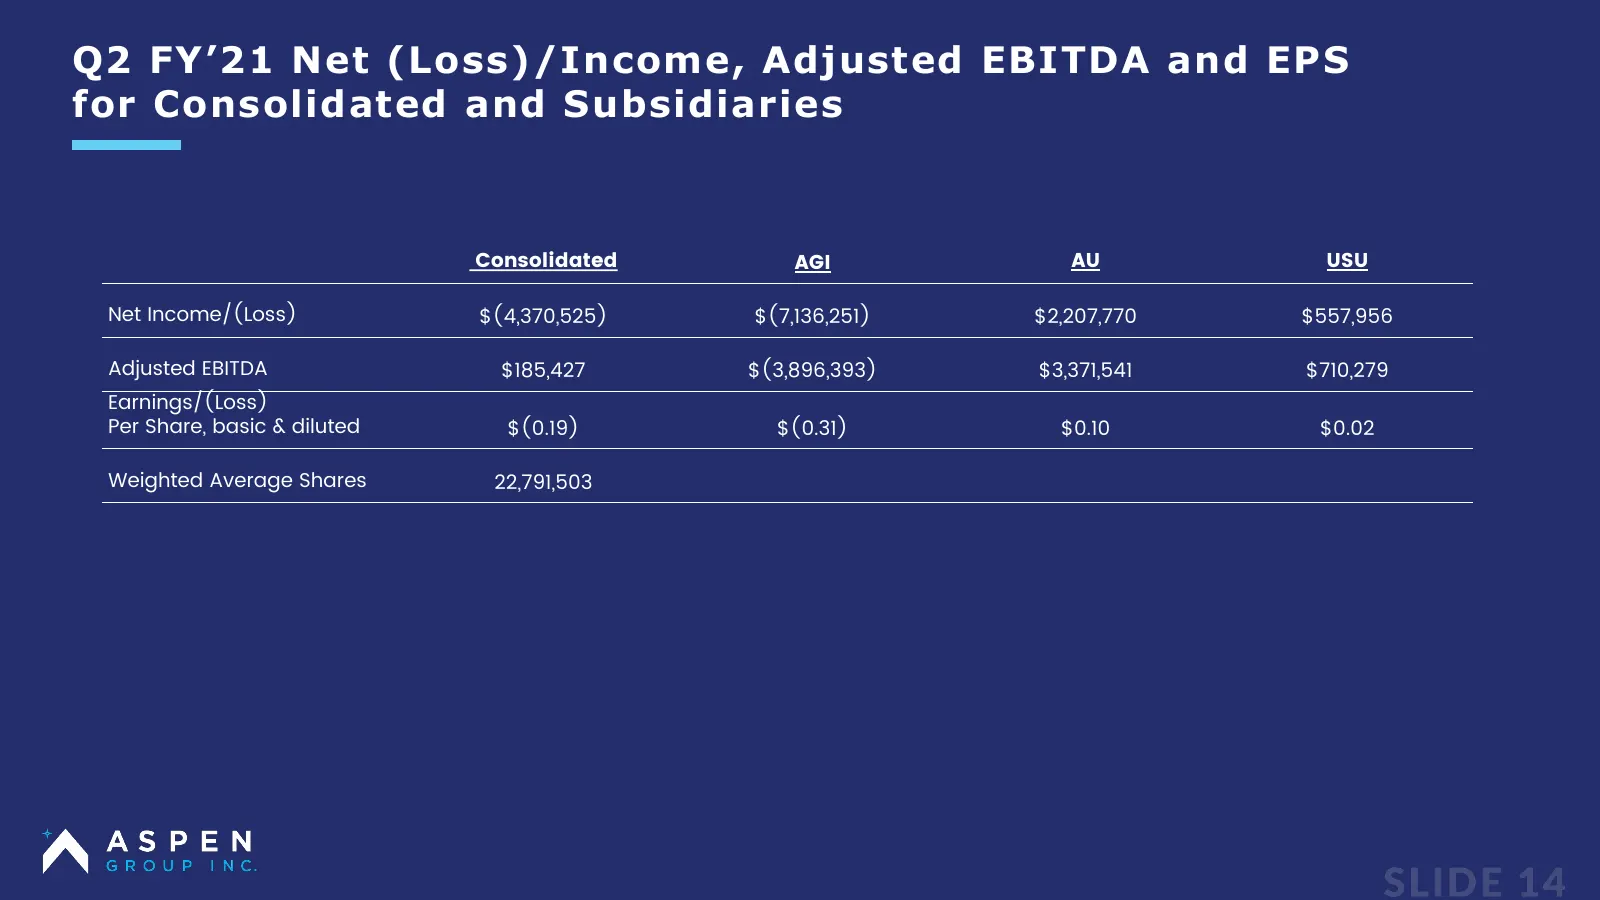
Slide 14: Net (Loss)/Income, Adjusted EBITDA and EPS for Consolidated and Subsidiaries
Q2 FY’21 Net (Loss)/Income, Adjusted EBITDA and EPS for Consolidated and Subsidiaries Consolidated AGI AU USU Net Income/(Loss) $(4,370,525) $(7,136,251) $2,207,770 $557,956 Adjusted EBITDA $185,427 $(3,896,393) $3,371,541 $710,279 Earnings/(Loss) Per Share, basic & diluted $(0.19) $(0.31) $0.10 $0.
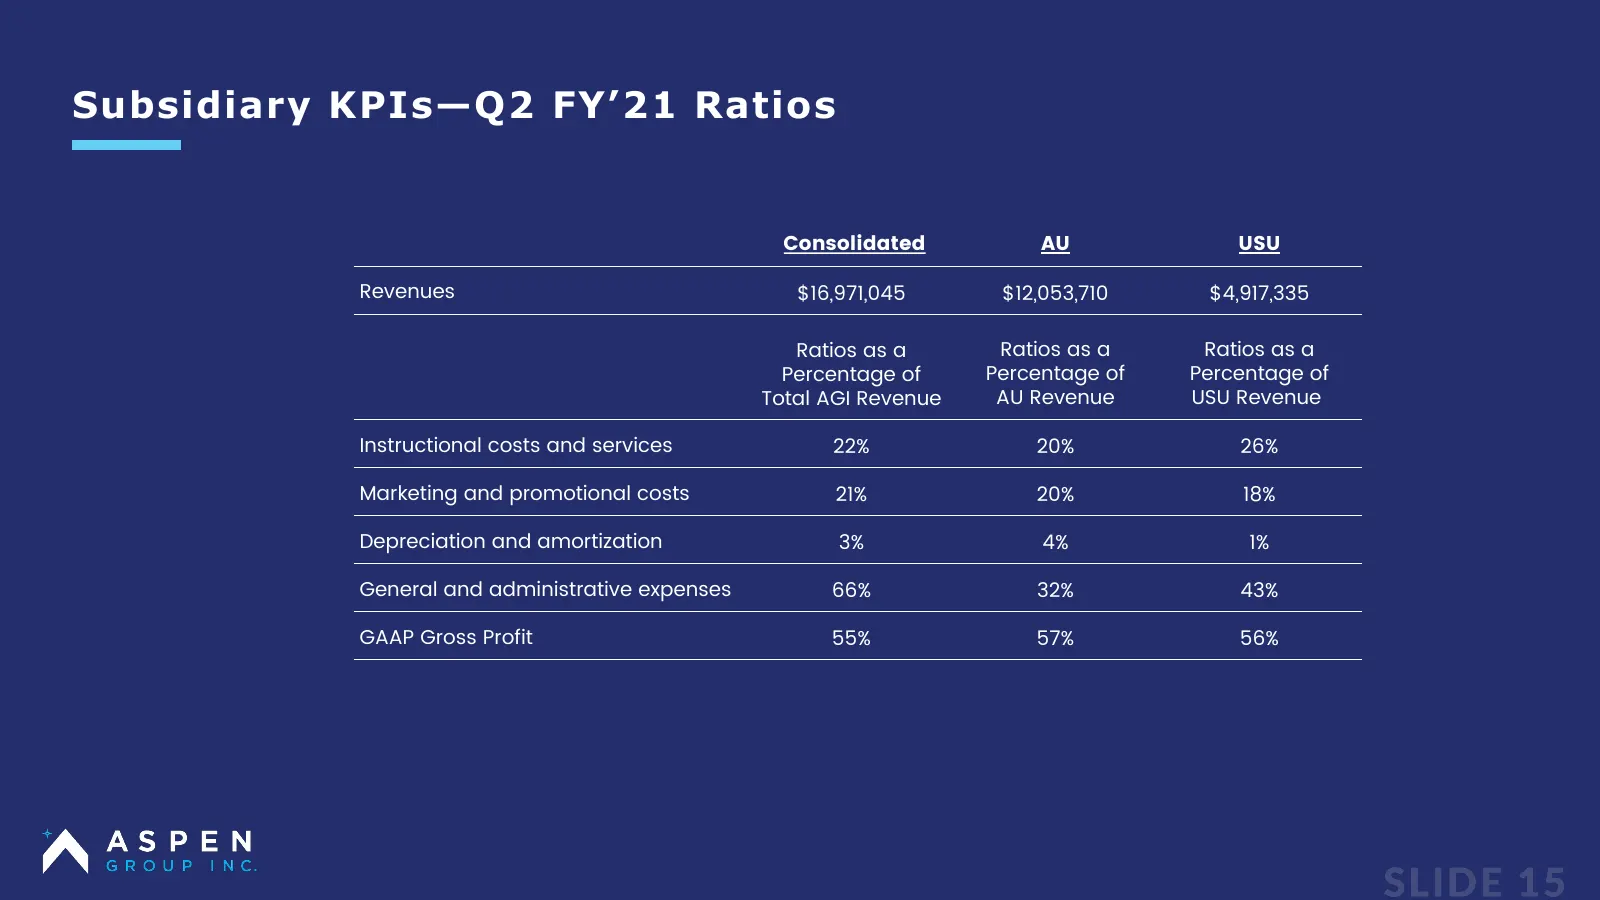
Slide 15: Subsidiary KPIs—Q2 FY'21 Ratios
Subsidiary KPIs—Q2 FY’21 Ratios Consolidated AU USU Revenues $16,971,045 $12,053,710 $4,917,335 Ratios as a Ratios as a Ratios as a Percentage of Percentage of Percentage of Total AGI Revenue AU Revenue USU Revenue Instructional costs and services 22% 20% 26% Marketing and promotional costs 21% 20%
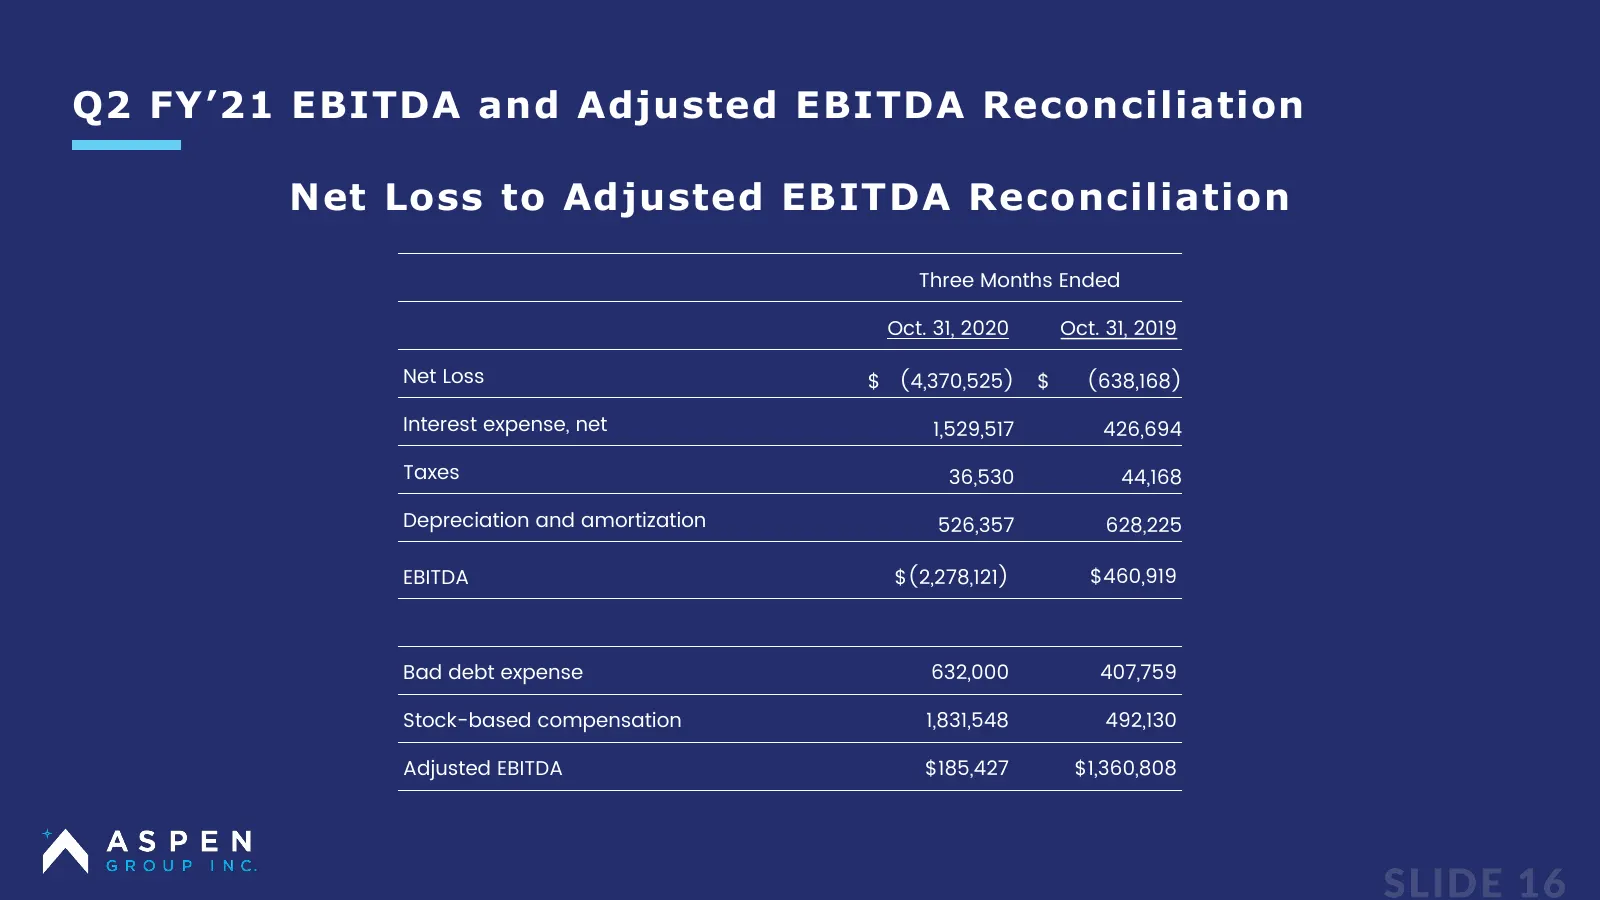
Slide 16: EBITDA and Adjusted EBITDA Reconciliation
Q2 FY’21 EBITDA and Adjusted EBITDA Reconciliation Net Loss to Adjusted EBITDA Reconciliation Three Months Ended Oct. 31, 2020 Oct. 31, 2019 Net Loss $ (4,370,525) $ (638,168) Interest expense, net 1,529,517 426,694 Taxes 36,530 44,168 Depreciation and amortization 526,357 628,225 EBITDA $(2,278,121
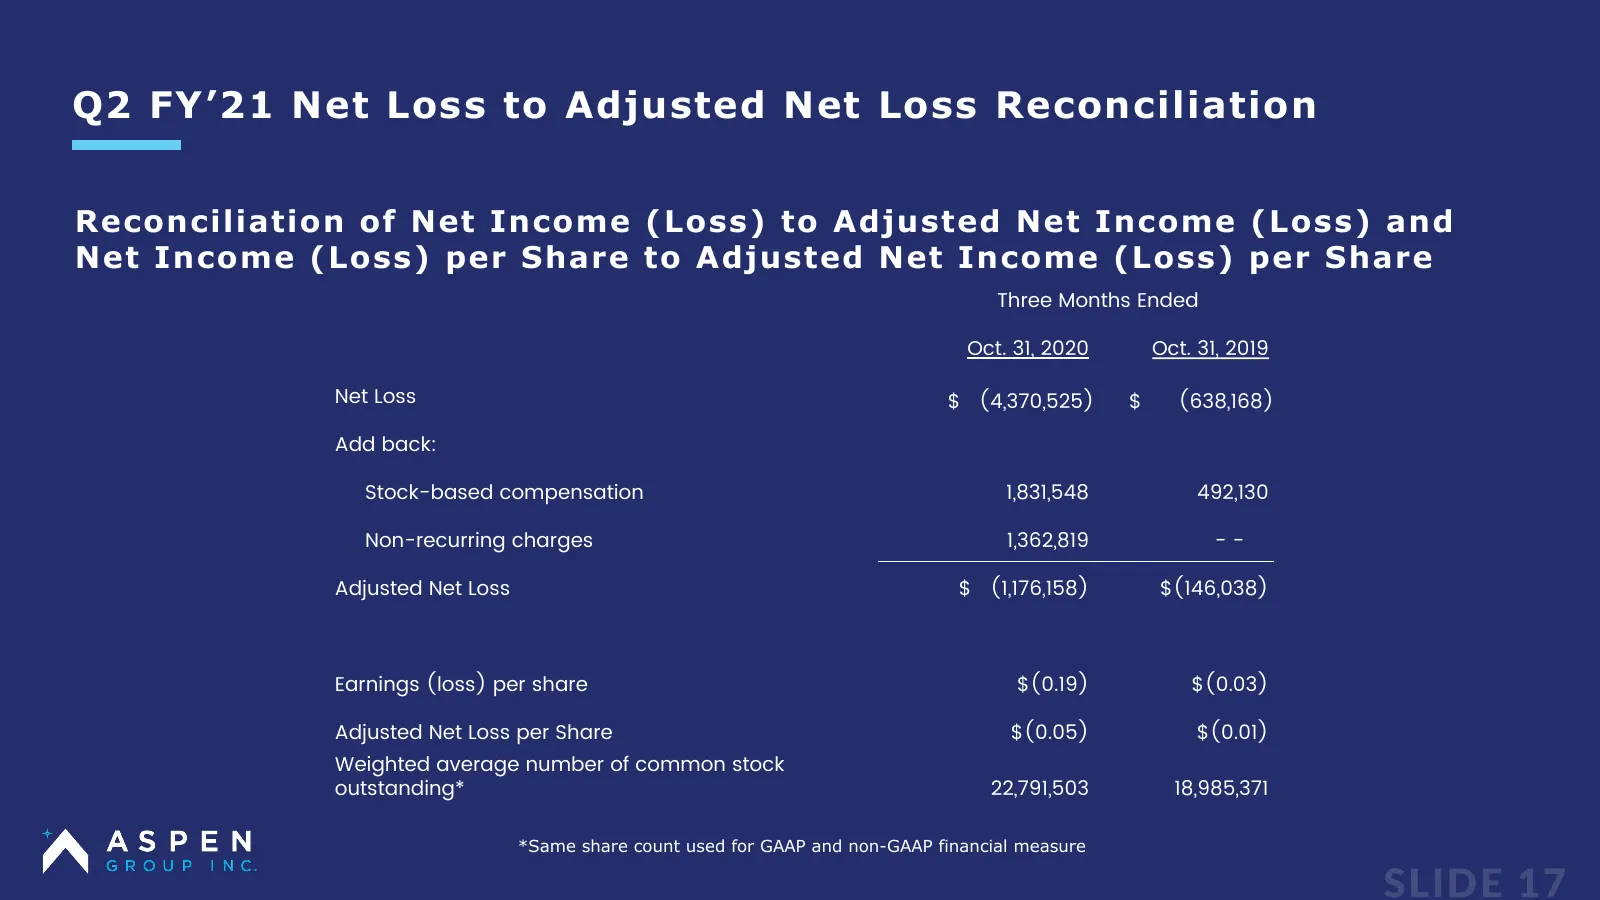
Slide 17: Net Loss to Adjusted Net Loss Reconciliation
Q2 FY’21 Net Loss to Adjusted Net Loss Reconciliation Reconciliation of Net Income (Loss) to Adjusted Net Income (Loss) and Net Income (Loss) per Share to Adjusted Net Income (Loss) per Share Three Months Ended Oct. 31, 2020 Oct. 31, 2019 Net Loss $ (4,370,525) $ (638,168) Add back: Stock-based comp
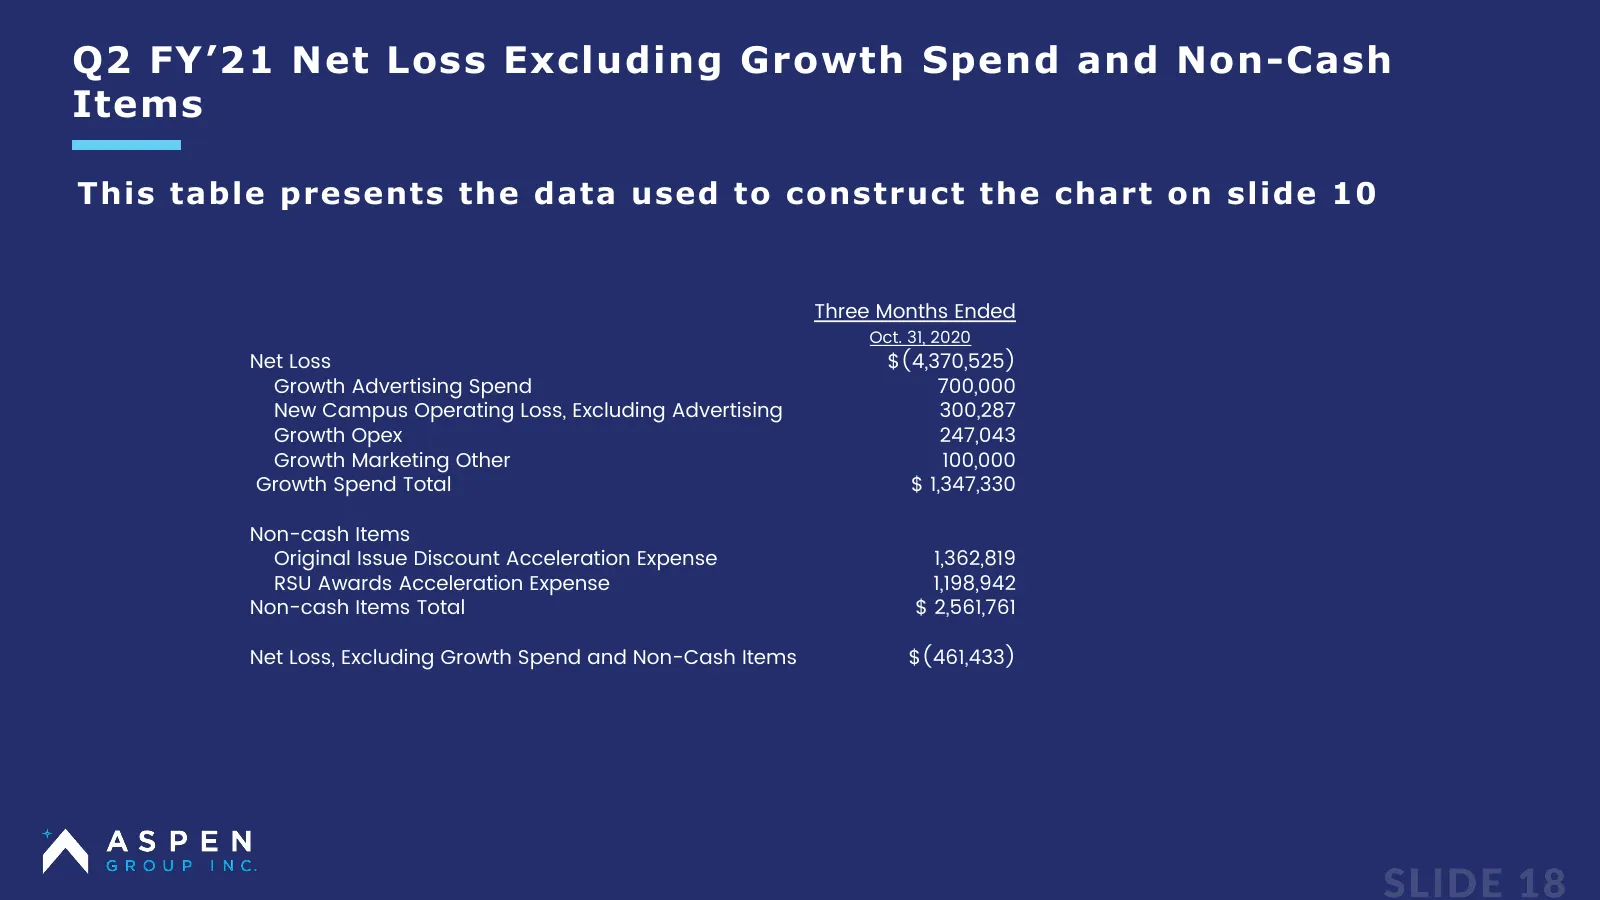
Slide 18: Net Loss Excluding Growth Spend and Non-Cash Items
Q2 FY’21 Net Loss Excluding Growth Spend and Non-Cash Items This table presents the data used to construct the chart on slide 10 Three Months Ended Oct. 31, 2020 Net Loss $(4,370,525) Growth Advertising Spend 700,000 New Campus Operating Loss, Excluding Advertising 300,287 Growth Opex 247,043 Growth
Source: company website
More decks from Aspen Group, Inc.
 Q1 FY2027 Earnings Presentation18 slides · October 2026
 Q4 FY2026 Earnings Presentation20 slides · August 2026
 Q3 FY2026 Earnings Presentation21 slides · April 2026
 Q2 FY2023 Earnings Presentation17 slides · Dec 13, 2022
 Q1 FY2023 Earnings Presentation17 slides · Sep 13, 2022
 FY2022 Earnings Presentation14 slides · Jul 19, 2022