GAIN Capital — Q1 2019 Earnings Presentation
32 slides from GAIN Capital's earnings presentation, Apr 25, 2019
Slide 1: Q1 2019 Results
GAIN | CAPITAL Q12019 Results April 2019
Slide 2: Safe Harbor Statement
SAFE HARBOR STATEMENT Forward Looking Statements In addition to historical information, this earnings presentation contains "forward-looking" statements that reflect management's expectations for the future. A variety of important factors could cause results to differ materially from such statements
Slide 3: Market Conditions Present Challenging Environment
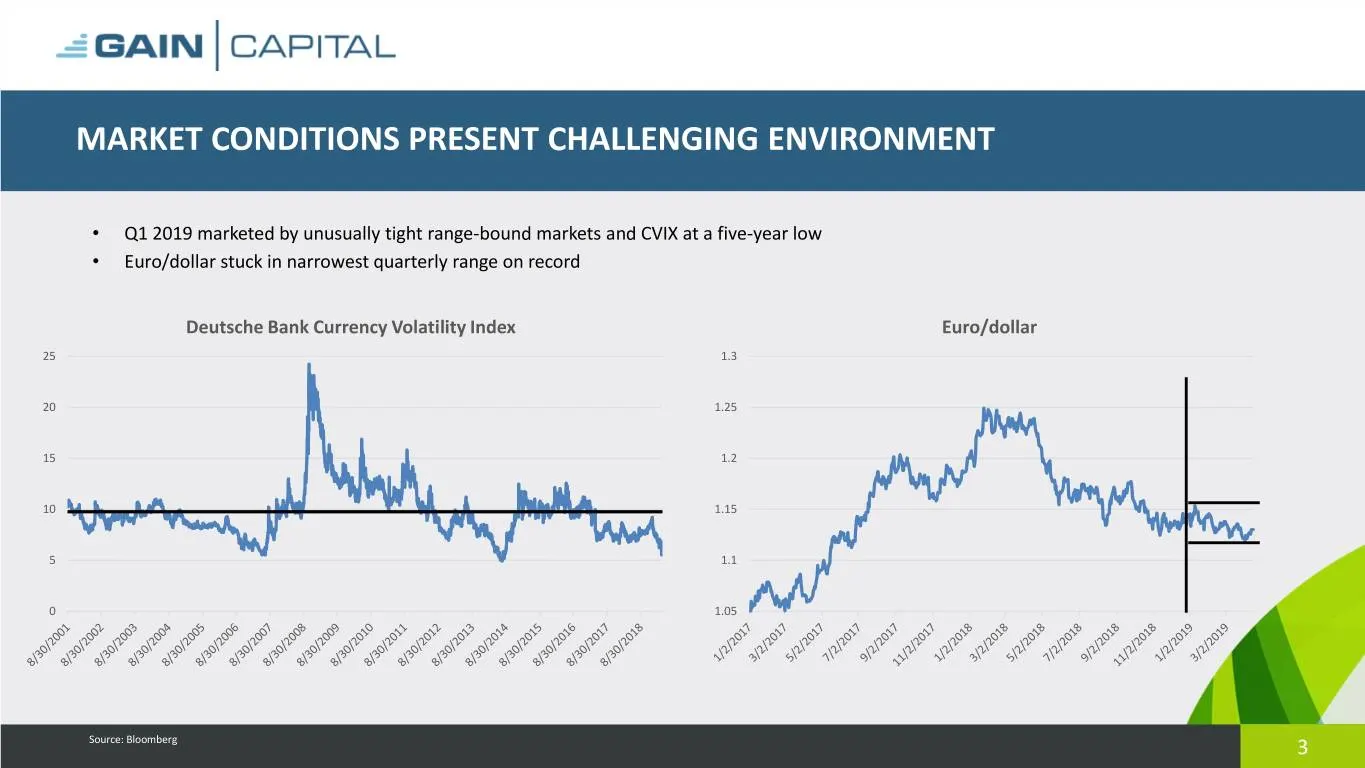
MARKET CONDITIONS PRESENT CHALLENGING ENVIRONMENT • Q1 2019 marketed by unusually tight range-bound markets and CVIX at a five-year low • Euro/dollar stuck in narrowest quarterly range on record Deutsche Bank Currency Volatility Index Euro/dollar 25 1.3 20 1.25 15 1.2 10 1.15 5 1.1 0 1.05 Source: Bl
Slide 4: First Quarter 2019 Review
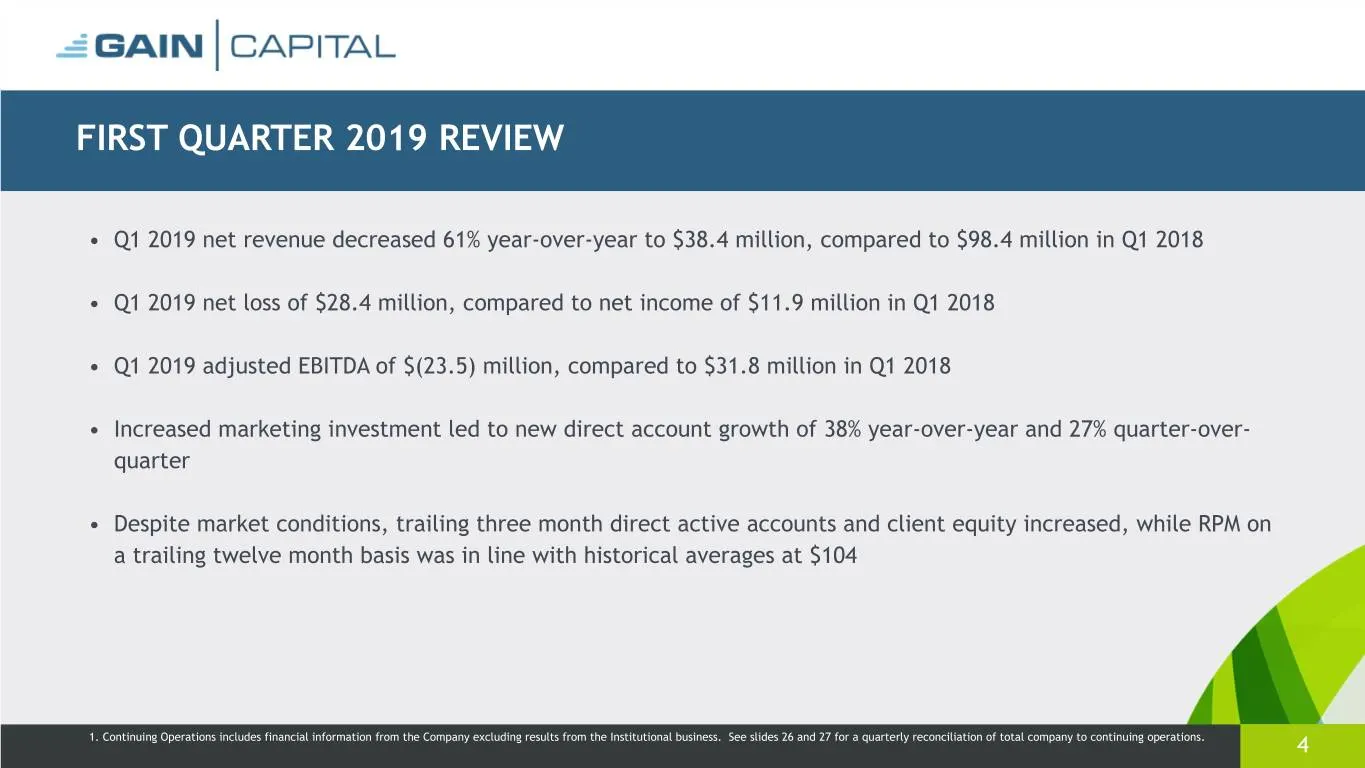
FIRST QUARTER 2019 REVIEW • Q1 2019 net revenue decreased 61% year-over-year to $38.4 million, compared to $98.4 million in Q1 2018 • Q1 2019 net loss of $28.4 million, compared to net income of $11.9 million in Q1 2018 • Q1 2019 adjusted EBITDA of $(23.5) million, compared to $31.8 million in Q1 20
Slide 5: Operating Metrics Showing Positive Signs for Future Organic Growth
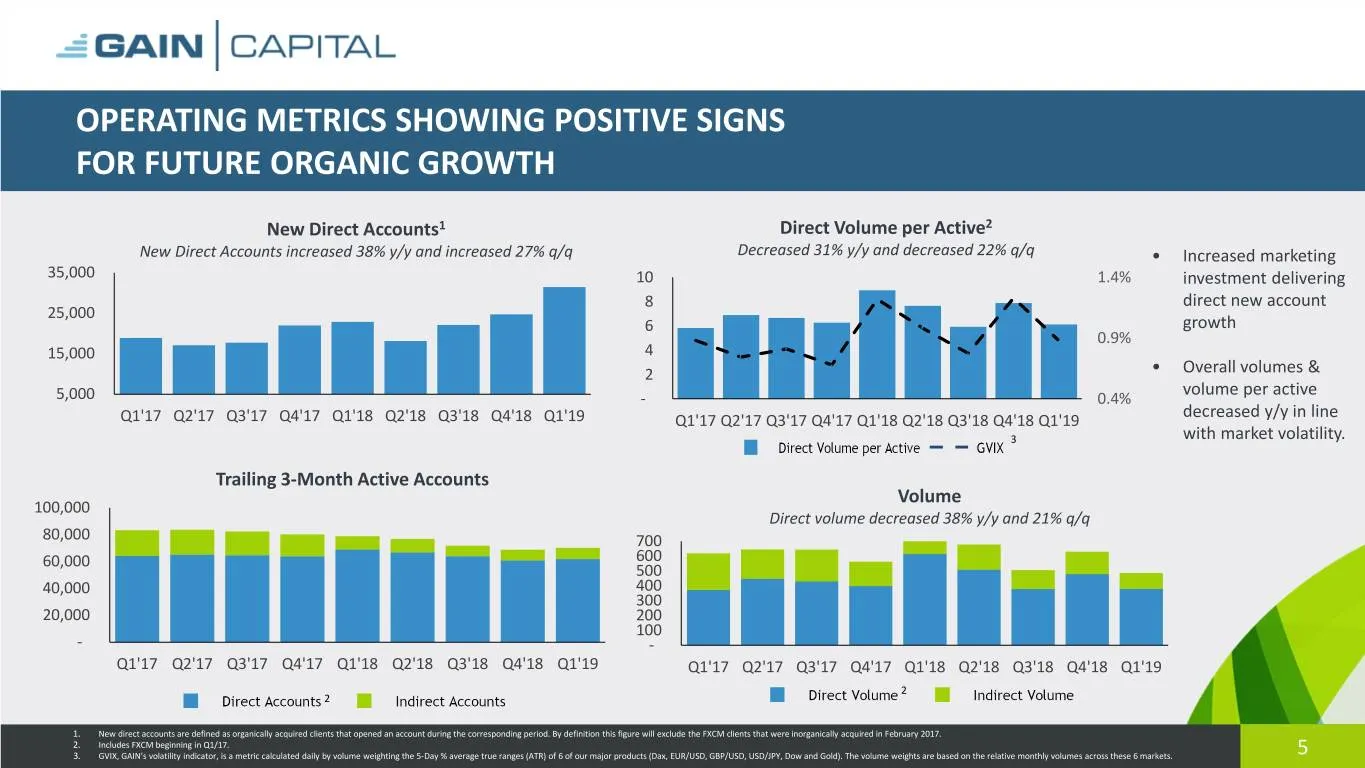
OPERATING METRICS SHOWING POSITIVE SIGNS FOR FUTURE ORGANIC GROWTH New Direct Accounts1 Direct Volume per Active2 New Direct Accounts increased 38% y/y and increased 27% q/q Decreased 31% y/y and decreased 22% q/q • Increased marketing 35,000 10 1.4% investment delivering 8 direct new account 25,000
Slide 6: Benefits from Increased Marketing Investment
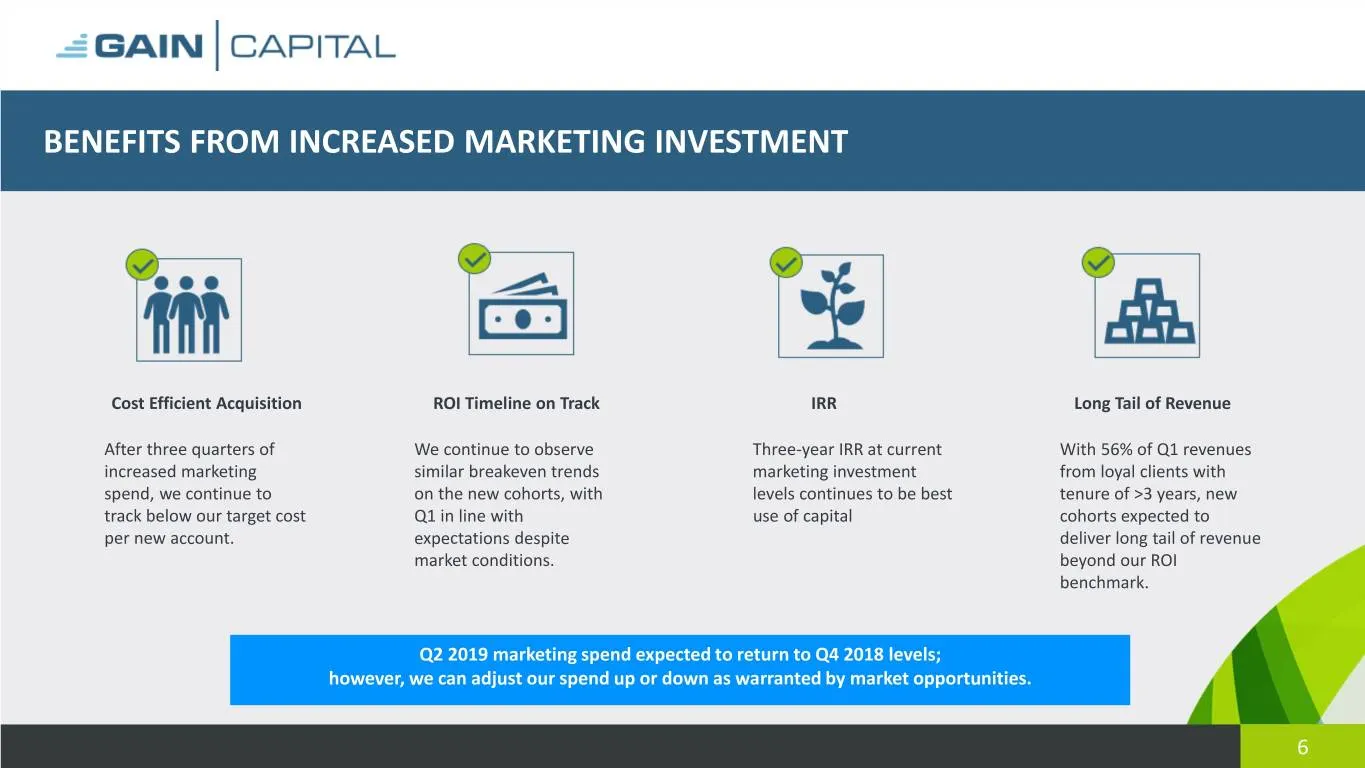
BENEFITS FROM INCREASED MARKETING INVESTMENT Cost Efficient Acquisition ROI Timeline on Track IRR Long Tail of Revenue After three quarters of We continue to observe Three-year IRR at current With 56% of Q1 revenues increased marketing similar breakeven trends marketing investment from loyal clients
Slide 7: AI-Driven Hedging Model Performance
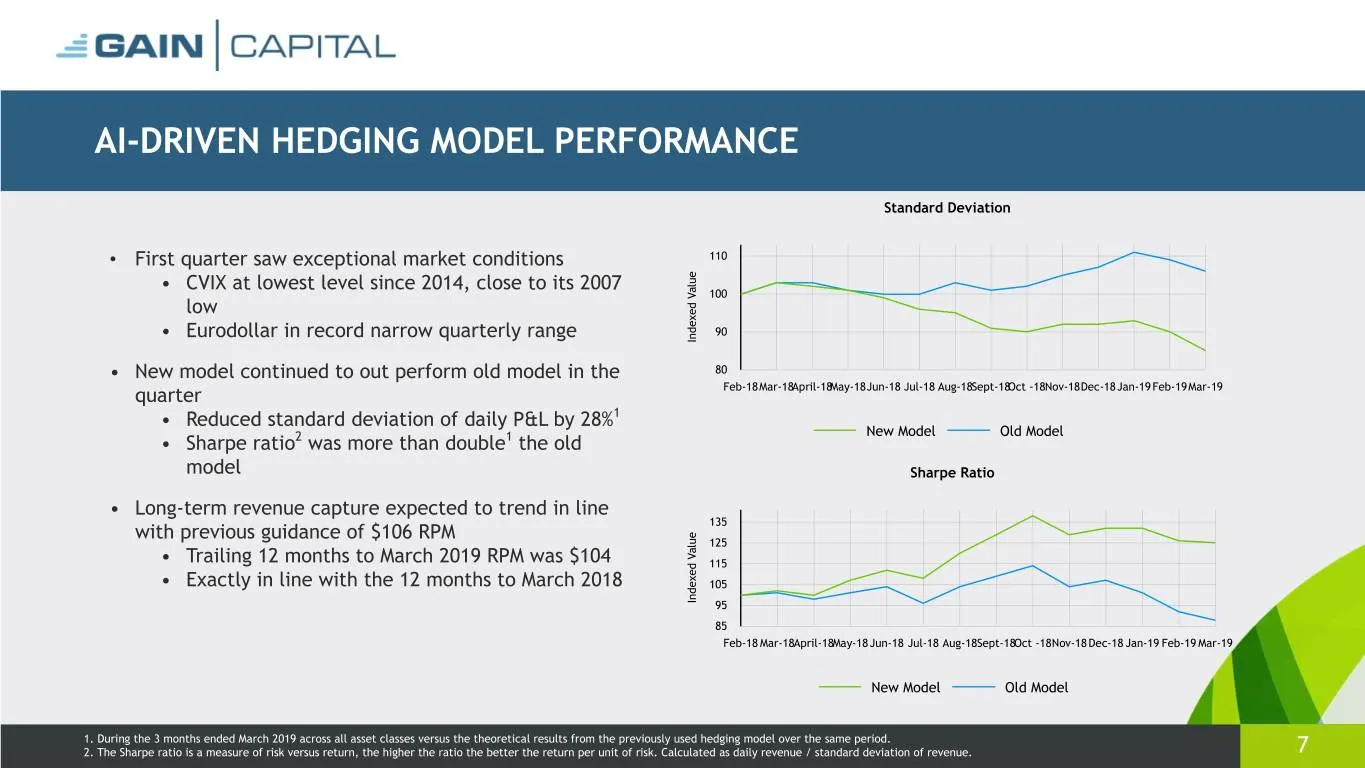
AI-DRIVEN HEDGING MODEL PERFORMANCE Standard Deviation • First quarter saw exceptional market conditions 110 e u l • CVIX at lowest level since 2014, close to its 2007 a V 100 d low e x e d 90 • Eurodollar in record narrow quarterly range n I • New model continued to out perform old model in the 80
Slide 8: Long-Term Strategic Priorities to Accelerate Organic Growth
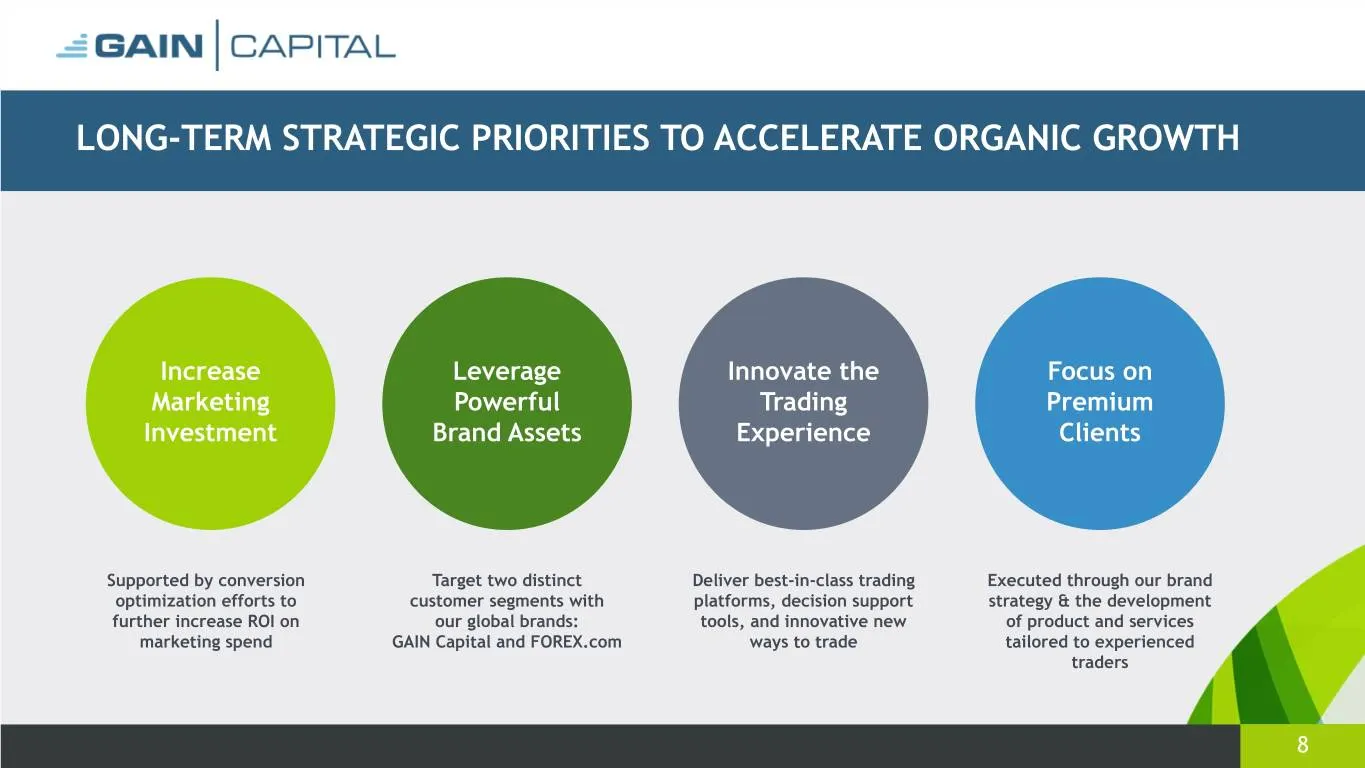
LONG-TERM STRATEGIC PRIORITIES TO ACCELERATE ORGANIC GROWTH Increase Leverage Innovate the Focus on Marketing Powerful Trading Premium Investment Brand Assets Experience Clients Supported by conversion Target two distinct Deliver best-in-class trading Executed through our brand optimization efforts
Slide 9: 2021 Operating and Financial Targets
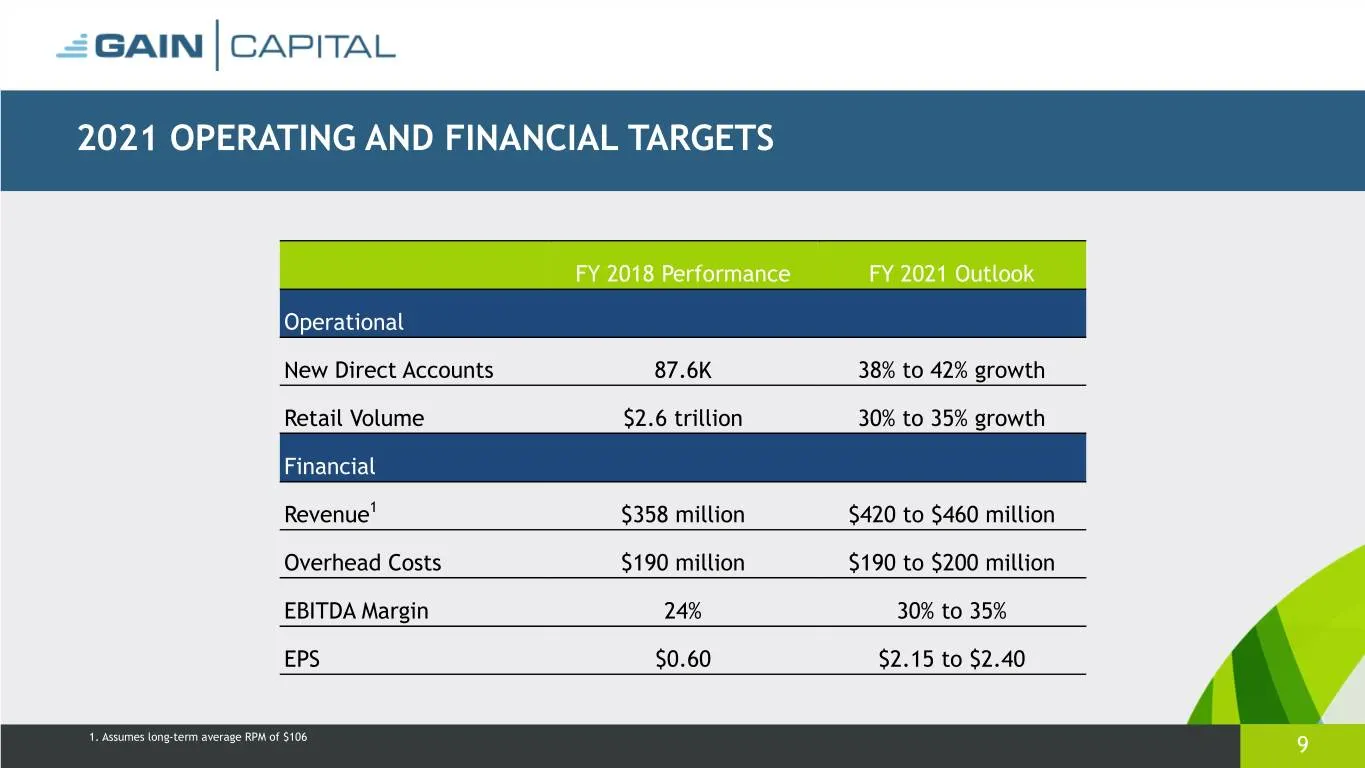
2021 OPERATING AND FINANCIAL TARGETS FY 2018 Performance FY 2021 Outlook Operational New Direct Accounts 87.6K 38% to 42% growth Retail Volume $2.6 trillion 30% to 35% growth Financial Revenue1 $358 million $420 to $460 million Overhead Costs $190 million $190 to $200 million EBITDA Margin 24% 30% t
Slide 10: Financial Review
GAIN | CAPITAL Financial Review
Slide 11: Key Financial Results & Operating Metrics
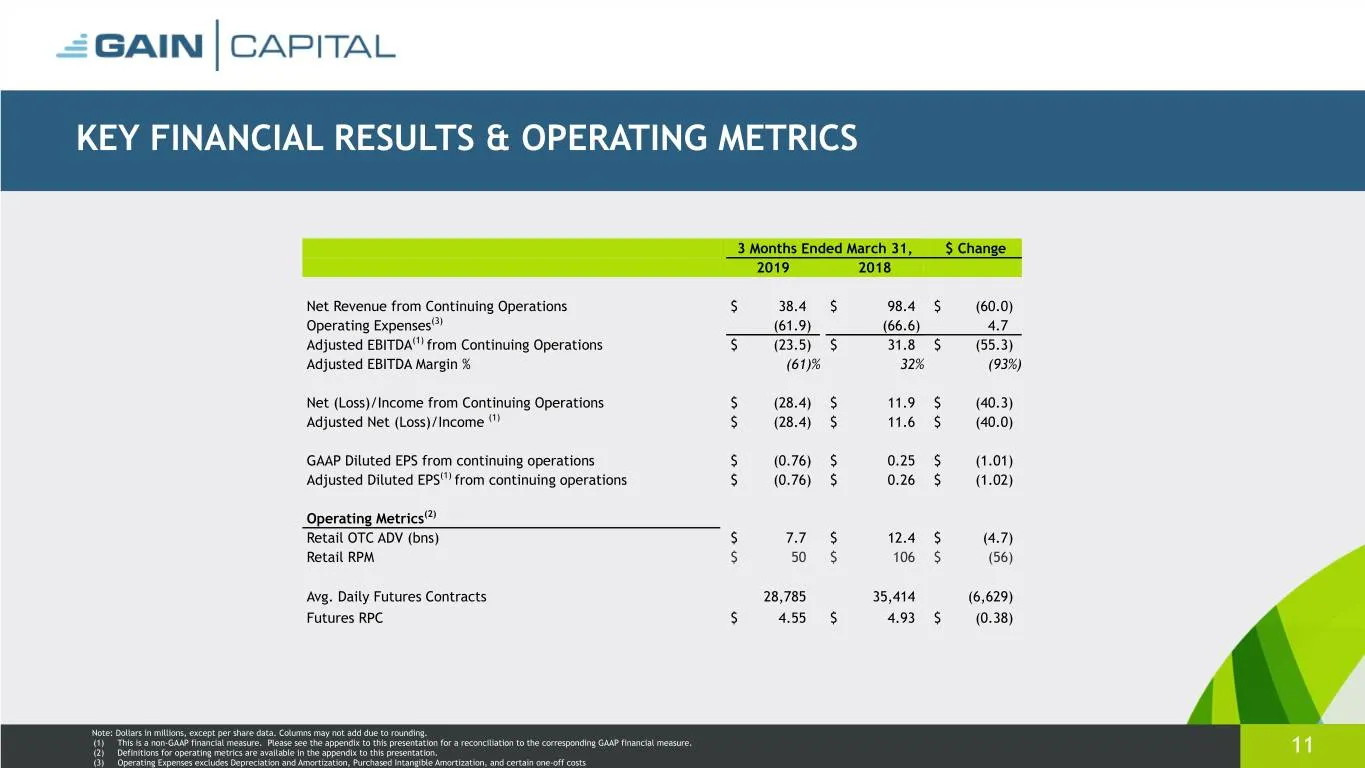
KEY FINANCIAL RESULTS & OPERATING METRICS 3 Months Ended March 31, $ Change 2019 2018 Net Revenue from Continuing Operations $ 38.4 $ 98.4 $ (60.0) Operating Expenses(3) (61.9) (66.6) 4.7 Adjusted EBITDA(1) from Continuing Operations $ (23.5) $ 31.8 $ (55.3) Adjusted EBITDA Margin % (61)% 32% (93%)
Slide 12: Operating Segment Results: Retail
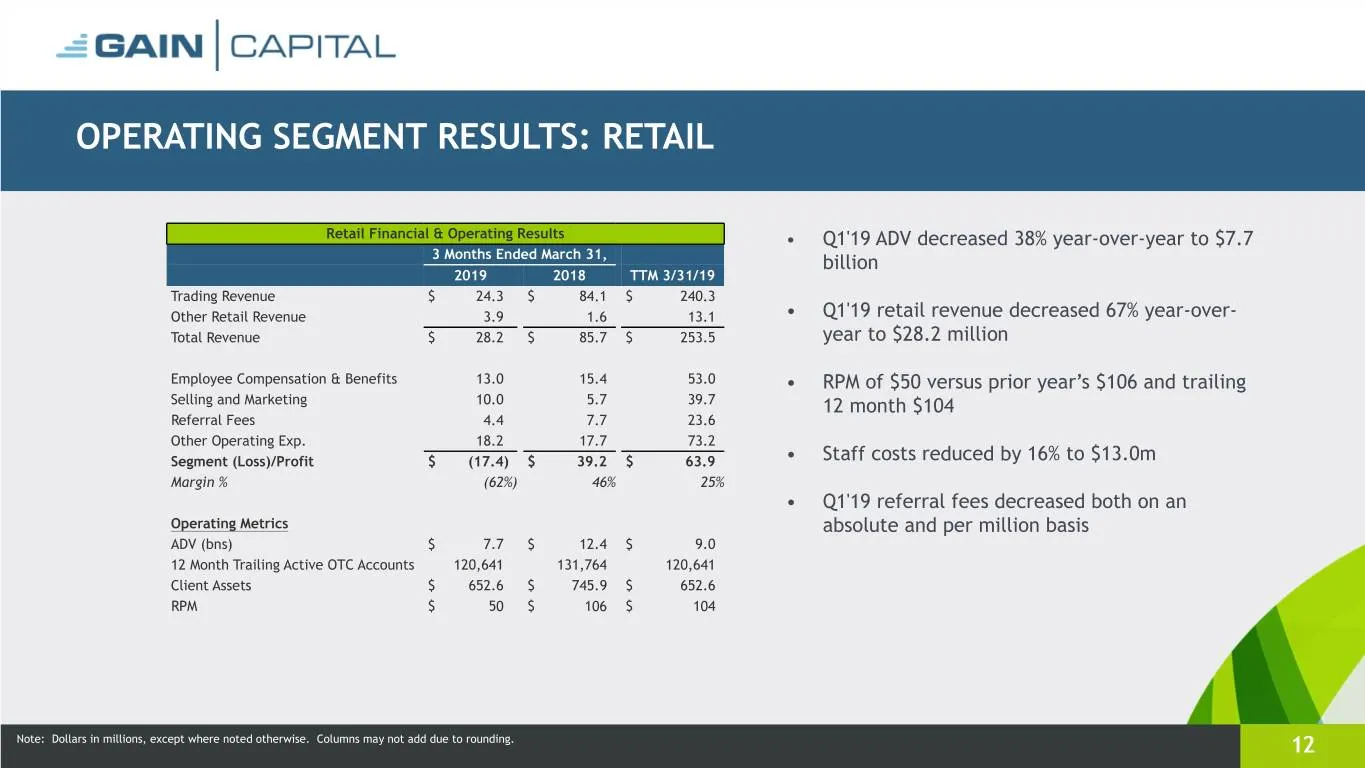
OPERATING SEGMENT RESULTS: RETAIL Retail Financial & Operating Results • Q1'19 ADV decreased 38% year-over-year to $7.7 3 Months Ended March 31, billion 2019 2018 TTM 3/31/19 Trading Revenue $ 24.3 $ 84.1 $ 240.3 Other Retail Revenue 3.9 1.6 13.1 • Q1'19 retail revenue decreased 67% year-over- Total
Slide 13: Operating Segment Results: Futures
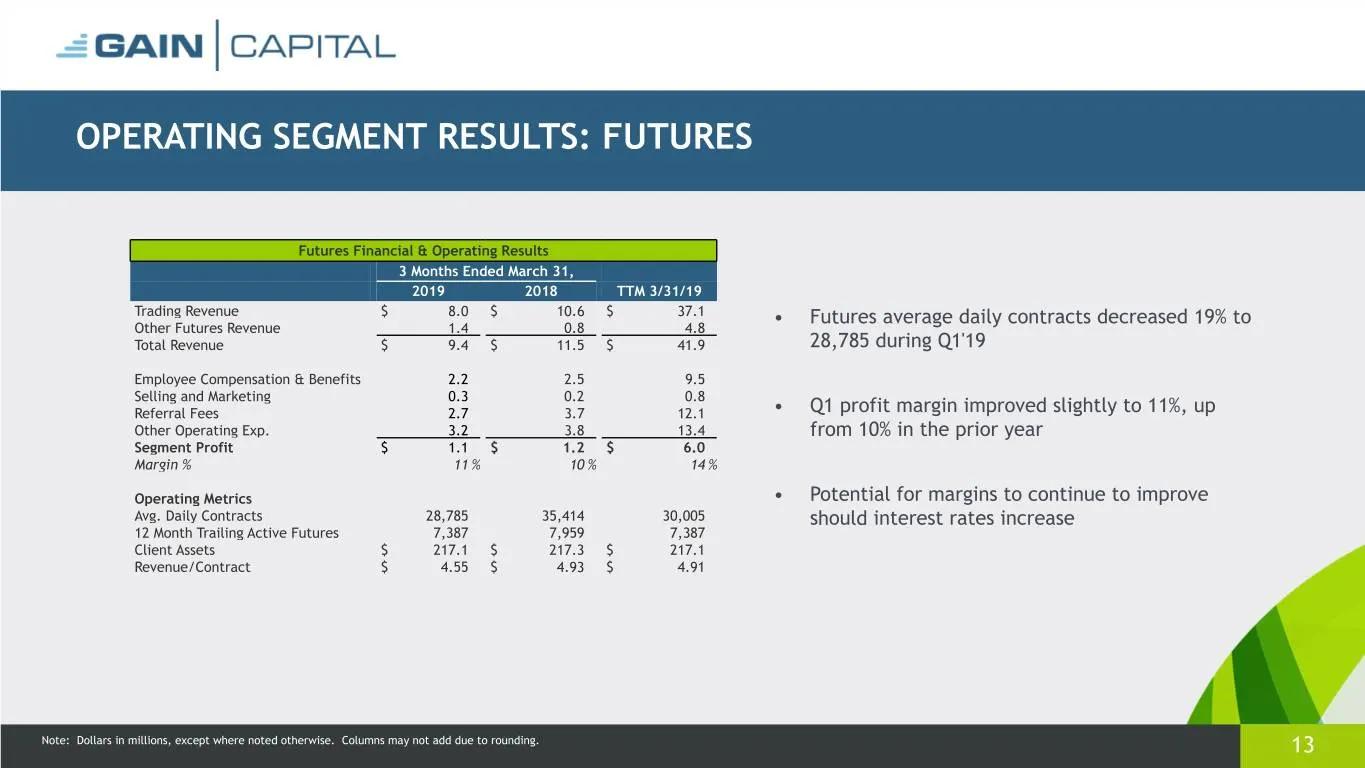
OPERATING SEGMENT RESULTS: FUTURES Futures Financial & Operating Results 3 Months Ended March 31, 2019 2018 TTM 3/31/19 Trading Revenue $ 8.0 $ 10.6 $ 37.1 • Futures average daily contracts decreased 19% to Other Futures Revenue 1.4 0.8 4.8 Total Revenue $ 9.4 $ 11.5 $ 41.9 28,785 during Q1'19 Emplo
Slide 14: Strong Liquidity Position
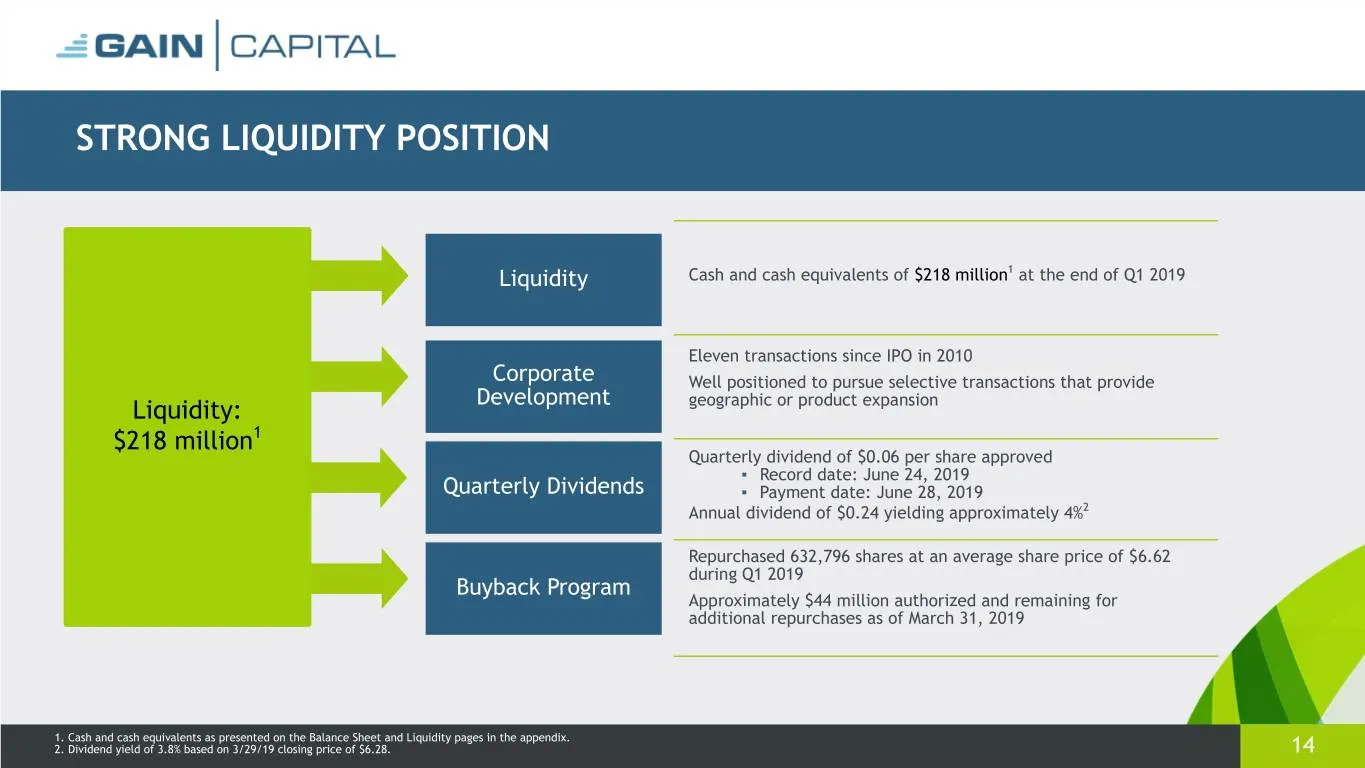
STRONG LIQUIDITY POSITION Liquidity Cash and cash equivalents of $218 million1 at the end of Q1 2019 Eleven transactions since IPO in 2010 Corporate Well positioned to pursue selective transactions that provide Development geographic or product expansion Liquidity: $218 million1 Quarterly dividend o
Slide 15: Positioned to Deliver Long-Term Value
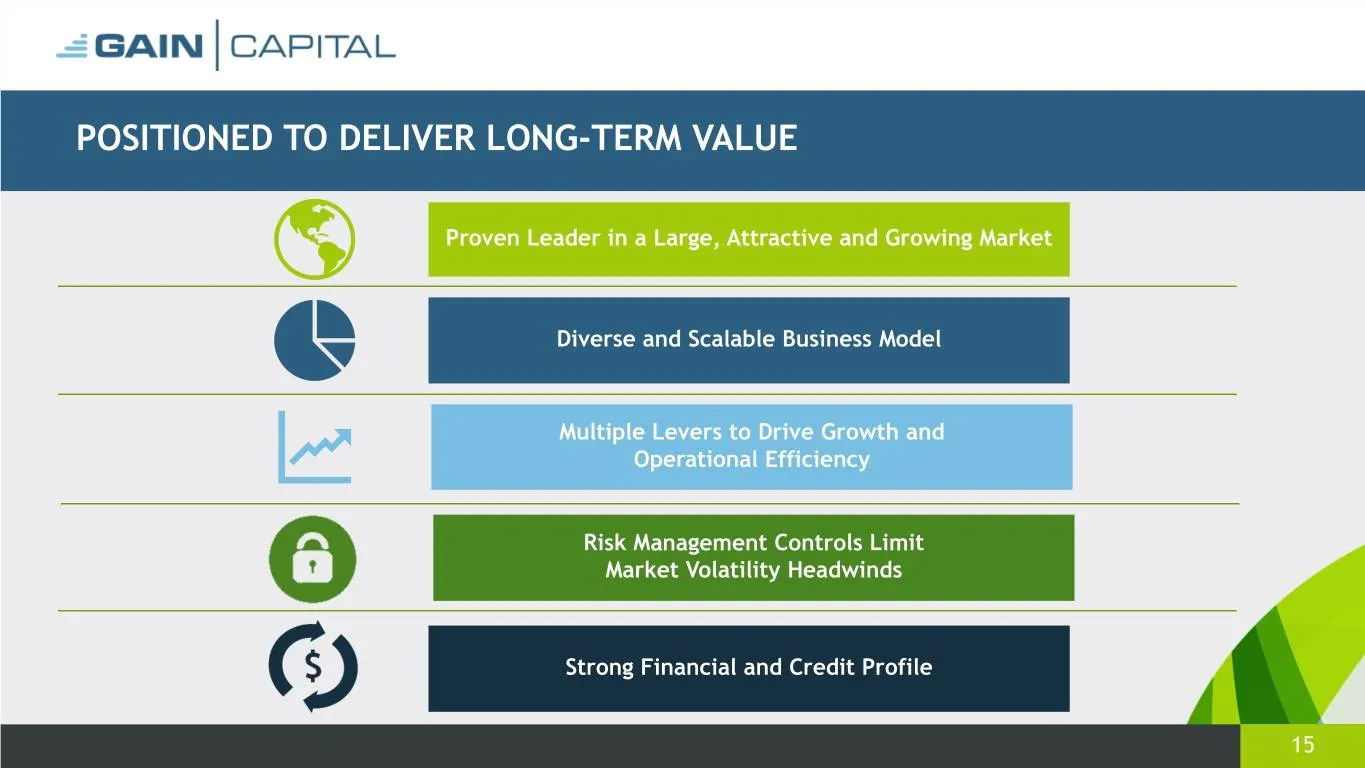
POSITIONED TO DELIVER LONG-TERM VALUE Proven Leader in a Large, Attractive and Growing Market Diverse and Scalable Business Model Multiple Levers to Drive Growth and Operational Efficiency Risk Management Controls Limit Market Volatility Headwinds Strong Financial and Credit Profile 15
Slide 16: Appendix
GAIN | CAPITAL Appendix
Slide 17: Condensed Consolidated Statement of Operations
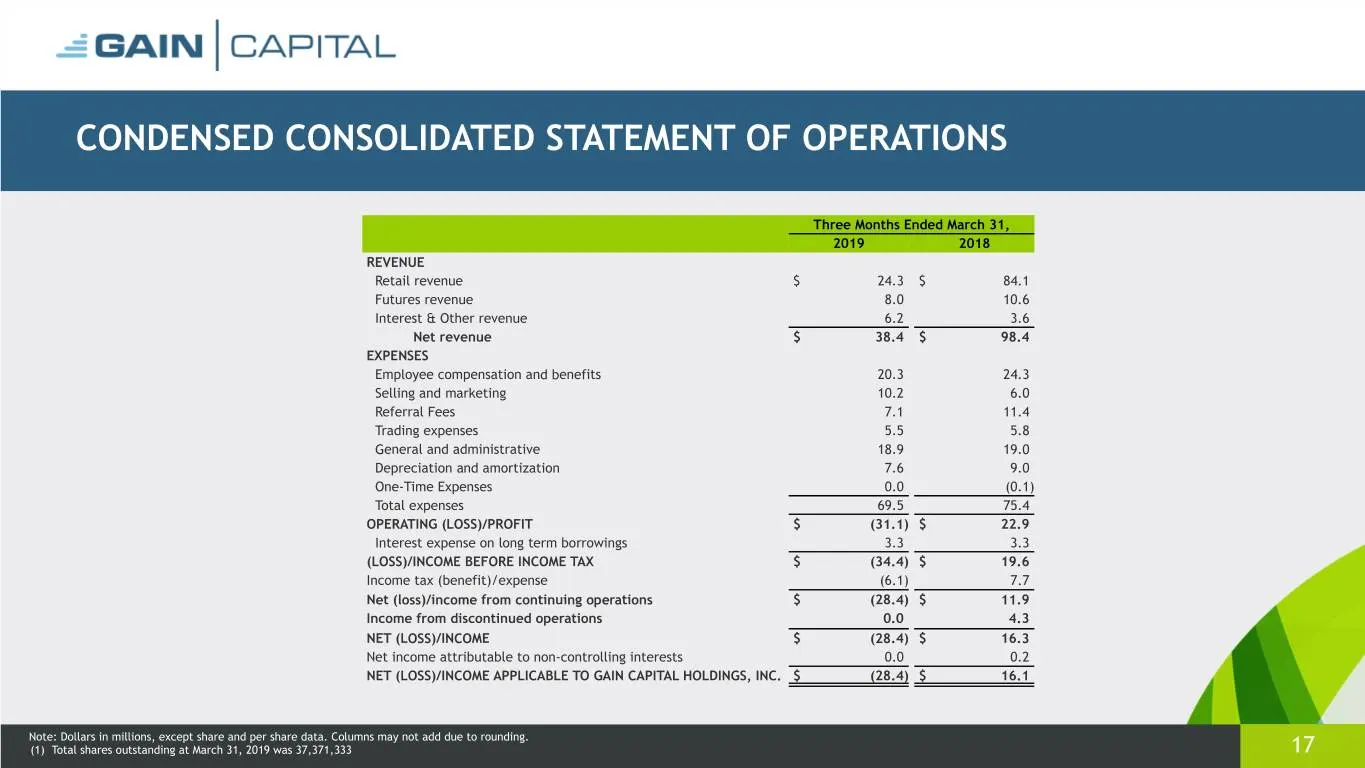
CONDENSED CONSOLIDATED STATEMENT OF OPERATIONS Three Months Ended March 31, 2019 2018 REVENUE Retail revenue $ 24.3 $ 84.1 Futures revenue 8.0 10.6 Interest & Other revenue 6.2 3.6 Net revenue $ 38.4 $ 98.4 EXPENSES Employee compensation and benefits 20.3 24.3 Selling and marketing 10.2 6.0 Referral
Slide 18: Condensed Consolidated Balance Sheet
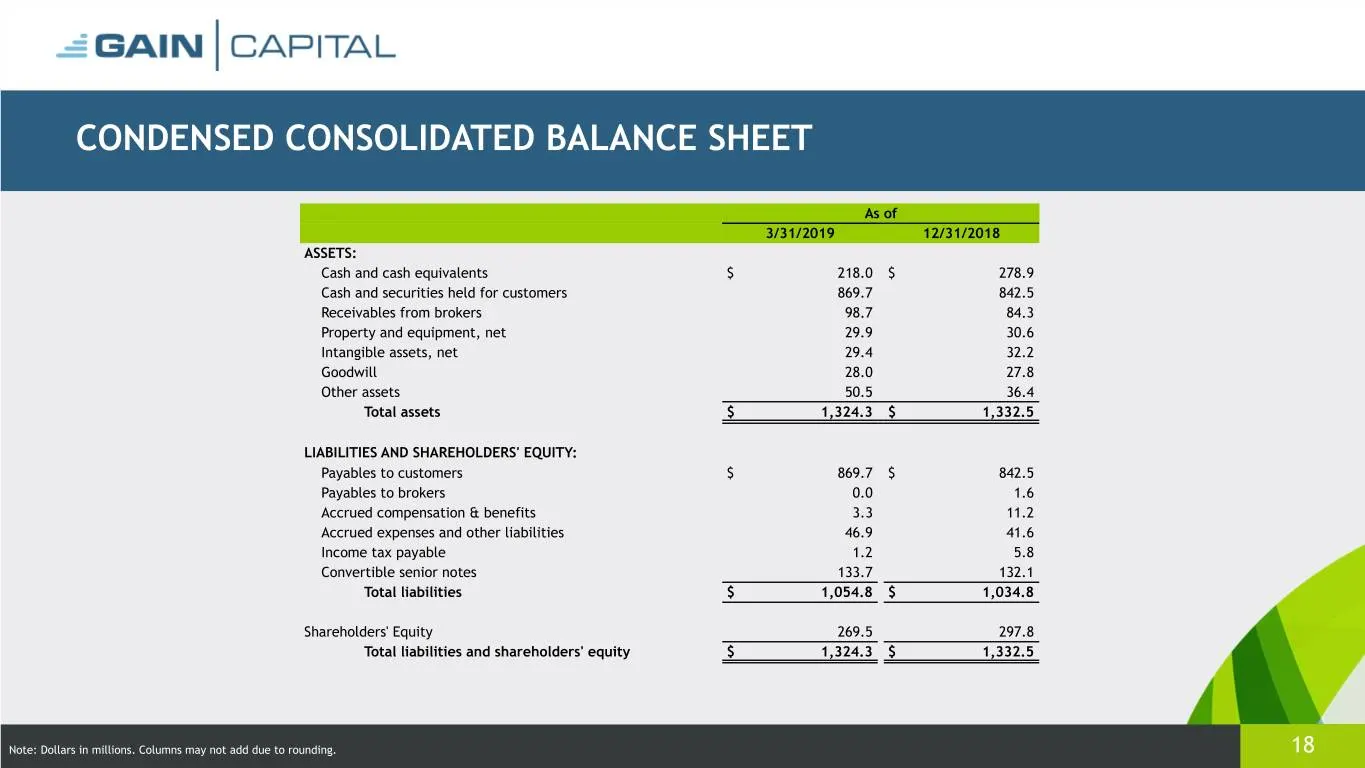
CONDENSED CONSOLIDATED BALANCE SHEET As of 3/31/2019 12/31/2018 ASSETS: Cash and cash equivalents $ 218.0 $ 278.9 Cash and securities held for customers 869.7 842.5 Receivables from brokers 98.7 84.3 Property and equipment, net 29.9 30.6 Intangible assets, net 29.4 32.2 Goodwill 28.0 27.8 Other asse
Slide 19: Liquidity
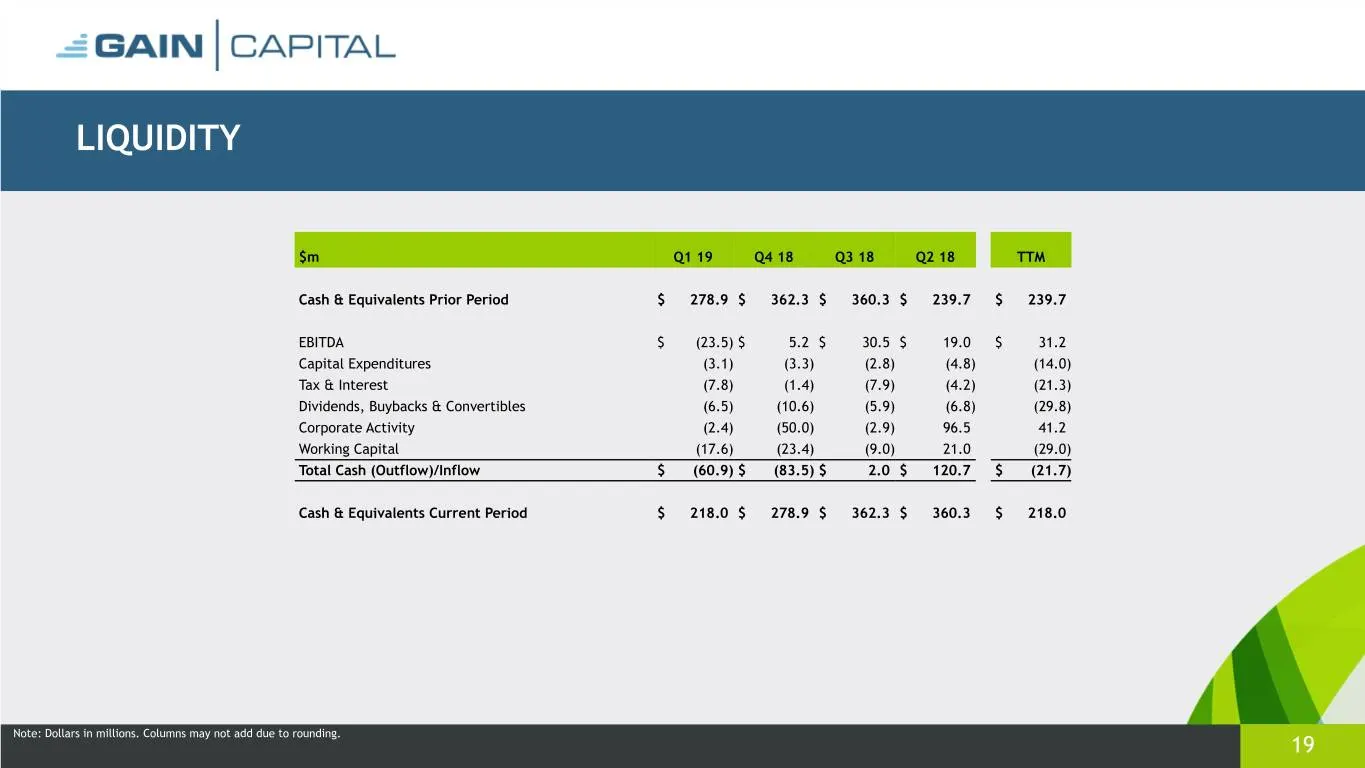
LIQUIDITY $m Q1 19 Q4 18 Q3 18 Q2 18 TTM Cash & Equivalents Prior Period $ 278.9 $ 362.3 $ 360.3 $ 239.7 $ 239.7 EBITDA $ (23.5) $ 5.2 $ 30.5 $ 19.0 $ 31.2 Capital Expenditures (3.1) (3.3) (2.8) (4.8) (14.0) Tax & Interest (7.8) (1.4) (7.9) (4.2) (21.3) Dividends, Buybacks & Convertibles (6.5) (10.6
Slide 20: Group Adjusted EBITDA
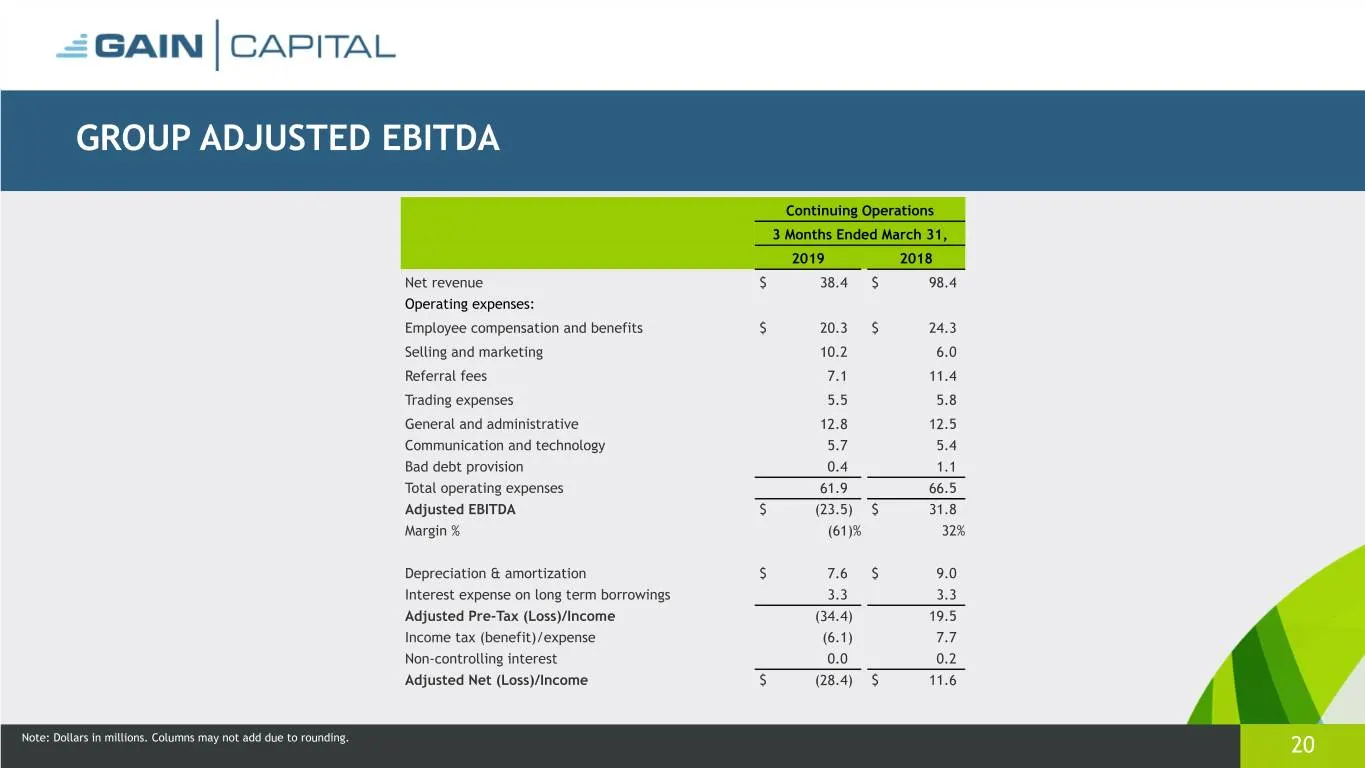
GROUP ADJUSTED EBITDA Continuing Operations 3 Months Ended March 31, 2019 2018 Net revenue $ 38.4 $ 98.4 Operating expenses: Employee compensation and benefits $ 20.3 $ 24.3 Selling and marketing 10.2 6.0 Referral fees 7.1 11.4 Trading expenses 5.5 5.8 General and administrative 12.8 12.5 Communicat
Slide 21: Adjusted EBITDA & Margin Reconciliation
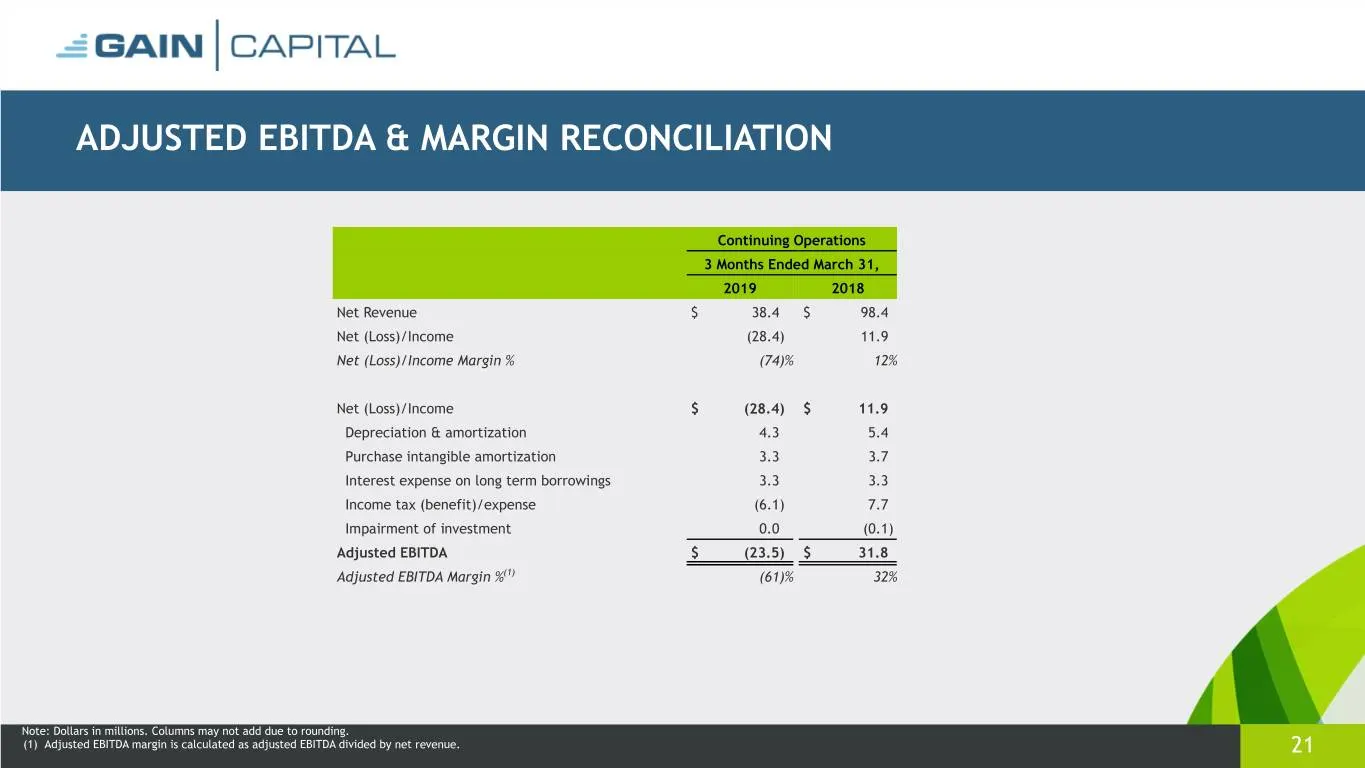
ADJUSTED EBITDA & MARGIN RECONCILIATION Continuing Operations 3 Months Ended March 31, 2019 2018 Net Revenue $ 38.4 $ 98.4 Net (Loss)/Income (28.4) 11.9 Net (Loss)/Income Margin % (74)% 12% Net (Loss)/Income $ (28.4) $ 11.9 Depreciation & amortization 4.3 5.4 Purchase intangible amortization 3.3 3.7
Slide 22: Adjusted Net Income and EPS Reconciliation
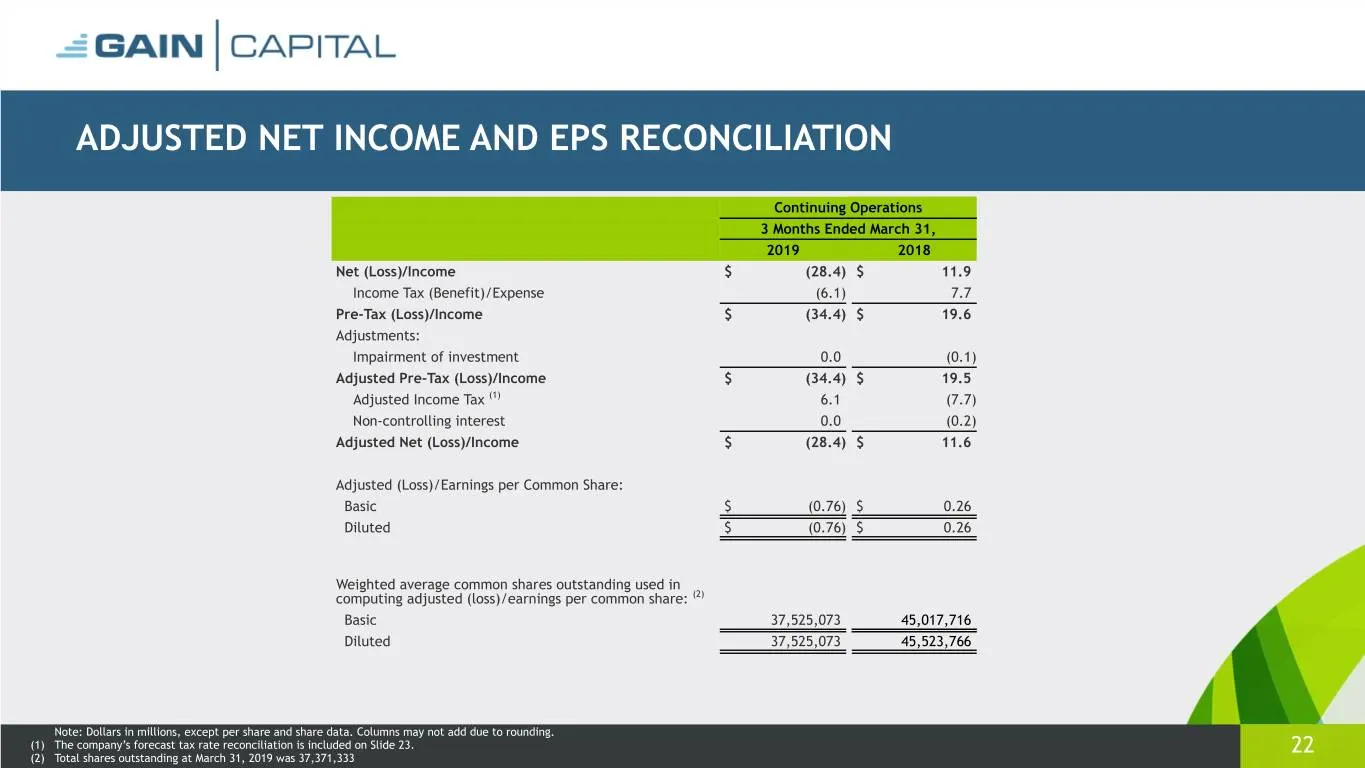
ADJUSTED NET INCOME AND EPS RECONCILIATION Continuing Operations 3 Months Ended March 31, 2019 2018 Net (Loss)/Income $ (28.4) $ 11.9 Income Tax (Benefit)/Expense (6.1) 7.7 Pre-Tax (Loss)/Income $ (34.4) $ 19.6 Adjustments: Impairment of investment 0.0 (0.1) Adjusted Pre-Tax (Loss)/Income $ (34.4) $
Slide 23: Adjusted Income Tax Benefit/(Expense) Reconciliation
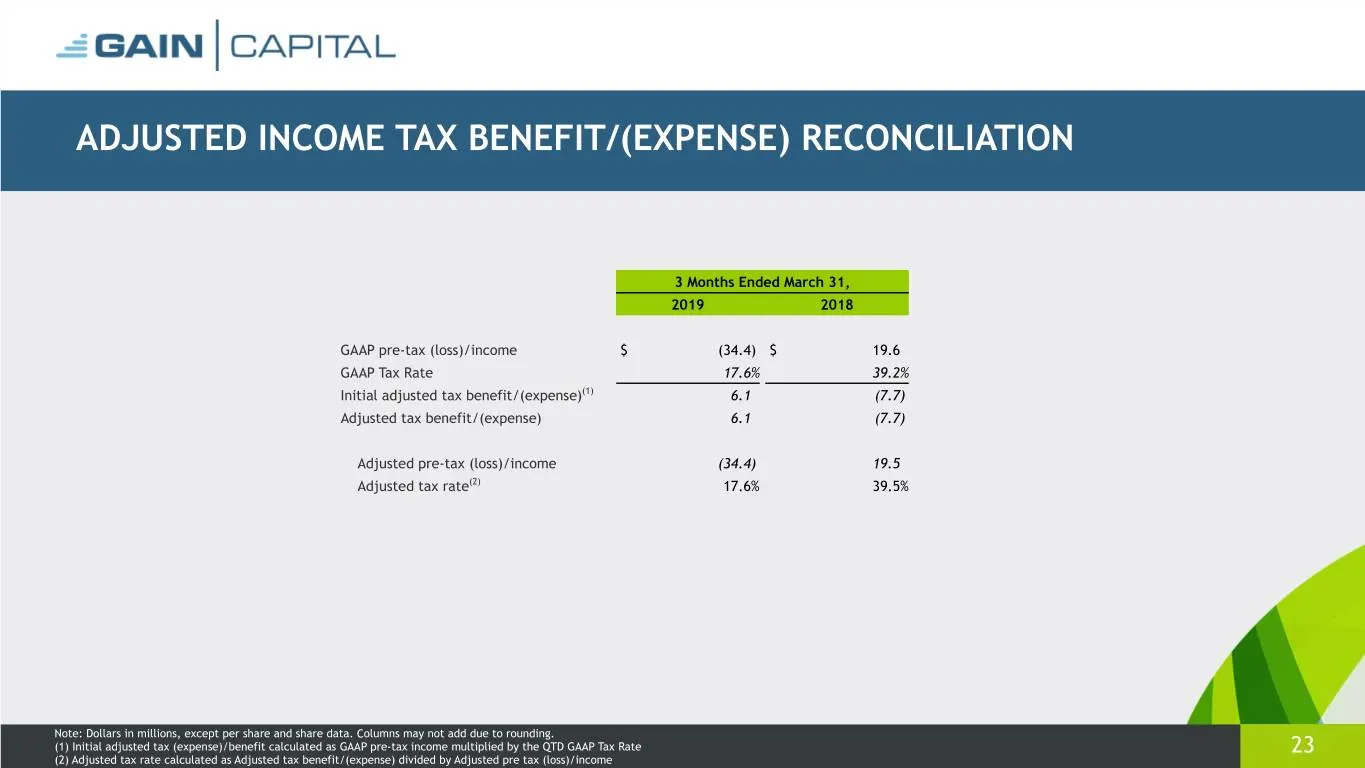
ADJUSTED INCOME TAX BENEFIT/(EXPENSE) RECONCILIATION 3 Months Ended March 31, 2019 2018 GAAP pre-tax (loss)/income $ (34.4) $ 19.6 GAAP Tax Rate 17.6% 39.2% Initial adjusted tax benefit/(expense)(1) 6.1 (7.7) Adjusted tax benefit/(expense) 6.1 (7.7) Adjusted pre-tax (loss)/income (34.4) 19.5 Adjuste
Slide 24: EPS Computation
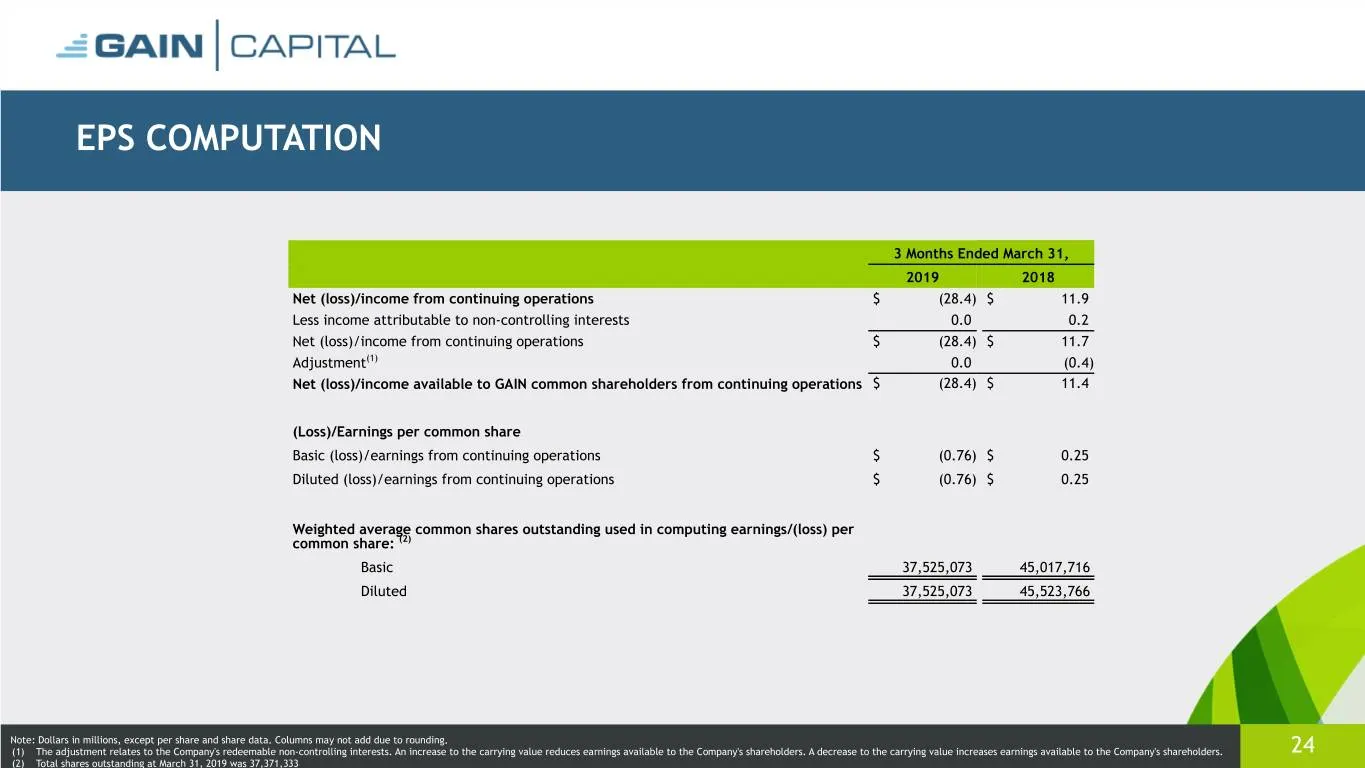
EPS COMPUTATION 3 Months Ended March 31, 2019 2018 Net (loss)/income from continuing operations $ (28.4) $ 11.9 Less income attributable to non-controlling interests 0.0 0.2 Net (loss)/income from continuing operations $ (28.4) $ 11.7 Adjustment(1) 0.0 (0.4) Net (loss)/income available to GAIN commo
Slide 25: Reconciliation of Segment Profit to Income Before Income Tax Expense
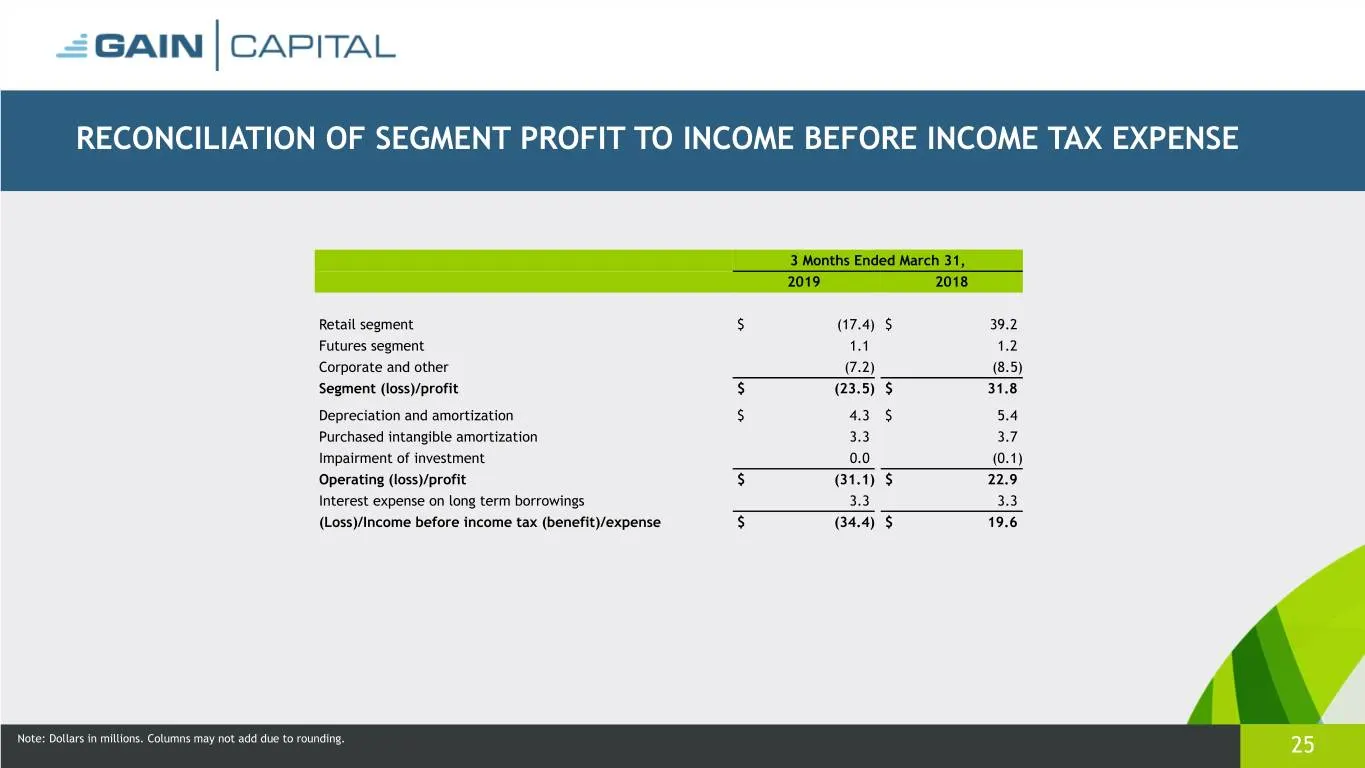
RECONCILIATION OF SEGMENT PROFIT TO INCOME BEFORE INCOME TAX EXPENSE 3 Months Ended March 31, 2019 2018 Retail segment $ (17.4) $ 39.2 Futures segment 1.1 1.2 Corporate and other (7.2) (8.5) Segment (loss)/profit $ (23.5) $ 31.8 Depreciation and amortization $ 4.3 $ 5.4 Purchased intangible amortiza
Slide 26: Pro Forma Reconciliation Q1 2018
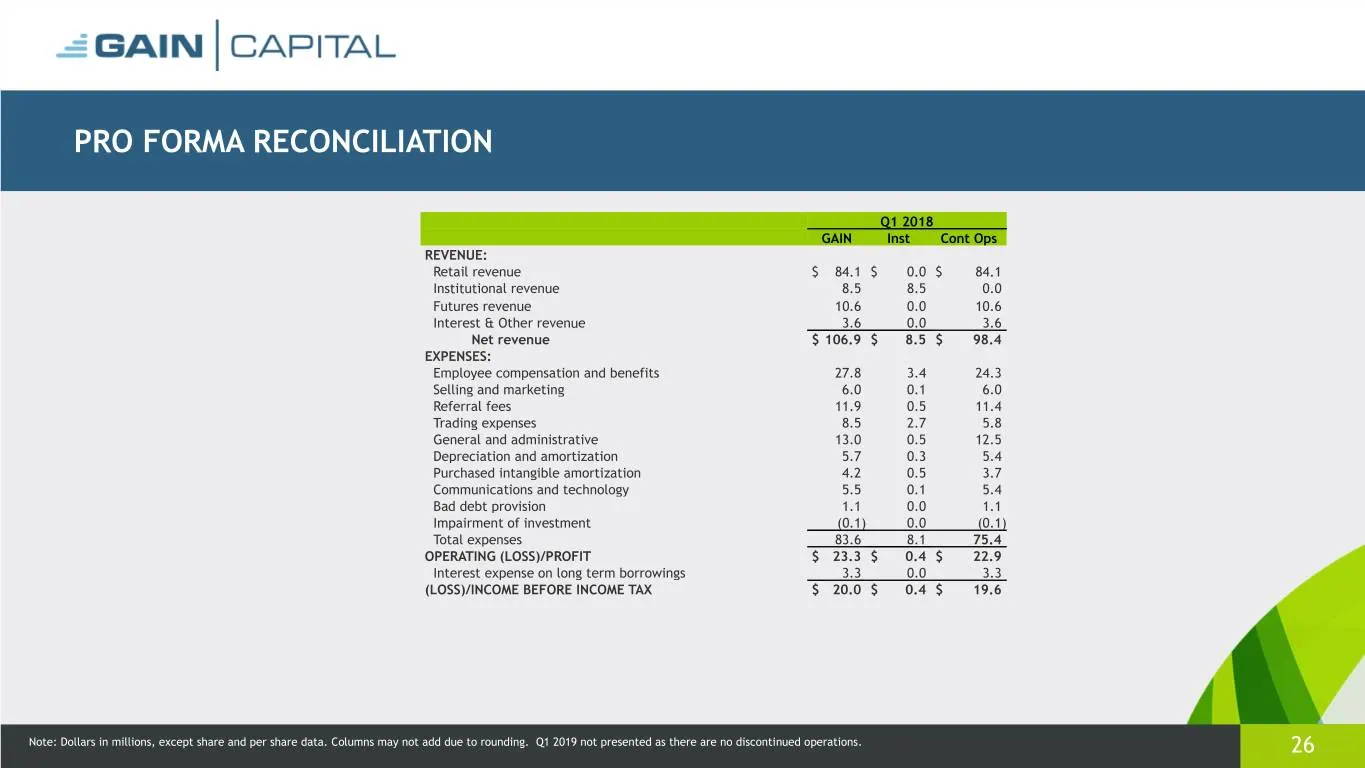
PRO FORMA RECONCILIATION Q1 2018 GAIN Inst Cont Ops REVENUE: Retail revenue $ 84.1 $ 0.0 $ 84.1 Institutional revenue 8.5 8.5 0.0 Futures revenue 10.6 0.0 10.6 Interest & Other revenue 3.6 0.0 3.6 Net revenue $ 106.9 $ 8.5 $ 98.4 EXPENSES: Employee compensation and benefits 27.8 3.4 24.3 Selling and
Slide 27: Discontinued Operations
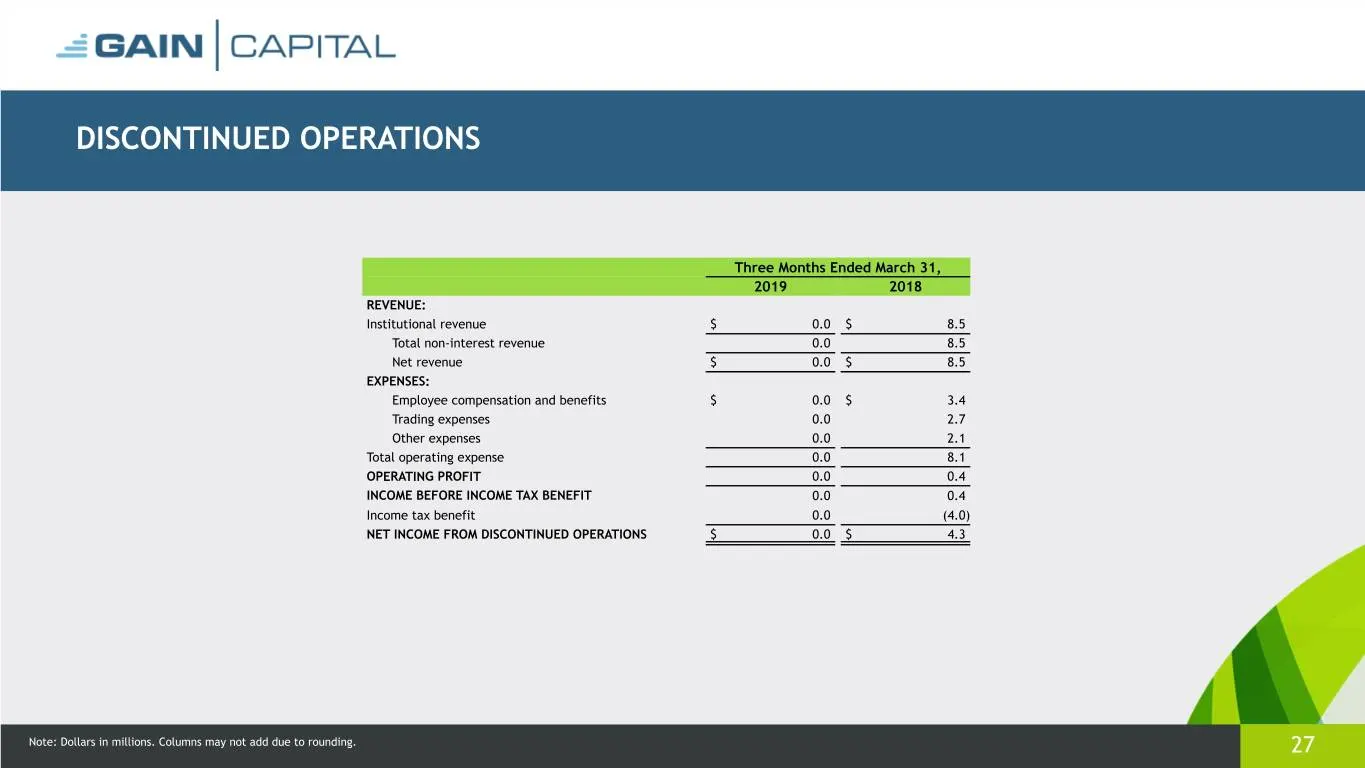
DISCONTINUED OPERATIONS Three Months Ended March 31, 2019 2018 REVENUE: Institutional revenue $ 0.0 $ 8.5 Total non-interest revenue 0.0 8.5 Net revenue $ 0.0 $ 8.5 EXPENSES: Employee compensation and benefits $ 0.0 $ 3.4 Trading expenses 0.0 2.7 Other expenses 0.0 2.1 Total operating expense 0.0 8.
Slide 28: Retail Revenue Per Million
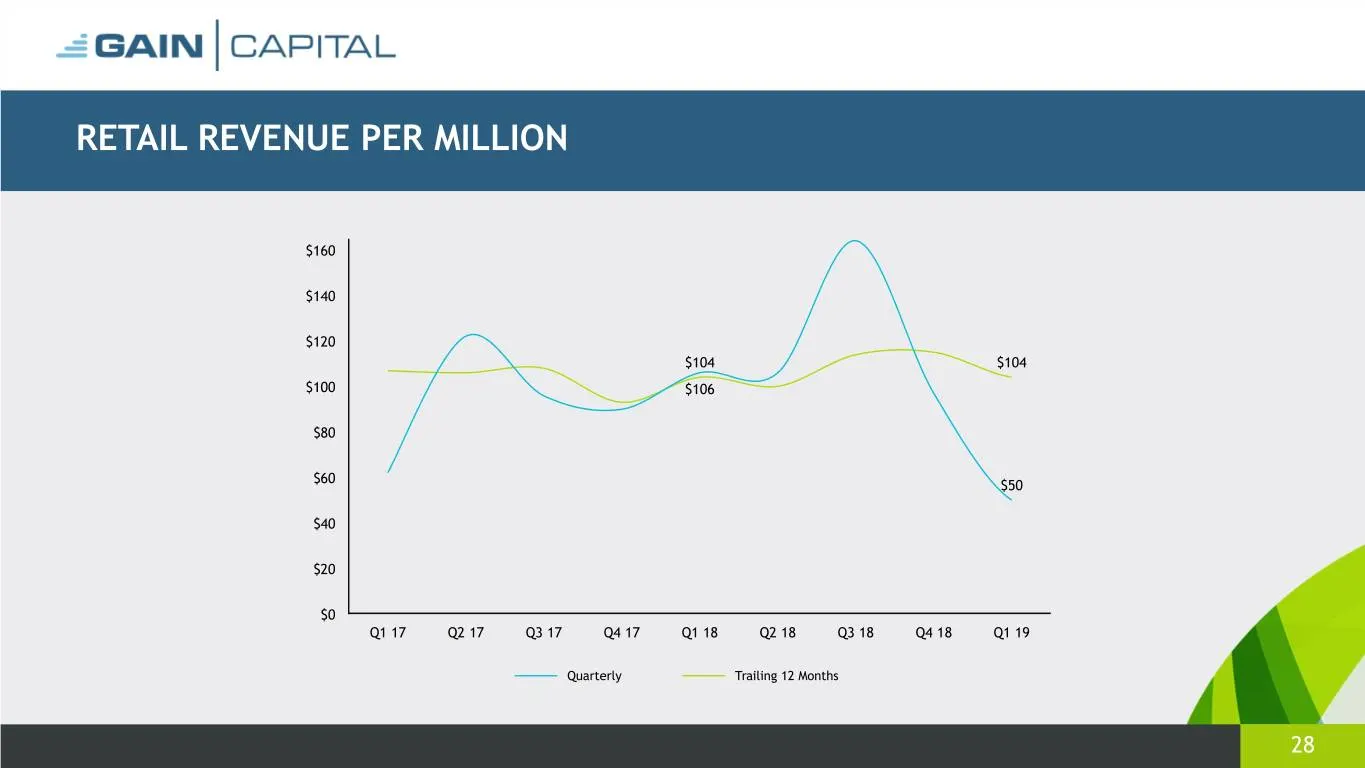
RETAIL REVENUE PER MILLION $160 $140 $120 $104 $104 $100 $106 $80 $60 $50 $40 $20 $0 Q1 17 Q2 17 Q3 17 Q4 17 Q1 18 Q2 18 Q3 18 Q4 18 Q1 19 Quarterly Trailing 12 Months 28
Slide 29: Operating Segment Results: Corporate & Other
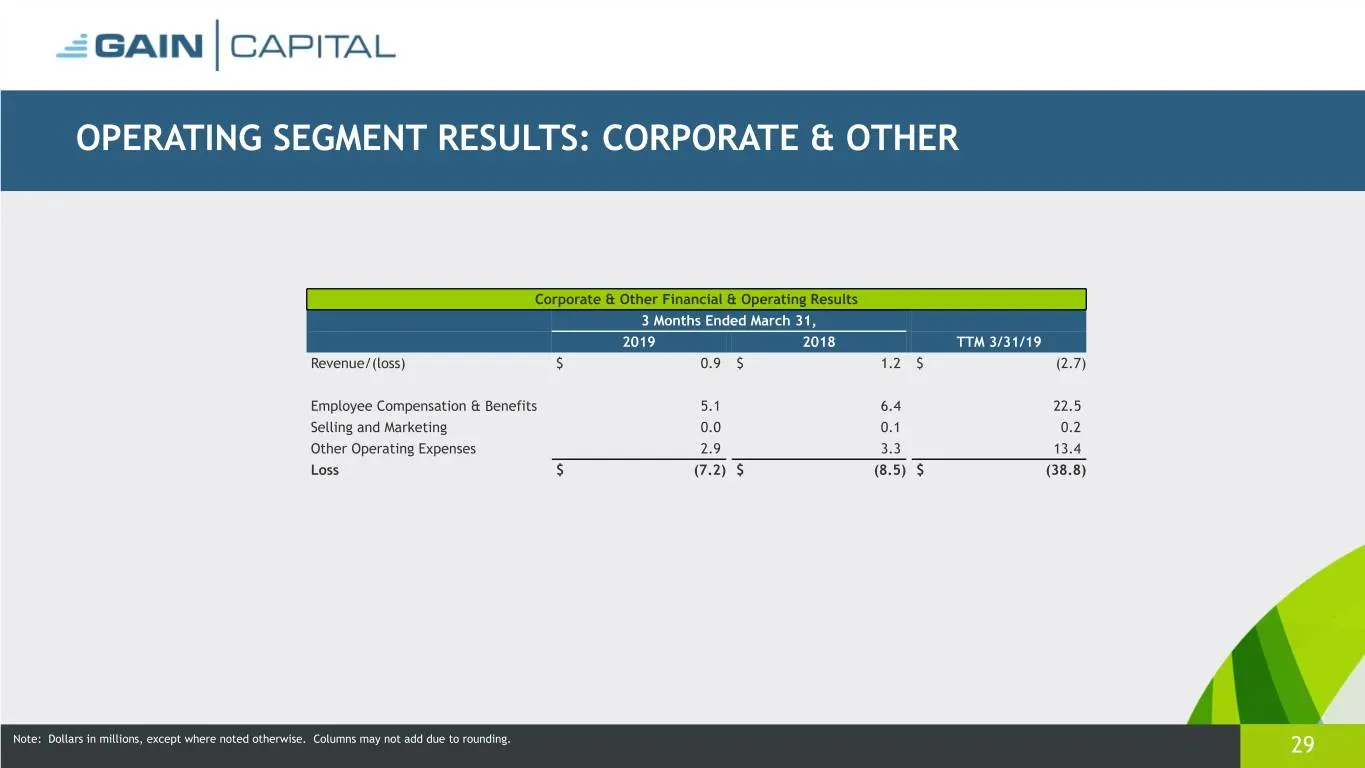
OPERATING SEGMENT RESULTS: CORPORATE & OTHER Corporate & Other Financial & Operating Results 3 Months Ended March 31, 2019 2018 TTM 3/31/19 Revenue/(loss) $ 0.9 $ 1.2 $ (2.7) Employee Compensation & Benefits 5.1 6.4 22.5 Selling and Marketing 0.0 0.1 0.2 Other Operating Expenses 2.9 3.3 13.4 Loss $
Slide 30: Quarterly Operating Metrics
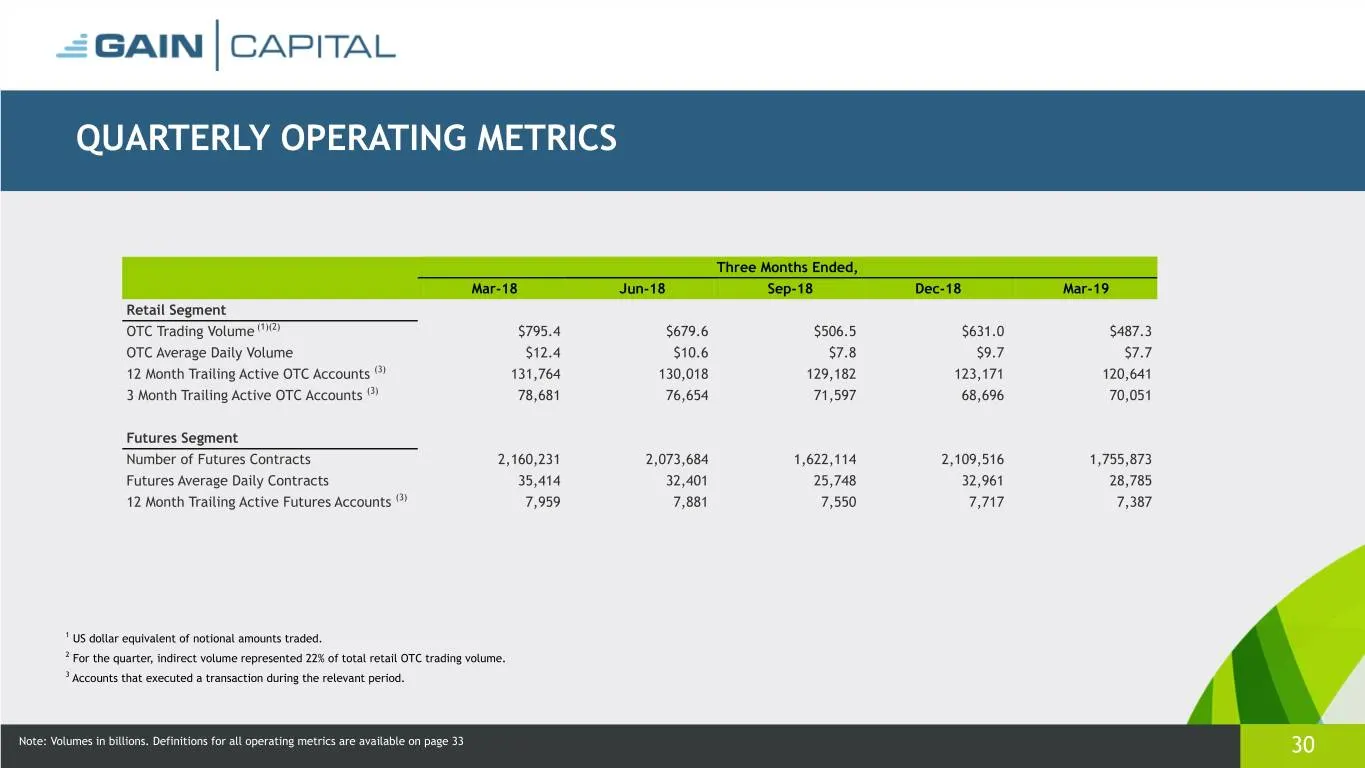
QUARTERLY OPERATING METRICS Three Months Ended, Mar-18 Jun-18 Sep-18 Dec-18 Mar-19 Retail Segment OTC Trading Volume (1)(2) $795.4 $679.6 $506.5 $631.0 $487.3 OTC Average Daily Volume $12.4 $10.6 $7.8 $9.7 $7.7 12 Month Trailing Active OTC Accounts (3) 131,764 130,018 129,182 123,171 120,641 3 Month
Slide 31: Operating Metrics
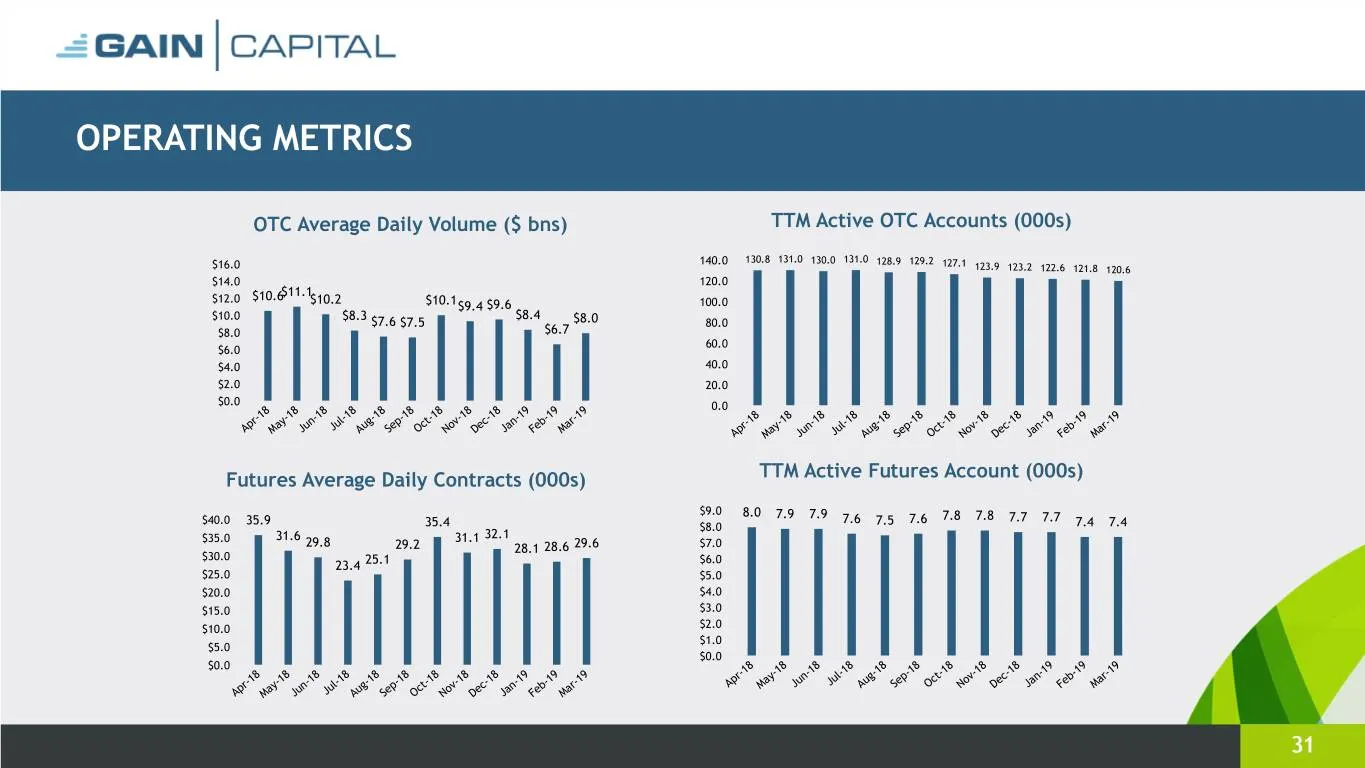
OPERATING METRICS OTC Average Daily Volume ($ bns) TTM Active OTC Accounts (000s) 140.0 130.8 131.0 130.0 131.0 128.9 129.2 127.1 $16.0 123.9 123.2 122.6 121.8 120.6 $14.0 120.0 $11.1 $12.0 $10.6 $10.2 $10.1$9.4 $9.6 100.0 $10.0 $8.3 $8.4 $7.6 $7.5 $8.0 80.0 $8.0 $6.7 60.0 $6.0 $4.0 40.0 $2.0 20.0 $
Slide 32: Definition of Metrics
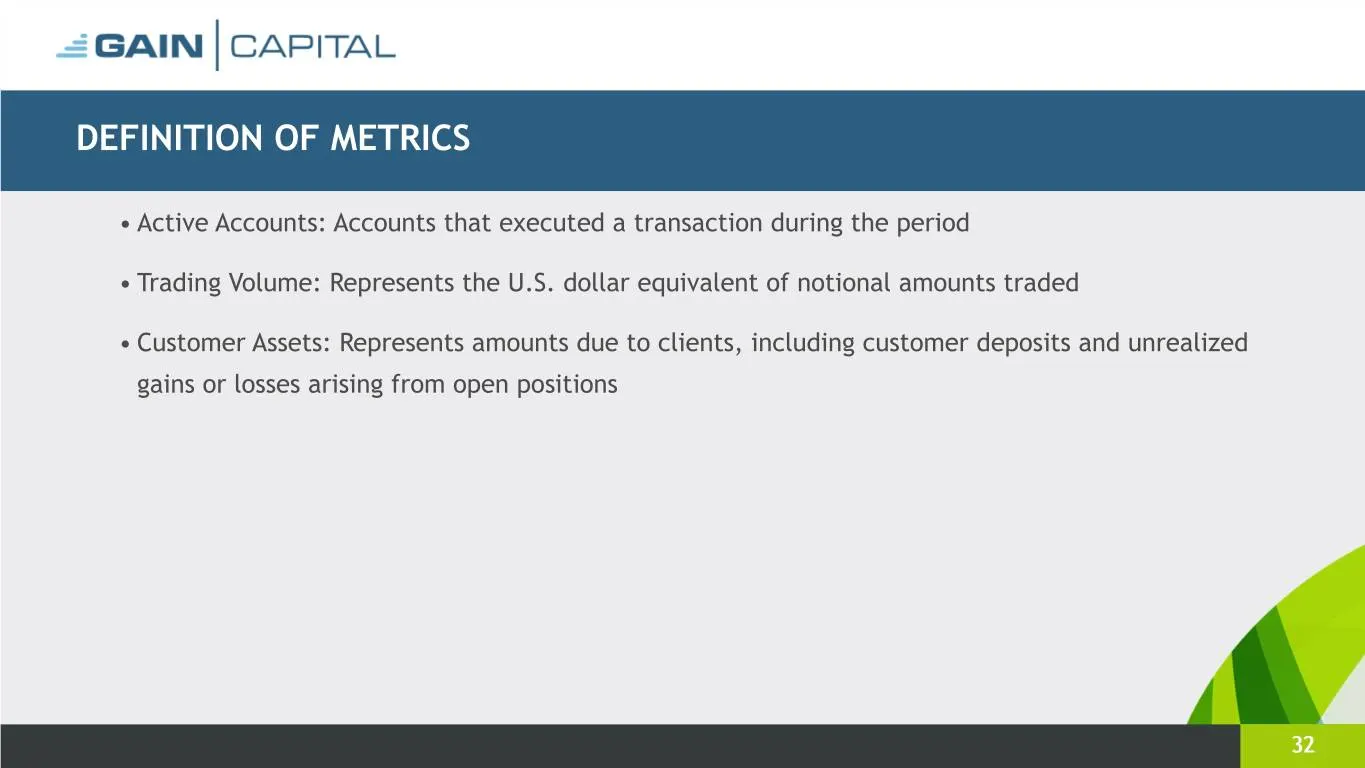
DEFINITION OF METRICS • Active Accounts: Accounts that executed a transaction during the period • Trading Volume: Represents the U.S. dollar equivalent of notional amounts traded • Customer Assets: Represents amounts due to clients, including customer deposits and unrealized gains or losses arising
Source: SEC EDGAR · 8-K filed Apr 25, 2019
More decks from GAIN Capital Holdings Inc
 Q2 2020 Earnings Presentation24 slides · Jul 23, 2020
 Merger or Acquisition (May 2020)10 slides · May 15, 2020
 Q1 2020 Earnings Presentation25 slides · Apr 23, 2020
 FY2019 Earnings Presentation35 slides · Feb 27, 2020
 Q3 2019 Earnings Presentation32 slides · Oct 25, 2019
 Q2 2019 Earnings Presentation33 slides · Jul 25, 2019