Spirit Realty Capital — Q2 2022 Earnings Presentation
41 slides from Spirit Realty Capital's earnings presentation, Aug 3, 2022
Slide 1: Q2 2022 Investor Presentation
Q2 2022 Investor Presentation August 2022 Exhibit 99.3
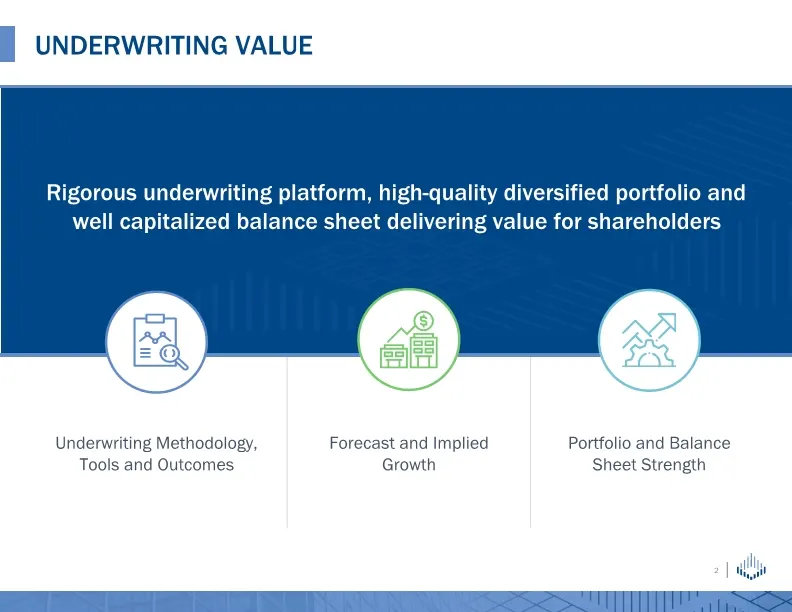
Slide 2: Underwriting value, forecast and portfolio and balance sheet strength
Underwriting value Forecast and Implied Growth Portfolio and Balance Sheet Strength Rigorous underwriting platform, high-quality diversified portfolio and well capitalized balance sheet delivering value for shareholders Underwriting Methodology, Tools and Outcomes
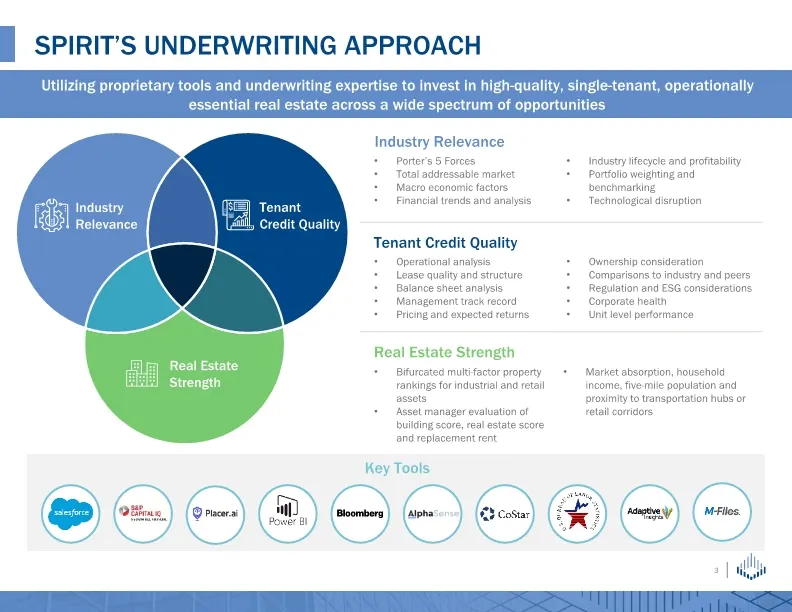
Slide 3: Spirit's underwriting approach
Spirit’s underwriting approach Utilizing proprietary tools and underwriting expertise to invest in high-quality, single-tenant, operationally essential real estate across a wide spectrum of opportunities Key Tools Porter’s 5 Forces Total addressable market Macro economic factors Financial trends and
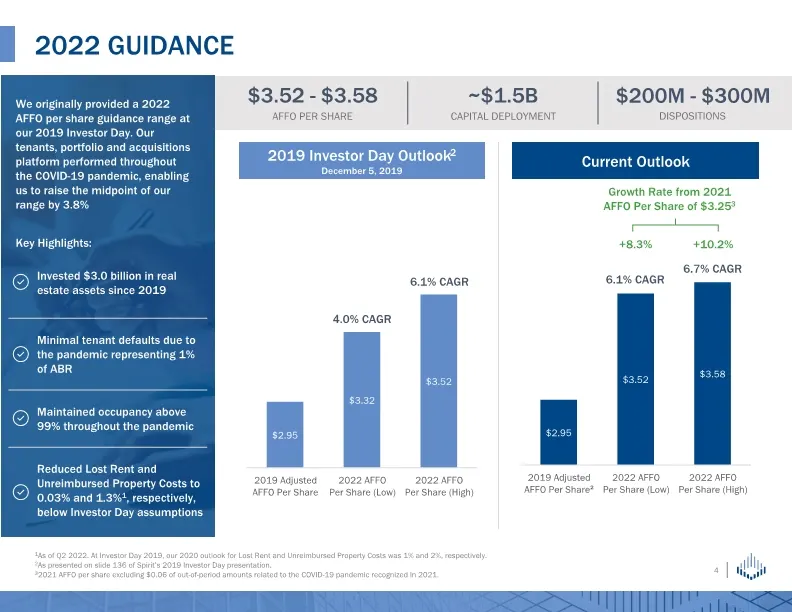
Slide 4: 2022 guidance
2022 guidance 1As of Q2 2022. At Investor Day 2019, our 2020 outlook for Lost Rent and Unreimbursed Property Costs was 1% and 2%, respectively. 2As presented on slide 136 of Spirit’s 2019 Investor Day presentation. 32021 AFFO per share excluding $0.06 of out-of-period amounts related to the COVID-19
Slide 5: Capital Deployment Highlights
Capital Deployment Highlights
Slide 6: Capital deployment performance
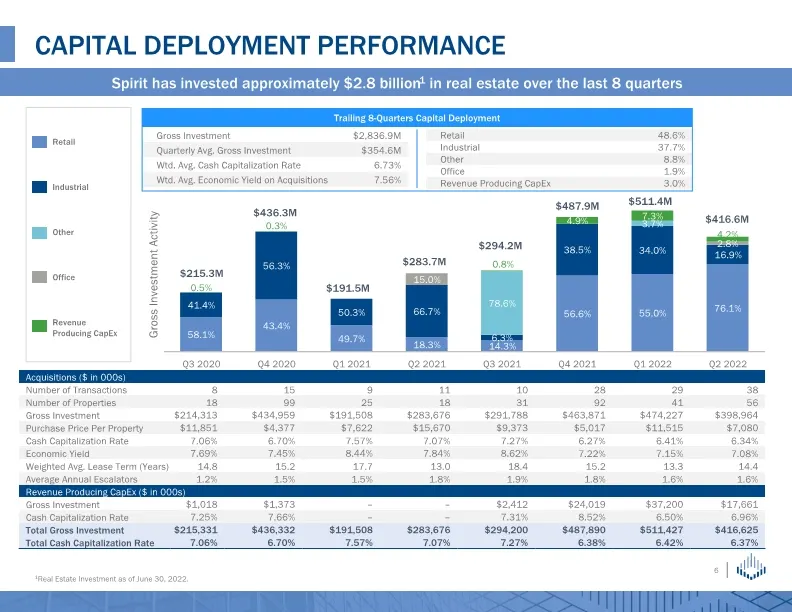
Capital deployment performance Gross Investment Activity Trailing 8-Quarters Capital Deployment Spirit has invested approximately $2.8 billion1 in real estate over the last 8 quarters 1Real Estate Investment as of June 30, 2022. $215.3M $436.3M $191.5M $283.7M $294.2M $487.9M $511.4M $416.6M
Slide 7: Trailing four-quarter acquisition industry breakdown
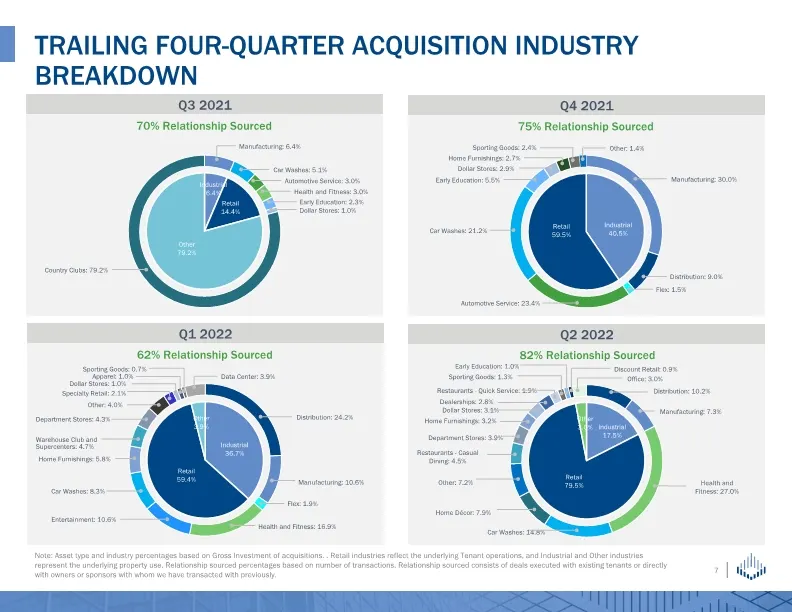
Trailing four-quarter acquisition industry breakdown Note: Asset type and industry percentages based on Gross Investment of acquisitions. . Retail industries reflect the underlying Tenant operations, and Industrial and Other industries represent the underlying property use. Relationship sourced perc
Slide 8: Disposition results
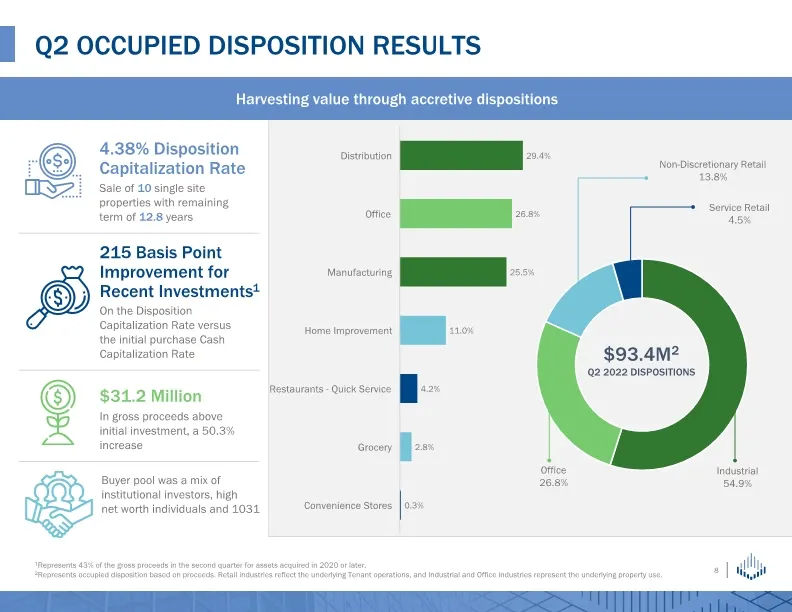
Q2 occupied Disposition results $93.4M2 Q2 2022 Dispositions Harvesting value through accretive dispositions 1Represents 43% of the gross proceeds in the second quarter for assets acquired in 2020 or later. 2Represents occupied disposition based on proceeds. Retail industries reflect the underlying
Slide 9: Industrial portfolio highlights
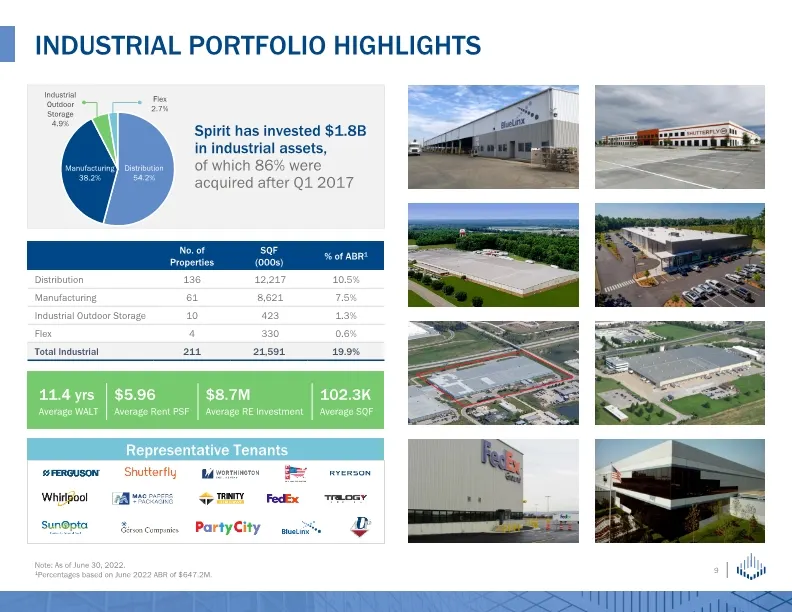
Industrial portfolio highlights Note: As of June 30, 2022. 1Percentages based on June 2022 ABR of $647.2M. Spirit has invested $1.8B in industrial assets, of which 86% were acquired after Q1 2017 Representative Tenants
Slide 10: Portfolio Evolution and Peer Comparisons
Portfolio Evolution and Peer Comparisons
Slide 11: Evolution of operating metrics
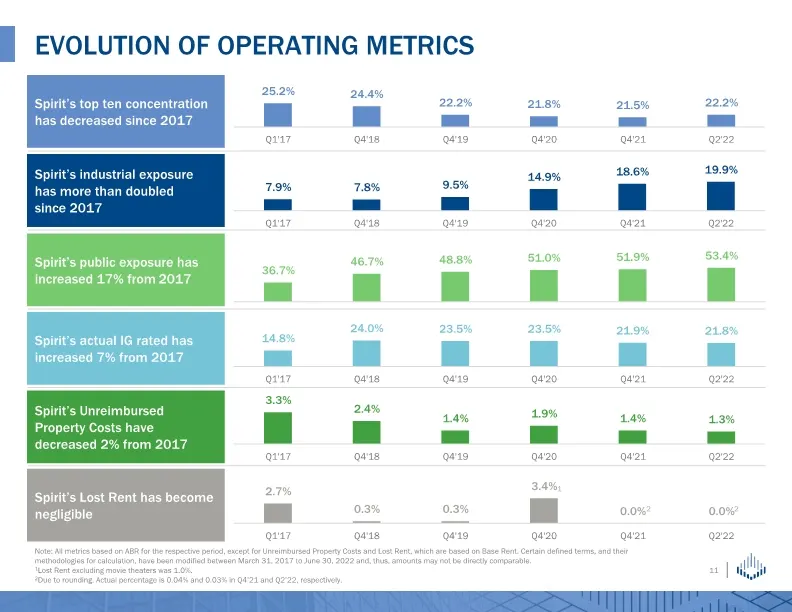
Evolution of operating metrics Note: All metrics based on ABR for the respective period, except for Unreimbursed Property Costs and Lost Rent, which are based on Base Rent. Certain defined terms, and their methodologies for calculation, have been modified between March 31, 2017 to June 30, 2022 and,
Slide 12: Evolution of Spirit's portfolio
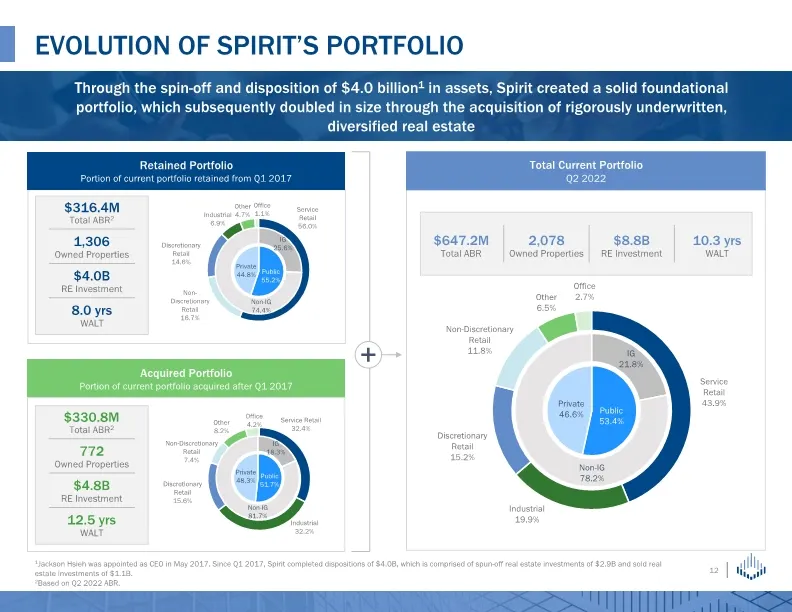
Evolution of spirit’s portfolio 1Jackson Hsieh was appointed as CEO in May 2017. Since Q1 2017, Spirit completed dispositions of $4.0B, which is comprised of spun-off real estate investments of $2.9B and sold real estate investments of $1.1B. 2Based on Q2 2022 ABR. $8.8B RE Investment 10.3 yrs WALT
Slide 13: Retained portfolio
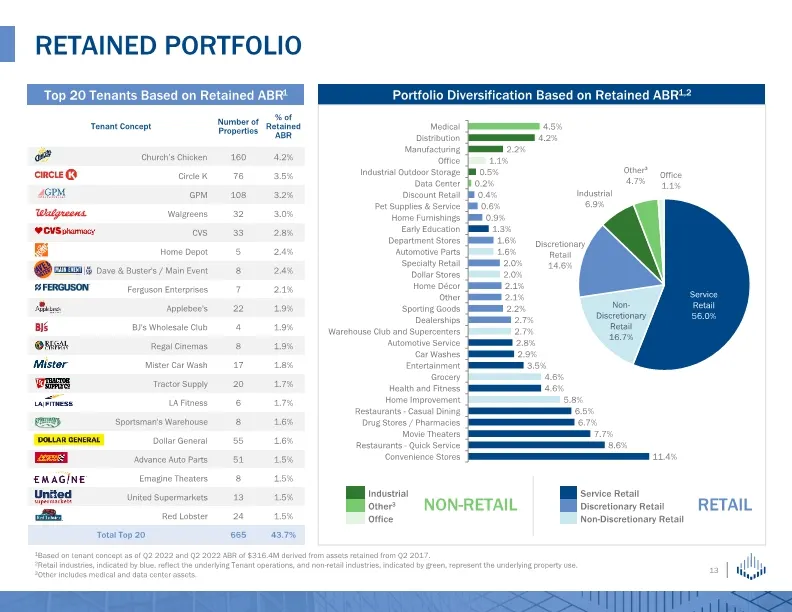
Retained portfolio Top 20 Tenants Based on Retained ABR1 Portfolio Diversification Based on Retained ABR1,2 1Based on tenant concept as of Q2 2022 and Q2 2022 ABR of $316.4M derived from assets retained from Q2 2017. 2Retail industries, indicated by blue, reflect the underlying Tenant operations, an
Slide 14: Acquired portfolio
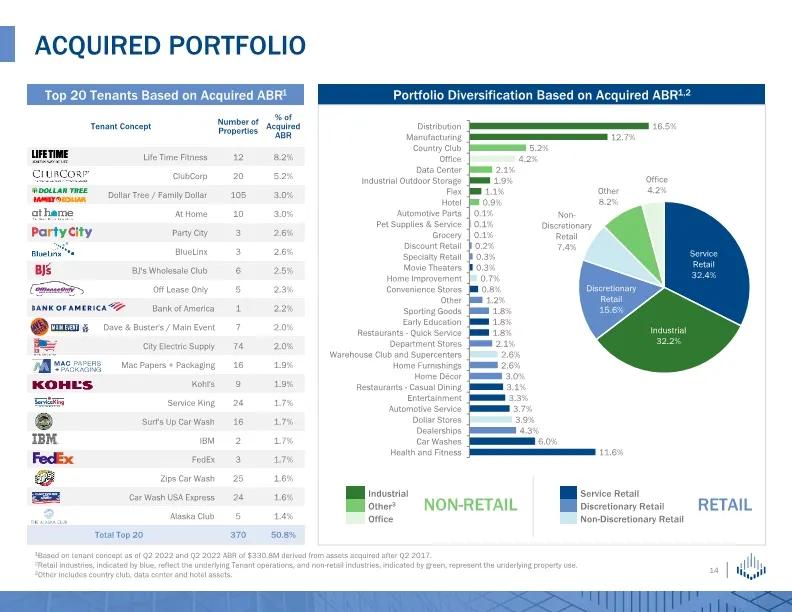
1Based on tenant concept as of Q2 2022 and Q2 2022 ABR of $330.8M derived from assets acquired after Q2 2017. 2Retail industries, indicated by blue, reflect the underlying Tenant operations, and non-retail industries, indicated by green, represent the underlying property use. 3Other includes country
Slide 15: Total Current Portfolio
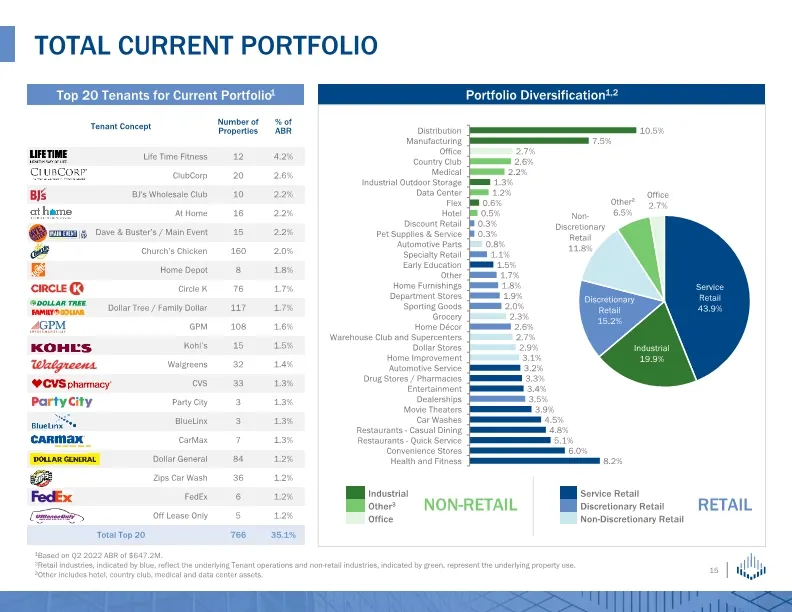
Total Current Portfolio 1Based on Q2 2022 ABR of $647.2M. 2Retail industries, indicated by blue, reflect the underlying Tenant operations and non-retail industries, indicated by green, represent the underlying property use. 3Other includes hotel, country club, medical and data center assets. Portfol
Slide 16: Operational Metrics Comparison
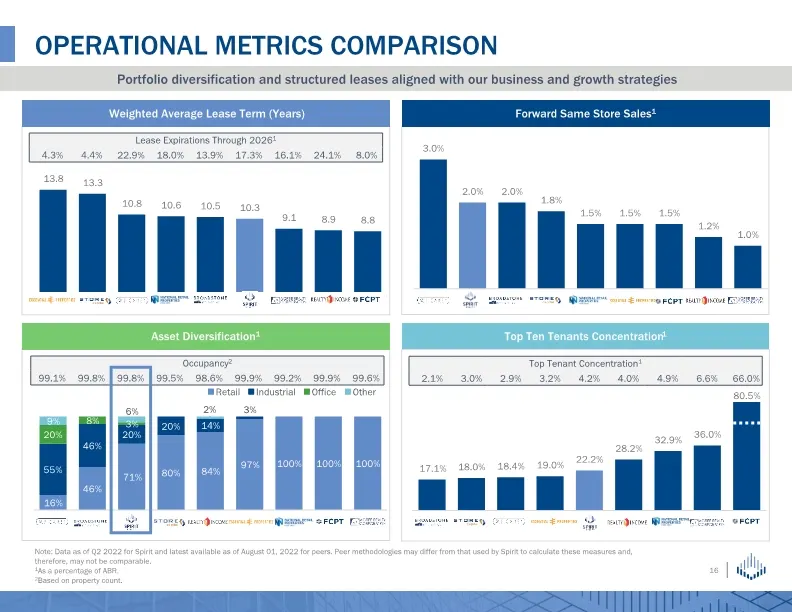
Operational Metrics Comparison 80.5% Portfolio diversification and structured leases aligned with our business and growth strategies Weighted Average Lease Term (Years) Asset Diversification1 Forward Same Store Sales1 Top Ten Tenants Concentration1 Note: Data as of Q2 2022 for Spirit and latest avai
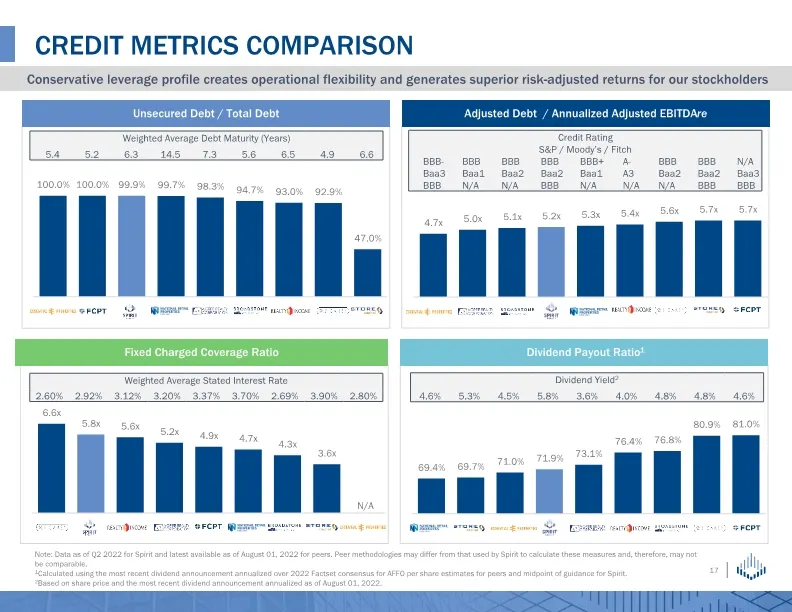
Slide 17: Credit metrics comparison
Credit metrics comparison Note: Data as of Q2 2022 for Spirit and latest available as of August 01, 2022 for peers. Peer methodologies may differ from that used by Spirit to calculate these measures and, therefore, may not be comparable. 1Calculated using the most recent dividend announcement annual
Slide 18: Supplemental Information
Supplemental Information
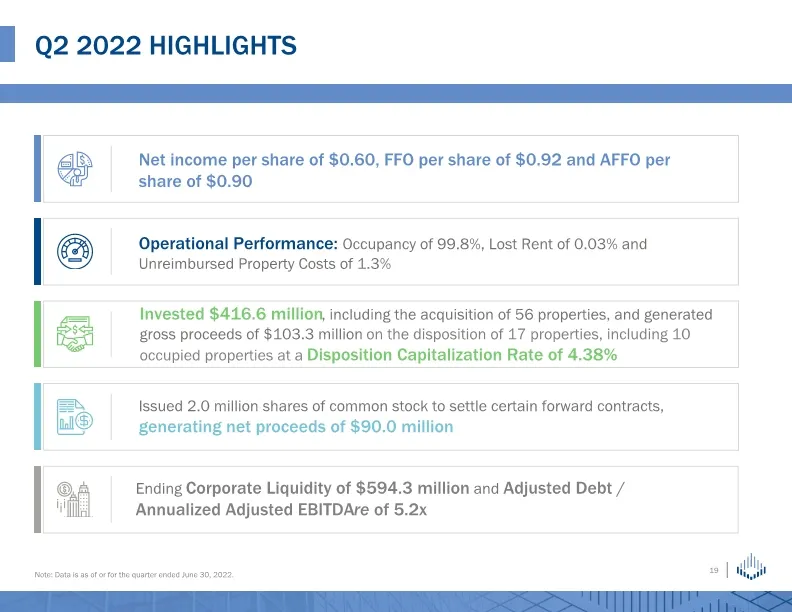
Slide 19: Q2 2022 highlights
Q2 2022 highlights Net income per share of $0.60, FFO per share of $0.92 and AFFO per share of $0.90 Operational Performance: Occupancy of 99.8%, Lost Rent of 0.03% and Unreimbursed Property Costs of 1.3% Invested $416.6 million, including the acquisition of 56 properties, and generated gross procee
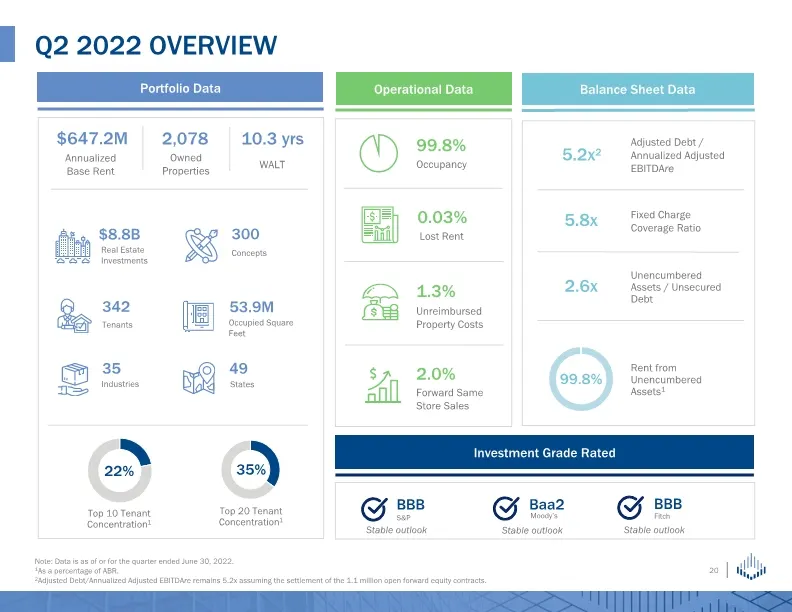
Slide 20: Q2 2022 Overview
Q2 2022 Overview Portfolio Data Operational Data Balance Sheet Data $647.2M 35% Top 10 Tenant Concentration1 22% Investment Grade Rated Baa2 Moody’s Annualized Base Rent Top 20 Tenant Concentration1 5.2x2 Adjusted Debt / Annualized Adjusted EBITDAre 5.8x Fixed Charge Coverage Ratio Concepts 300 10.3
Slide 21: Debt Summary and Market Capitalization
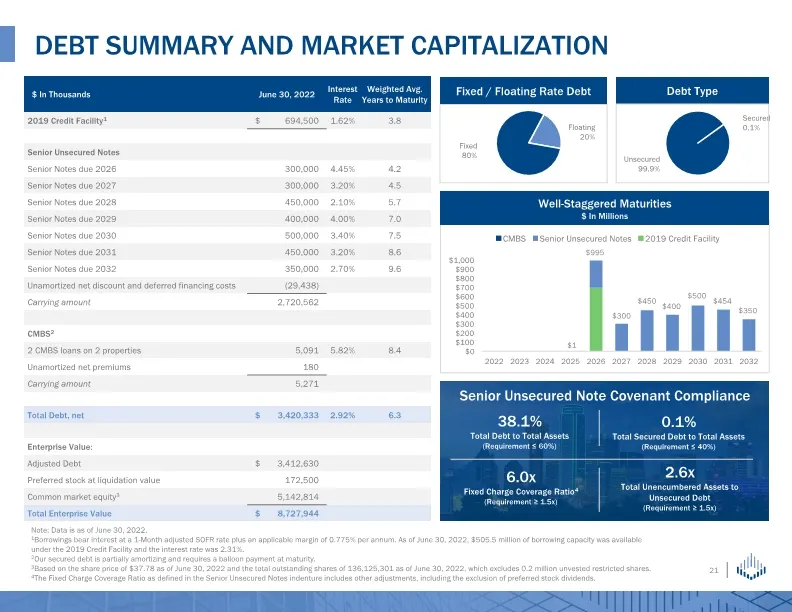
Debt Summary and Market Capitalization Note: Data is as of June 30, 2022. 1Borrowings bear interest at a 1-Month adjusted SOFR rate plus an applicable margin of 0.775% per annum. As of June 30, 2022, $505.5 million of borrowing capacity was available under the 2019 Credit Facility and the interest r
Slide 22: Net Investment Activity
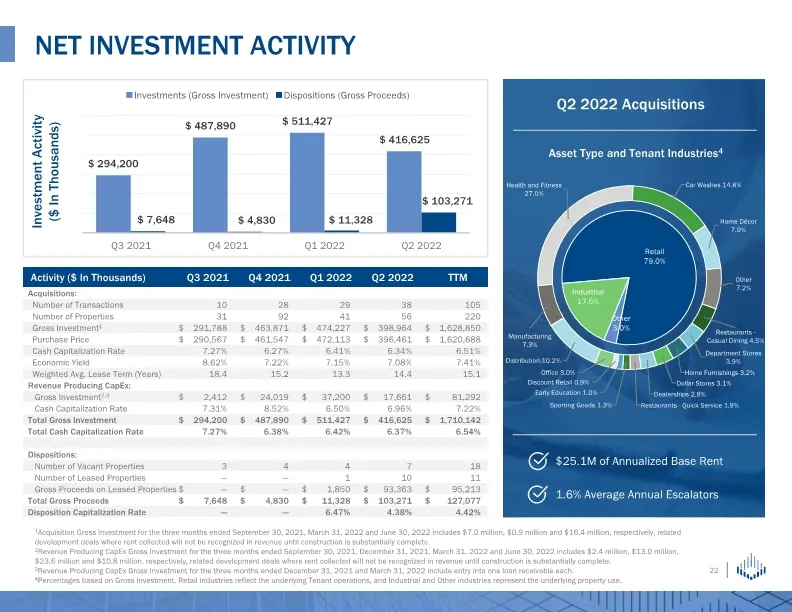
NET INVESTMENT ACTIVITY Asset Type and Tenant Industries4 1Acquisition Gross Investment for the three months ended September 30, 2021, March 31, 2022 and June 30, 2022 includes $7.0 million, $0.9 million and $16.4 million, respectively, related development deals where rent collected will not be reco
Slide 23: Portfolio Health
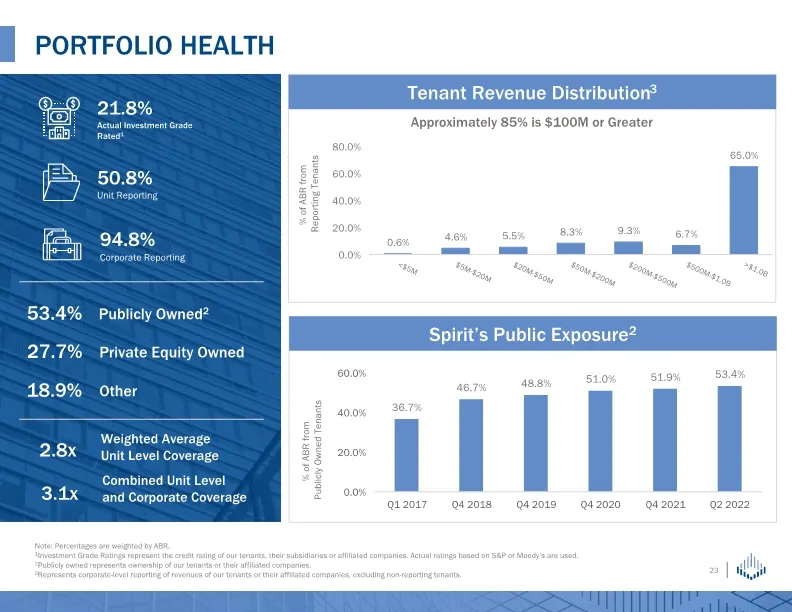
Portfolio Health % of ABR from Reporting Tenants Note: Percentages are weighted by ABR. 1Investment Grade Ratings represent the credit rating of our tenants, their subsidiaries or affiliated companies. Actual ratings based on S&P or Moody’s are used. 2Publicly owned represents ownership of our tenan
Slide 24: Lease Structure, Expirations and Escalations
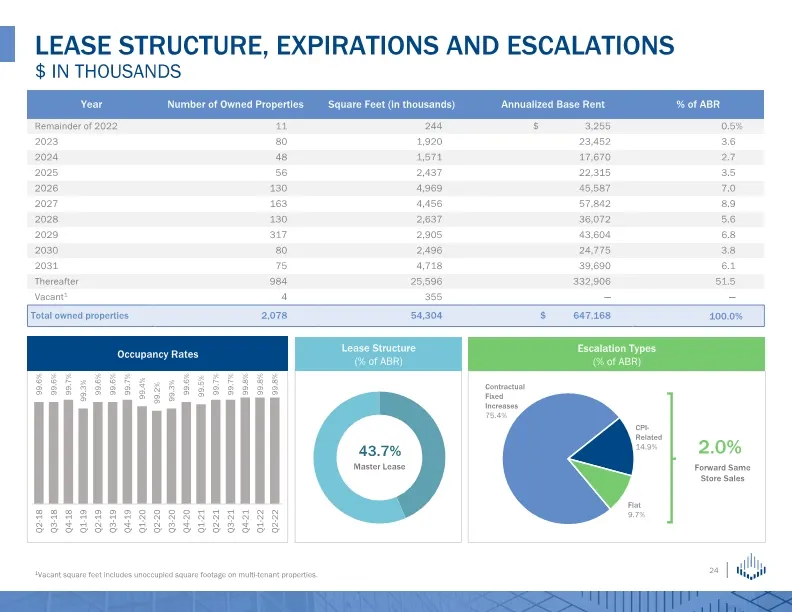
LEASE STRUCTURE, EXPIRATIONS AND ESCALATIONS $ in thousands 2.0% Forward Same Store Sales Occupancy Rates Lease Structure (% of ABR) 43.7% Master Lease Escalation Types (% of ABR) 1Vacant square feet includes unoccupied square footage on multi-tenant properties.
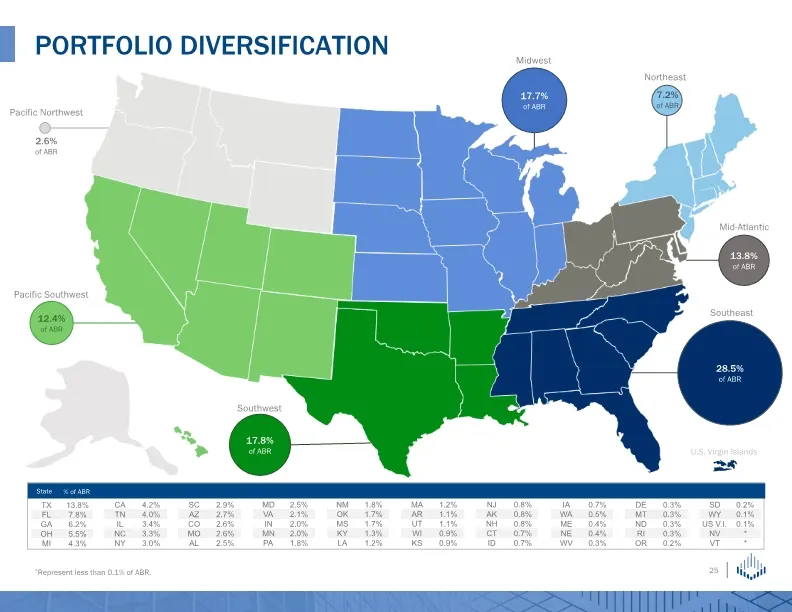
Slide 25: Portfolio Diversification
28.5% of ABR PORTFOLIO DIVERSIFICATION *Represent less than 0.1% of ABR. % of ABR State Southeast Mid-Atlantic Pacific Southwest Pacific Northwest Southwest Midwest Northeast 17.7% of ABR 13.8% of ABR 12.4% of ABR 17.8% of ABR U.S. Virgin Islands 2.6% of ABR 7.2% of ABR
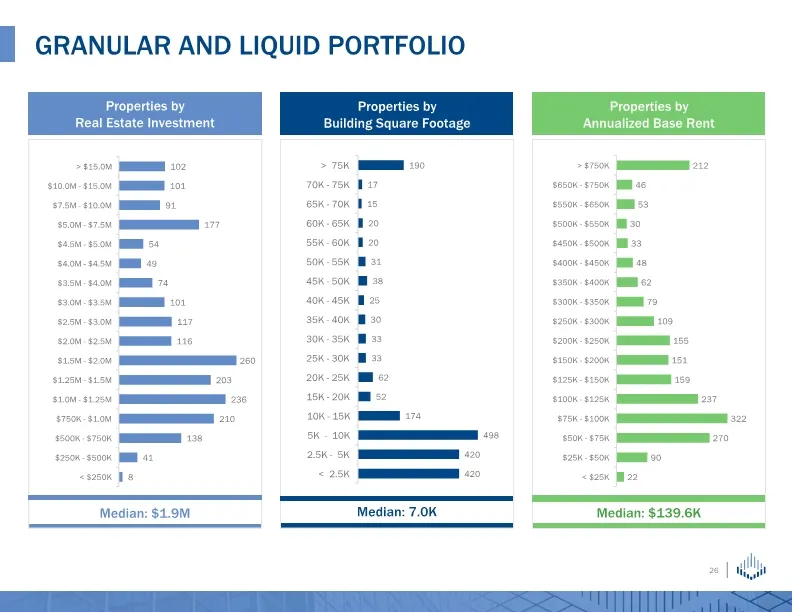
Slide 26: Granular and Liquid Portfolio
Granular and Liquid Portfolio
Slide 27: Financial Presentation and Non-GAAP Reconciliations
Financial Presentation and Non-GAAP Reconciliations
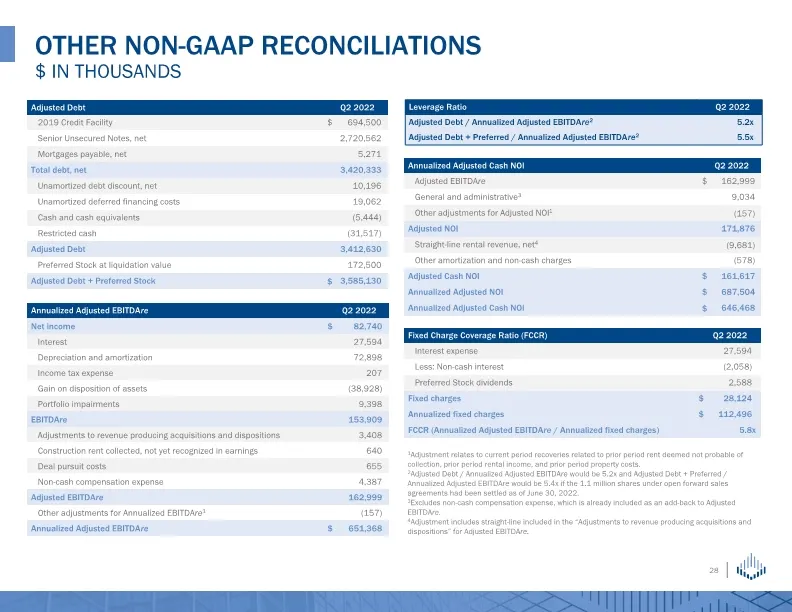
Slide 28: Other Non-GAAP Reconciliations
Other NON-GAAP RECONCILIATIONS $ in thousands 1Adjustment relates to current period recoveries related to prior period rent deemed not probable of collection, prior period rental income, and prior period property costs. 2Adjusted Debt / Annualized Adjusted EBITDAre would be 5.2x and Adjusted Debt +
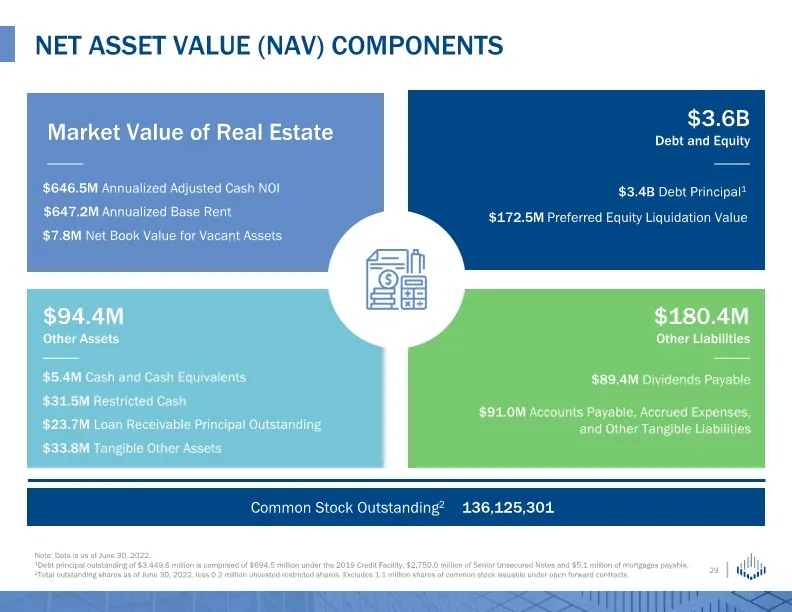
Slide 29: Net Asset Value (NAV) Components
Net Asset Value (NAV) Components Market Value of Real Estate $3.6B Debt and Equity $94.4M Other Assets $180.4M Other Liabilities $647.2M Annualized Base Rent $7.8M Net Book Value for Vacant Assets $3.4B Debt Principal1 $172.5M Preferred Equity Liquidation Value $5.4M Cash and Cash Equivalents $33.8M
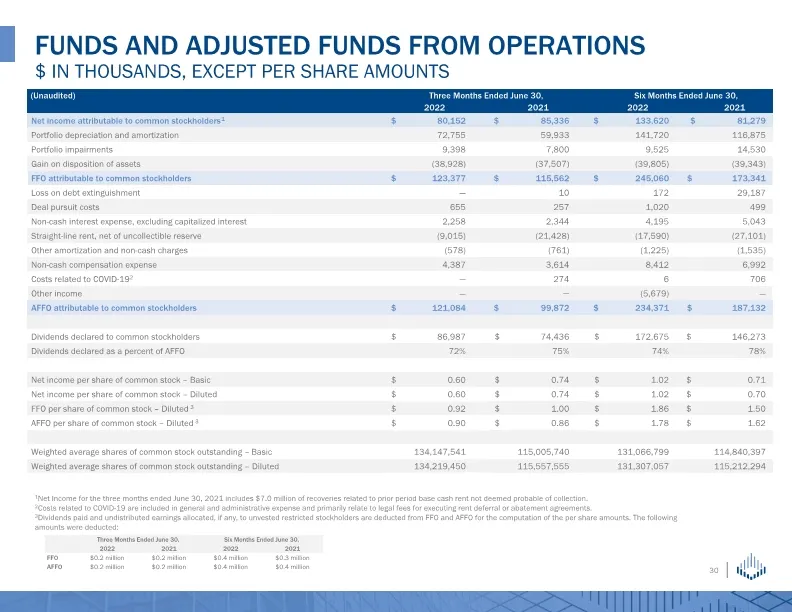
Slide 30: Funds and Adjusted Funds From Operations
1Net Income for the three months ended June 30, 2021 includes $7.0 million of recoveries related to prior period base cash rent not deemed probable of collection. 2Costs related to COVID-19 are included in general and administrative expense and primarily relate to legal fees for executing rent defer
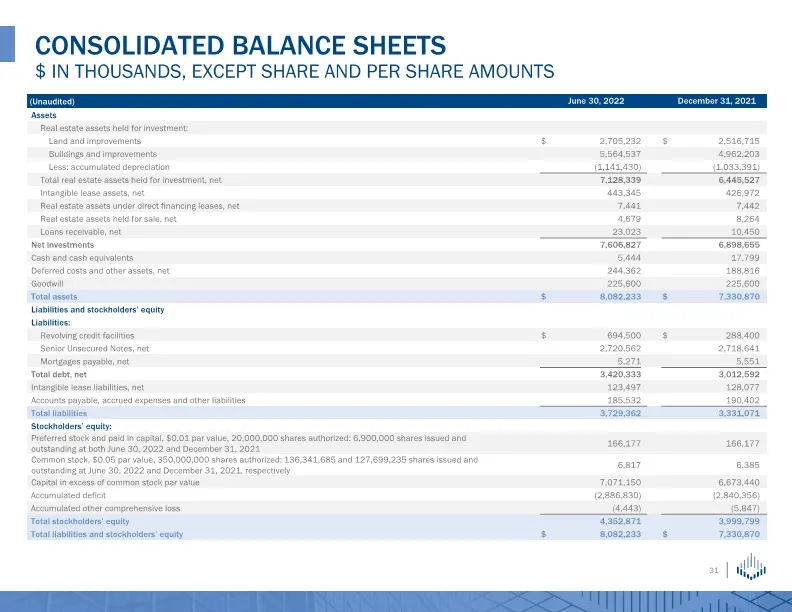
Slide 31: Consolidated Balance Sheets
CONSOLIDATED BALANCE SHEETS $ IN THOUSANDS, EXCEPT SHARE AND PER SHARE AMOUNTS
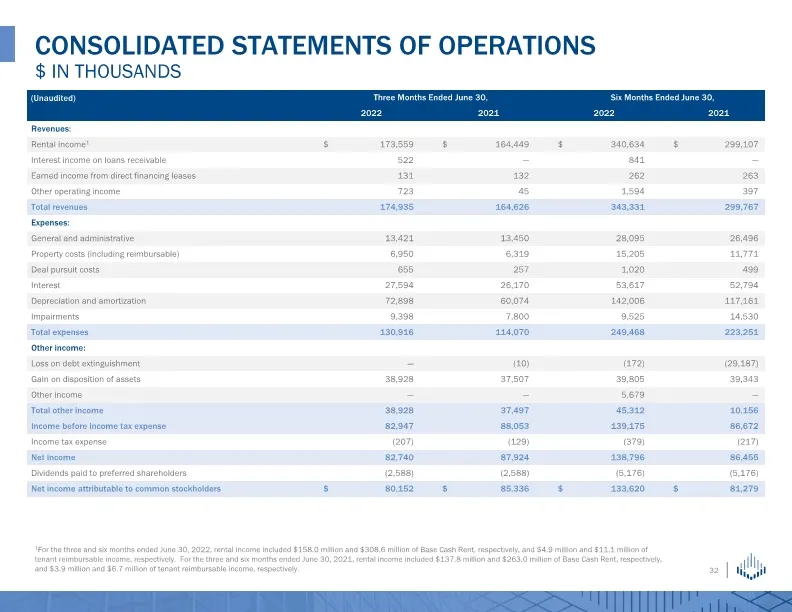
Slide 32: Consolidated Statements of Operations
CONSOLIDATED STATEMENTS OF OPERATIONS $ IN THOUSANDS 1For the three and six months ended June 30, 2022, rental income included $158.0 million and $308.6 million of Base Cash Rent, respectively, and $4.9 million and $11.1 million of tenant reimbursable income, respectively. For the three and six mont
Slide 33: Environment, Social and Governance Updates
Environment, Social and Governance Updates
Slide 34: Key ESG successes in 2021
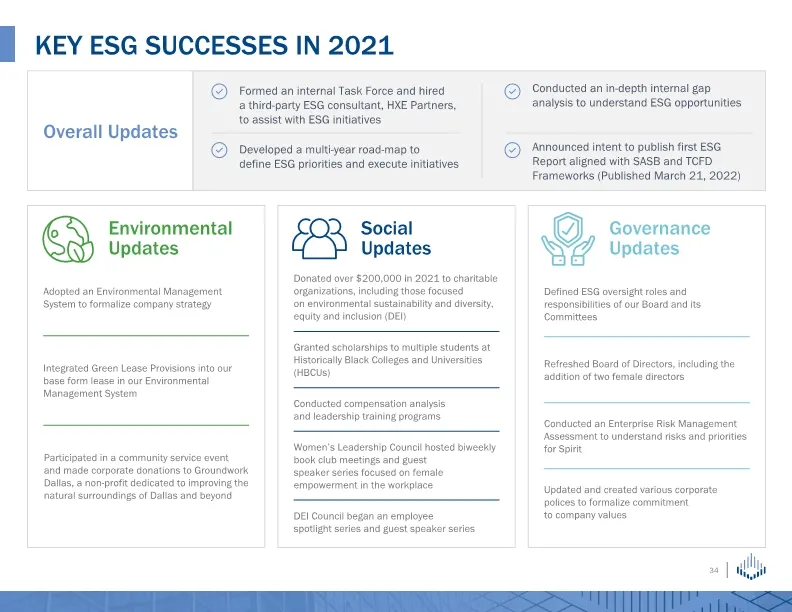
Announced intent to publish first ESG Report aligned with SASB and TCFD Frameworks (Published March 21, 2022) Key esg successes in 2021 Overall Updates Formed an internal Task Force and hired a third-party ESG consultant, HXE Partners, to assist with ESG initiatives Developed a multi-year road-map t
Slide 35: Commitment to Environmental Sustainability
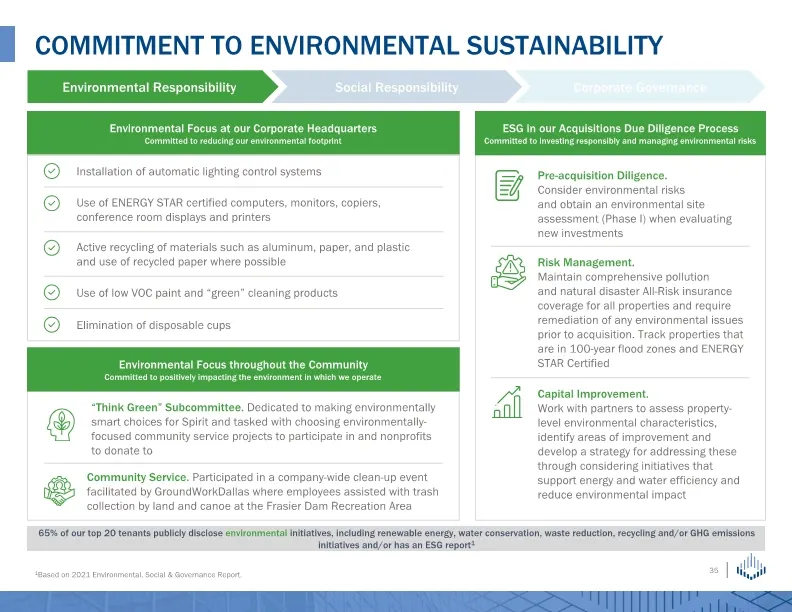
Commitment to Environmental Sustainability Environmental Responsibility Social Responsibility Corporate Governance Environmental Focus throughout the Community Committed to positively impacting the environment in which we operate Environmental Focus at our Corporate Headquarters Committed to reducin
Slide 36: Commitment to social responsibility
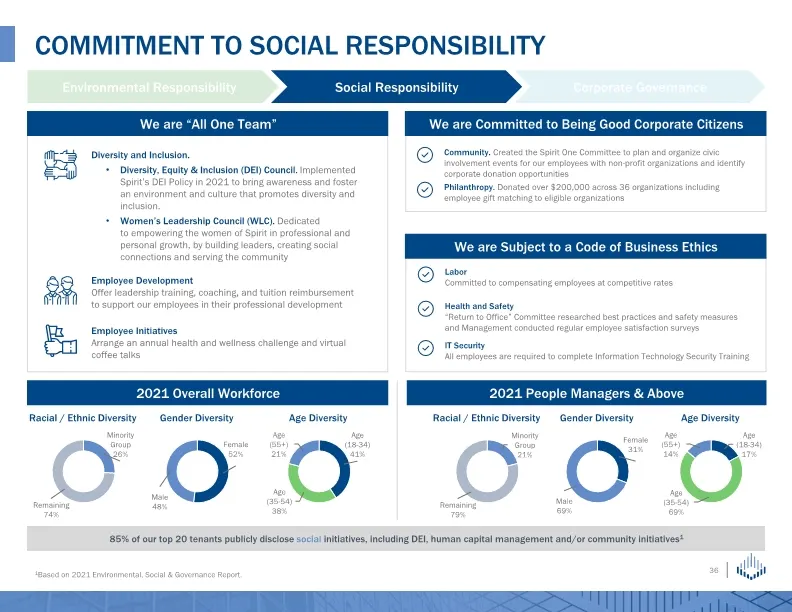
Commitment to social responsibility Racial / Ethnic Diversity Racial / Ethnic Diversity Gender Diversity Gender Diversity Age Diversity Age Diversity We are “All One Team” 2021 Overall Workforce 2021 People Managers & Above We are Committed to Being Good Corporate Citizens Environmental Responsibili
Slide 37: Commitment to strong governance practice
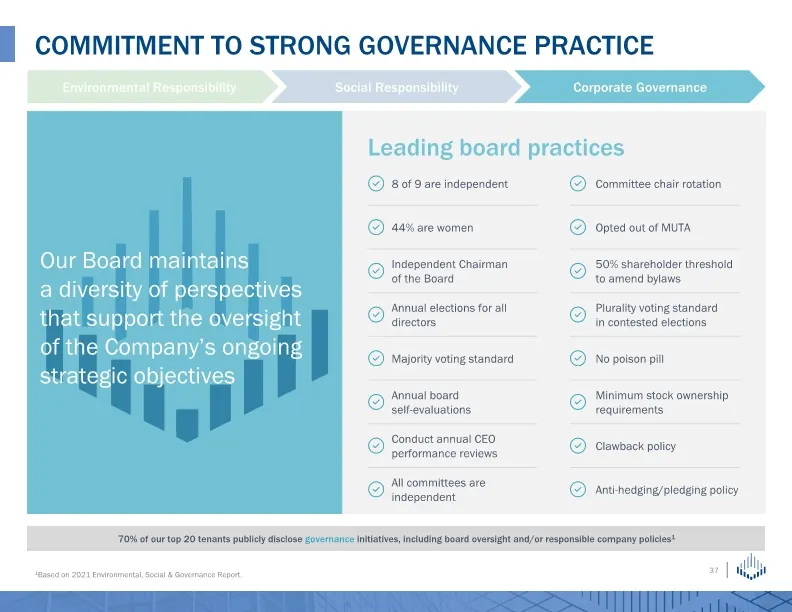
Commitment to strong governance practice Environmental Responsibility Social Responsibility Corporate Governance Our Board maintains a diversity of perspectives that support the oversight of the Company’s ongoing strategic objectives Leading board practices 8 of 9 are independent Committee chair rot
Slide 38: Appendix
Appendix
Slide 39: Non-GAAP Definitions and Explanations
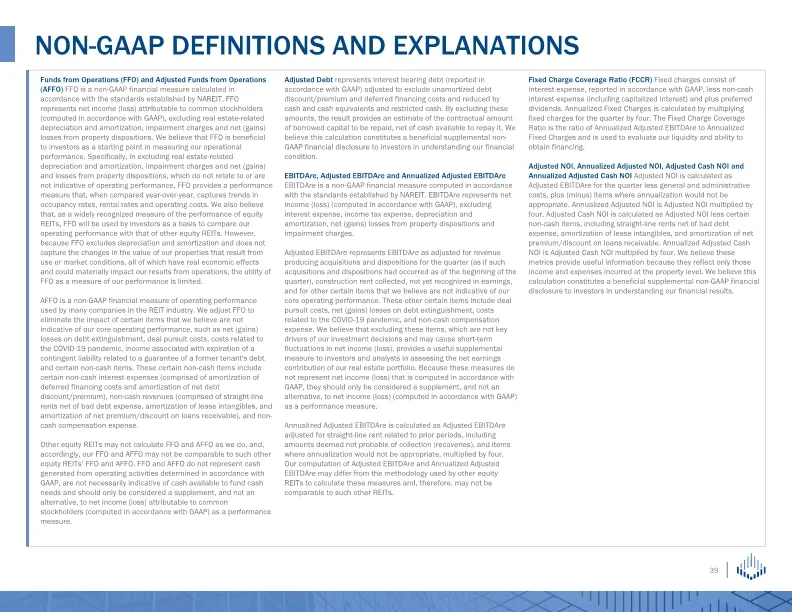
NON-GAAP DEFINITIONS AND EXPLANATIONS
Slide 40: Other Definitions and Explanations
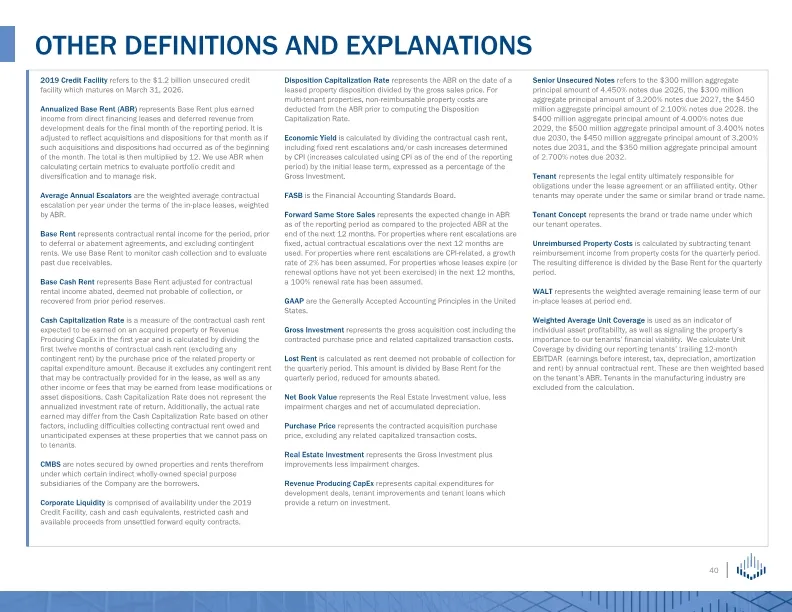
OTHER DEFINITIONS AND EXPLANATIONS
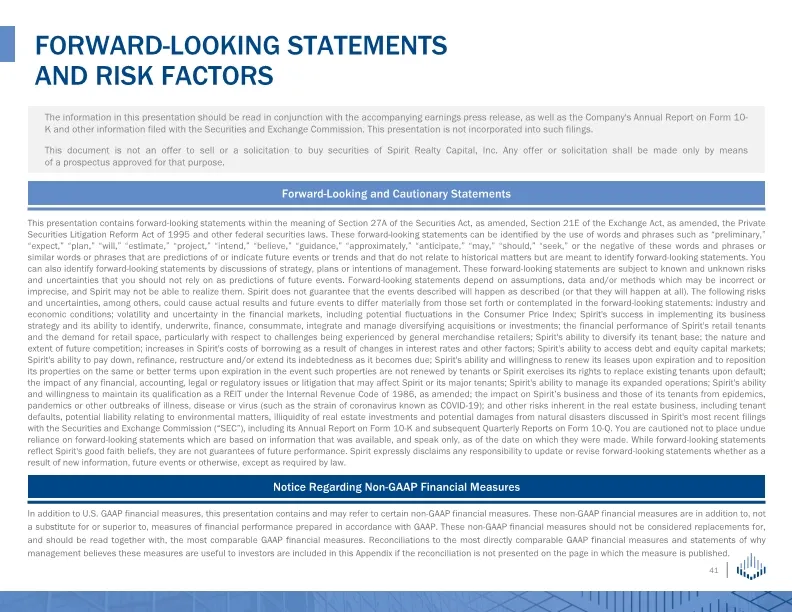
Slide 41: Forward-Looking Statements and Risk Factors
FORWARD-LOOKING STATEMENTS AND RISK FACTORS The information in this presentation should be read in conjunction with the accompanying earnings press release, as well as the Company's Annual Report on Form 10-K and other information filed with the Securities and Exchange Commission. This presentation
Source: SEC EDGAR · 8-K filed Aug 3, 2022
More decks from Spirit Realty Capital Inc
 Q3 2023 Earnings Presentation28 slides · Nov 2, 2023
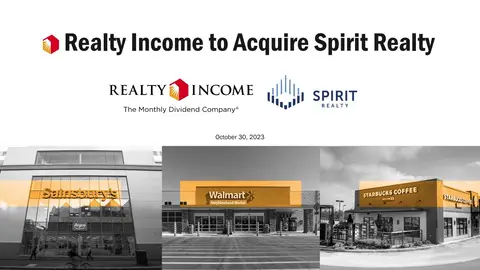 Merger or Acquisition (October 2023)20 slides · Oct 30, 2023
 Q2 2023 Earnings Presentation26 slides · Aug 7, 2023
 Q2 2023 Earnings Presentation26 slides · August 2023
 Q1 2023 Earnings Presentation27 slides · May 3, 2023
 Q4 2022 Earnings Presentation31 slides · Feb 28, 2023