TEAM plc · LSE:TEAM
TEAM — FY2025 Earnings Presentation
12 slides from TEAM's earnings presentation, Mar 25, 2026

Slide 1: Results for the year ended 30 Sep'25
Results for the year ended 30 Sep’25 March 2026
Slide 2: Contents
Contents 3 Highlights 4 Divisional update 8 Financial results 12 Investment thesis 2
Slide 3: Highlights
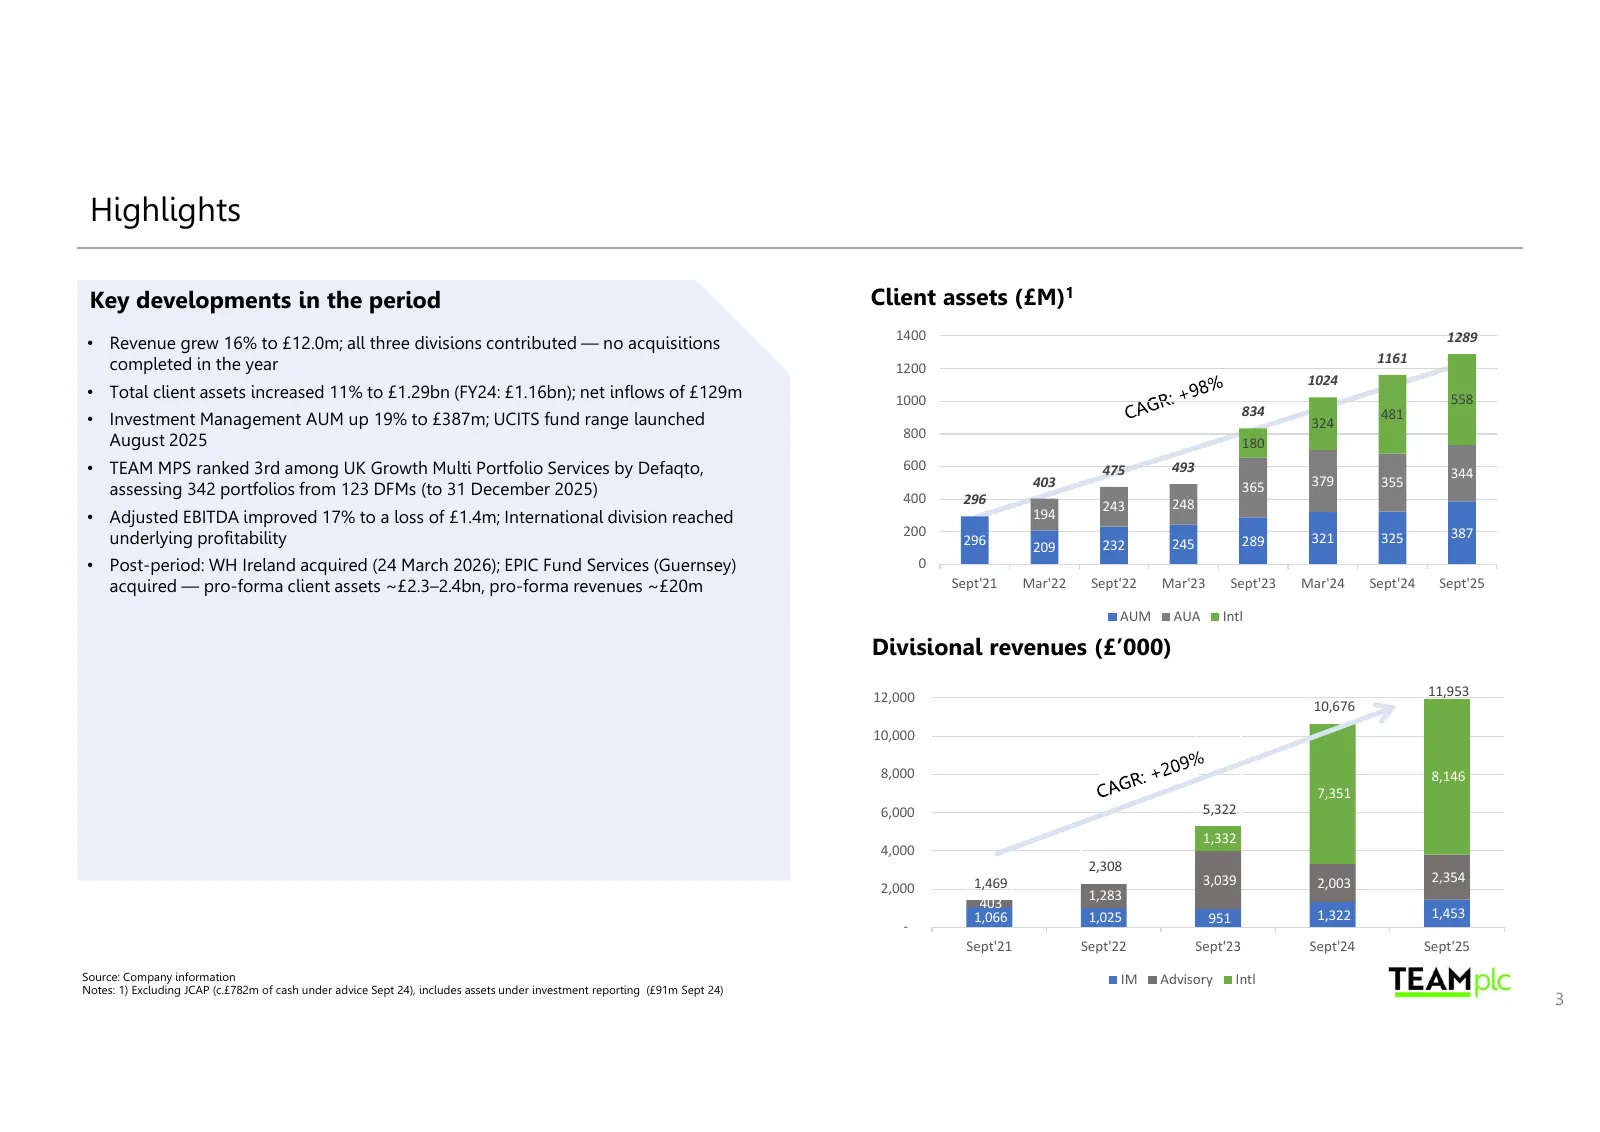
Highlights Key developments in the period Client assets (£M)1 1400 1289 • Revenue grew 16% to £12.0m; all three divisions contributed — no acquisitions completed in the year 1161 1200 1024 • Total client assets increased 11% to £1.29bn (FY24: £1.16bn); net inflows of £129m 1000 558 834 481 • Investm

Slide 4: Divisional update
Divisional update TEAMplc
Slide 5: Overview & highlights
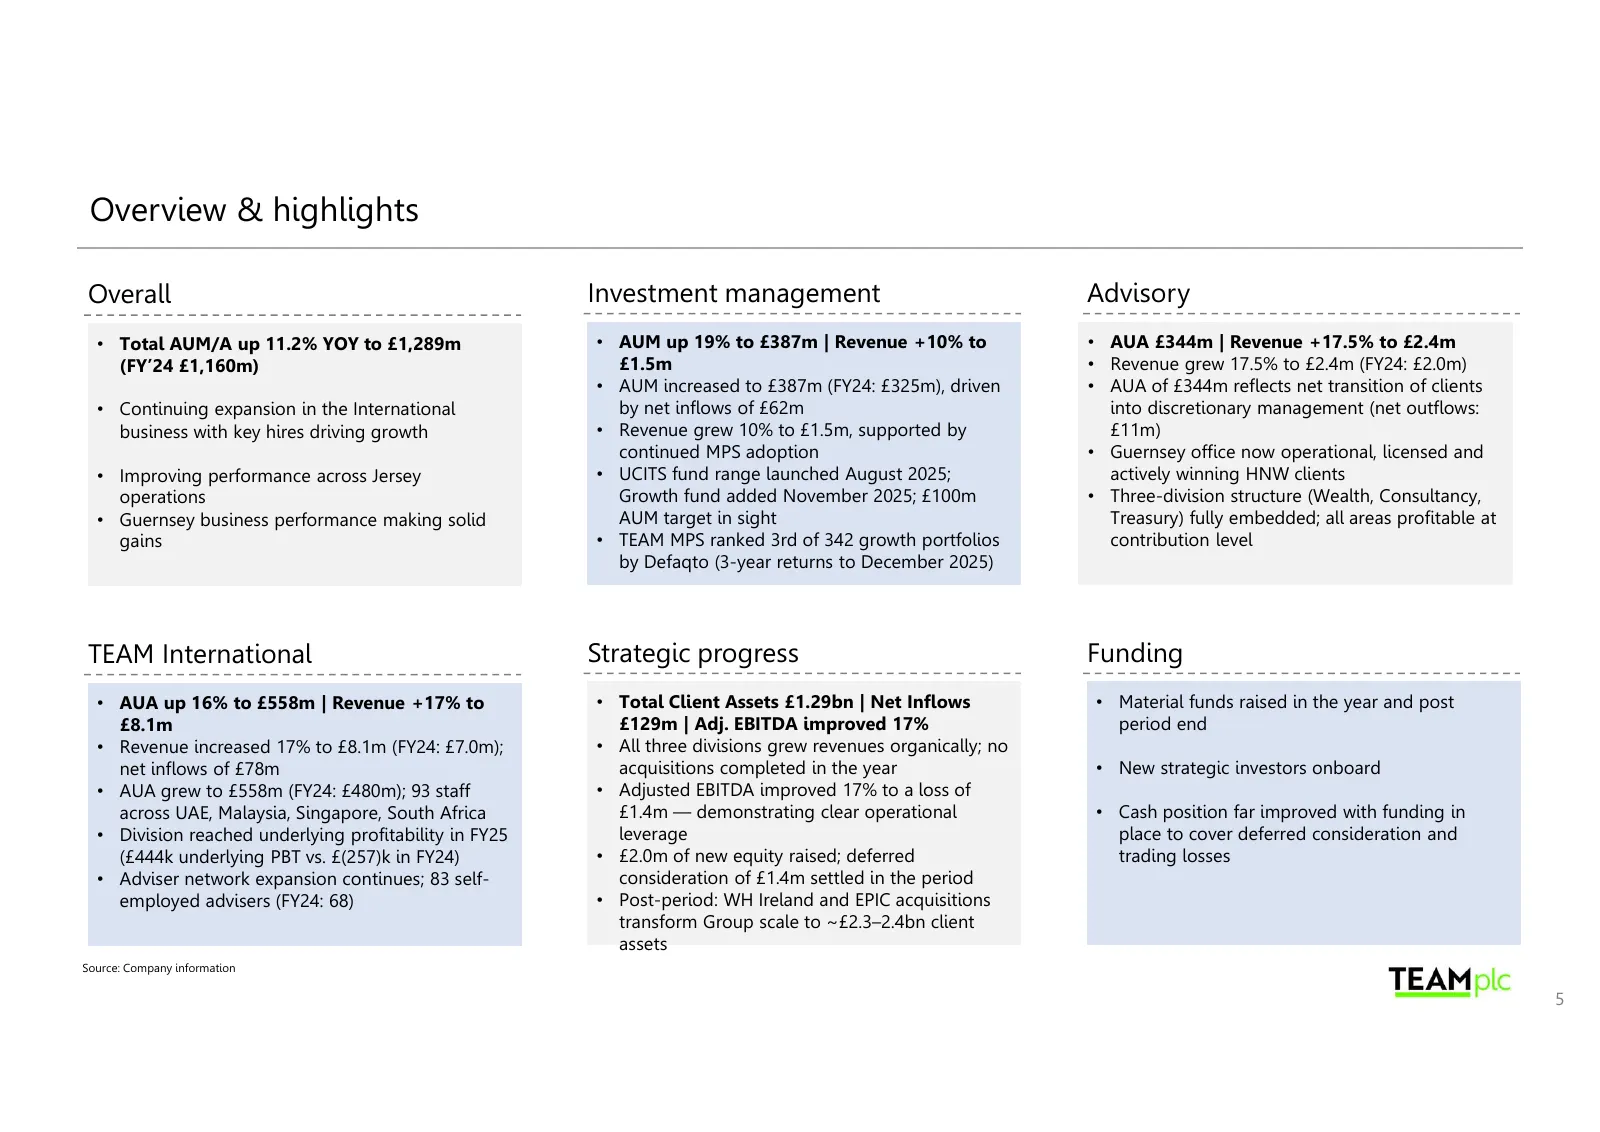
Overview & highlights Overall Investment management Advisory • Total AUM/A up 11.2% YOY to £1,289m • AUM up 19% to £387m | Revenue +10% to • AUA £344m | Revenue +17.5% to £2.4m (FY’24 £1,160m) £1.5m • Revenue grew 17.5% to £2.4m (FY24: £2.0m) • AUM increased to £387m (FY24: £325m), driven • AUA of £
Slide 6: Operations
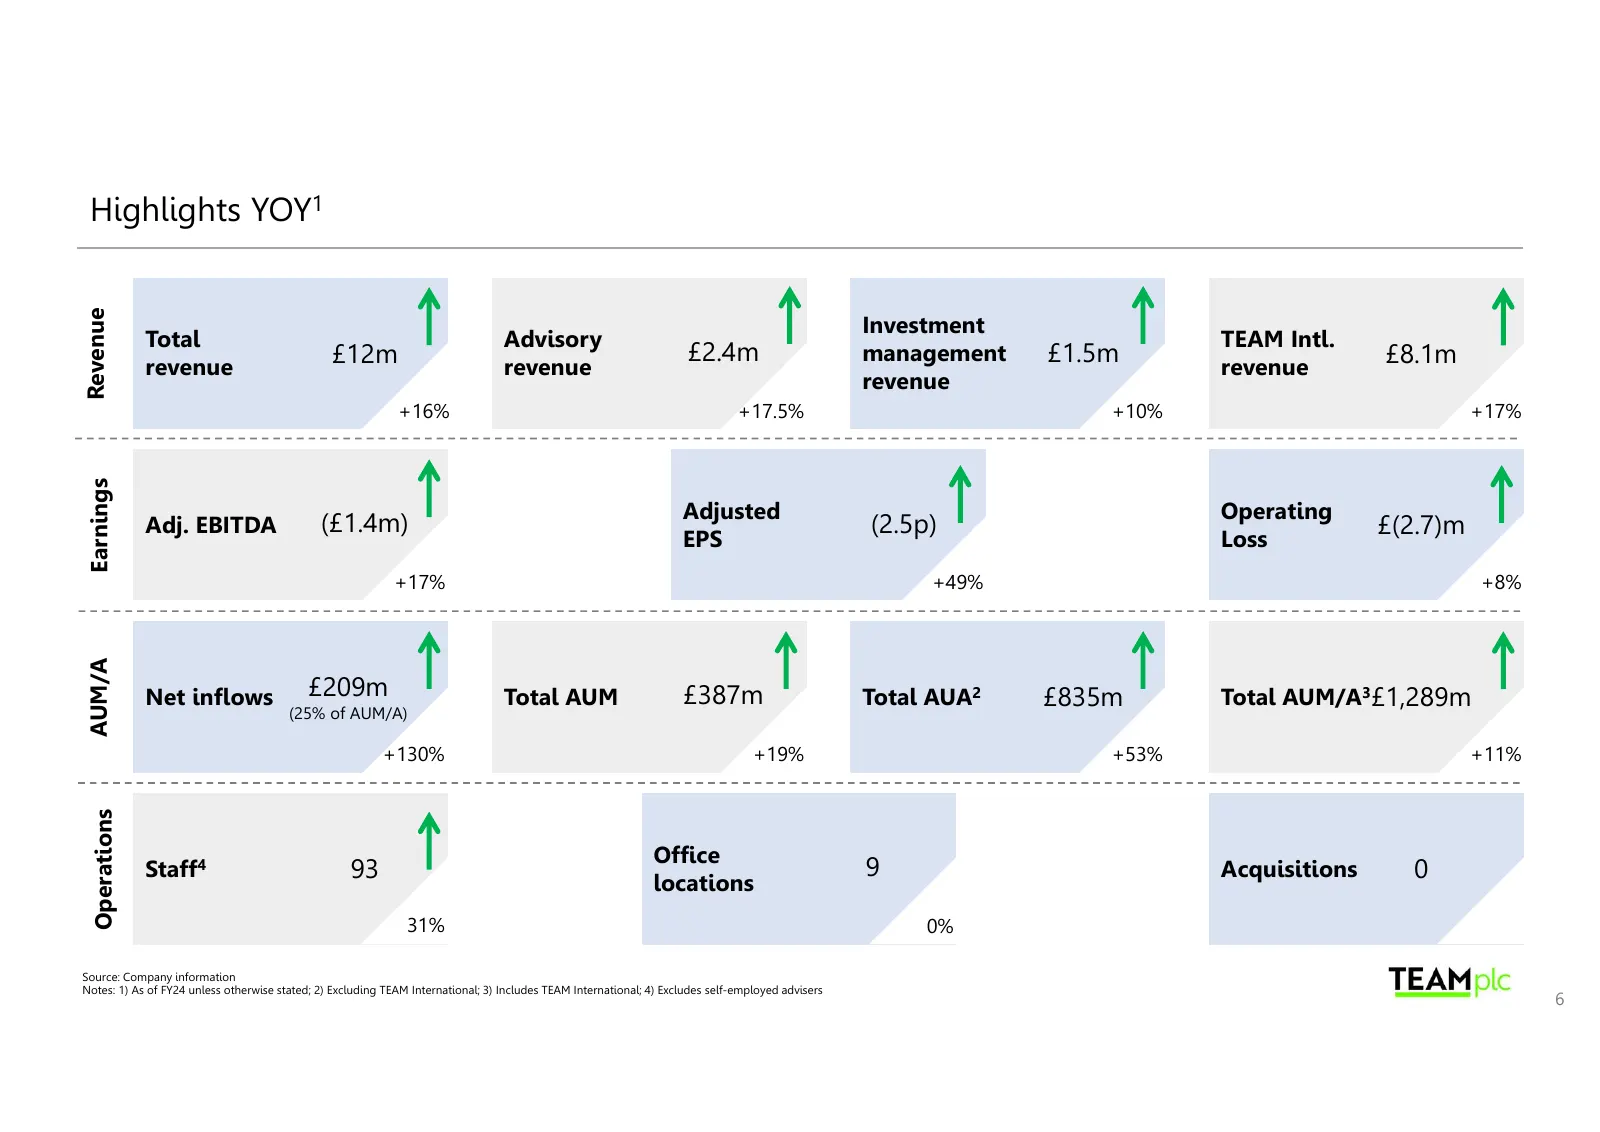
Highlights YOY1 Revenue Investment Total Advisory TEAM Intl. £12m £2.4m management £1.5m £8.1m revenue revenue revenue revenue +16% +17.5% +10% +17% Earnings Adjusted Operating Adj. EBITDA (£1.4m) (2.5p) £(2.7)m EPS Loss +17% +49% +8% AUM/A Net inflows £209m Total AUM £387m Total AUA2 £835m Total AU
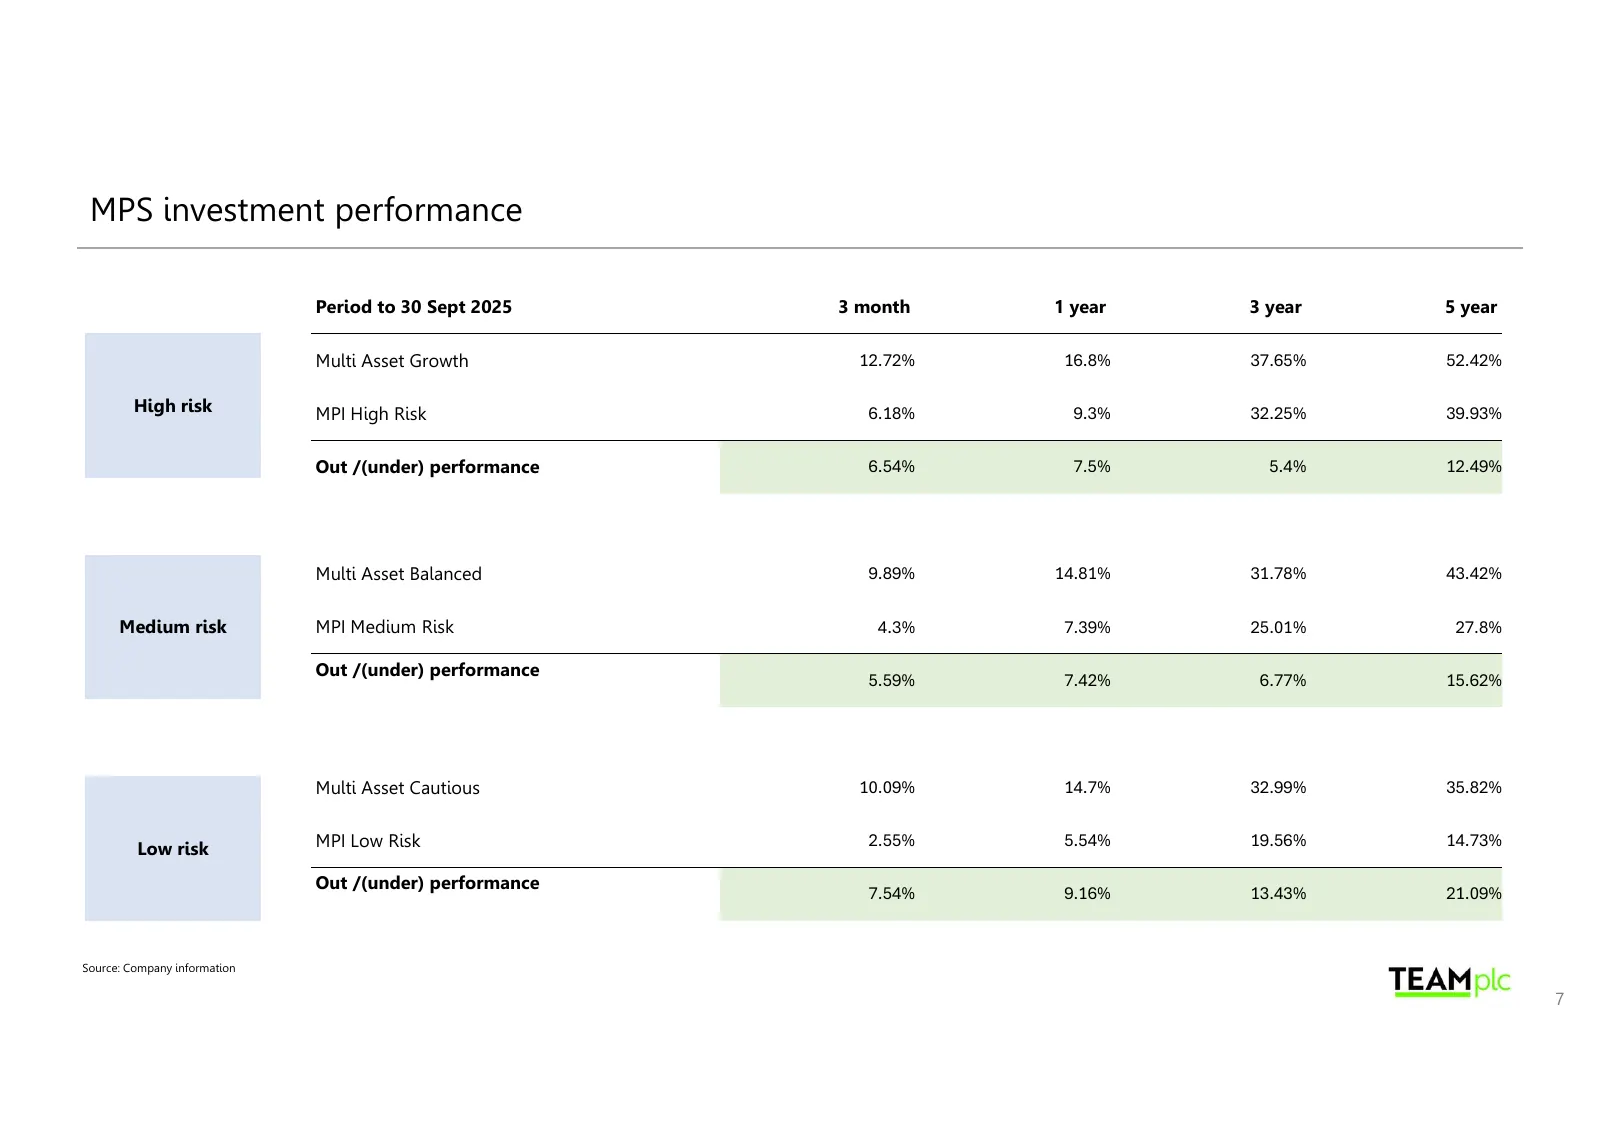
Slide 7: MPS investment performance
MPS investment performance Period to 30 Sept 2025 3 month 1 year 3 year 5 year Multi Asset Growth 12.72% 16.8% 37.65% 52.42% High risk MPI High Risk 6.18% 9.3% 32.25% 39.93% Out /(under) performance 6.54% 7.5% 5.4% 12.49% Multi Asset Balanced 9.89% 14.81% 31.78% 43.42% Medium risk MPI Medium Risk 4.
Slide 8: Financial results
Financtal results TEAMplc
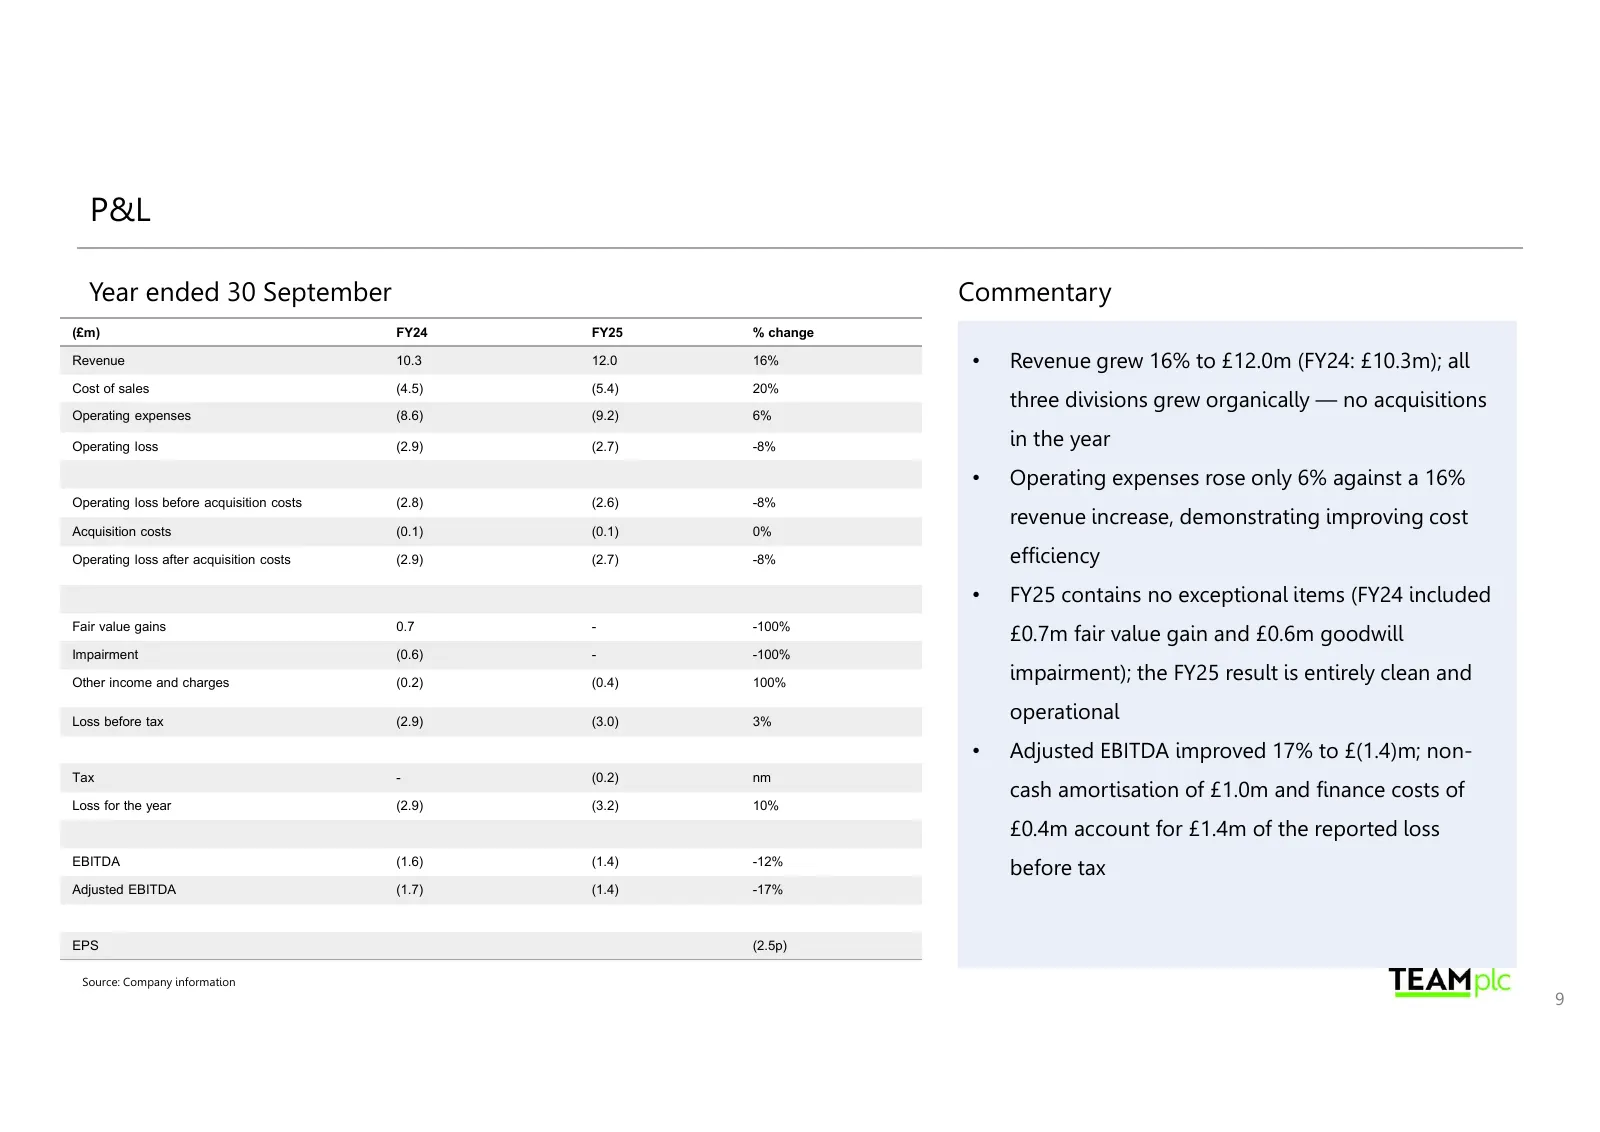
Slide 9: P&L
P&L Year ended 30 September Commentary (£m) FY24 FY25 % change Revenue 10.3 12.0 16% • Revenue grew 16% to £12.0m (FY24: £10.3m); all Cost of sales (4.5) (5.4) 20% three divisions grew organically — no acquisitions Operating expenses (8.6) (9.2) 6% Operating loss (2.9) (2.7) -8% in the year • Operat
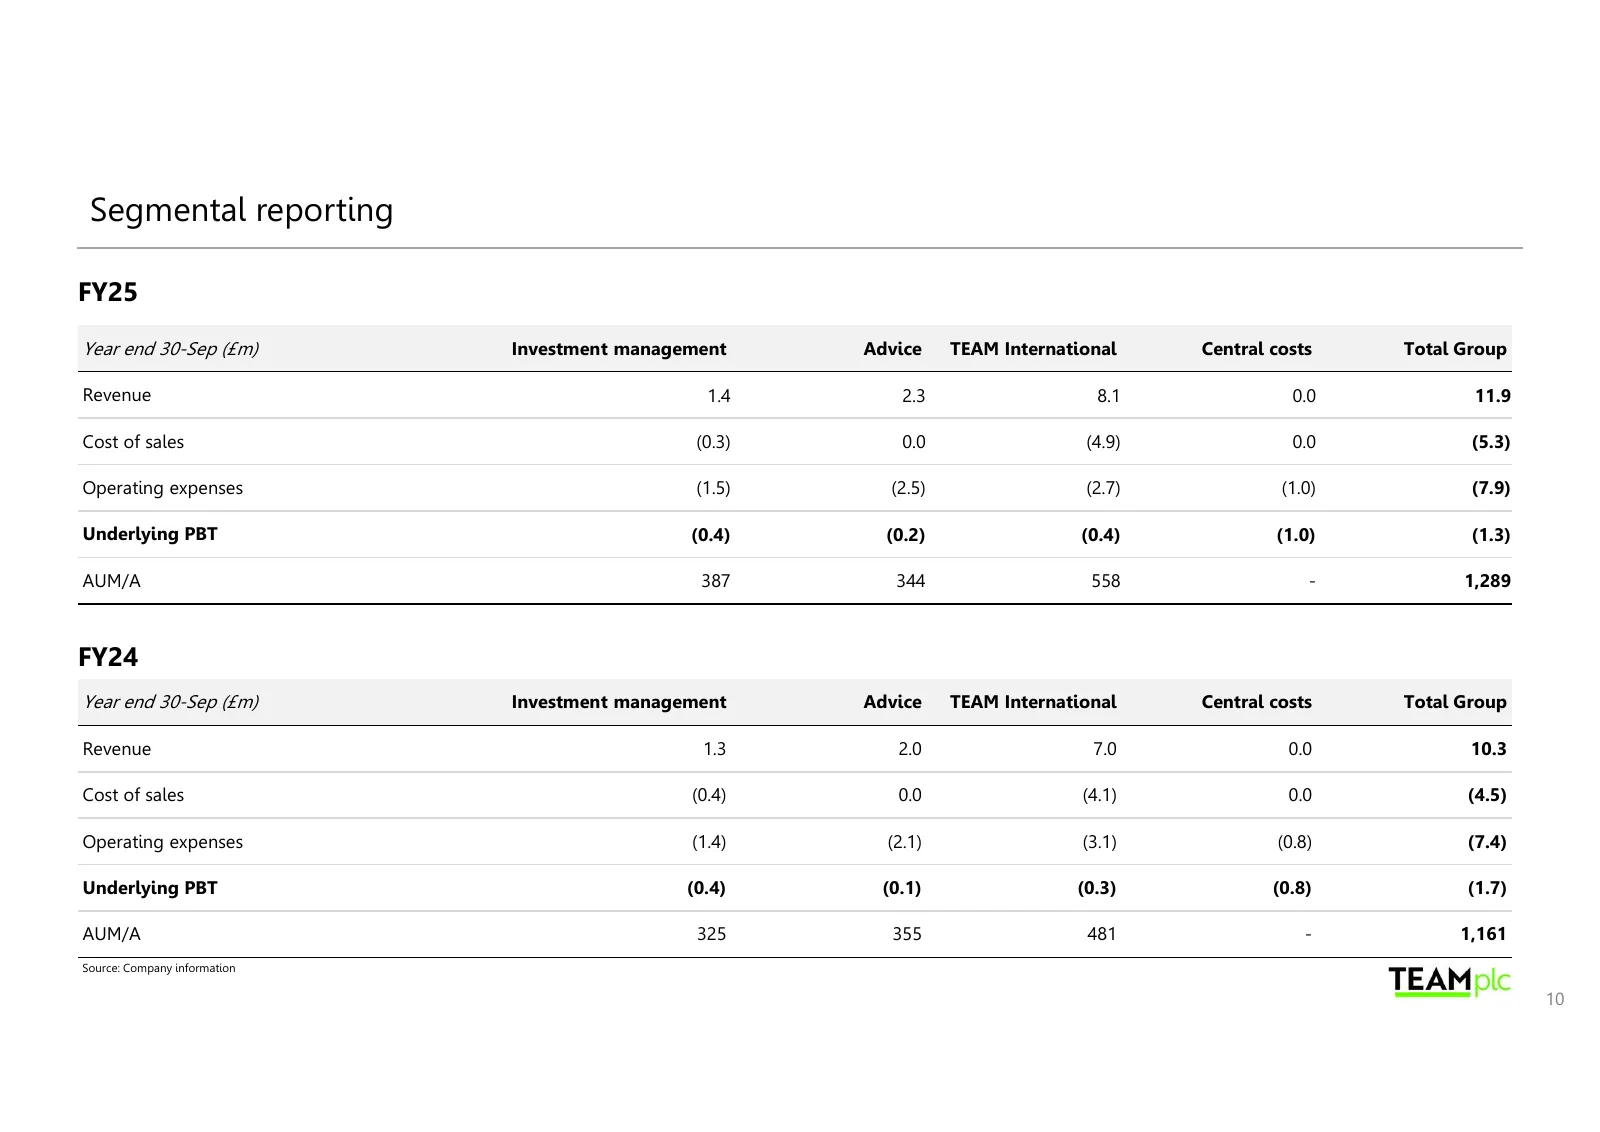
Slide 10: Segmental reporting
Segmental reporting FY25 Year end 30-Sep (£m) Investment management Advice TEAM International Central costs Total Group Revenue 1.4 2.3 8.1 0.0 11.9 Cost of sales (0.3) 0.0 (4.9) 0.0 (5.3) Operating expenses (1.5) (2.5) (2.7) (1.0) (7.9) Underlying PBT (0.4) (0.2) (0.4) (1.0) (1.3) AUM/A 387 344 558
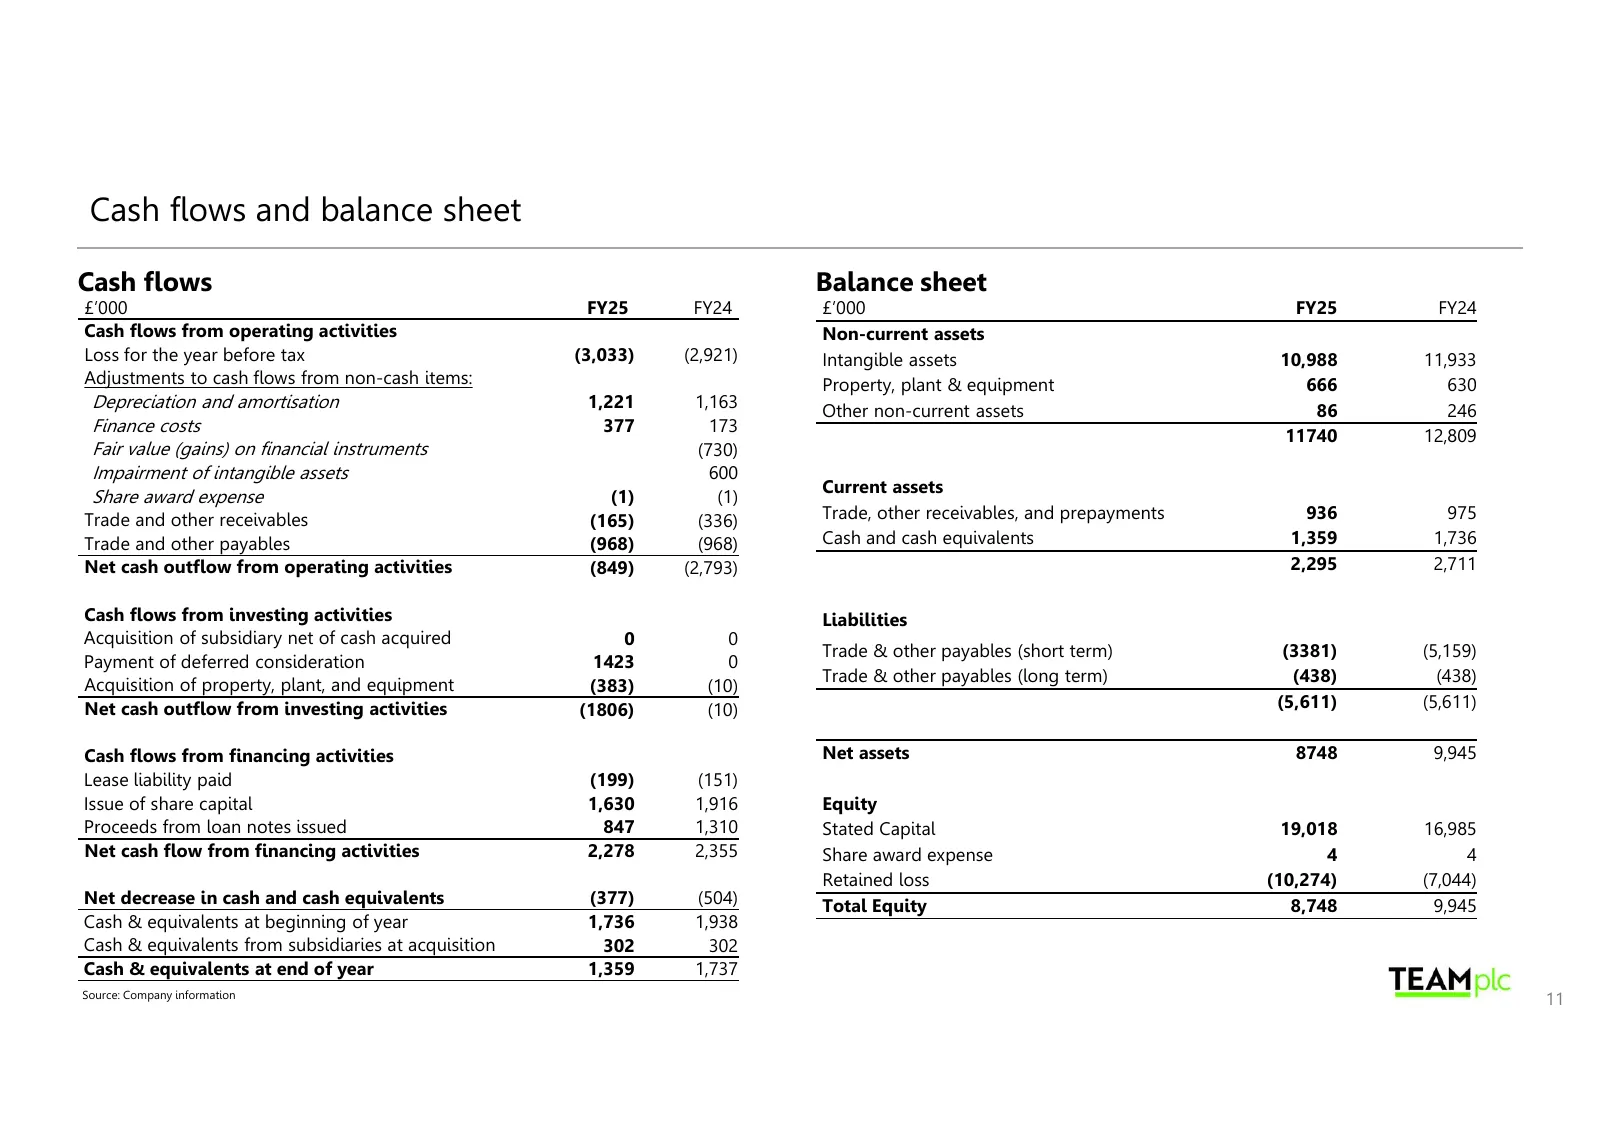
Slide 11: Cash flows and balance sheet
Cash flows and balance sheet Cash flows Balance sheet £’000 FY25 FY24 £’000 FY25 FY24 Cash flows from operating activities Non-current assets Loss for the year before tax (3,033) (2,921) Intangible assets 10,988 11,933 Adjustments to cash flows from non-cash items: Property, plant & equipment 666 63
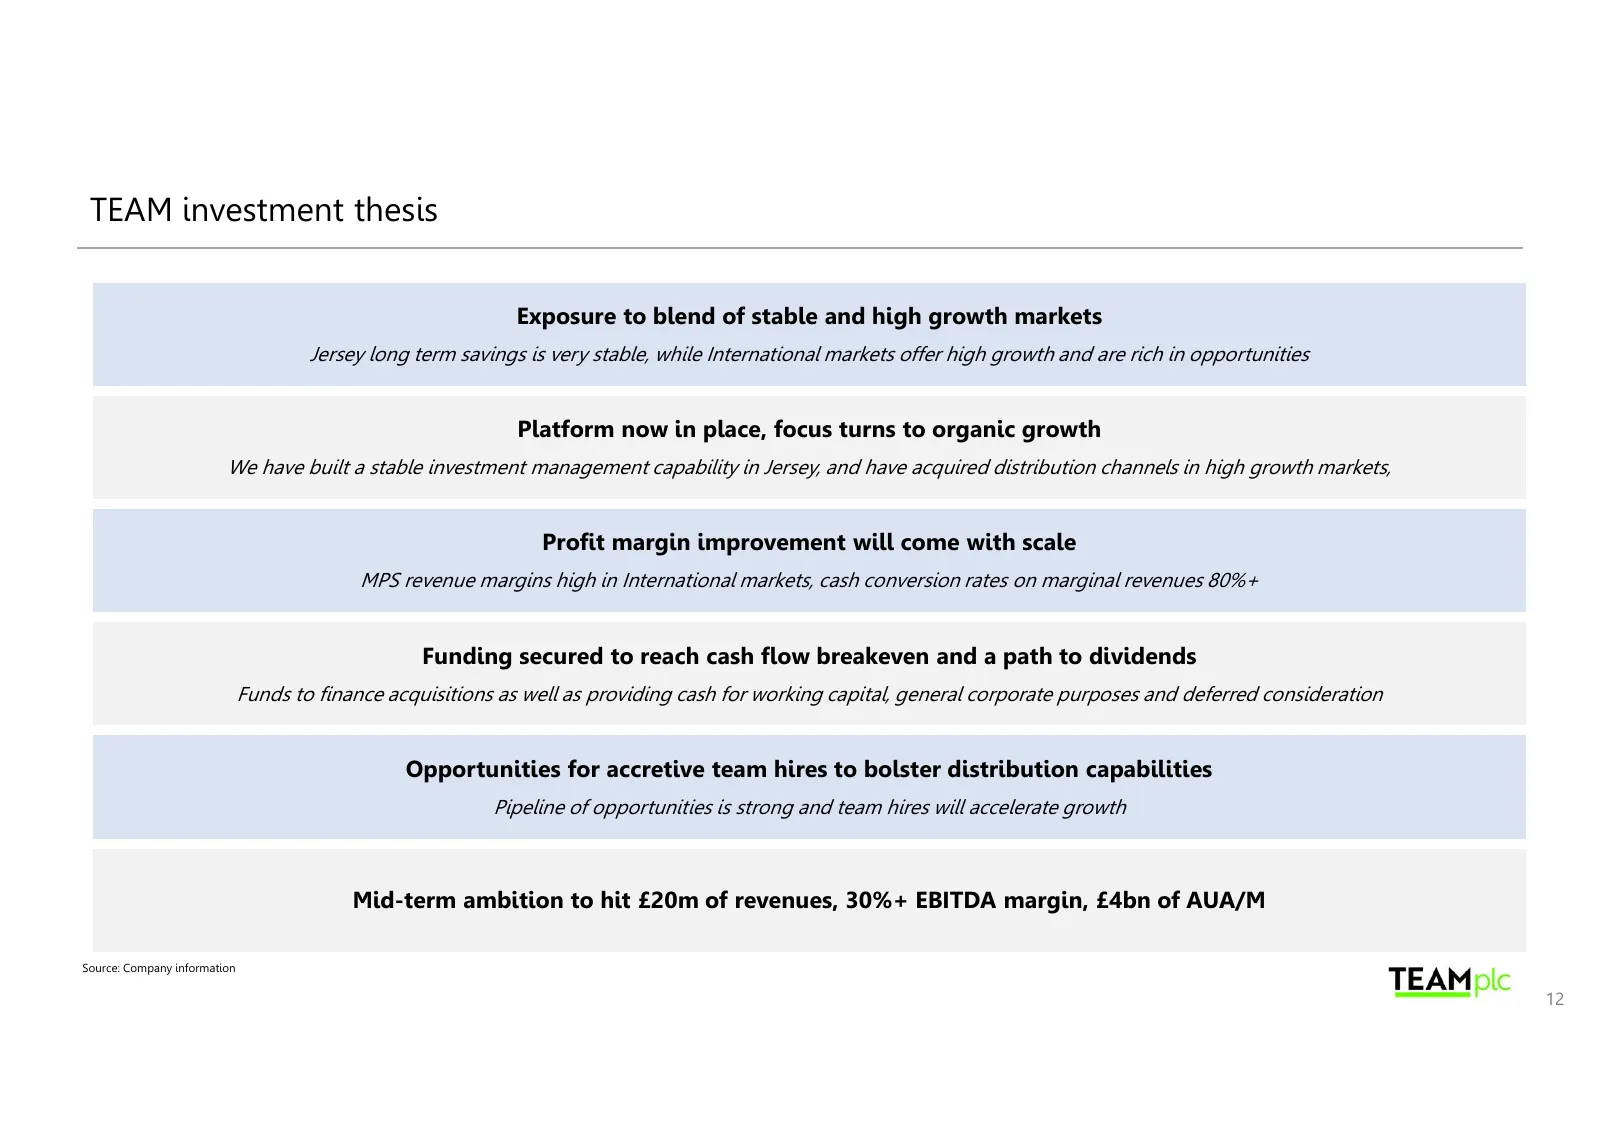
Slide 12: TEAM investment thesis
TEAM investment thesis Exposure to blend of stable and high growth markets Jersey long term savings is very stable, while International markets offer high growth and are rich in opportunities Platform now in place, focus turns to organic growth We have built a stable investment management capability
Source: company website
More decks from TEAM plc
 H1 2026 Earnings Presentation21 slides · June 2026
 H1 2025 Earnings Presentation18 slides · June 2025
 FY2024 Earnings Presentation12 slides · March 2025
 H1 2024 Earnings Presentation21 slides · June 2024
 FY2023 Earnings Presentation14 slides · March 2024
 H1 2023 Earnings Presentation14 slides · June 2023