United Financial Bancorp — Shareholder Meeting (May 2018)
11 slides from United Financial Bancorp's shareholder meeting presentation, May 17, 2018
Slide 1: Annual Shareholders Meeting Create Your Balance
Annual Shareholders Meeting Create Your Balance NASDAQ: UBNK
Slide 2: Forward Looking Statements
Forward Looking Statements This Presentation contains forward-looking statements that are within the meaning of the Private Securities Litigation Reform Act of 1995. Such statements are based upon the current beliefs and expectations of our management and are subject to significant risks and uncerta
Slide 3: Chief Executive Officer & President Presentation of Results
Chief Executive Officer & President Presentation of Results
Slide 4: Compound Annual Growth Rates (CAGR) 2010-2017
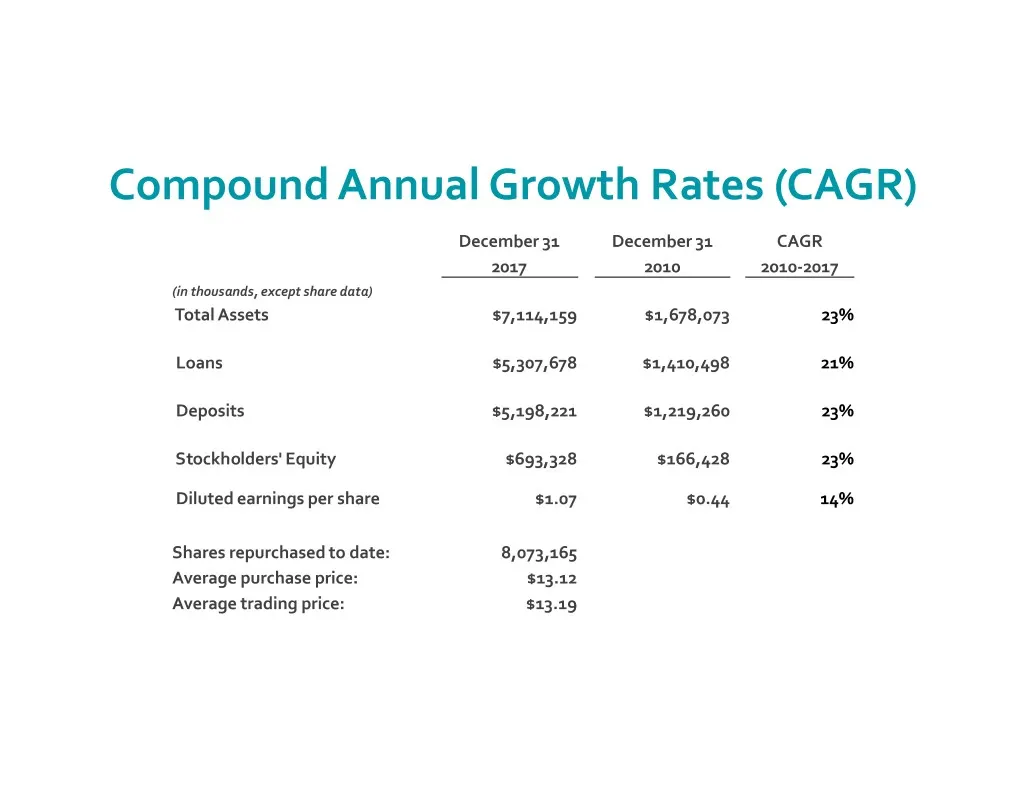
Compound Annual Growth Rates (CAGR) December 31 December 31 CAGR 2017 2010 2010-2017 (in thousands, except share data) Total Assets $7,114,159 $1,678,073 23% Loans $5,307,678 $1,410,498 21% Deposits $5,198,221 $1,219,260 23% Stockholders' Equity $693,328 $166,428 23% Diluted earnings per share $1.07
Slide 5: Selected Balance Sheet Data
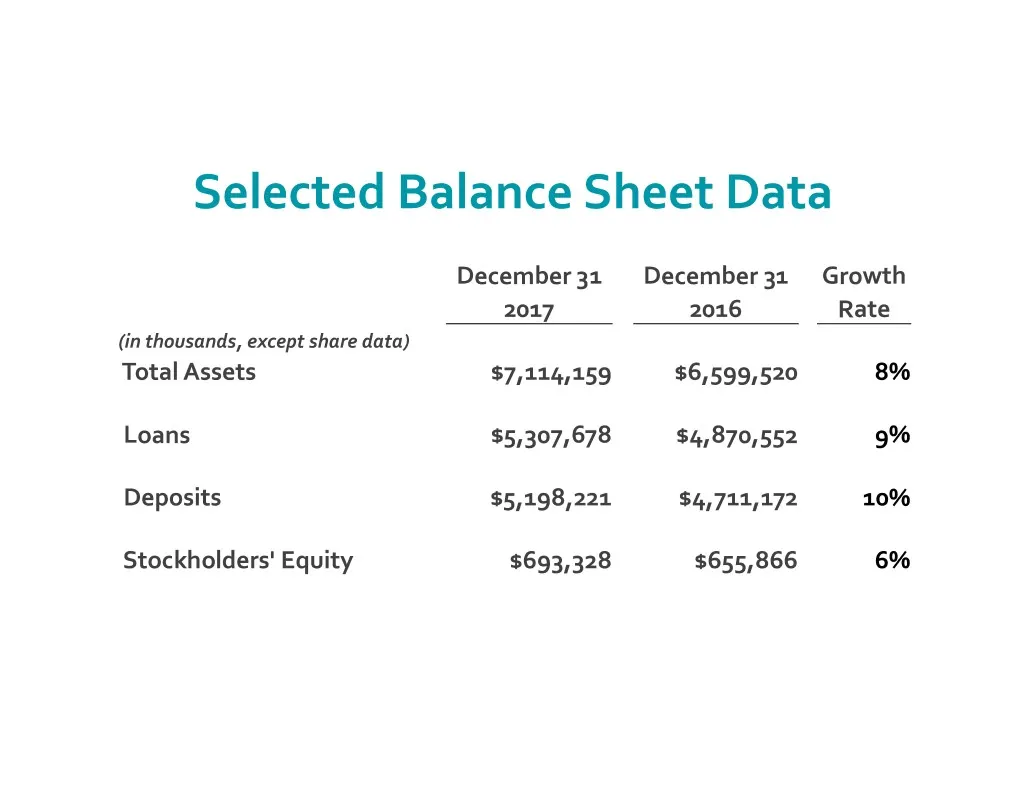
Selected Balance Sheet Data December 31 December 31 Growth 2017 2016 Rate (in thousands, except share data) Total Assets $7,114,159 $6,599,520 8% Loans $5,307,678 $4,870,552 9% Deposits $5,198,221 $4,711,172 10% Stockholders' Equity $693,328 $655,866 6%
Slide 6: Financial Performance FY 2017
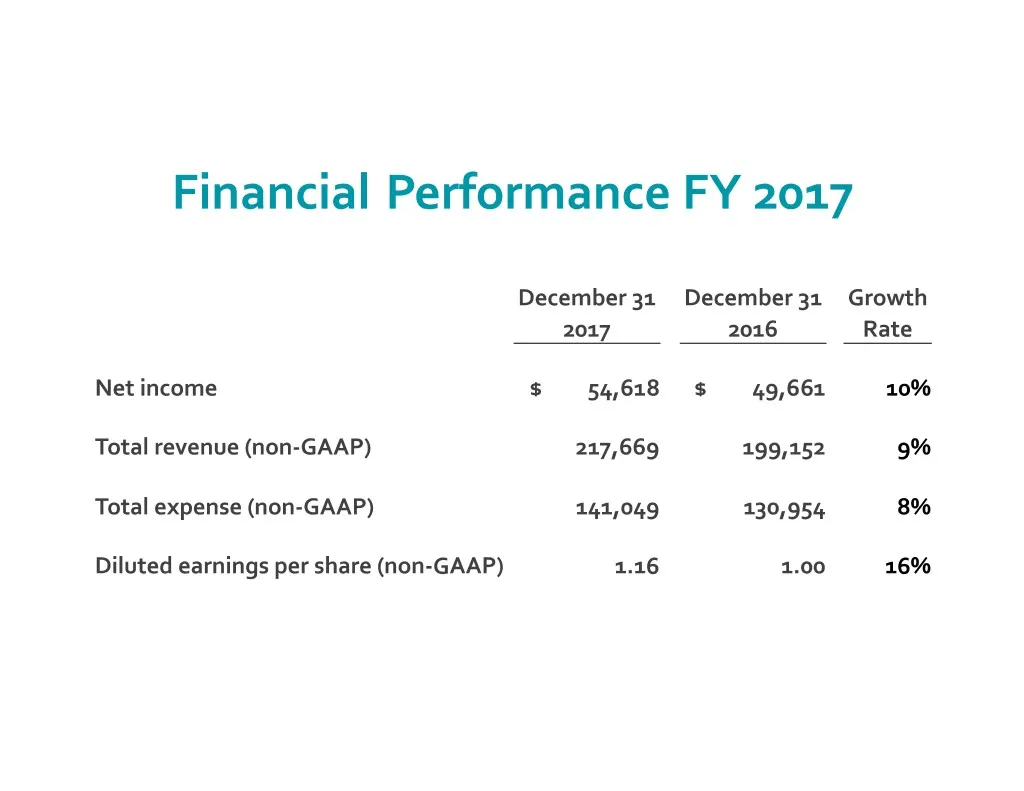
Financial Performance FY 2017 December 31 December 31 Growth 2017 2016 Rate Net income $ 54,618 $ 49,661 10% Total revenue (non-GAAP) 217,669 199,152 9% Total expense (non-GAAP) 141,049 130,954 8% Diluted earnings per share (non-GAAP) 1.16 1.00 16%
Slide 7: Total Shareholder Return (TSR)
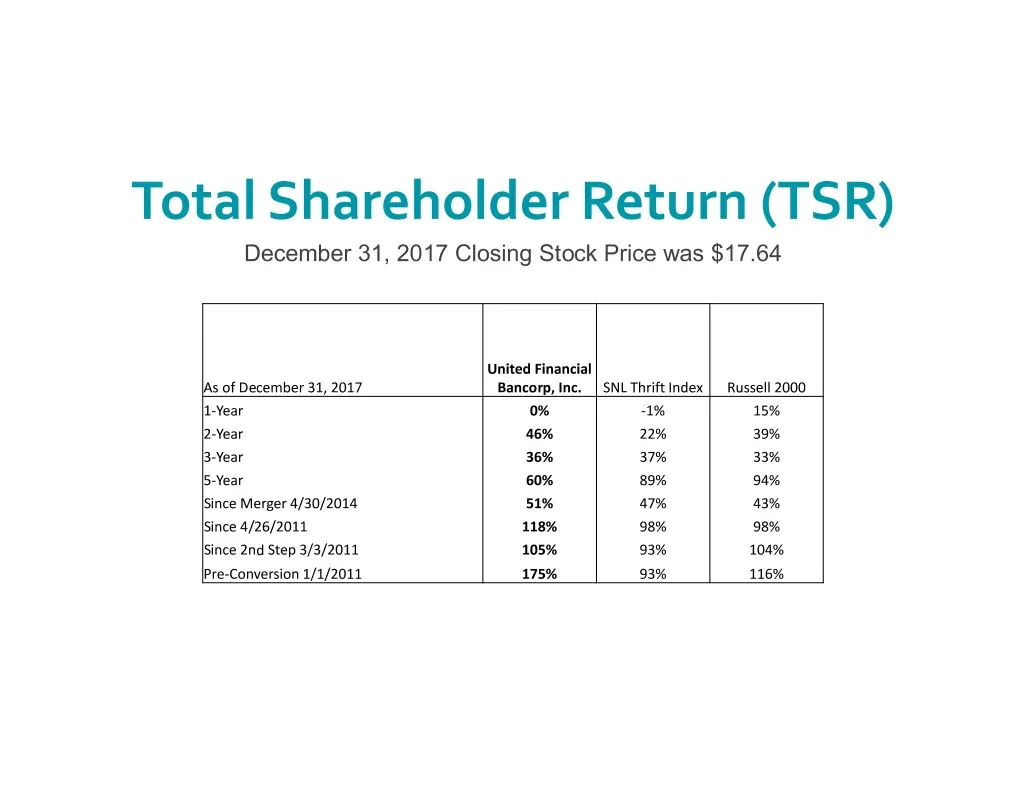
Total Shareholder Return (TSR) December 31, 2017 Closing Stock Price was $17.64 United Financial As of December 31, 2017 Bancorp, Inc. SNL Thrift Index Russell 2000 1-Year 0% -1% 15% 2-Year 46% 22% 39% 3-Year 36% 37% 33% 5-Year 60% 89% 94% Since Merger 4/30/2014 51% 47% 43% Since 4/26/2011 118% 98%
Slide 8: Four Key Objectives
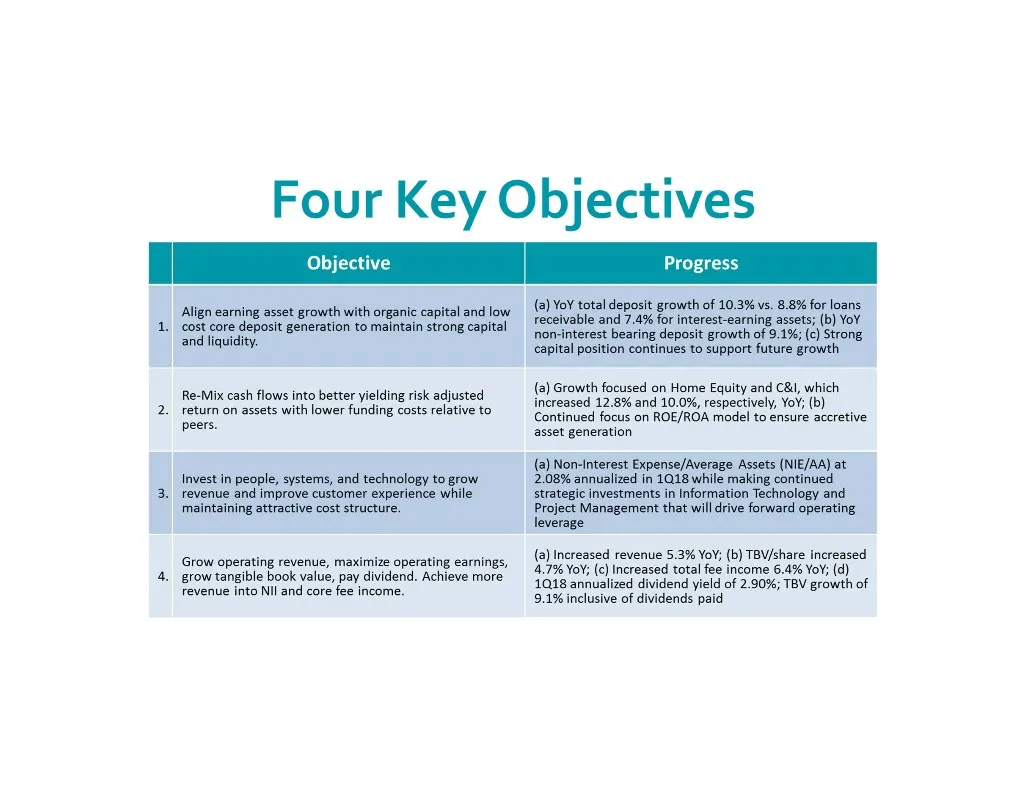
» - Four Key Objectives a | and liquidity. Re-Mix cash flows into better yielding risk adjusted return on assets with lower fur osts relative to peers. Invest in people, systems, and technology to grow revenue and improve customer experience while mee attractive cost structure. Grow operating revenu
Slide 9: Forecast
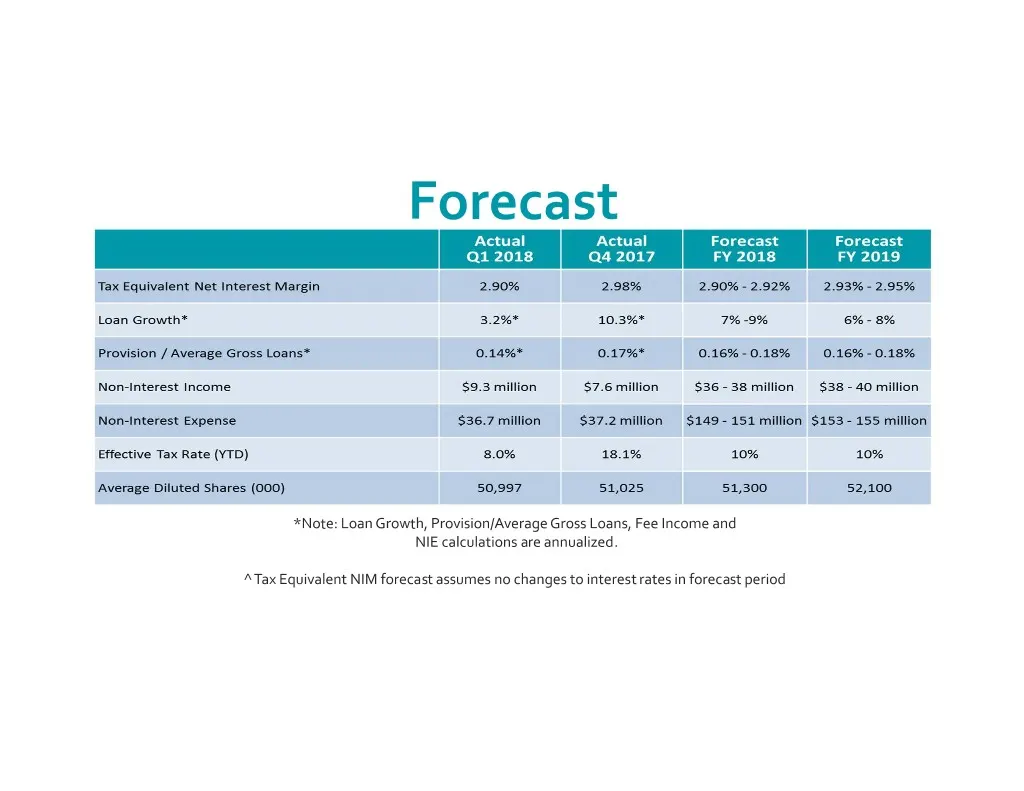
Forecast *Note: Loan Growth, Provision/Average Gross Loans, Fee Income and NIE calculations are annualized. ^ Tax Equivalent NIM forecast assumes no changes to interest rates in forecast period
Slide 10: Questions & Answers
Questions & Answers
Slide 11: Thank you for attending
Thank you for attending
Source: SEC EDGAR · 8-K filed May 17, 2018
More decks from United Financial Bancorp Inc
 Merger or Acquisition (July 2019)10 slides · Jul 15, 2019
 Shareholder Meeting (May 2019)14 slides · May 13, 2019
 Q1 2019 Earnings Presentation27 slides · Apr 16, 2019
 Q4 2018 Earnings Presentation26 slides · Jan 22, 2019
 Q3 2018 Earnings Presentation25 slides · Oct 16, 2018
 Q2 2018 Earnings Presentation25 slides · Jul 17, 2018