Ramtron International — Investor Presentation (November 2009)
19 slides from Ramtron International's investor presentation, Nov 3, 2009
Slide 1: Investor Presentation
Investor Presentation November
Slide 2: Cautionary Statements
Cautionary Statements • Except for historical information, statements made in the course of this presentation that state the company’s or management’s intentions, hopes, beliefs, expectations, targets, or predictions of the future are forward-looking statements that involve risks and uncertainties.
Slide 3: Investment Highlights
• F-RAM pioneer and technology leader • Established base of F-RAM memory business • Executing strategy to grow revenue substantially in the near term, reach $200+ million in revenue long-term – Leverage F-RAM features to exploit emerging market opportunities – New foundry model – Execute cost-down i
Slide 4: The F-RAM Technology Advantage
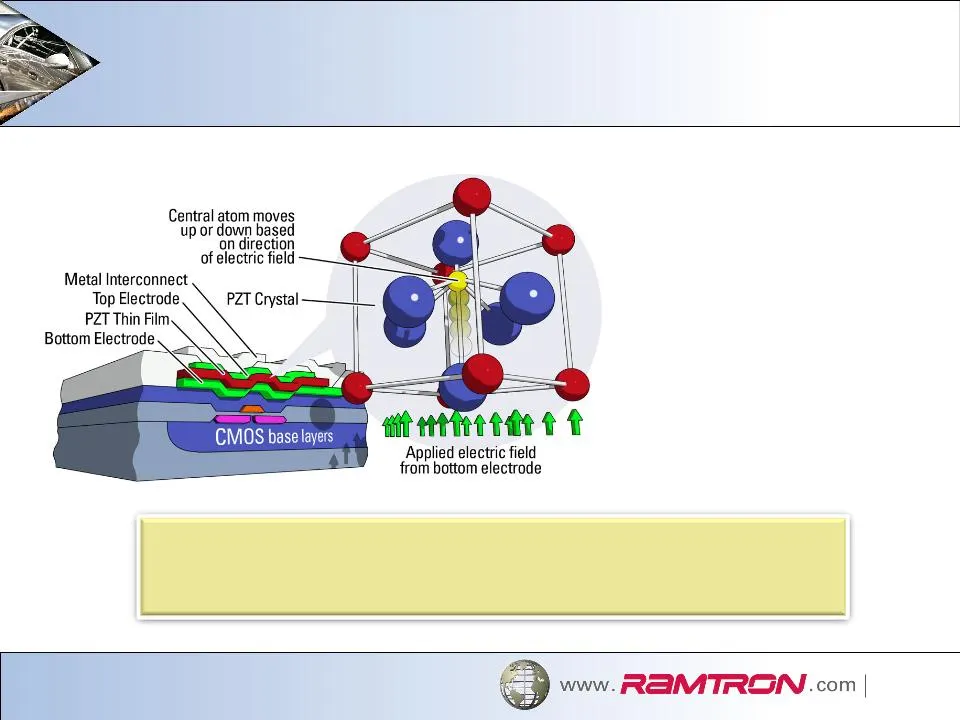
The F-RAM Technology Advantage F-RAM Memory: Writes data… • 500x faster and • 10,000x more often with • 3000x less power …than older nonvolatile memory technologies Ultra low power F-RAM can be written to 26,000 times more with the same TOTAL ENERGY compared to EEPROM, enabling more data logging in
Slide 5: Ramtron Footprint
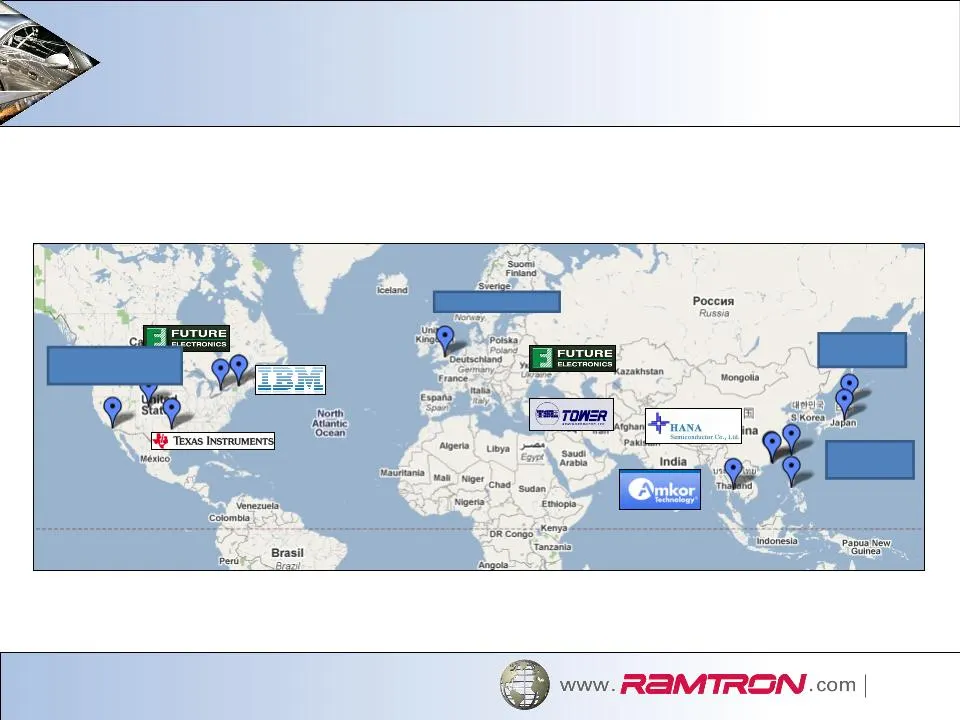
Ramtron UK Ramtron Japan Ramtron China Ramtron North America Worldwide footprint with world-class strategic partners and service providers Ramtron Footprint
Slide 6: Established Presence in Key Verticals
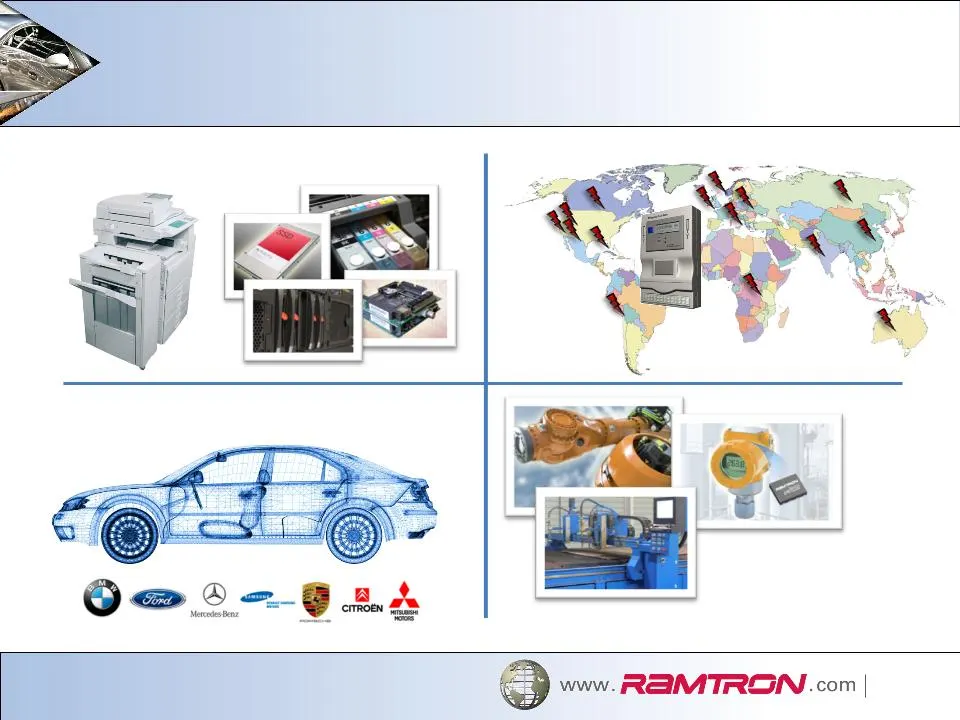
Established Presence in Key Verticals Computing 37% of Revenue* Metering 23% of Revenue* Automotive 14% of Revenue* Industrial & Medical 26% of Revenue* * Percentages approximate for full-year 2008
Slide 7: Proven Ability to Rapidly Layer New Products
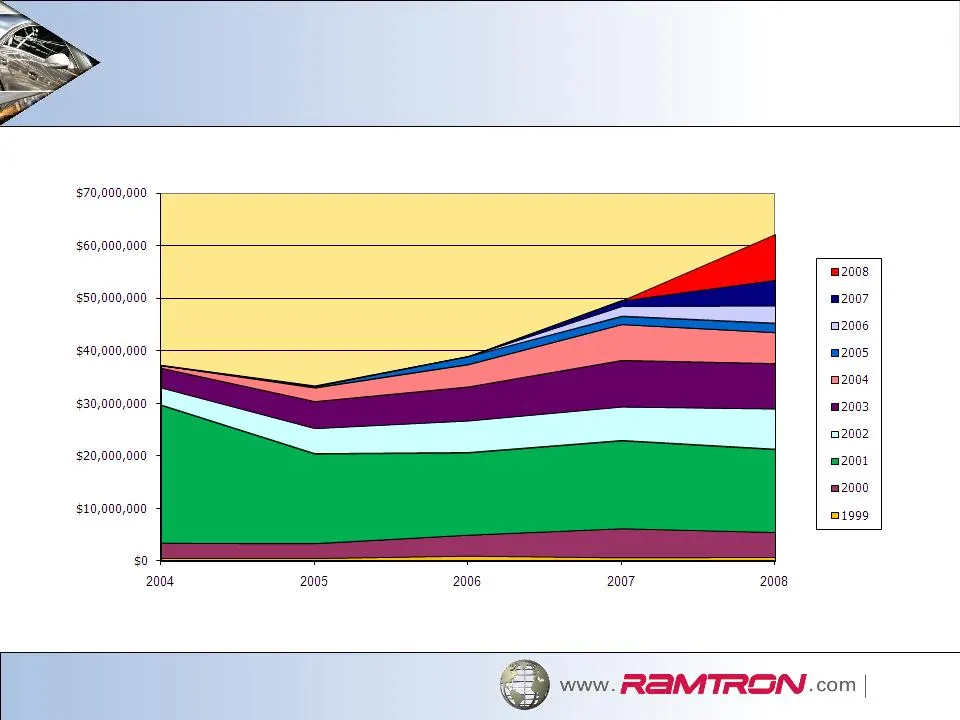
Proven Ability to Rapidly Layer New Products
Slide 8: Strong Historical Results
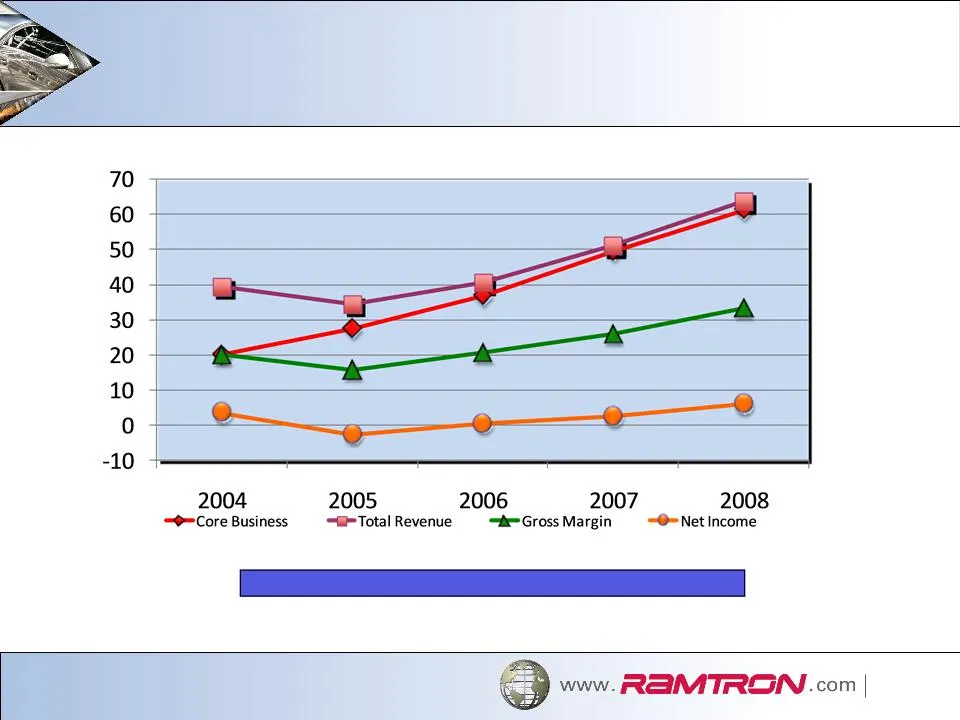
Net Income (loss) is from continuing operations and before income tax provision (1) Strong Historical Results (1) ($M) Excludes sales to Enel Please see slide 9 for YTD 2009 information
Slide 9: Q3 and YTD 2009 Financial Highlights
3Q2009 YTD 2009 Revenue $11,596 $33,118 Gross Product Margin 53% 49% Net Income $131 $(6,582) Cash $4,736 $4,736 Debt $6,745 $6,745 Q3 and YTD 2009 Financial Highlights (In Thousands)
Slide 10: Market Trends and Opportunities
Market Trends Opportunities Product Metering • Electromechanical to digital smart meters • Multiphase and high function residential meters • Memory • Integrated • Wireless Automotive • Longer vehicle life • Consumer/regulatory safety requirements • Fuel efficiency • Infotainment • Increase in automo
Slide 11: Foundry Strategy for Improved Manufacturing Economics and Growth
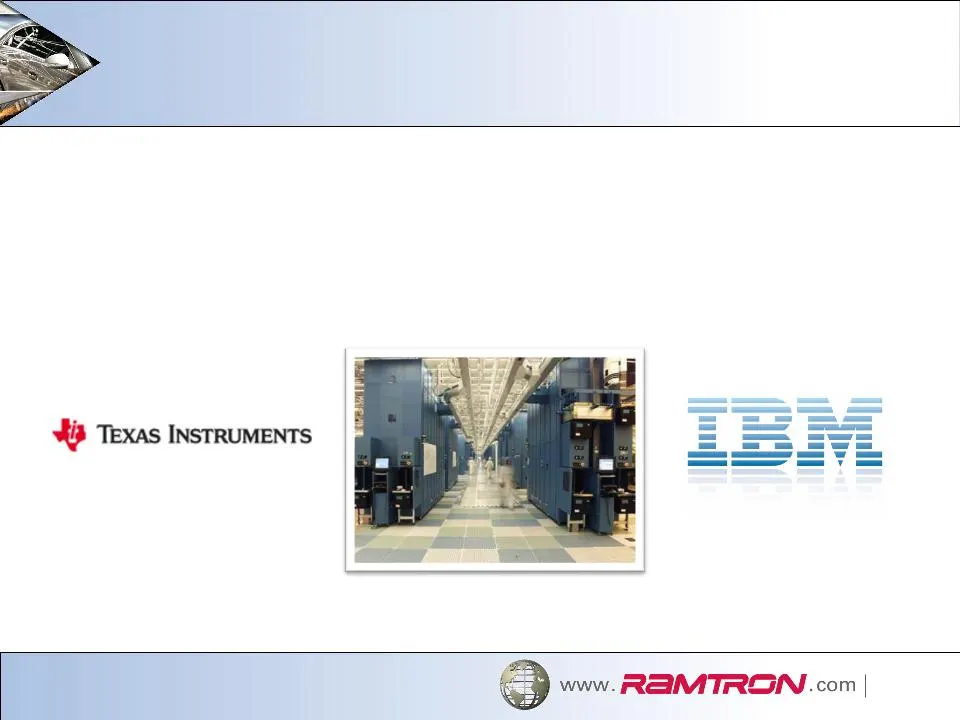
Foundry Strategy for Improved Manufacturing Economics and Growth • TI and IBM offer full array of product manufacturing capabilities • New products to boast improved features and performance • Existing products become more competitive • Engineering silicon currently in the line at IBM The TI and IBM
Slide 12: Product Roadmap to Leverage Low Power F-RAM Advantage
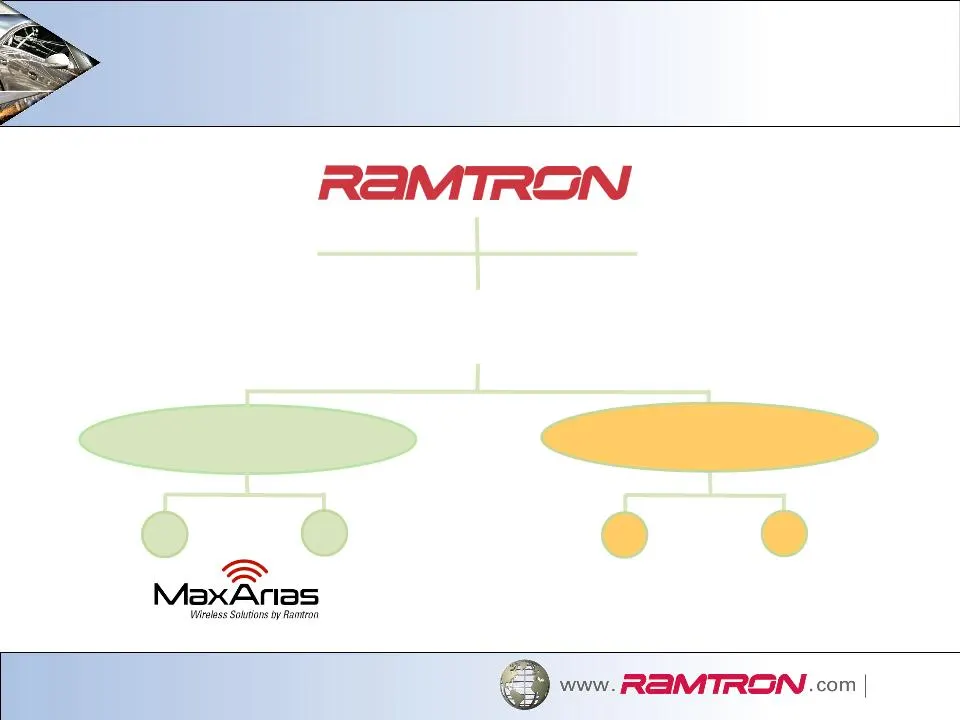
Product Roadmap to Leverage Low Power F-RAM Advantage Integrated Memory F-RAM Memory Technology Flexible System Architecture Embedded Wireless Products Embedded System Products F-RAM based RFID Wireless Memory Intelligent Ultra-Low Power Semiconductors TM
Slide 13: Wireless Initiative Gaining Momentum
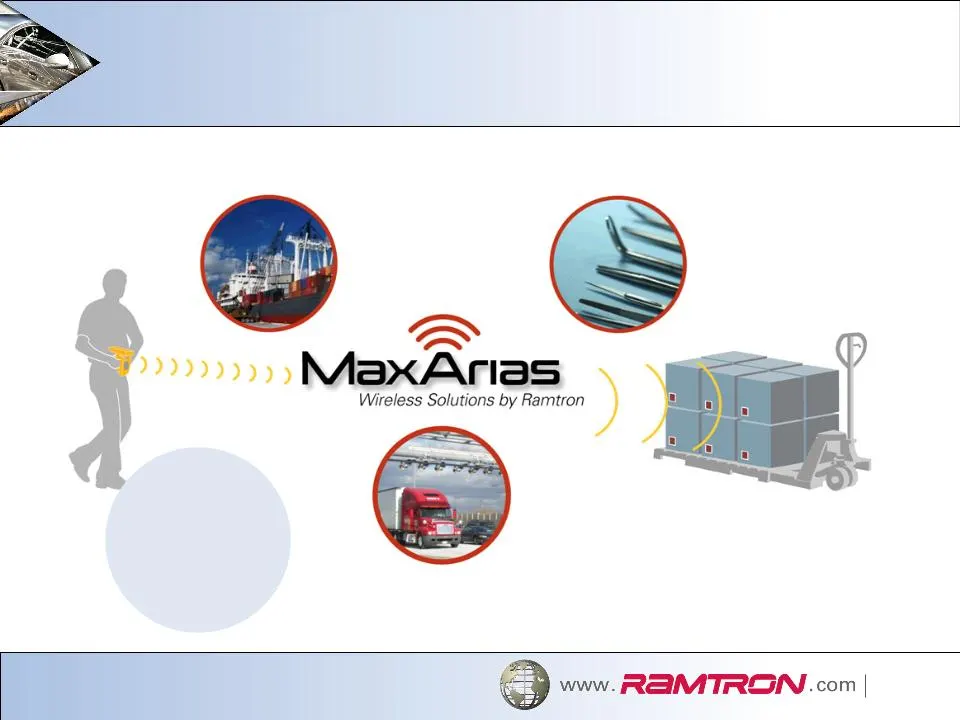
Wireless Initiative Gaining Momentum From shipping… To surgical instrument tracking… To electronic tolls… and more Breakthrough wireless memory technology that enables applications beyond traditional RFID
Slide 14: Passive RFID Market
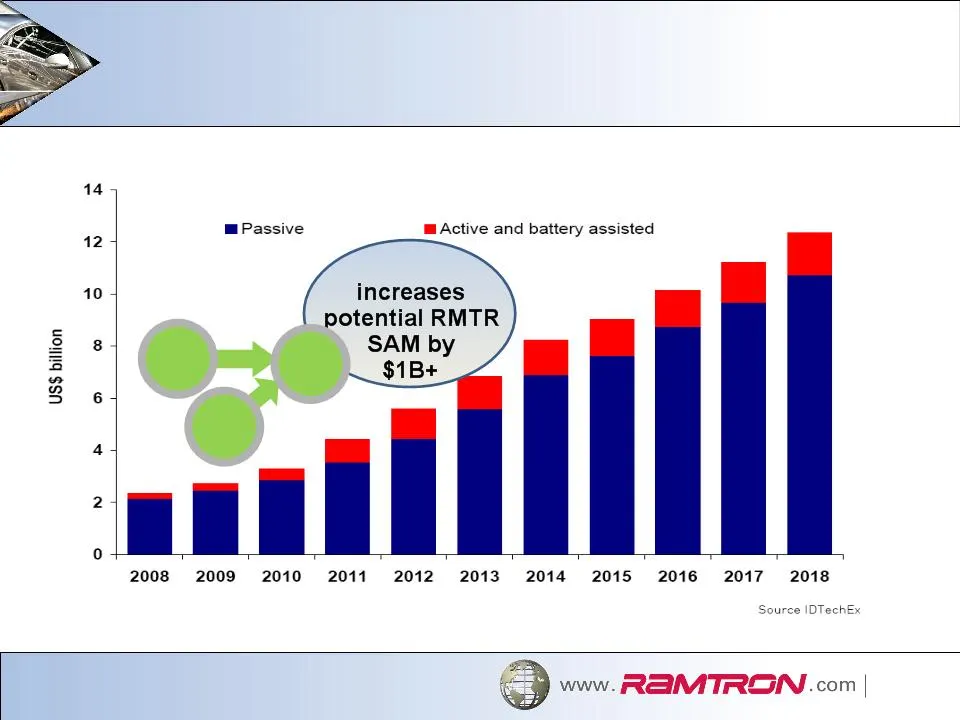
Passive RFID Market RFID RFID SAM $0.98B HF Tag TAM $1.19B UHF Tag TAM $0.98B
Slide 15: Product and Technology Roadmap
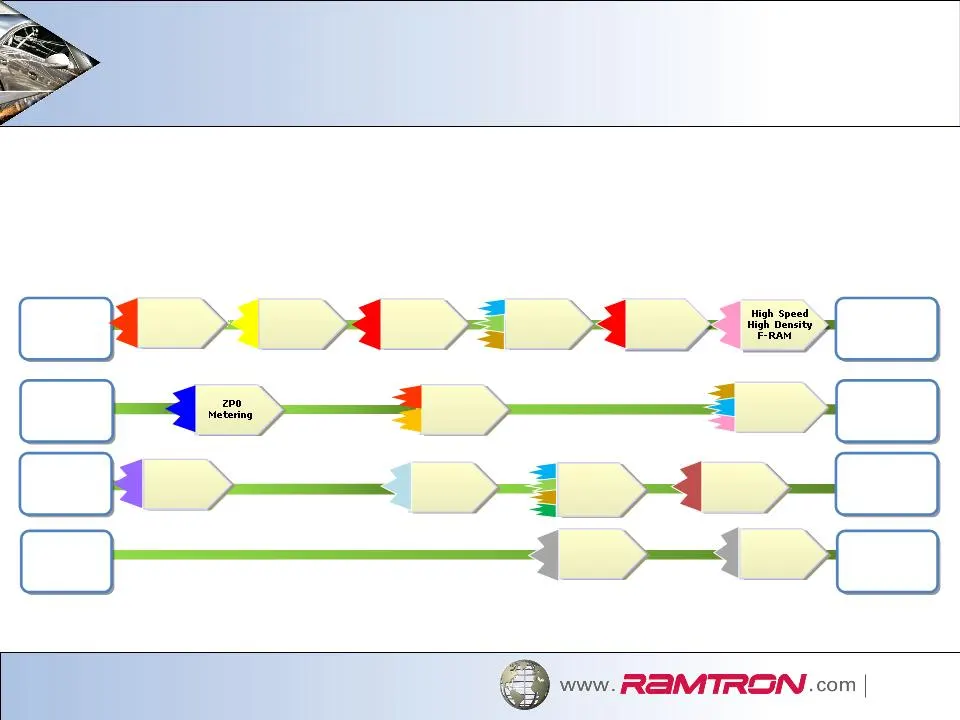
Product and Technology Roadmap Plain Memory Integrated Wireless Memory MCU High Density F-RAM ZP1 Metering Gen2 RFID With Security Active Tag ZP2 Secure New MCU 60xx Family ULP Memory Gen2 UHF RFID ULV/ULP Memory Secure Memory HF Secure RFID High Density ULP Memory New MCU 40xx/50xx Family High- Spe
Slide 16: Future initiatives to drive further reduction
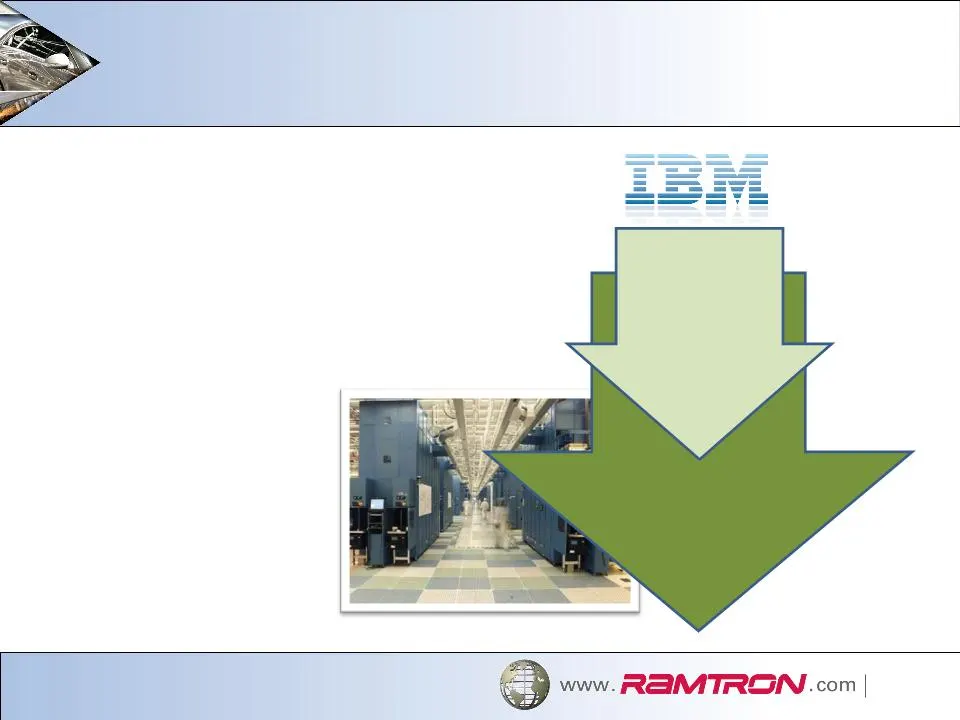
Future initiatives to drive further reduction Cost Down Initiative with IBM • Phase-1 IBM initiative to drive 30% to 40% COGs reduction on existing F-RAM memory products • Future initiatives to drive further COGs reduction Phase-1 IBM up to 40% reduction COGs
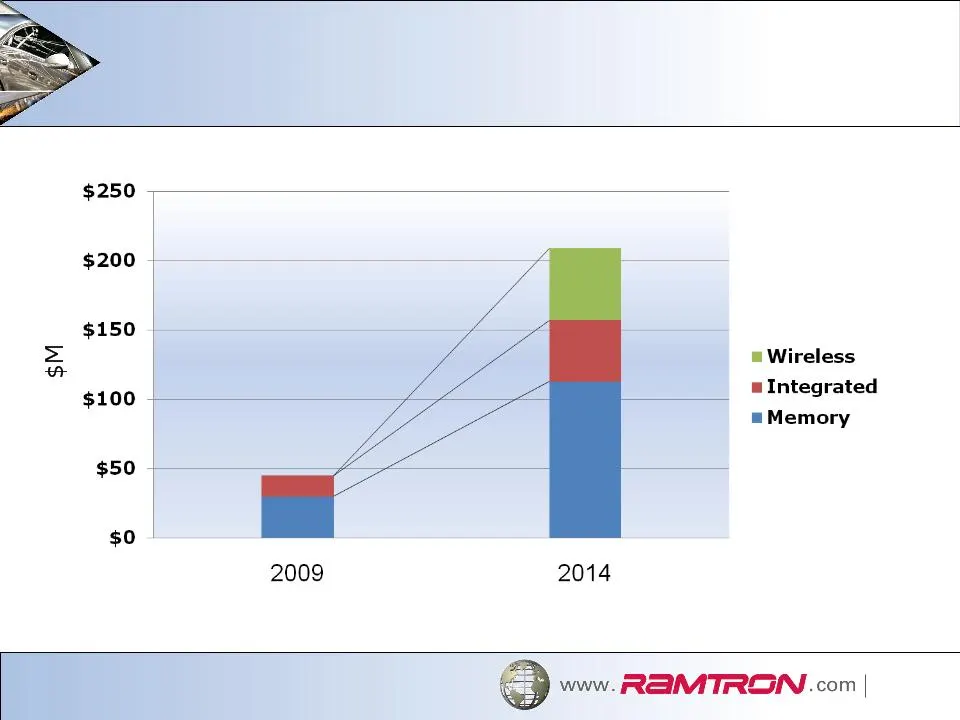
Slide 17: Target Product Revenue Mix 2009/2014
Target Product Revenue Mix 2009/2014 Copyright © 2009. Ramtron International Corp. All rights reserved.
Slide 18: Revenue Growth and Operating Targets
Revenue/Operating Target Total revenue $100M+ $200M+ Gross margin 53%-55% 54%-56% Research & develop. 15%-17% 13%-15% Sales and mktg. 11%-13% 10%-12% General and admin. 6%-8% 4%-6% Net income after tax 9%-11% 13%-15% Revenue Growth and Operating Targets
Slide 19: Summary
Summary • Strong foundation - design expertise, established distribution channels, F-RAM leadership • Proven product layering strategy for growth • Expansion of market opportunities underway with new product and IP initiatives • Enhanced operating dynamics within reach through foundry initiative
Source: SEC EDGAR · 8-K filed Nov 3, 2009