HCC Insurance — Q1 2011 Earnings Presentation
19 slides from HCC Insurance's earnings presentation, Jul 7, 2011
Slide 1: HCC Insurance Holdings, Inc. First Quarter 2011 Investor Presentation
HCC Insurance Holdings, Inc. First Quarter 2011 Investor Presentation J l 7 July 7, 2011
Slide 2: Notice About This Presentation
See Notice About This Presentation Notice About This Presentation ABOUT FORWARD-LOOKING STATEMENTS: This presentation contains certain “forward-looking statements” within the meaning of Section 27A of the Securities Act of 1933 and Section 21E of the Securities Exchange Act of 1934, which are intend
Slide 3: HCC Overview
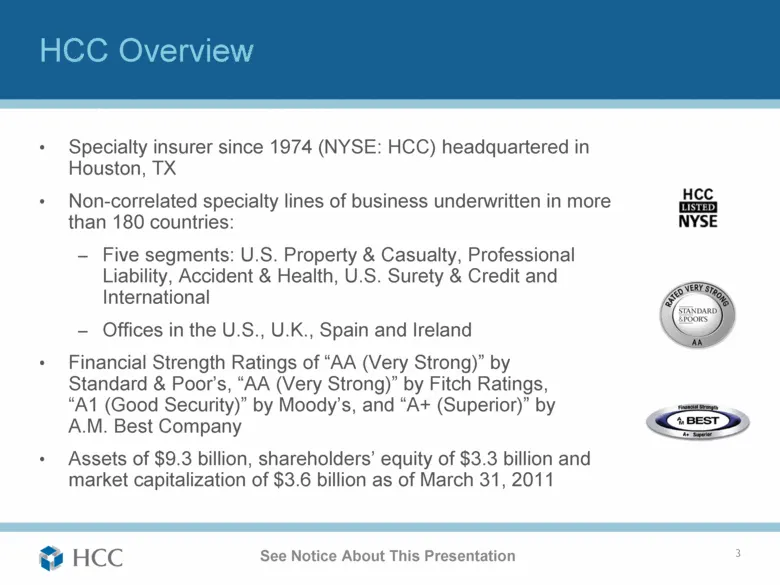
See Notice About This Presentation HCC Overview Specialty insurer since 1974 (NYSE: HCC) headquartered in Houston, TX Non-correlated specialty lines of business underwritten in more than 180 countries: Five segments: U.S. Property & Casualty, Professional Liability, Accident & Health, U.S. Surety &
Slide 4: YTD 2011 Operating Highlights
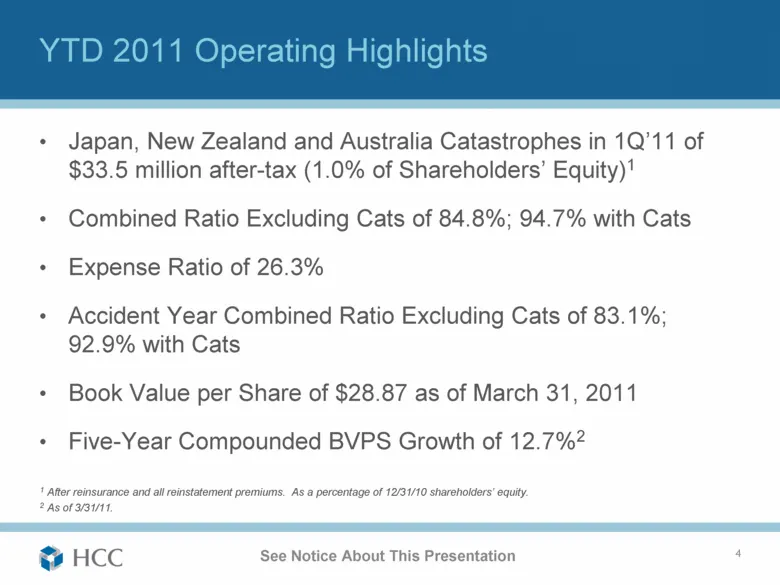
See Notice About This Presentation YTD 2011 Operating Highlights Japan, New Zealand and Australia Catastrophes in 1Q’11 of $33.5 million after-tax (1.0% of Shareholders’ Equity)1 Combined Ratio Excluding Cats of 84.8%; 94.7% with Cats Expense Ratio of 26.3% Accident Year Combined Ratio Excluding Cat
Slide 5: Segment Overview
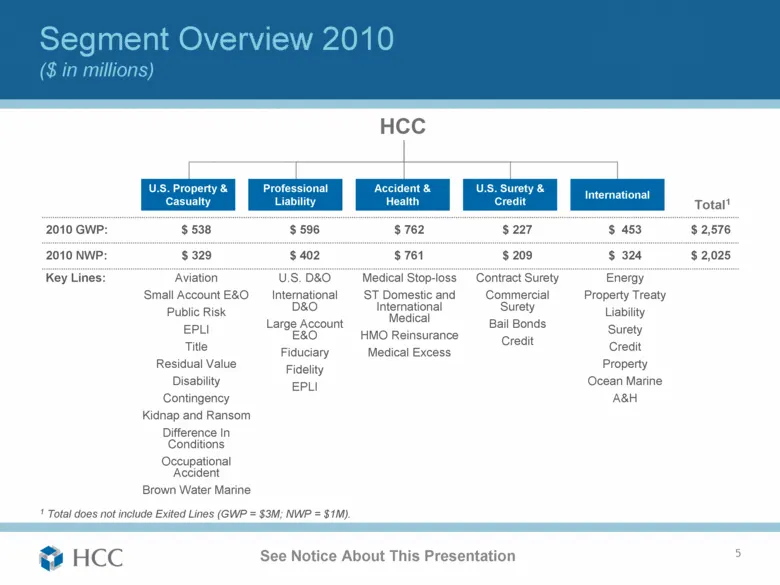
See Notice About This Presentation Segment Overview 2010 ($ in millions) 5 1 Total does not include Exited Lines (GWP = $3M; NWP = $1M). Total1 2010 GWP: $ 538 $ 596 $ 762 $ 227 $ 453 $ 2,576 2010 NWP: $ 329 $ 402 $ 761 $ 209 $ 324 $ 2,025 Key Lines: Aviation Small Account E&O Public Risk EPLI Title
Slide 6: Segment Comparison 2010
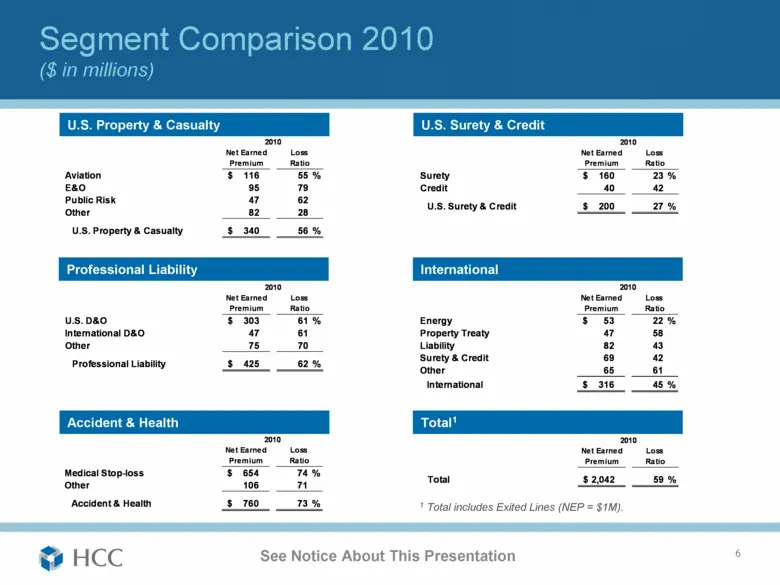
Segment Comparison 2010 ($ in millions) Net Earned Premium 2010 Loss Ratio U.S. Property & Casualty U.S. Surety & Credit Net Earned Premium 2010 Loss Ratio Aviation 116 $ 55 % E&O 95 79 Public Risk 47 62 Other 82 28 U.S. Property & Casualty 340 $ 56 % Surety 160 $ 23 % Credit 40 42 U.S. Surety & Cre
Slide 7: Segment Comparison YTD 1Q'11
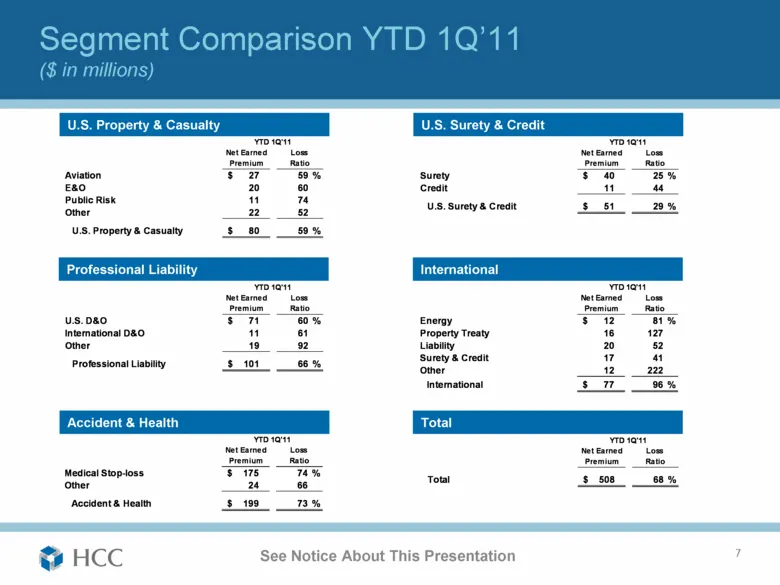
Segment Comparison YTD 1Q’11 ($ in millions) Net Earned Premium YTD 1Q'11 Loss Ratio U.S. Property & Casualty U.S. Surety & Credit Net Earned Premium YTD 1Q'11 Loss Ratio Aviation 27 $ 59 % E&O 20 60 Public Risk 11 74 Other 22 52 U.S. Property & Casualty 80 $ 59 % Surety 40 $ 25 % Credit 11 44 U.S.
Slide 8: Historical Performance
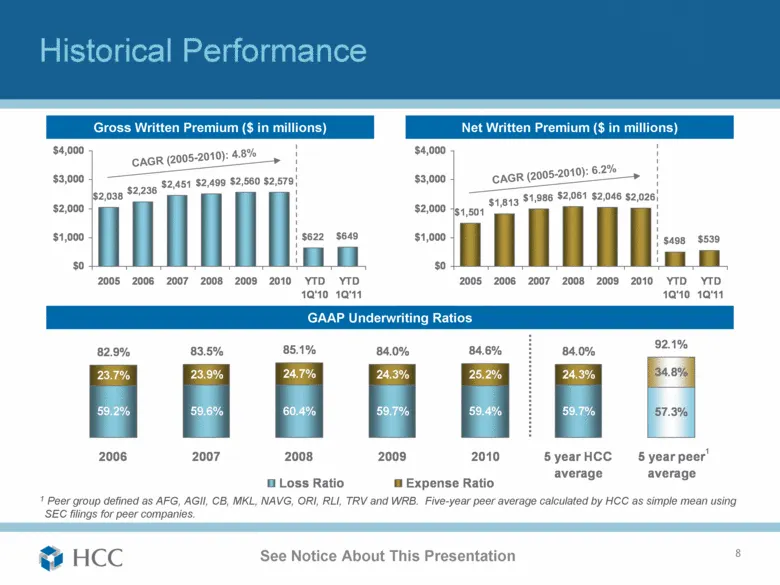
See Notice About This Presentation Historical Performance 8 1 Peer group defined as AFG, AGII, CB, MKL, NAVG, ORI, RLI, TRV and WRB. Five-year peer average calculated by HCC as simple mean using SEC filings for peer companies. Gross Written Premium ($ in millions) GAAP Underwriting Ratios Net Writte
Slide 9: YTD 1Q'11 Underwriting Performance
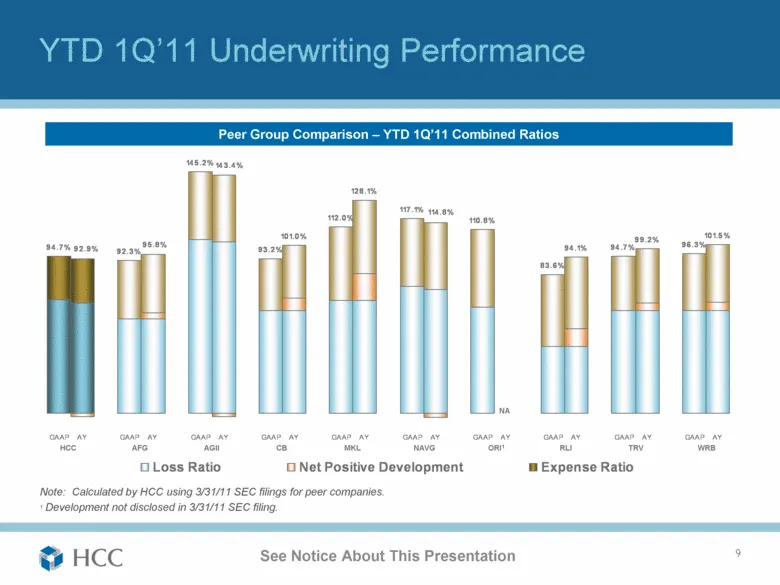
See Notice About This Presentation YTD 1Q’11 Underwriting Performance 9 HCC AGII MKL NAVG ORI1 WRB AFG RLI CB TRV Note: Calculated by HCC using 3/31/11 SEC filings for peer companies. 1 Development not disclosed in 3/31/11 SEC filing. Peer Group Comparison – YTD 1Q’11 Combined Ratios NA 94.7% 92.3%
Slide 10: Strong BVPS Growth
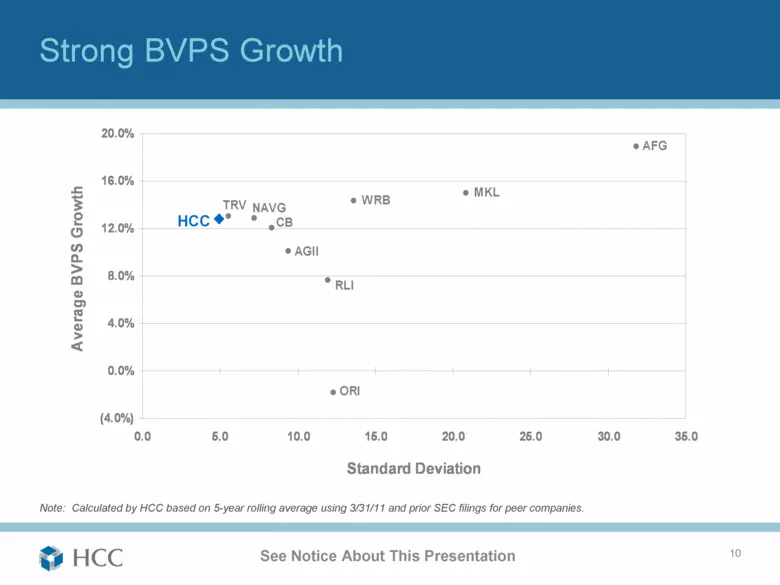
See Notice About This Presentation Strong BVPS Growth 10 Note: Calculated by HCC based on 5-year rolling average using 3/31/11 and prior SEC filings for peer companies. WRB HCC AGII CB MKL NAVG RLI TRV AFG ORI (4.0%) 0.0% 4.0% 8.0% 12.0% 16.0% 20.0% 0.0 5.0 10.0 15.0 20.0 25.0 30.0 35.0 Standard Dev
Slide 11: Characteristics That Make HCC Unique
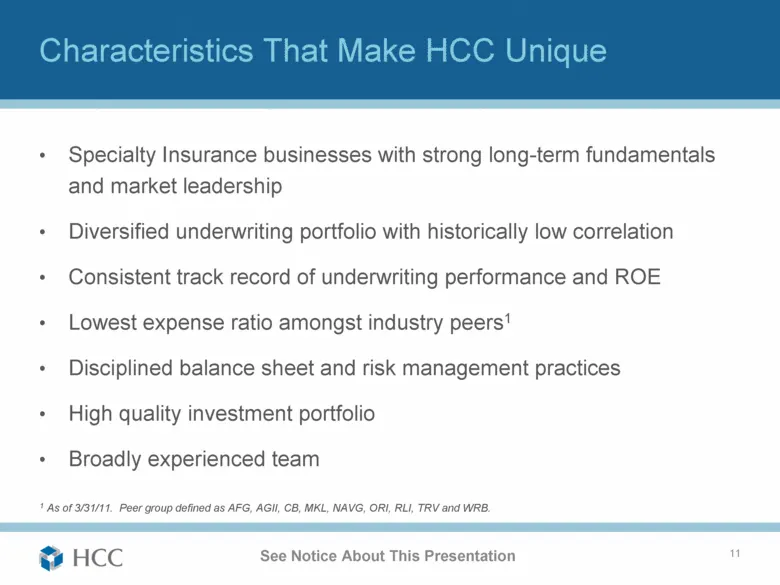
See Notice About This Presentation Characteristics That Make HCC Unique Specialty Insurance businesses with strong long-term fundamentals and market leadership Diversified underwriting portfolio with historically low correlation Consistent track record of underwriting performance and ROE Lowest expe
Slide 12: Effective Catastrophe Management
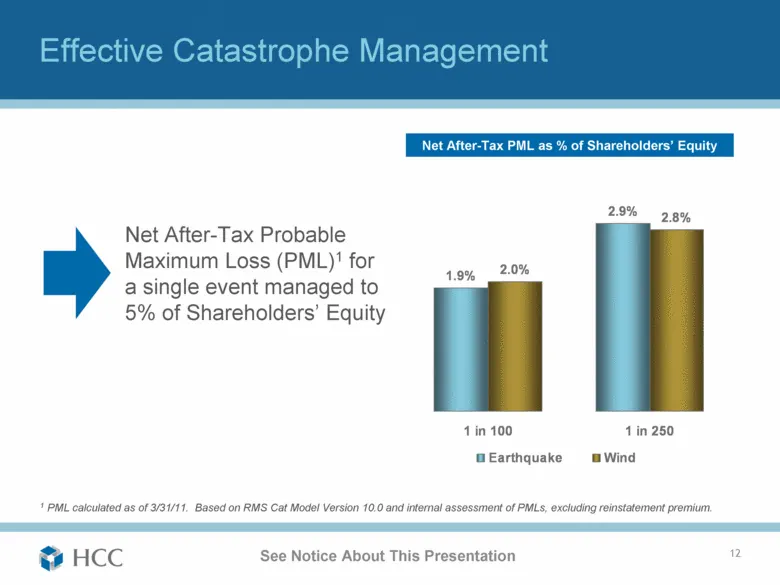
See Notice About This Presentation Effective Catastrophe Management 12 1 PML calculated as of 3/31/11. Based on RMS Cat Model Version 10.0 and internal assessment of PMLs, excluding reinstatement premium. Net After-Tax Probable Maximum Loss (PML)1 for a single event managed to 5% of Shareholders’ Eq
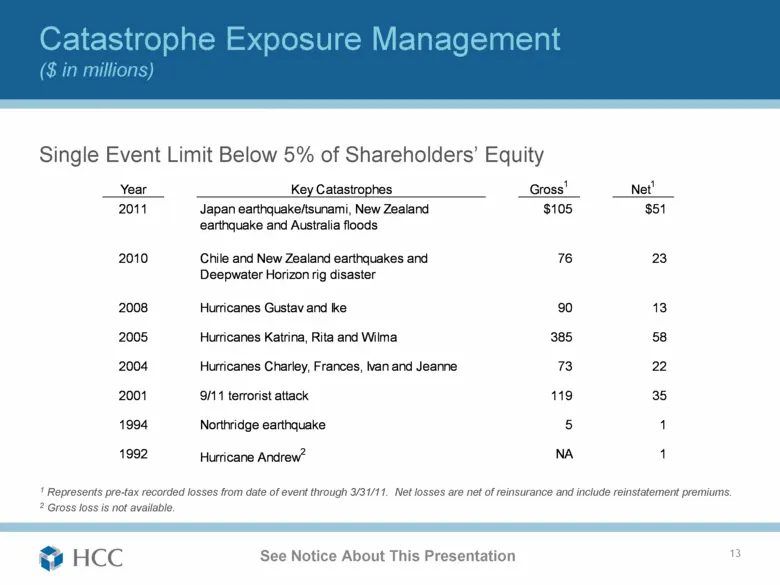
Slide 13: Catastrophe Exposure Management
Single Event Limit Below 5% of Shareholders’ Equity See Notice About This Presentation Catastrophe Exposure Management ($ in millions) 13 1 Represents pre-tax recorded losses from date of event through 3/31/11. Net losses are net of reinsurance and include reinstatement premiums. 2 Gross loss is not
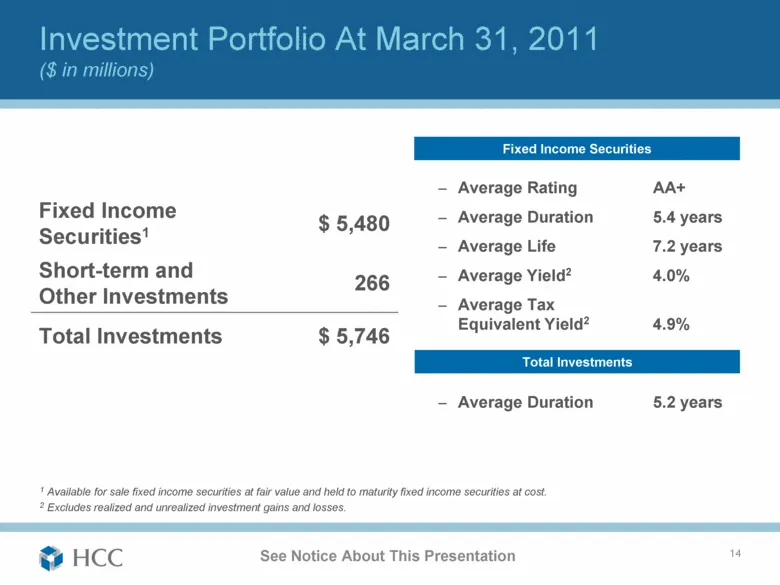
Slide 14: Investment Portfolio
See Notice About This Presentation Investment Portfolio At March 31, 2011 ($ in millions) 14 1 Available for sale fixed income securities at fair value and held to maturity fixed income securities at cost. 2 Excludes realized and unrealized investment gains and losses. Average Rating AA+ Average Dur
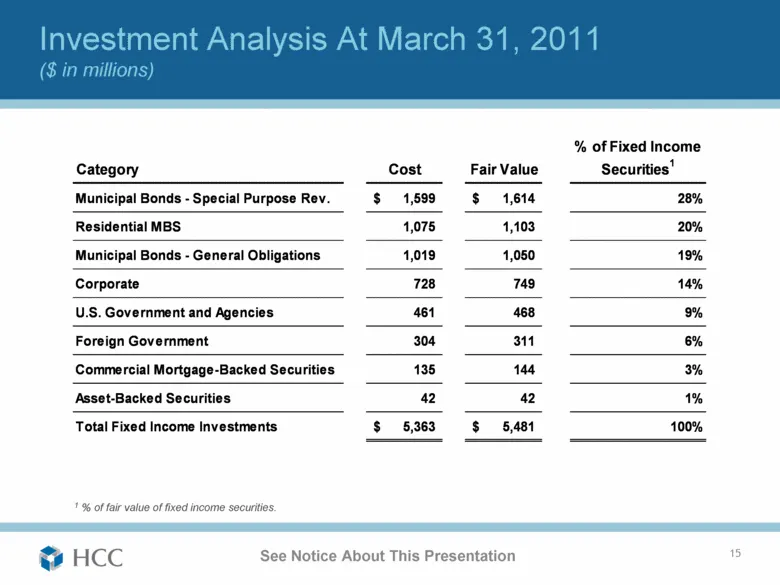
Slide 15: Investment Analysis
See Notice About This Presentation Investment Analysis At March 31, 2011 ($ in millions) 15 1 % of fair value of fixed income securities. Category Cost Fair Value % of Fixed Income Securities 1 Municipal Bonds - Special Purpose Rev. 1,599 $ 1,614 $ 28% Residential MBS 1,075 1,103 20% Municipal Bonds
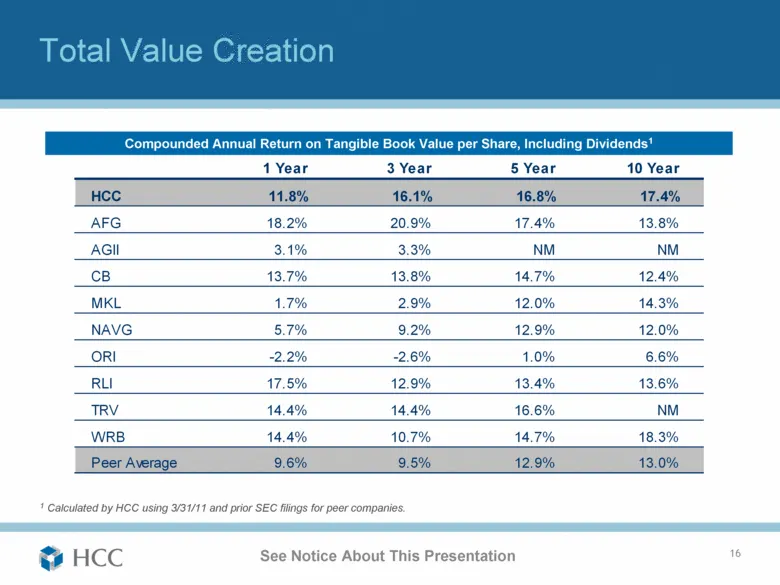
Slide 16: Total Value Creation
See Notice About This Presentation Total Value Creation 16 1 Calculated by HCC using 3/31/11 and prior SEC filings for peer companies. Compounded Annual Return on Tangible Book Value per Share, Including Dividends1 1 Year 3 Year 5 Year 10 Year HCC 11.8% 16.1% 16.8% 17.4% AFG 18.2% 20.9% 17.4% 13.8%
Slide 17: Lowest Financial Leverage Of Peer Group
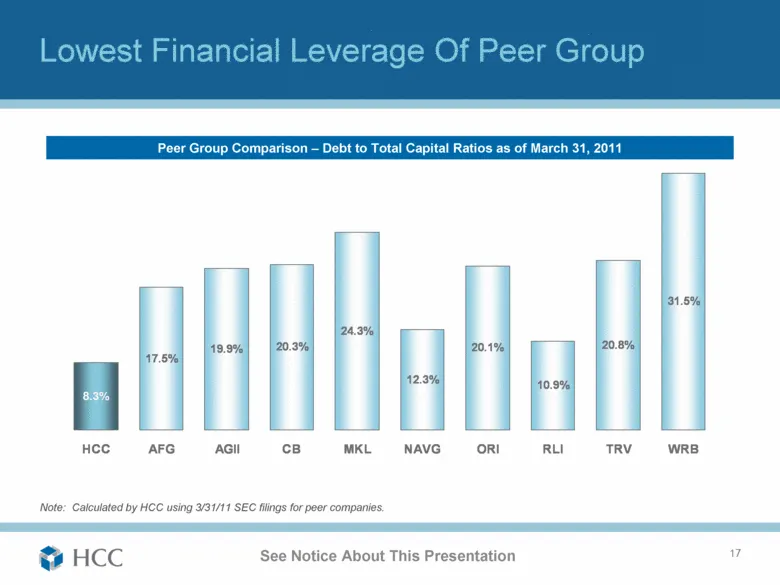
See Notice About This Presentation Lowest Financial Leverage Of Peer Group 17 Note: Calculated by HCC using 3/31/11 SEC filings for peer companies. Peer Group Comparison – Debt to Total Capital Ratios as of March 31, 2011 17.5% 19.9% 20.3% 24.3% 12.3% 20.1% 10.9% 20.8% 31.5% 8.3% HCC AFG AGII CB MKL
Slide 18: Quality Reinsurance Security
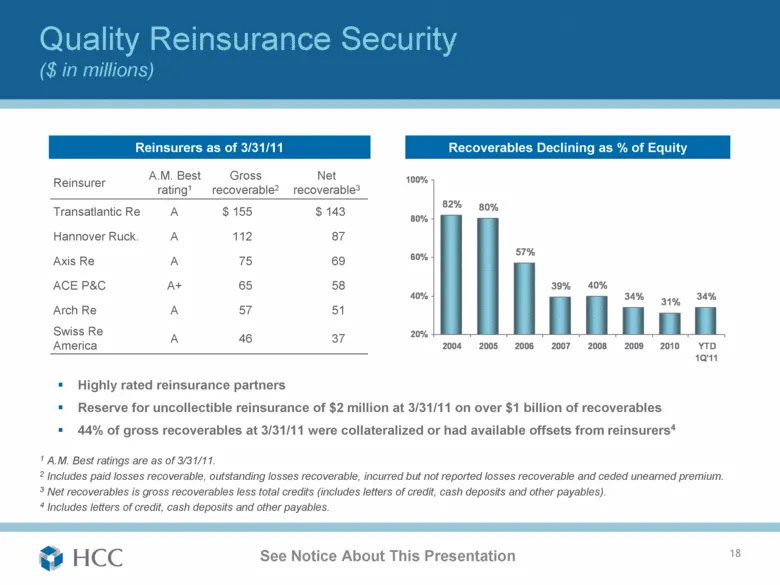
See Notice About This Presentation Quality Reinsurance Security ($ in millions) 18 1 A.M. Best ratings are as of 3/31/11. 2 Includes paid losses recoverable, outstanding losses recoverable, incurred but not reported losses recoverable and ceded unearned premium. 3 Net recoverables is gross recoverab
Slide 19: HCC's Value Proposition
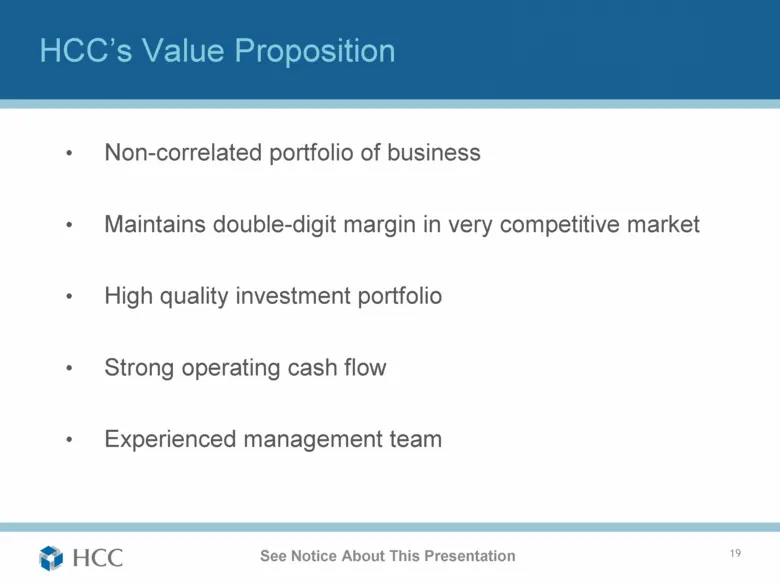
See Notice About This Presentation HCC’s Value Proposition 19 Non-correlated portfolio of business Maintains double-digit margin in very competitive market High quality investment portfolio Strong operating cash flow Experienced management team
Source: SEC EDGAR · 8-K filed Jul 7, 2011
More decks from HCC Insurance Holdings Inc
 Q2 2015 Earnings Presentation31 slides · Aug 14, 2015
 Merger or Acquisition (June 2015)22 slides · Jun 23, 2015
 Merger or Acquisition (June 2015)10 slides · Jun 10, 2015
 Merger or Acquisition (June 2015)30 slides · Jun 10, 2015
 Q1 2015 Earnings Presentation35 slides · May 21, 2015
 36th Annual Raymond James Institutional Investors Conference (February 2015)36 slides · Feb 27, 2015