Layne Christensen — Investor Presentation (February 2014)
23 slides from Layne Christensen's investor presentation, Feb 11, 2014
Slide 1: Layne Christensen Investor Presentation February 2014
Exhibit 99.1 LAYNE CHRISTENSEN Investor Presentation February 2014
Slide 2: Safe Harbor
SAFE HARBOR This presentationmay contain forward-lookingstatementswithin the meaningof Section27A of the Securities Act of 1933and Section21Eof the ExchangeAct of 1934.Suchstatementsmay include,but are not limited to, statementsof plansandobjectives,statementsof future economicperformanceand stateme
Slide 3: Overview
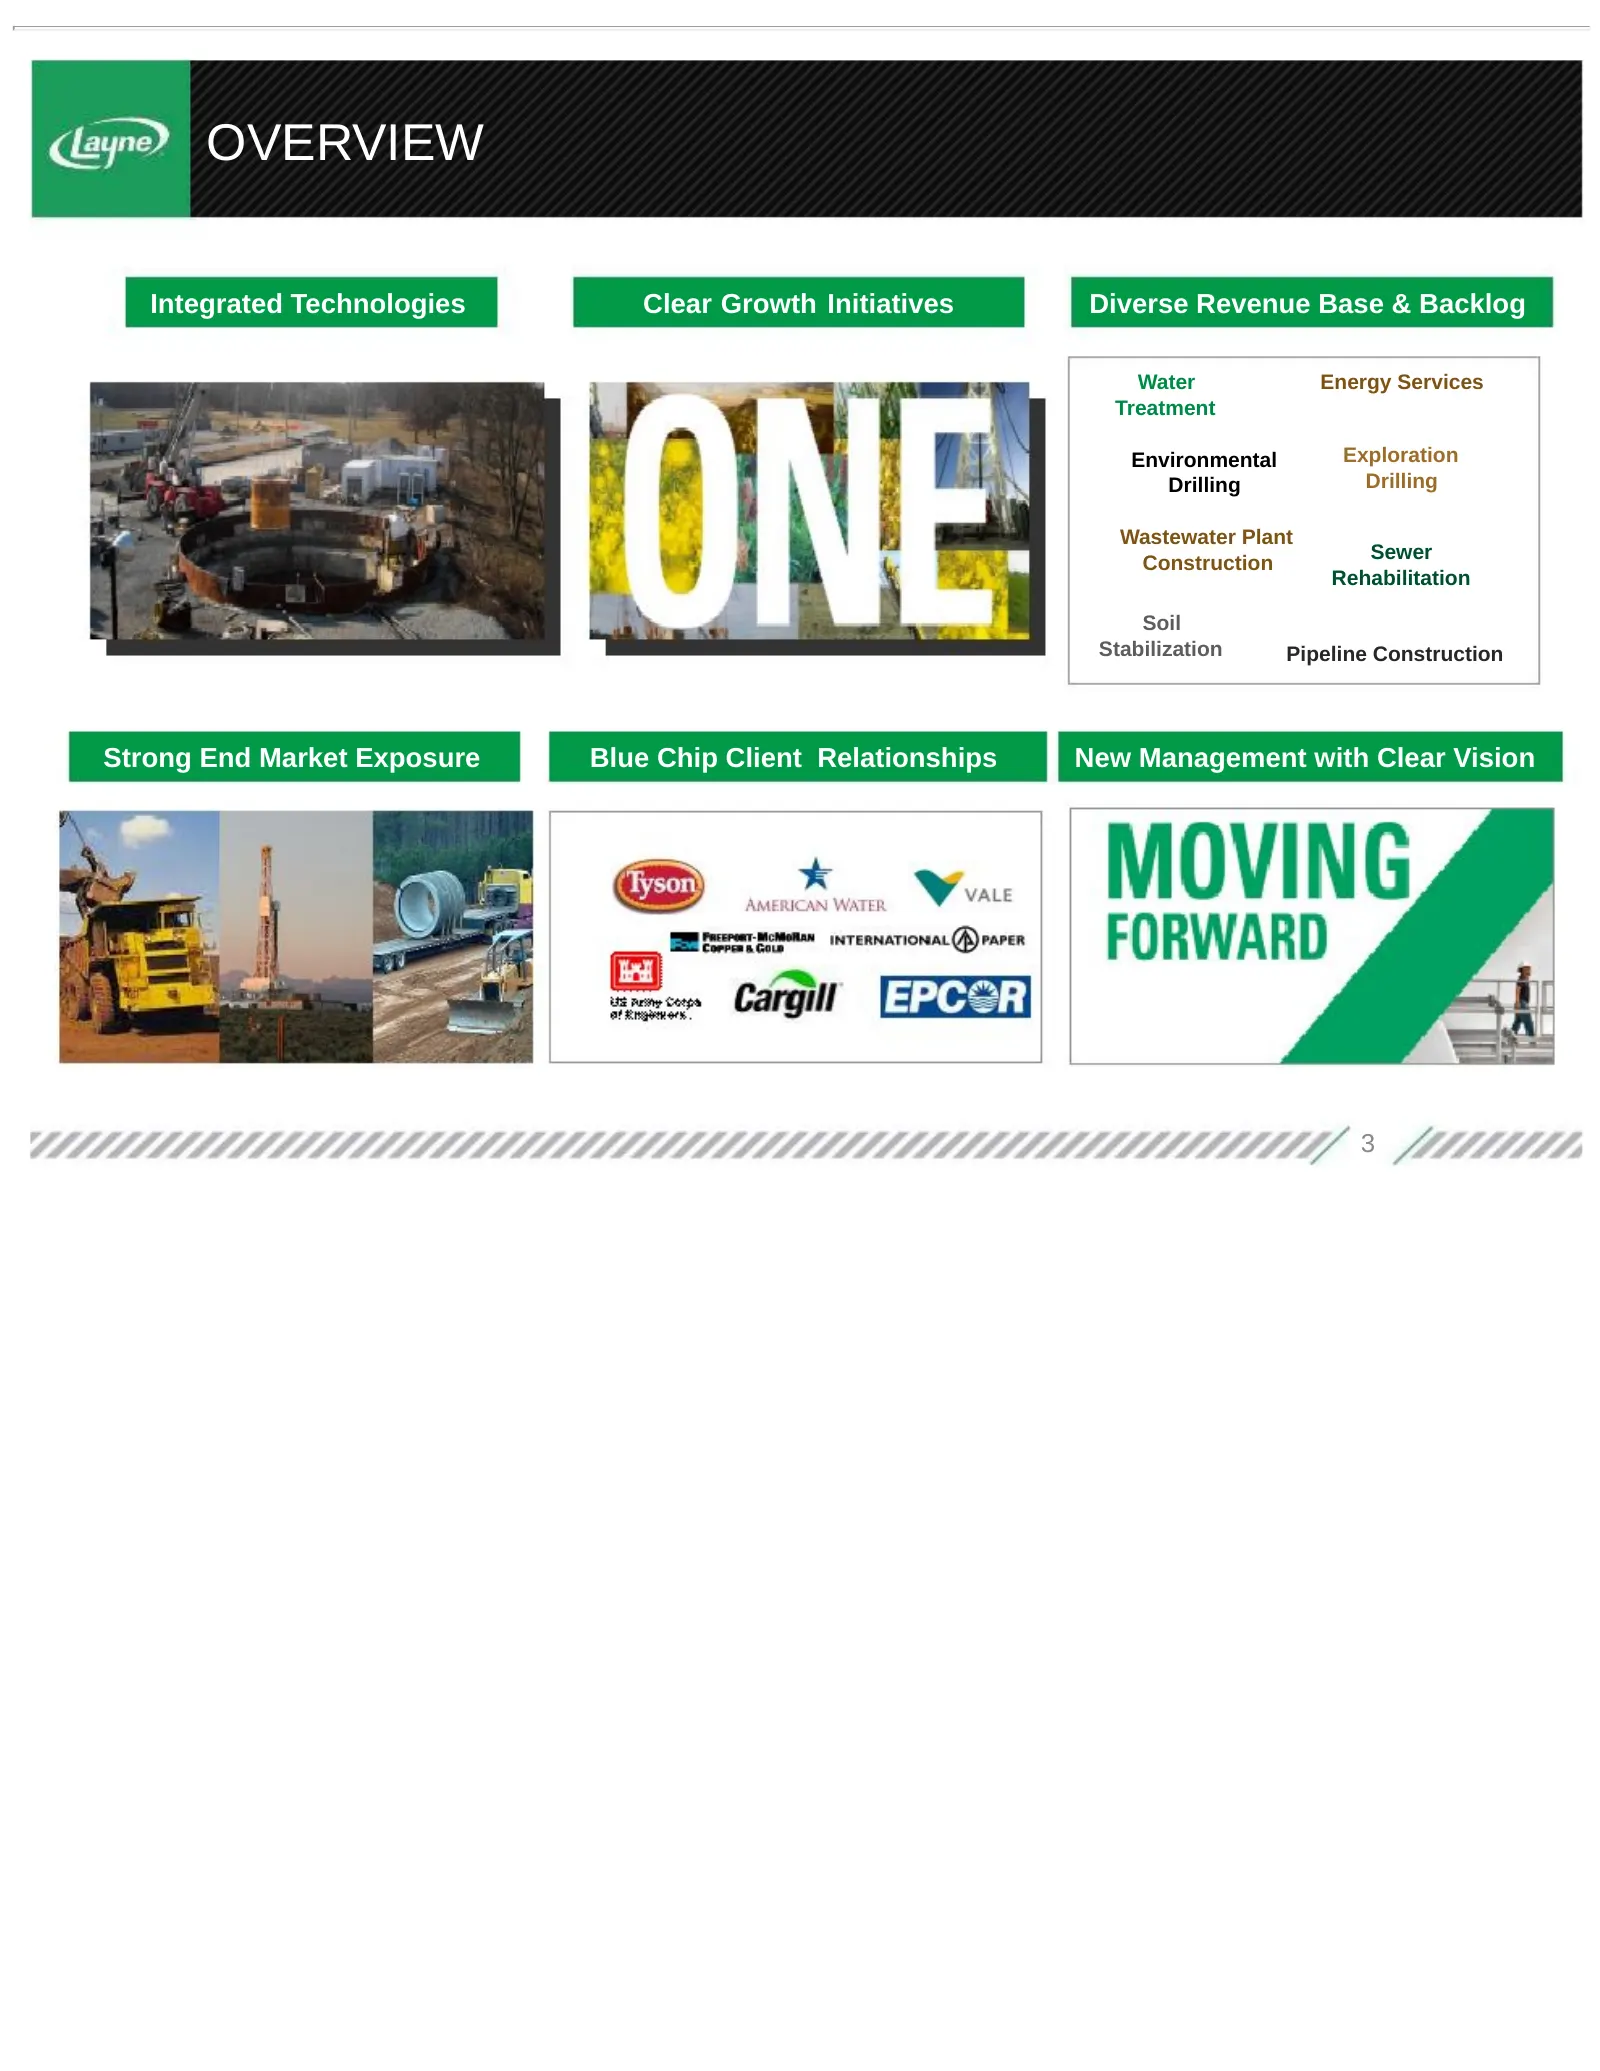
OVERVIEW Integrated Technologies Clear Growth Initiatives Diverse Revenue Base & Backlog Water Energy Services Treatment Environmental Exploration Drilling Drilling Wastewater Plant Sewer Construction Rehabilitation Soil Stabilization Pipeline Construction Strong End Market Exposure Blue Chip Client
Slide 4: Investment Considerations
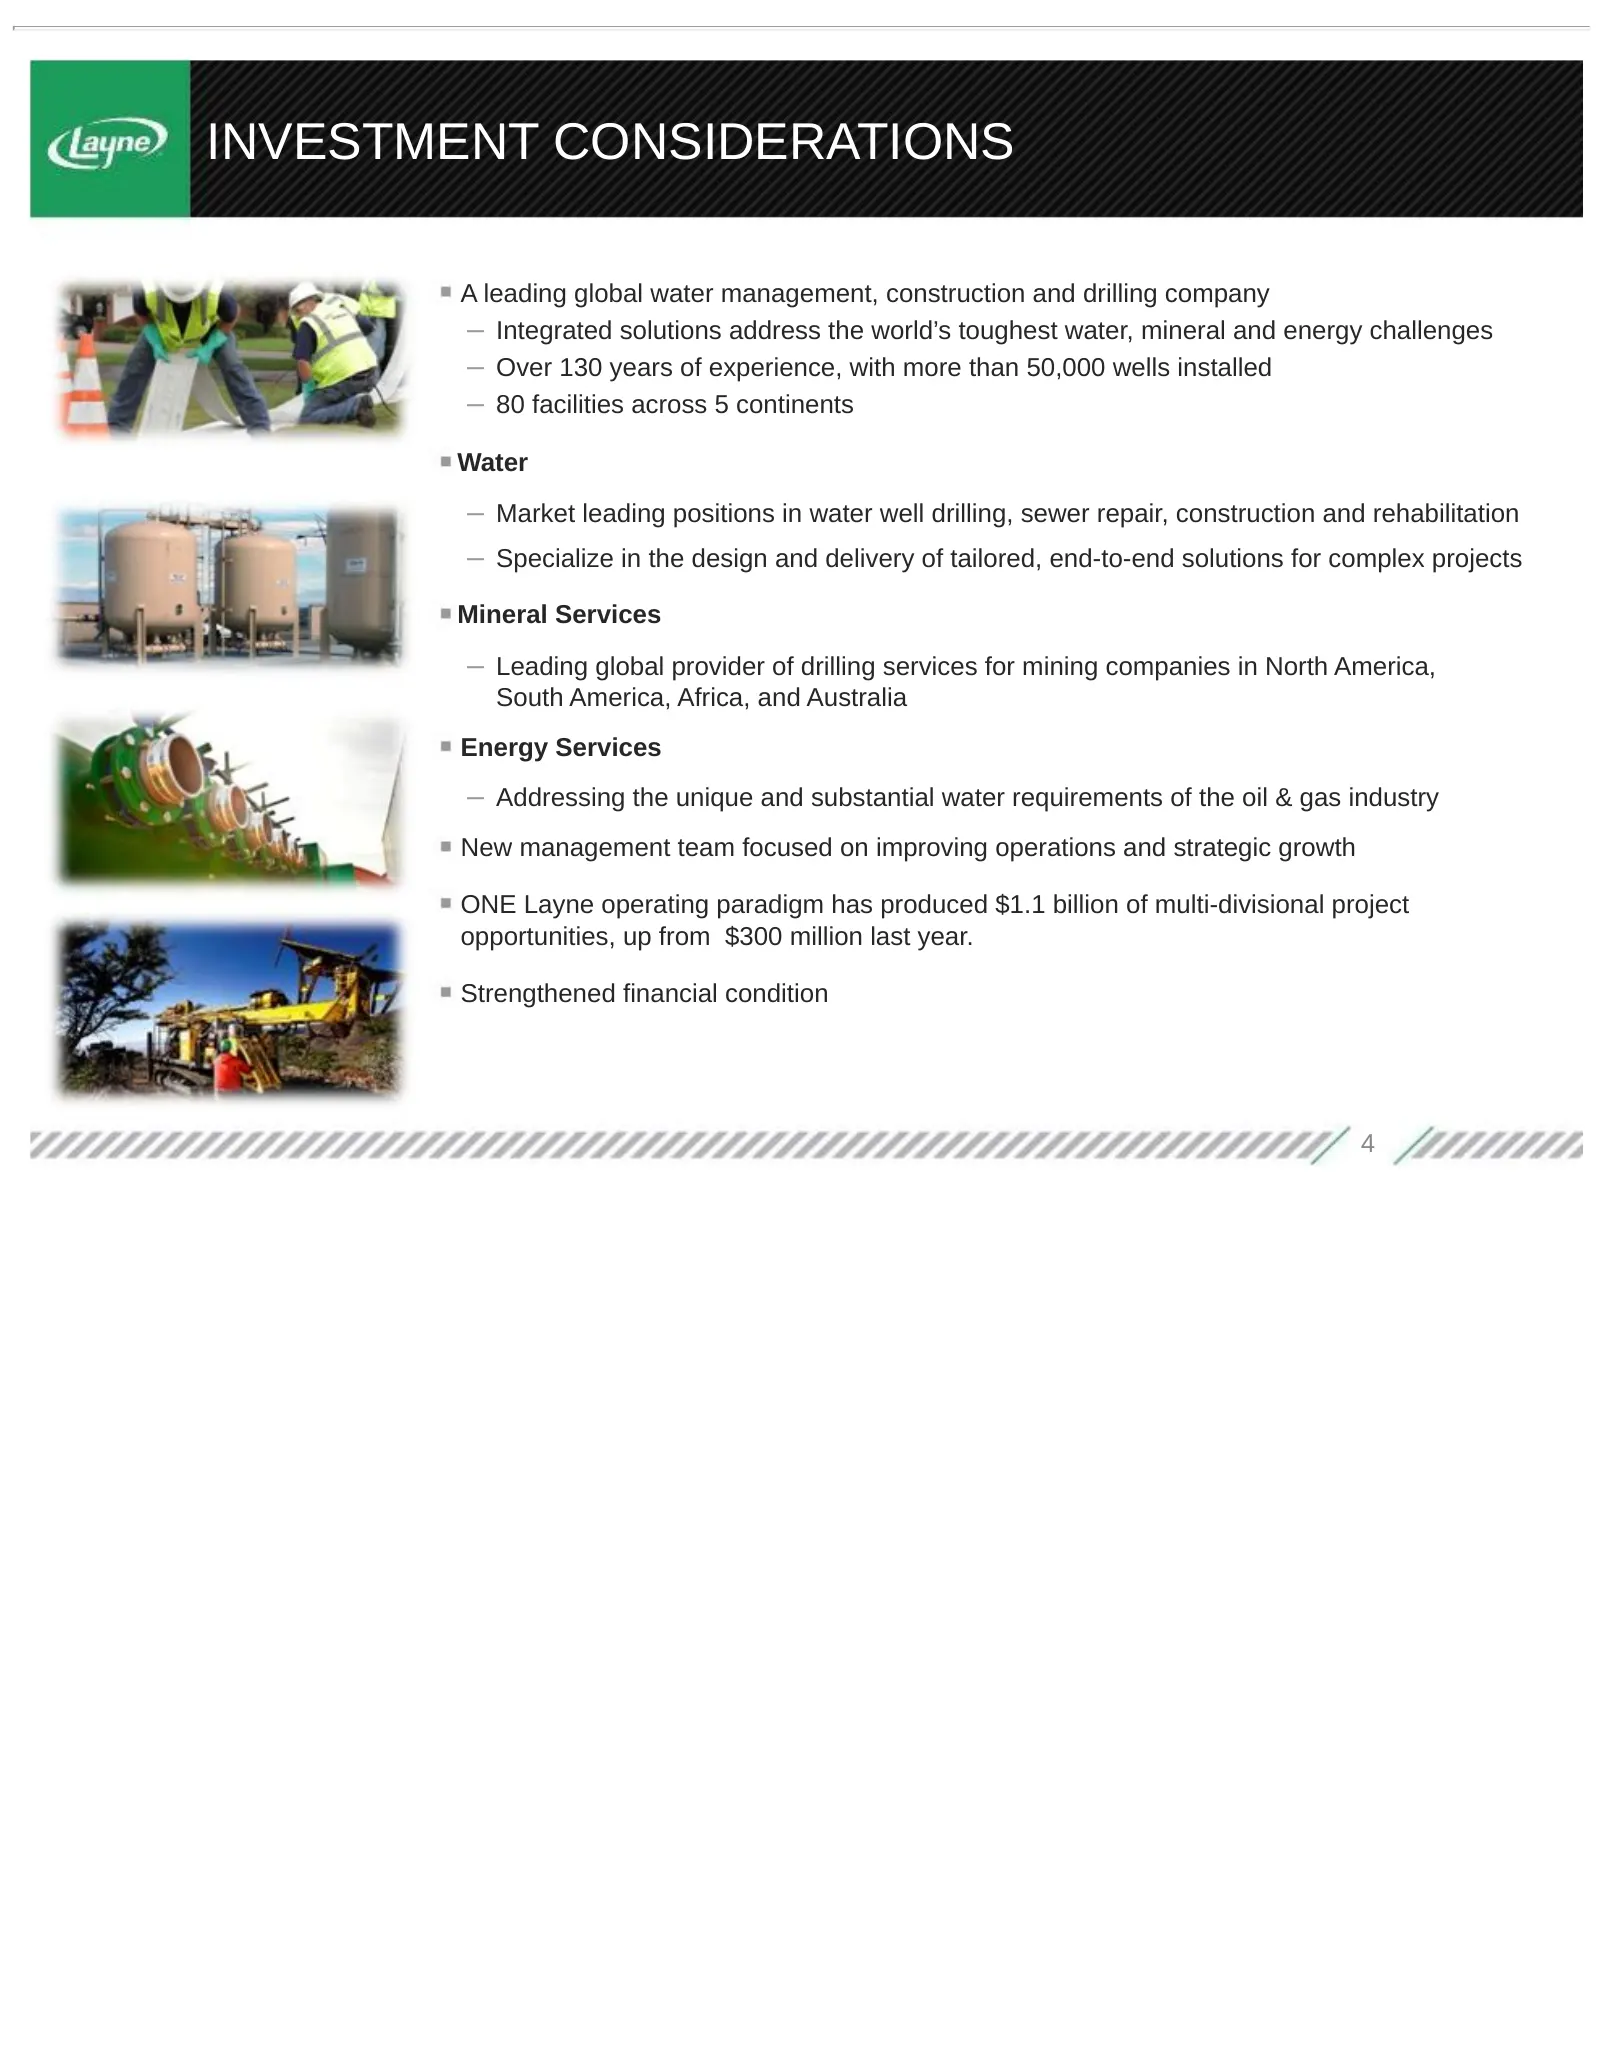
INVESTMENT CONSIDERATIONS A leading global water management, construction and drilling company – Integrated solutions address the world’s toughest water, mineral and energy challenges – Over 130 years of experience, with more than 50,000 wells installed – 80 facilities across 5 continents Water – Ma
Slide 5: A Market Leader in the U.S. and Around the World
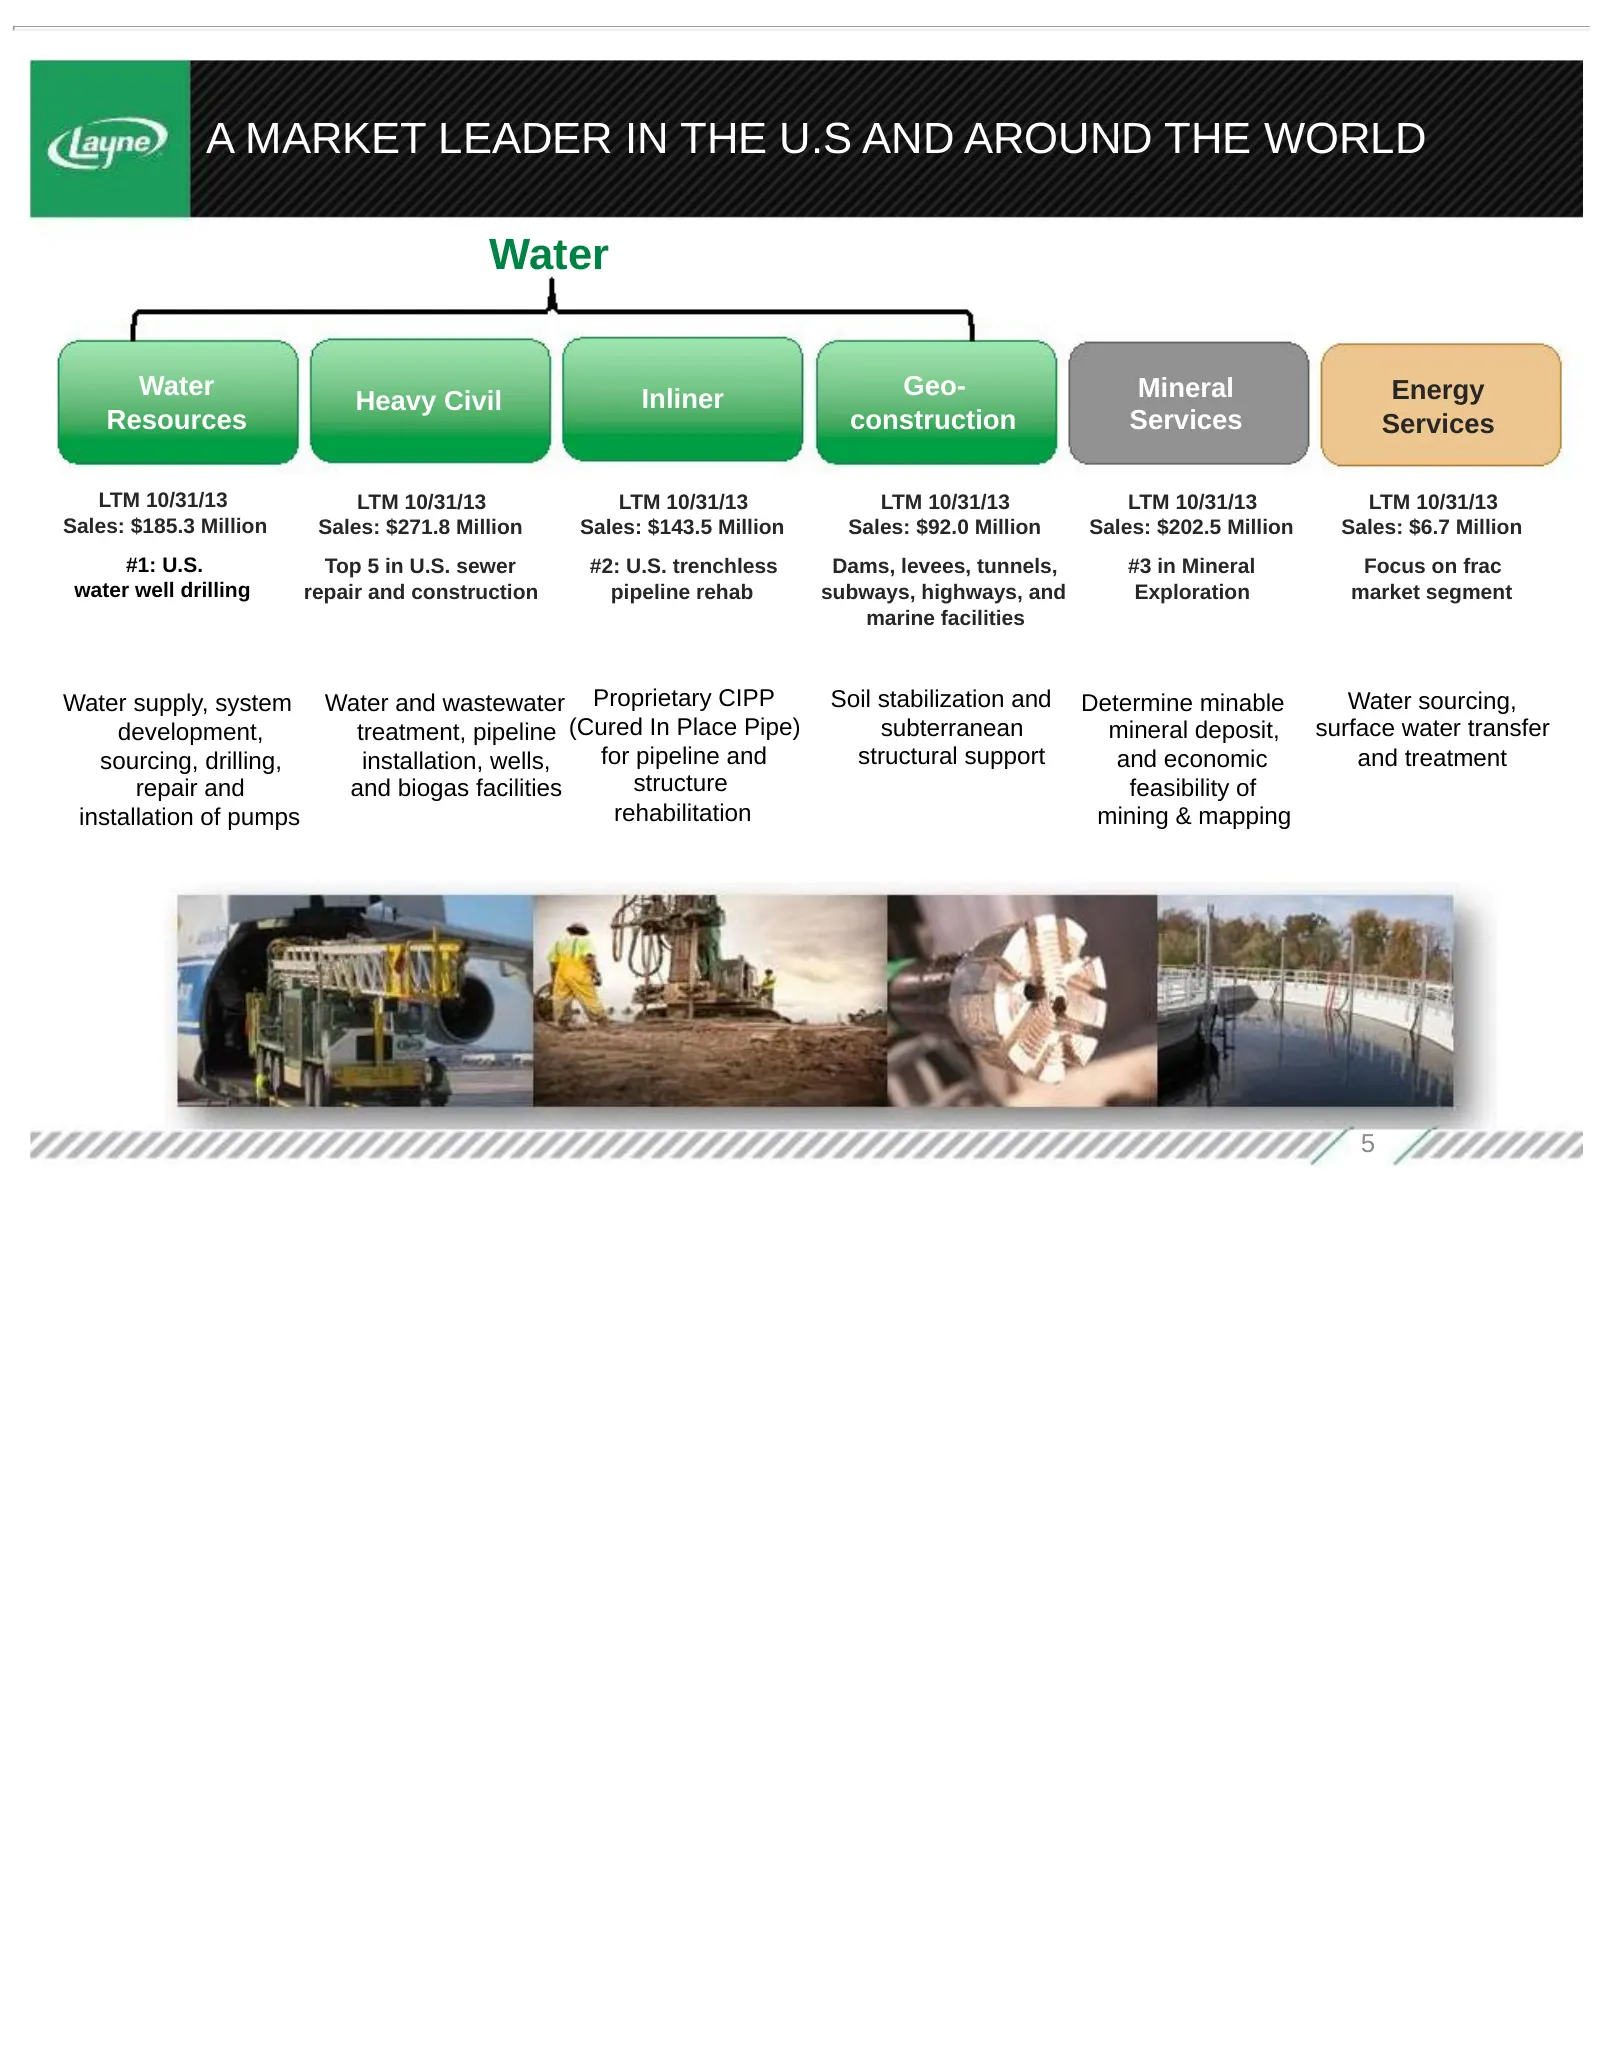
A MARKET LEADER IN THE U.S AND AROUND THE WORLD Water Water Inliner Geo- Mineral Energy Heavy Civil Resources construction Services Services LTM 10/31/13 LTM 10/31/13 LTM 10/31/13 LTM 10/31/13 LTM 10/31/13 LTM 10/31/13 Sales: $185.3 Million Sales: $271.8 Million Sales: $143.5 Million Sales: $92.0 Mi
Slide 6: Layne Solutions Lifecycle
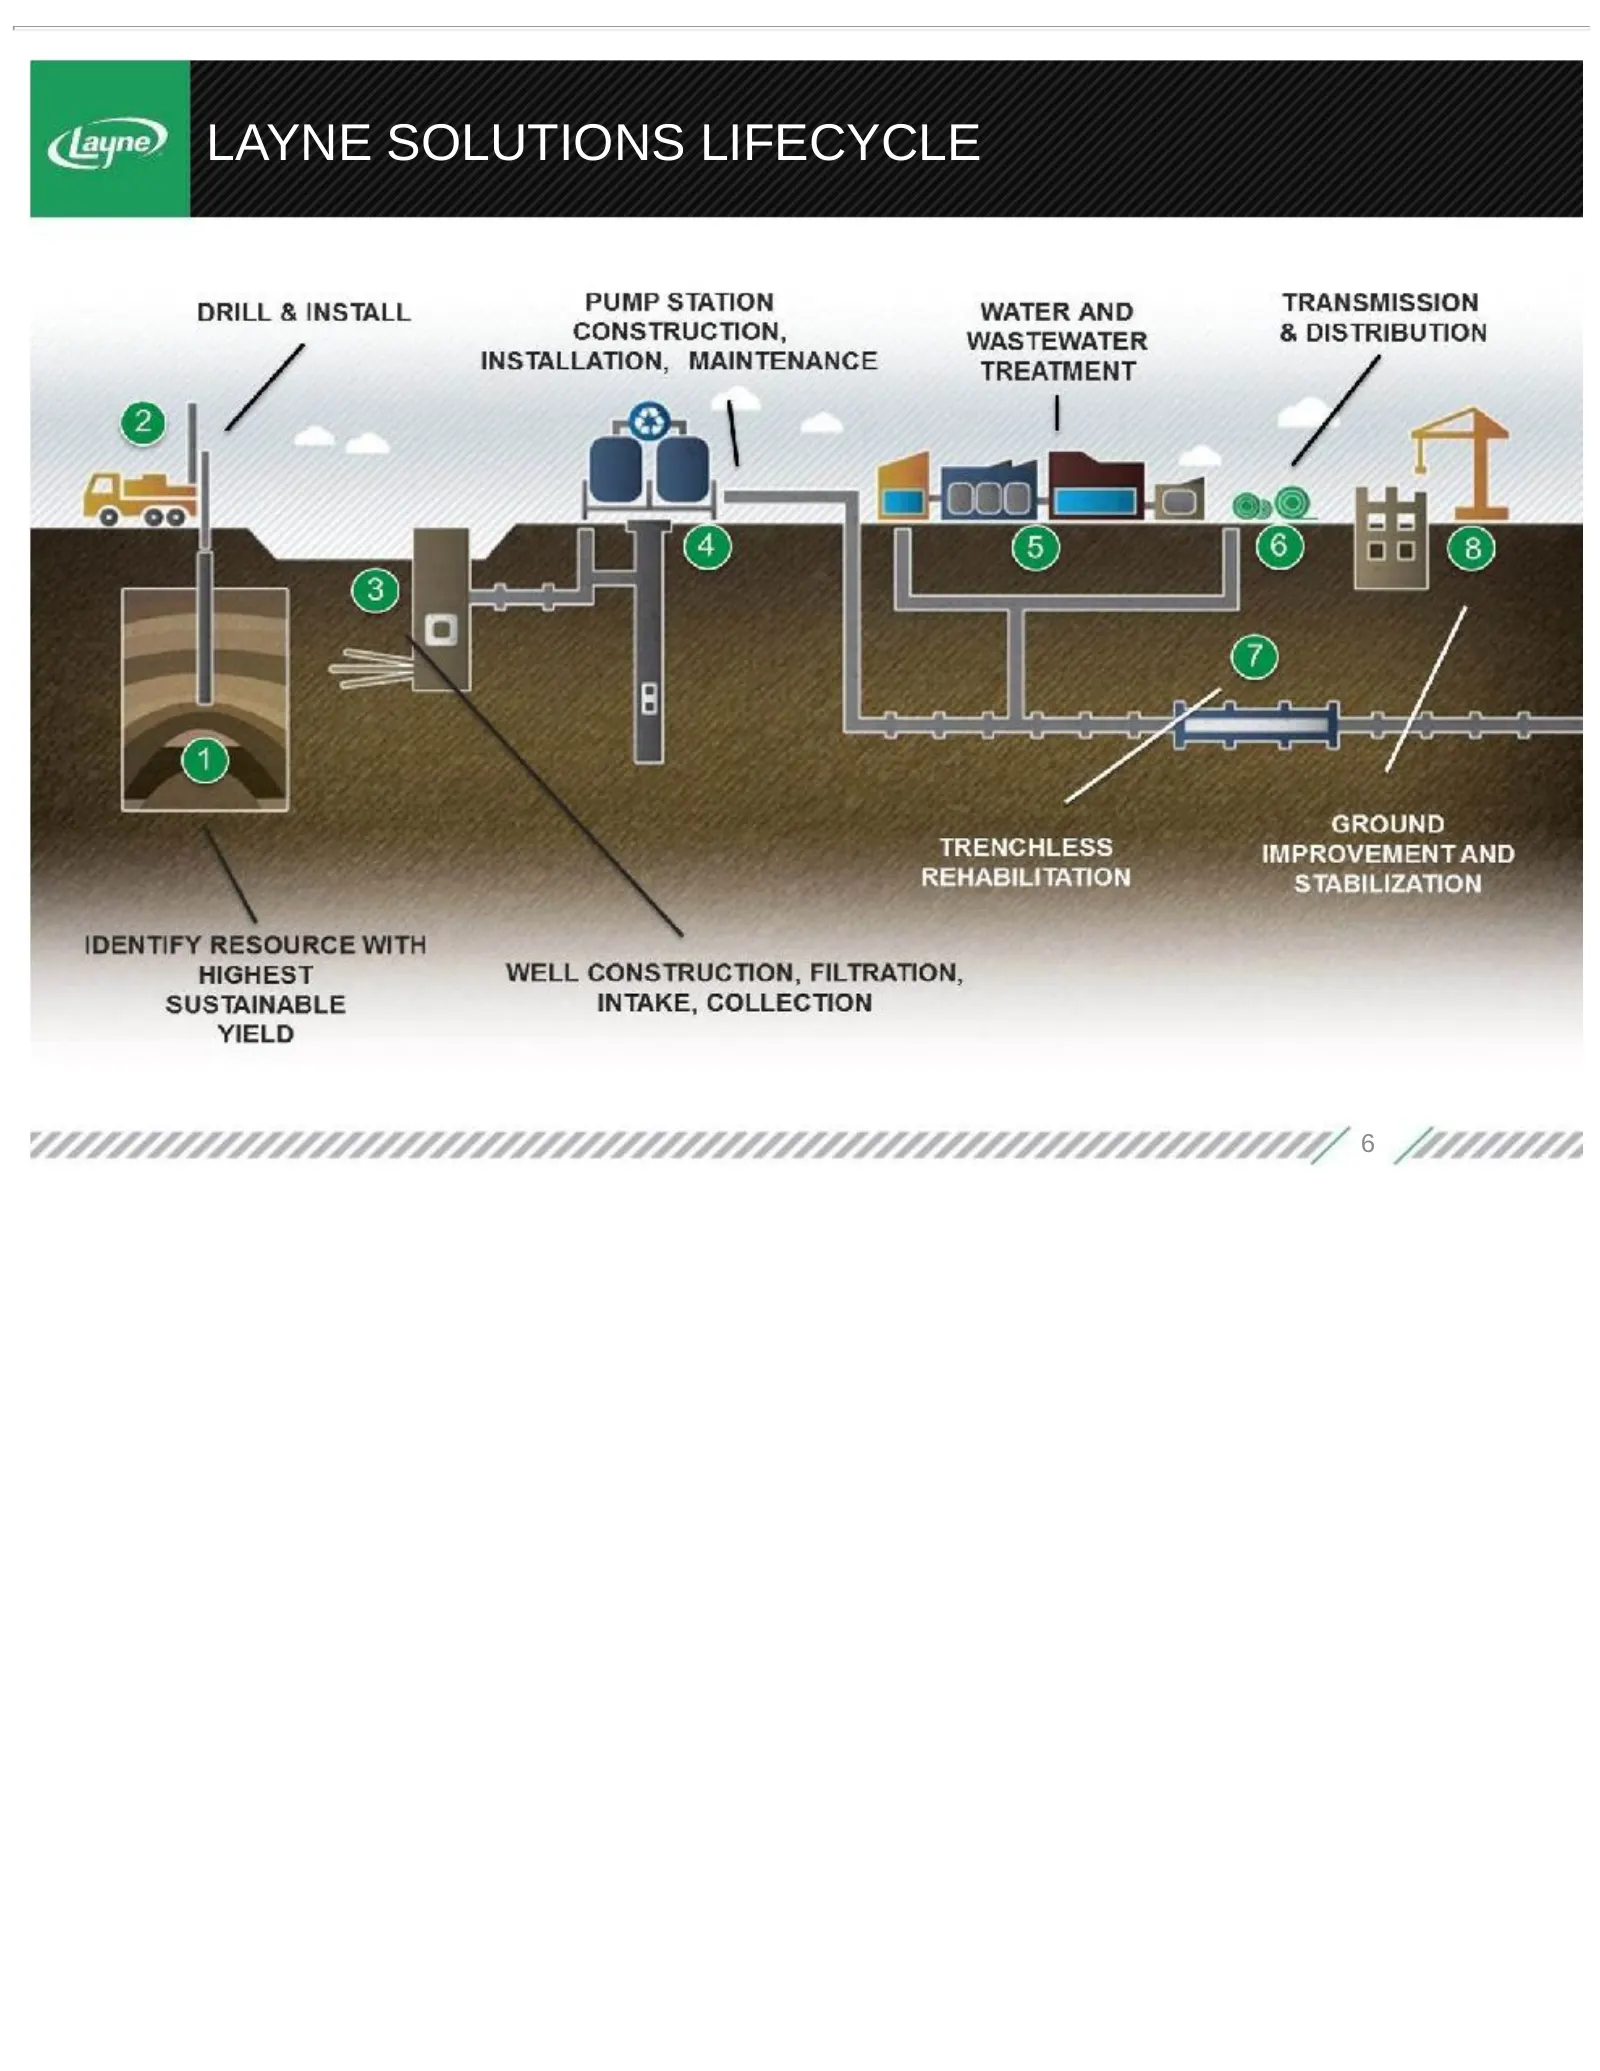
dey LAYNE SOLUTIONS LIFECYCLE DRILL & INSTALL PUMP STATION WATER AND TRANSMISSION CONSTRUCTION, WASTEWATER & DISTRIBUTION he INSTALLATION, MAINTENANCE TREATMENT 2) | 1 \ | . —> o 5 : | | ay } GROUND TRENCHLESS IMPROVEMENT AND REHABILITATION , STABILIZATION ‘ “ Lc atl a eee re IDENTIFY RESOURCE WITH
Slide 7: Water
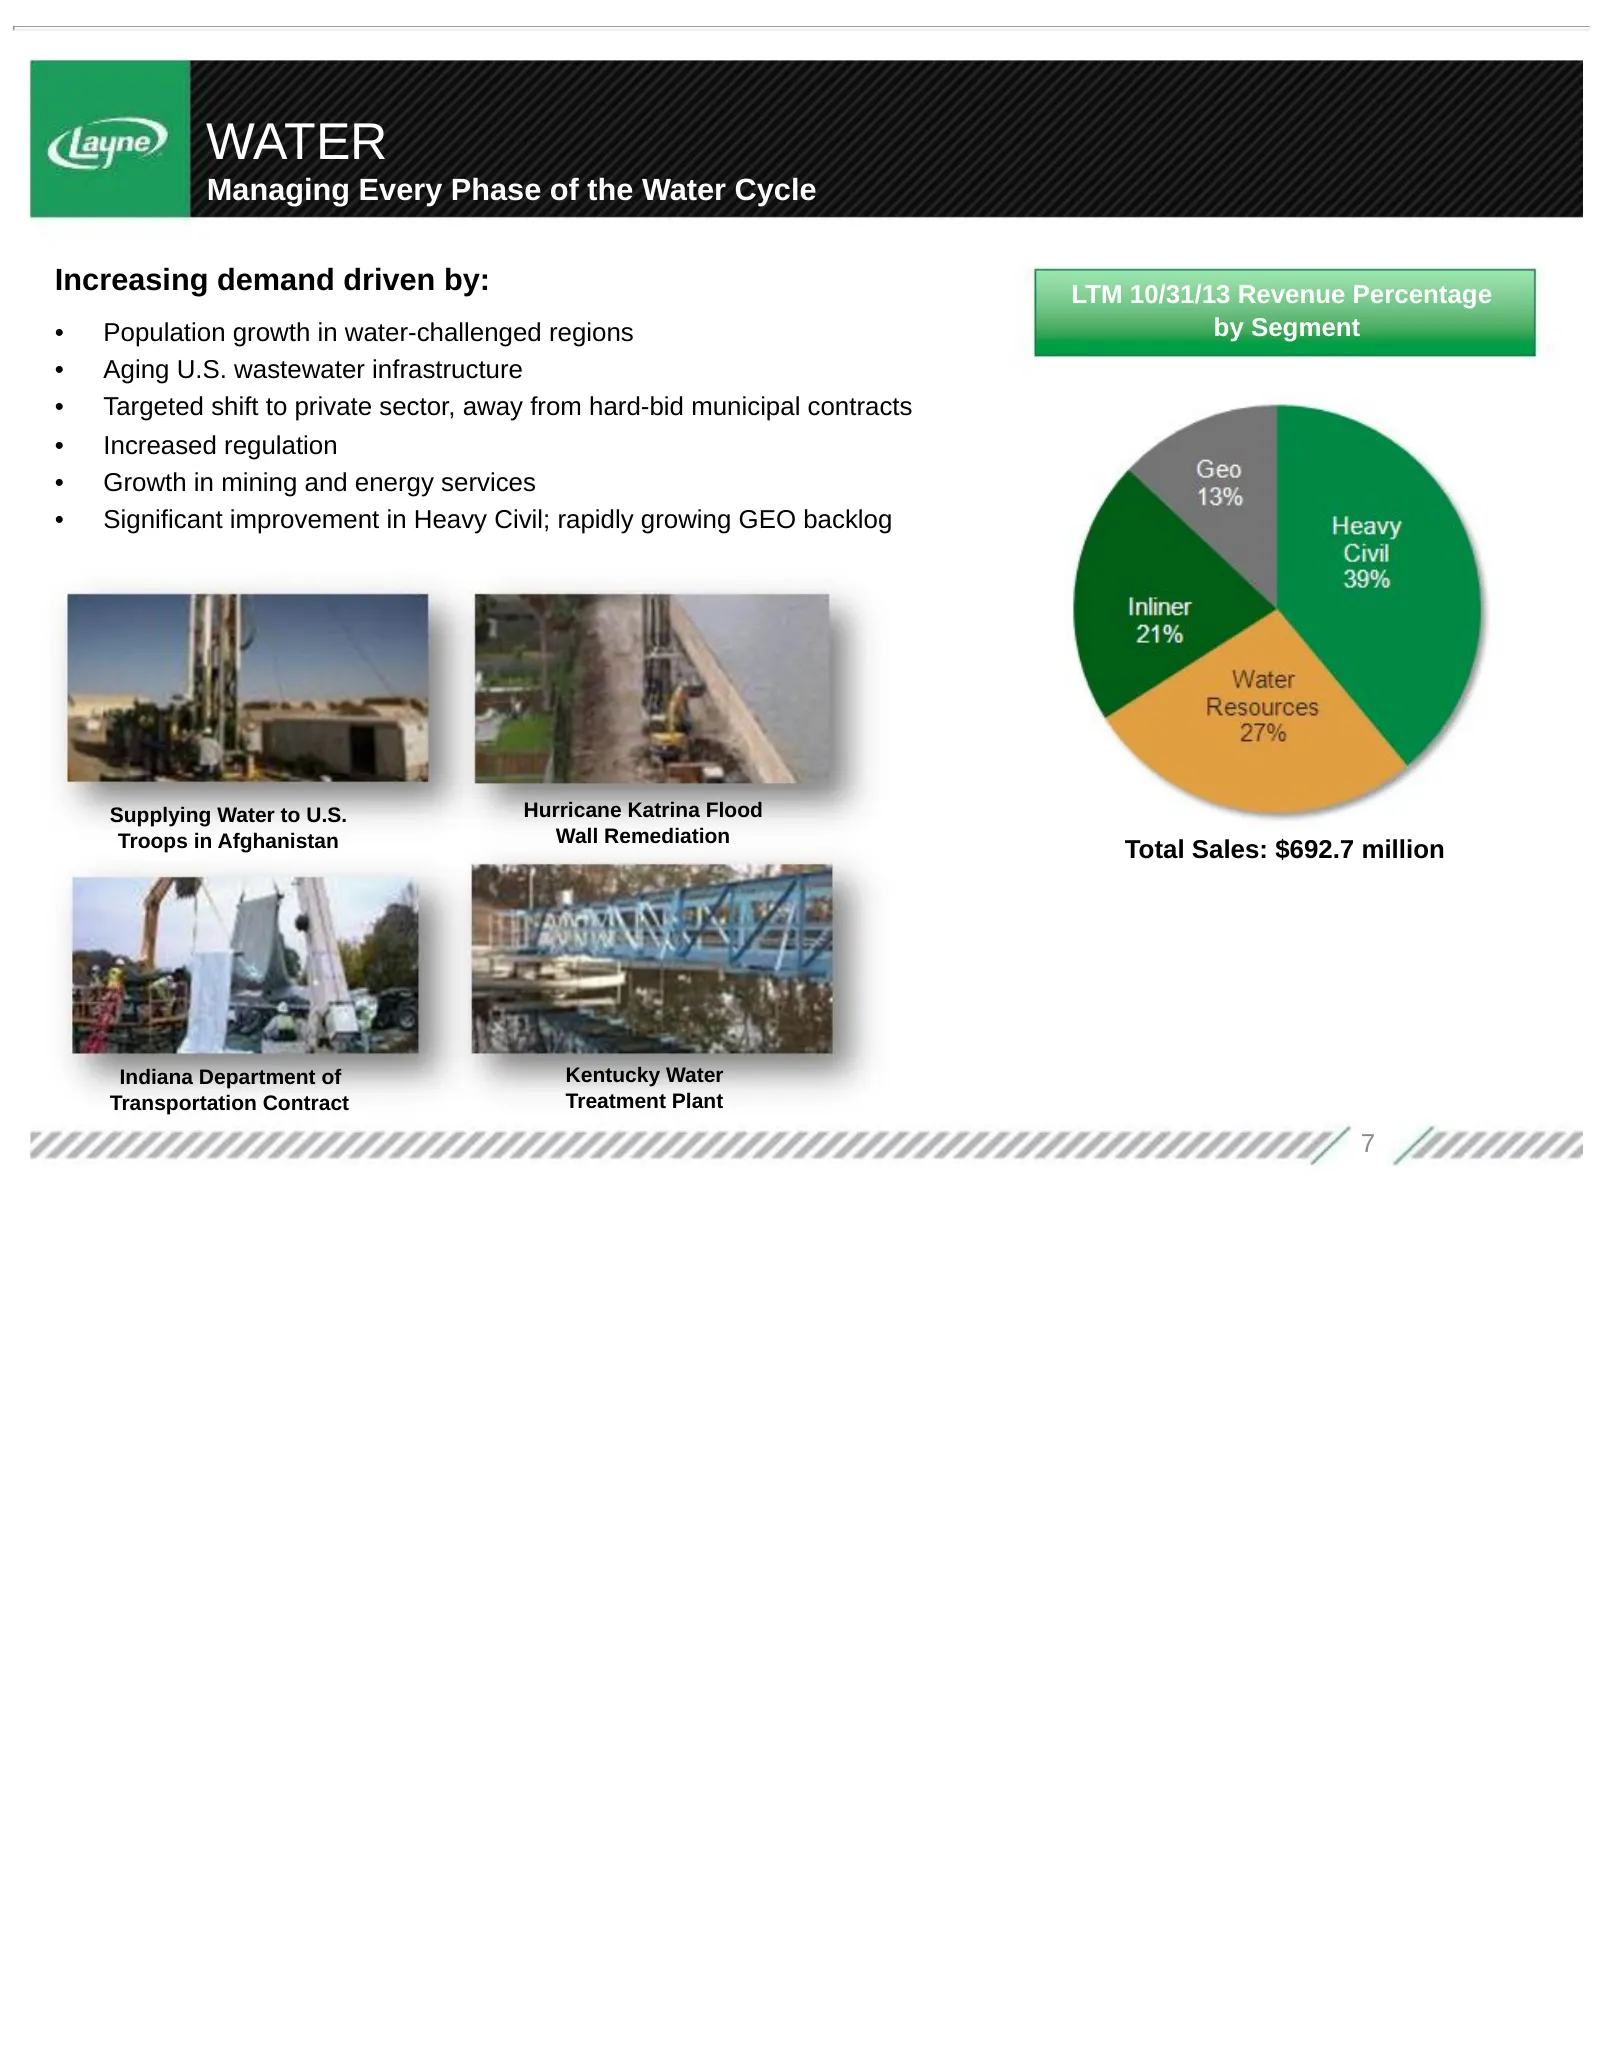
WATER Managing Every Phase of the Water Cycle Increasing demand driven by: LTM 10/31/13 Revenue Percentage • Population growth in water-challenged regions by Segment • Aging U.S. wastewater infrastructure • Targeted shift to private sector, away from hard-bid municipal contracts • Increased regulati
Slide 8: Mineral Services
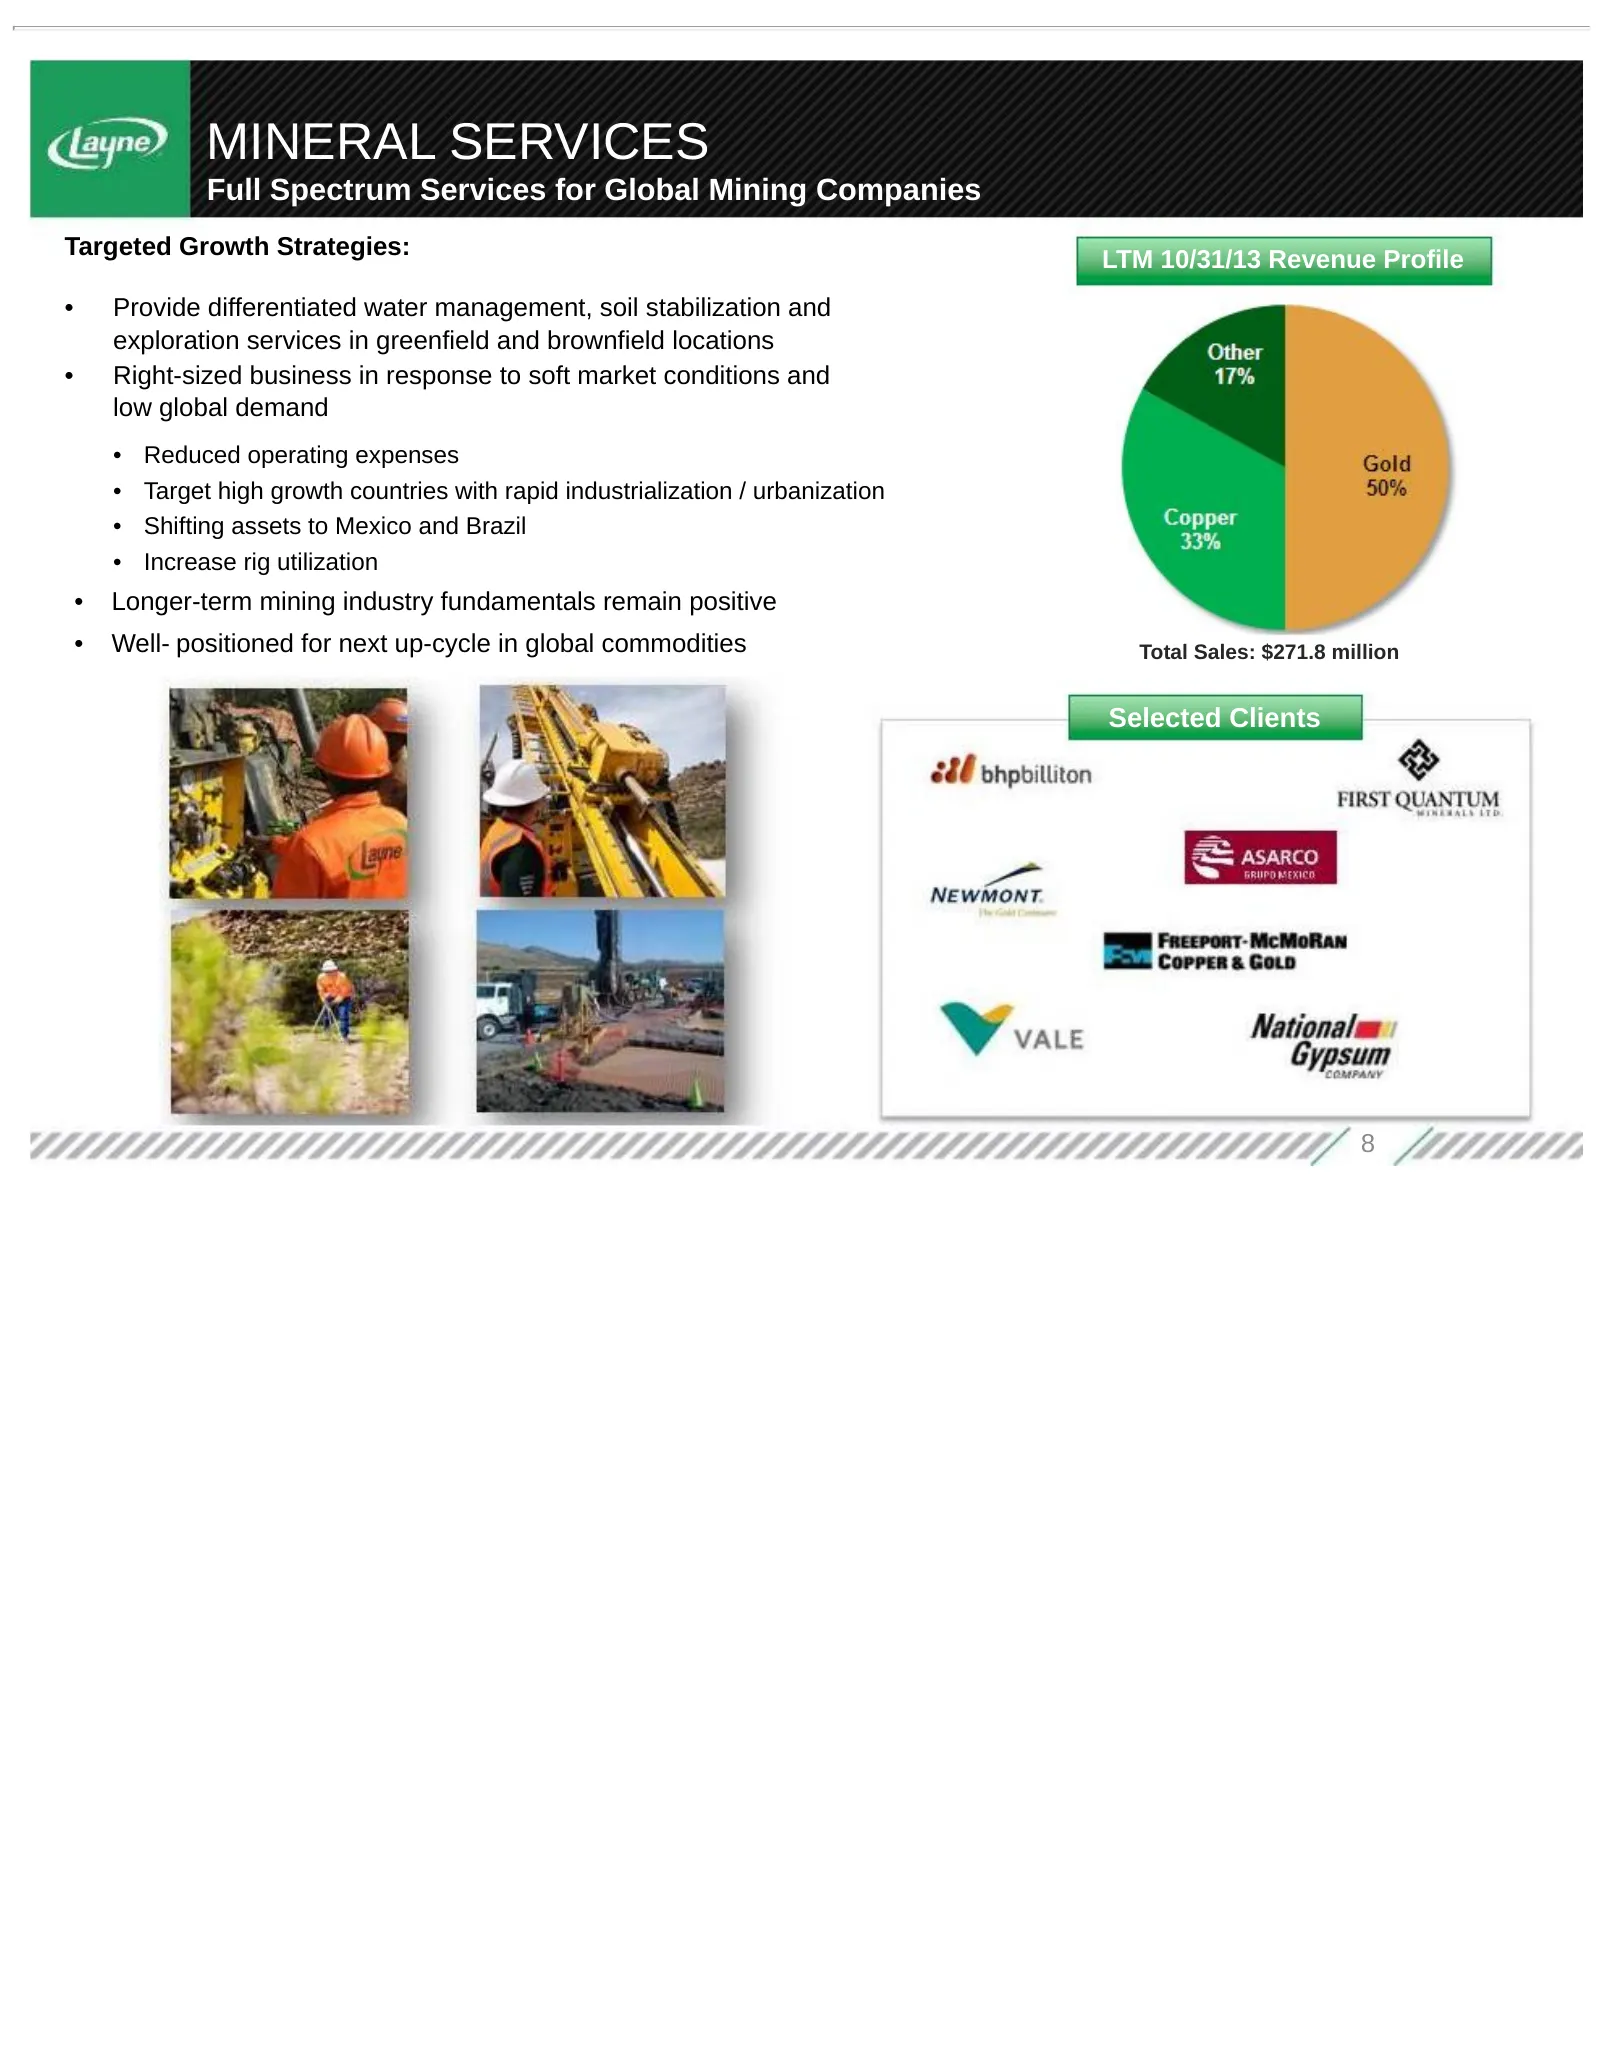
MINERAL SERVICES Full Spectrum Services for Global Mining Companies Targeted Growth Strategies: LTM 10/31/13 Revenue Profile • Provide differentiated water management, soil stabilization and exploration services in greenfield and brownfield locations • Right-sized business in response to soft market
Slide 9: Chilean Miners Rescue
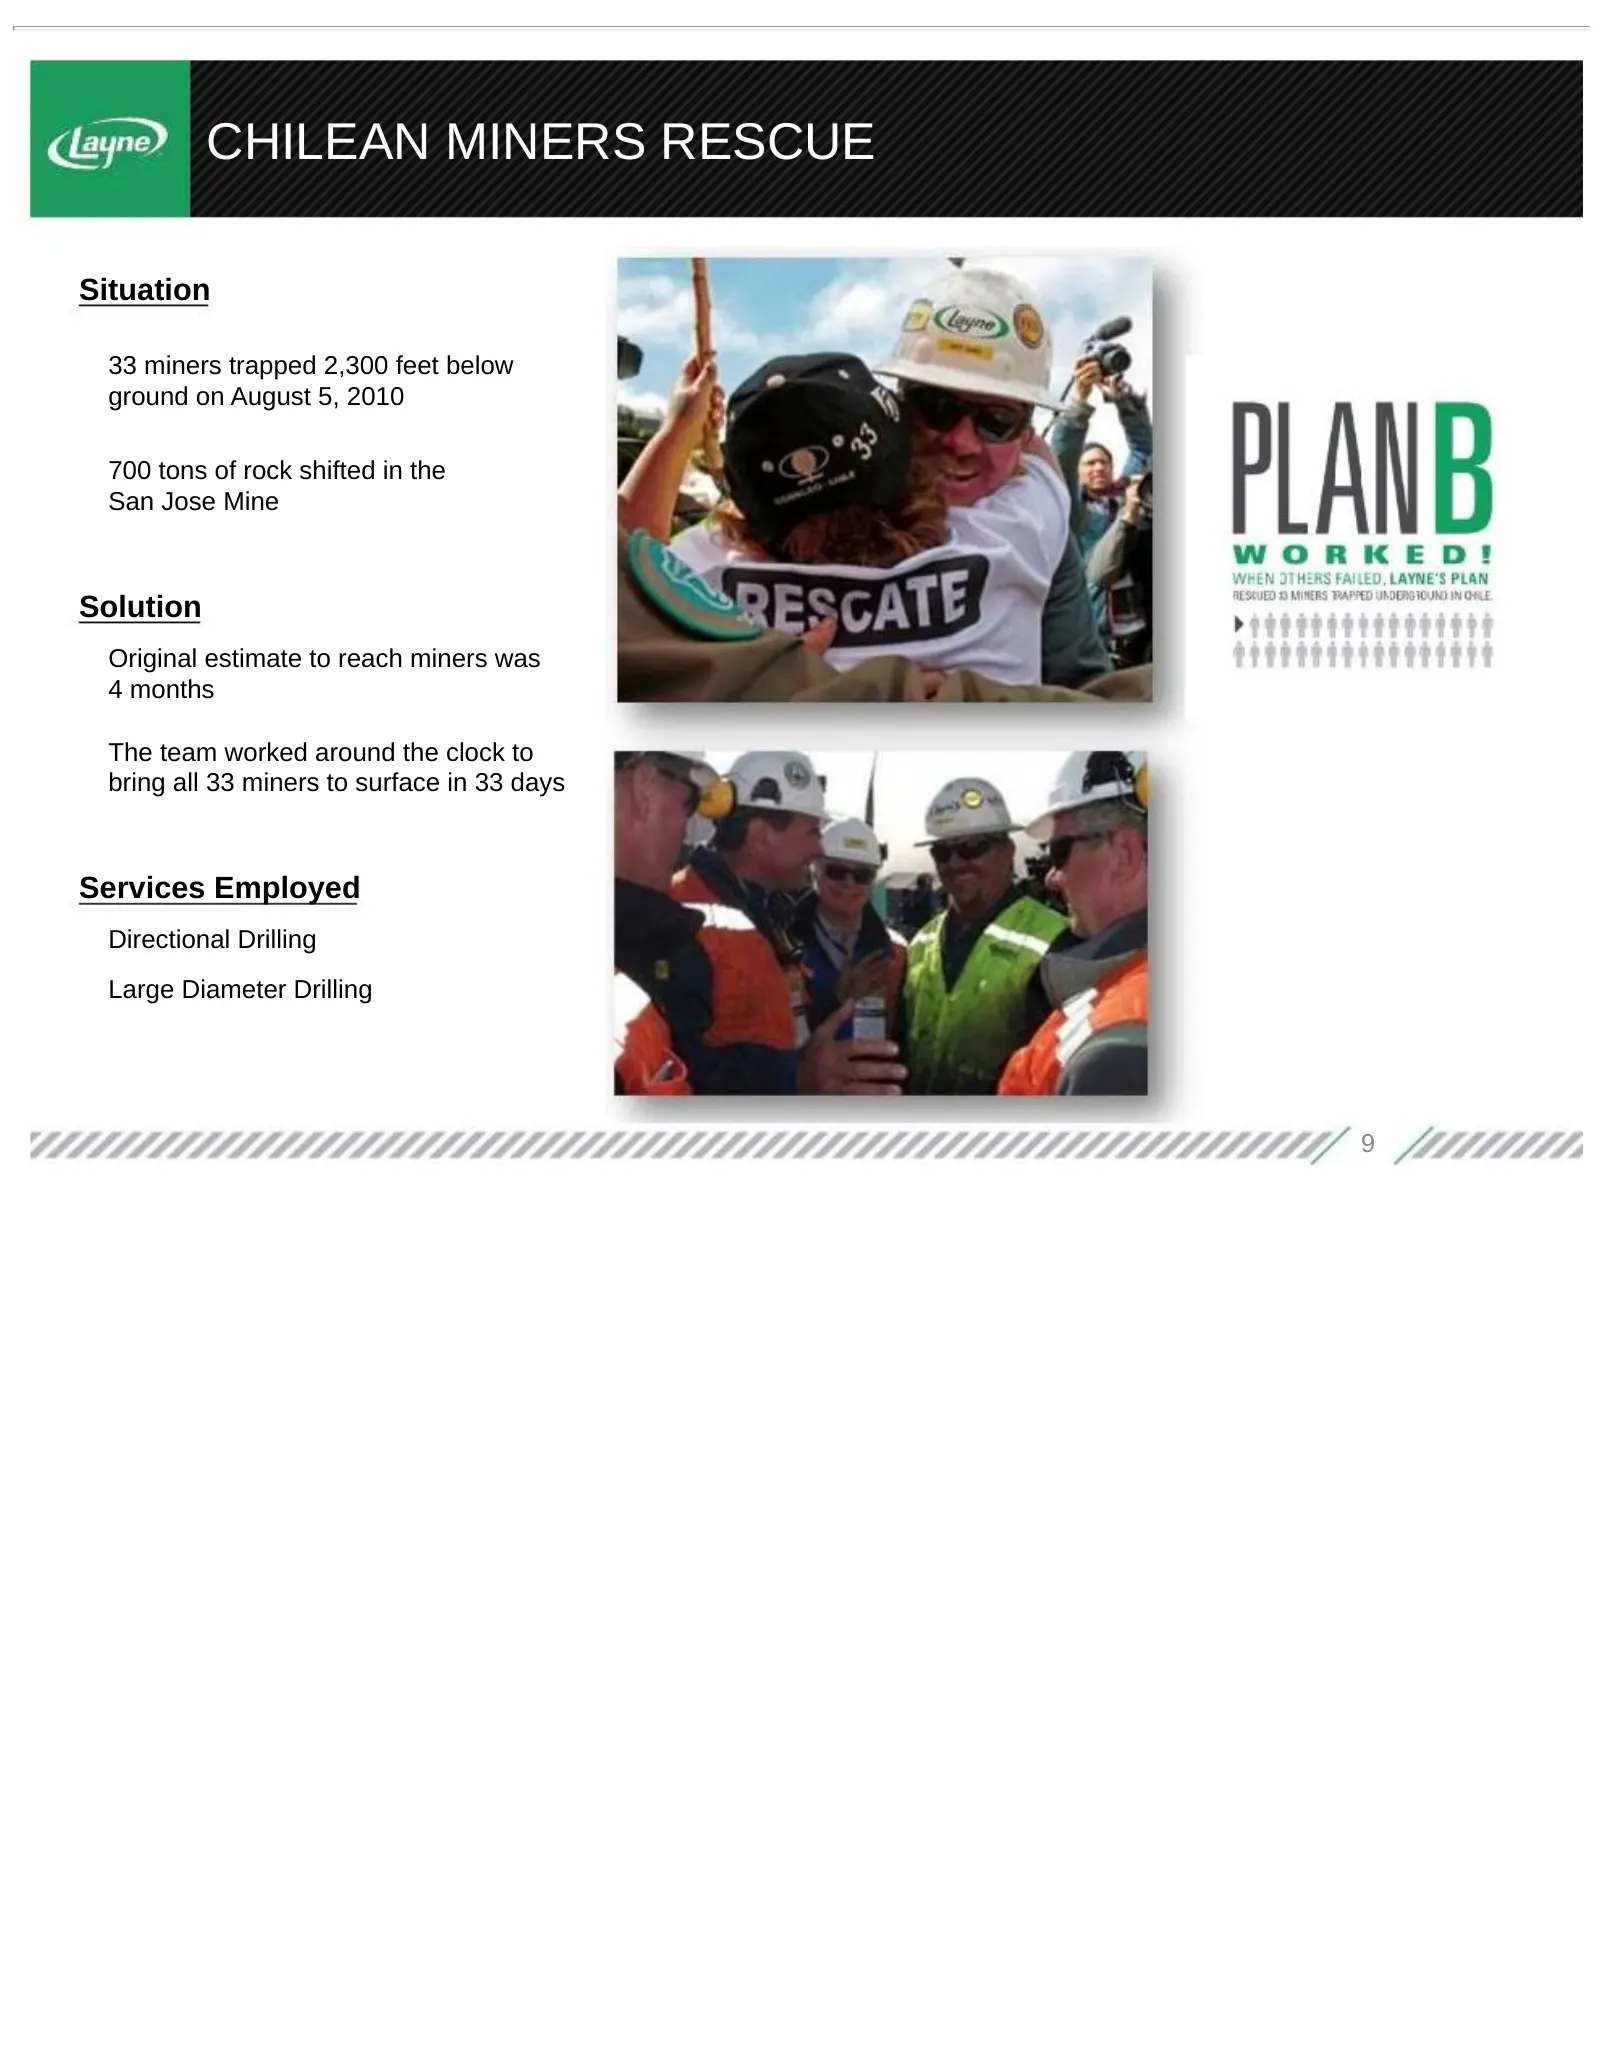
CHILEAN MINERS RESCUE Situation 33 miners trapped 2,300 feet below ground on August 5, 2010 700 tons of rock shifted in the San Jose Mine Solution Original estimate to reach miners was 4 months The team worked around the clock to bring all 33 miners to surface in 33 days Services Employed Directiona
Slide 10: Energy Services
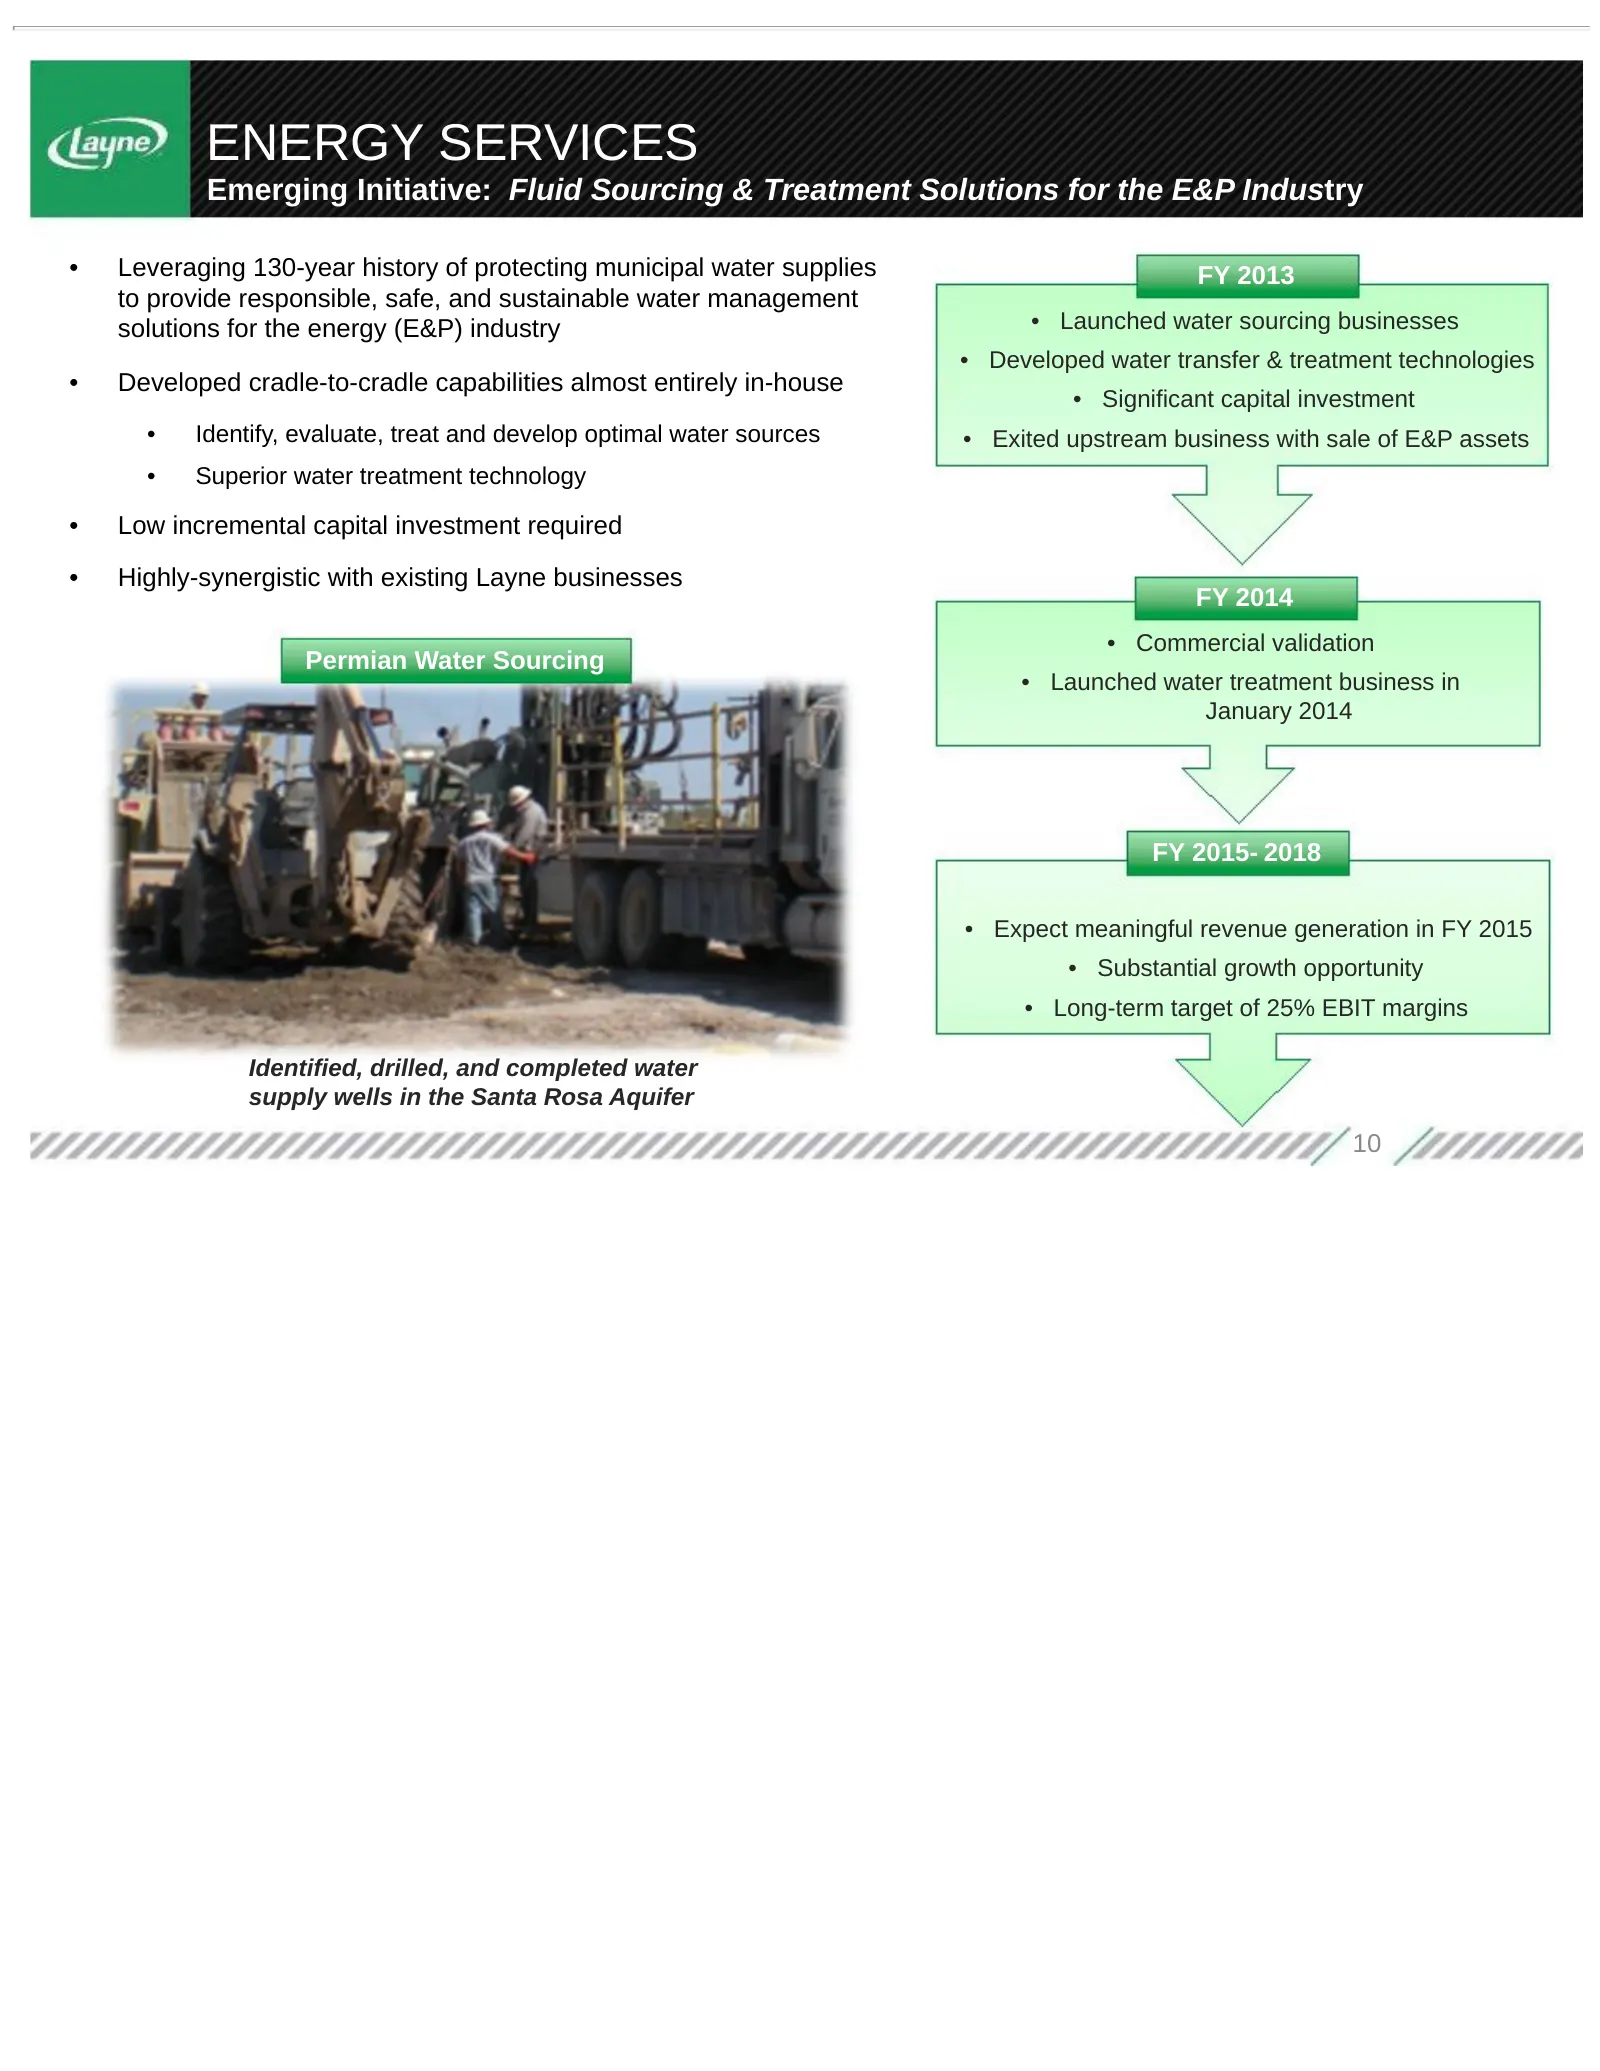
ENERGY SERVICES Emerging Initiative: Fluid Sourcing & Treatment Solutions for the E&P Industry • Leveraging 130-year history of protecting municipal water supplies FY 2013 to provide responsible, safe, and sustainable water management solutions for the energy (E&P) industry • Launched water sourcing
Slide 11: Business Update
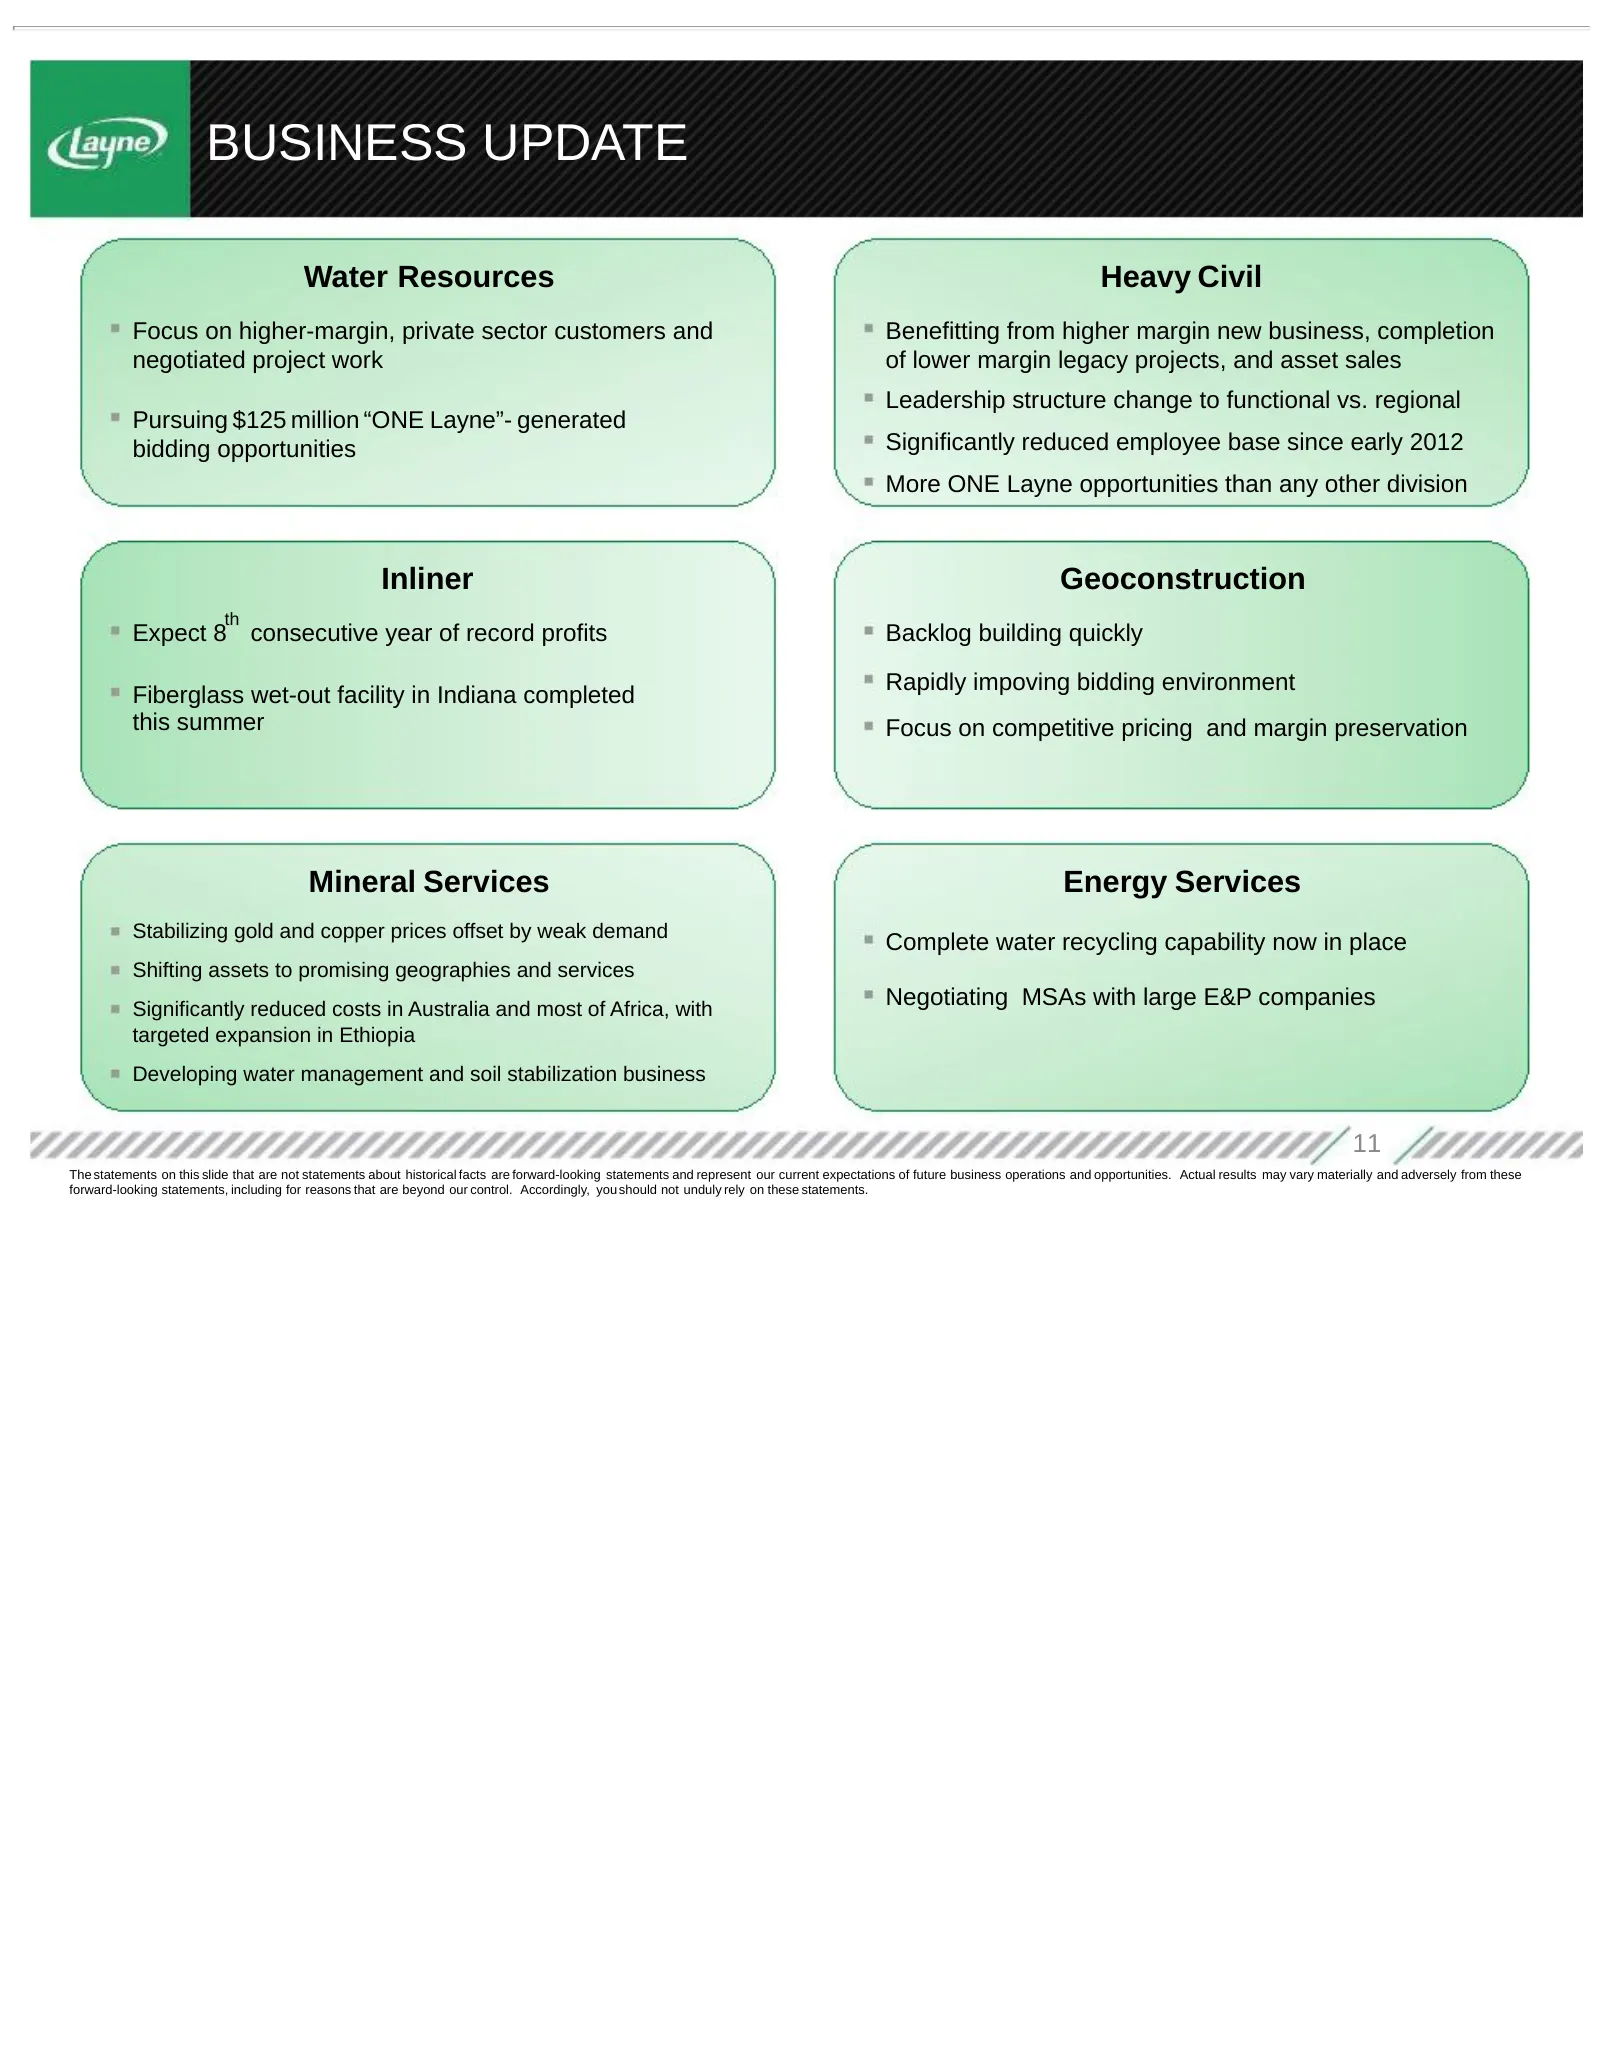
BUSINESS UPDATE Water Resources Heavy Civil Focus on higher-margin, private sector customers and Benefitting from higher margin new business, completion negotiated project work of lower margin legacy projects, and asset sales Leadership structure change to functional vs. regional Pursuing $125 milli
Slide 12: Business Update: Complex Project Wins
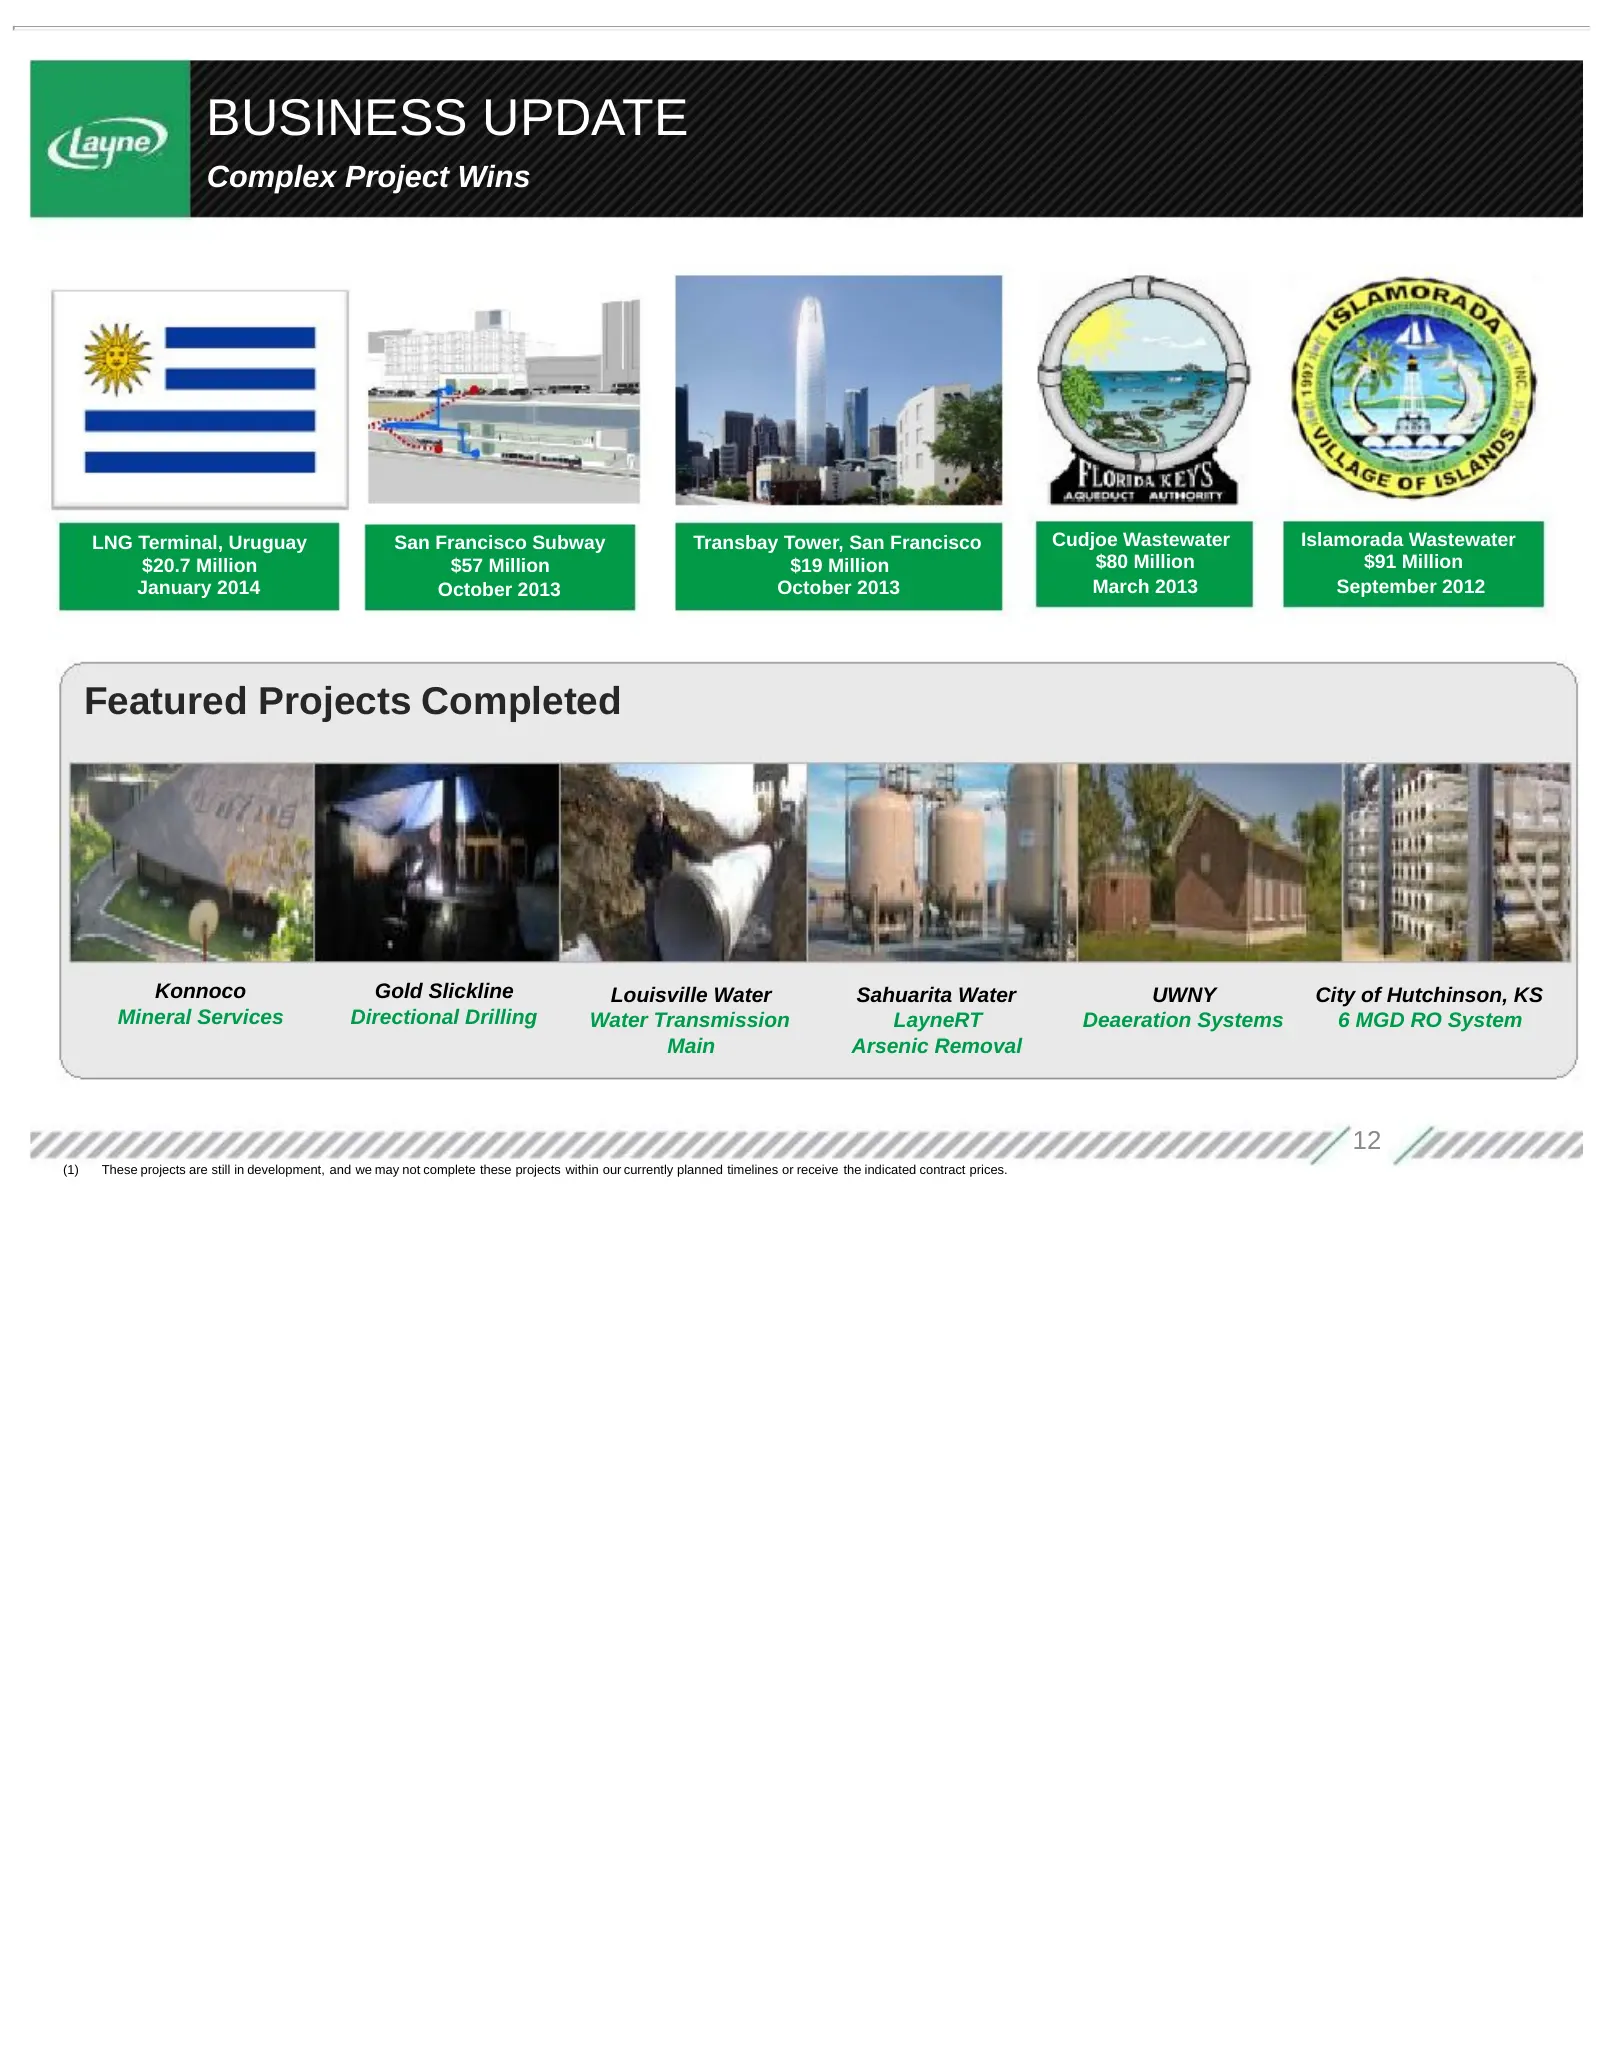
BUSINESS UPDATE Complex Project Wins LNG Terminal, Uruguay San Francisco Subway Transbay Tower, San Francisco Cudjoe Wastewater Islamorada Wastewater $20.7 Million $57 Million $19 Million $80 Million $91 Million January 2014 October 2013 October 2013 March 2013 September 2012 Featured Projects Compl
Slide 13: Integrated Solutions, Collaborative Model
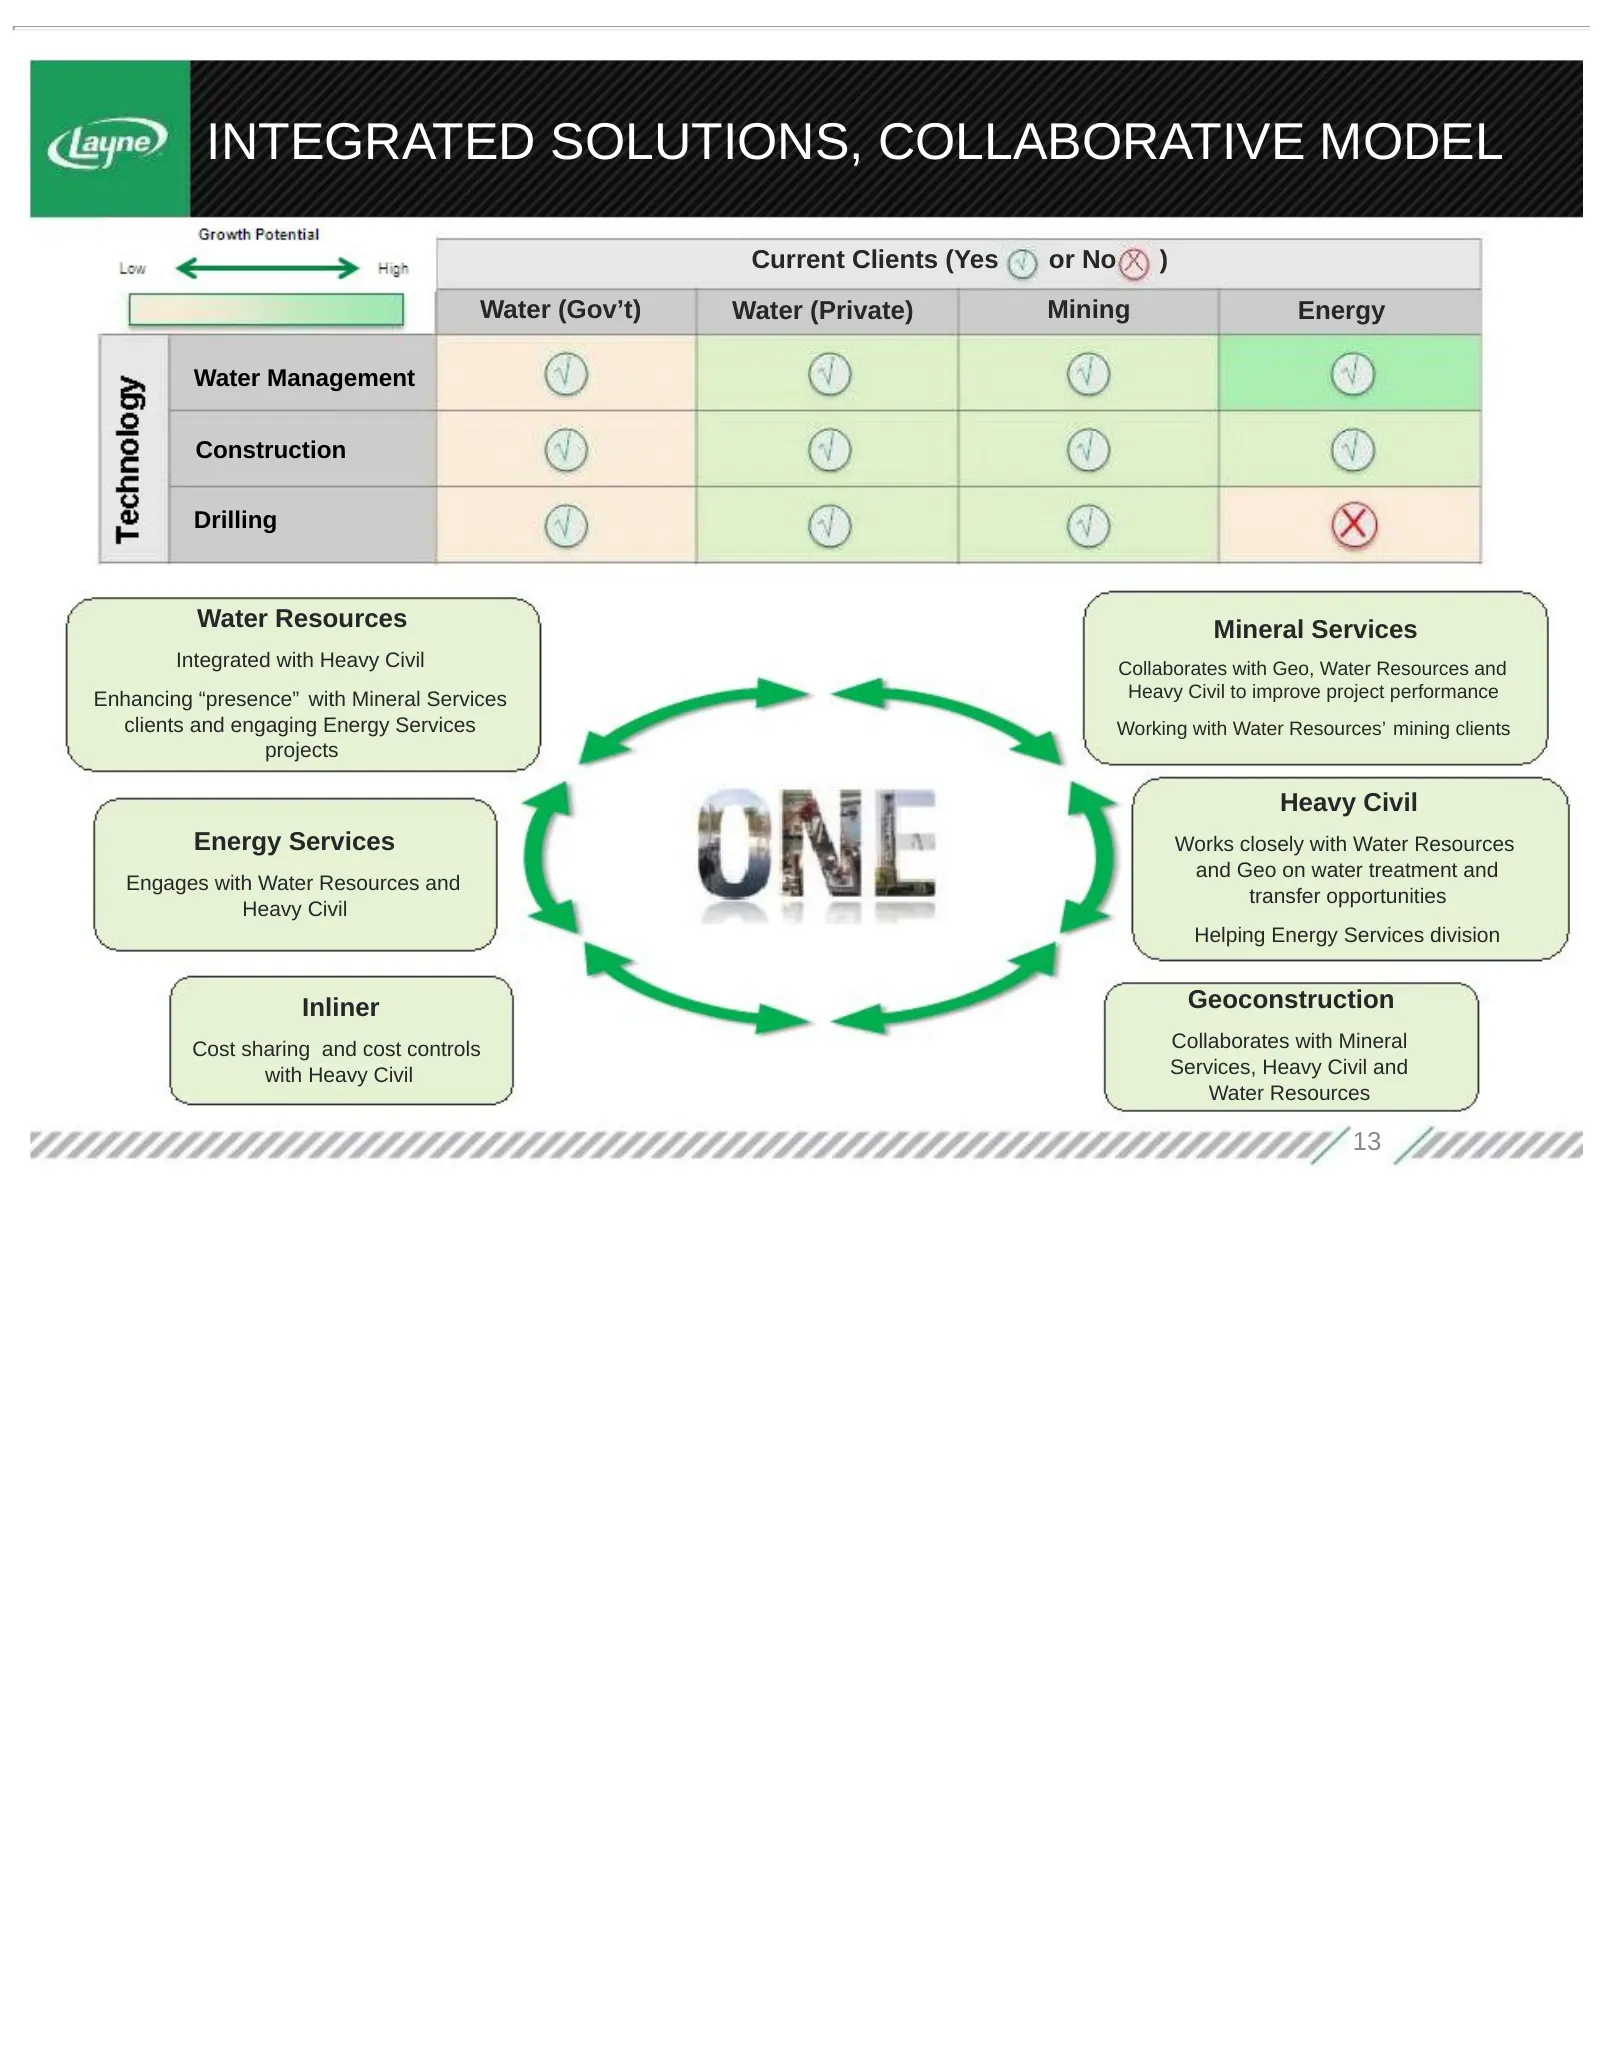
INTEGRATED SOLUTIONS, COLLABORATIVE MODEL Current Clients (Yes or No ) Water (Gov’t) Water (Private) Mining Energy Water Management Construction Drilling Water Resources Mineral Services Integrated with Heavy Civil Collaborates with Geo, Water Resources and Enhancing “presence” with Mineral Services
Slide 14: Industry and End Market Trends
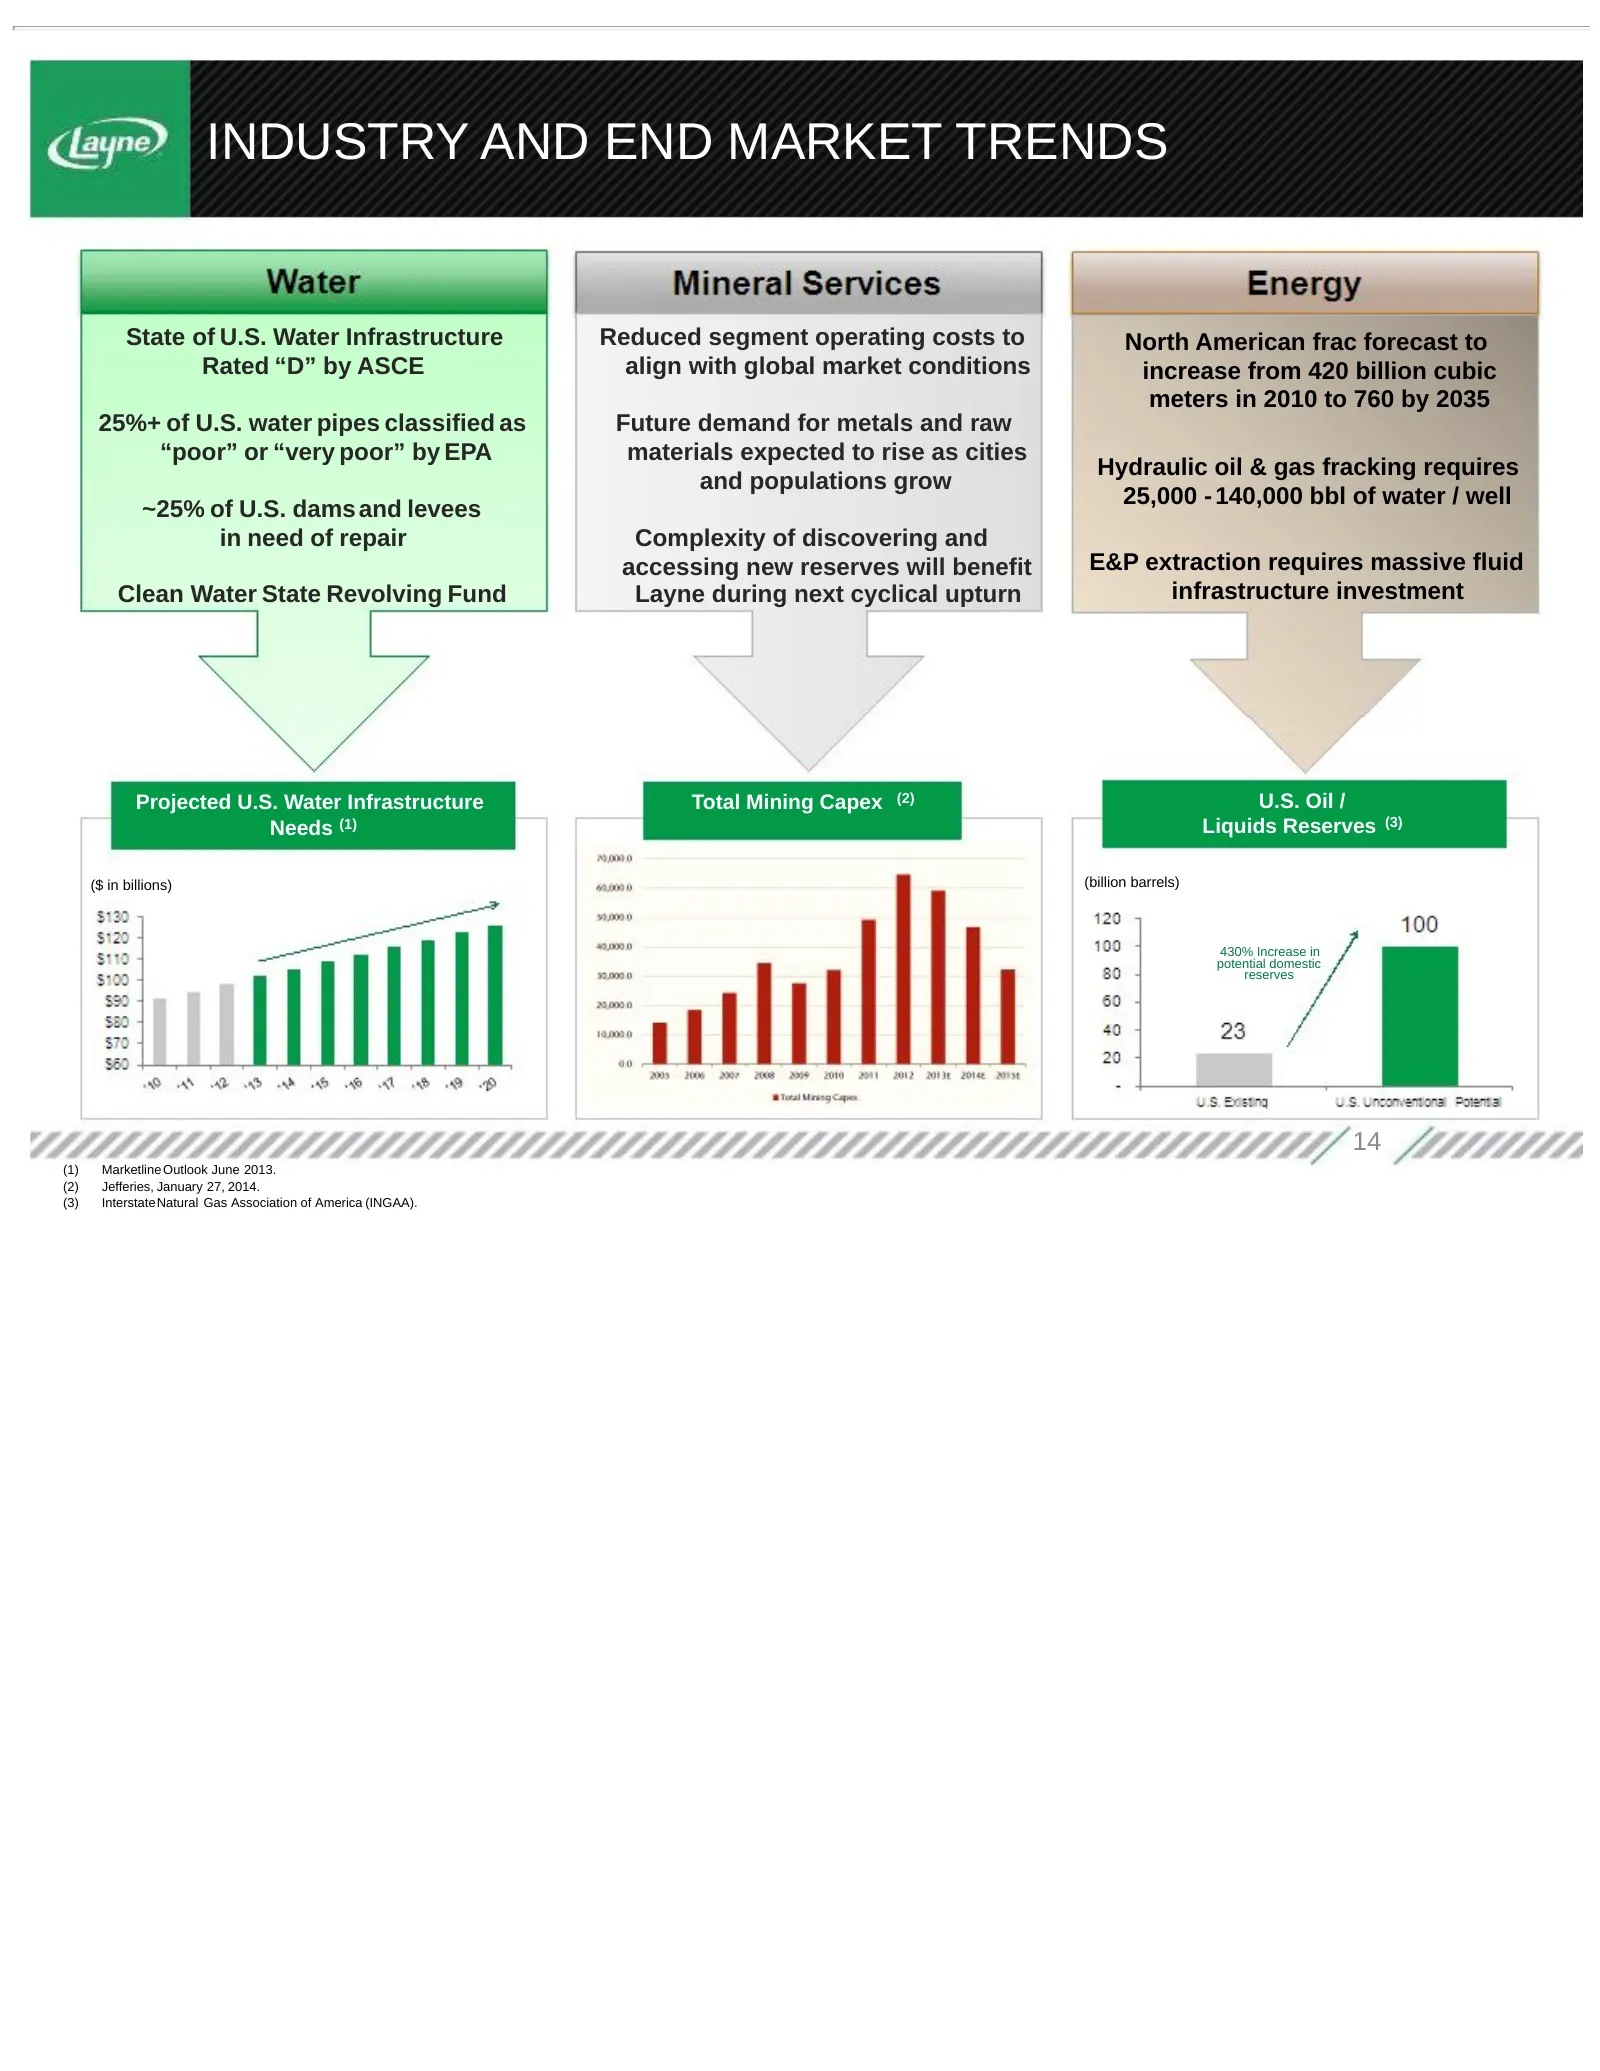
INDUSTRY AND END MARKET TRENDS State of U.S. Water Infrastructure Reduced segment operating costs to North American frac forecast to Rated “D” by ASCE align with global market conditions increase from 420 billion cubic meters in 2010 to 760 by 2035 25%+ of U.S. water pipes classified as Future deman
Slide 15: Growth Initiatives
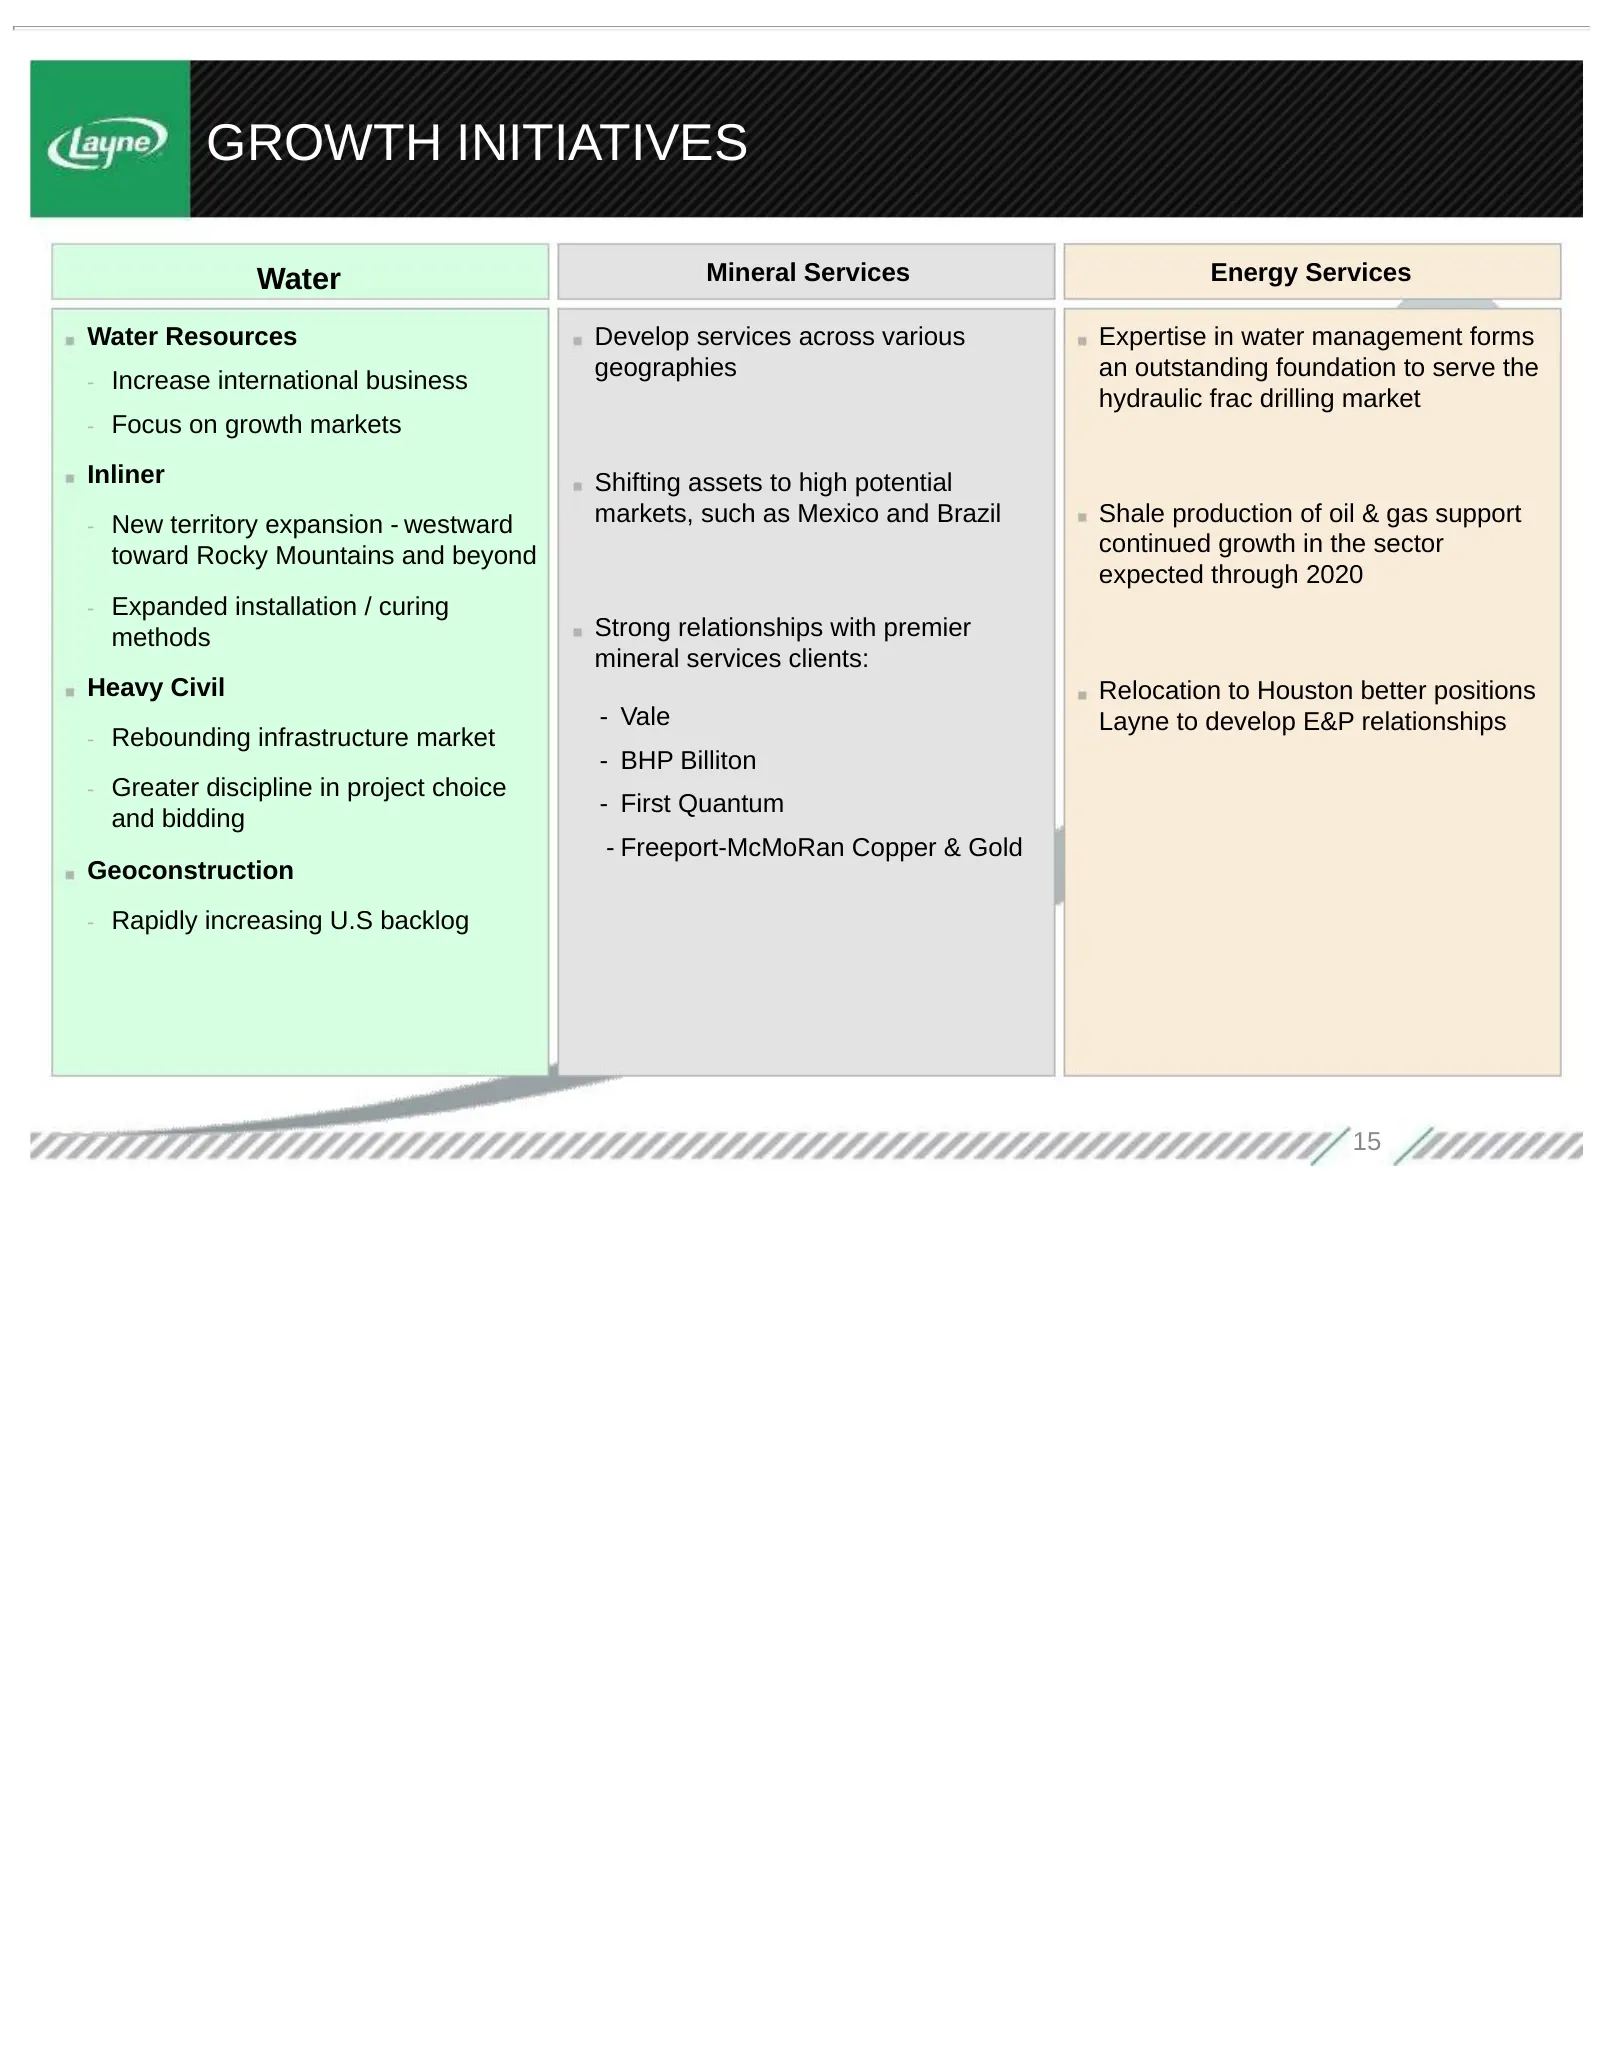
GROWTH INITIATIVES Water Mineral Services Energy Services Water Resources Develop services across various Expertise in water management forms - Increase international business geographies an outstanding foundation to serve the hydraulic frac drilling market - Focus on growth markets Inliner Shifting
Slide 16: New Management Team with Clear Vision
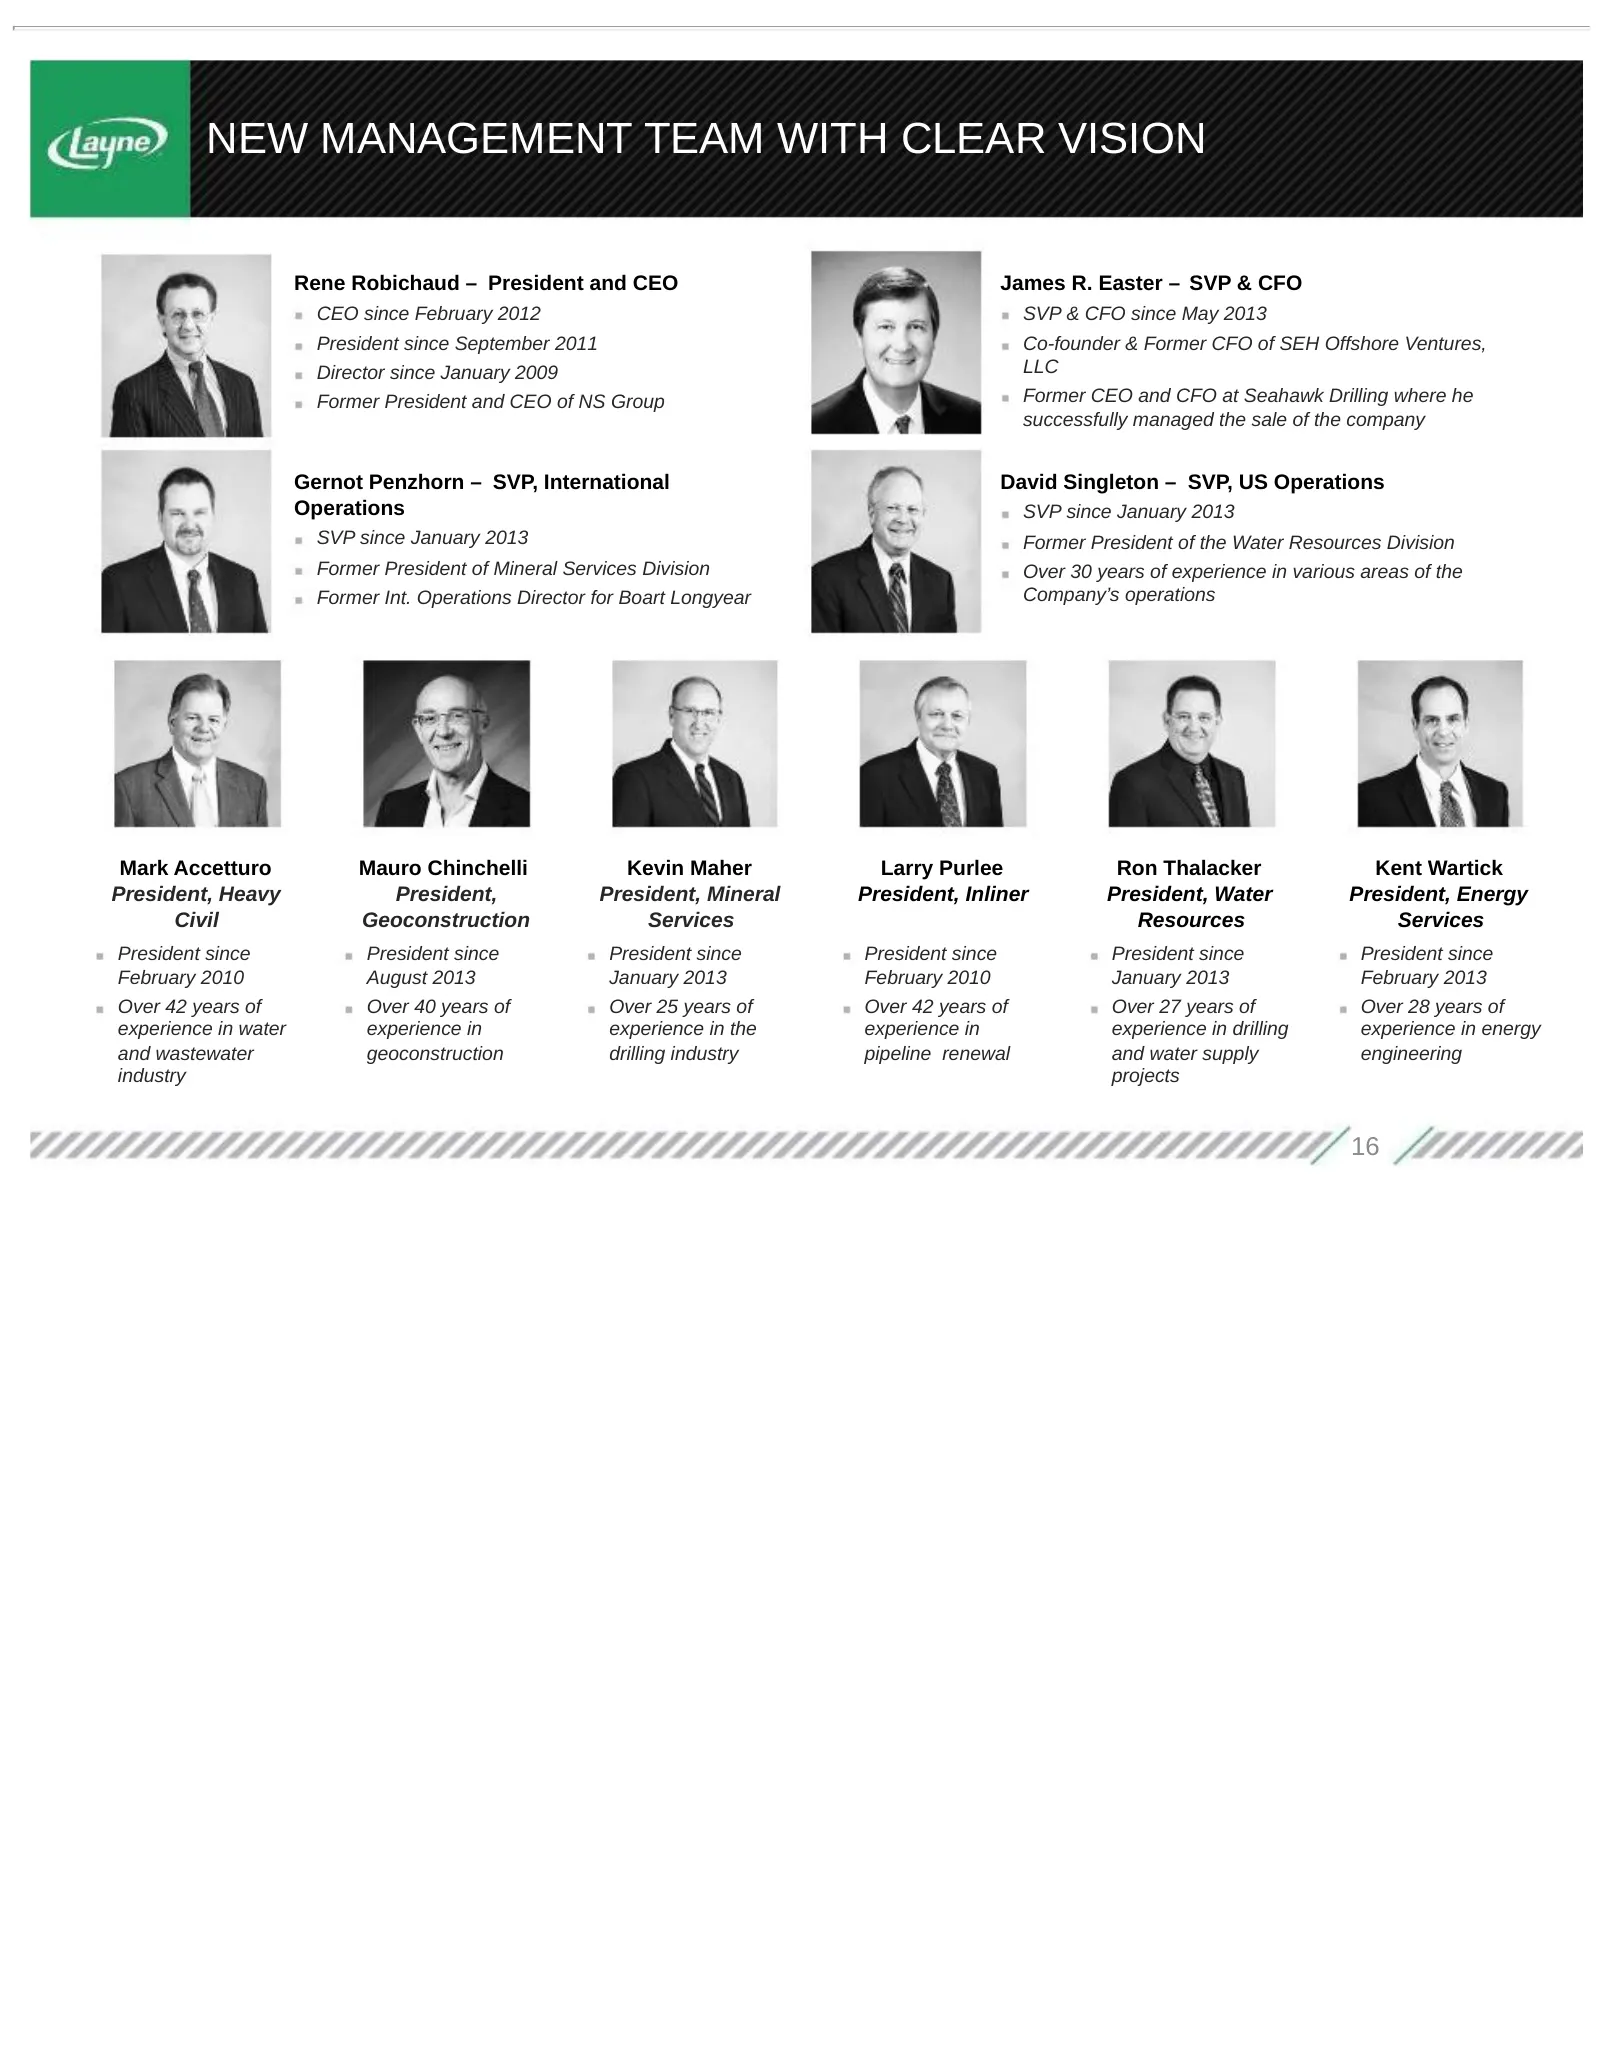
NEW MANAGEMENT TEAM WITH CLEAR VISION Rene Robichaud – President and CEO James R. Easter – SVP & CFO CEO since February 2012 SVP & CFO since May 2013 President since September 2011 Co-founder & Former CFO of SEH Offshore Ventures, Director since January 2009 LLC Former President and CEO of NS Group
Slide 17: Diversified Backlog & Revenue Base
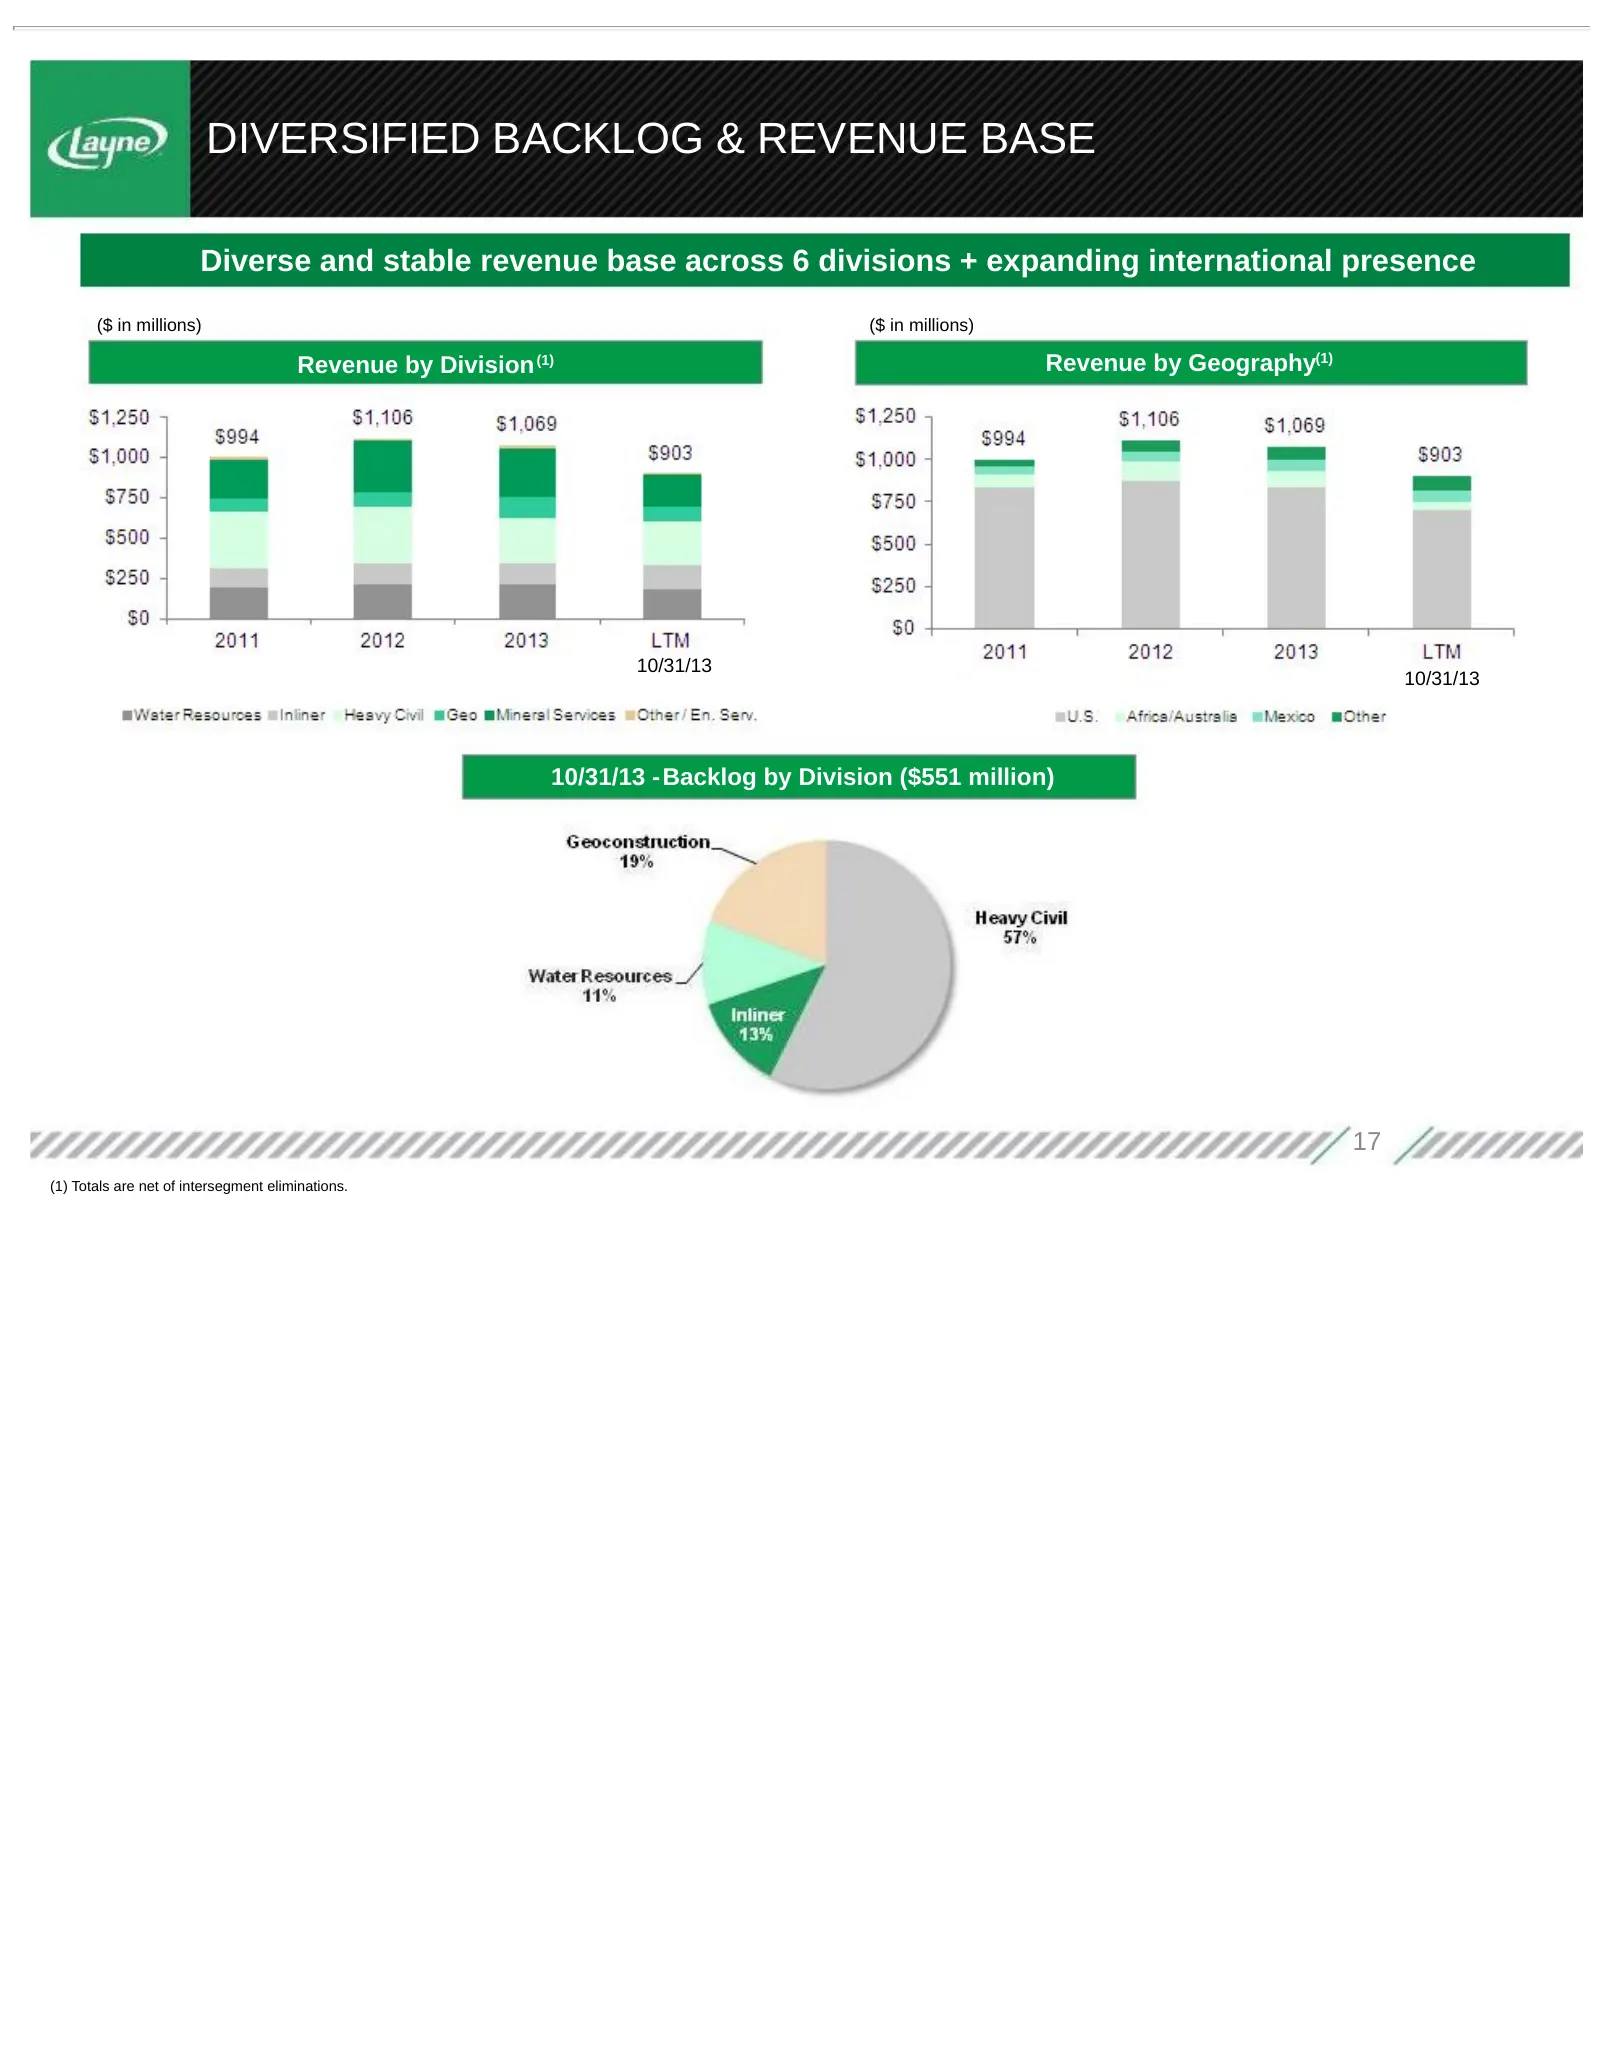
DIVERSIFIED BACKLOG & REVENUE BASE Diverse and stable revenue base across 6 divisions + expanding international presence ($ in millions) ($ in millions) Revenue by Division (1) Revenue by Geography(1) 10/31/13 10/31/13 10/31/13 -Backlog by Division ($551 million) 17 (1) Totals are net of intersegmen
Slide 18: Summary of Financial Performance
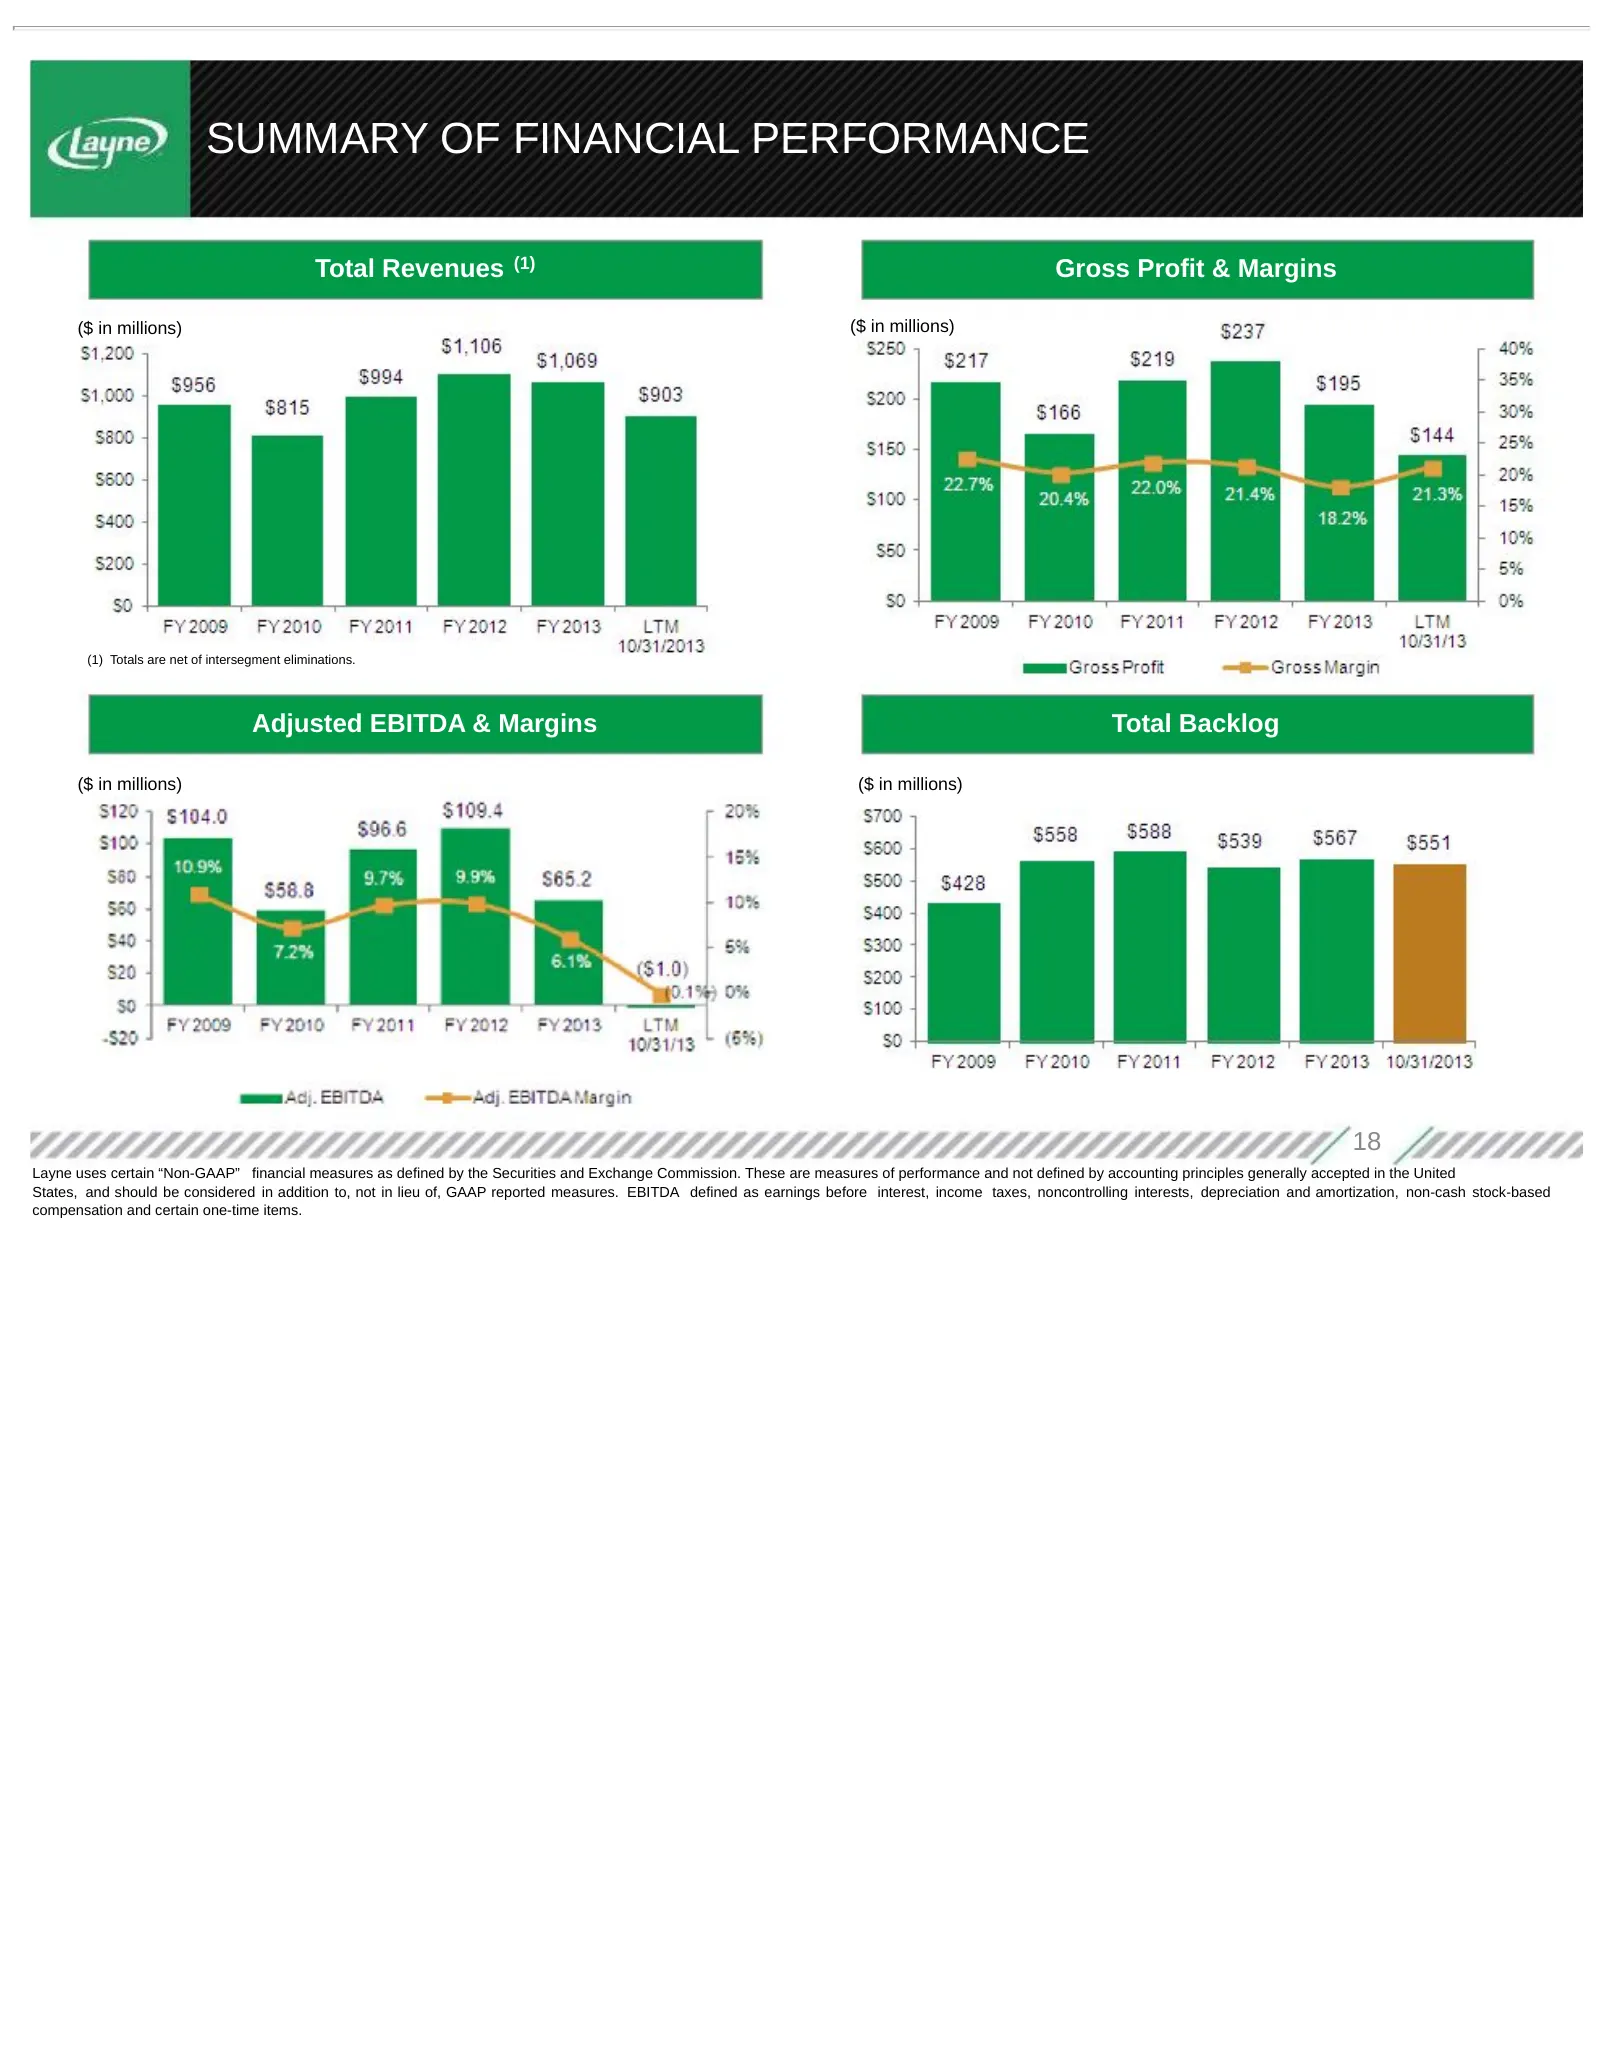
SUMMARY OF FINANCIAL PERFORMANCE Total Revenues (1) Gross Profit & Margins ($ in millions) ($ in millions) (1) Totals are net of intersegment eliminations. Adjusted EBITDA & Margins Total Backlog ($ in millions) ($ in millions) 18 Layne uses certain “Non-GAAP” financial measures as defined by the Se
Slide 19: Appendix
APPENDIX 19
Slide 20: Three and Nine Months Financial Data
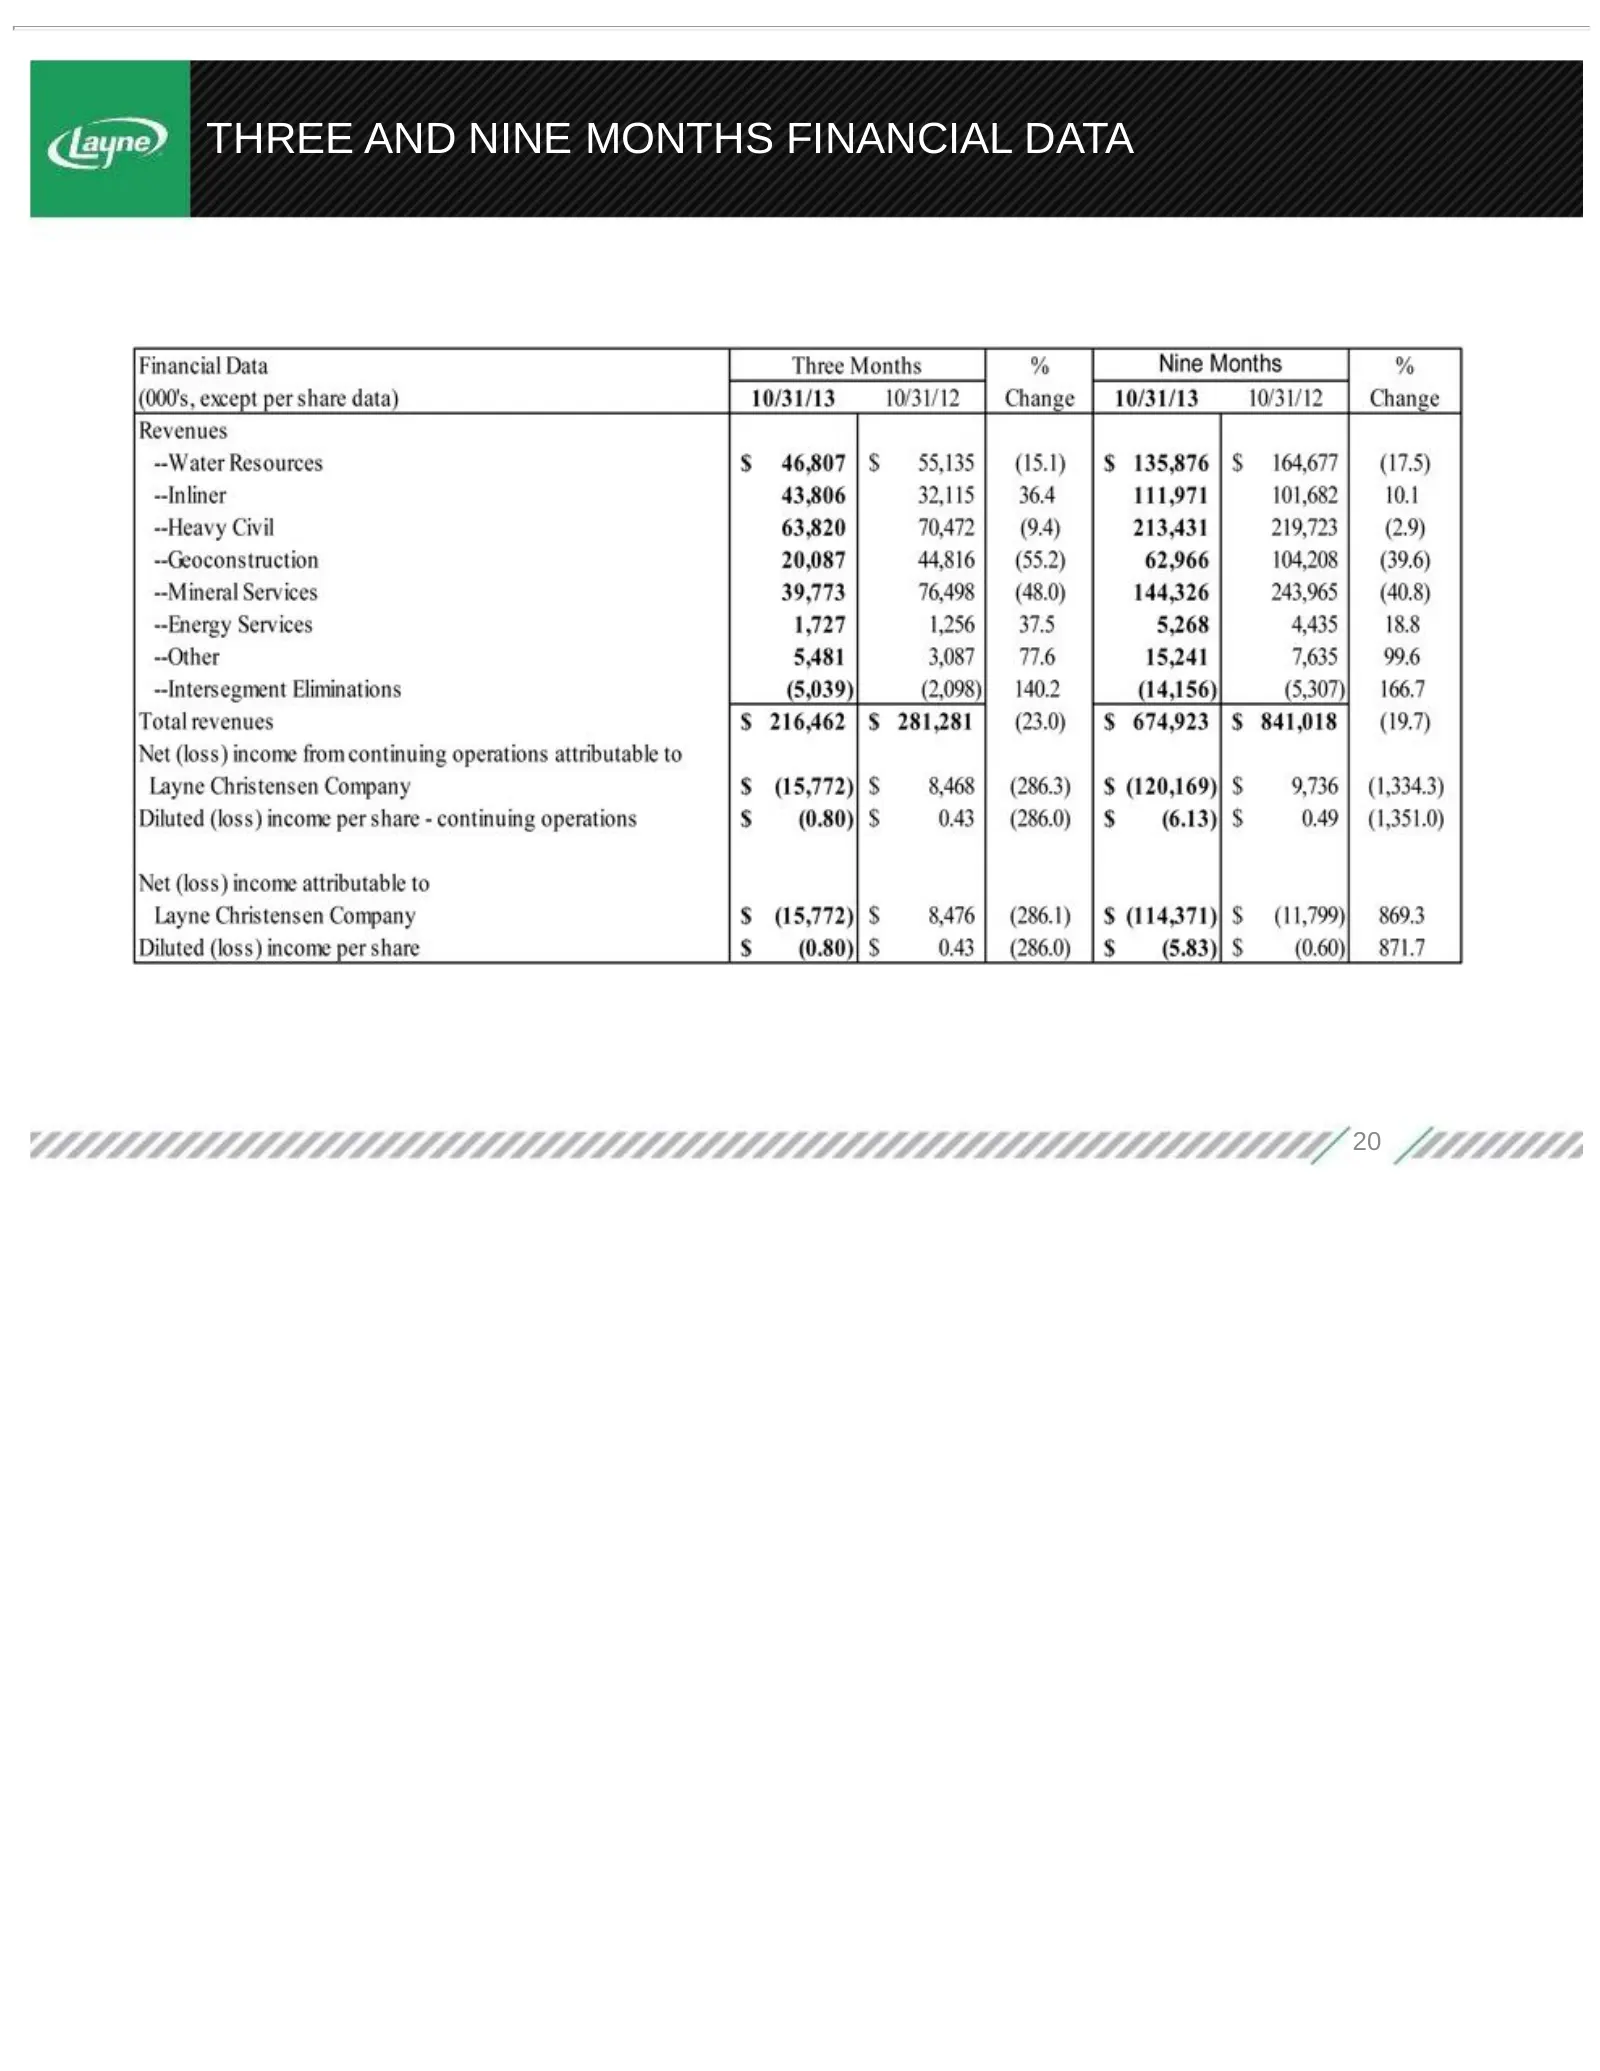
THREE AND NINE MONTHS FINANCIAL DATA 20
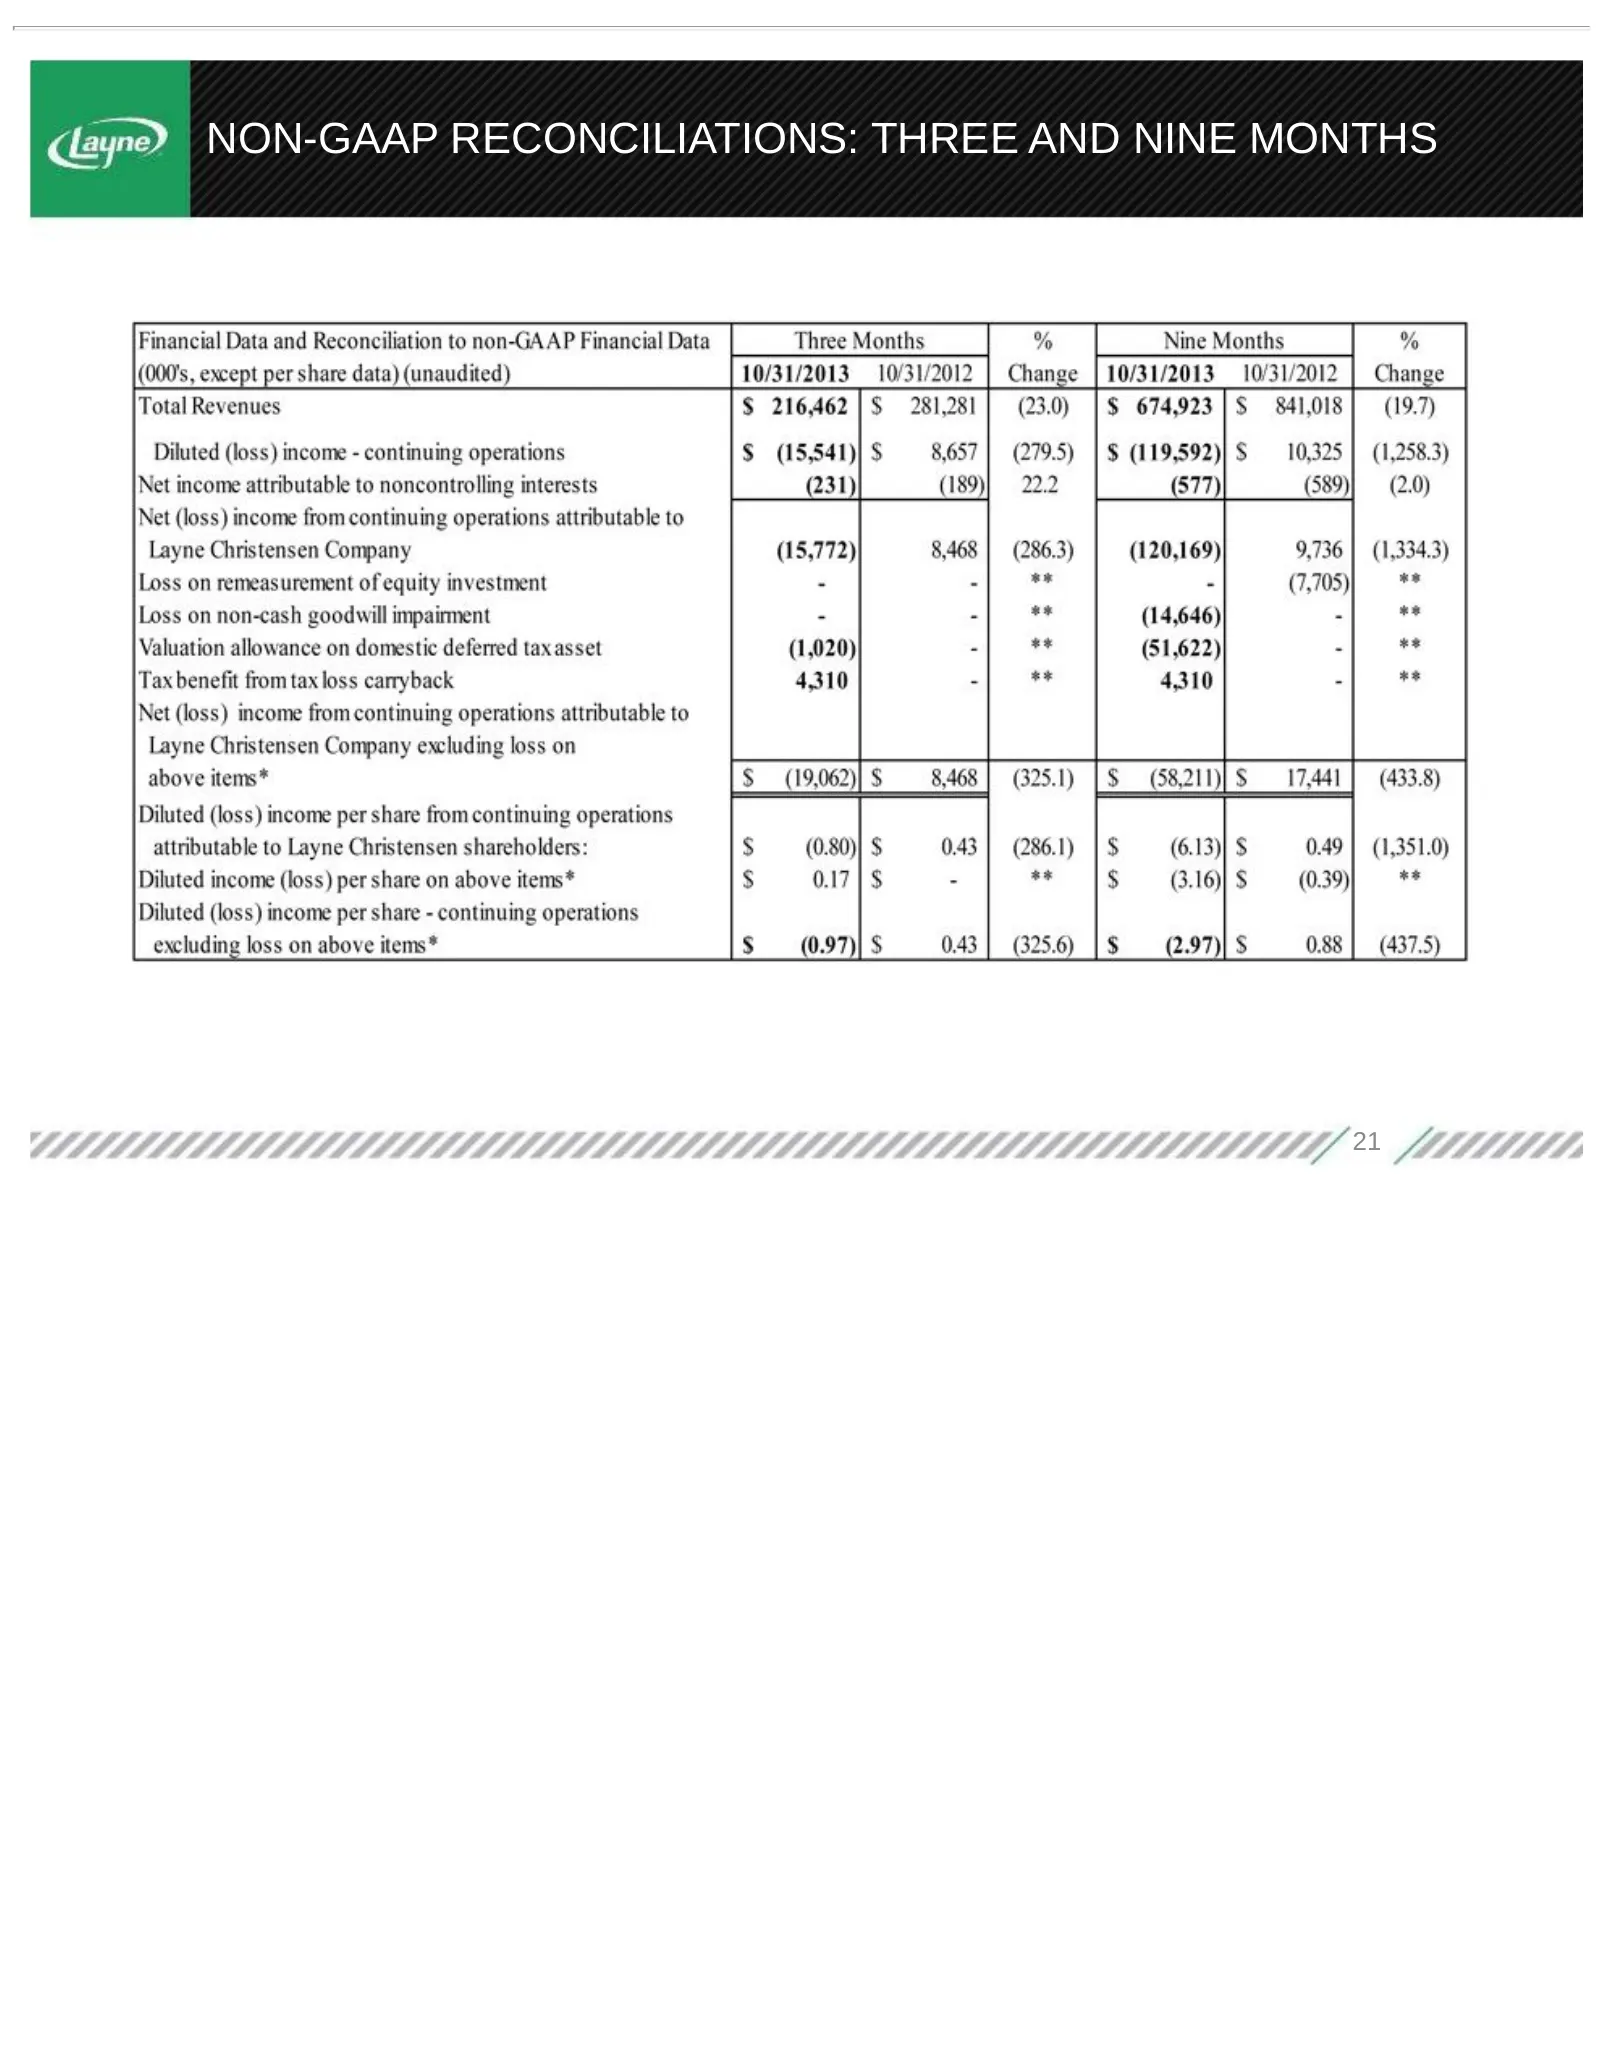
Slide 21: Non-GAAP Reconciliations: Three and Nine Months
NON-GAAP RECONCILIATIONS: THREE AND NINE MONTHS 21
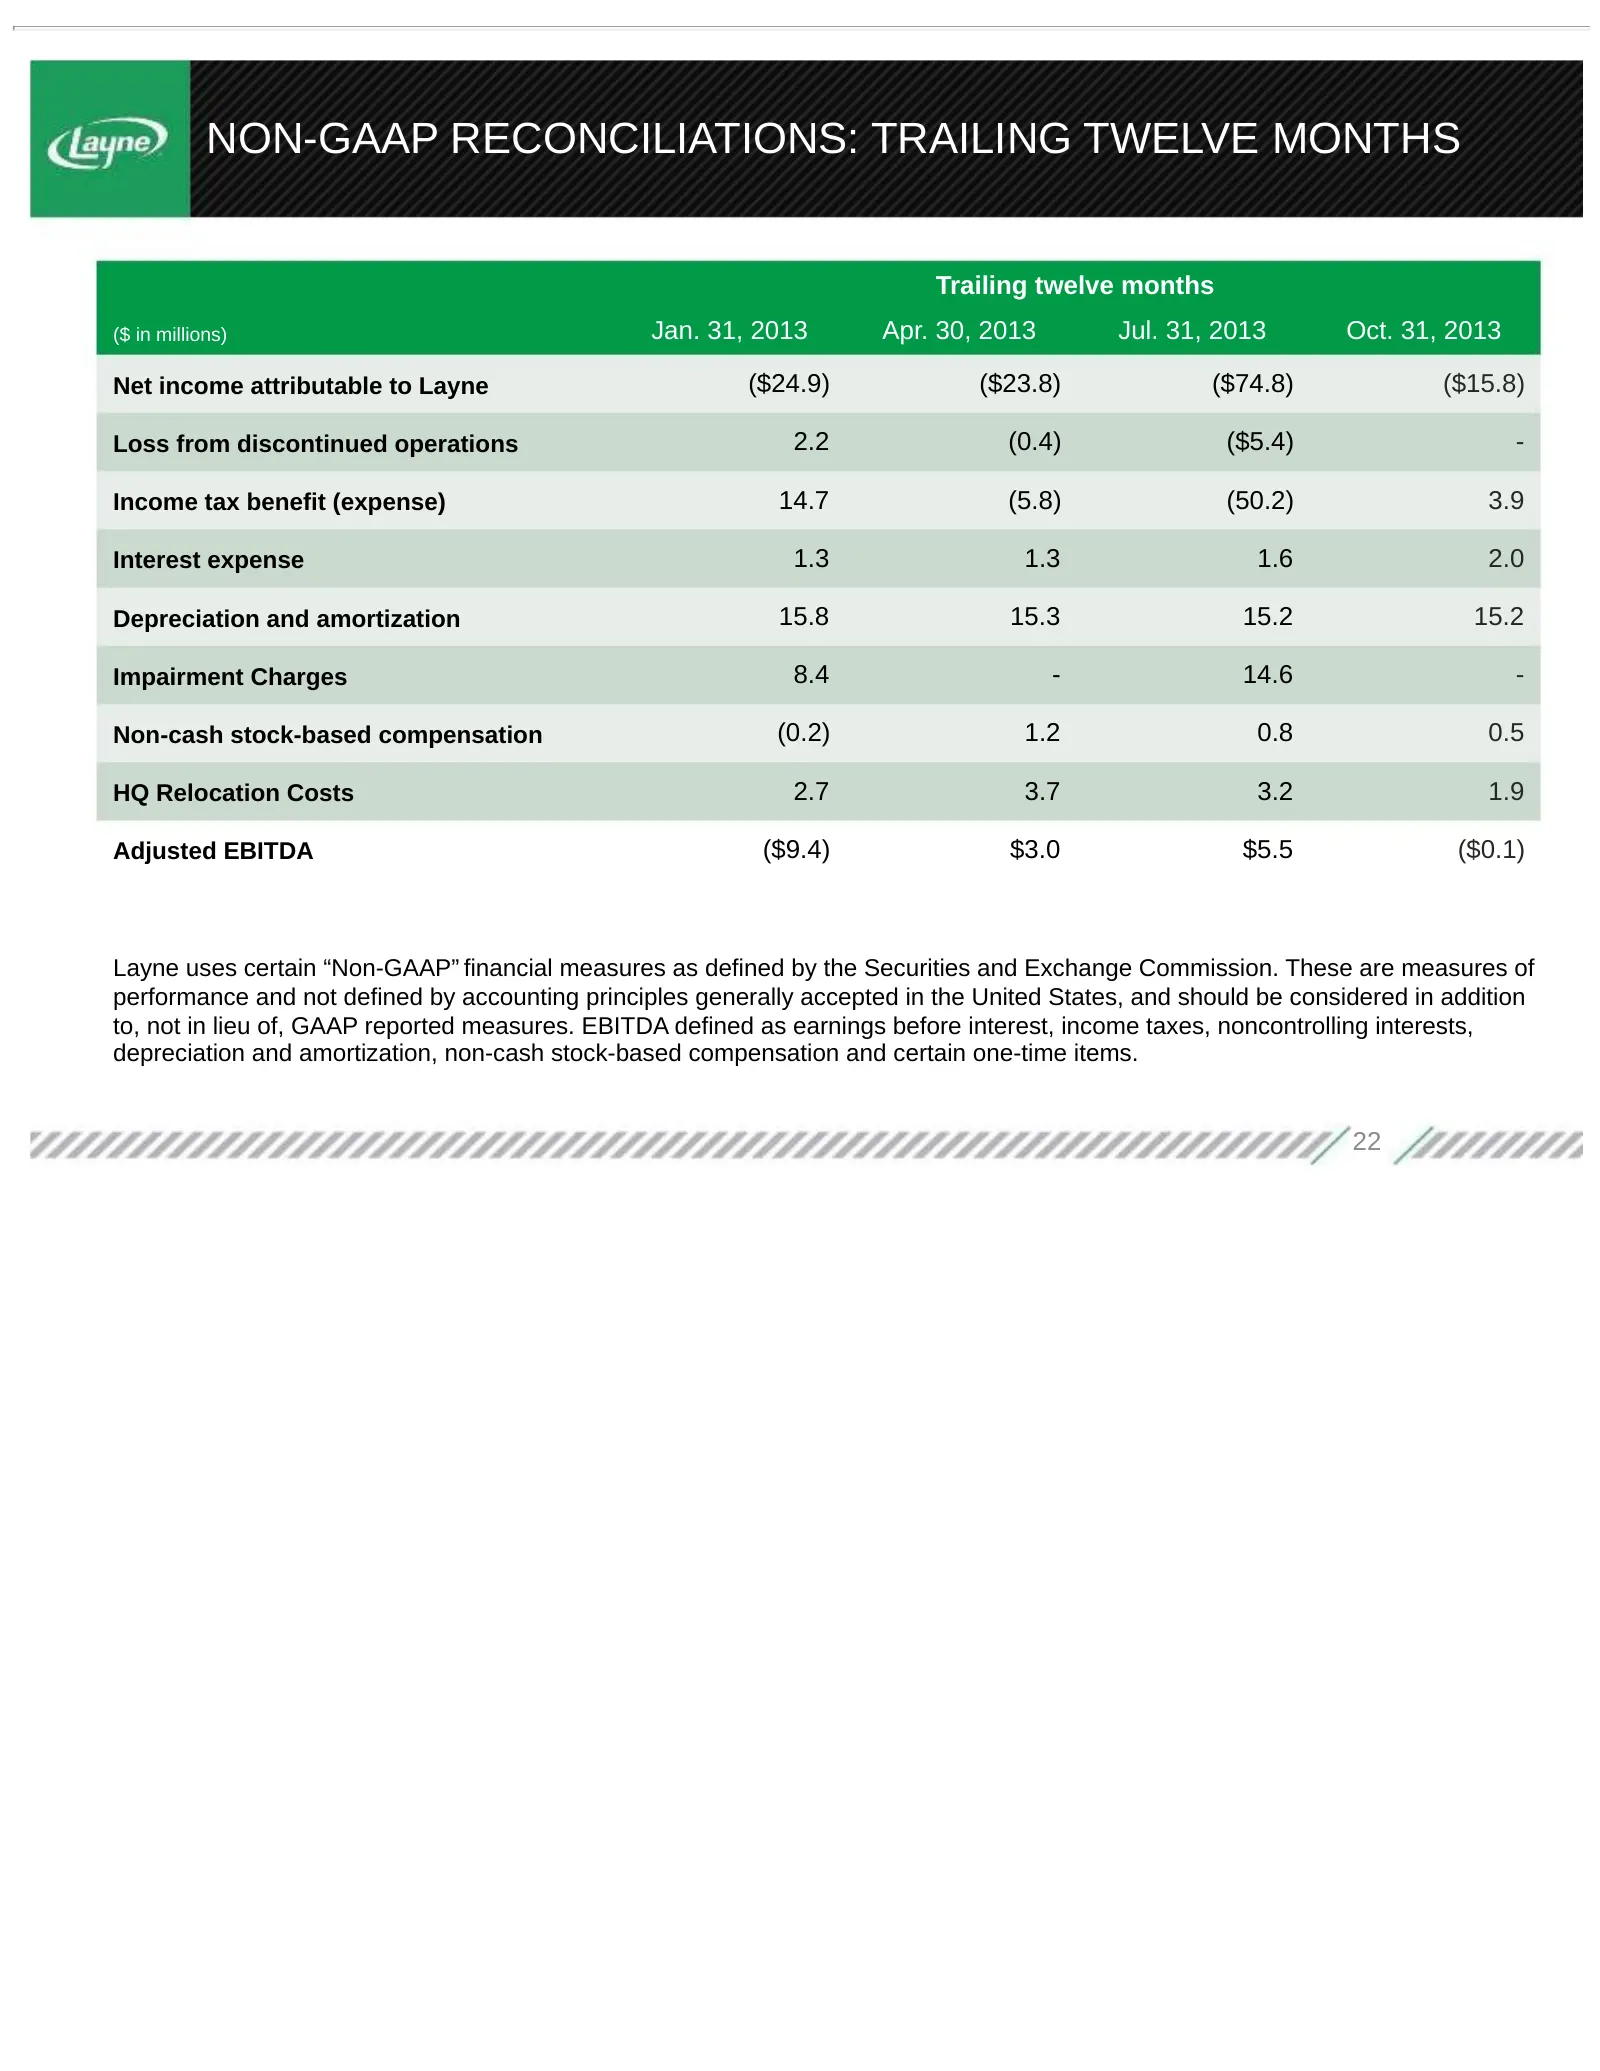
Slide 22: Non-GAAP Reconciliations: Trailing Twelve Months
NON-GAAP RECONCILIATIONS: TRAILING TWELVE MONTHS Trailing twelve months ($ in millions) Jan. 31, 2013 Apr. 30, 2013 Jul. 31, 2013 Oct. 31, 2013 Net income attributable to Layne ($24.9) ($23.8) ($74.8) ($15.8) Loss from discontinued operations 2.2 (0.4) ($5.4) - Income tax benefit (expense) 14.7 (5.8
Slide 23: Contact
CONTACT Jim Easter, Chief Financial Officer Devin Sullivan, SVP 281.475.2694 212.836.9608 jim.easter@layne.com dsullivan@equityny.com www.layne.com www.theequitygroup.com 23
Source: SEC EDGAR · 8-K filed Feb 11, 2014
More decks from Layne Christensen Company
 Southwest IDEAS Investor Conference November 201730 slides · Nov 16, 2017
 D.A. Davidson 16th Annual Engineering & Construction Conference 201729 slides · Sep 20, 2017
 Jefferies 2017 Industrials Conference29 slides · Aug 7, 2017
 Gabelli & Company's 27th Annual Pump, Valve, & Water Systems Symposium (March 2017)29 slides · Mar 1, 2017
 D.A. Davidson Engineering & Construction Conference 201627 slides · Sep 8, 2016
 Jefferies Industrials Conference 201623 slides · Aug 10, 2016