HCC Insurance — Q1 2011 Earnings Presentation
17 slides from HCC Insurance's earnings presentation, May 18, 2011
Slide 1: First Quarter 2011 Investor Presentation
First Quarter 2011 Investor Presentation May 18, 2011
Slide 2: Notice About This Presentation
Notice About This Presentation ABOUT FORWARD-LOOKING STATEMENTS: This presentation contains certain “forward-looking statements” within the meaning of Section 27A of the Securities Act of 1933 and Section 21E of the Securities Exchange Act of 1934, which are intended to be covered by the safe harbor
Slide 3: HCC Overview
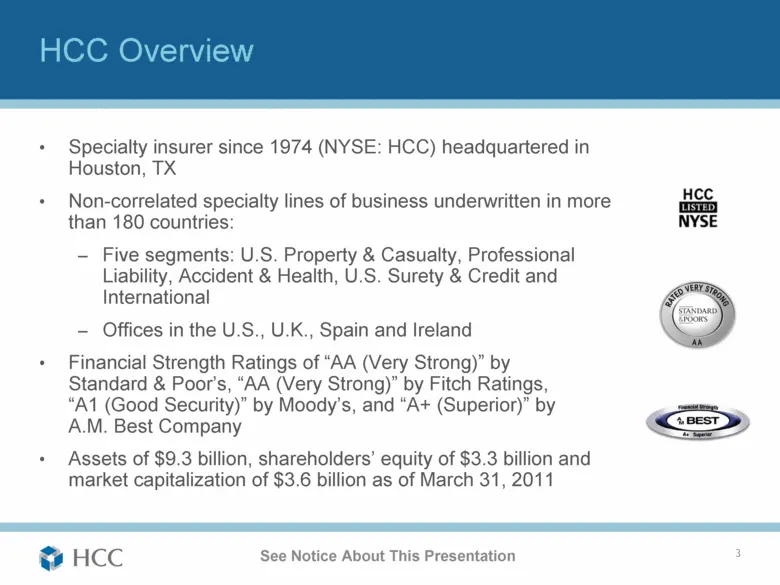
HCC Overview Specialty insurer since 1974 (NYSE: HCC) headquartered in Houston, TX Non-correlated specialty lines of business underwritten in more than 180 countries: Five segments: U.S. Property & Casualty, Professional Liability, Accident & Health, U.S. Surety & Credit and International Offices in
Slide 4: YTD 2011 Operating Highlights
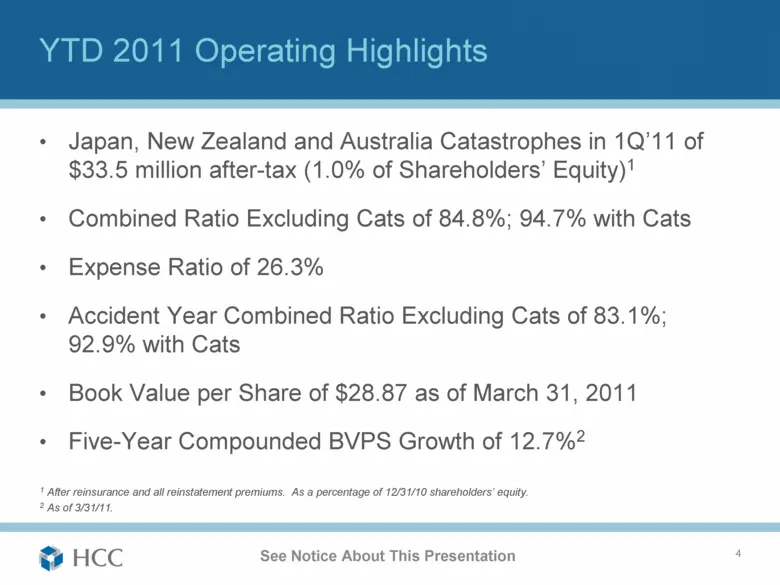
YTD 2011 Operating Highlights Japan, New Zealand and Australia Catastrophes in 1Q’11 of $33.5 million after-tax (1.0% of Shareholders’ Equity)1 Combined Ratio Excluding Cats of 84.8%; 94.7% with Cats Expense Ratio of 26.3% Accident Year Combined Ratio Excluding Cats of 83.1%; 92.9% with Cats Book Va
Slide 5: Segment Overview
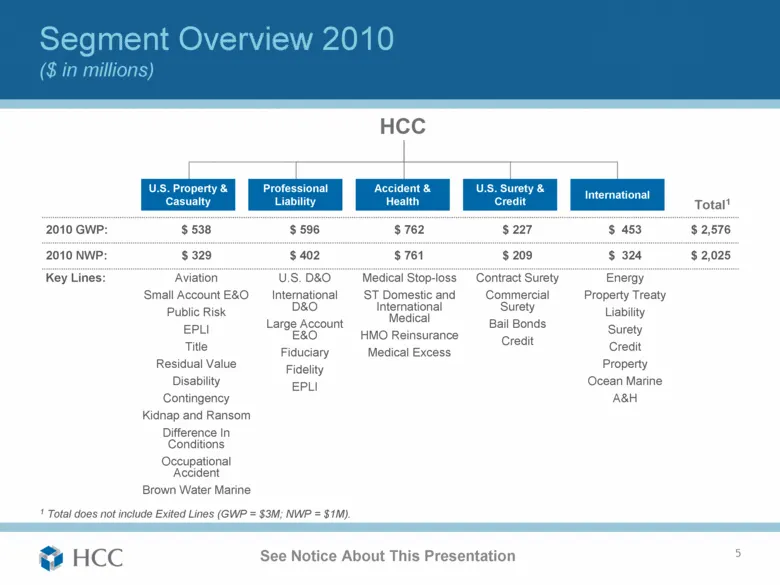
Segment Overview 2010 ($ in millions) 5 1 Total does not include Exited Lines (GWP = $3M; NWP = $1M). Total1 2010 GWP: $ 538 $ 596 $ 762 $ 227 $ 453 $ 2,576 2010 NWP: $ 329 $ 402 $ 761 $ 209 $ 324 $ 2,025 Key Lines: Aviation Small Account E&O Public Risk EPLI Title Residual Value Disability Continge
Slide 6: Segment Comparison 2010
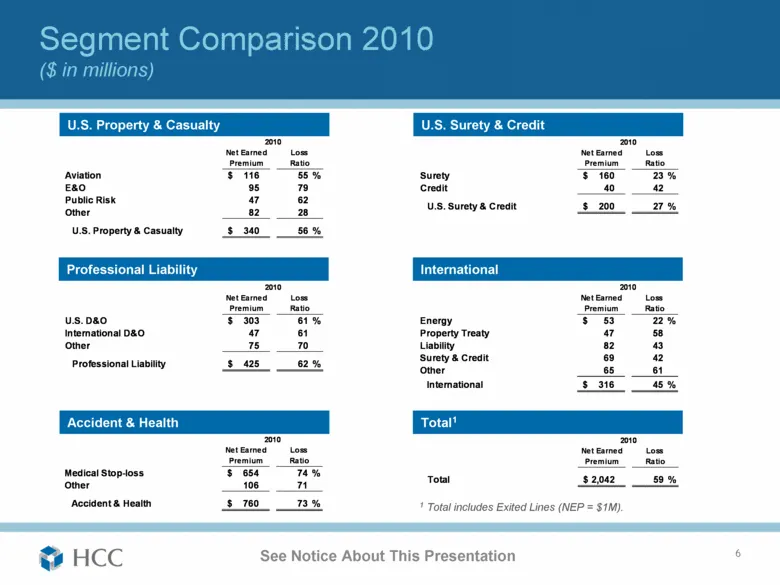
Segment Comparison 2010 ($ in millions) 6 U.S. Property & Casualty Professional Liability Accident & Health U.S. Surety & Credit International Total1 1 Total includes Exited Lines (NEP = $1M). Net Earned Premium Aviation 116 $ 55 % E&O 95 79 Public Risk 47 62 Other 82 28 U.S. Property & Casualty 340
Slide 7: Segment Comparison YTD 1Q'11
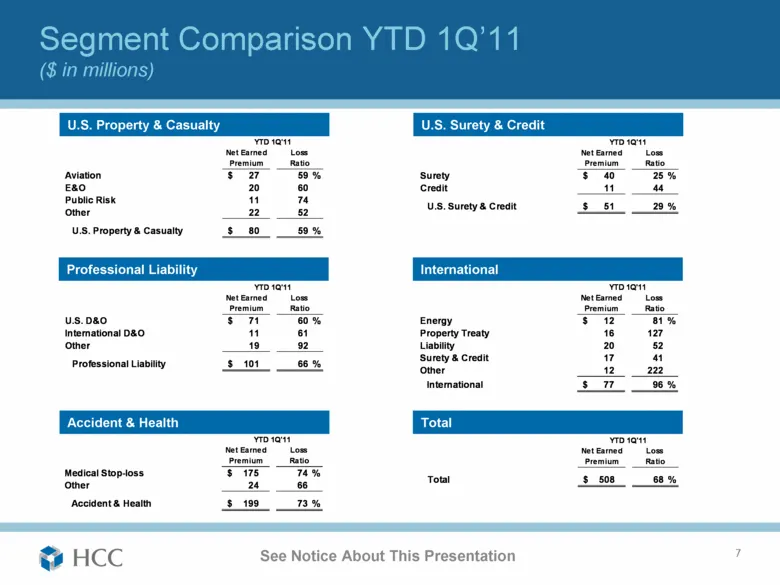
Segment Comparison YTD 1Q’11 ($ in millions) 7 U.S. Property & Casualty Professional Liability Accident & Health U.S. Surety & Credit International Total Net Earned Premium Aviation 27 $ 59 % E&O 20 60 Public Risk 11 74 Other 22 52 U.S. Property & Casualty 80 $ 59 % YTD 1Q'11 Loss Ratio Net Earned P
Slide 8: Historical Performance
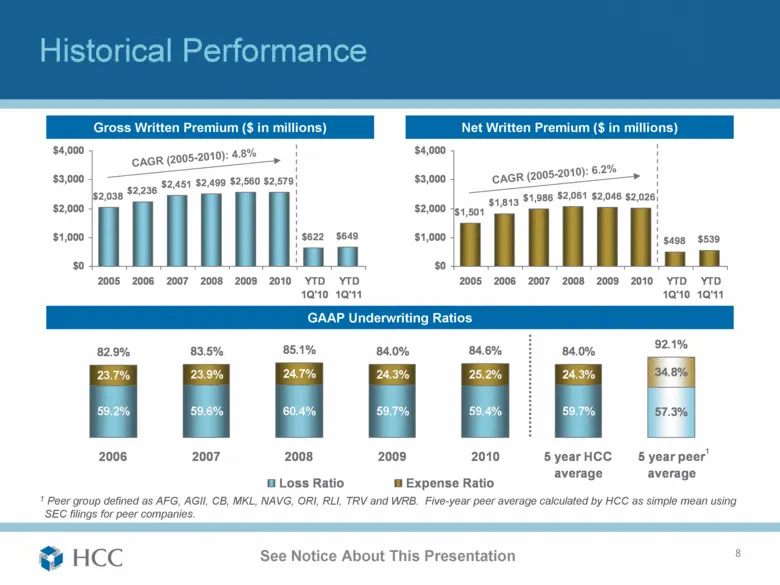
Historical Performance 8 1 Peer group defined as AFG, AGII, CB, MKL, NAVG, ORI, RLI, TRV and WRB. Five-year peer average calculated by HCC as simple mean using SEC filings for peer companies. Gross Written Premium ($ in millions) GAAP Underwriting Ratios Net Written Premium ($ in millions) 1 CAGR (2
Slide 9: YTD 1Q'11 Underwriting Performance
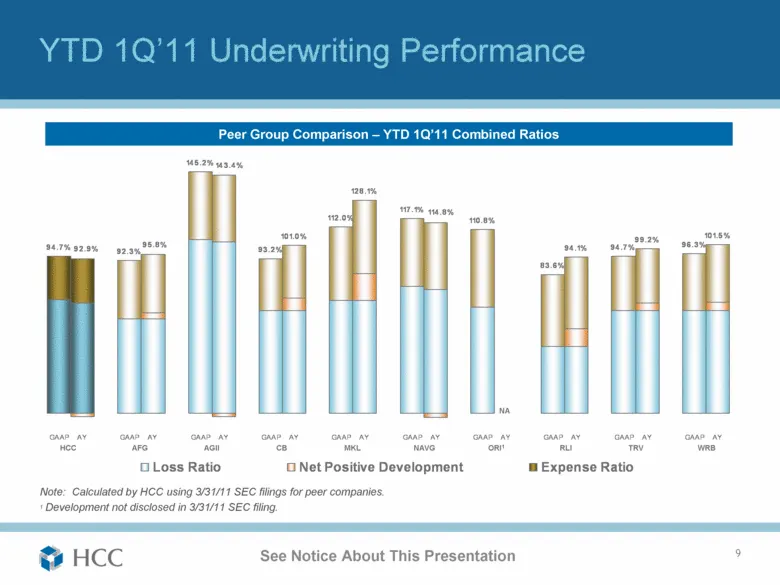
YTD 1Q’11 Underwriting Performance 9 HCC AGII MKL NAVG ORI1 WRB AFG RLI CB TRV Note: Calculated by HCC using 3/31/11 SEC filings for peer companies. 1 Development not disclosed in 3/31/11 SEC filing. Peer Group Comparison – YTD 1Q’11 Combined Ratios NA 94.7% 92.3% 145.2% 93.2% 101.0% 112.0% 128.1% 1
Slide 10: Strong BVPS Growth
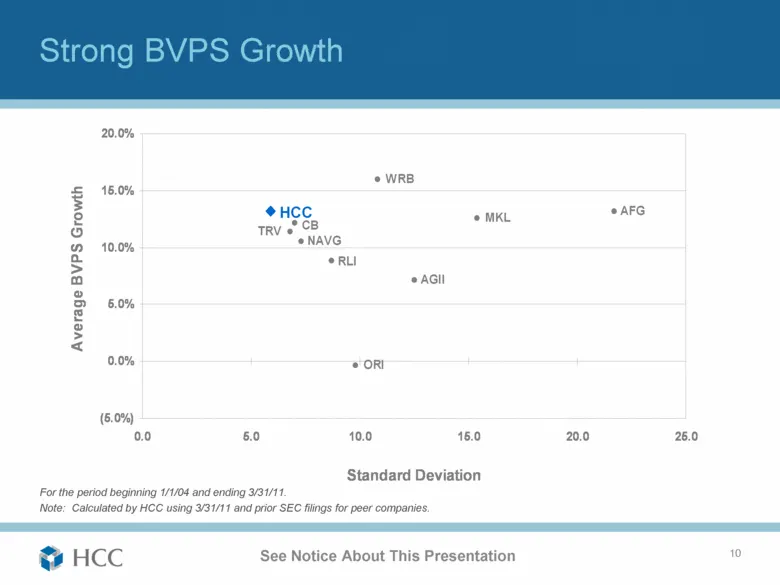
Strong BVPS Growth 10 For the period beginning 1/1/04 and ending 3/31/11. Note: Calculated by HCC using 3/31/11 and prior SEC filings for peer companies. WRB ORI HCC AGII CB MKL NAVG RLI TRV AFG (5.0%) 0.0% 5.0% 10.0% 15.0% 20.0% 0.0 5.0 10.0 15.0 20.0 25.0 Standard Deviation Average BVPS Growth
Slide 11: Characteristics That Make HCC Unique
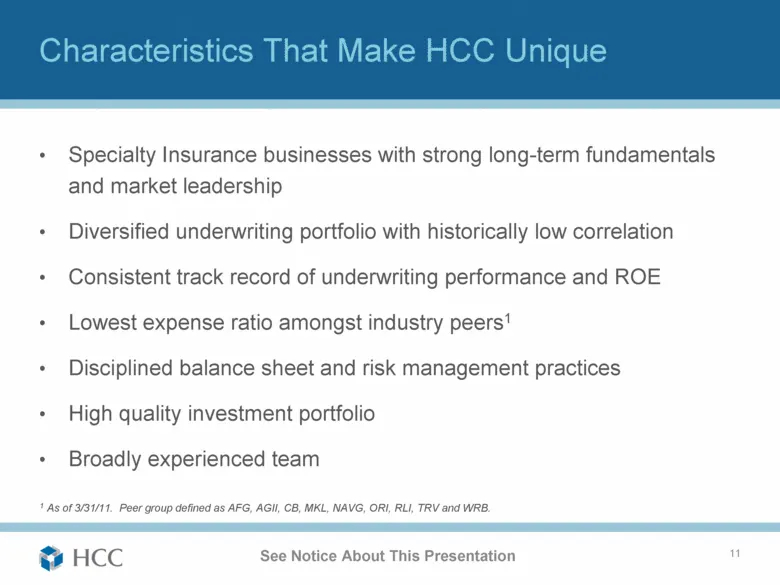
Characteristics That Make HCC Unique Specialty Insurance businesses with strong long-term fundamentals and market leadership Diversified underwriting portfolio with historically low correlation Consistent track record of underwriting performance and ROE Lowest expense ratio amongst industry peers1 D
Slide 12: Investment Portfolio
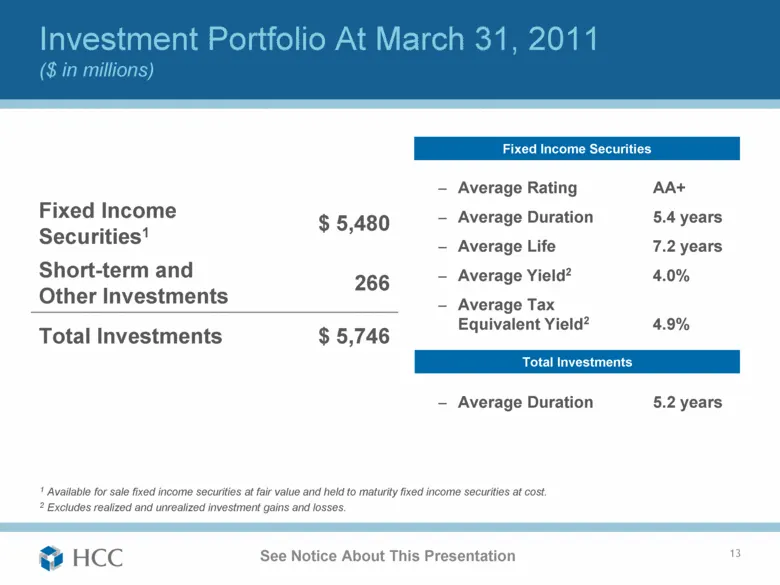
Investment Portfolio At March 31, 2011 ($ in millions) 13 1 Available for sale fixed income securities at fair value and held to maturity fixed income securities at cost. 2 Excludes realized and unrealized investment gains and losses. Average Rating AA+ Average Duration 5.4 years Average Life 7.2 ye
Slide 13: Investment Analysis
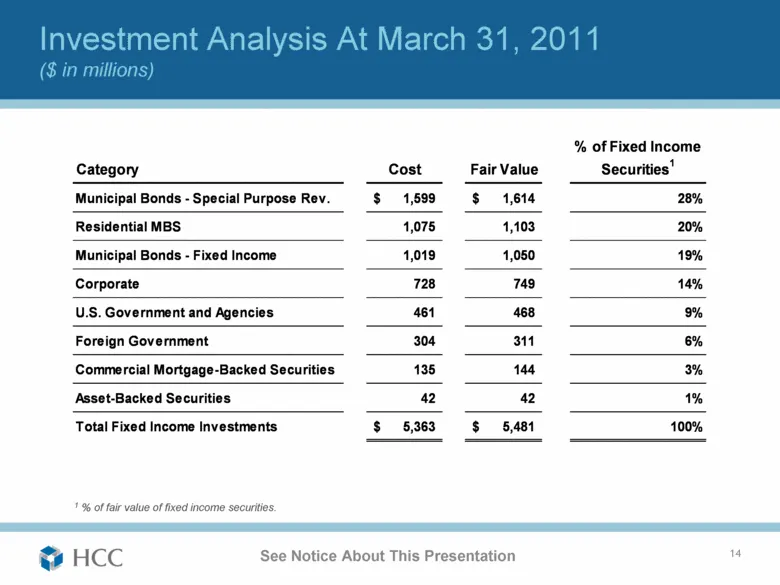
Investment Analysis At March 31, 2011 ($ in millions) 14 1 % of fair value of fixed income securities. Category Cost Fair Value % of Fixed Income Securities 1 Municipal Bonds - Special Purpose Rev. 1,599 $ 1,614 $ 28% Residential MBS 1,075 1,103 20% Municipal Bonds - Fixed Income 1,019 1,050 19% Cor
Slide 14: Total Value Creation
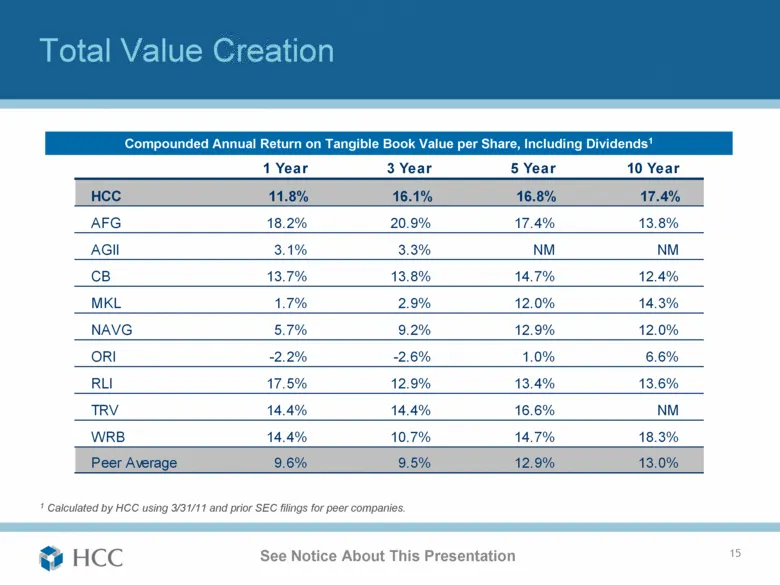
Total Value Creation 15 1 Calculated by HCC using 3/31/11 and prior SEC filings for peer companies. Compounded Annual Return on Tangible Book Value per Share, Including Dividends1 1 Year 3 Year 5 Year 10 Year HCC 11.8% 16.1% 16.8% 17.4% AFG 18.2% 20.9% 17.4% 13.8% AGII 3.1% 3.3% NM NM CB 13.7% 13.8%
Slide 15: Lowest Financial Leverage Of Peer Group
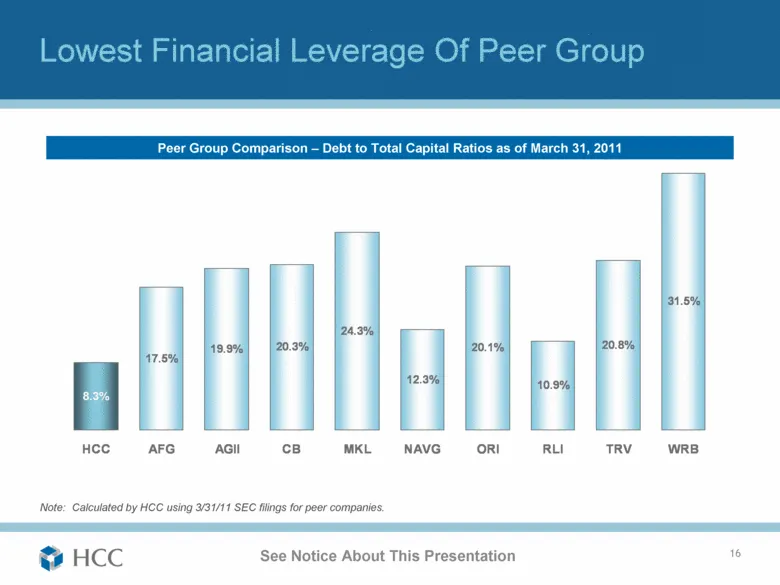
Lowest Financial Leverage Of Peer Group 16 Note: Calculated by HCC using 3/31/11 SEC filings for peer companies. Peer Group Comparison – Debt to Total Capital Ratios as of March 31, 2011 17.5% 19.9% 20.3% 24.3% 12.3% 20.1% 10.9% 20.8% 31.5% 8.3% HCC AFG AGII CB MKL NAVG ORI RLI TRV WRB
Slide 16: Quality Reinsurance Security
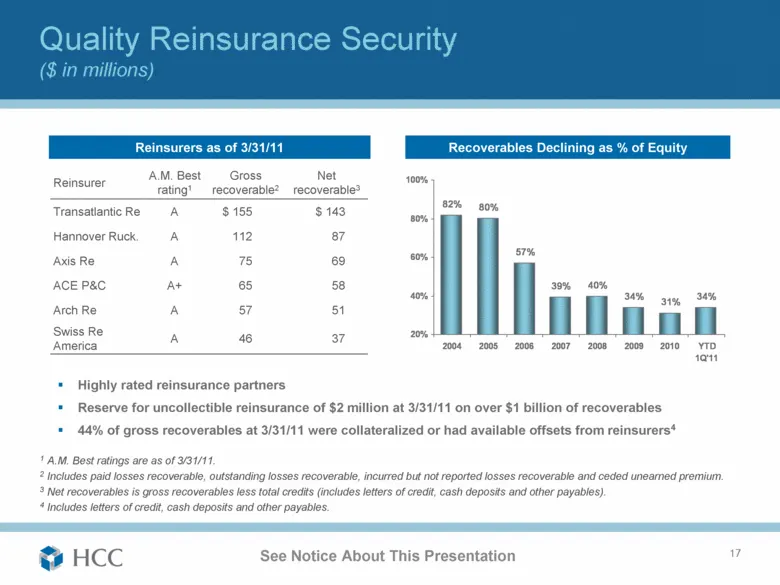
Quality Reinsurance Security ($ in millions) 17 1 A.M. Best ratings are as of 3/31/11. 2 Includes paid losses recoverable, outstanding losses recoverable, incurred but not reported losses recoverable and ceded unearned premium. 3 Net recoverables is gross recoverables less total credits (includes le
Slide 17: HCC's Value Proposition
HCC’s Value Proposition 18 Non-correlated portfolio of business Maintains double-digit margin in very competitive market High quality investment portfolio Strong operating cash flow Experienced management team
Source: SEC EDGAR · 8-K filed May 18, 2011
More decks from HCC Insurance Holdings Inc
 Q2 2015 Earnings Presentation31 slides · Aug 14, 2015
 Merger or Acquisition (June 2015)22 slides · Jun 23, 2015
 Merger or Acquisition (June 2015)10 slides · Jun 10, 2015
 Merger or Acquisition (June 2015)30 slides · Jun 10, 2015
 Q1 2015 Earnings Presentation35 slides · May 21, 2015
 36th Annual Raymond James Institutional Investors Conference (February 2015)36 slides · Feb 27, 2015