Chaparral Energy — Debt Investor Presentation (February 2010)
37 slides from Chaparral Energy's debt investor presentation, Feb 8, 2010
Slide 1: $200 million Second Lien Senior Notes
Exhibit 99.3 Exhibit $200 million 99.3 Second Lien Notes $200 million Senior Notes February 2010
Slide 2: Disclaimer—Forward-Looking Statements
Disclaimer—Forward This market projections should looking” that capital and oil purchasers attacks, We have Securities forward-looking 2 and may believe replacement could presentation norequirements read natural prices, actions control. use information. and cause of about itstatements the is our Exc
Slide 3: Management Presenters
Management Mark Joe 3 Evans, Fischer, Chief Presenters Chief Financial Executive Officer Officer & Executive & President Vice President
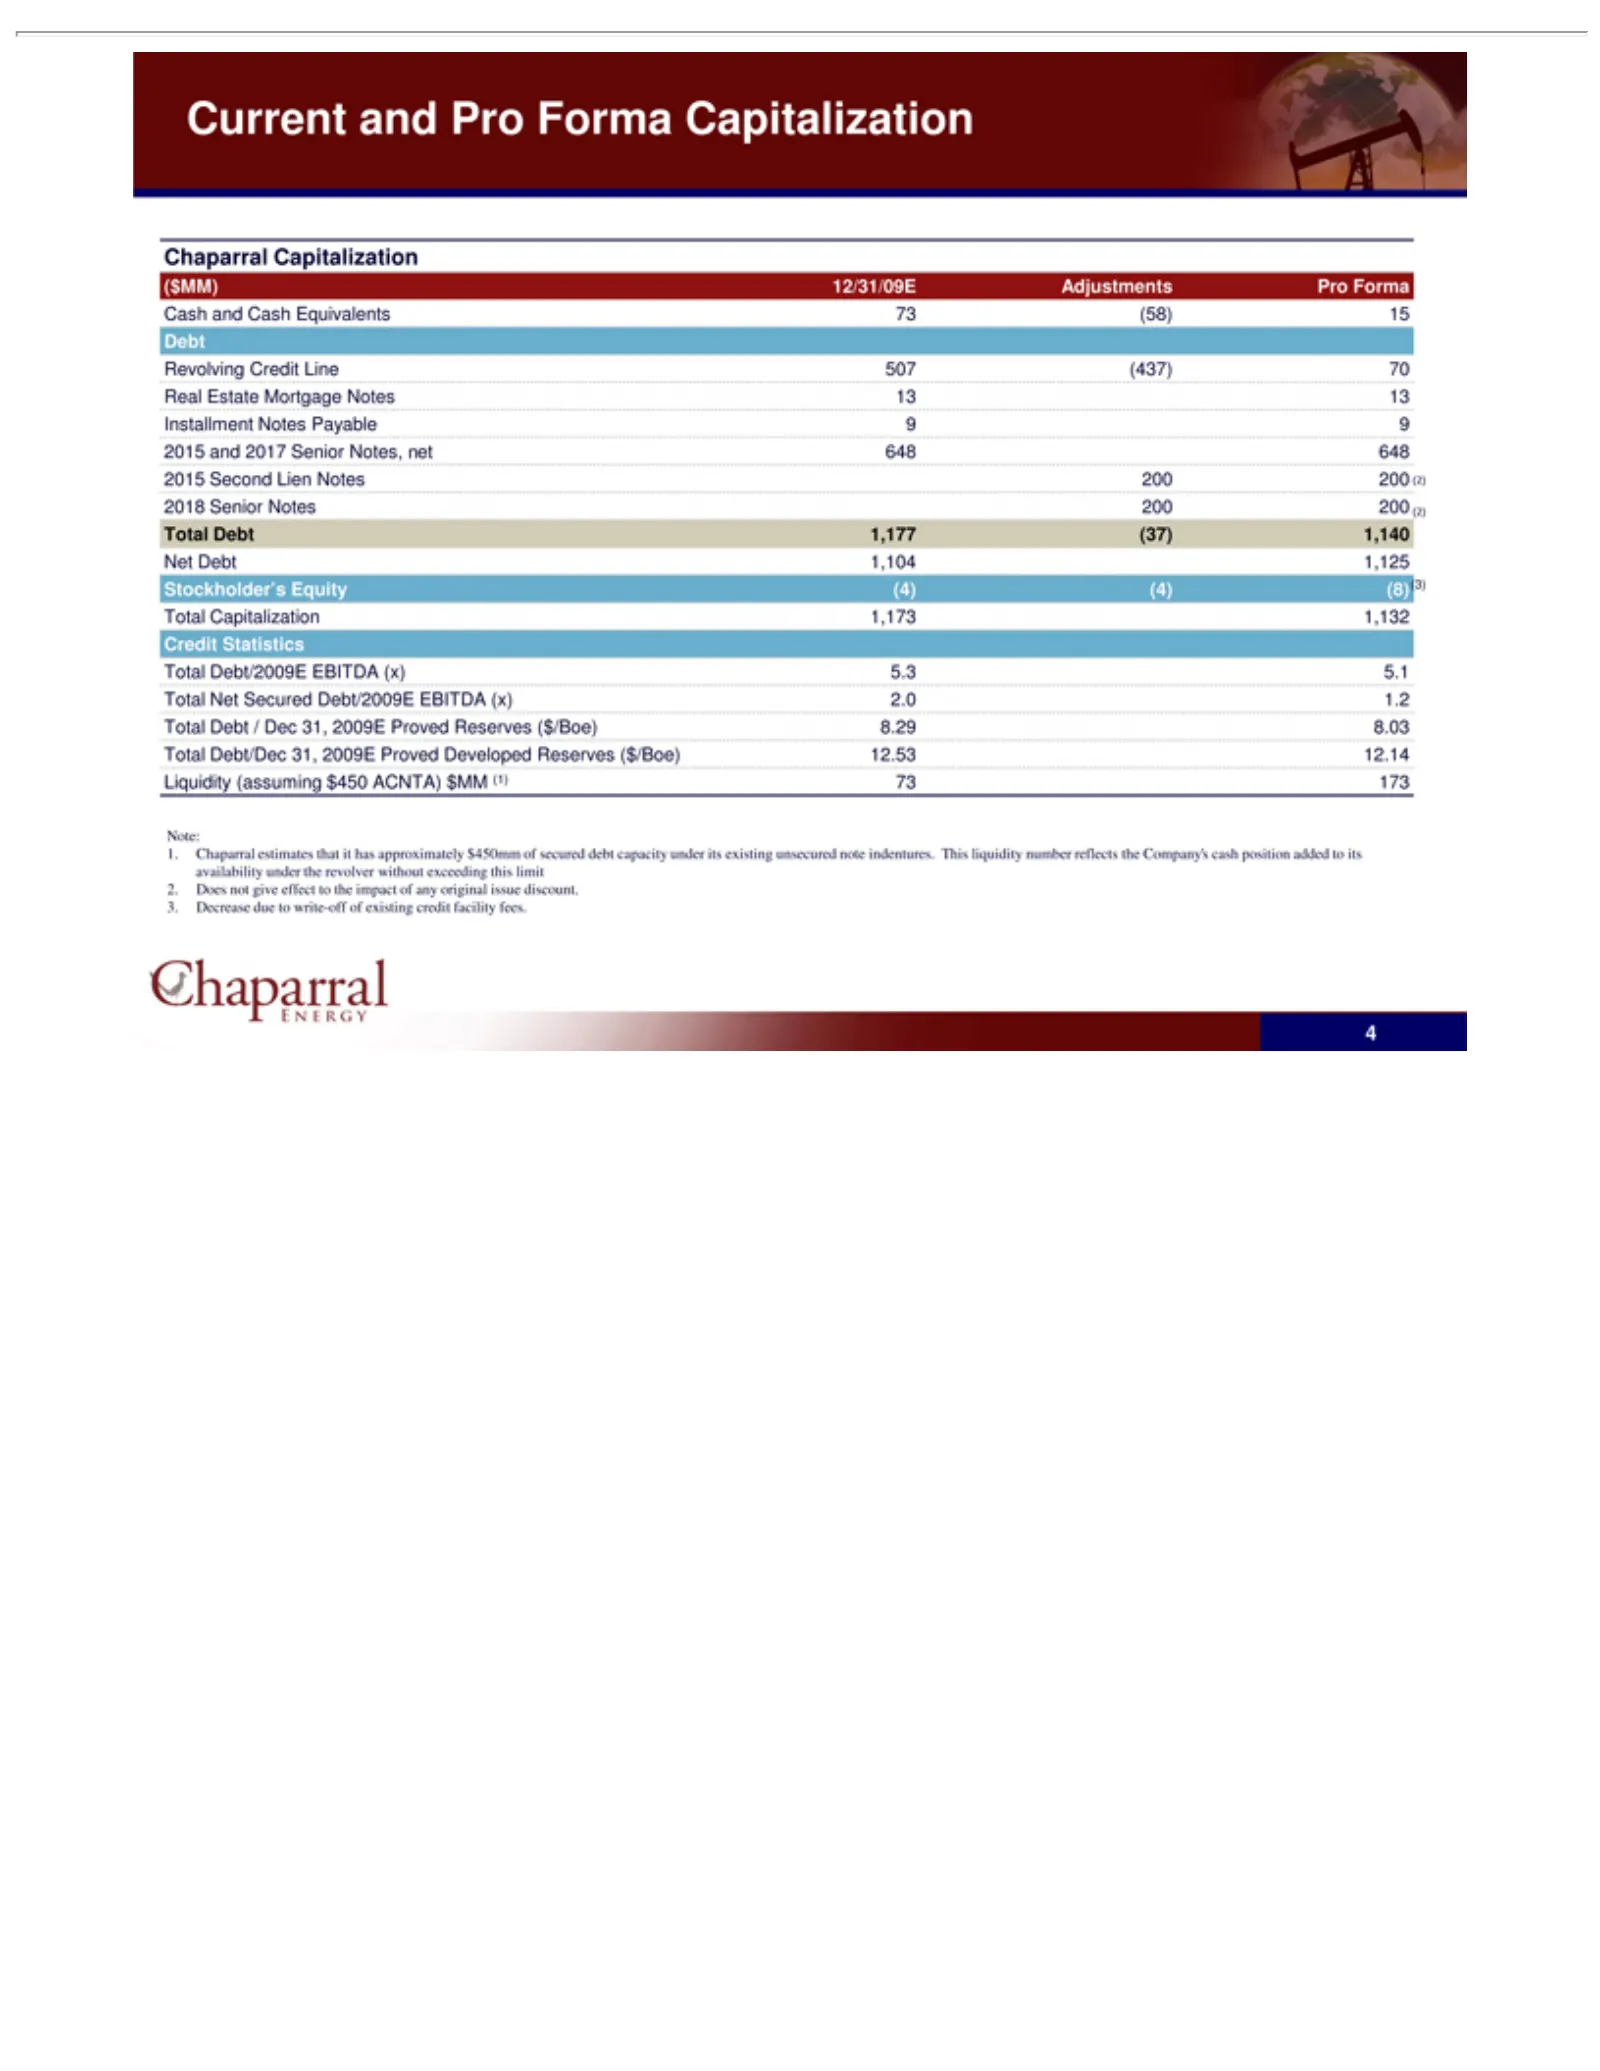
Slide 4: Current and Pro Forma Capitalization
Current Chaparral ($MM) Cash Revolving Debt Real Installment 2015 2018 Net Stockholder’s Credit Total Liquidity 1. Note: availability 2. 3. 4 Chaparral Does Decrease Debt Estate and Second Senior Capitalization Debt/2009E Net Debt Debt/Dec Statistics 12/31/09E and not 1,104 2017 Cash (assuming Secur
Slide 5: Company Overview
Company Overview Chaparral
Slide 6: Chaparral Overview
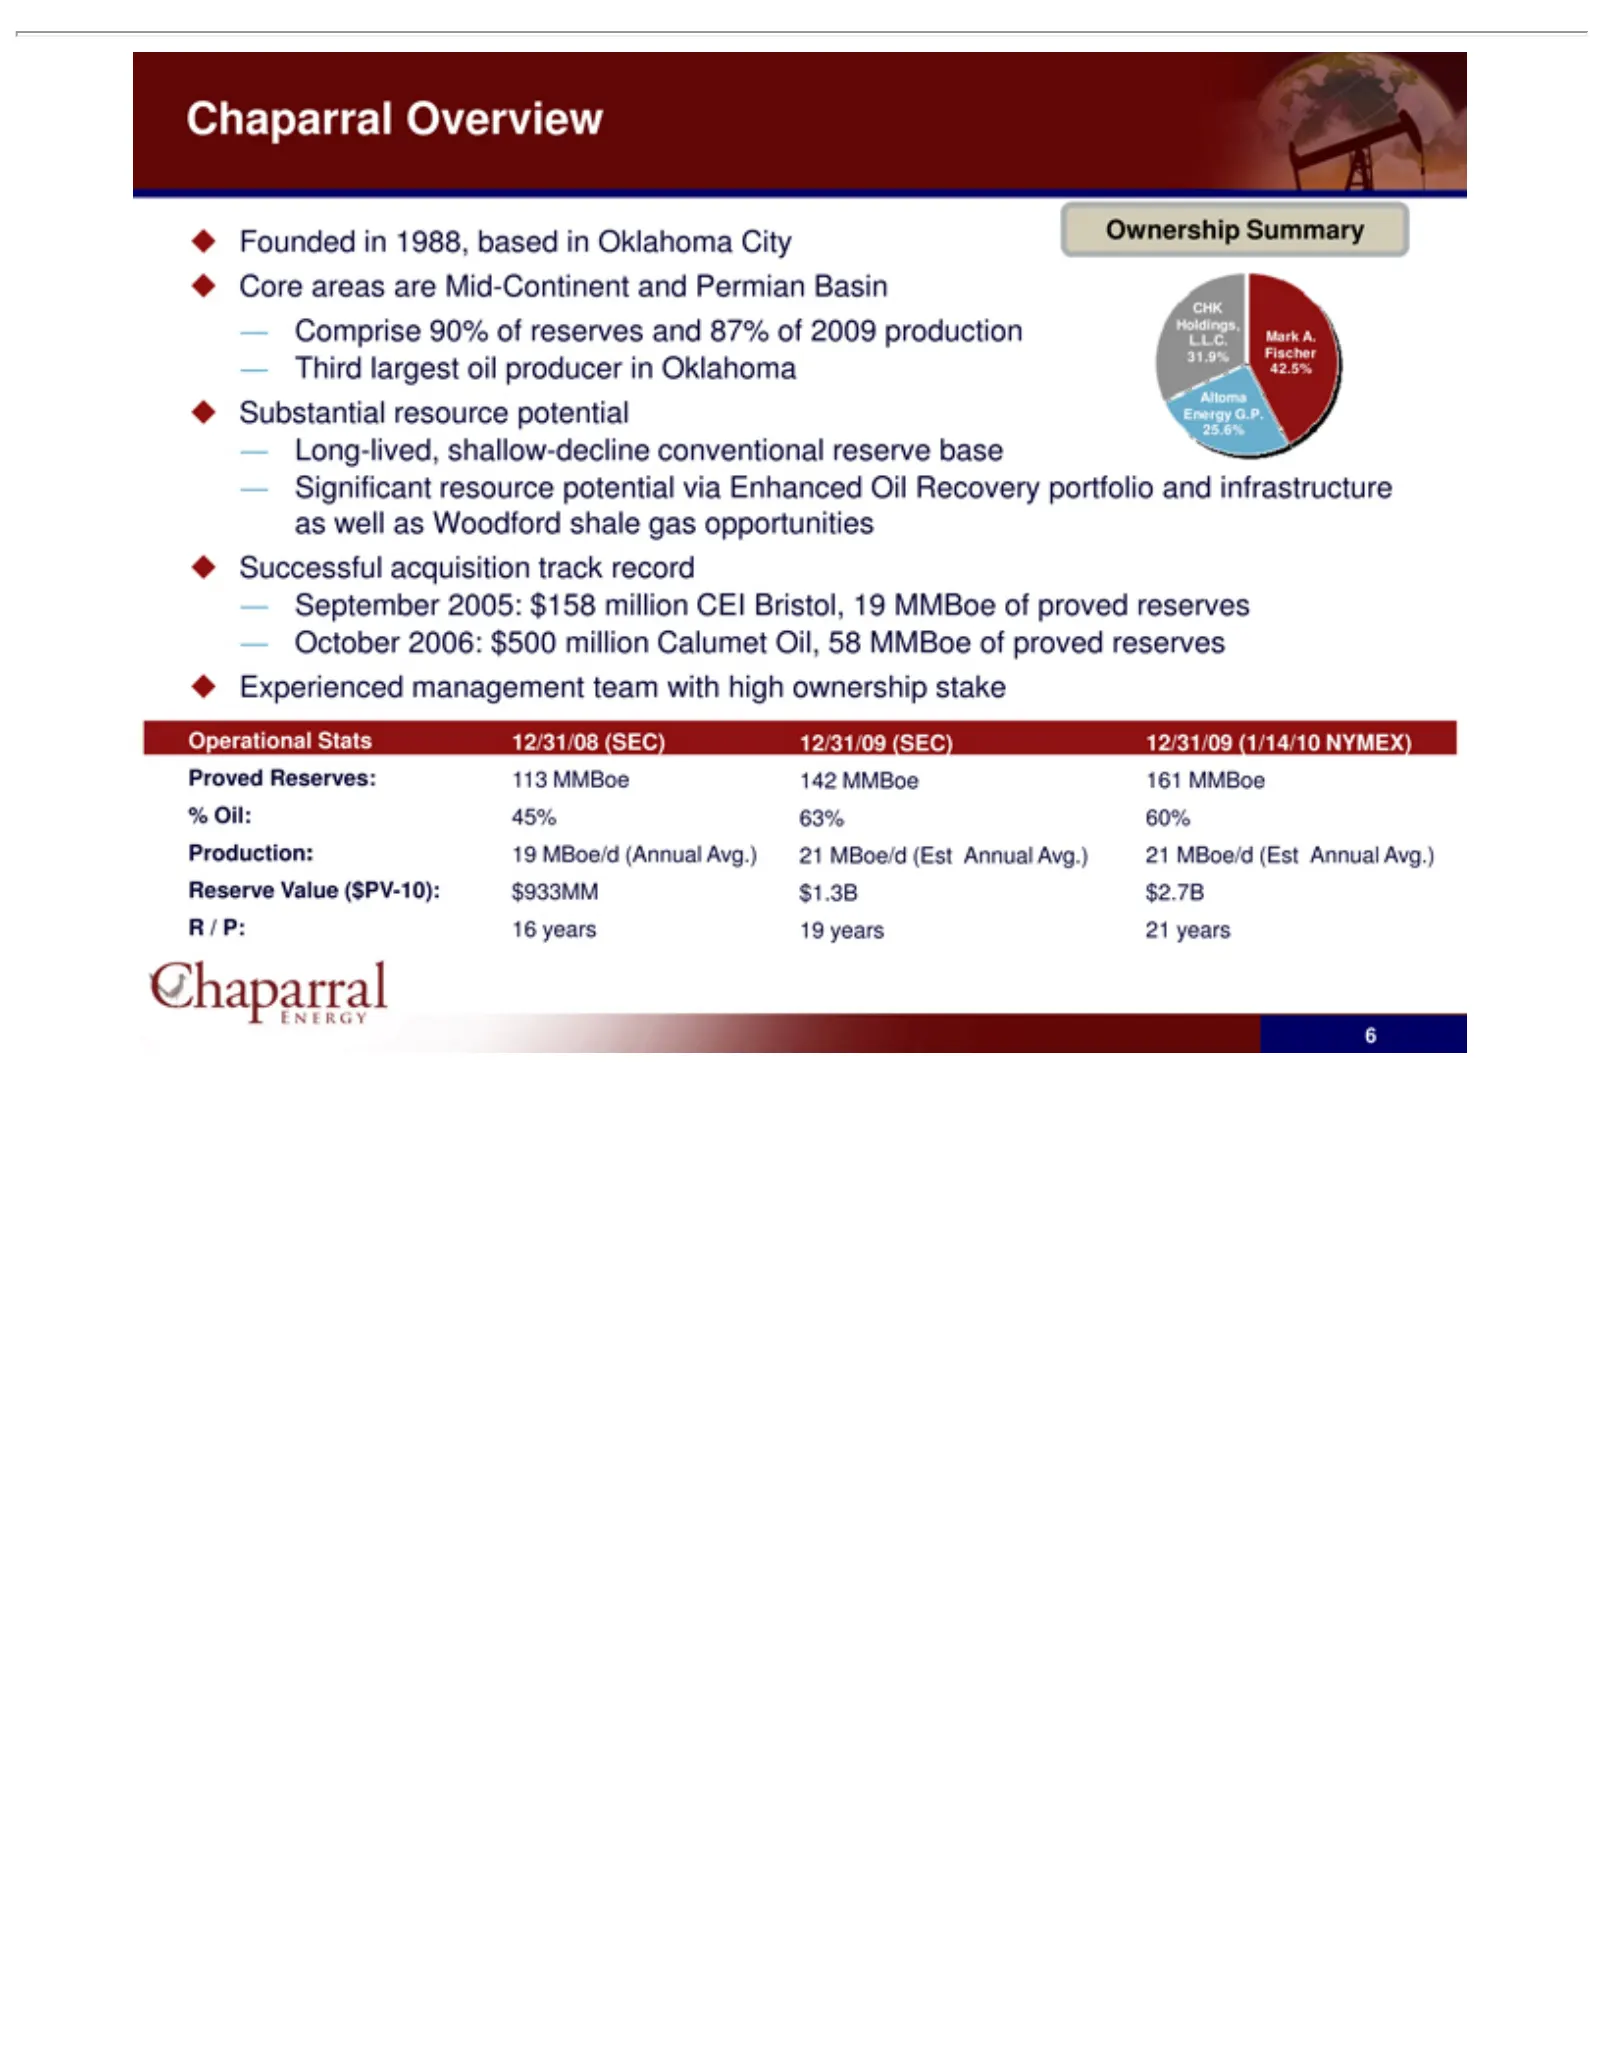
Chaparral Founded Comprise Third Long-lived, Significant September October Operational % Reserve 12/31/08 113 16 142 19 12/31/09 161 21 6 Oil: MBoe/d years MMBoe largest Production_ Value 2006: in (SEC) (1/14/10 90% Overview 2005: resource 1988, (Annual (Est shallow-decline Stats 45% oil 63% 60% ($P
Slide 7: Operating Areas
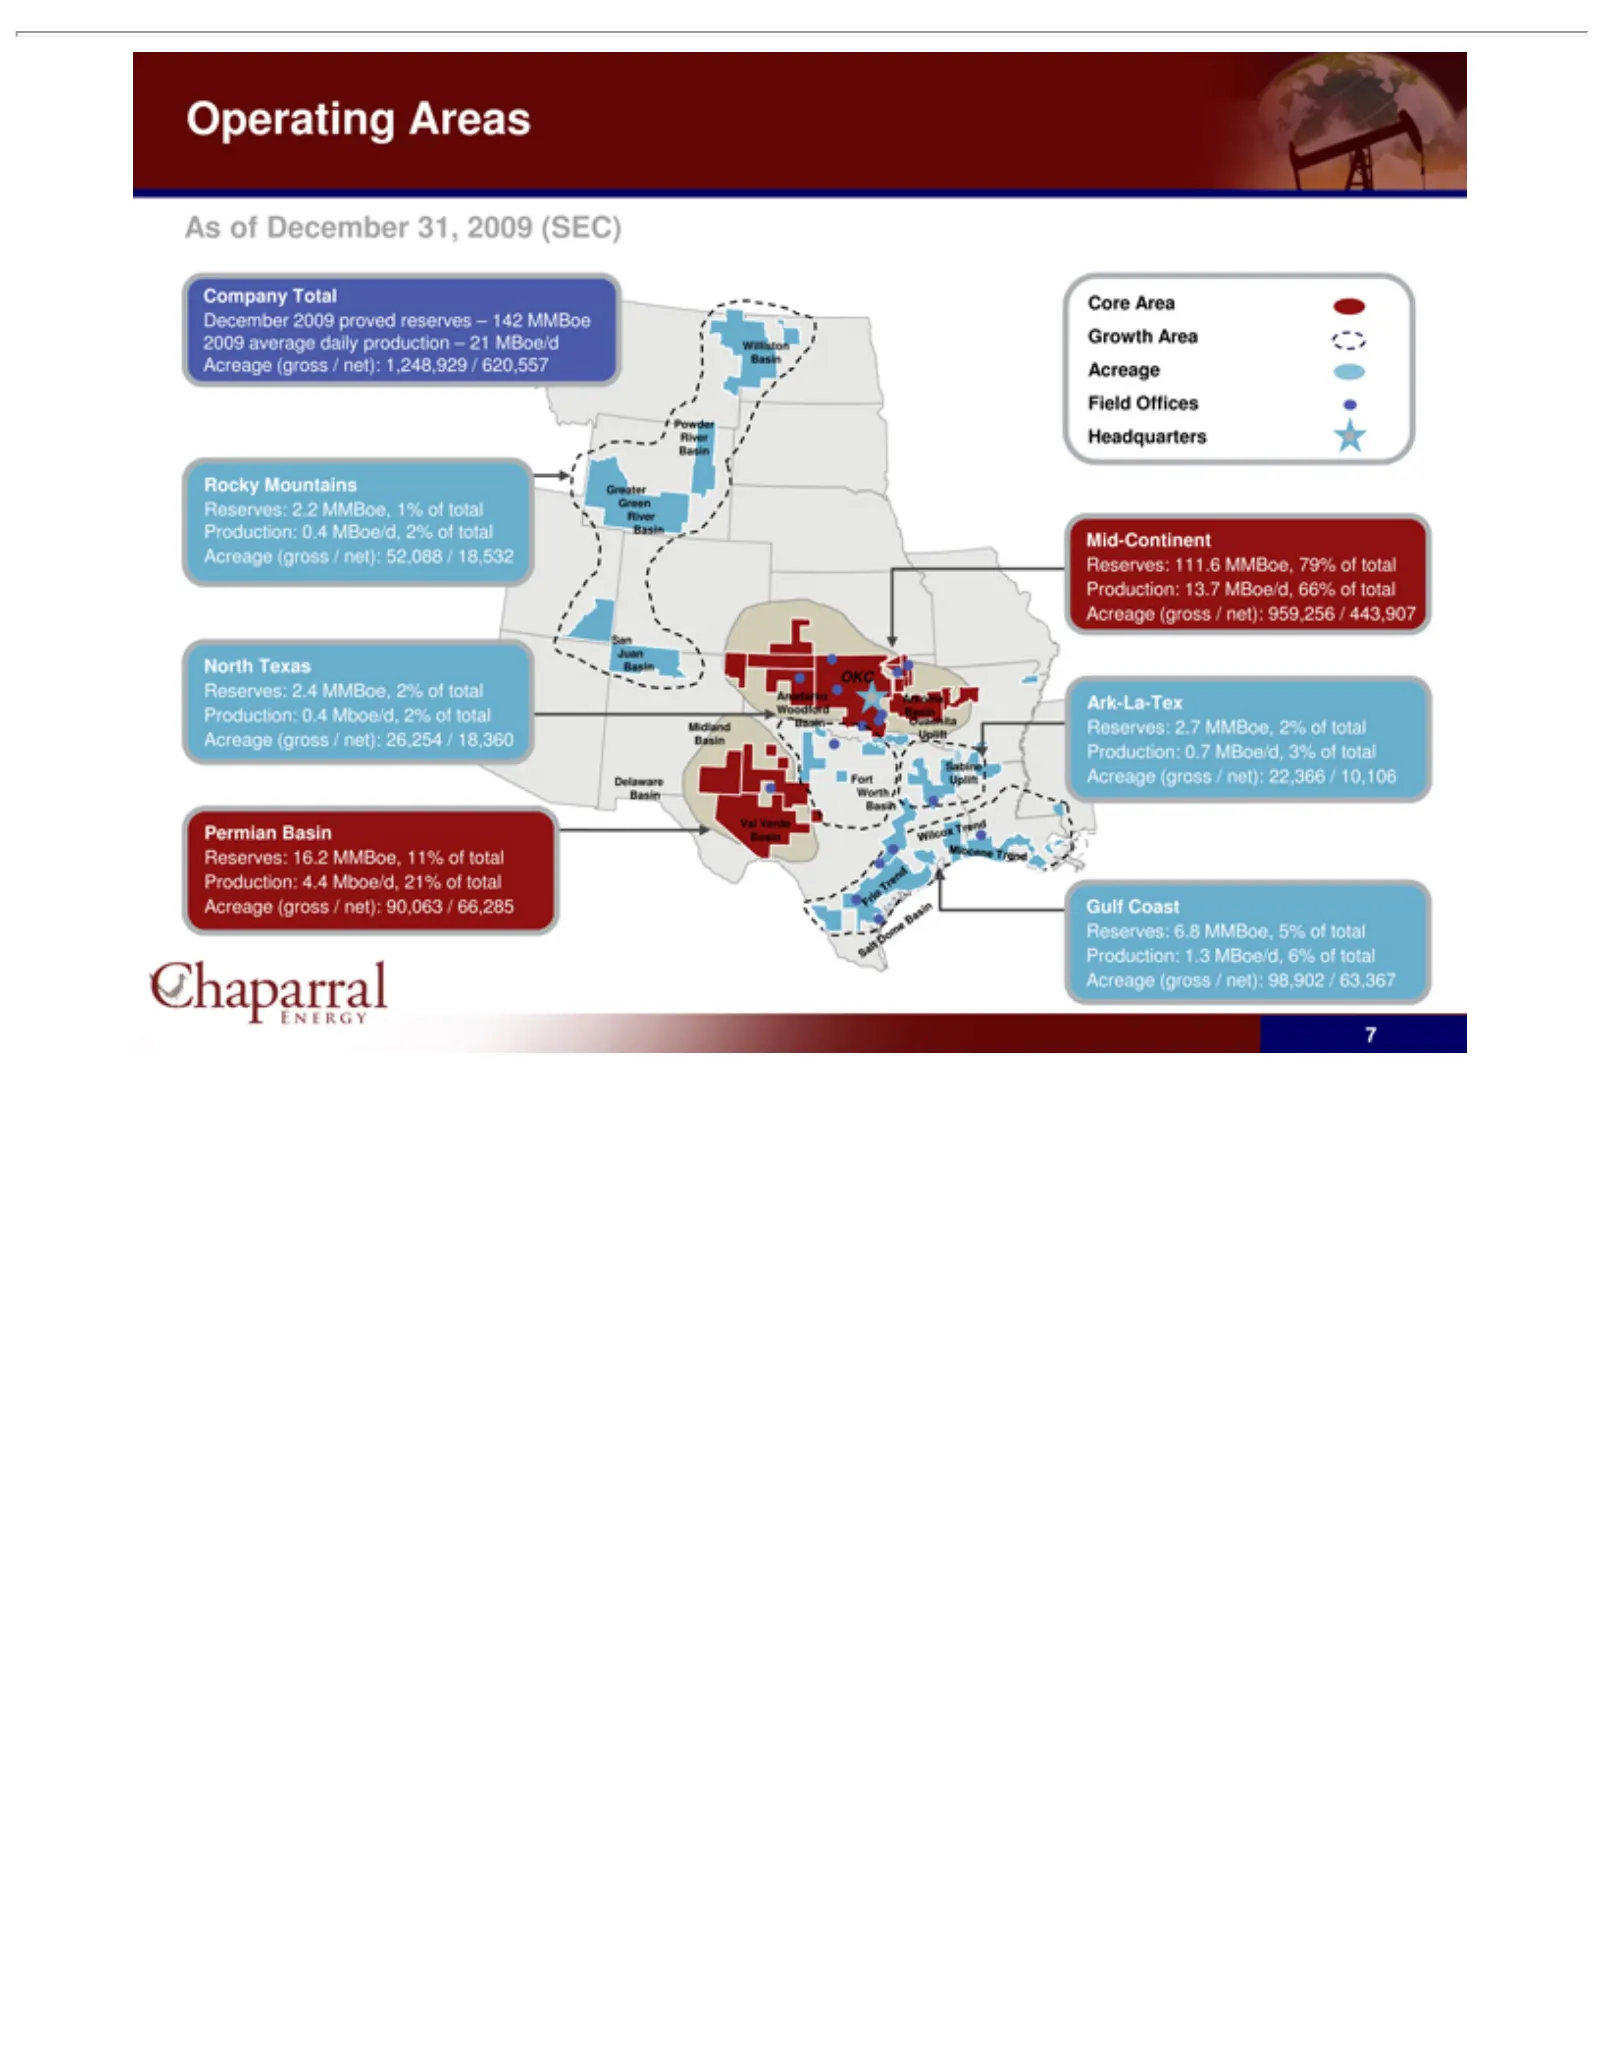
Operating As Company December Rocky North Permian Core Mid-Continent Ark-La-Tex Gulf Reserves: Williston Powder Greater San Midland Anadarko Arkoma Val Basin Delaware Fort Sabine Wilcox Miocene Frio Salt 7 of Verde Juan Dome Worth Trend Coast Area December Texas Mountains Uplift Trend Green River Ba
Slide 8: Strong Reserve and Production Growth
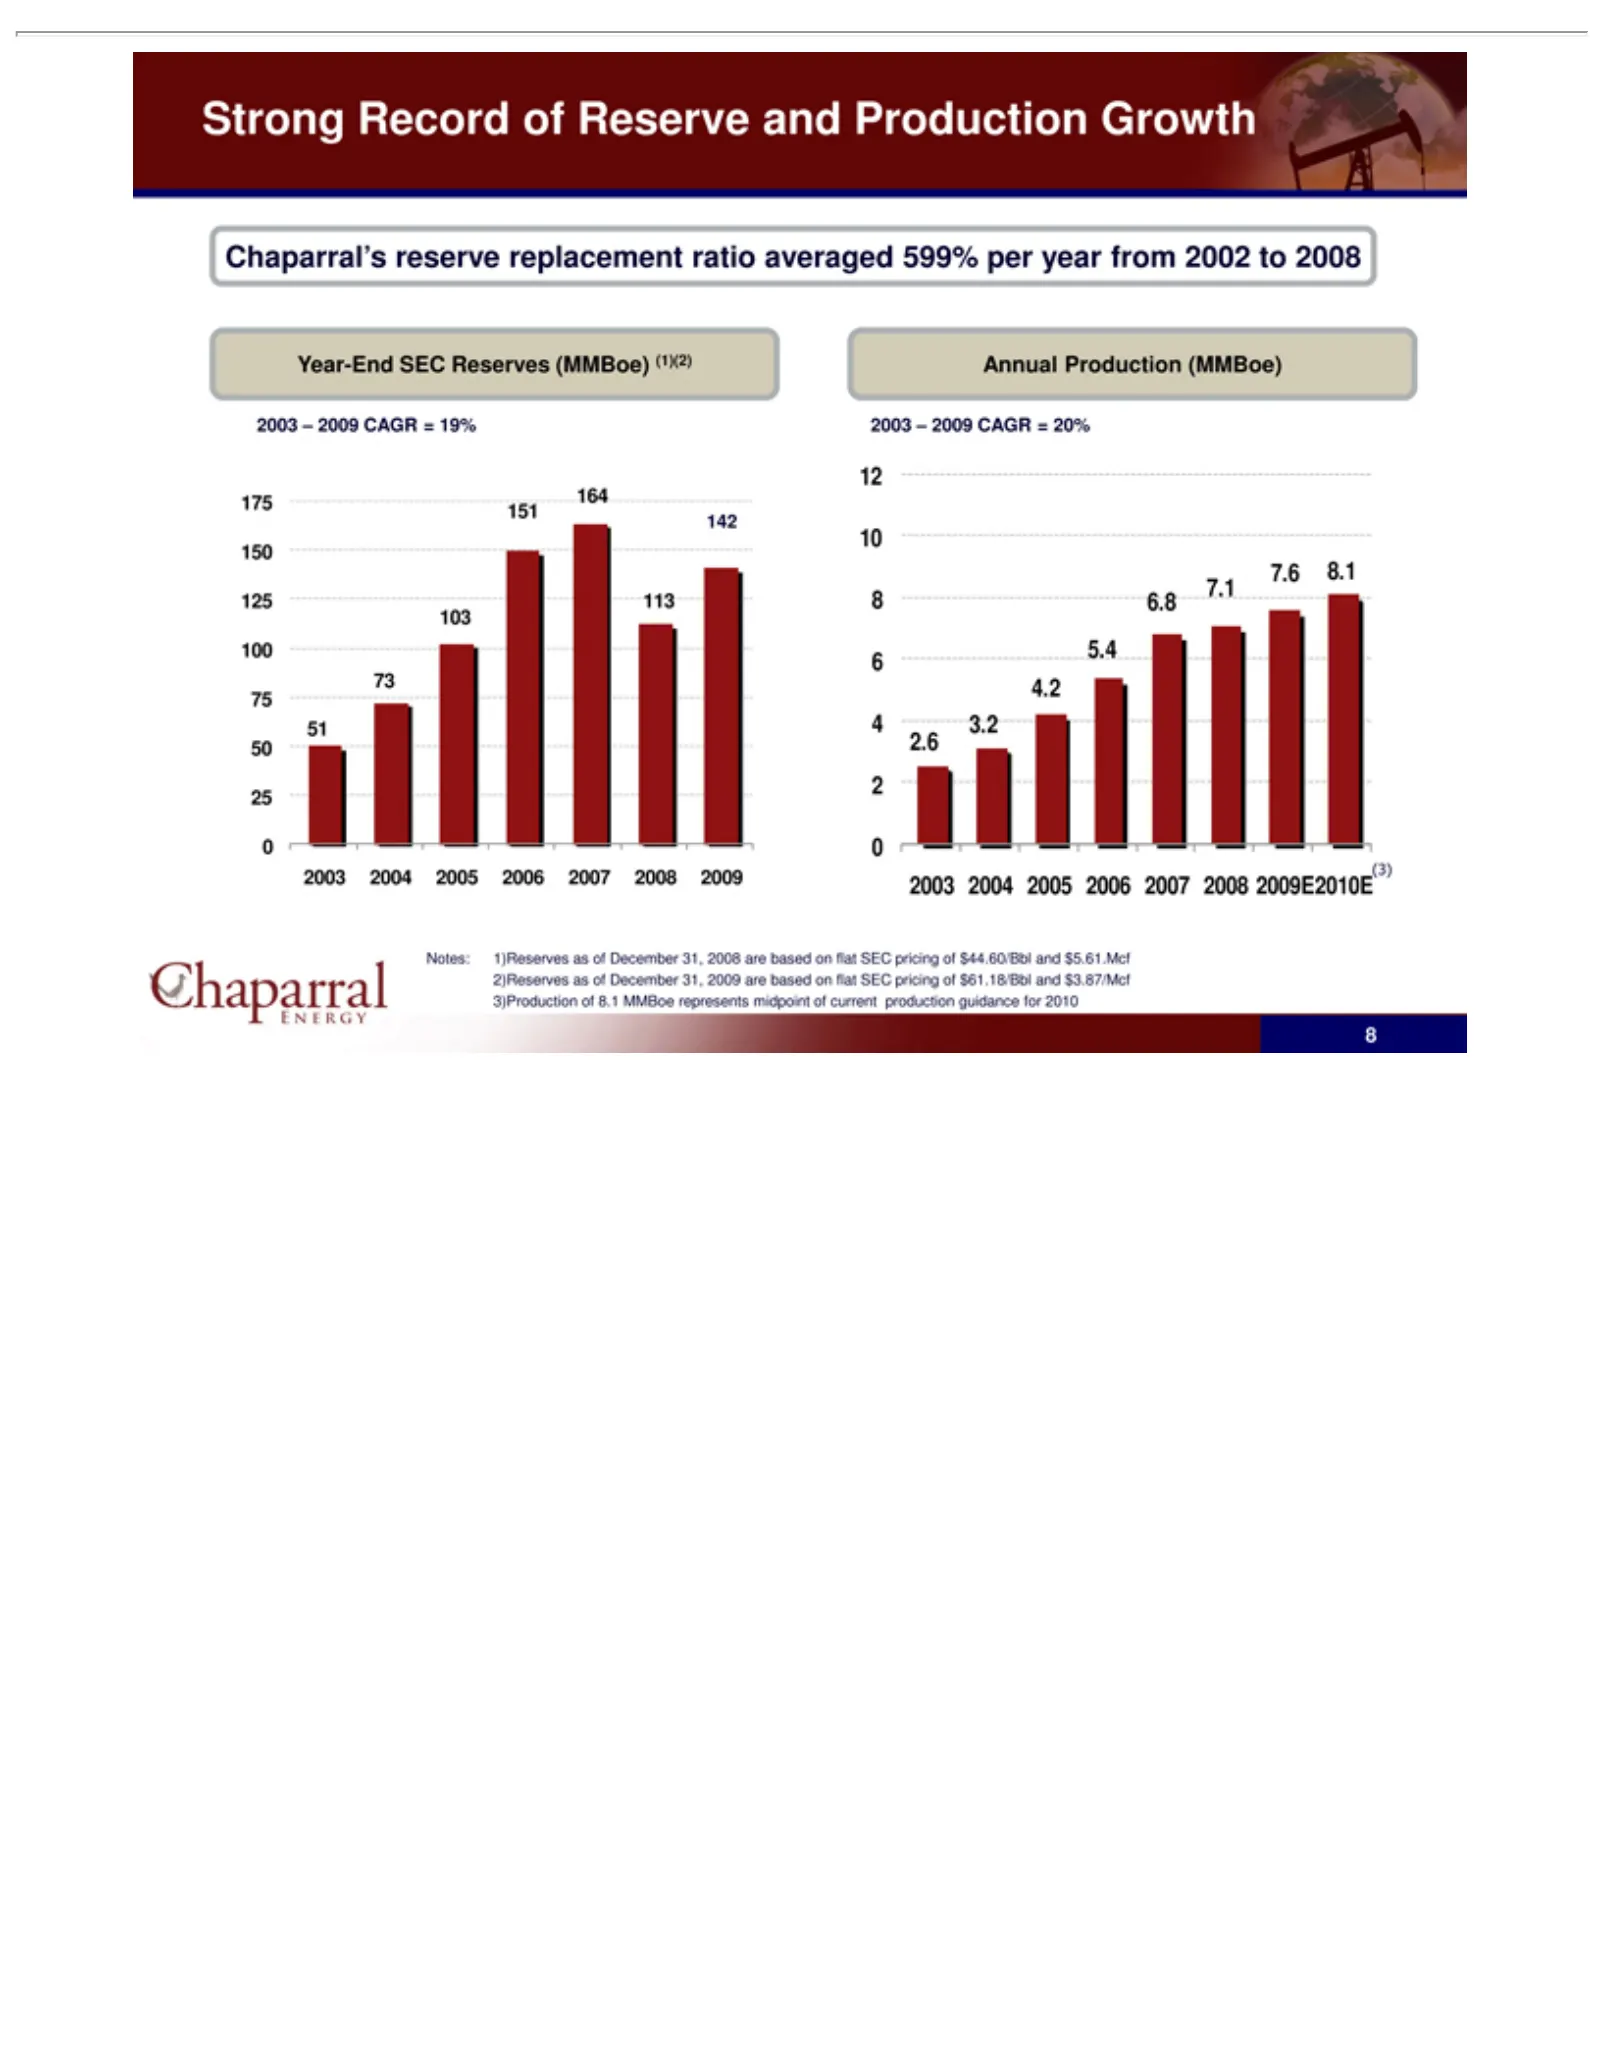
Strong Chaparral’s Year-End 175 151 125 150 2 0 25 50 51 75 73 100 103 Annual 2003 7.6 10 12 8 0003 6 4 0038.1 4.2 2.6 2 164 142 113 Notes: –2004 $3.87/Mcf 8 Record 2009 Production 6.8SEC 5.4 3.2 2004 2005 7.1 reserve CAGR 1)Reservesof Reserves 2006 Reserve (MMBoe) replacement =of2007 3)Production 2
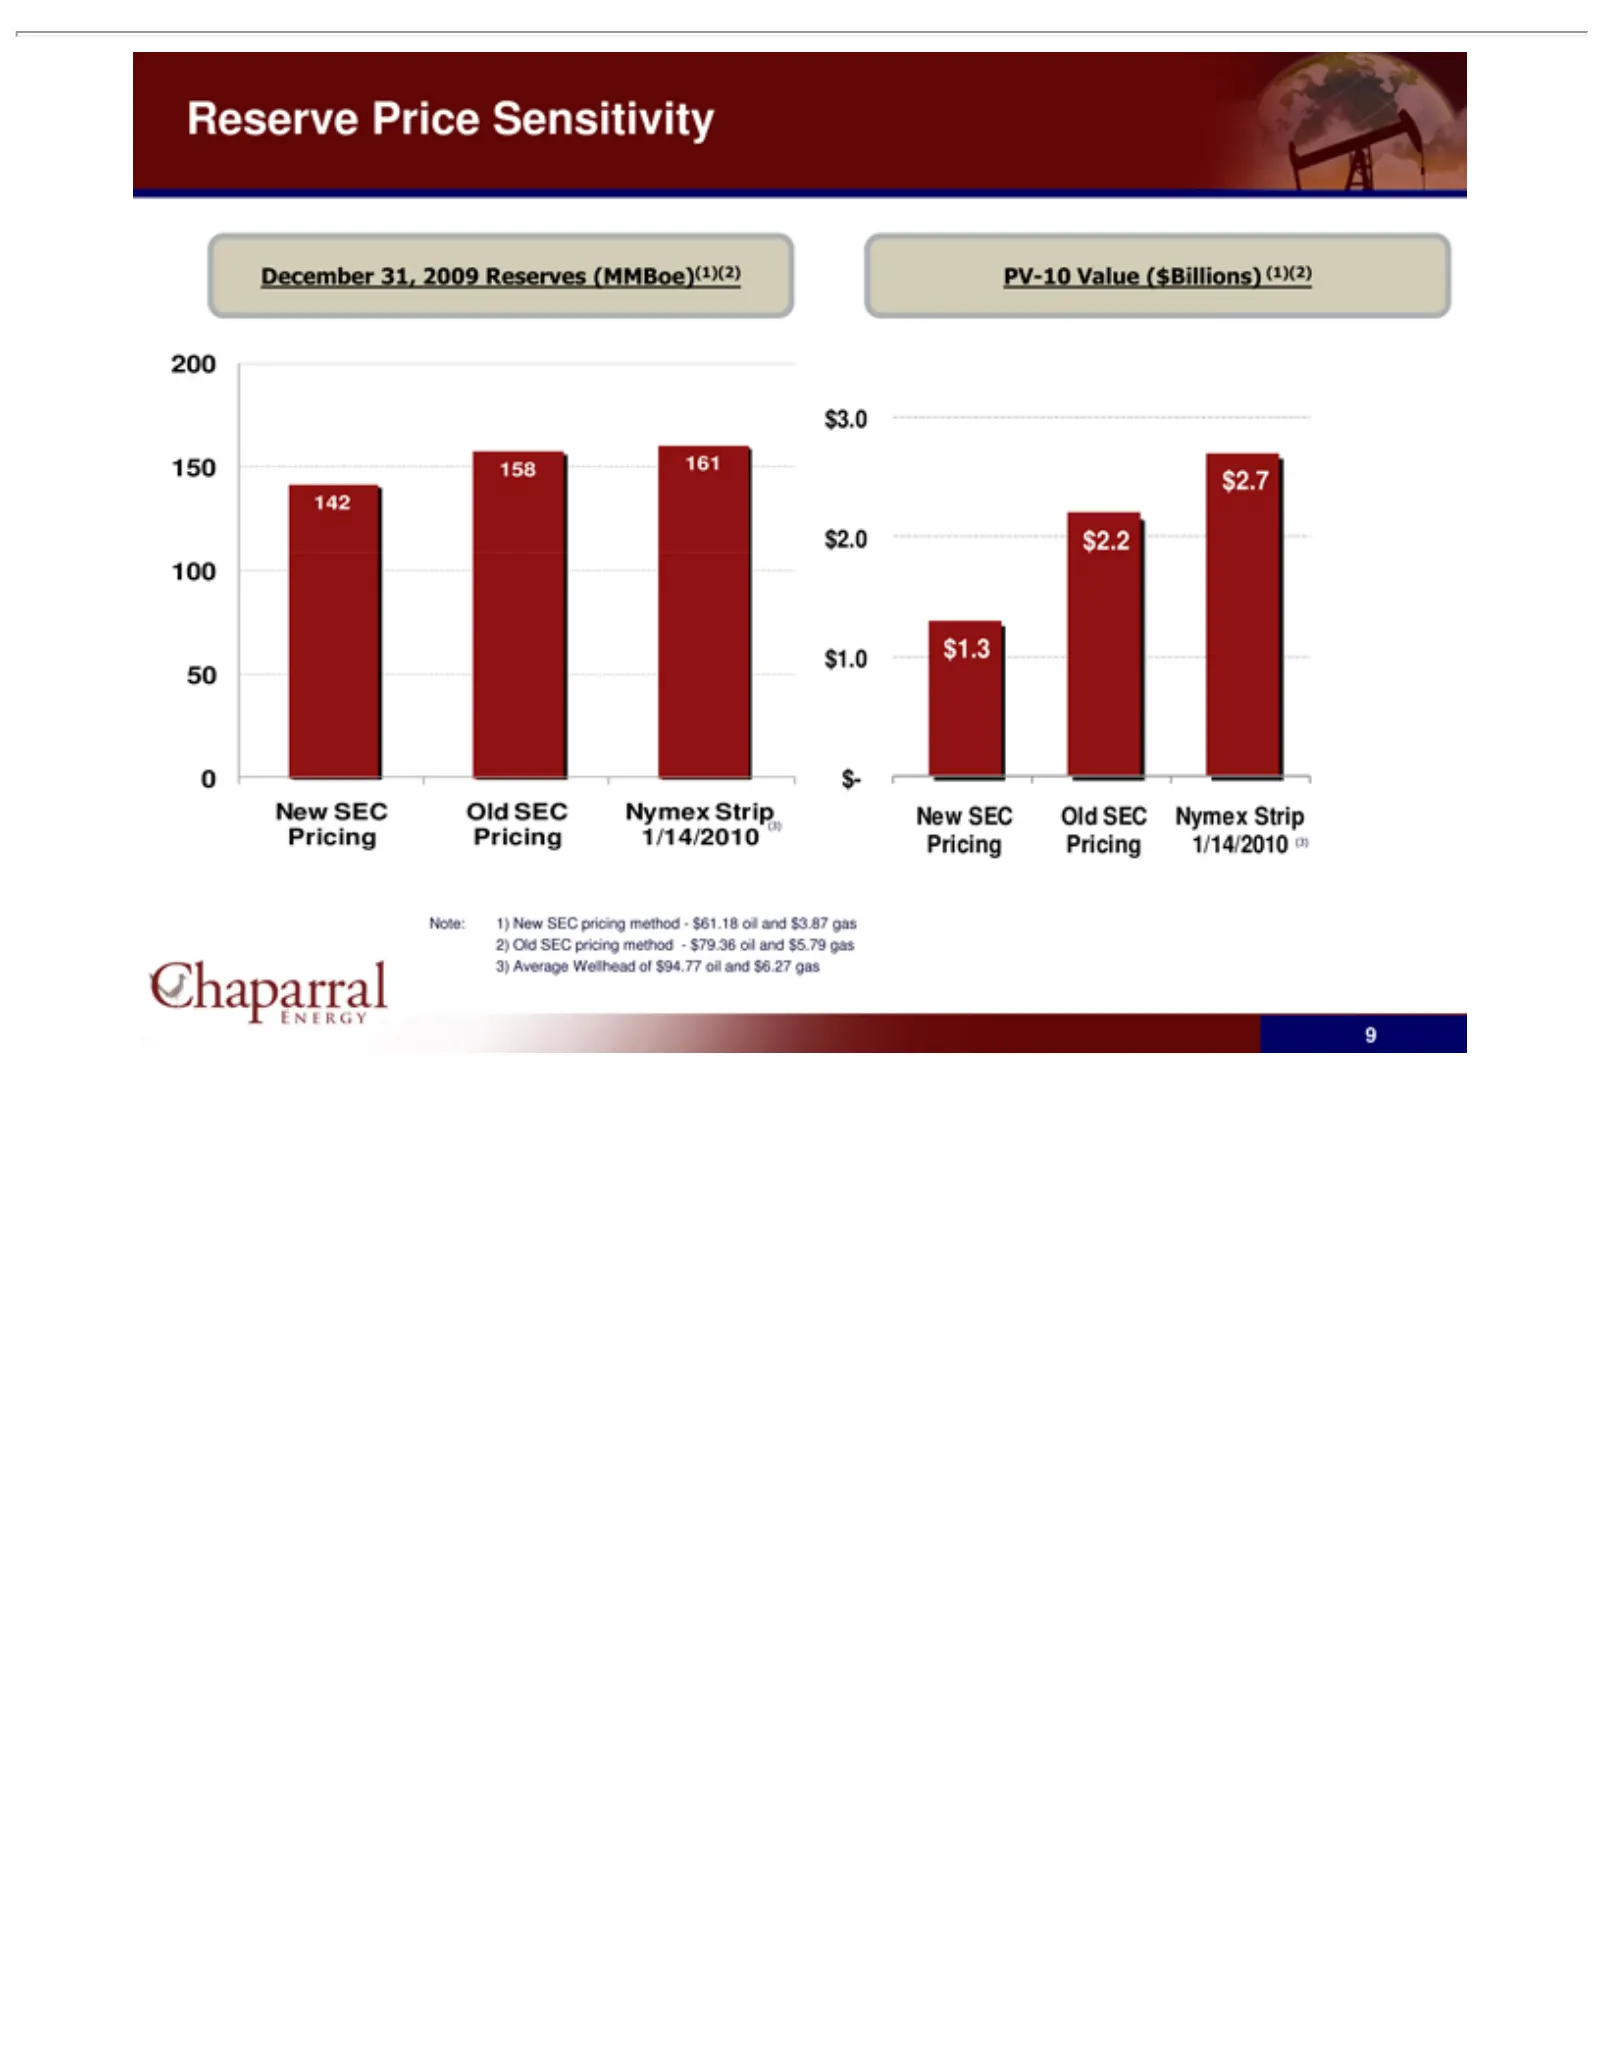
Slide 9: Reserve Pricing Sensitivity
Reserve December 150 200 N 0 50 100 142 Pricing PV-10 $3.0 New $2.7 $2.2 $1.3 Old Nymex 1/14/2010 Note: 2) 3) 9 ew Average Old 158 SEC $2.0 SEC 1) Value SEC Pricing Strip Price 161 New Pricing $1.0 Old Pricing (3) 31, Wellhead pricing ($Billions) SEC Sensitivity 2009 SEC $- 1/14/2010 pricing method
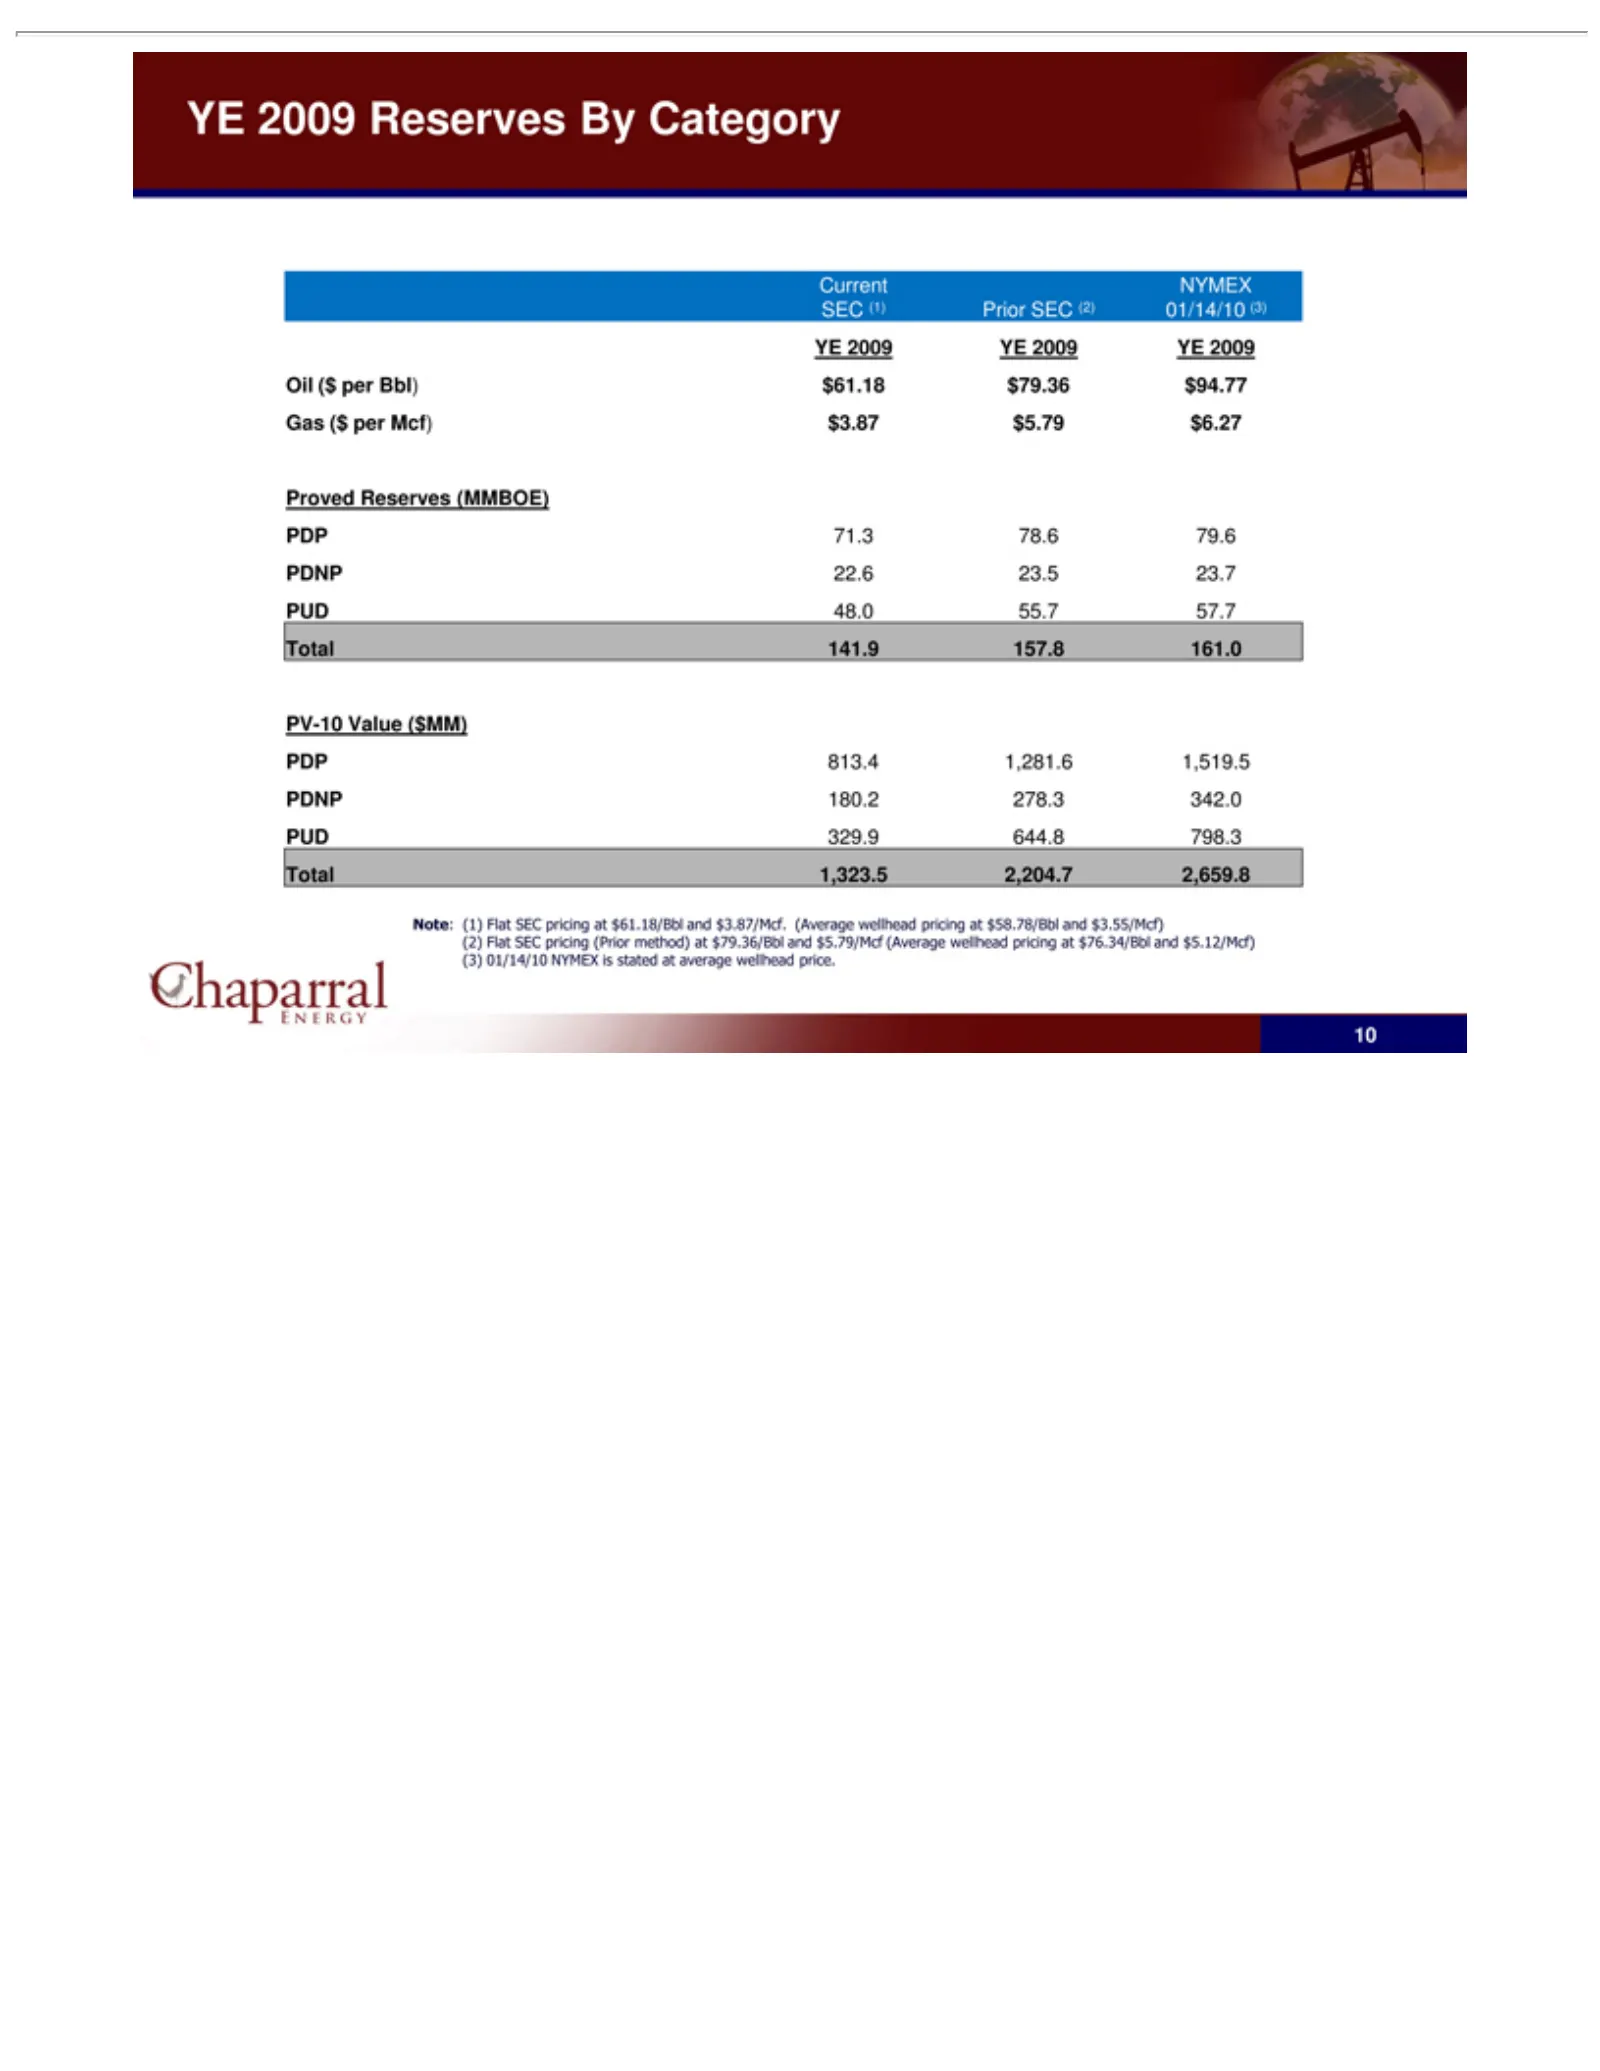
Slide 10: Proved Reserves and PV-10 Value
Current SEC YE Oil Gas Proved PV-10 PDP PDNP PUD Total Note: (2) (3) 10 ($ 2009 ($ 71.3 813.4 (1) 48.0 329.9 141.9 1,323.5 (1) per Value 22.6 180.2 per Reserves flat NYMEX Prior YE Reserves Flat 78.6 Bbl) 55.7 Mcf) 1,281.6 644.8 23.5 sec 157.8 278.3 ($MM) 2009 01/14/102,204.7 sec SEC 79.6 $61.18 57.
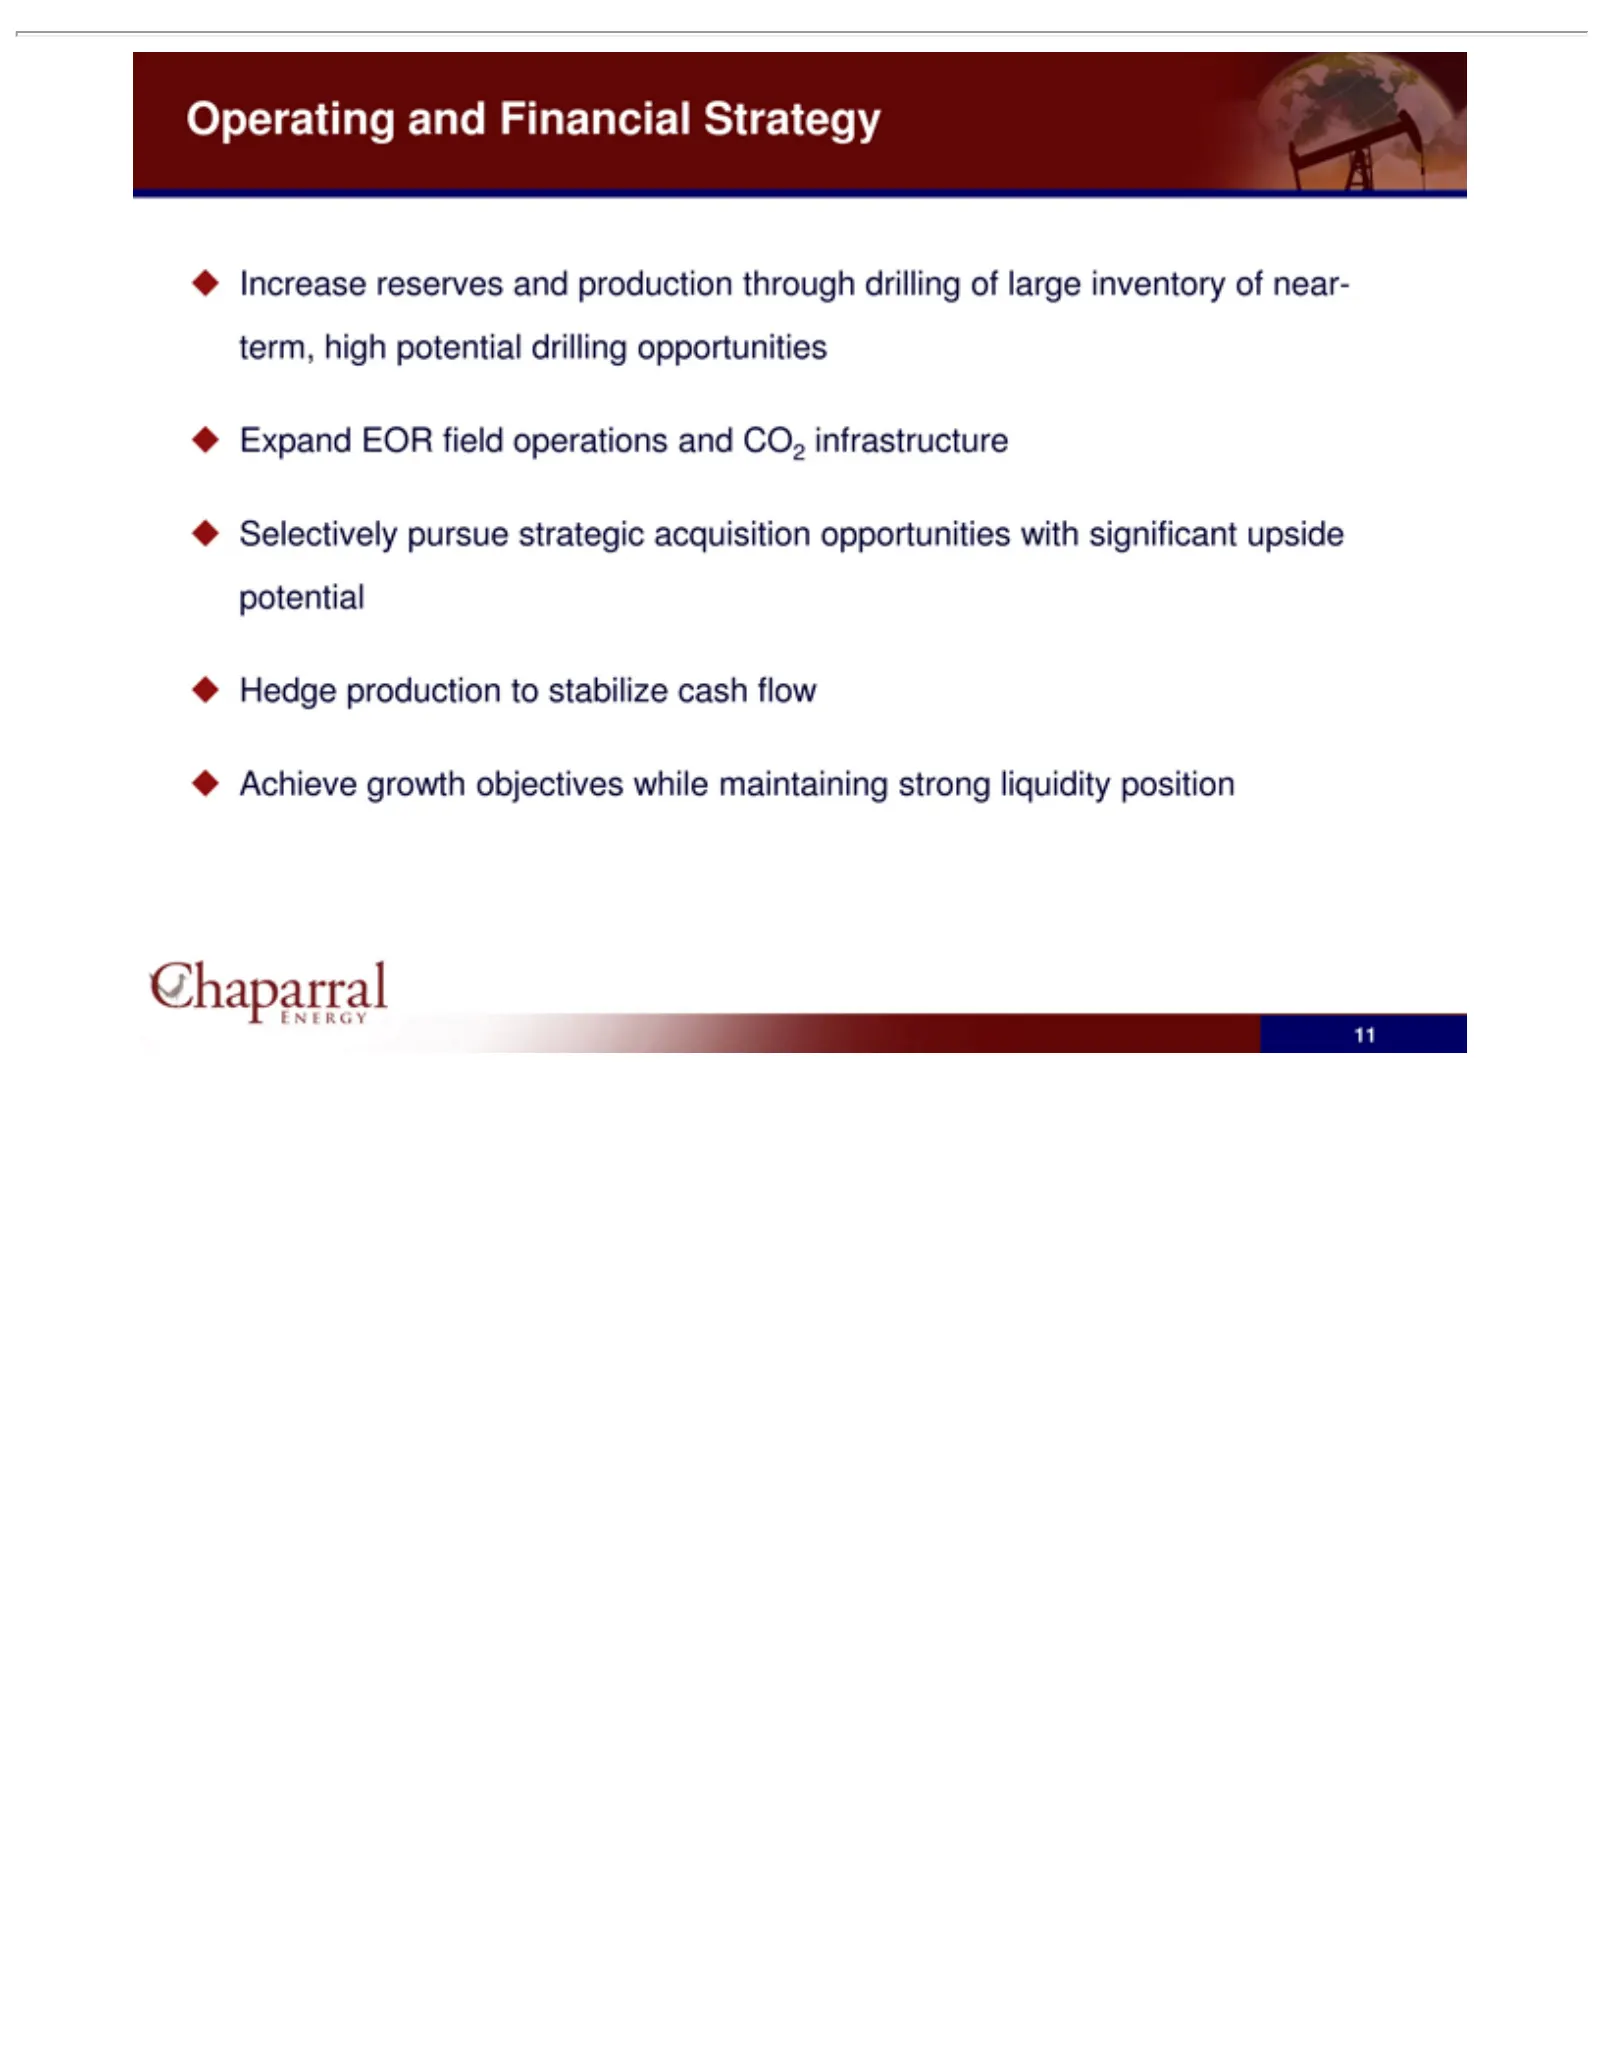
Slide 11: Operating and Financial Strategy
Operating Increase Expand Selectively Hedge Achieve 11 production EOR reserves growth and pursue field Financial objectives and to strategic operations stabilize production Strategy while acquisition cash andthrough maintaining CO2 flowopportunities infrastructure drilling strong of large liquidity
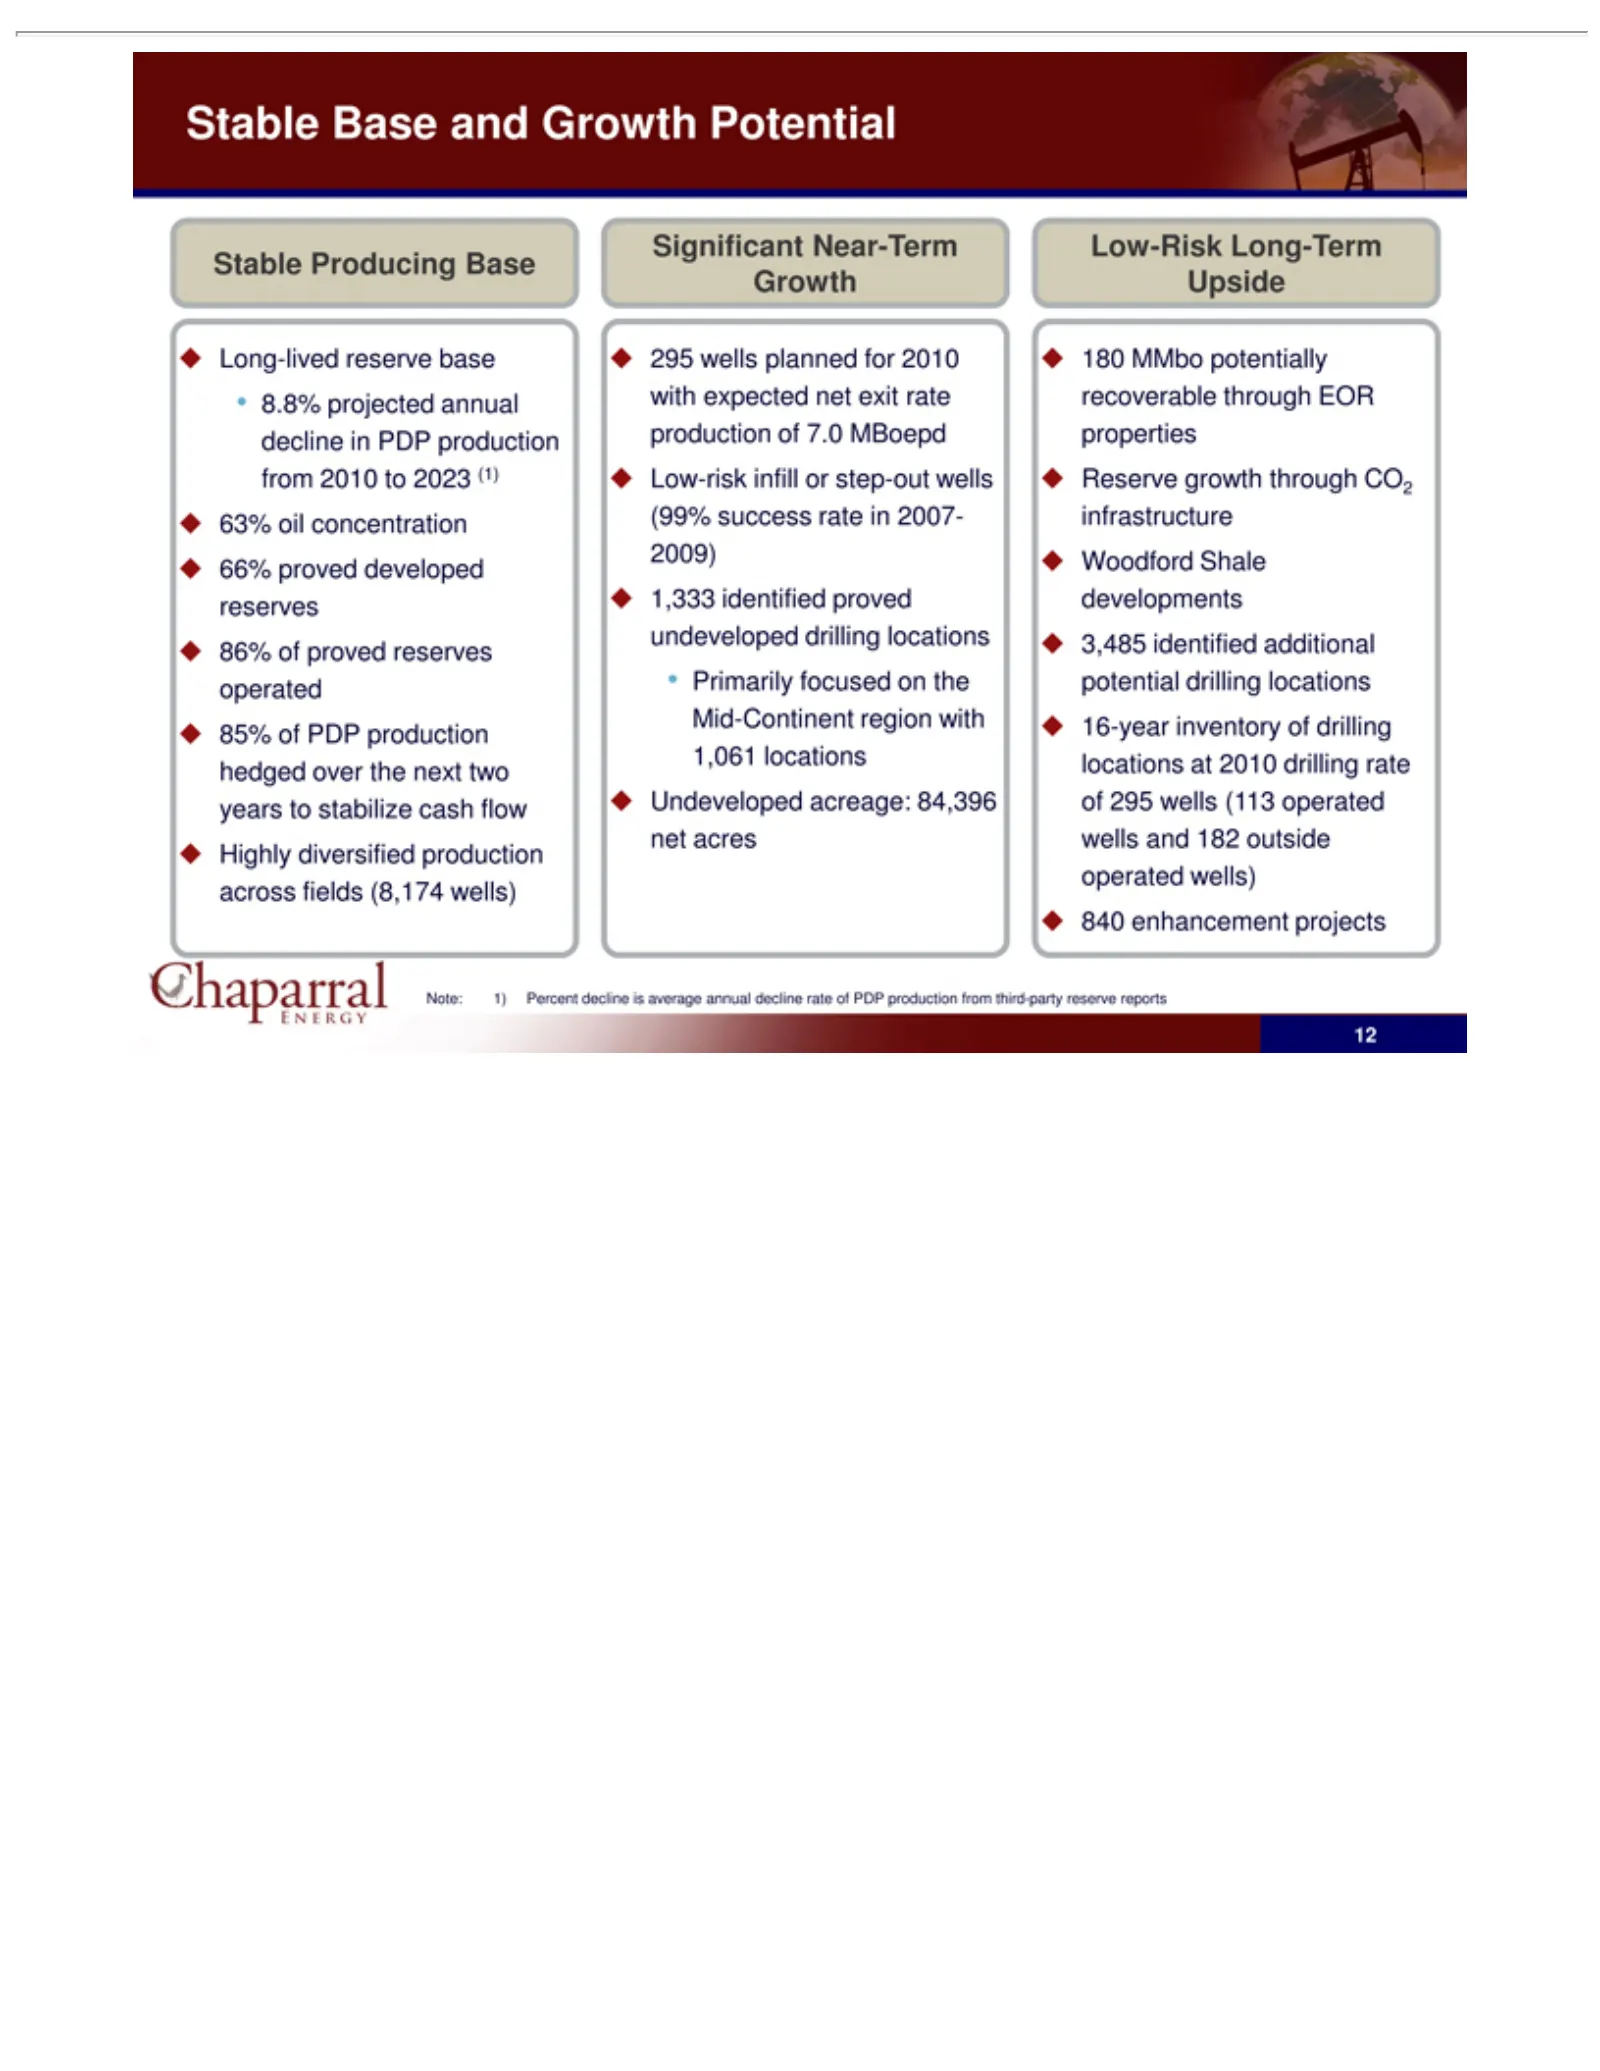
Slide 12: Stable, Long-lived Production Base
Stable •Significant Low-Risk _ Note: 128.8% Primarily Woodford Long-lived 63% 66% 86% 85% Highly 295 Low-risk 1,333 Undeveloped 180 Reserve 3,485 16-year 840 1) wells MMbo enhancement Base Producing oil proved of projected identified Percent diversified proved PDP inventory concentration growth Long
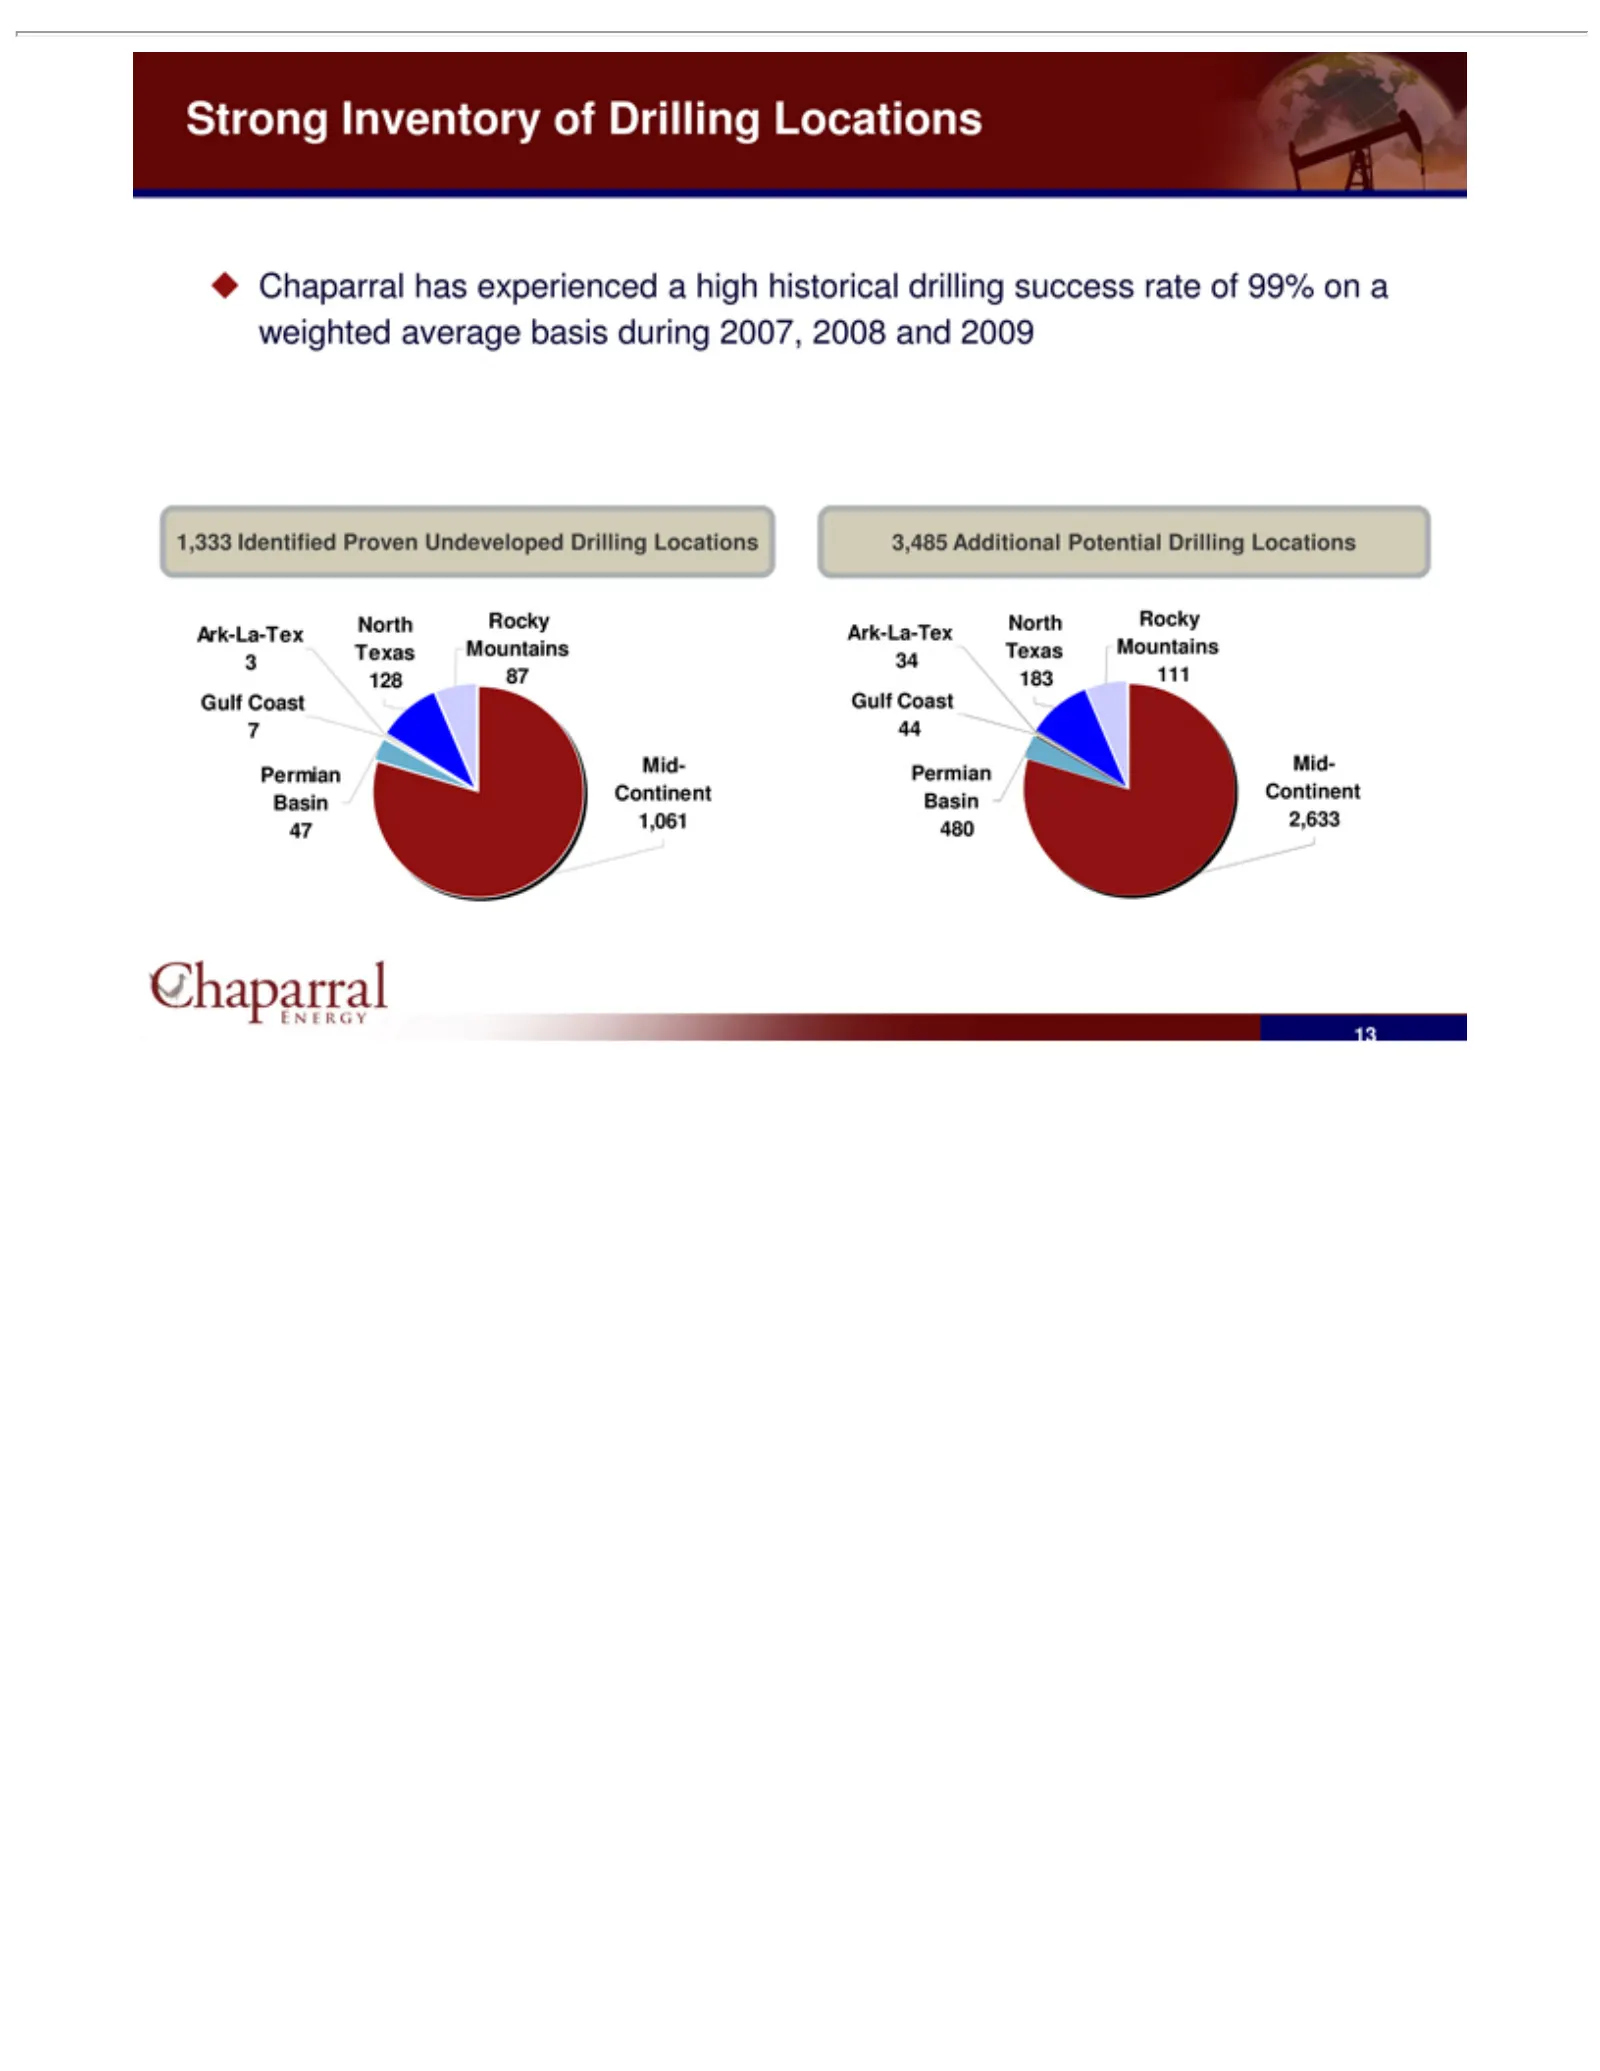
Slide 13: Strong Drilling Inventory
Strong Chaparral 1,333 3,485 Ark-La-Tex Gulf Permian North Rocky Mid-Continent 13 Coast Additional Identified Texas Mountains Inventory Basin has 734 443183 128 experienced 47 480 1,061 2,633 Proven Potential of111 87Drilling Undeveloped Drilling a high Locations historical Locations Drilling drilli
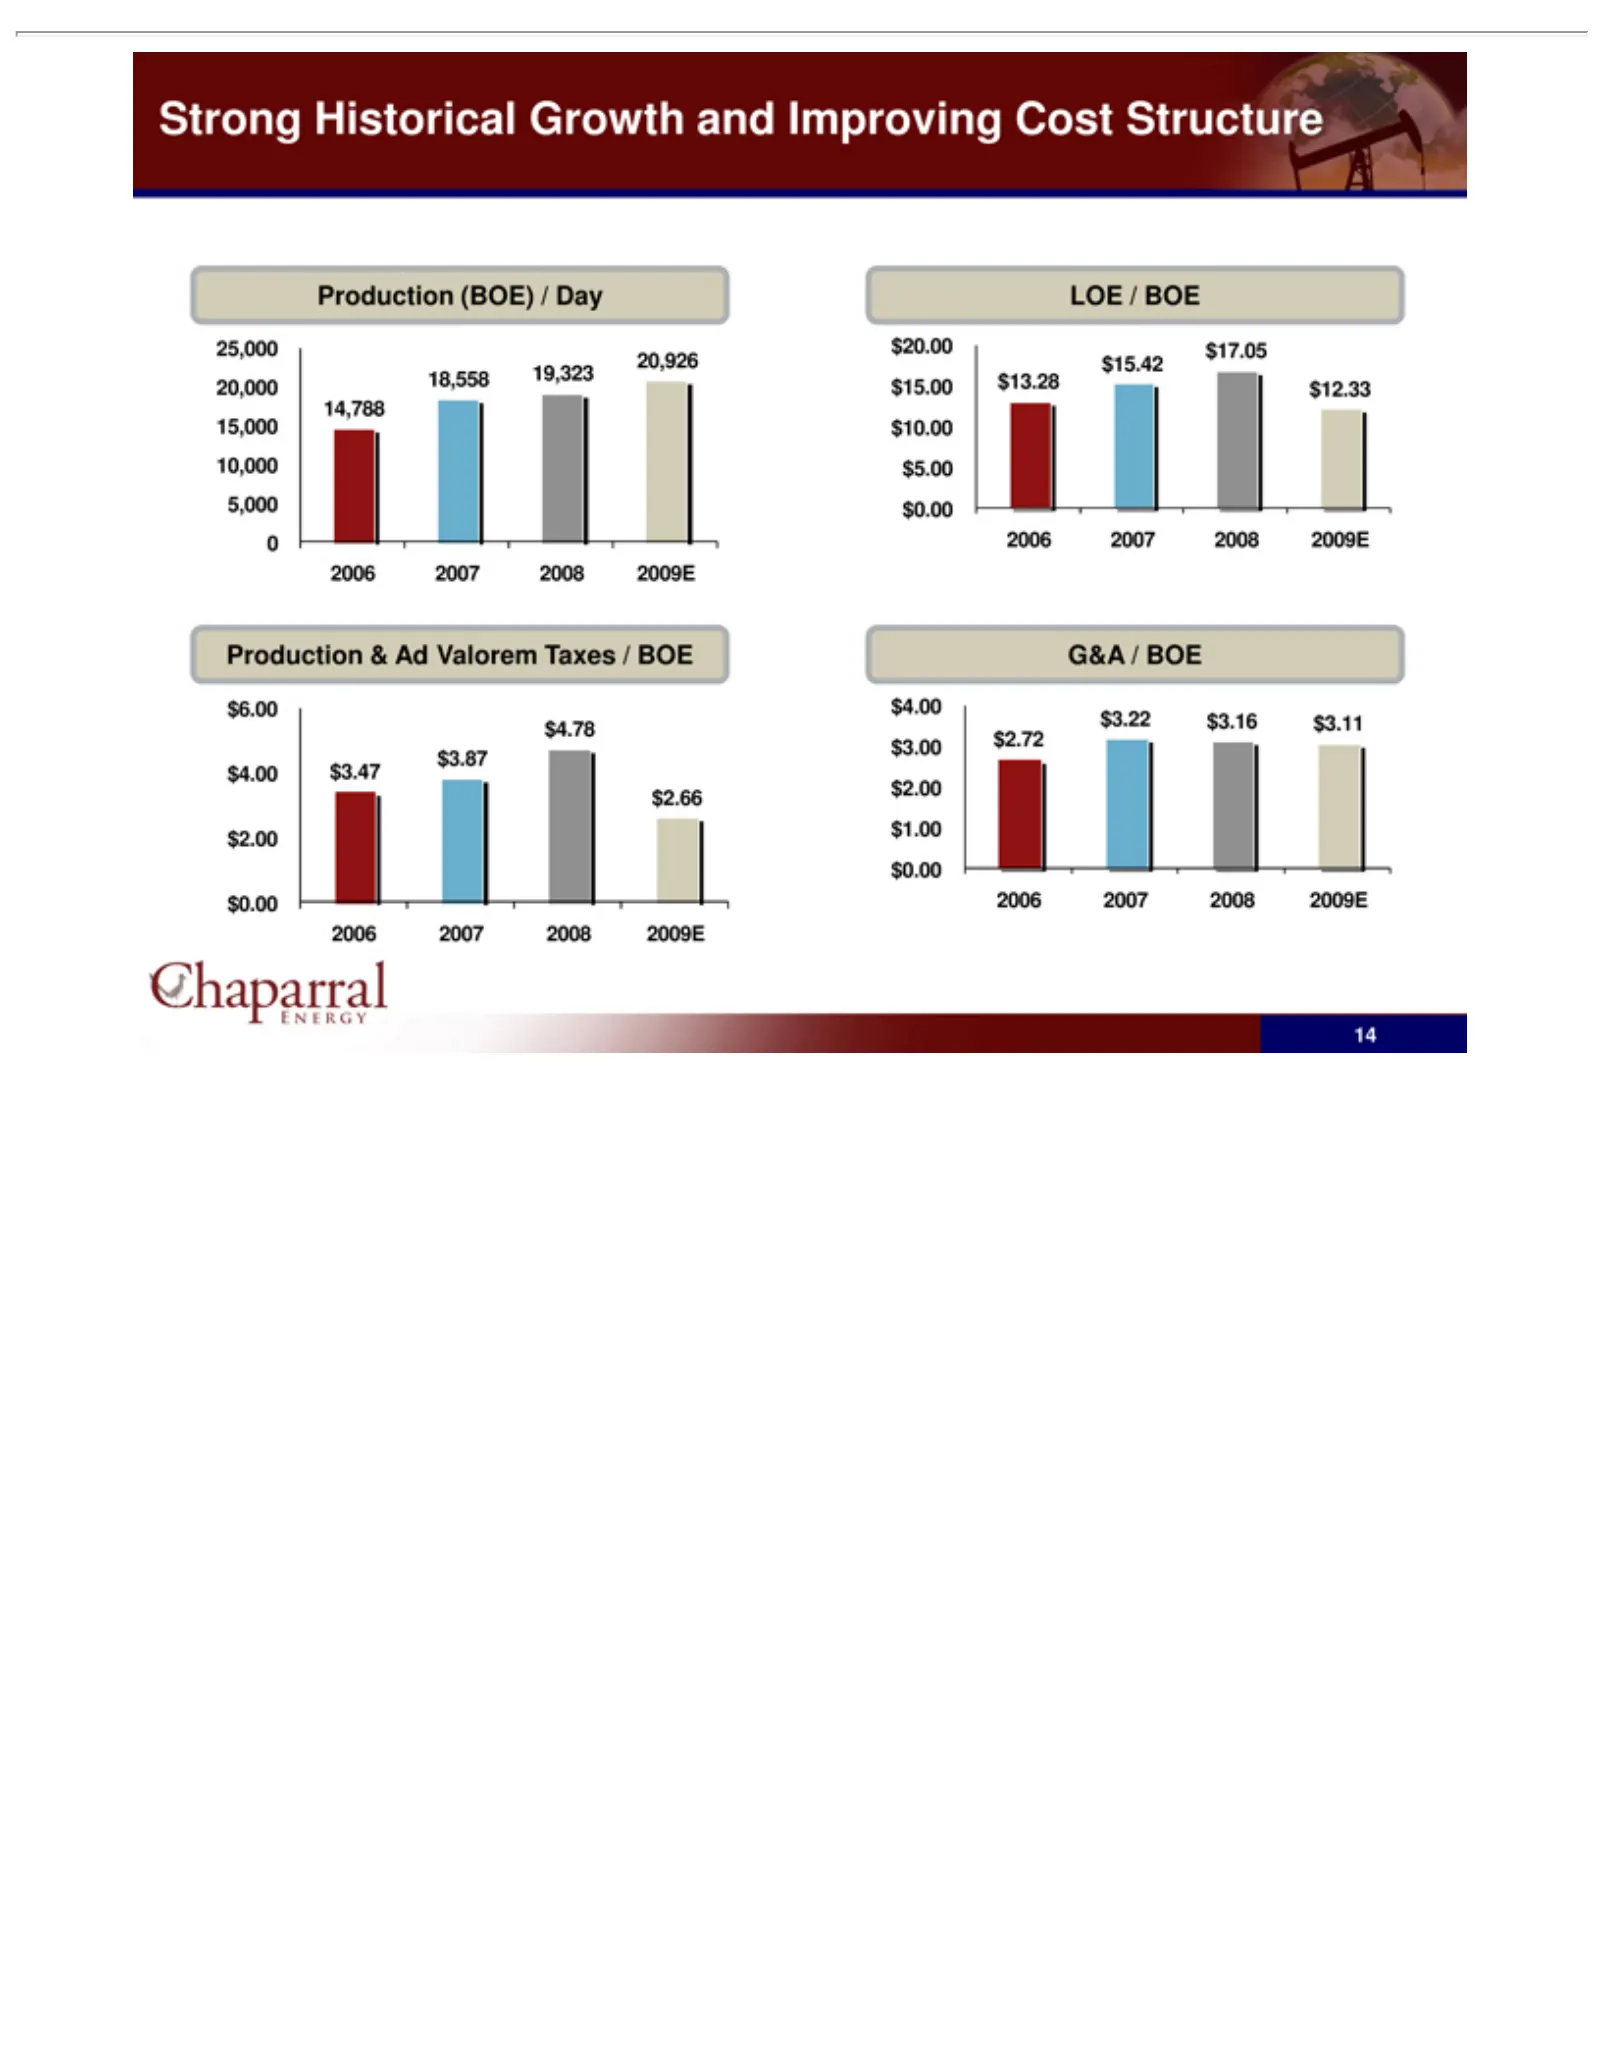
Slide 14: Strong Production and Improving Cost Structure
Strong 25,000 20,000 2 0 5,000 10,000 15,000 14,788 Production $6.00 $2.66 LOE $20.00 $15.00 $15.42 $5.00 $10.00 G&A $4.00 $3.00 2006 $0.00 $1.00 $2.00 14006 /2007 /$2.72 $4.78 $3.47 $3.22 BOE Historical BOE 20,926 18,558 $17.05 $13.28 2008 ($3.16 &$3.87 ) Ad /$12.33 19,323 Day 2009E Valorem Growth
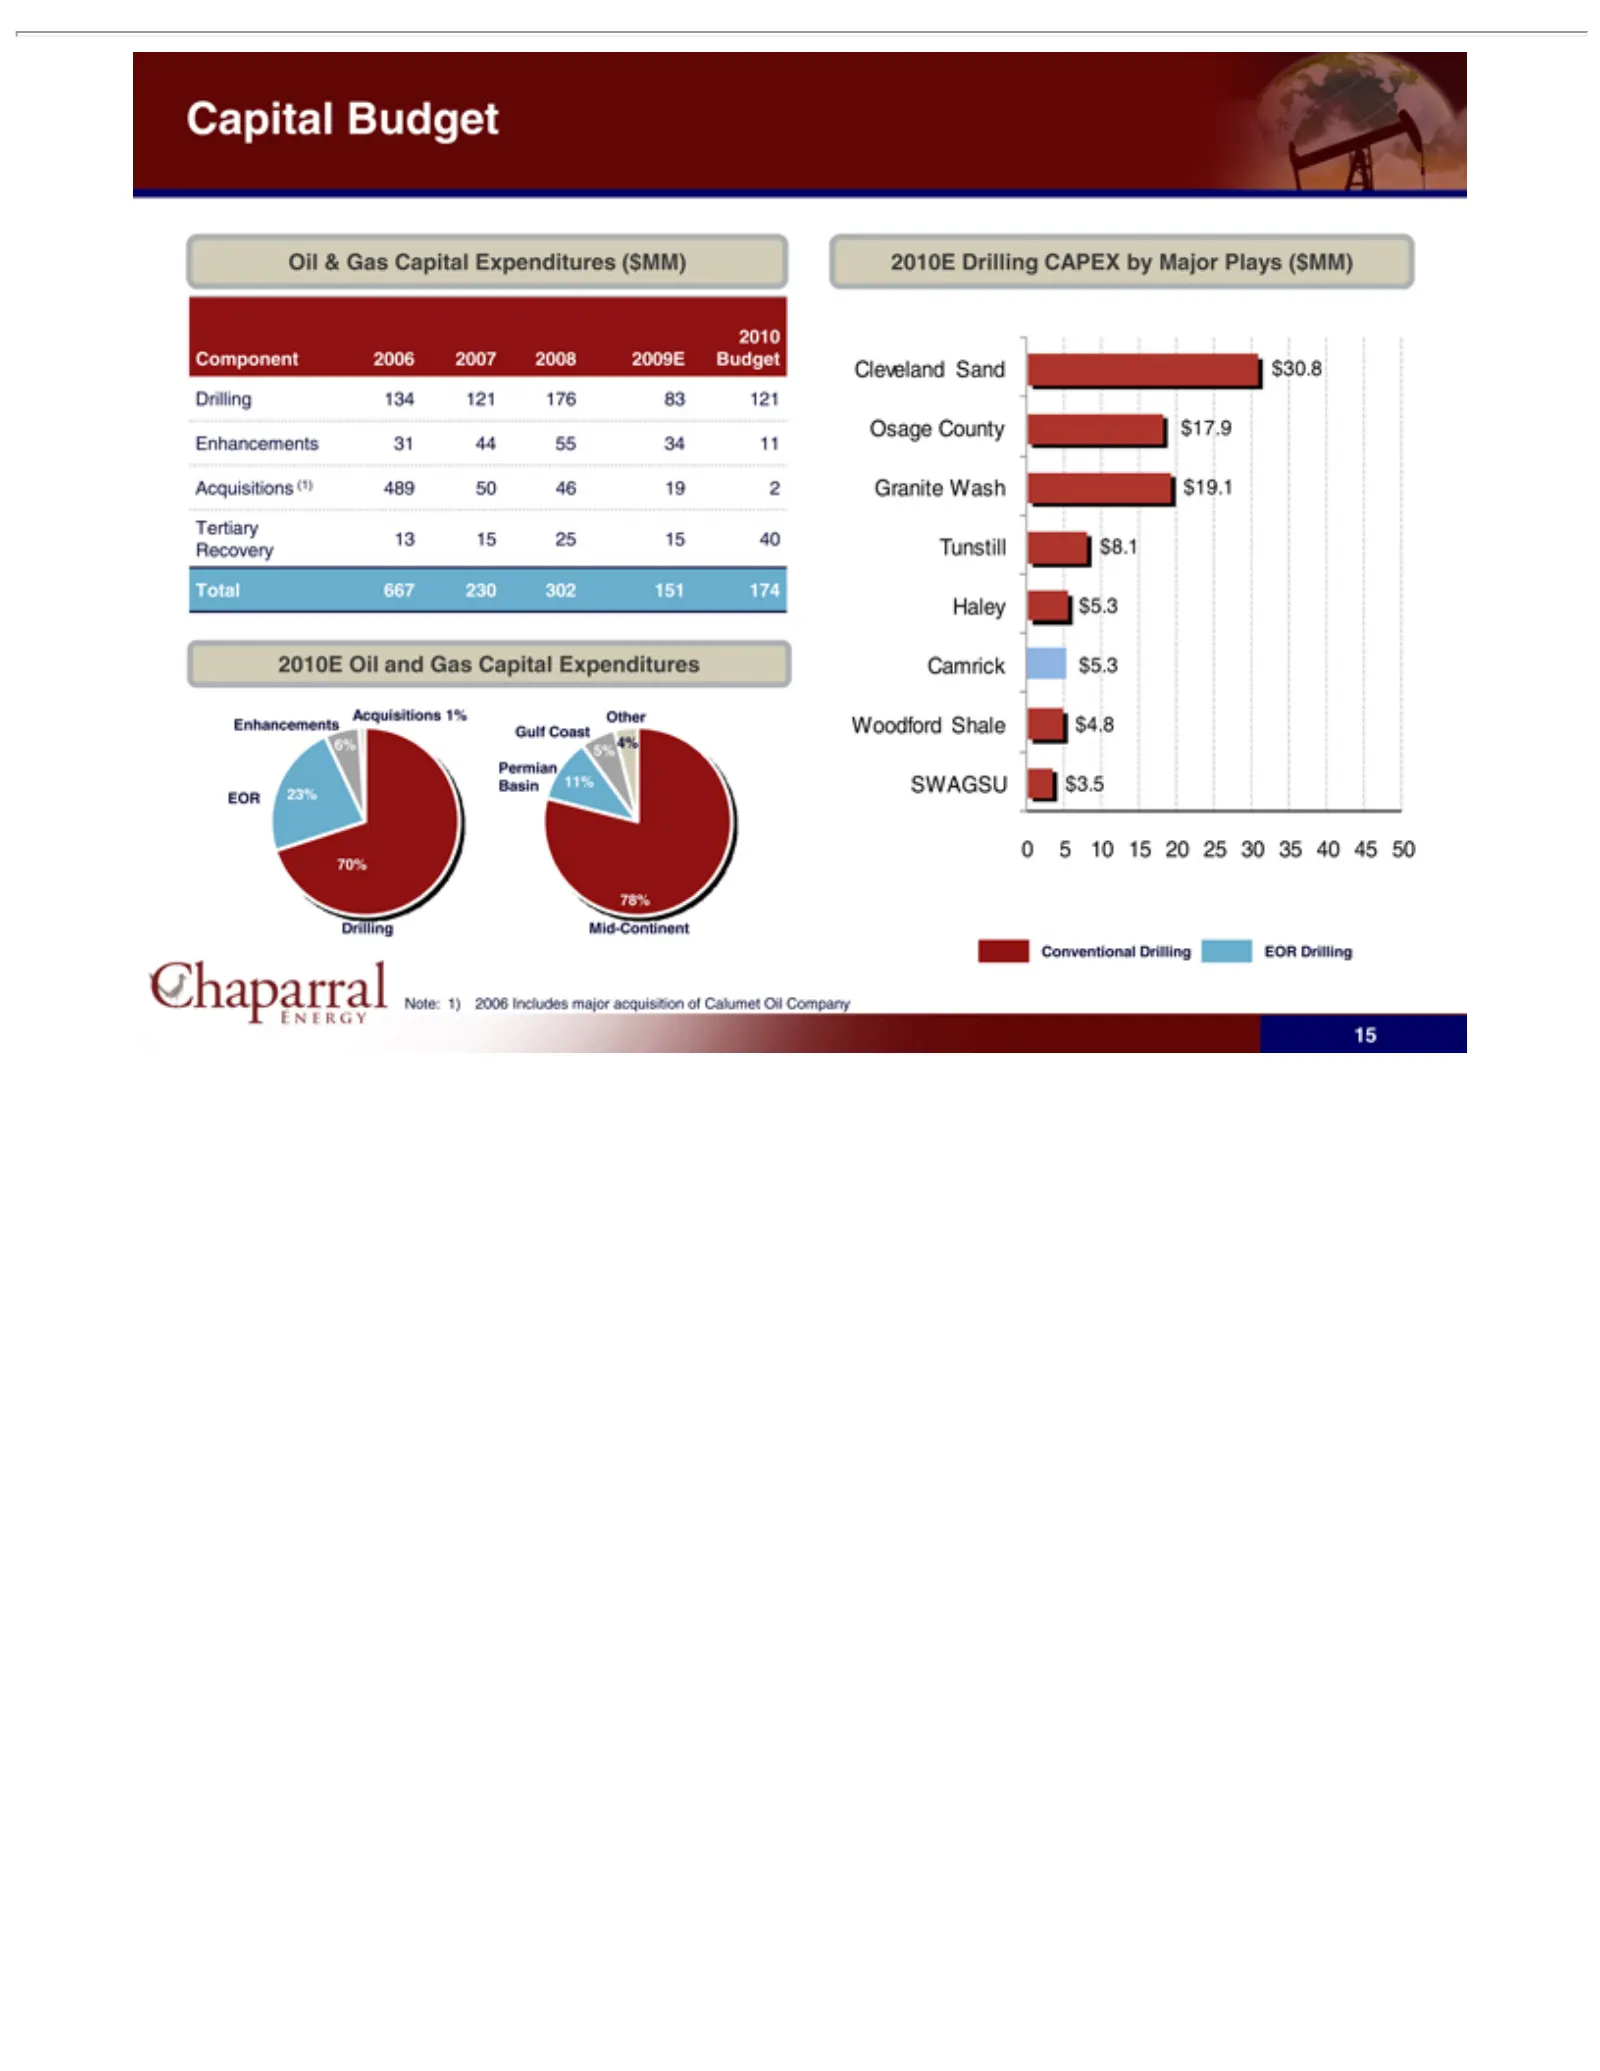
Slide 15: Capital Expenditures Budget
Capital Oil Component 2010 Enhancements Tertiary Total Recovery Acquisitions Gulf 70% 23% 6% Drilling EOR 78% 2010E Cleveland Osage Granite Tunstill Haley Camrick Woodford SWAGSU 0 Conventional Note: 155 10 &79% Coast 667 1) Gas $5.3 County 15 Oil Drilling Budget Wash $8.1 13 134 2006 $5.3 20 230 Mi
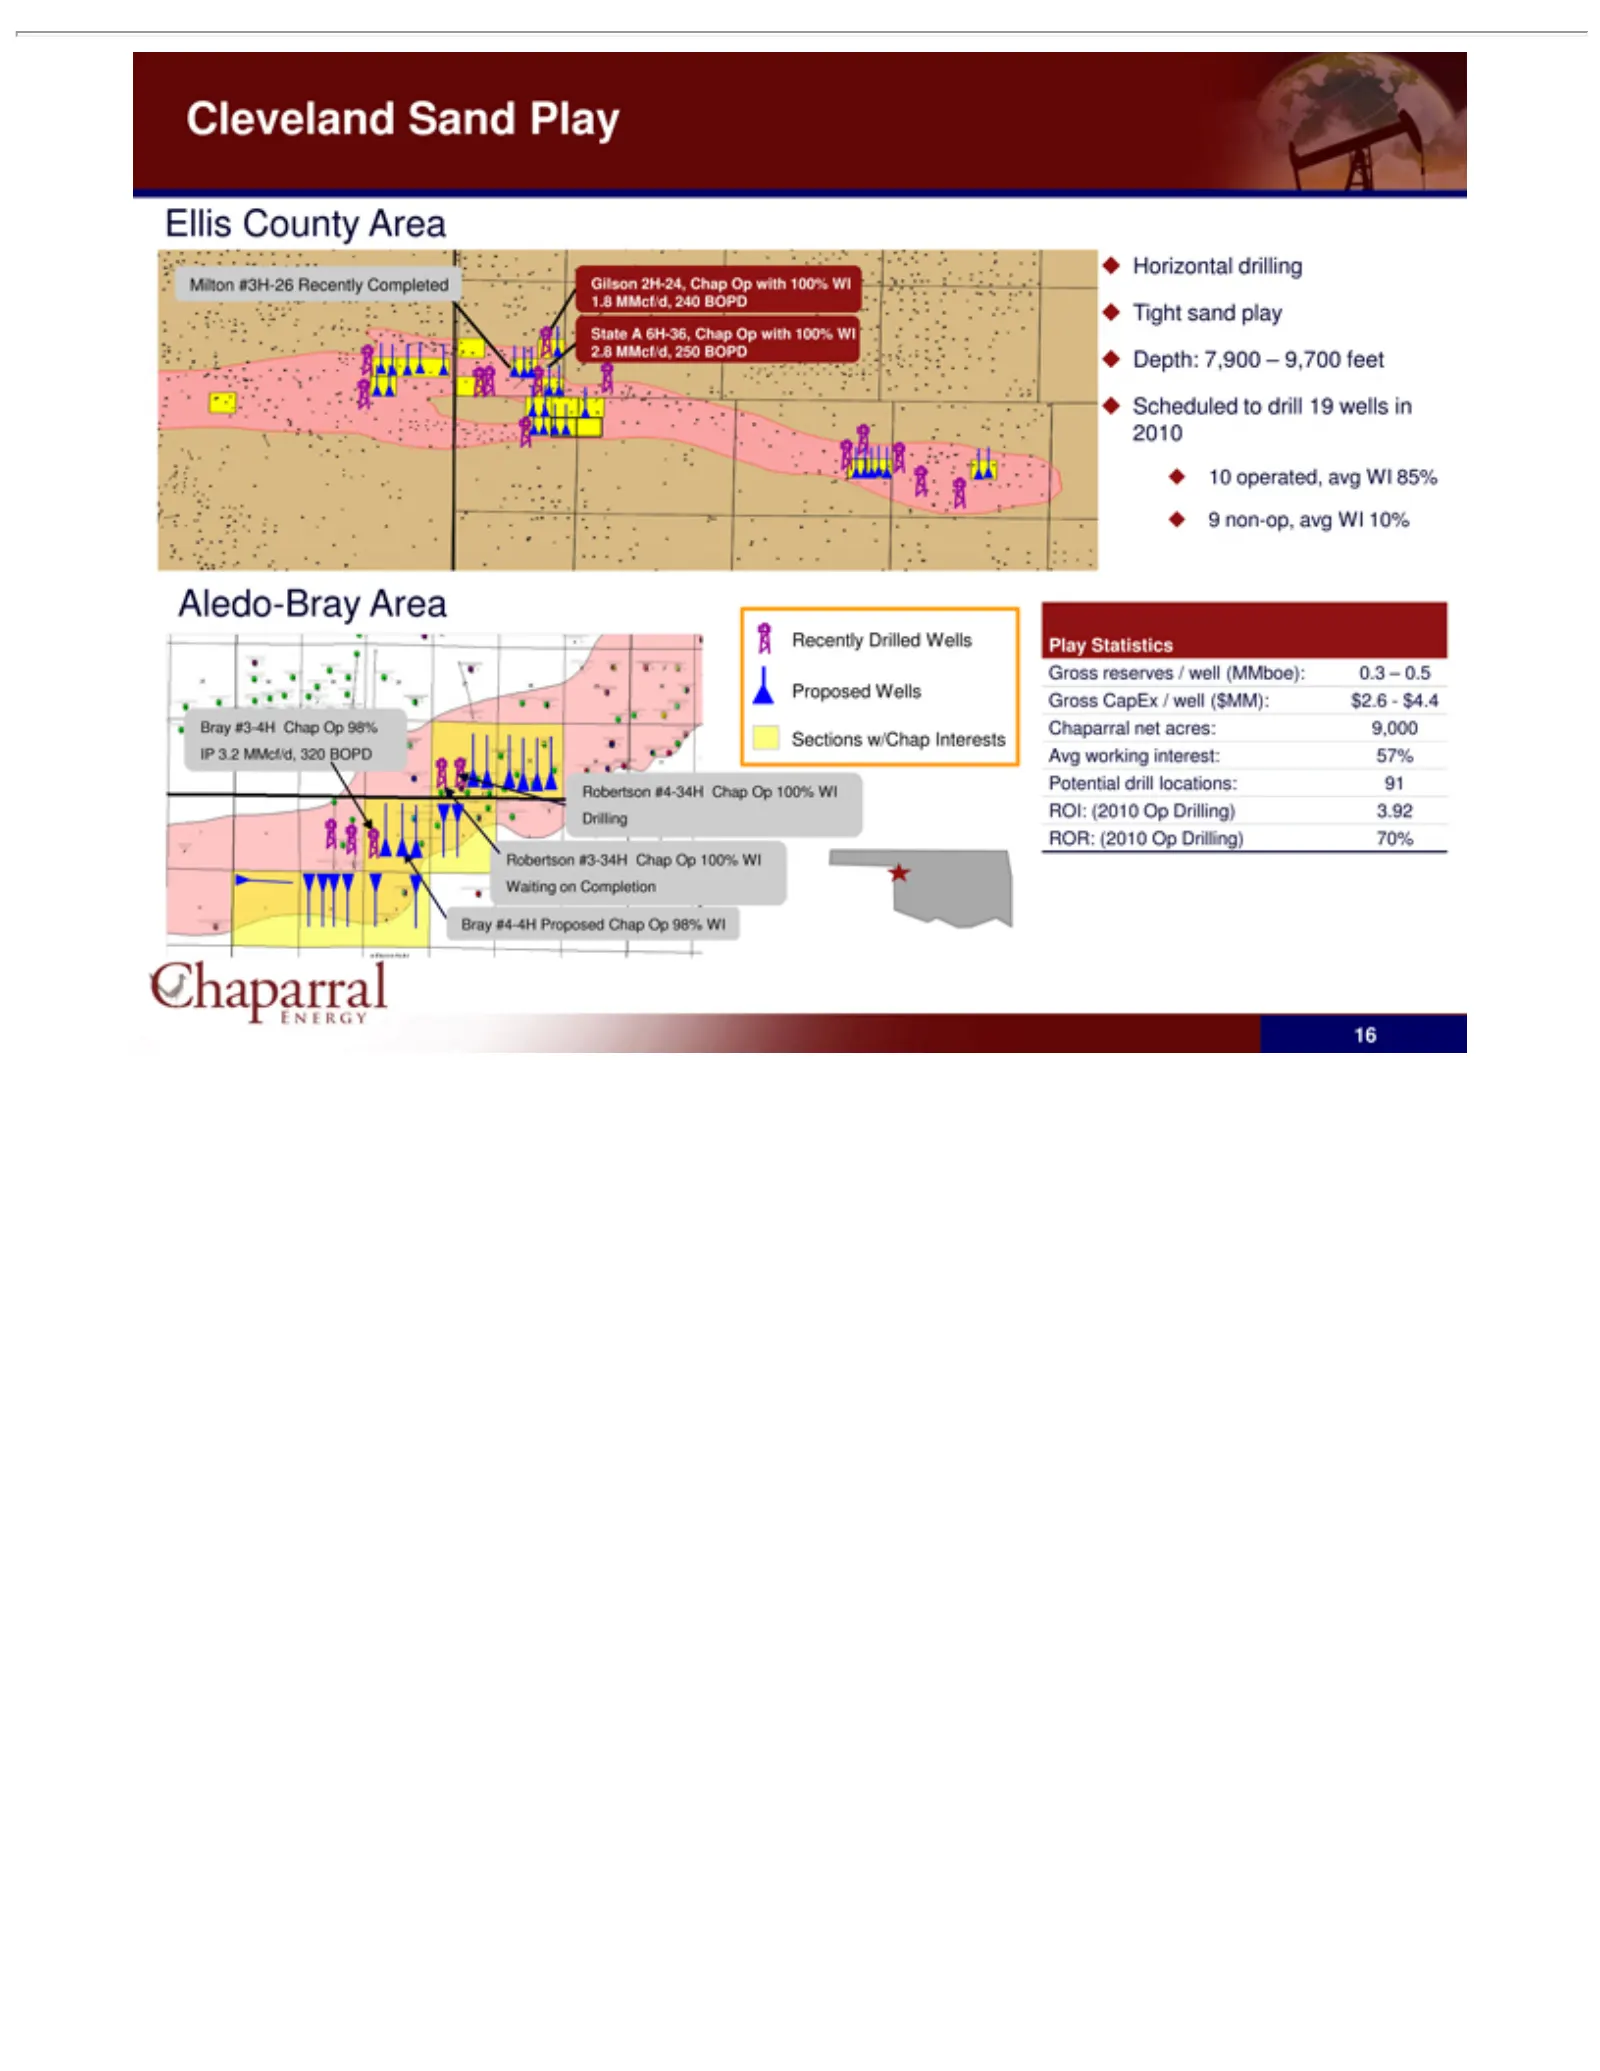
Slide 16: Cleveland Play
Cleveland Ellis Milton Gilson State Aledo-Bray Robertson Bray Recently Horizontal Depth: 10 9 Play Gross Chaparral Avg Potential ROI: ROR: 16non-op, operated, working Statistics County #3-4H #4-4H A (2010 reserves CapEx (2010 2H-24, 7,900 #3H-26 6H-36, Drilled drill avg net Sand #4-34H #3-34H drilli
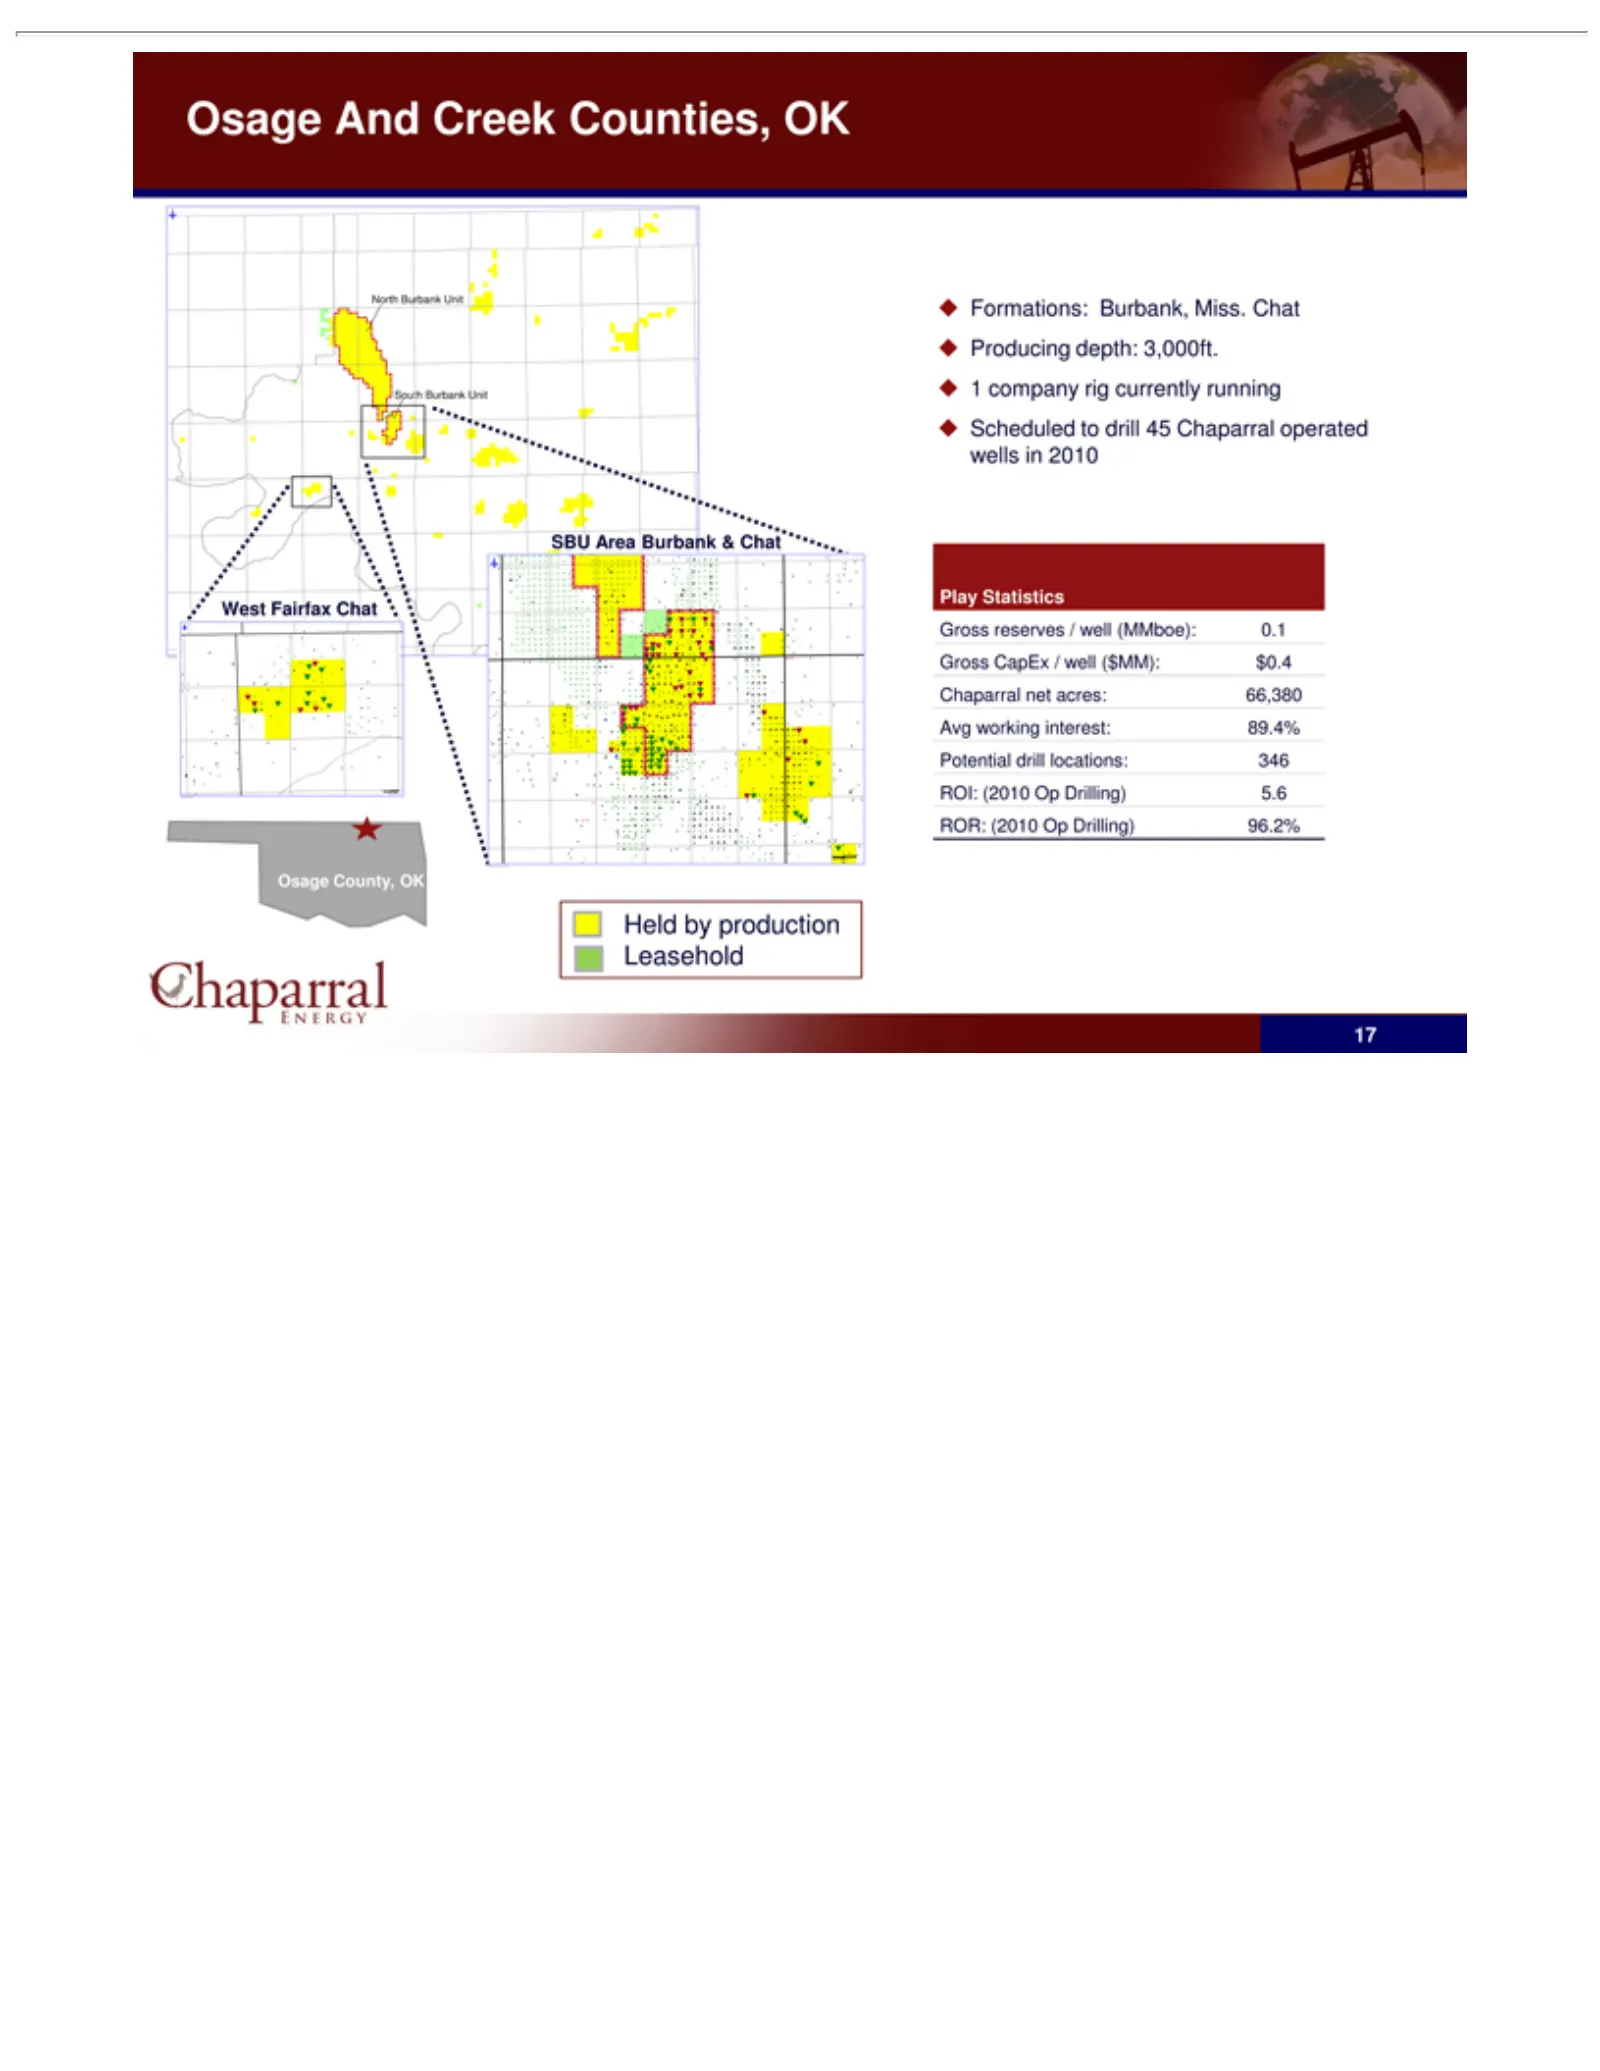
Slide 17: North Burbank / Osage Play
North South West SBU Osage Held Formations: 1 Scheduled Play Gross Chaparral Avg Potential ROI: ROR: 17company working Statistics Area by Fairfax (2010 Burbank reserves CapEx (2010 And County, production drill net Burbank to rig Creek Op Burbank, Op Chat drill interest: /acres: locations: currently
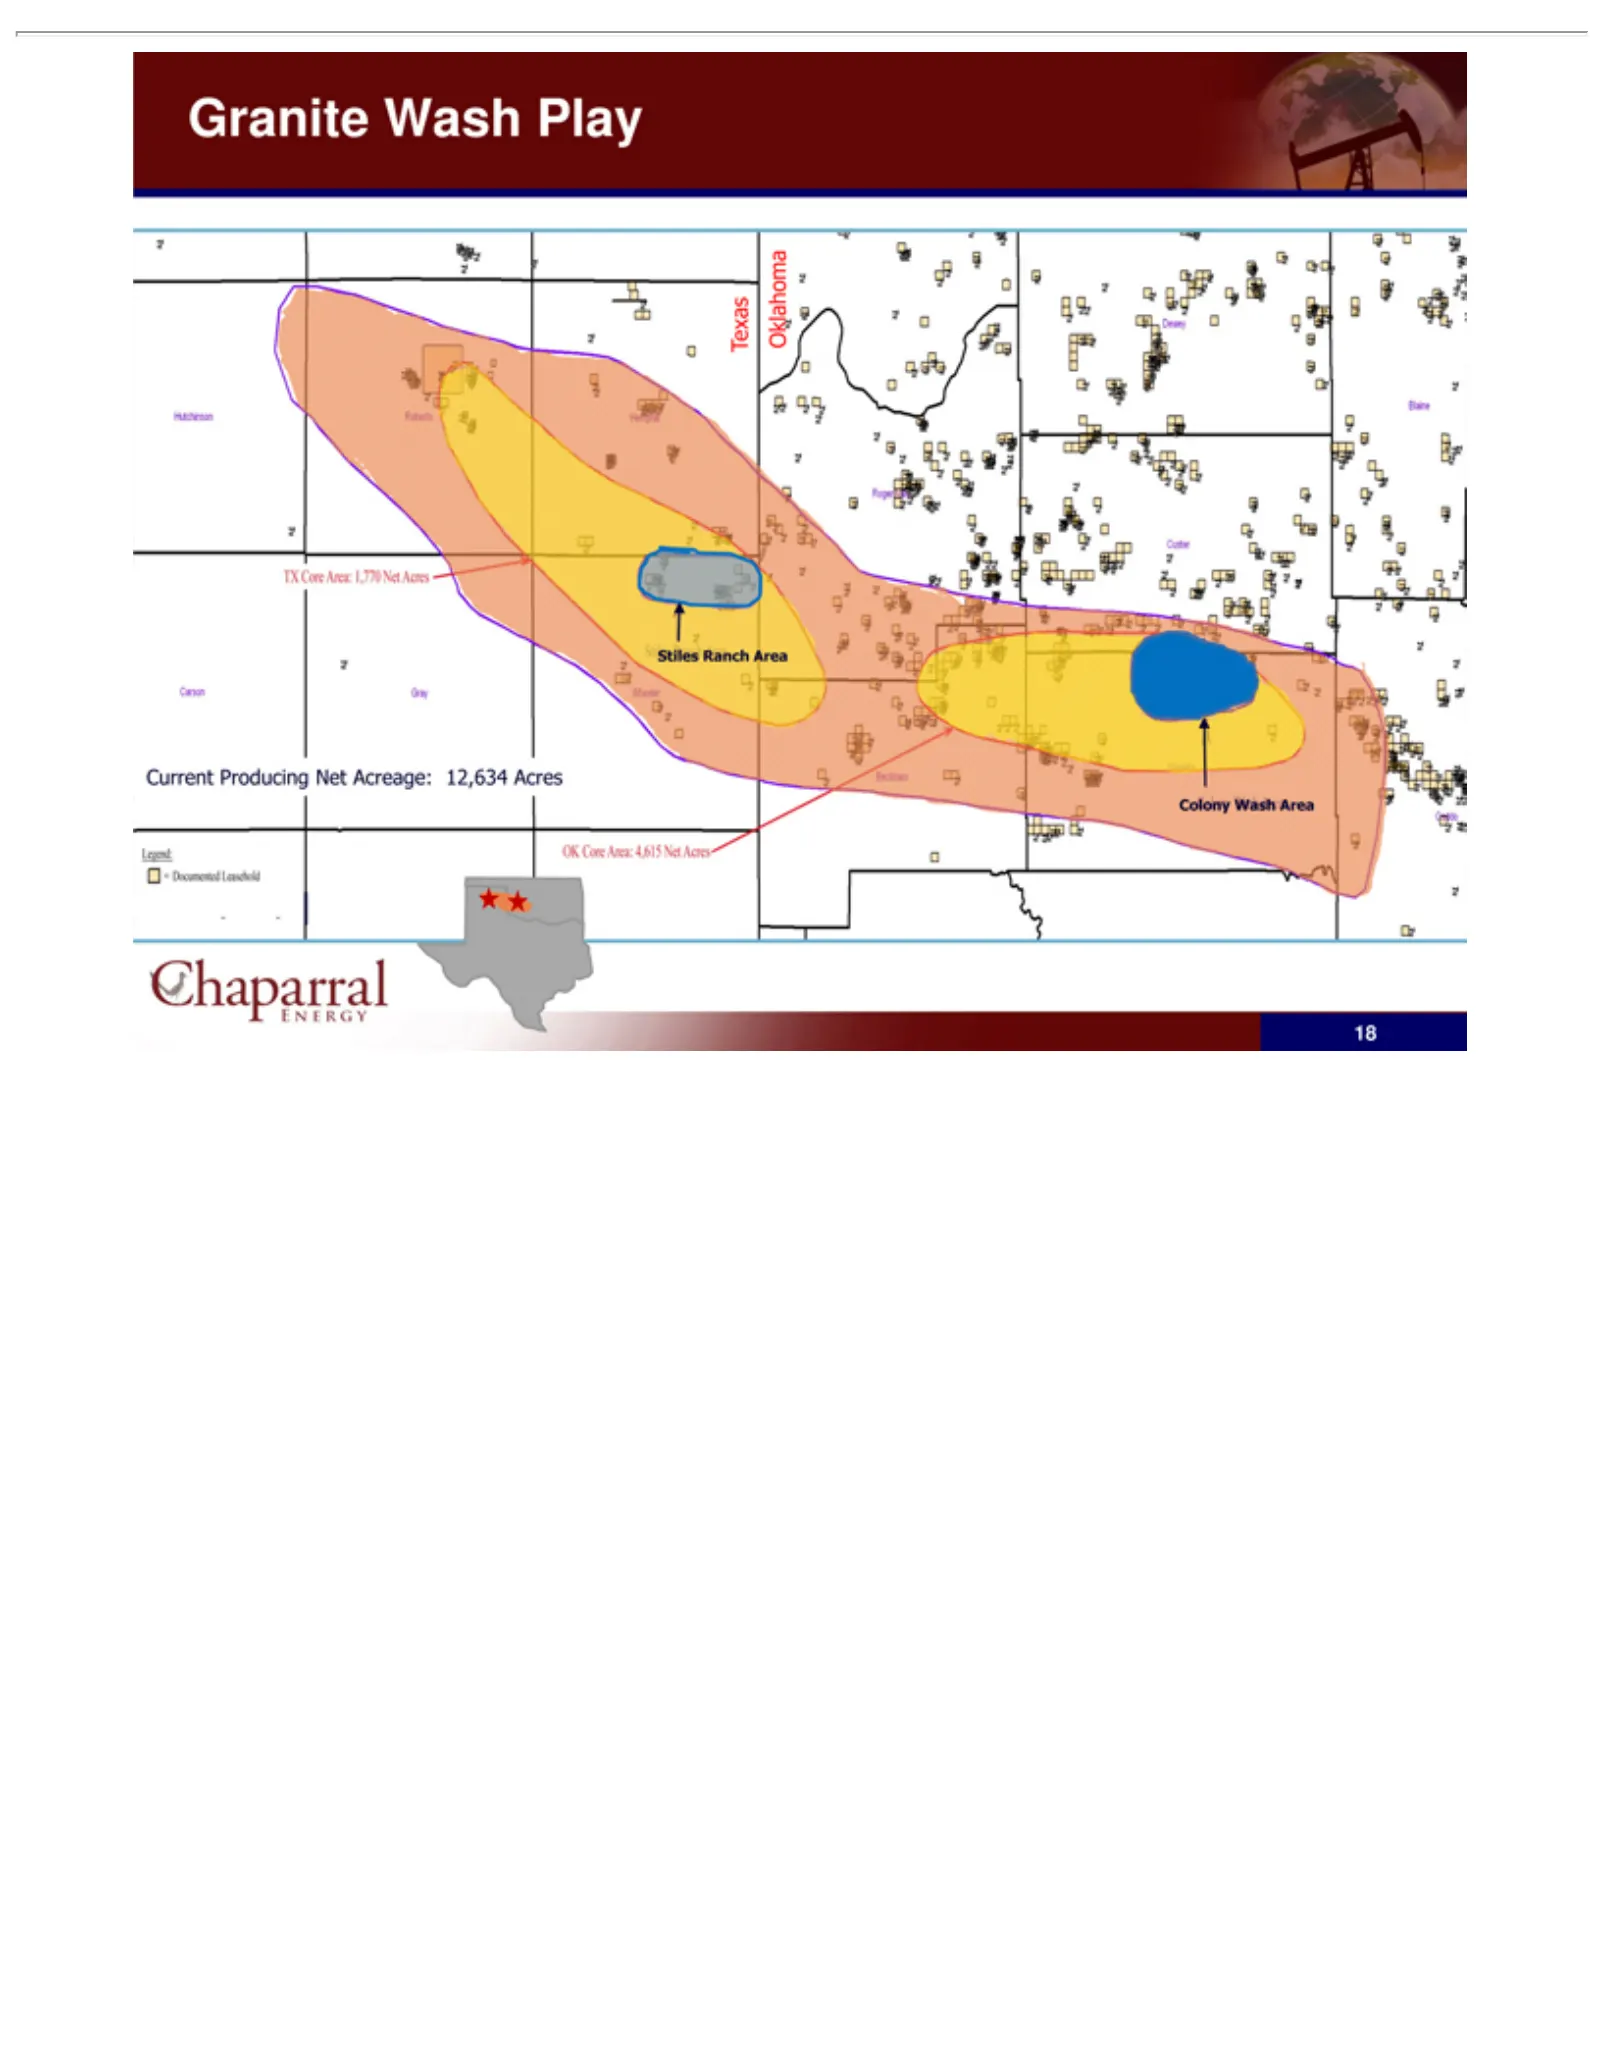
Slide 18: Granite Wash Current Producing Area
Granite Current Oklahoma Texas Colony Stiles 18 ranch wash Wash producing area area Play net average: 12,634 acres
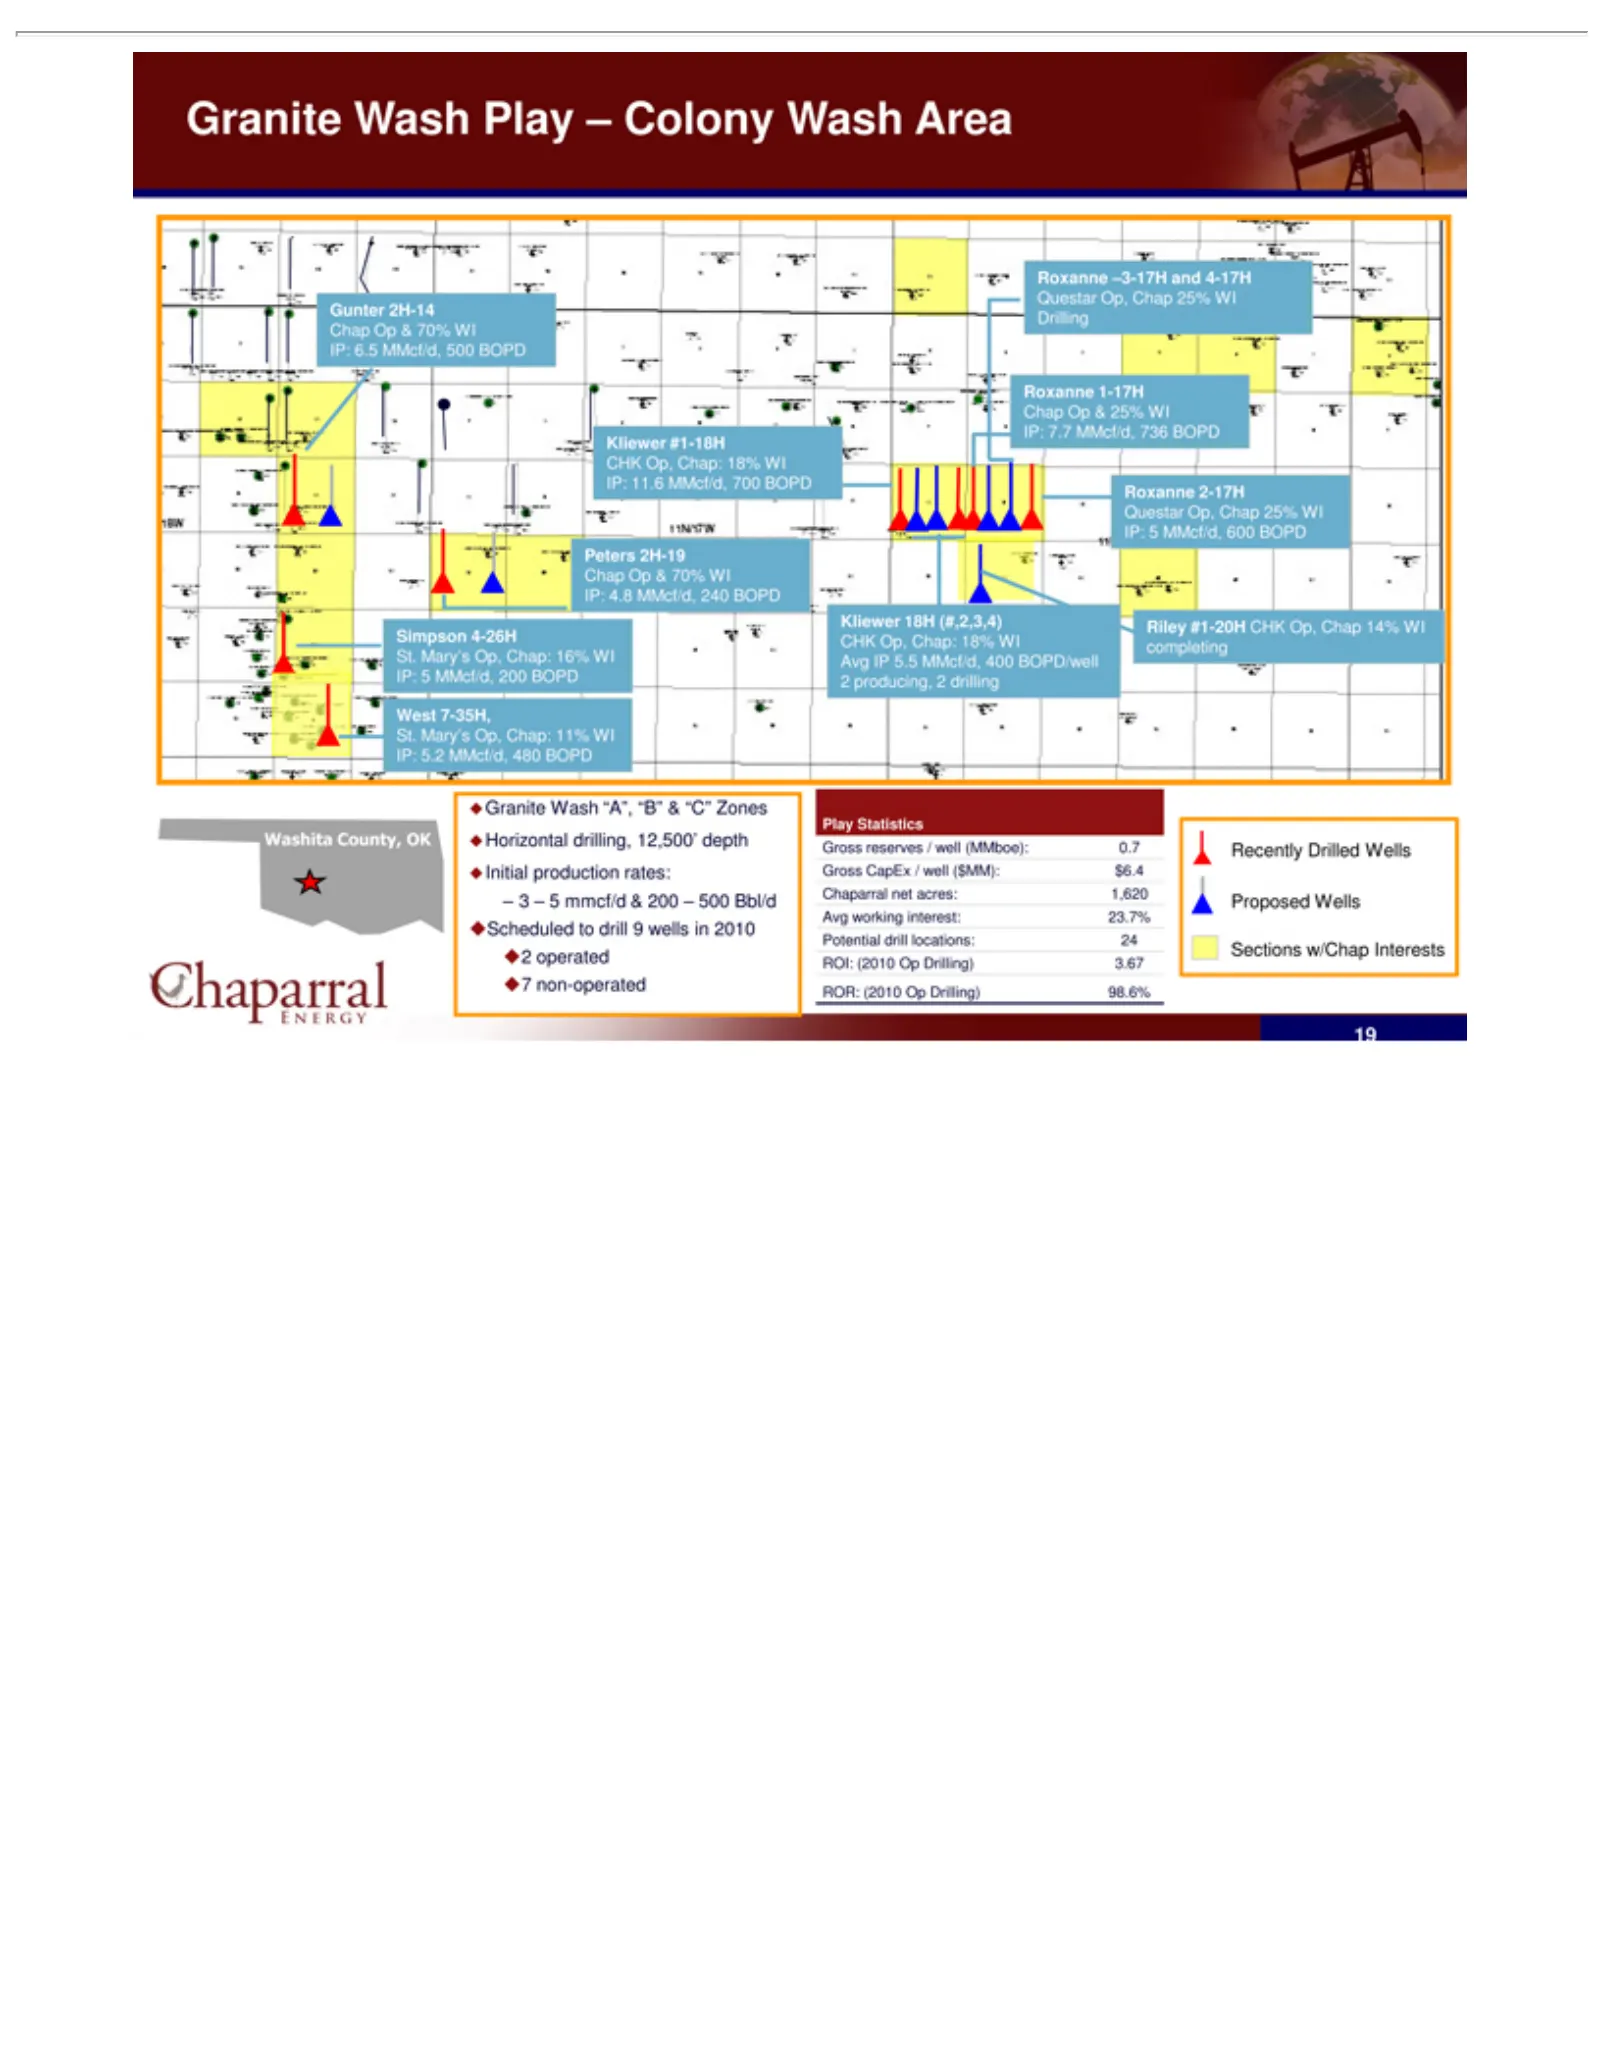
Slide 19: Granite Wash Play
Gunter Peters Simpson West St. Chap Roxanne Questar Kliewer CHK Riley Granite – 2 7 Play Gross Chaparral Avg Potential ROI: ROR: Washita Recently 193 Mary’s operated non-operated –working IP Statistics 7-35H, 5(2010 Op Op, #1-20H reserves CapEx (2010 2H mmcf/d 5.5 2H-14 Wash Op, county, #1-18H 18H 4
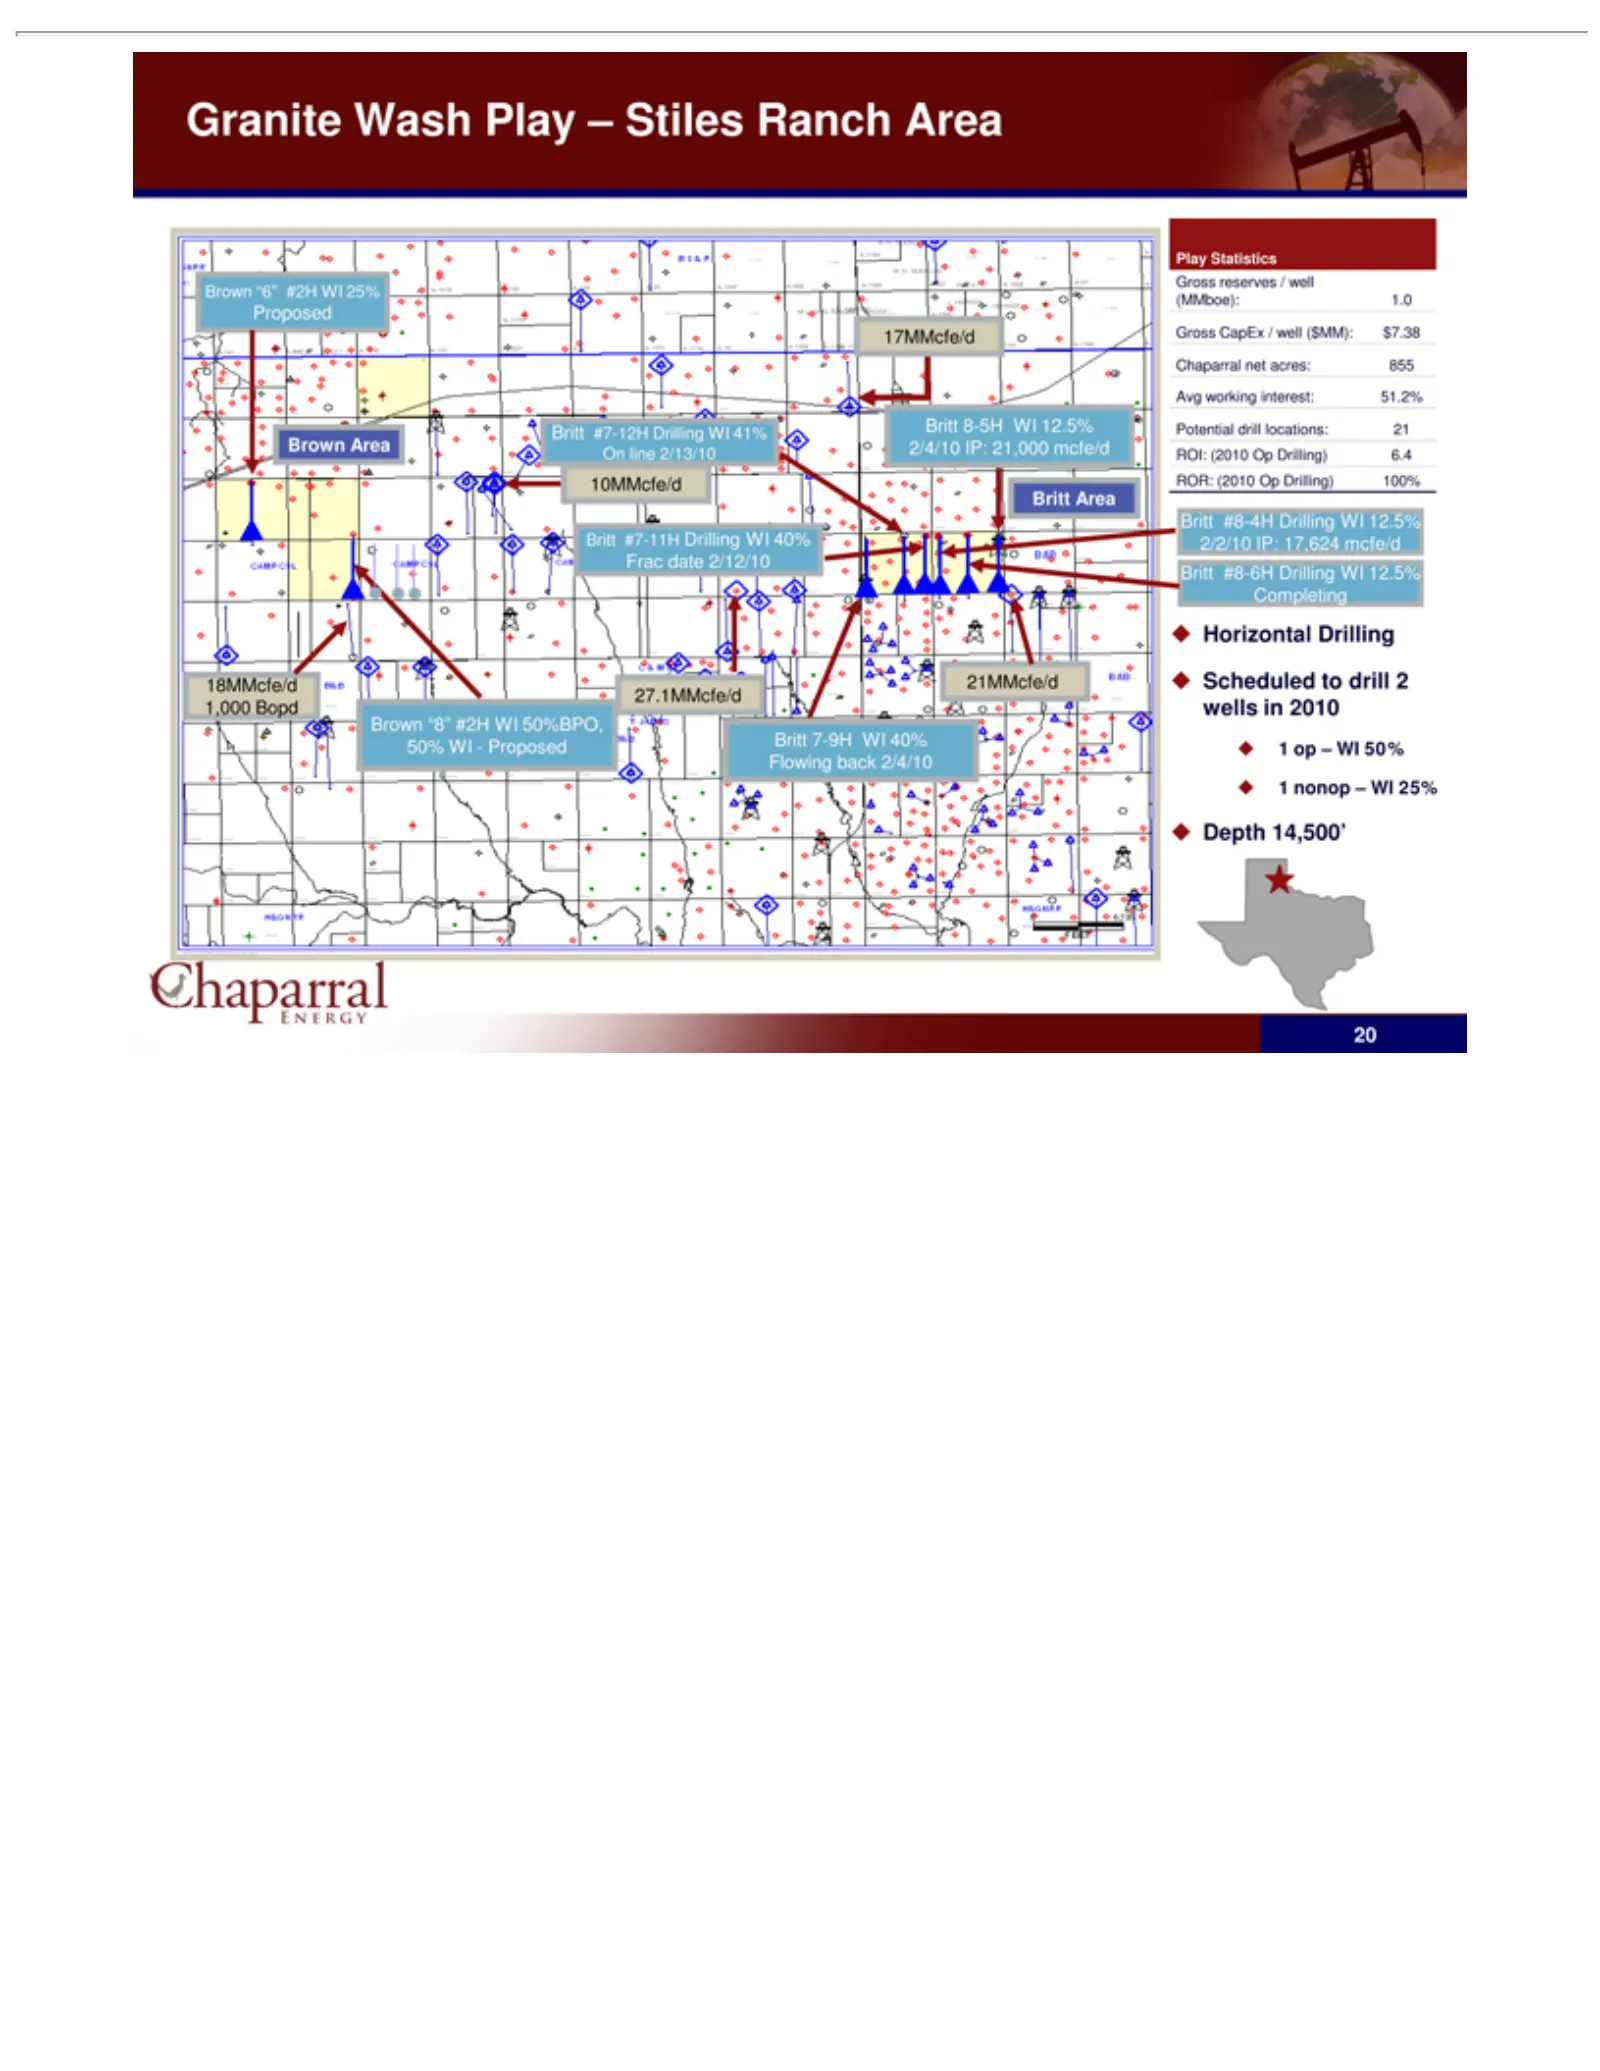
Slide 20: Granite Wash Stiles Ranch Area
Granite 18MMcfe/d 10MMcfe/d Brown 27.1MMcfe/d 17MMcfe/d 21MMcfe/d Play (MMboe): Gross Chaparral Avg Potential ROI: ROR: Britt Horizontal _ Depth 201 nonop opworking Statistics Area #7-12H #7-11H 8-5H 7-9H #8-4H (2010 reserves CapEx (2010 14,500’ –Area “6” “8” Wash WI drill net –WI 1.0 Drilling #2H O
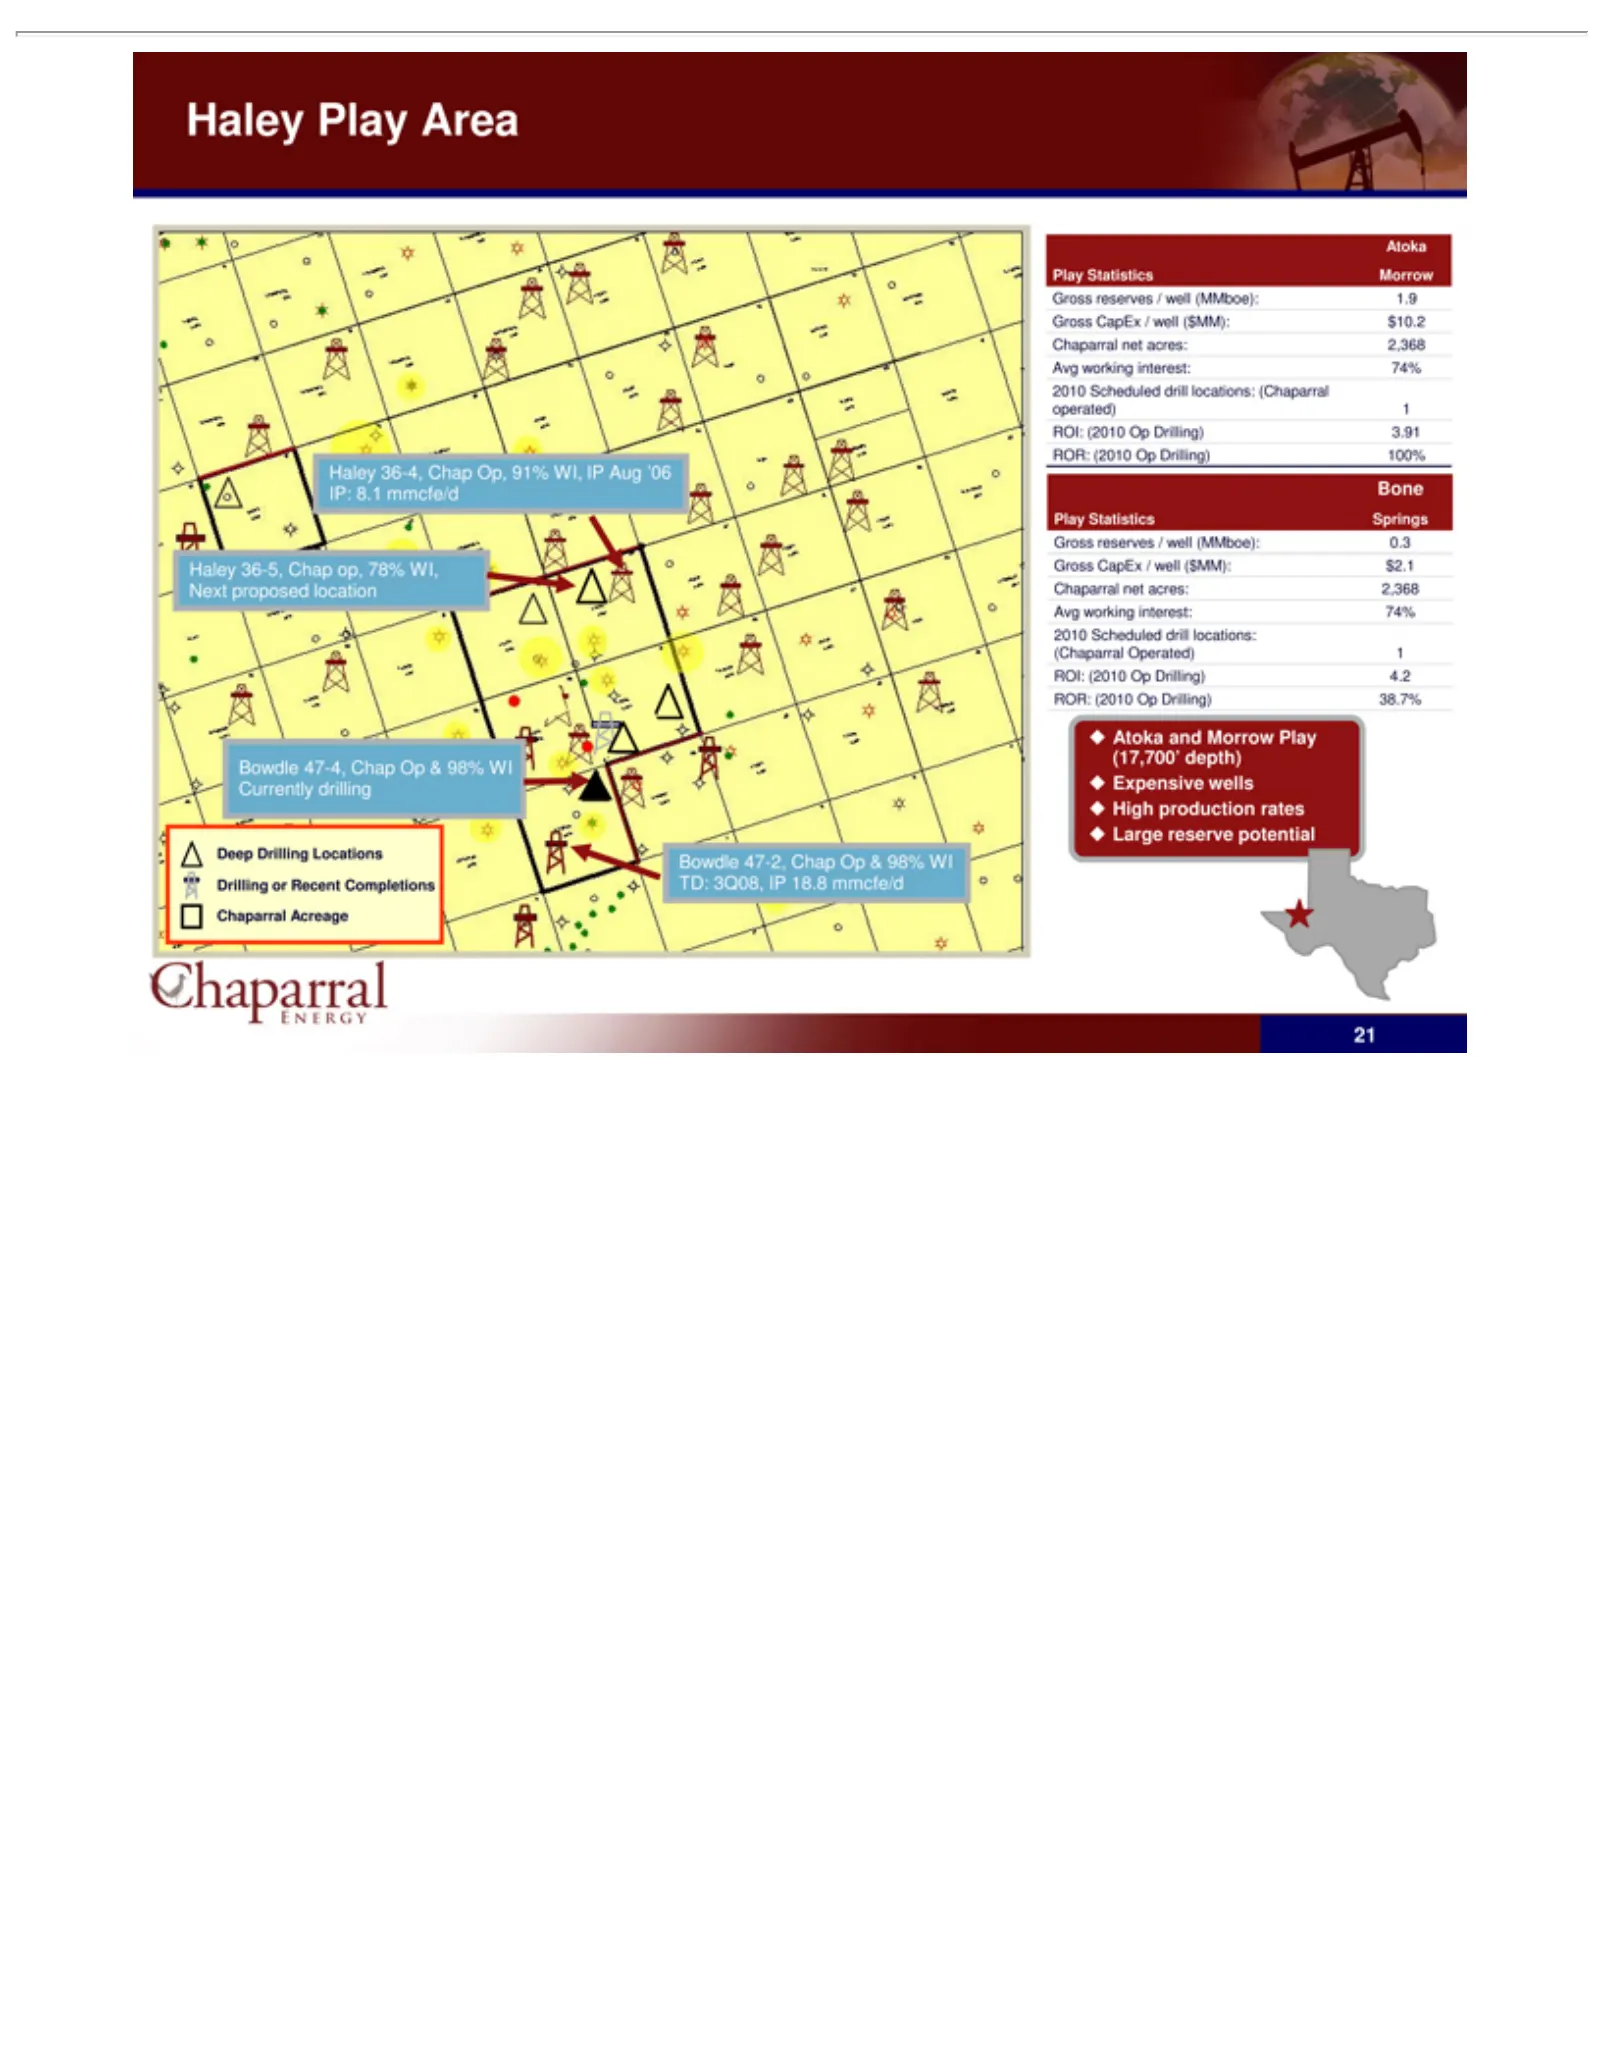
Slide 21: Haley / Bowdle Deep Morrow Play
Haleyworking Bowdle Deep operated) Play Bone Gross Chaparral Avg 2010 (Chaparral ROI: ROR: Atoka 21 Statistics Scheduled (2010 Drilling reserves CapEx (2010 Play 36-4, 36-5, and 47-4, 47-2, 1net Morrow Operated) Area Op Chap Op interest: /acres: Chap Locations Morrow Springs well /Drilling) well Dri
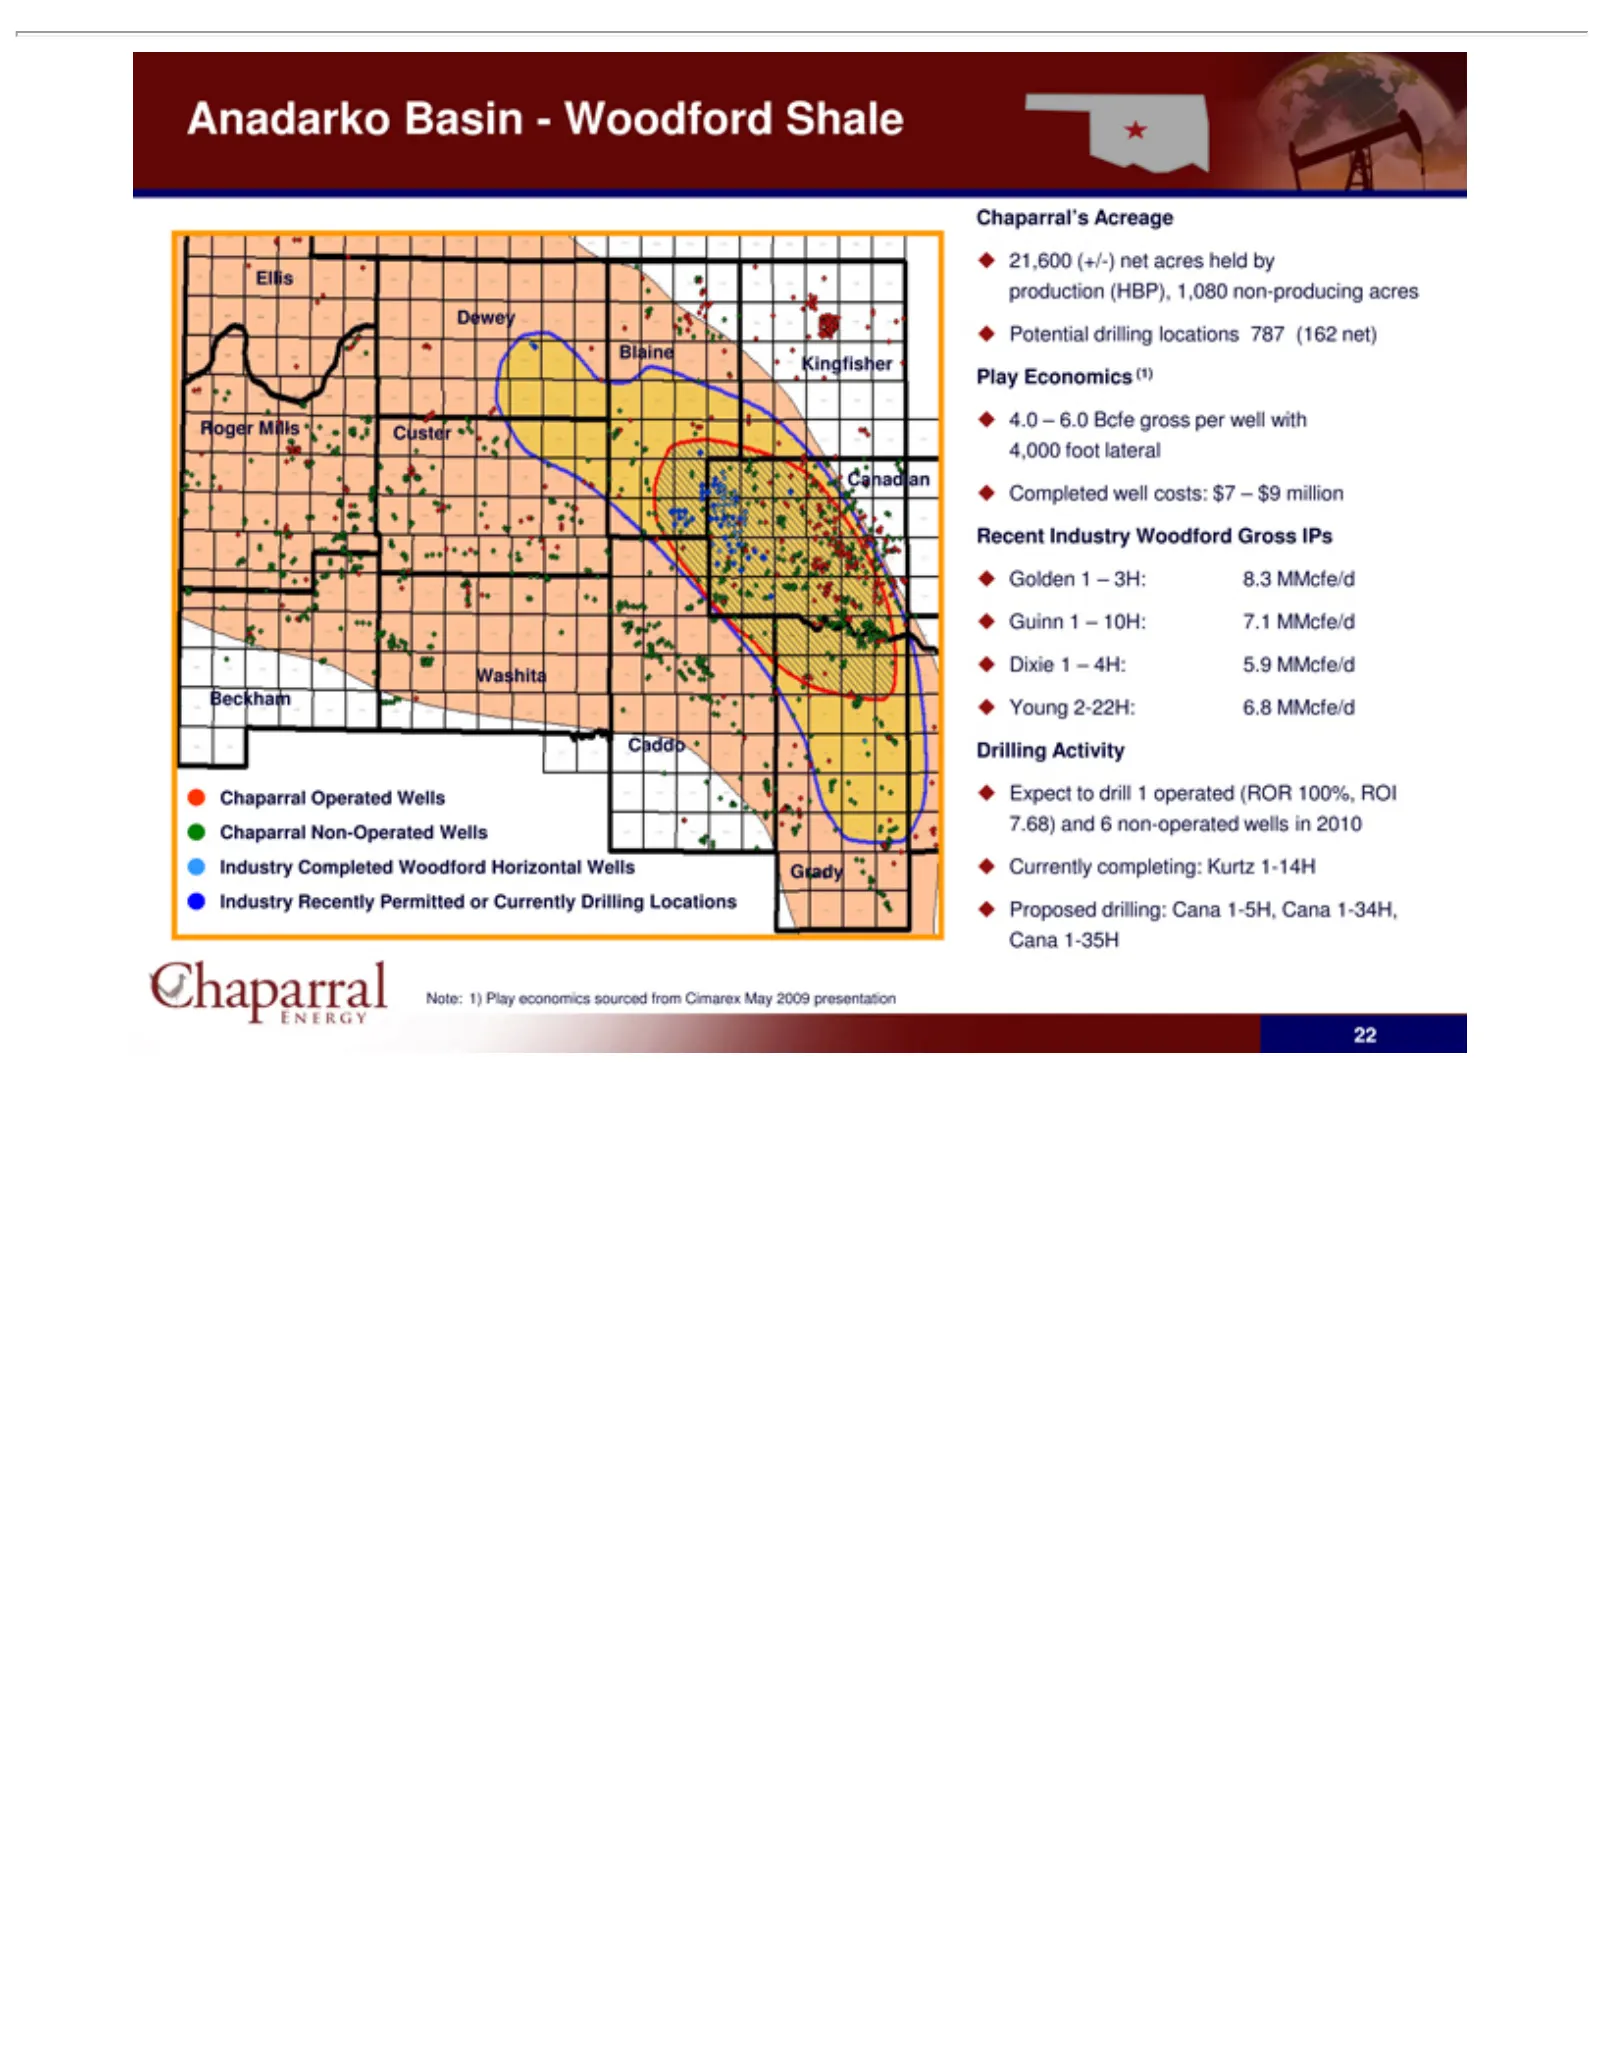
Slide 22: Anadarko Basin Woodford Shale Play
Anadarko Roger Kingfisher Blaine Dewey Ellis Washita Canadian Chaparral Grady Caddo Industry Chaparral’s 21,600 Potential Play 4.0 Completed Recent Golden Guinn Dixie Young Drilling Expect Currently Proposed Note: 22 –Economics 6.0 1Mills 1) 12-22H: (+/-) to Industry 1–Activity Beckham –Play Complet
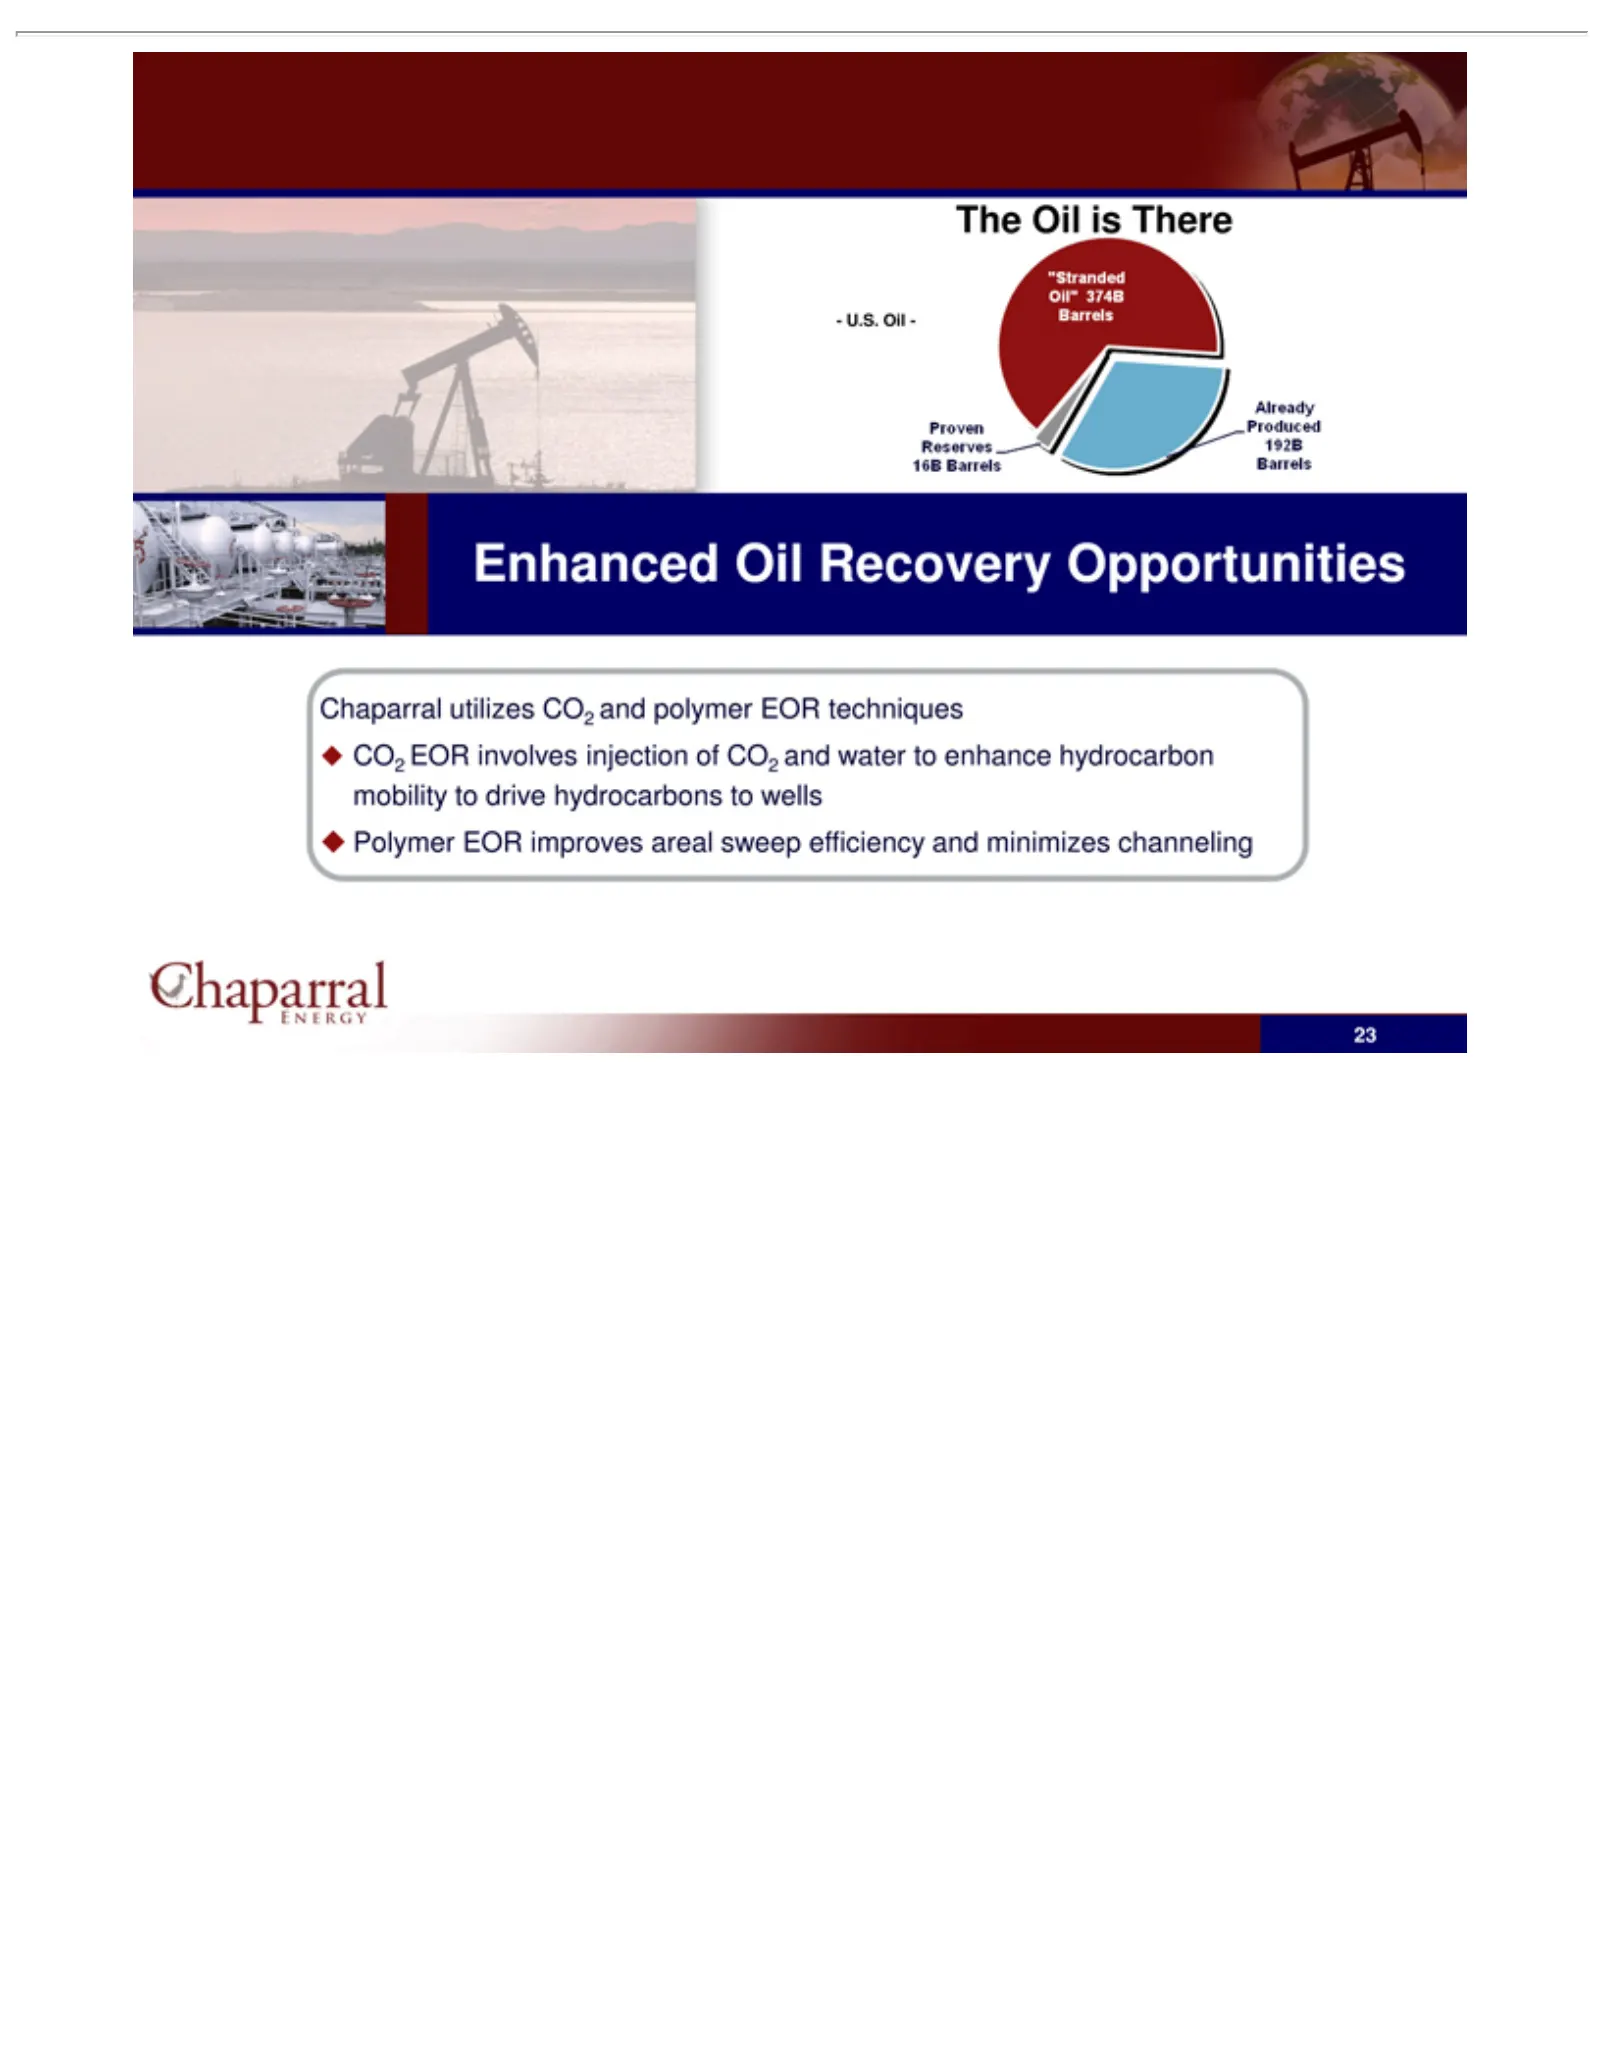
Slide 23: The Enhanced Oil Recovery Opportunity
-The Enhanced Chaparral CO2 Polymer 23 U.S. Oil EOR Oil isEOR -utilizes Oil There involves Recovery improves CO2 injection and Opportunities areal polymer of sweep CO2EOR efficiency and water techniques and to enhance minimizes hydrocarbon channeling mobility to drive hydrocarbons to wells
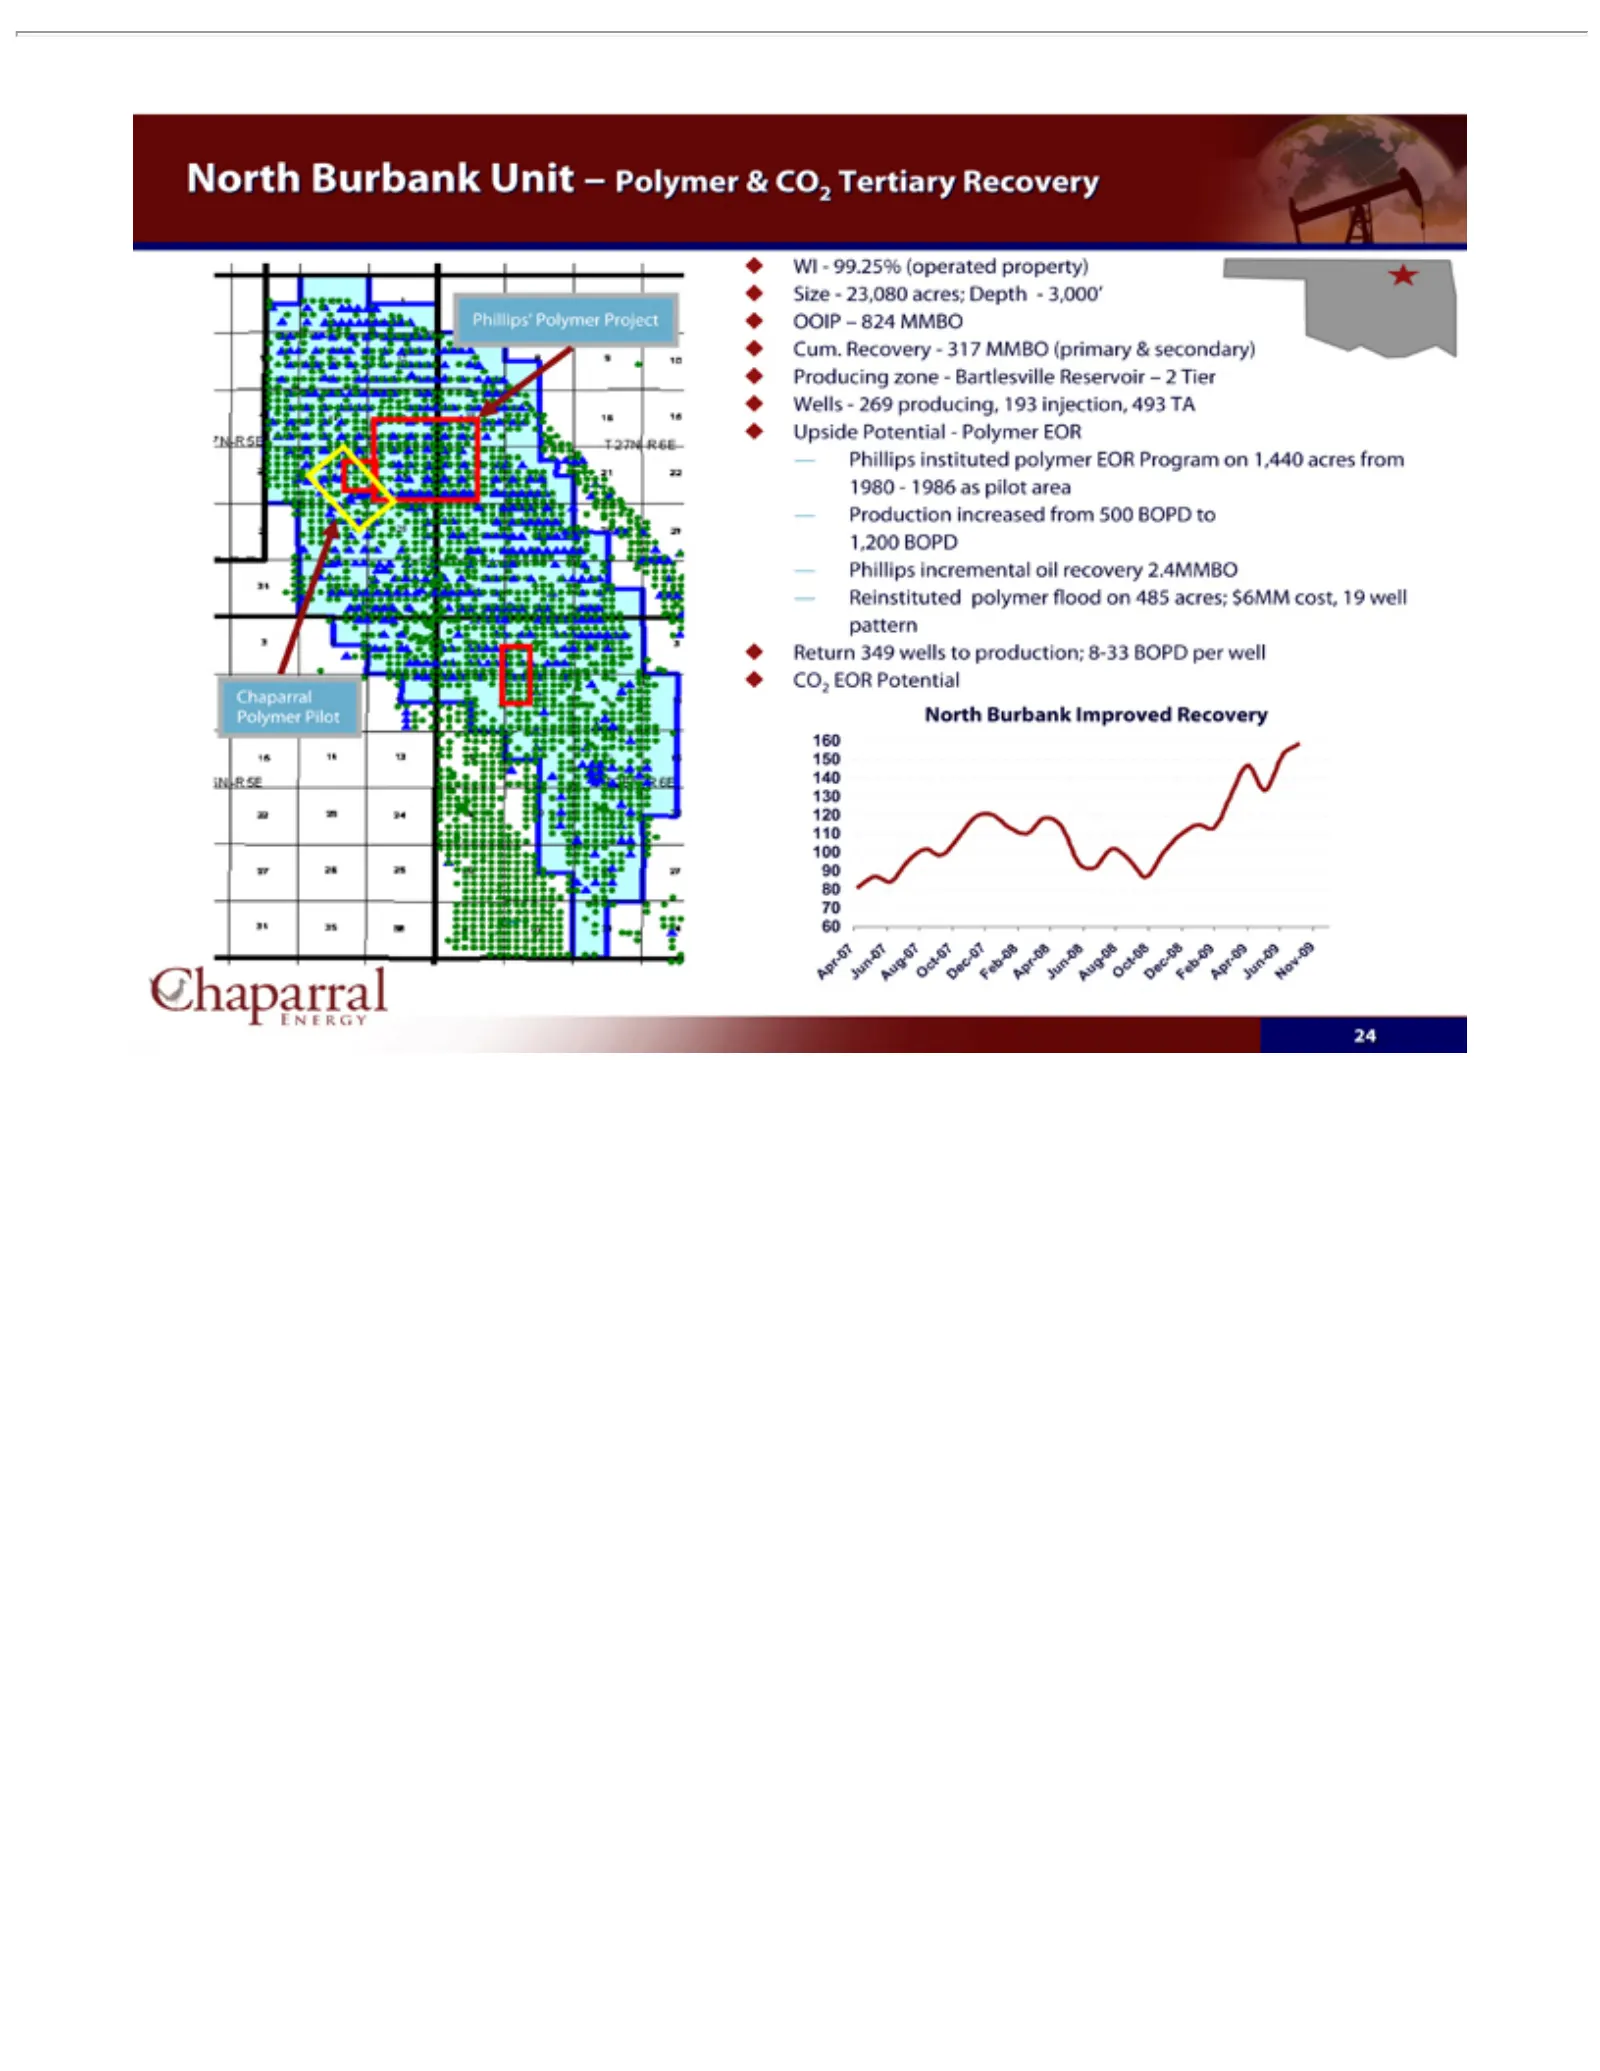
Slide 24: North Burbank Polymer EOR Pilot
WI -150 Size OOIP Cum. Producing Wells Upside Production Phillips Reinstituted Return CO2 North Phillips’ 160 Apr 24 Energy Chaparral -07 -99.25% EOR Recovery -23,080 Burbank 349 Potential 269 824 instituted incremental Jun-07 140 Polymer Polymer zone Potential increased wells producing, MMBO polyme
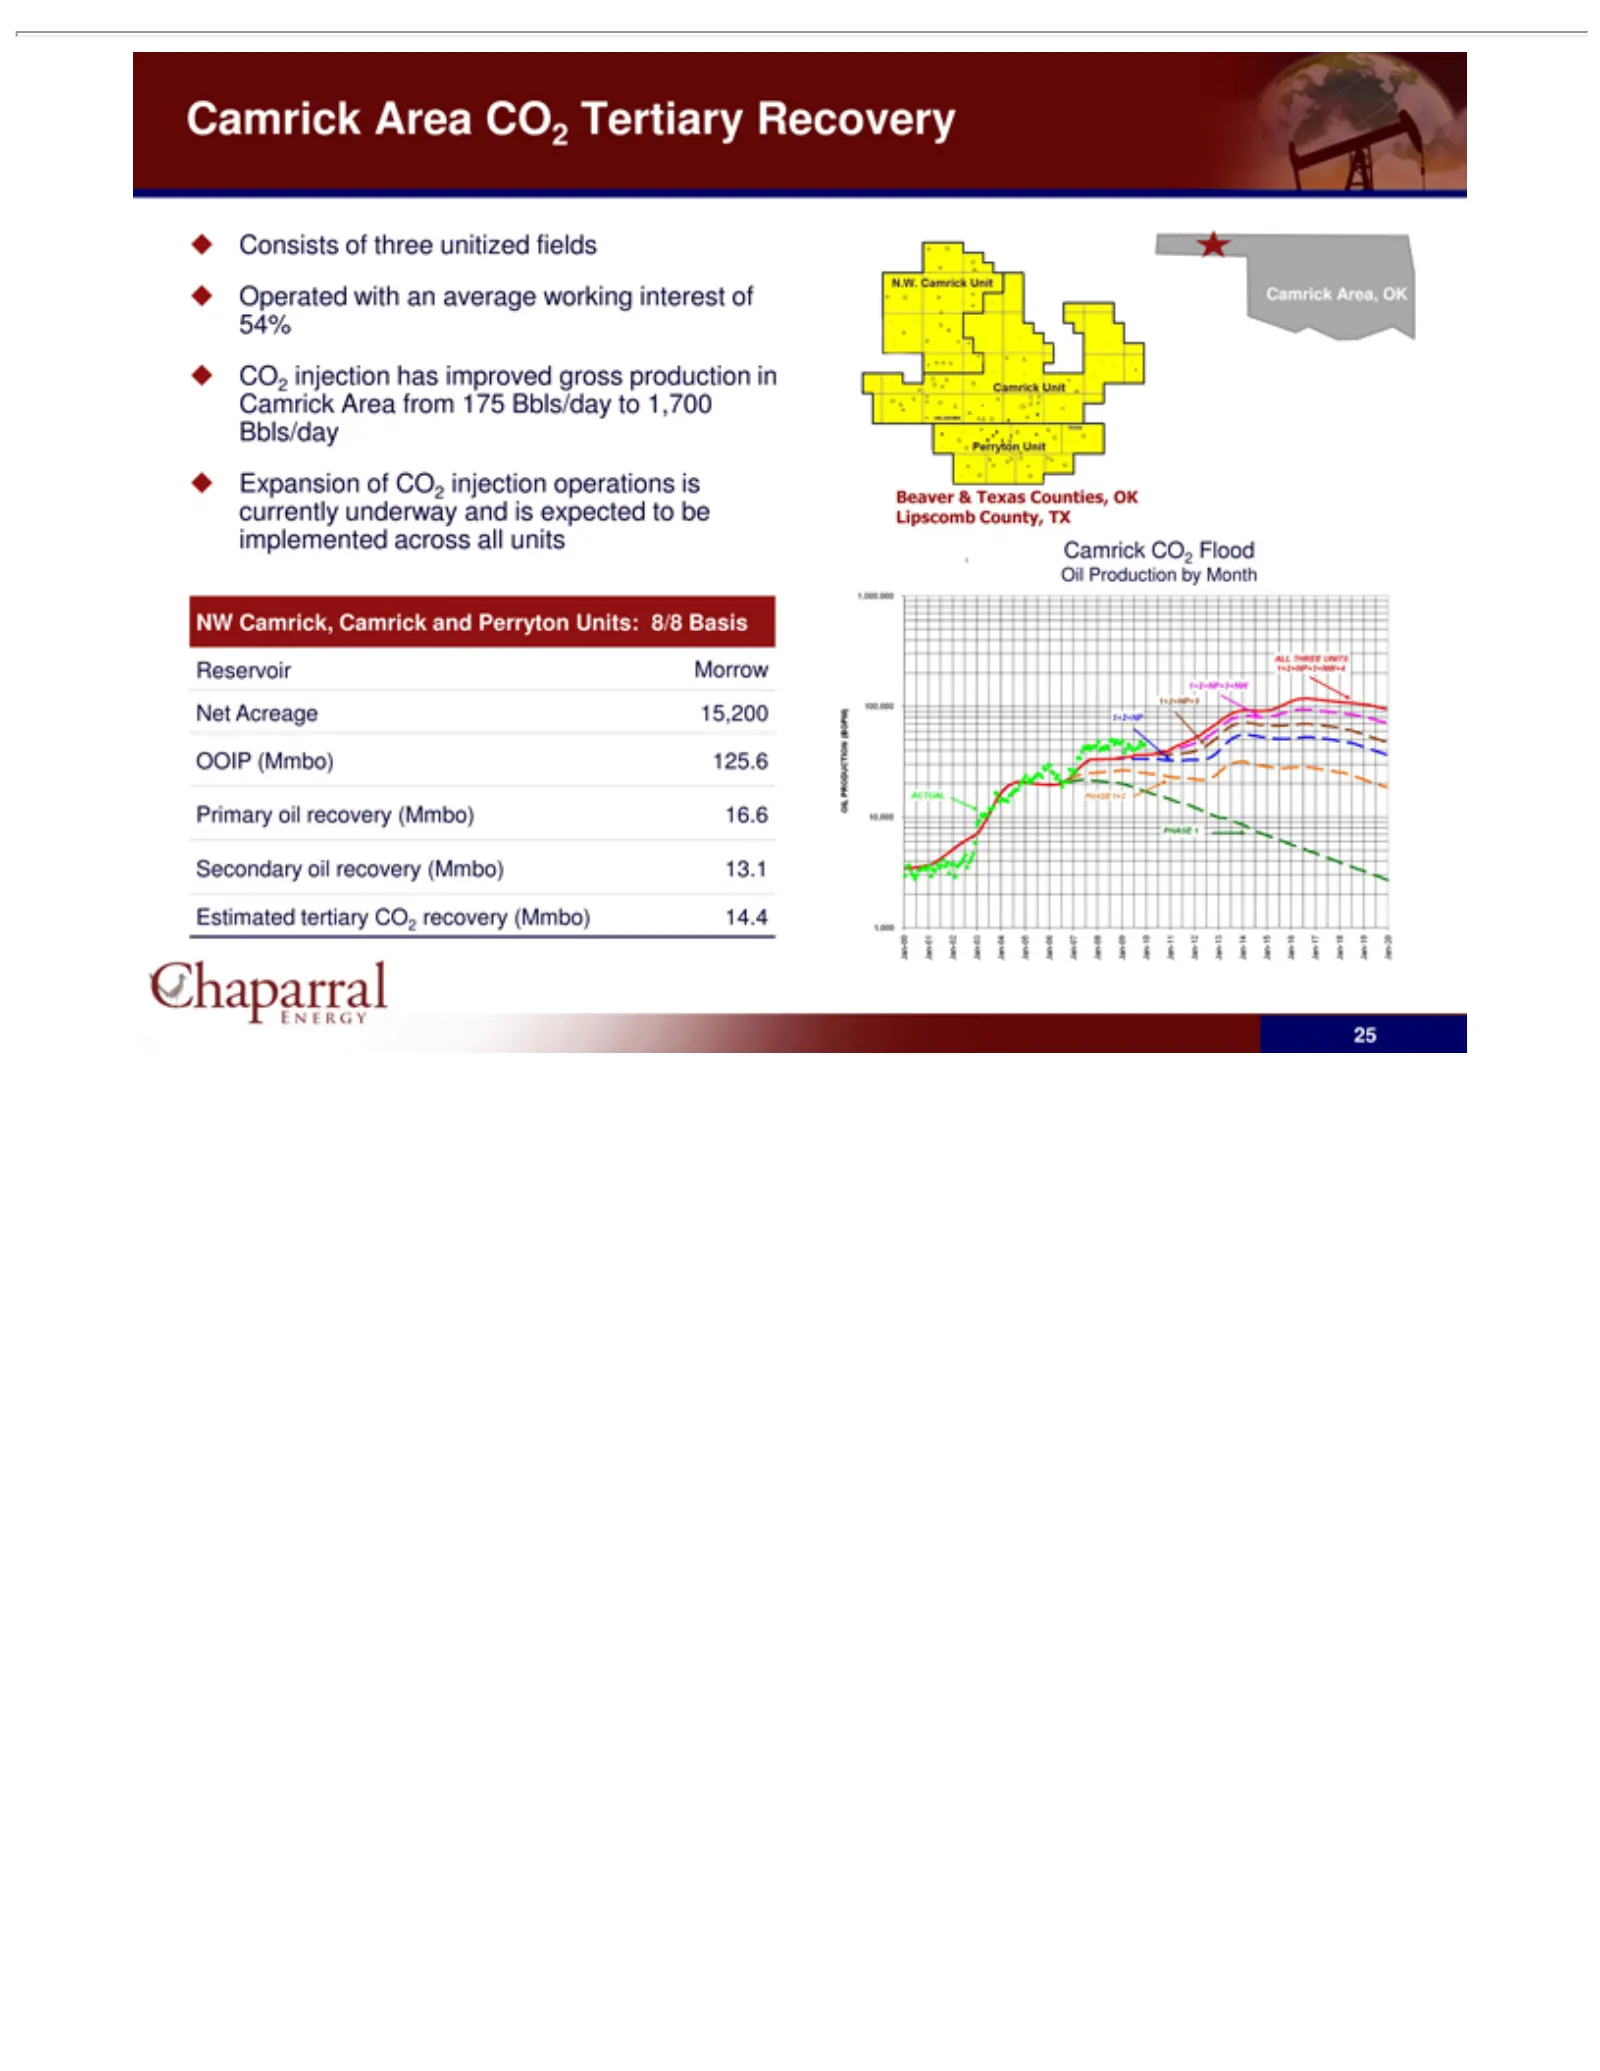
Slide 25: Camrick CO2 Flood
Consists Operated currently NW Reservoir Net OOIP Primary Secondary Estimated Beaver Lipscomb Camrick Oil 25 Production Acreage Camrick, (Mmbo) &oil Area Area, of CO2 underway with Texas Morrow tertiary County, oil three recovery 15,200 recovery CO2 Flood Camrick an OK 125.6 by counties, unitized av
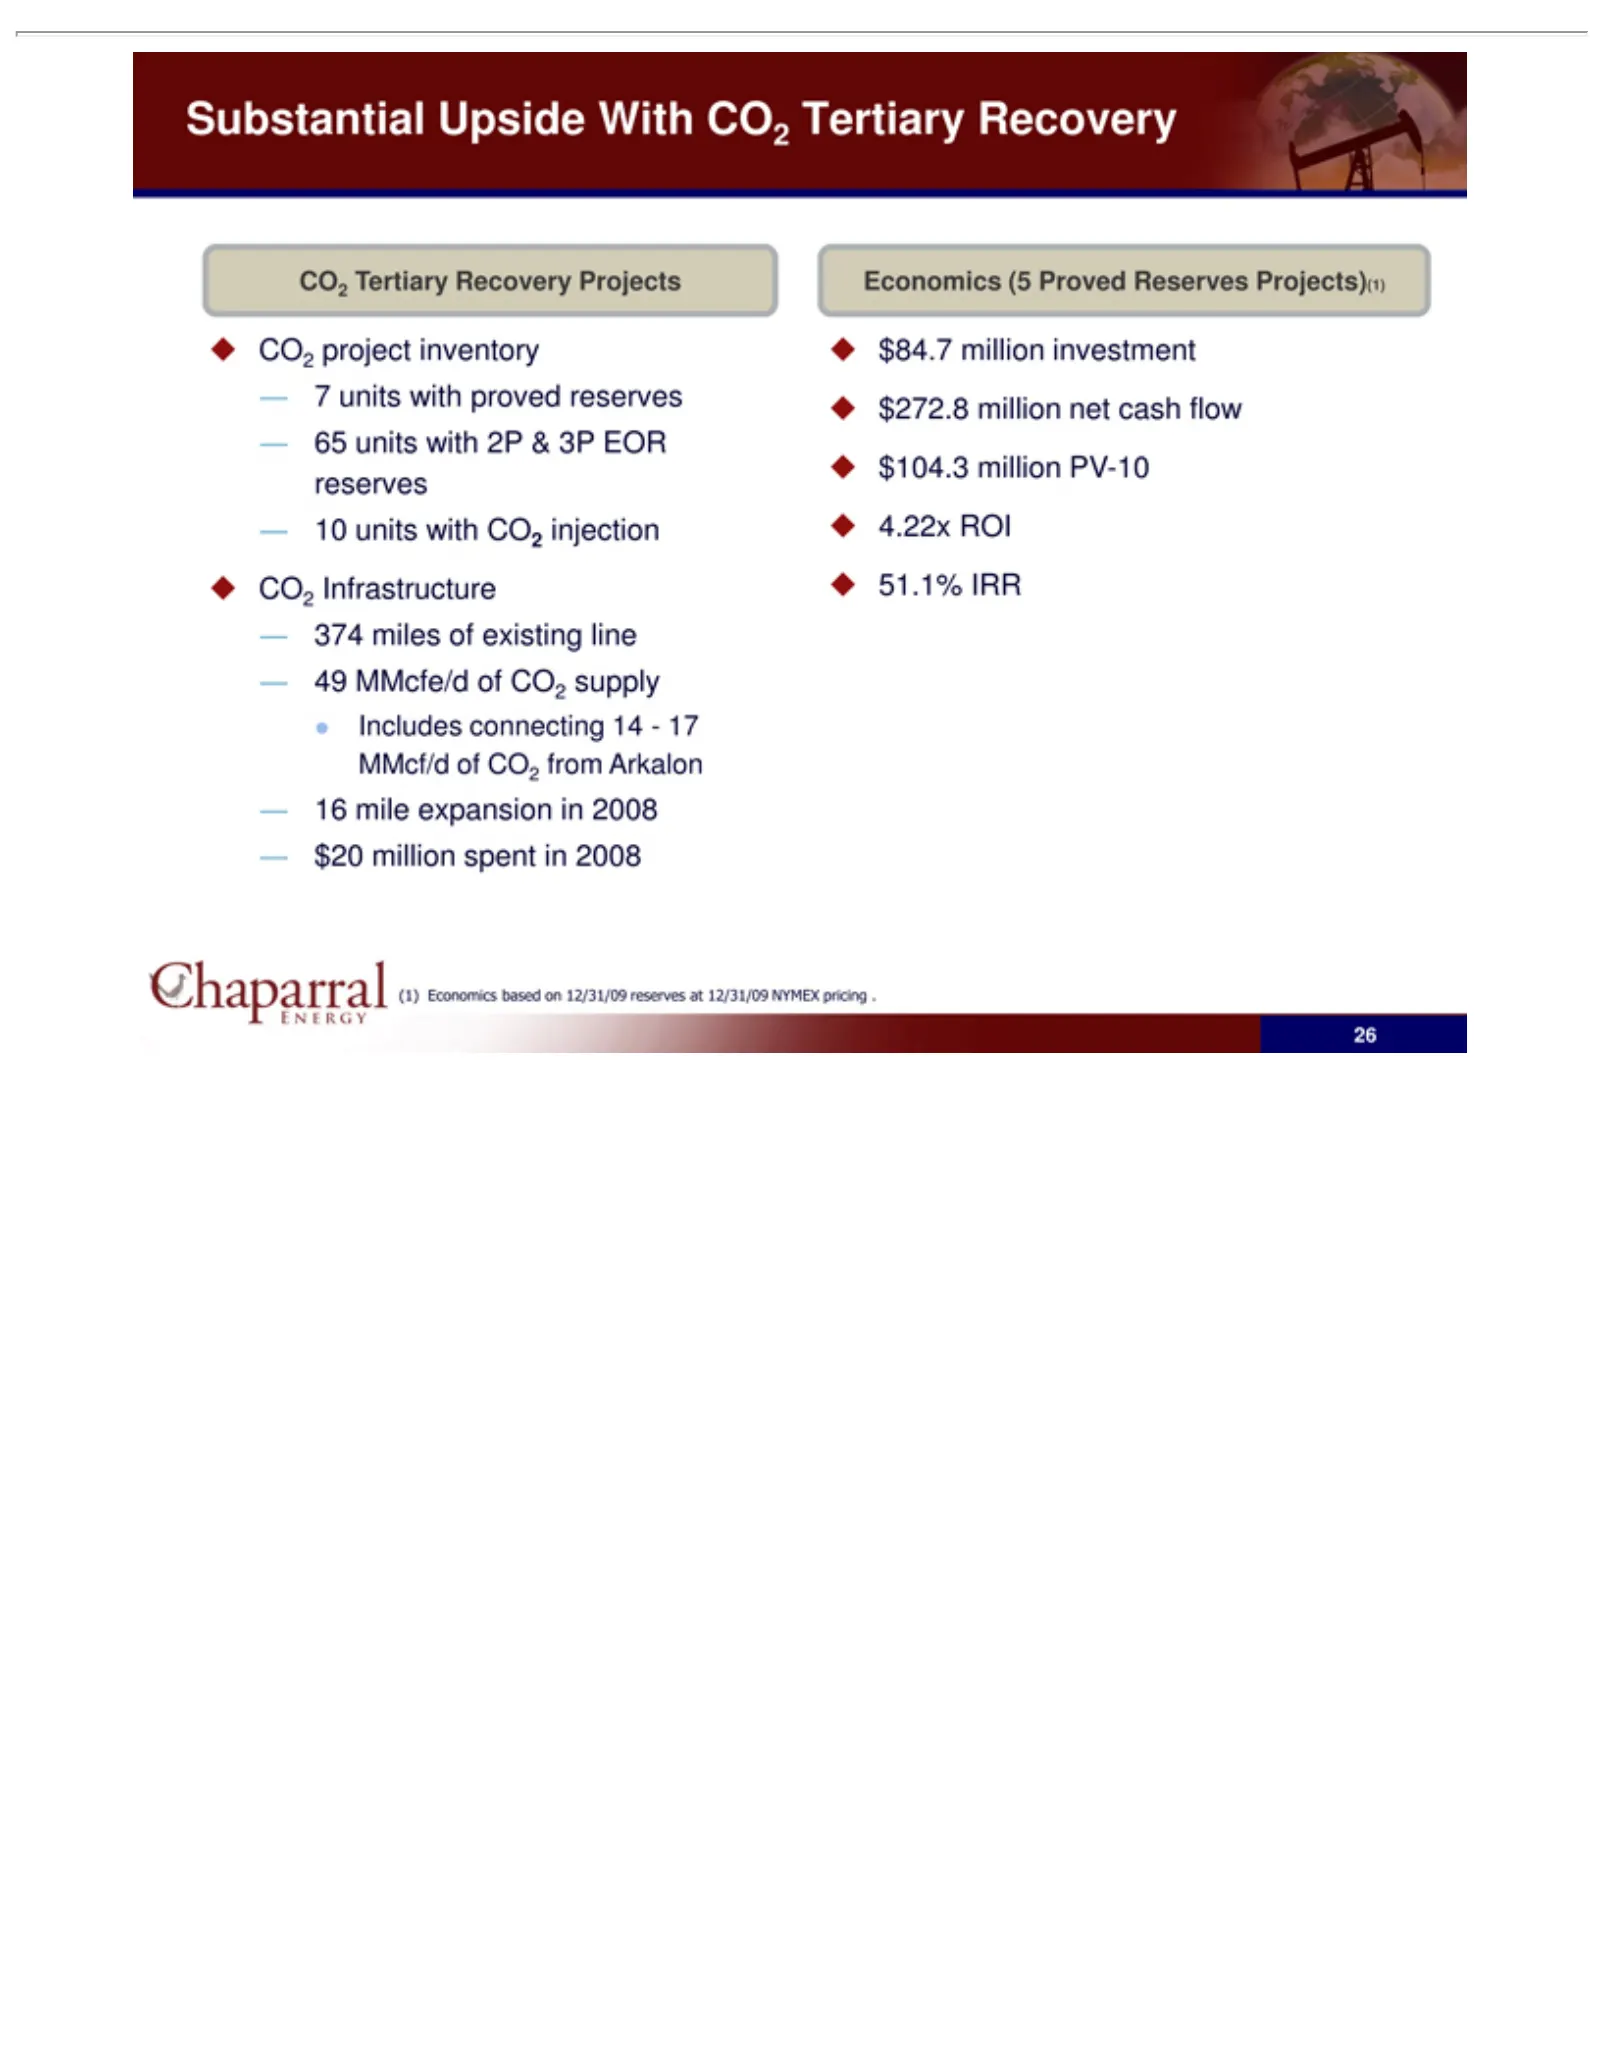
Slide 26: Substantial CO2 EOR Economics
Substantial CO2 Includes _ Economics $84.7 $272.8 $104.3 4.22x 51.1% (1) 267 units 65 10 374 49 16 $20units MMcfe/d mile Tertiary project Infrastructure miles million ROI IRR million Economics connecting with expansion with (5 Upside of inventory Recovery spent investment proved Proved existing of n
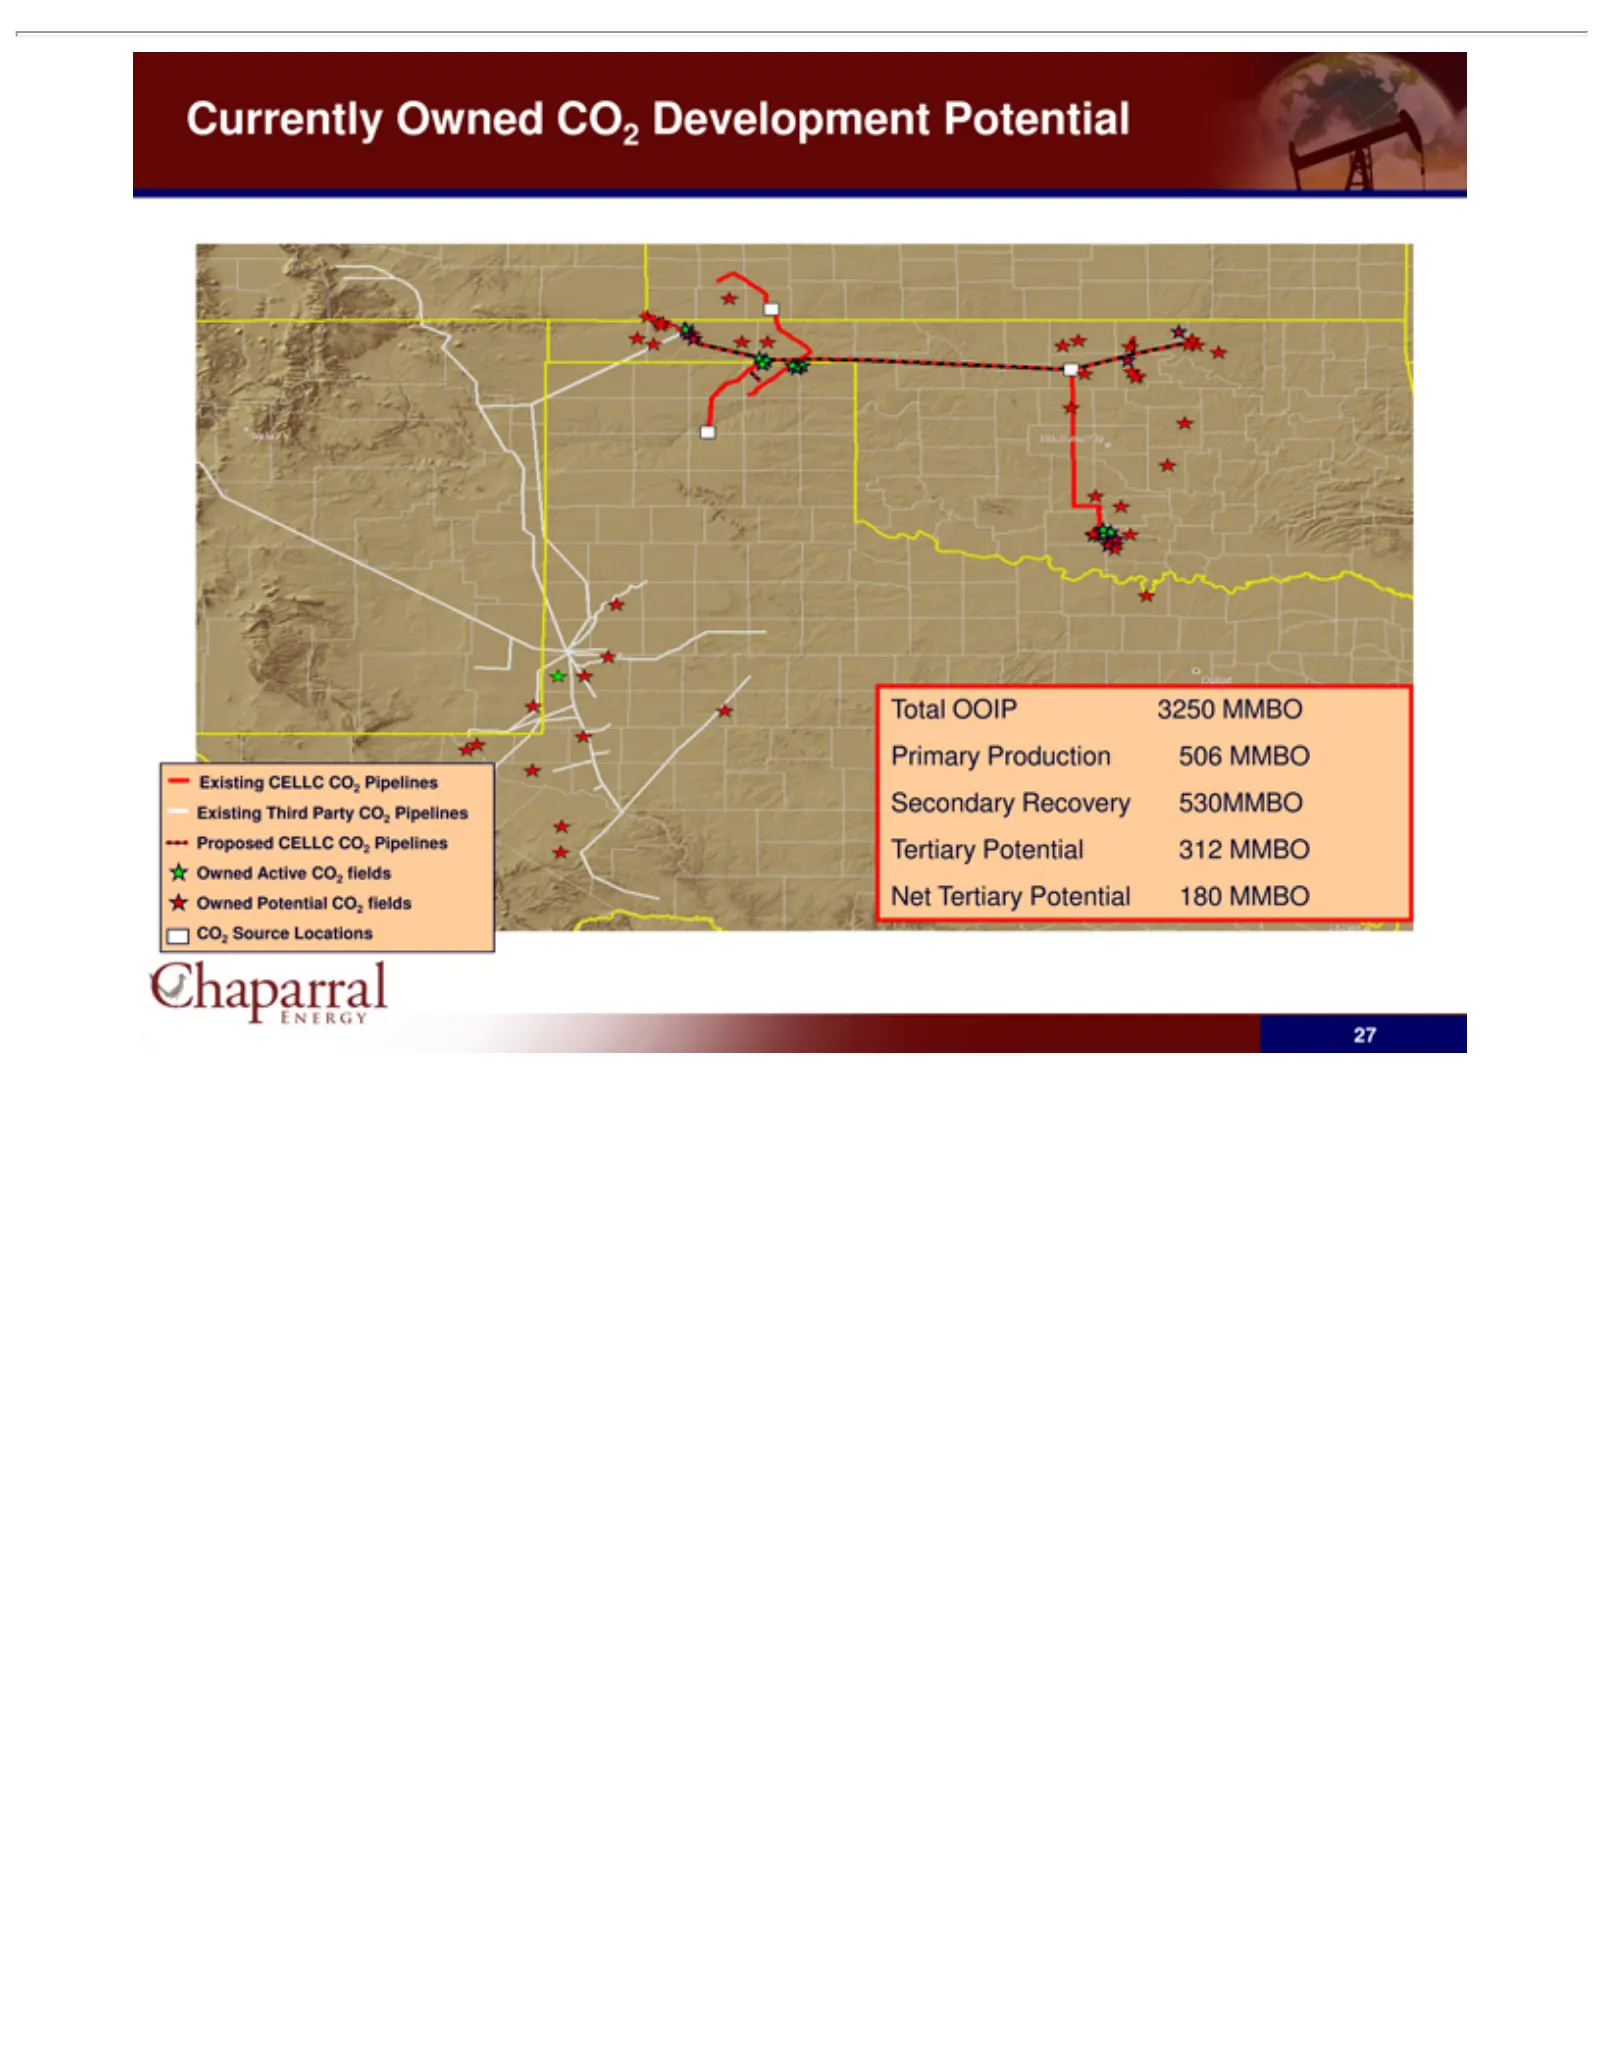
Slide 27: CO2 Pipelines and Potential Fields
Currently Existing Total Primary Secondary Tertiary Net 27 Tertiary OOIP Potential Production CELLC Owned Recovery 3250 Potential CO2 MMBO 312 CO2 506 530MMBO 180 MMBO Pipelines Development MMBO MMBO Existing Potential Third Party CO2 Pipelines Proposed CELLC CO2 Pipelines Owned Active CO2 fields Ow
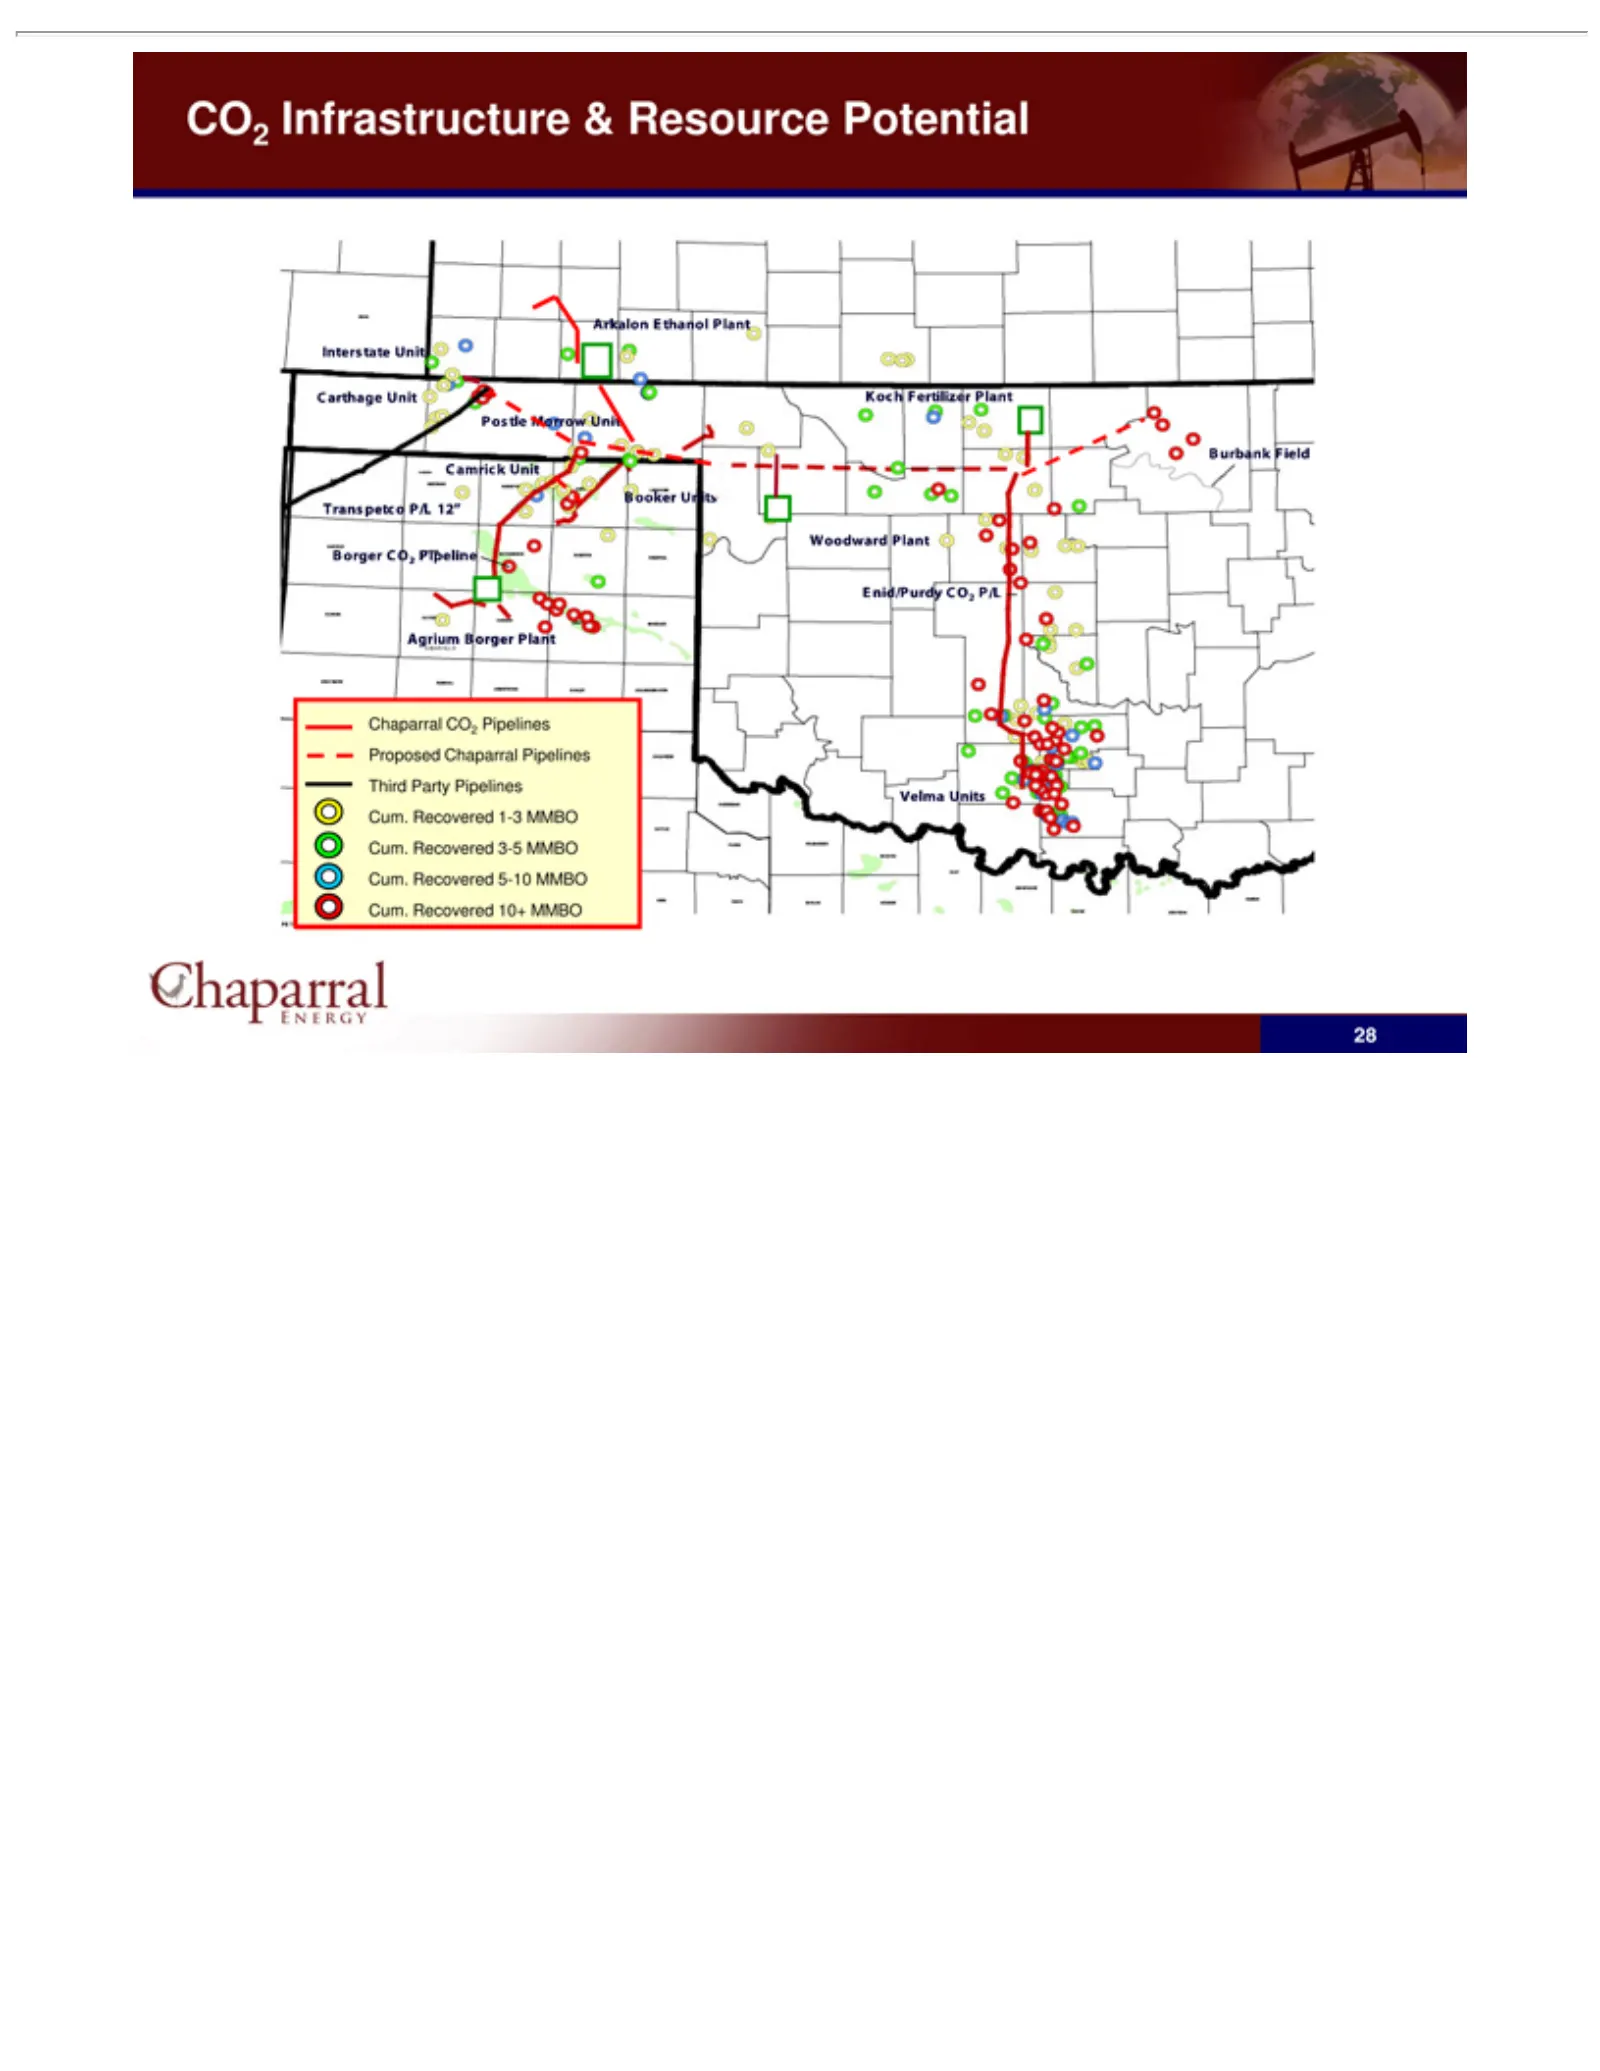
Slide 28: CO2 Infrastructure and Resource Potential
CO2 Infrastructure Chaparral 28 CO2 Pipelines & Resource Proposed Potential Chaparral Pipelines Third Party Pipelines Cum. Recovered 1-3 MMBO Cum. Recovered 3-5 MMBO Cum. Recovered 5-10 MMBO Cum. Recovered 10+ MMBO
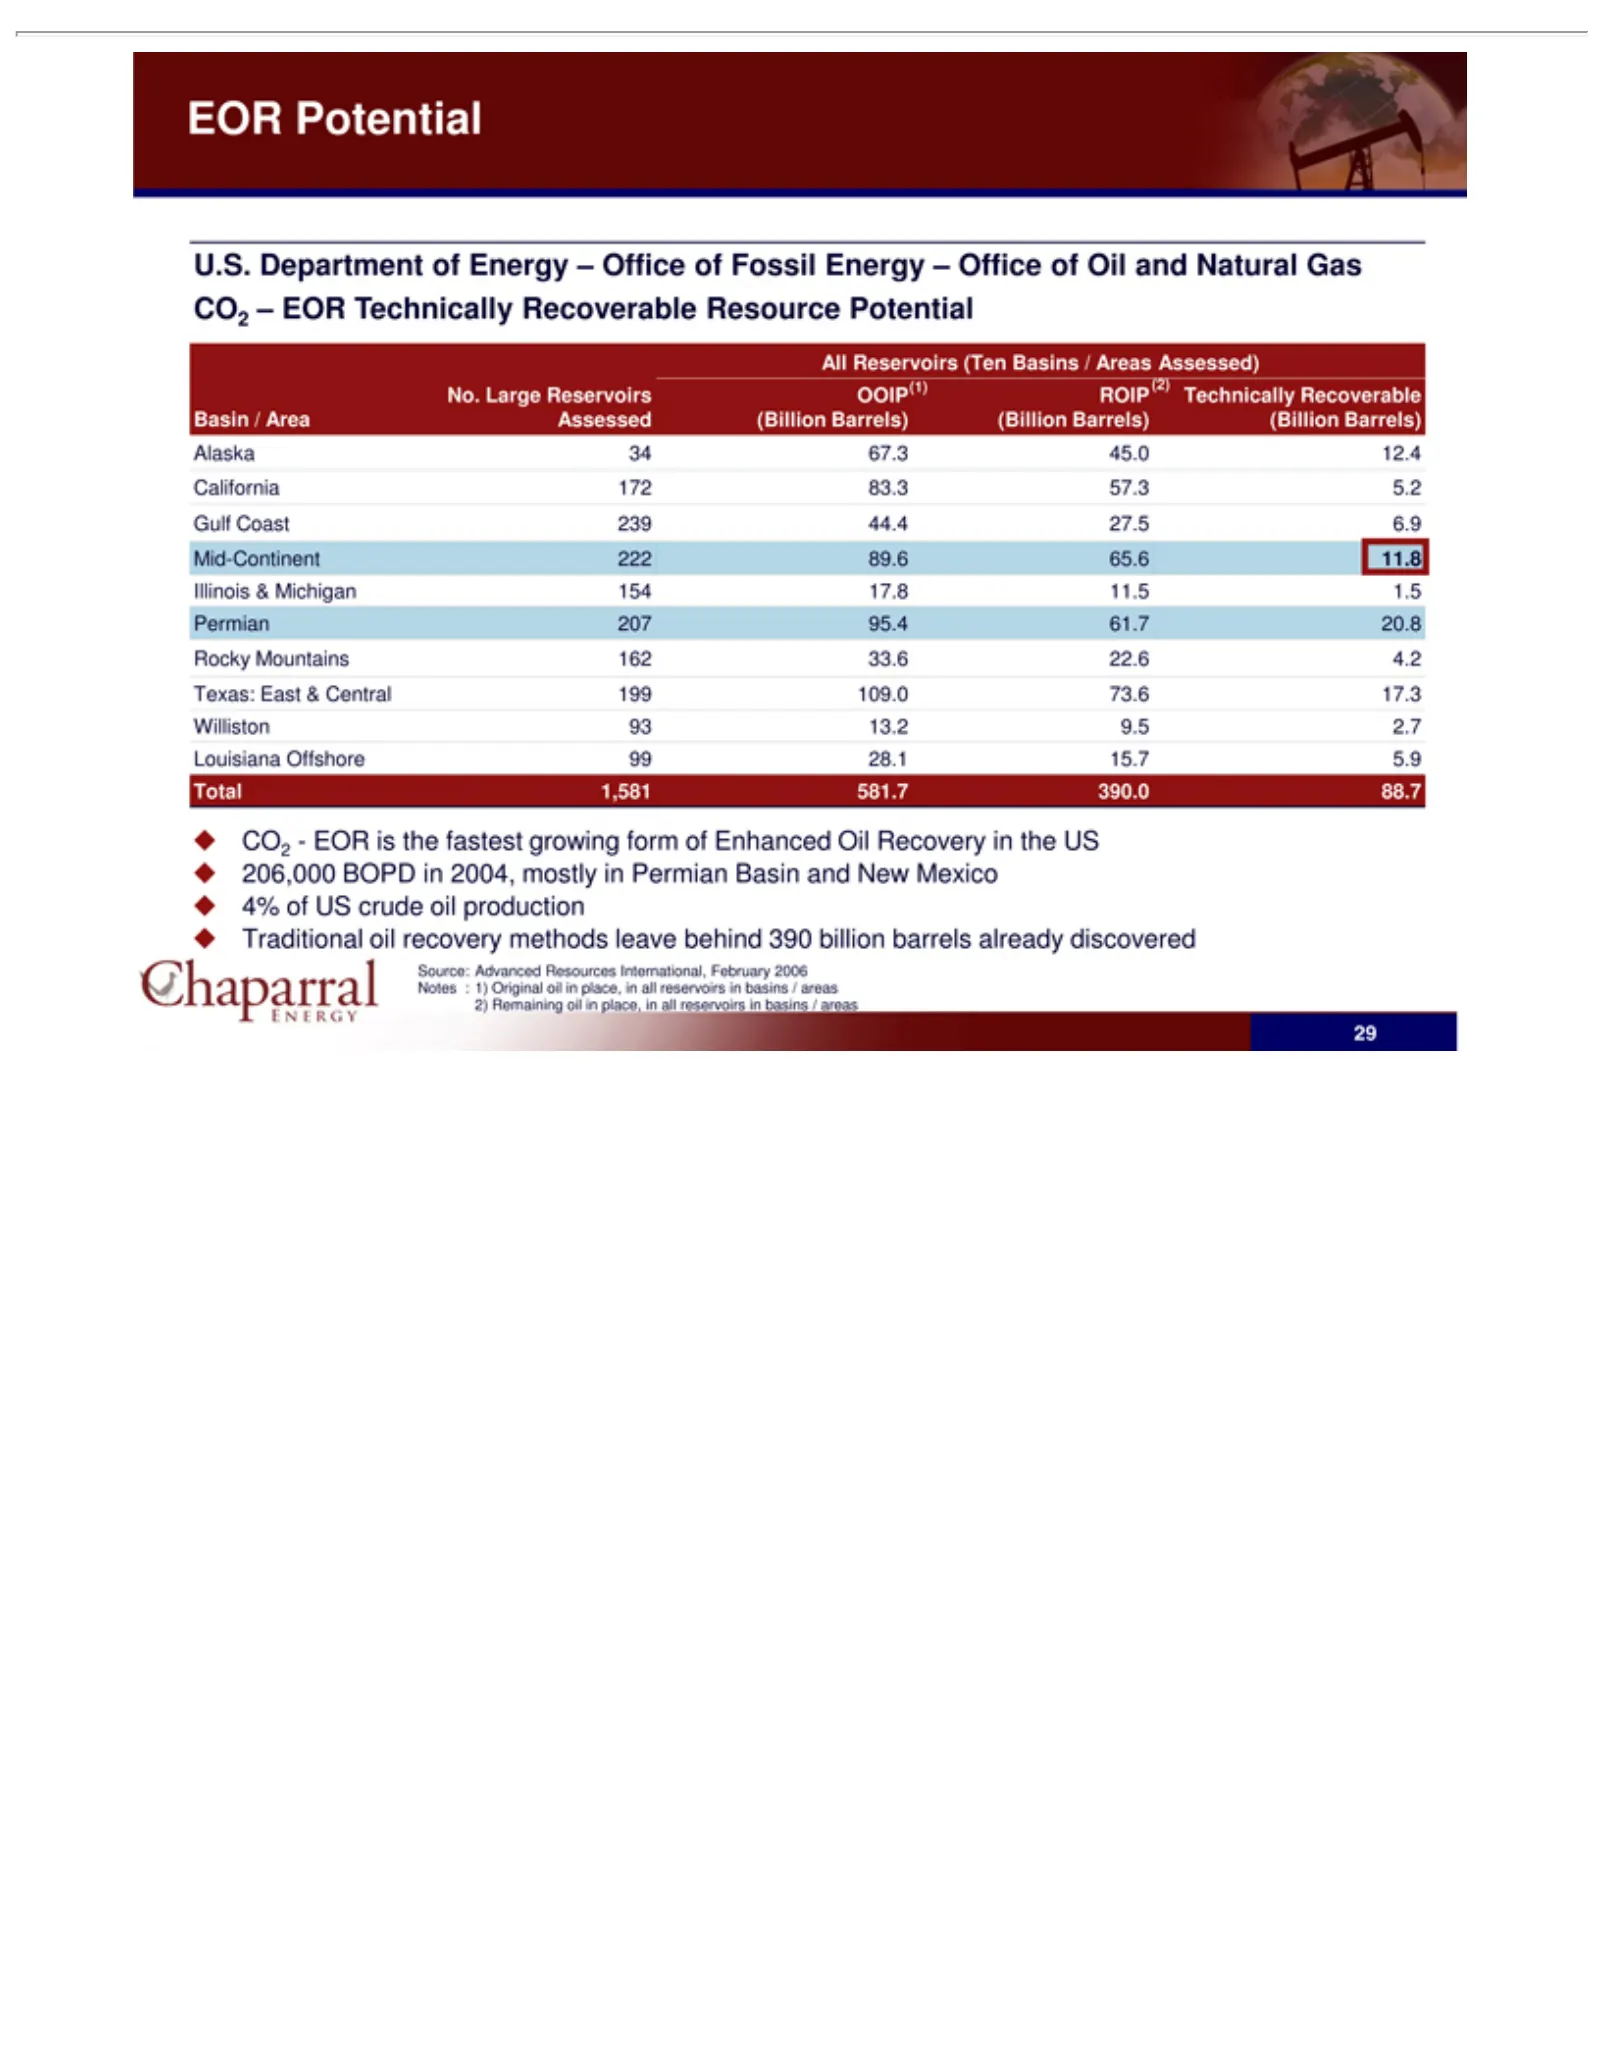
Slide 29: U.S. CO2-EOR Potential
EOR U.S. All No. Basin Alaska California Gulf Mid-Continent Illinois Permian Rocky Texas: Williston Louisiana Total CO2-EOR Traditional Source: 2) 29 Remaining Reservoirs Large Department Coast Potential 1,581 / East Mountains Area 34 &Advanced 207 93 Michigan Offshore 67.3 Reservoirs 172 is 239 oil
Slide 30: Financial Overview
Financial Overview Chaparral
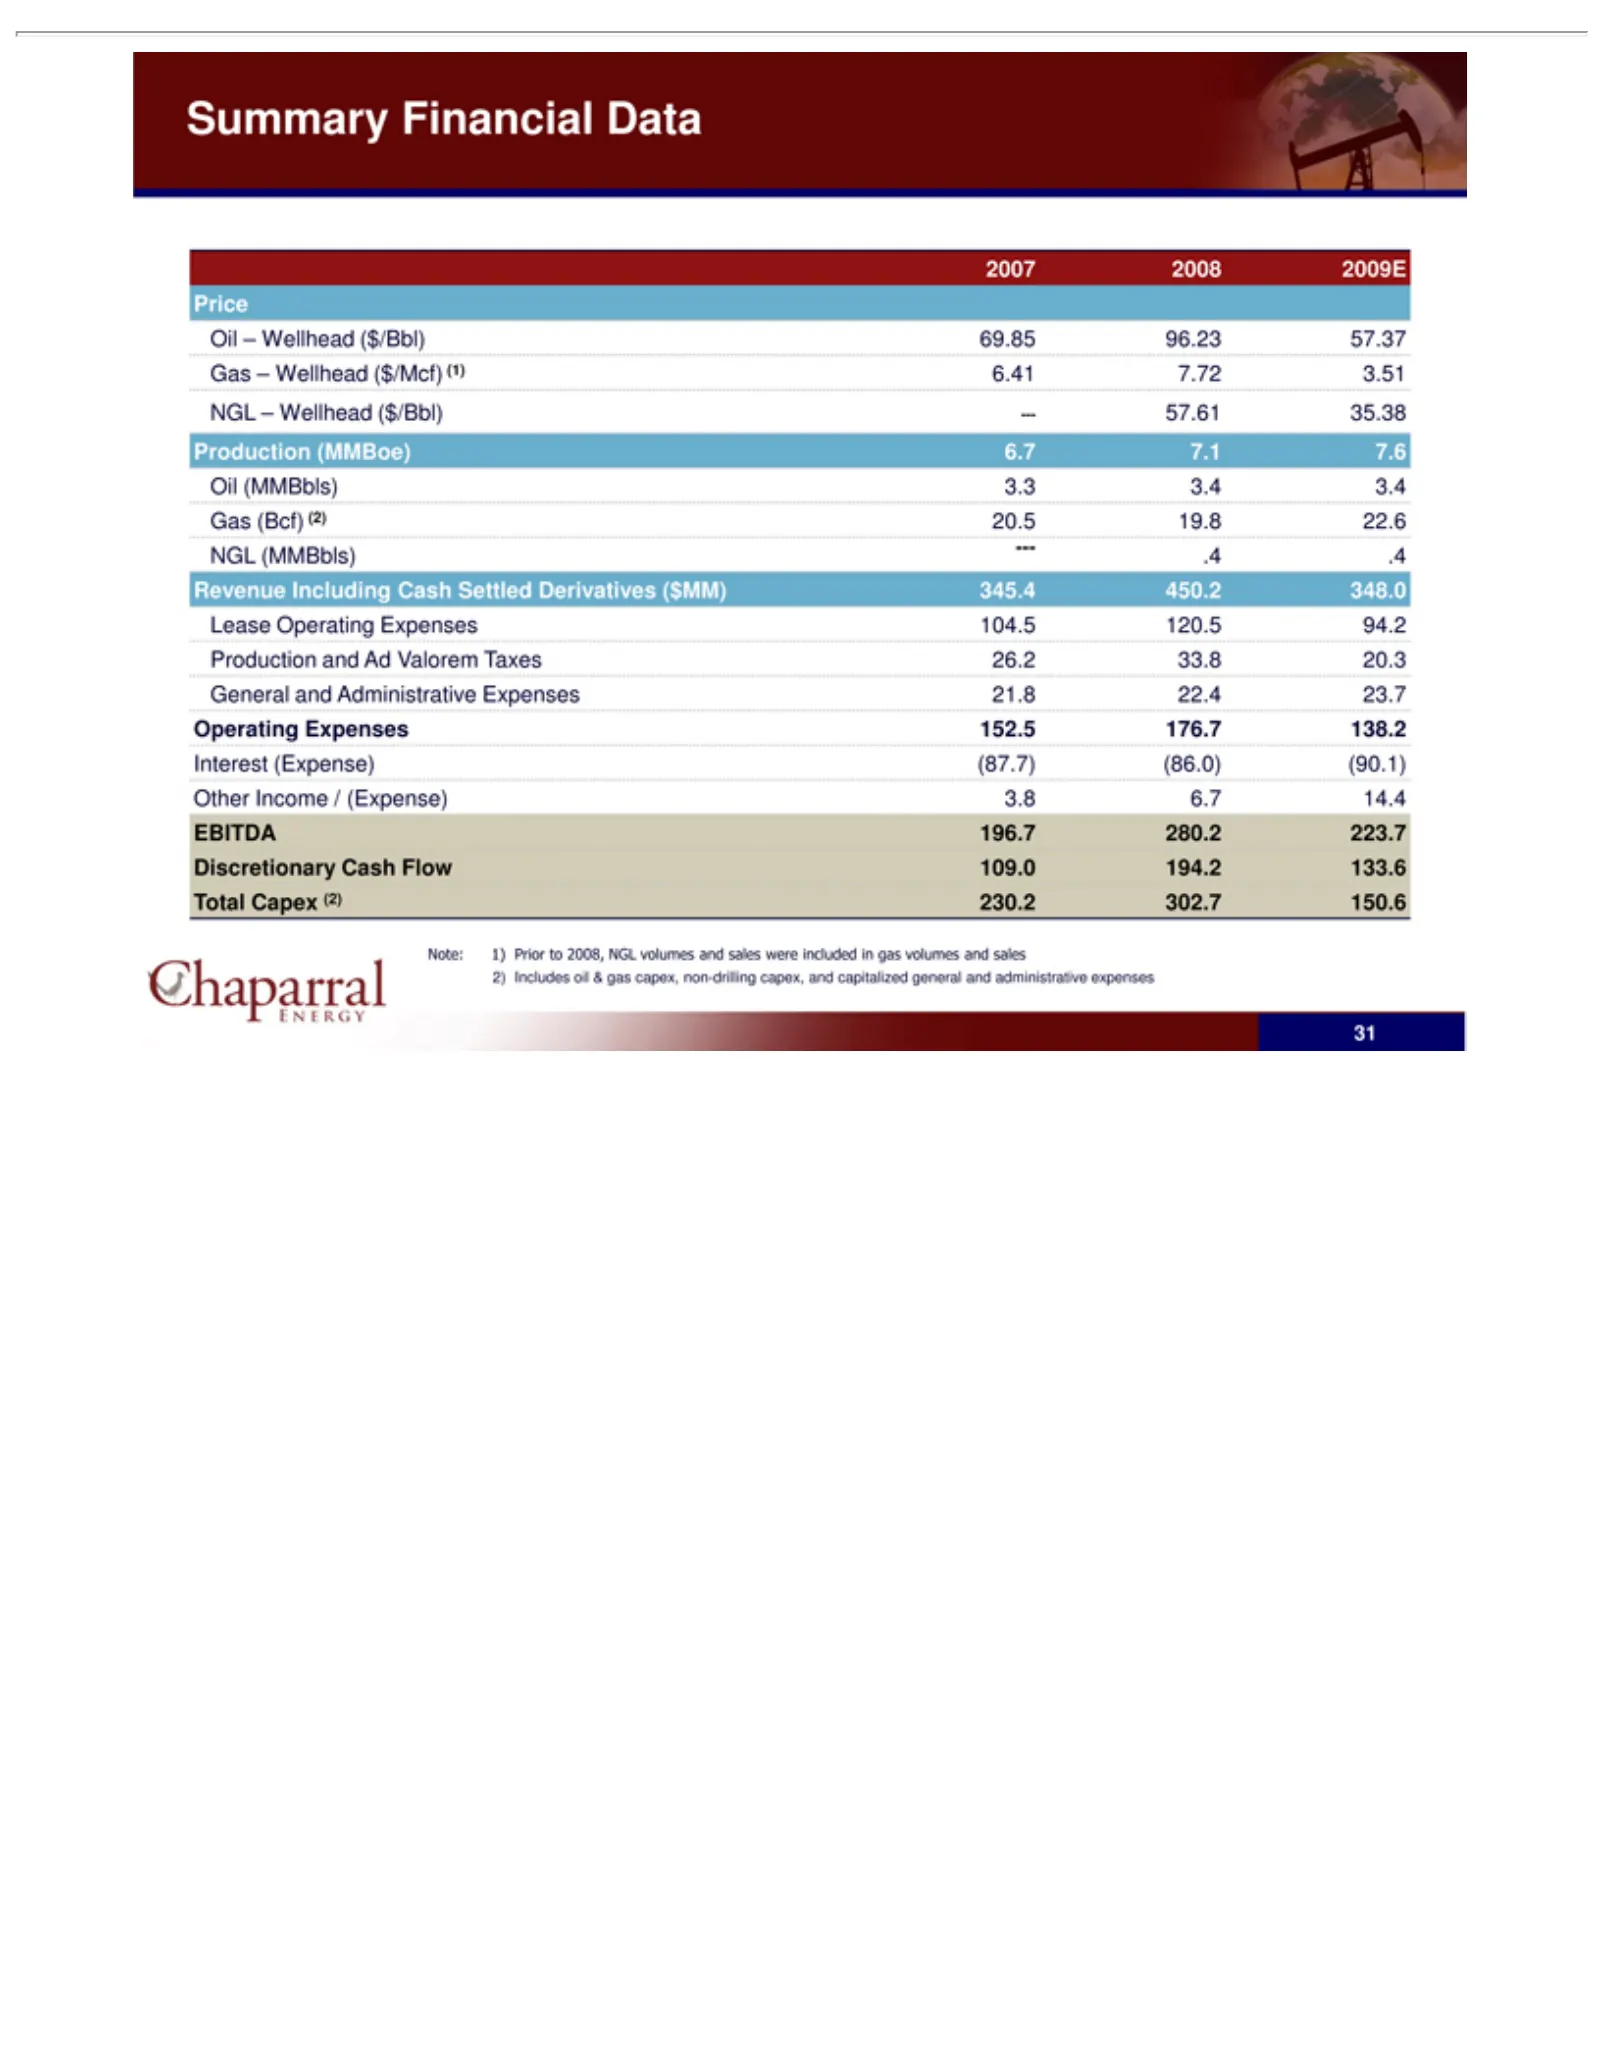
Slide 31: Summary Financial Data
Summary 2007 Price Oil Gas NGL Revenue Lease Production General Operating Interest Other EBITDA Discretionary Total Note: 2) 31 Includes –(Bcf) (MMBbls) –2008 Wellhead –Capex (MMBbls) 1) Income Wellhead Operating Wellhead (Expense) and Prior Including 196.7 Financial (2) Expenses 2009E (MMBoe) and o
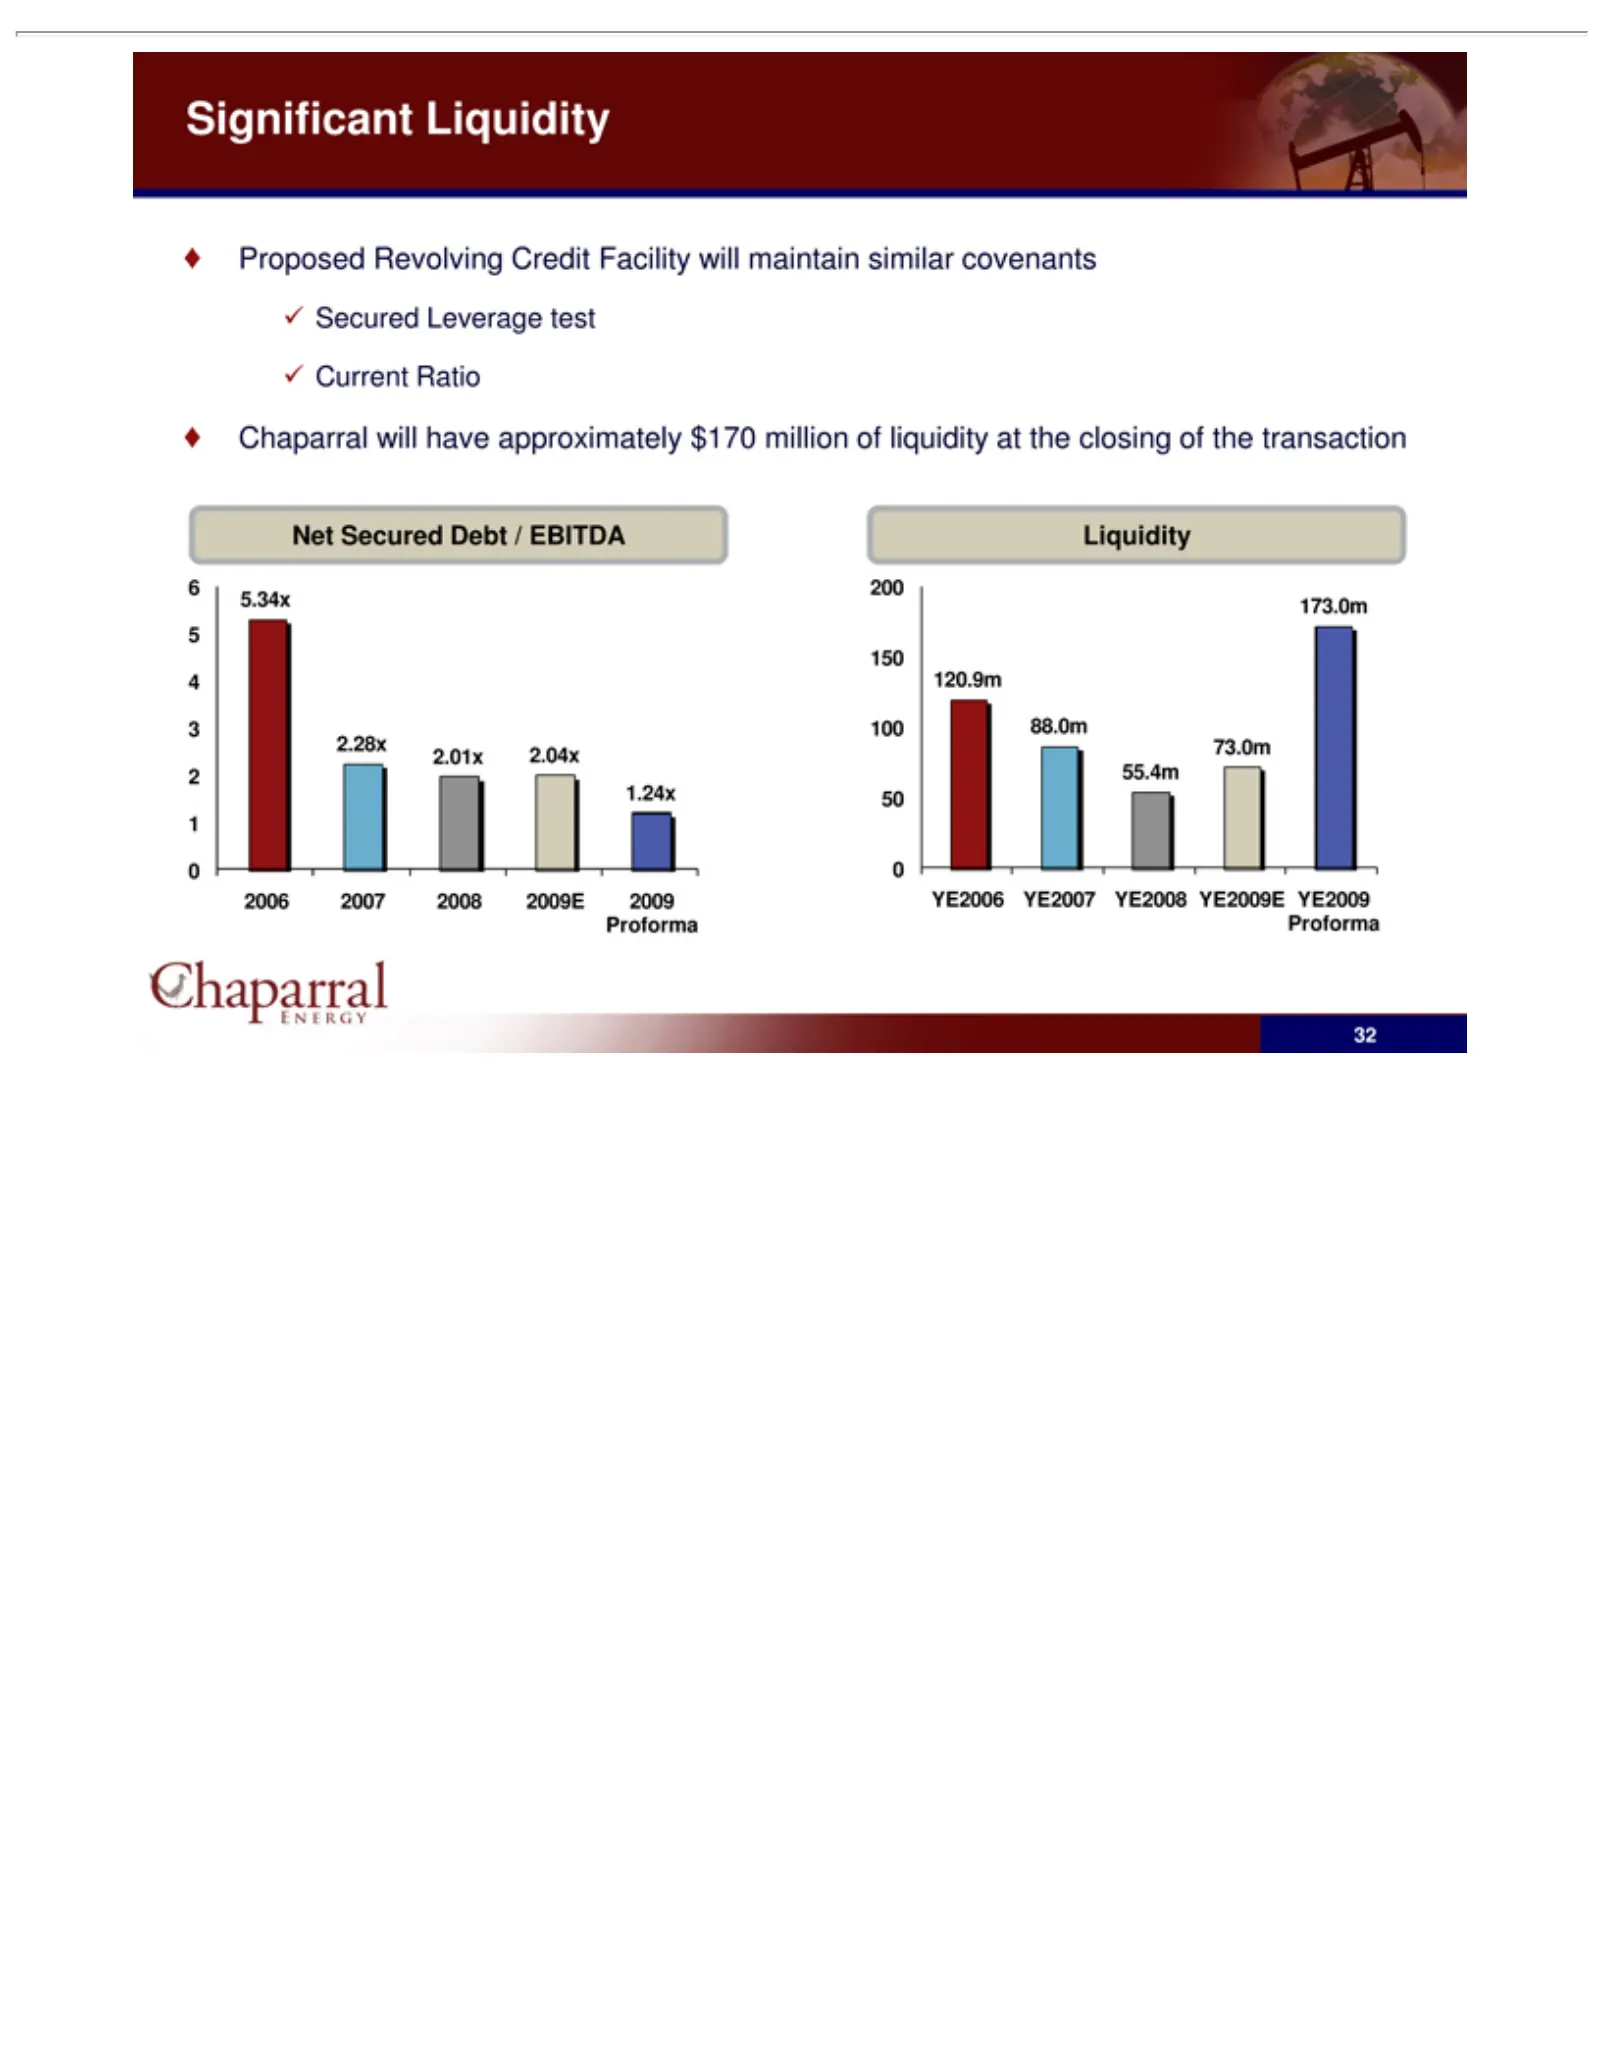
Slide 32: Significant Net Leverage and Liquidity Profile
Significant _ Net 6 3 32 Proposed Secured Current Chaparral 5.34x 4 2.01x 2.28x 1.24x 2 100 Secured 120.9m 150 173.0m 200 73.0m Y 0 006 E2006 Ratio Leverage Liquidity Revolving will 2Debthave 550YE2007 Liquidity 55.4m88.0m 2007 12.04x2008 / EBITDA test 2009Eapproximately Credit YE2008 2009 FacilityY
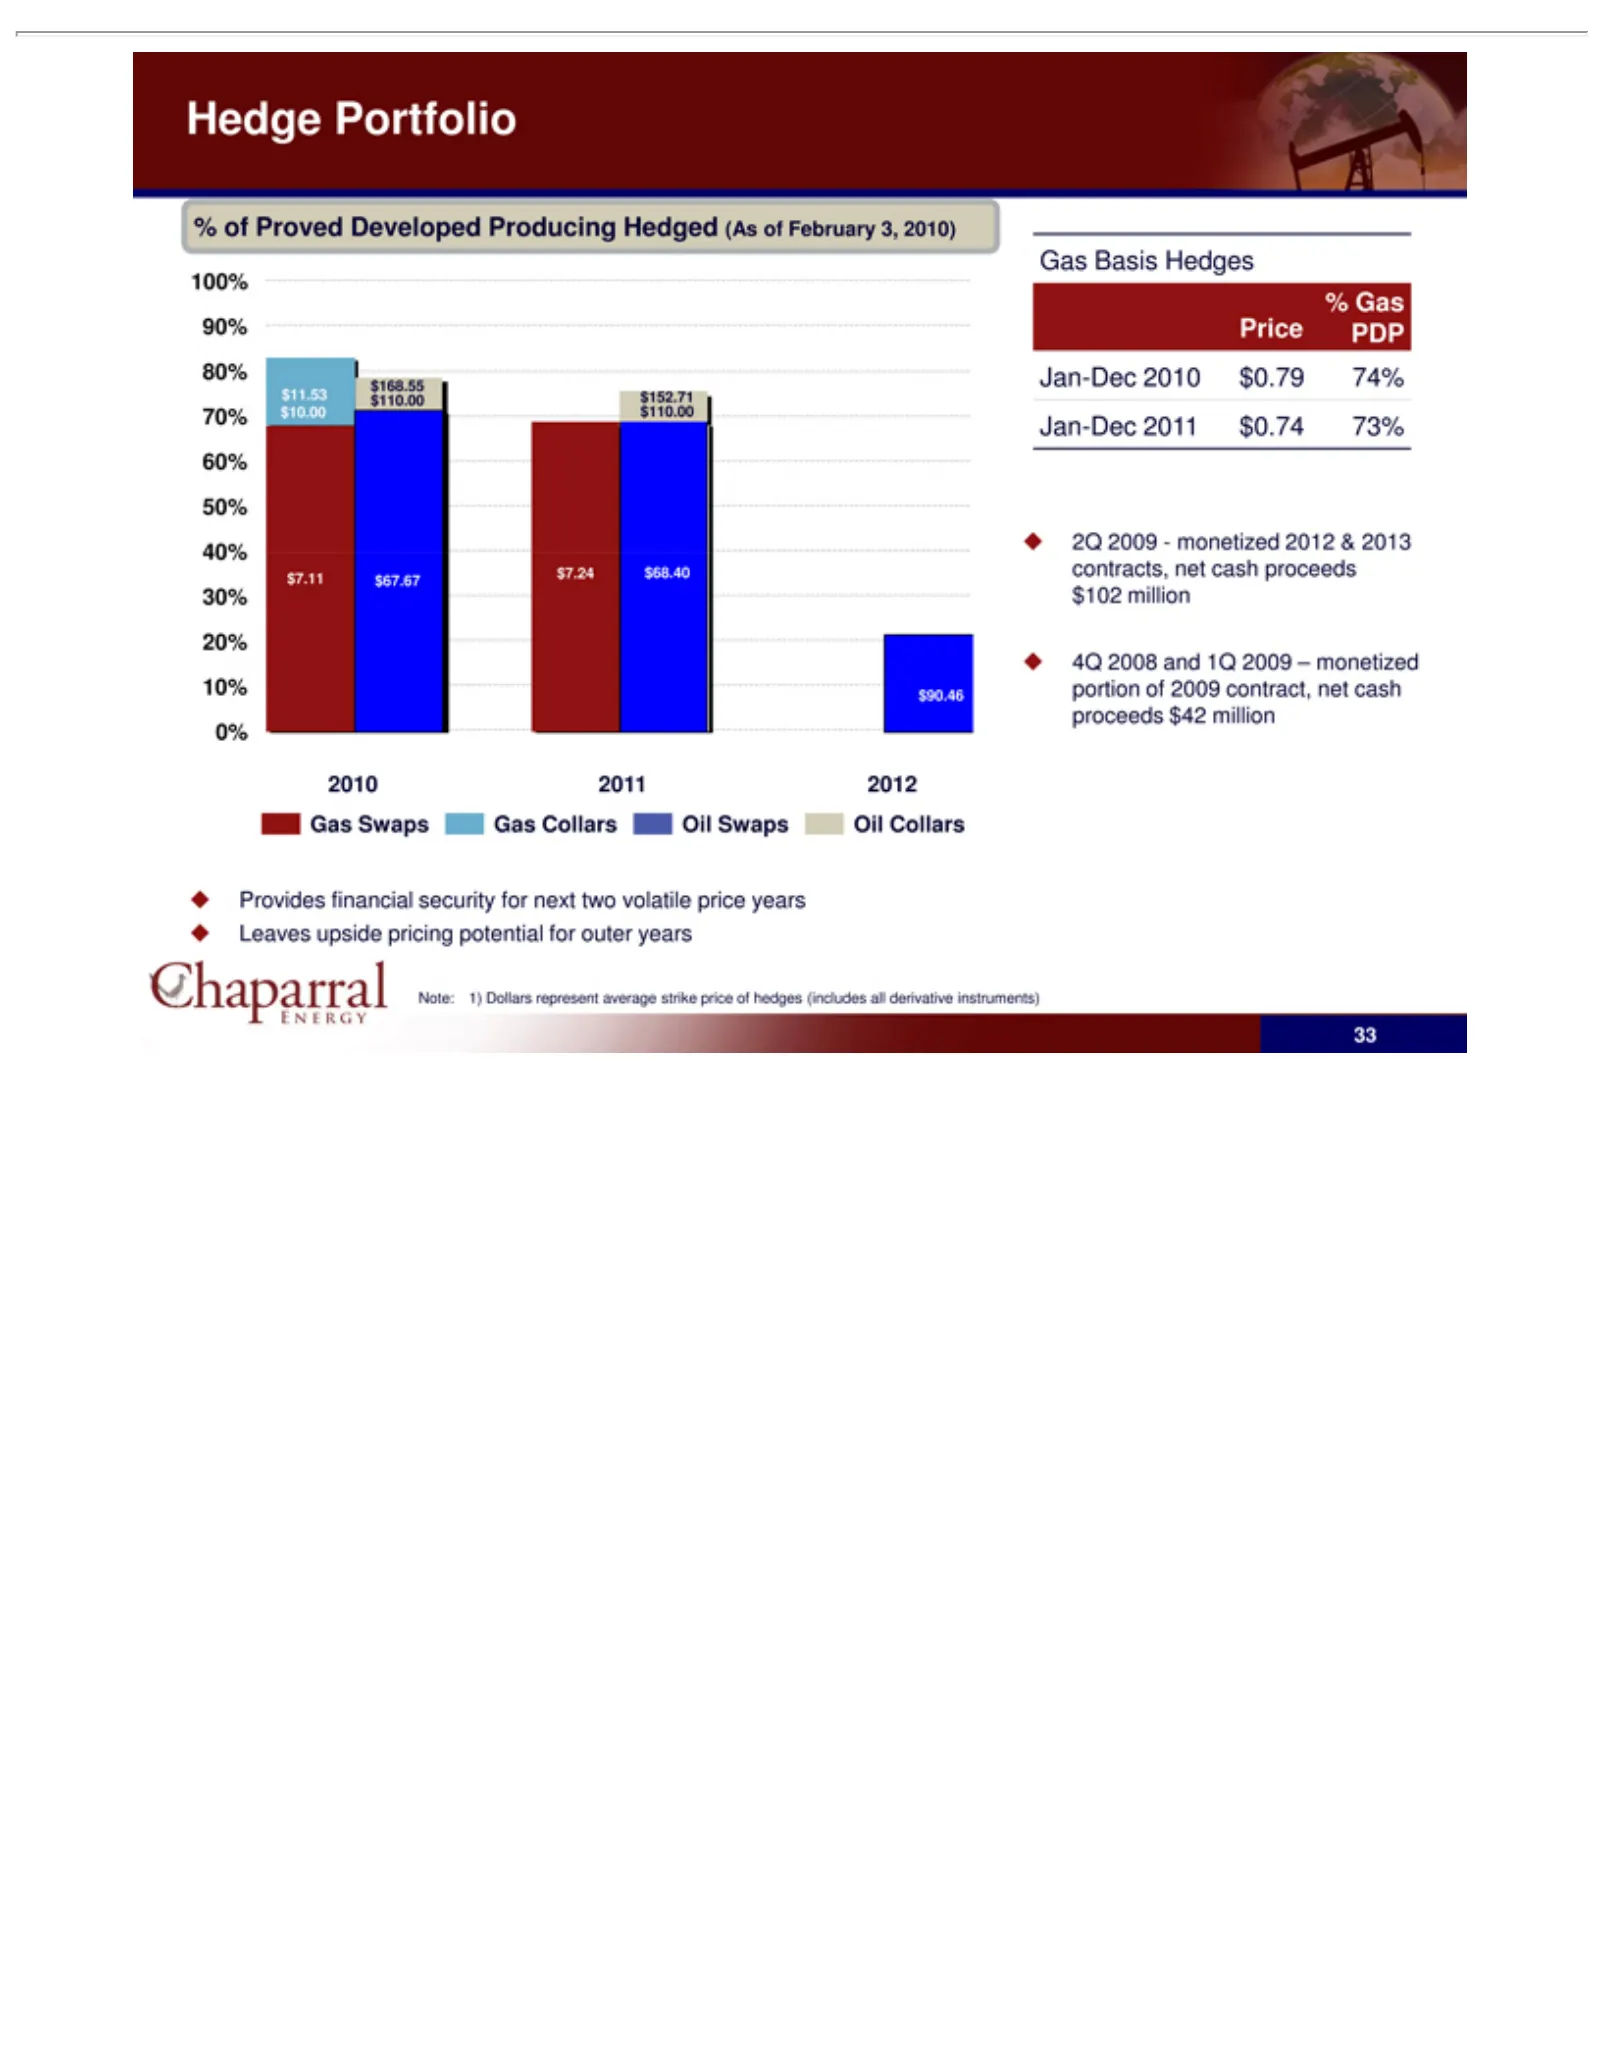
Slide 33: Hedge Portfolio
Hedge $11.53 $168.55 80% 90% 100% 70% $7.11 40% 50% 60% 10% 20% 30% 2010 0% Gas % Price Jan-Dec 2Q 4Q Provides Note: 33 of2008 Gas 2009-monetized Swaps Basis $10.00 $90.46 Proved 2011 PDP $67.67 1)Portfolio $110.00 2010 2011 Dollars and financial Hedges 2012 Gas $110.00 Developed 1Q $7.24 $0.74 $0.7
Slide 34: Appendix
Appendix Chaparral
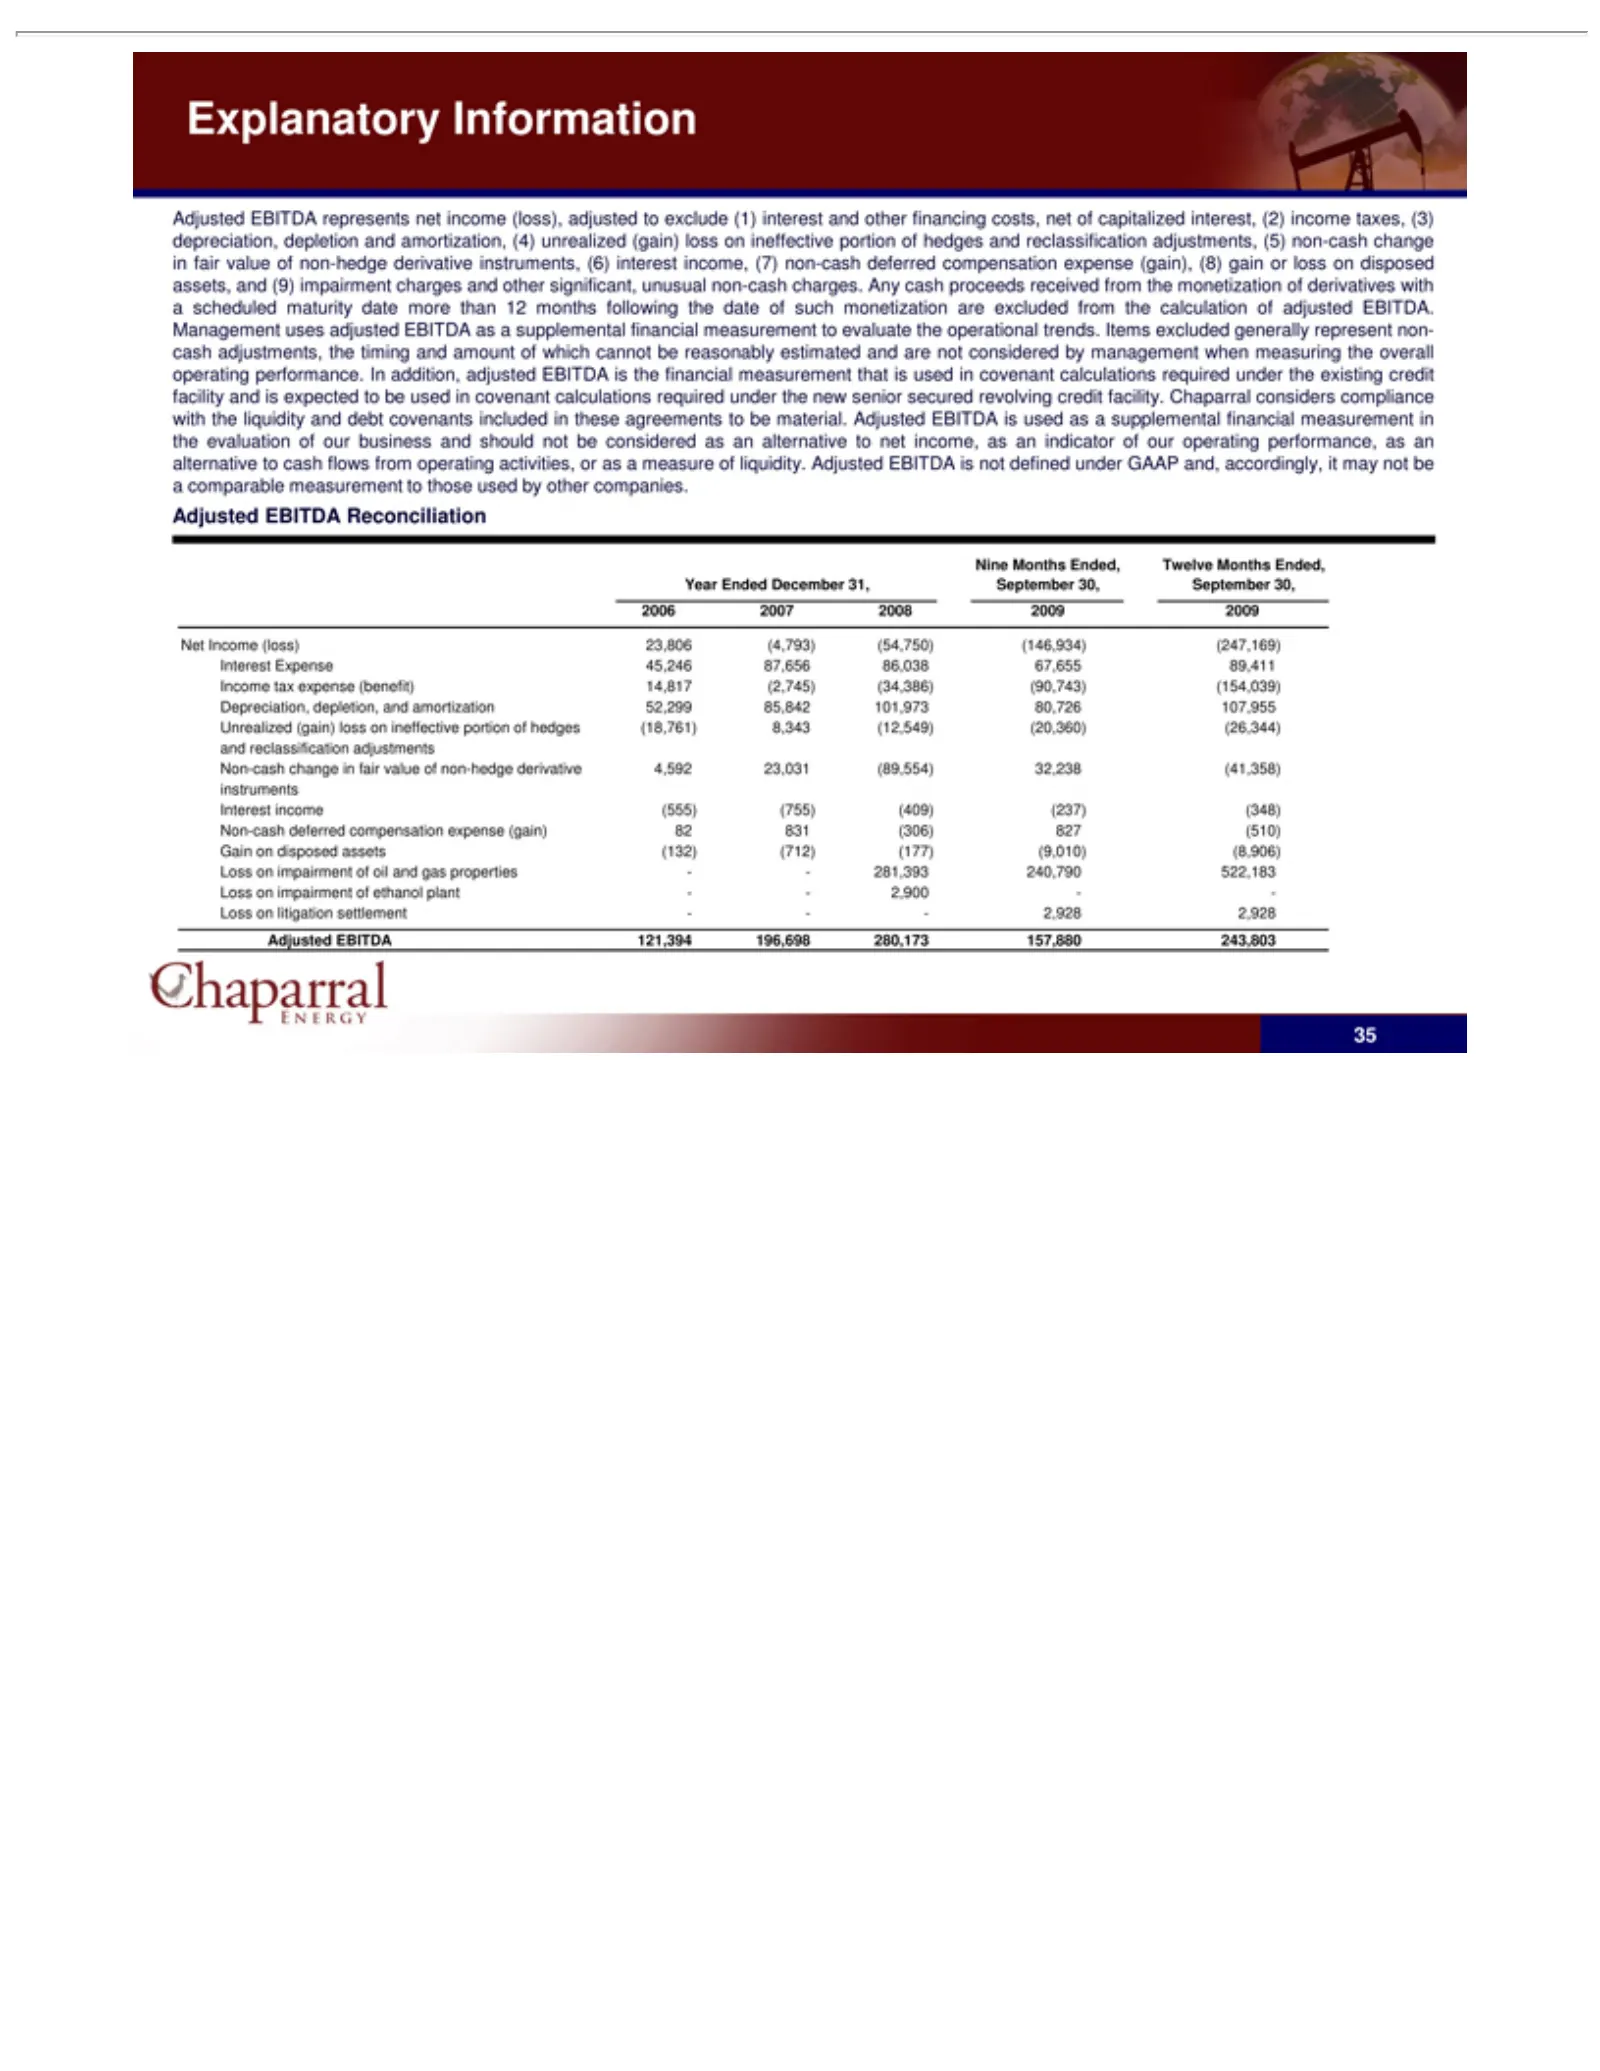
Slide 35: Adjusted EBITDA Reconciliation
Explanatory (4) deferred monetization adjusted reasonably calculations compliance should EBITDA Nine Year 2006 Net Income Depreciation, Unrealized and Interest instruments Non-cash Gain Loss Adjusted 35 unrealized Income reclassification Ended on Months 2007 not Expense tax income impairment litigat
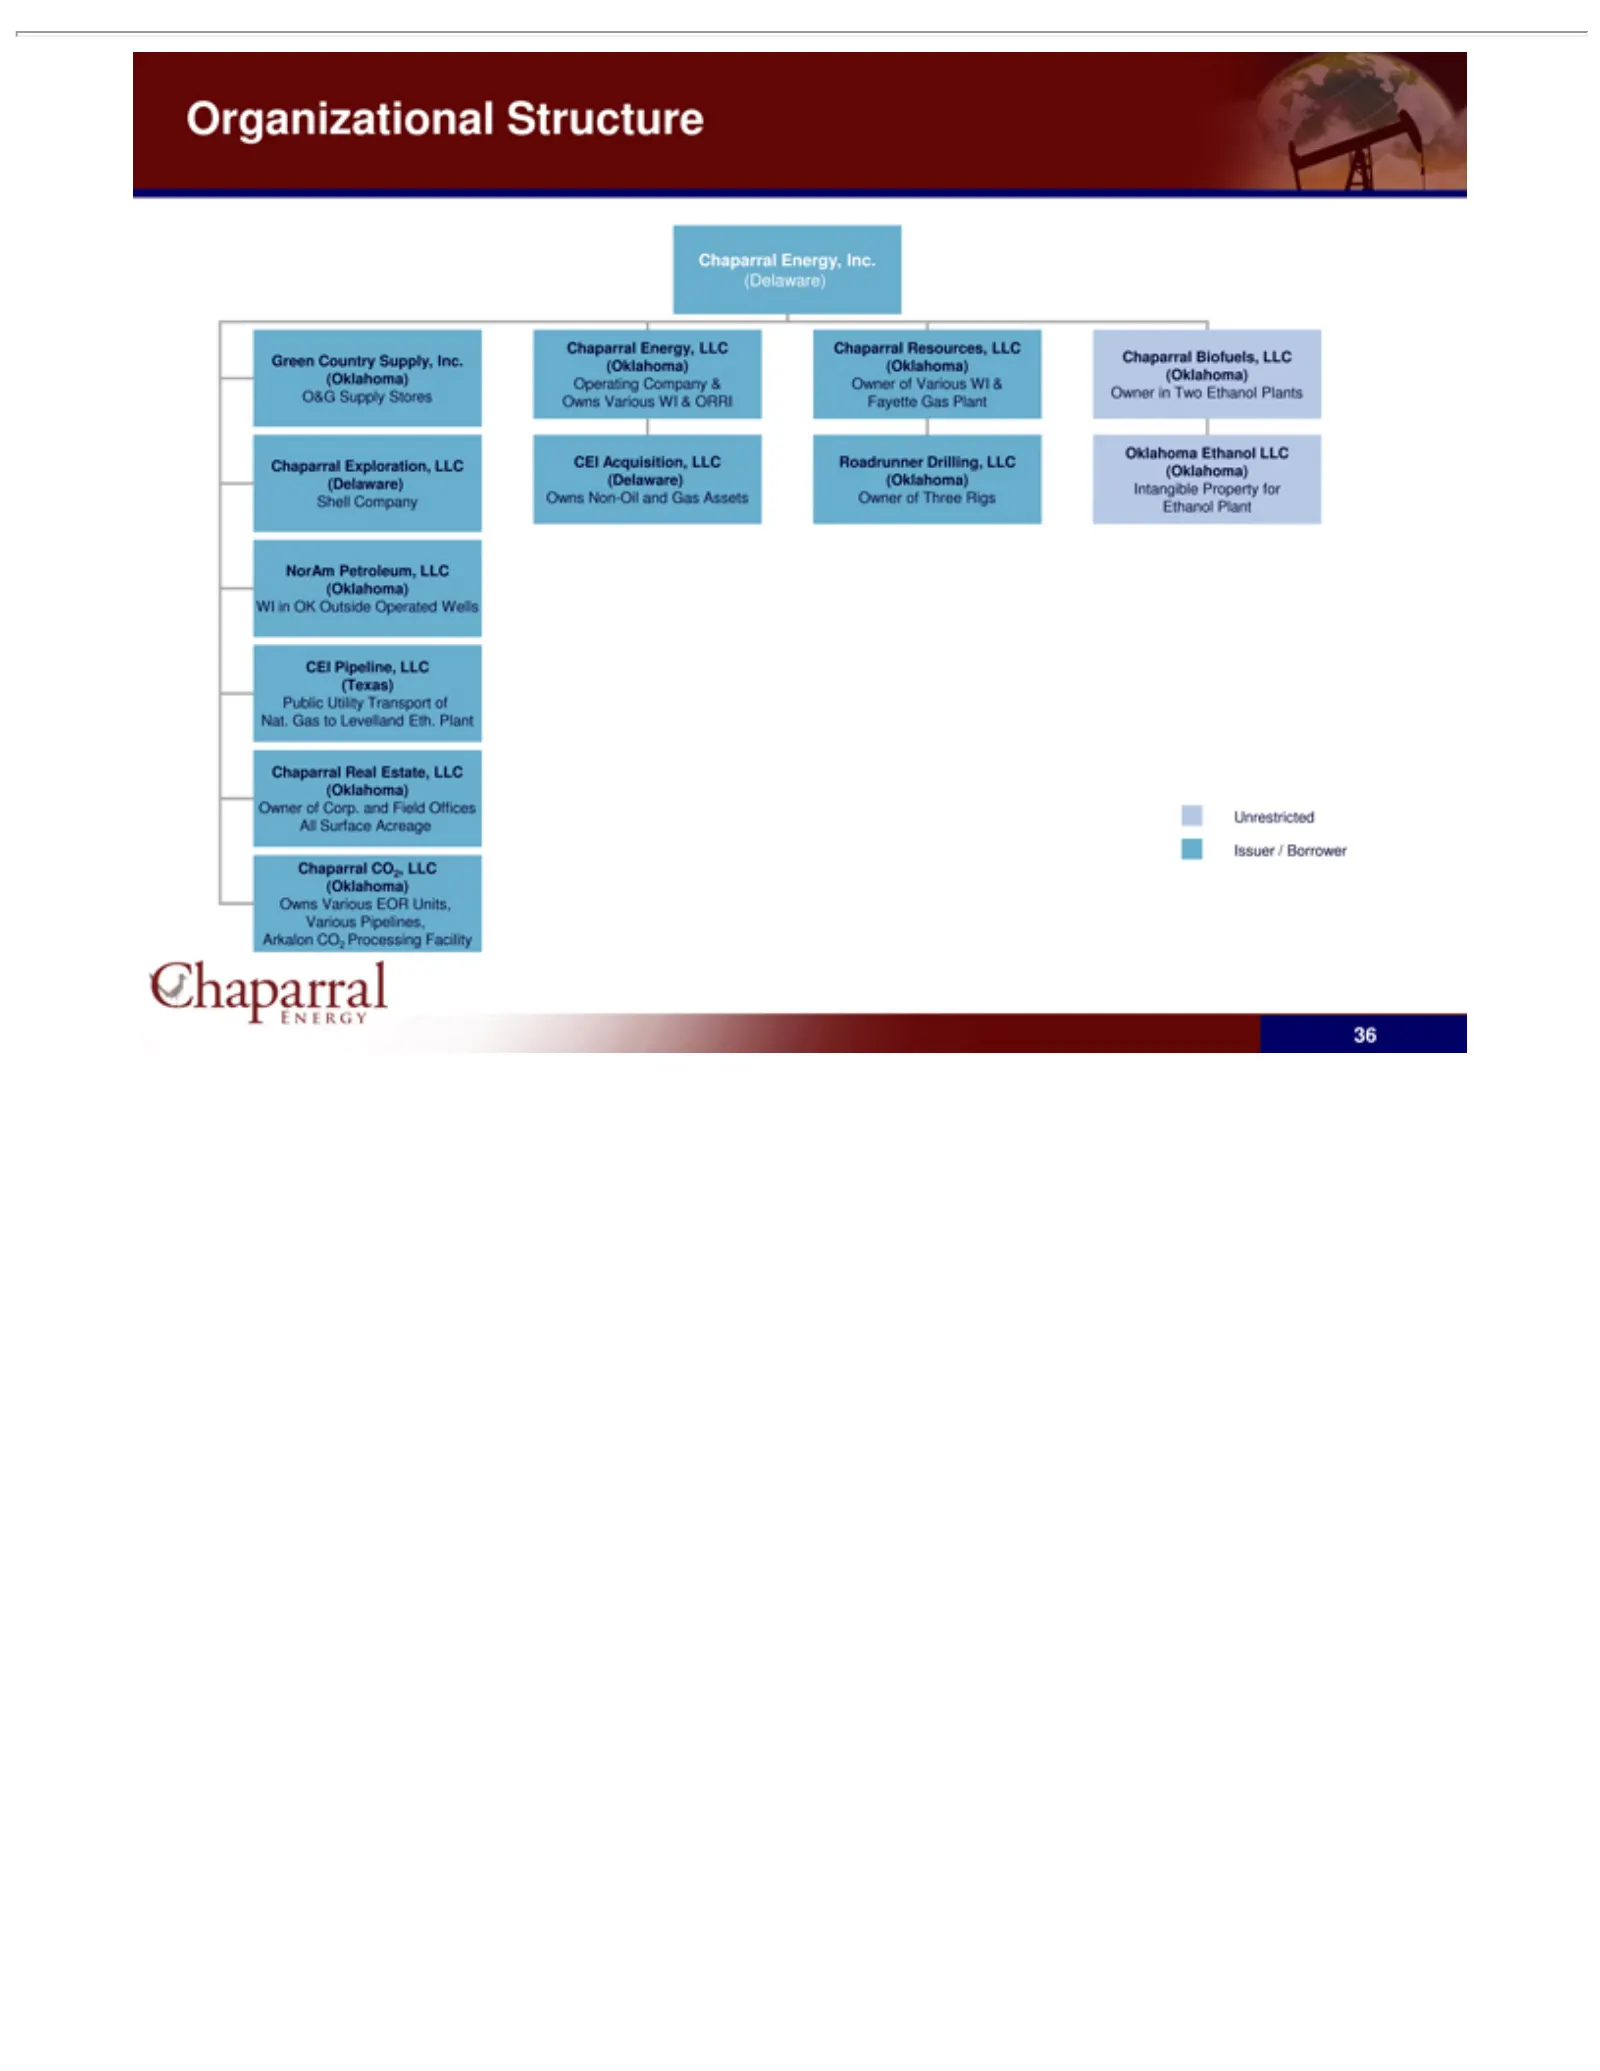
Slide 36: Organizational Structure
Organizational Green (Delaware) O&G Shell NorAm WI Public Operating CEI Owns Roadrunner Chaparral Owner Oklahoma Intangible Issuer Unrestricted 36 inAcquisition, Pipeline, Company Supply OK Various Non-Oil /Country Utility of in Borrower Petroleum, Two Various Three Corp. Exploration, Real CO2, Ener
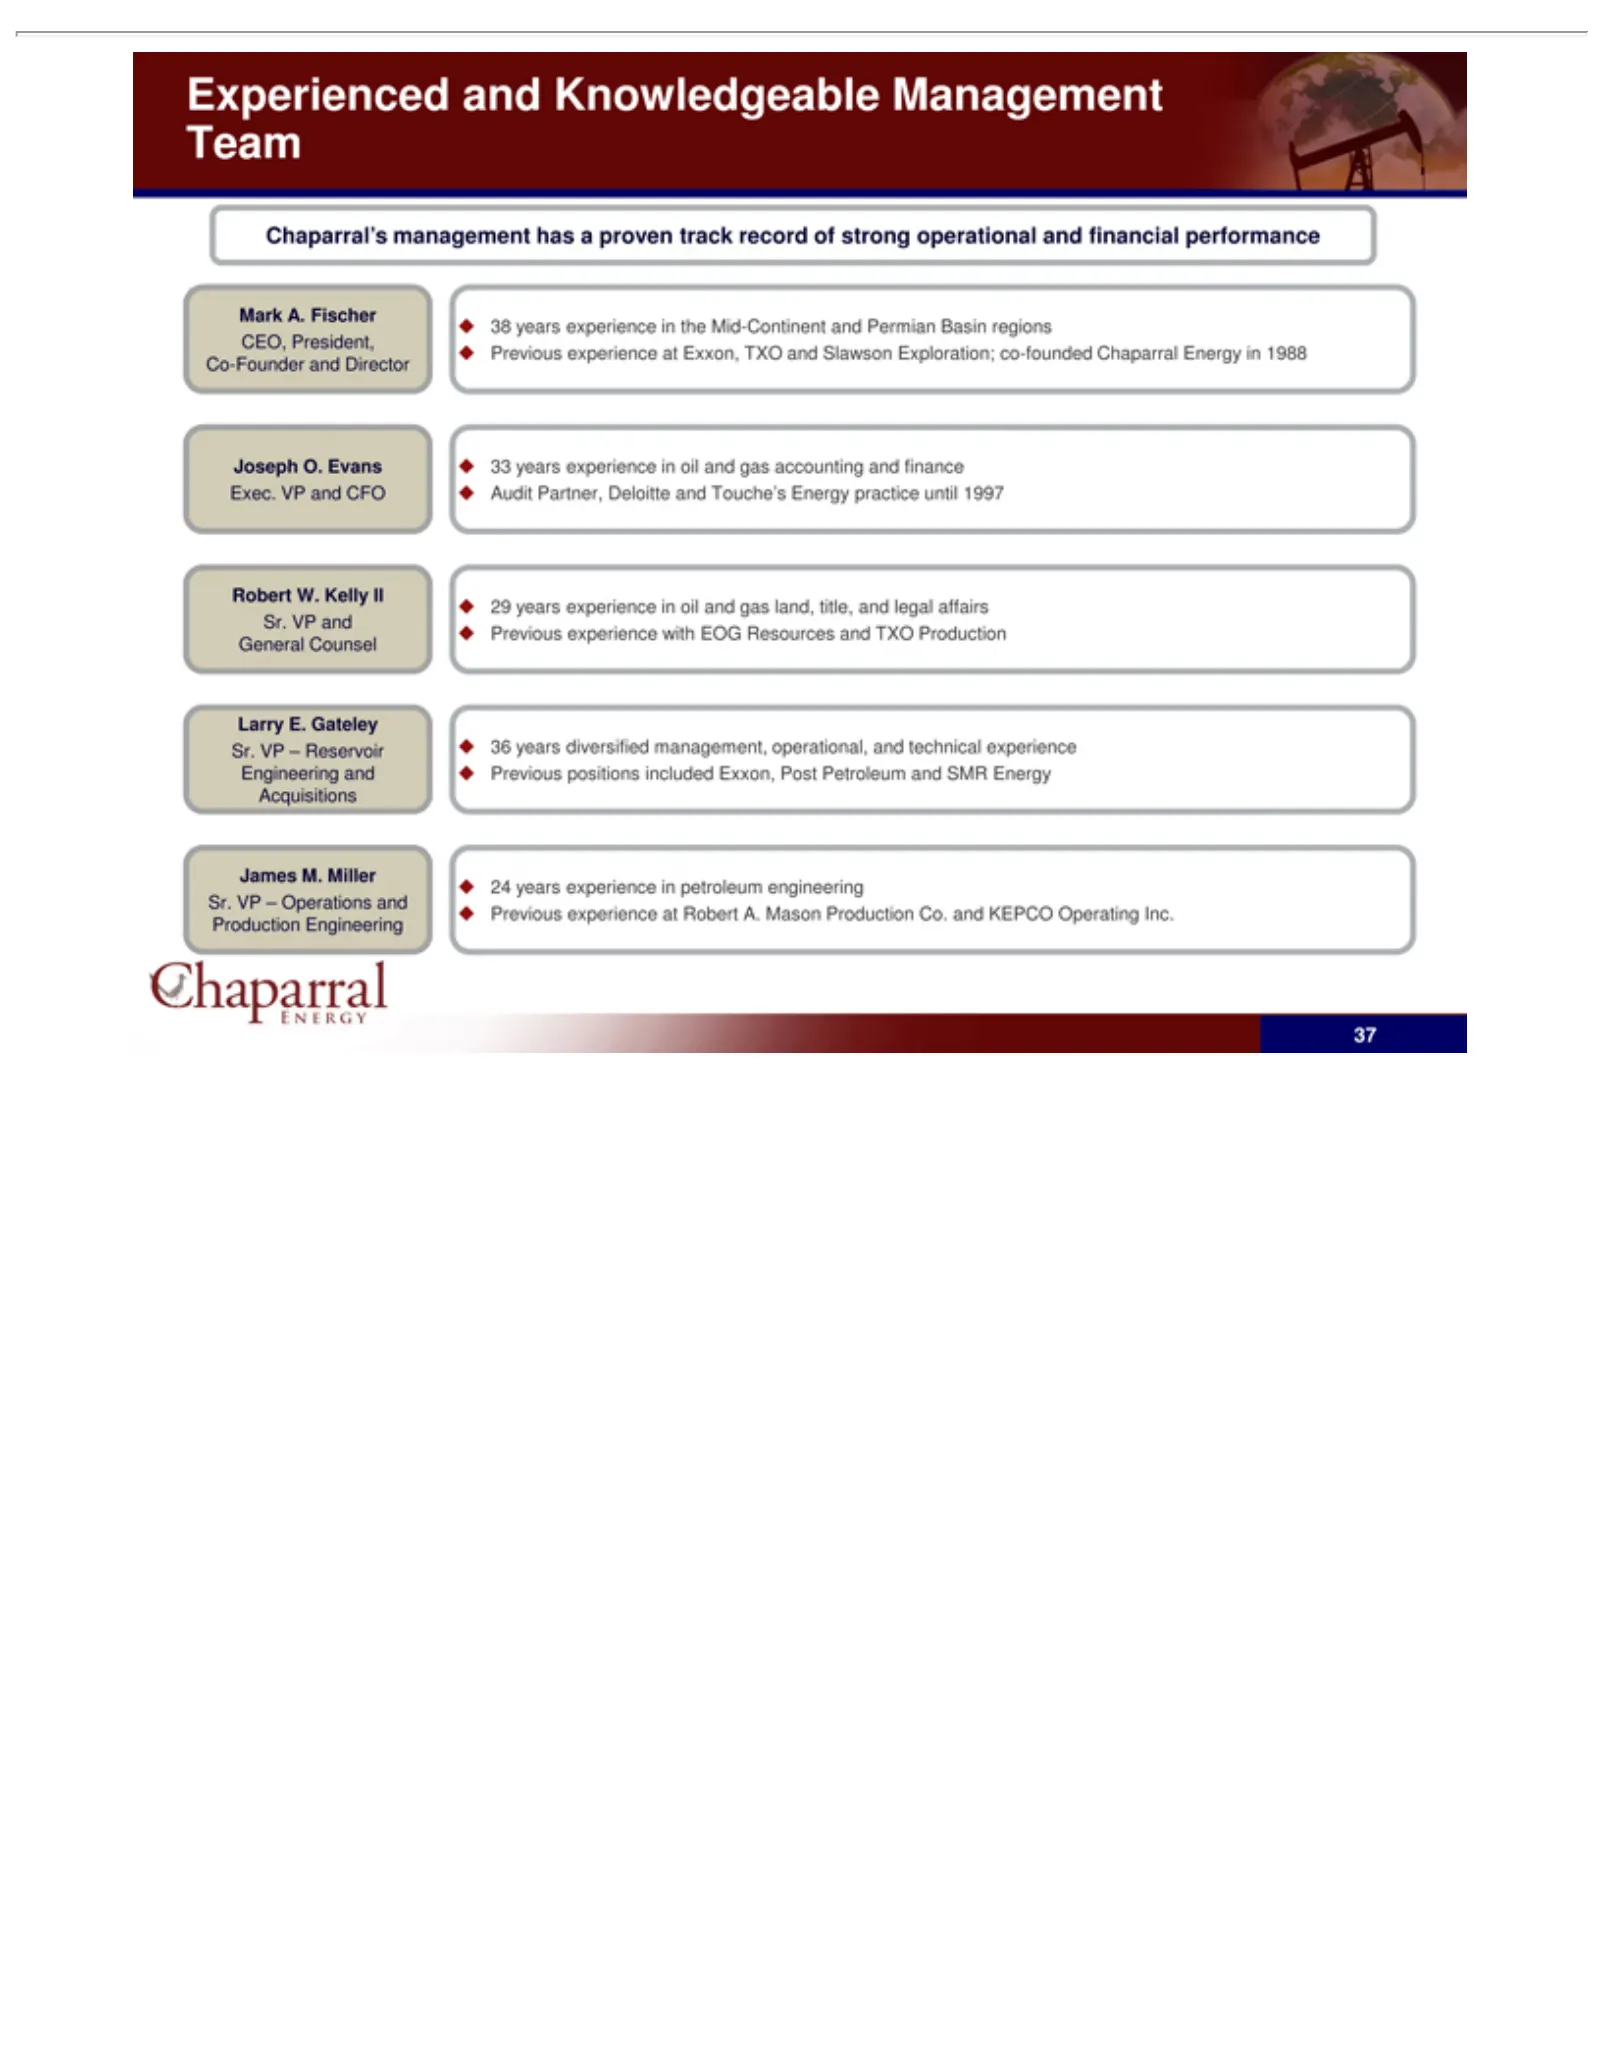
Slide 37: Experienced Management Team
Experienced Chaparral’s Mark CEO, Joseph Exec. Robert Larry James Sr. 38 33 29 36 24 Previous 37 years VPA. E. VP President, M. –and W. O.Operations Reservoir Gateley Fischer diversified experience experience and Miller Evans Kelly General management and CFOCo-Founder II Knowledgeable Engineering Co
Source: SEC EDGAR · 8-K filed Feb 8, 2010
More decks from Chaparral Energy Inc
 Debt Investor Presentation (August 2020)10 slides · Aug 17, 2020
 Q1 2020 Earnings Presentation26 slides · May 12, 2020
 Investor Presentation (March 2020)30 slides · Mar 12, 2020
 Q3 2019 Earnings Presentation31 slides · Nov 12, 2019
 Q2 2019 Earnings Presentation33 slides · Aug 8, 2019
 Investor Presentation (May 2019)41 slides · May 28, 2019