Sundance Energy — Sundance Energy Australia — Investor Presentation (April 2014)
23 slides from Sundance Energy's investor presentation, Apr 30, 2014
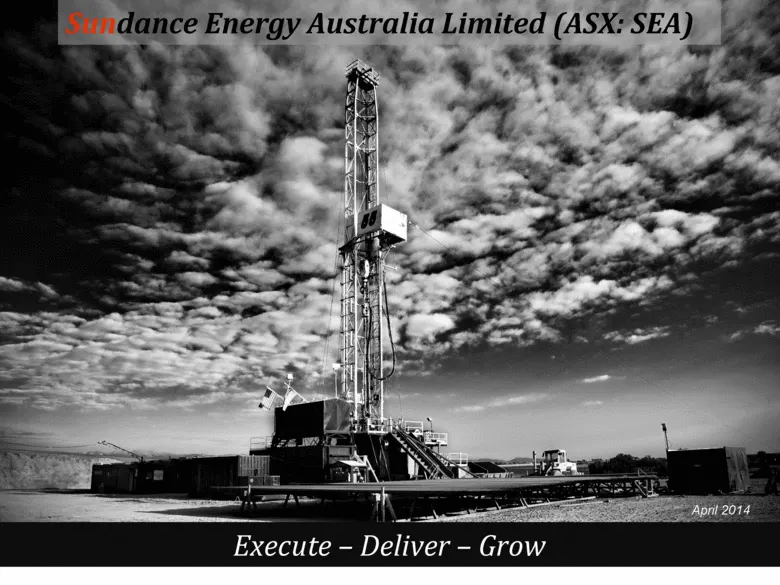
Slide 1: Execute – Deliver – Grow
Sundance Energy Australia Limited (ASX: SEA) Execute – Deliver – Grow April 2014
Slide 2: Disclaimer
This presentation has been prepared by Sundance Energy Australia Limited (ABN 76 112 202 883). Summary information The following disclaimer applies to this document and any information contained in it (the “Information”). The Information in this presentation is of general background and does not pur
Slide 3: Disclaimer and forward-looking statements
Not an offer The Information does not constitute an offer, invitation, solicitation or recommendation in relation to the subscription, purchase or sale of securities in any jurisdiction. Neither this presentation nor anything in it shall form any part of any contract for the acquisition of Sundance
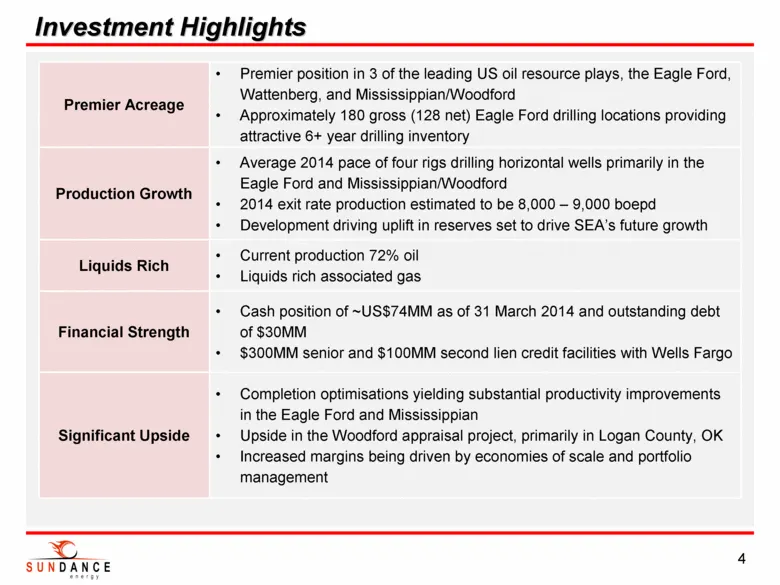
Slide 4: Investment Highlights
Investment Highlights 4 Premier Acreage • Premier position in 3 of the leading US oil resource plays, the Eagle Ford, Wattenberg, and Mississippian/Woodford • Approximately 180 gross (128 net) Eagle Ford drilling locations providing attractive 6+ year drilling inventory Production Growth • Average 2
Slide 5: Quarterly Overview
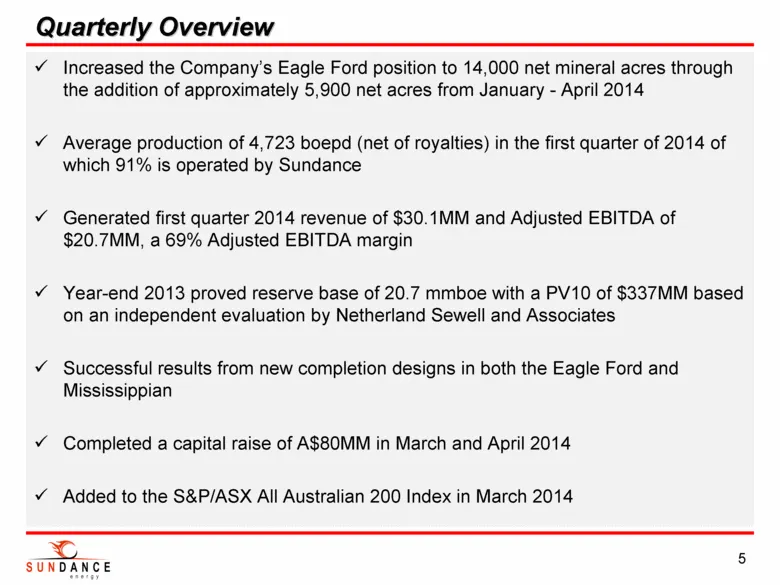
. Increased the Company’s Eagle Ford position to 14,000 net mineral acres through the addition of approximately 5,900 net acres from January - April 2014 . Average production of 4,723 boepd (net of royalties) in the first quarter of 2014 of which 91% is operated by Sundance . Generated first quarter
Slide 6: Production and Revenue Trend
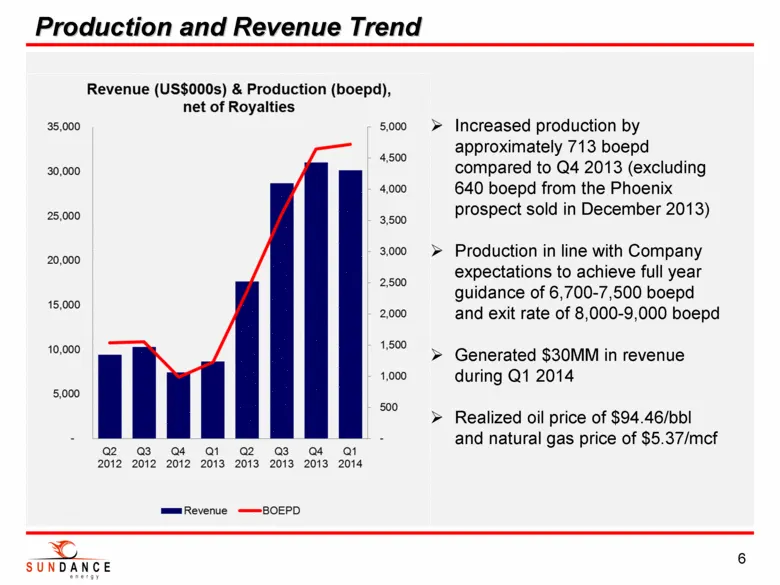
Production and Revenue Trend 6 . Increased production by approximately 713 boepd compared to Q4 2013 (excluding 640 boepd from the Phoenix prospect sold in December 2013) . Production in line with Company expectations to achieve full year guidance of 6,700-7,500 boepd and exit rate of 8,000-9,000 bo
Slide 7: Adjusted EBITDAX Trend
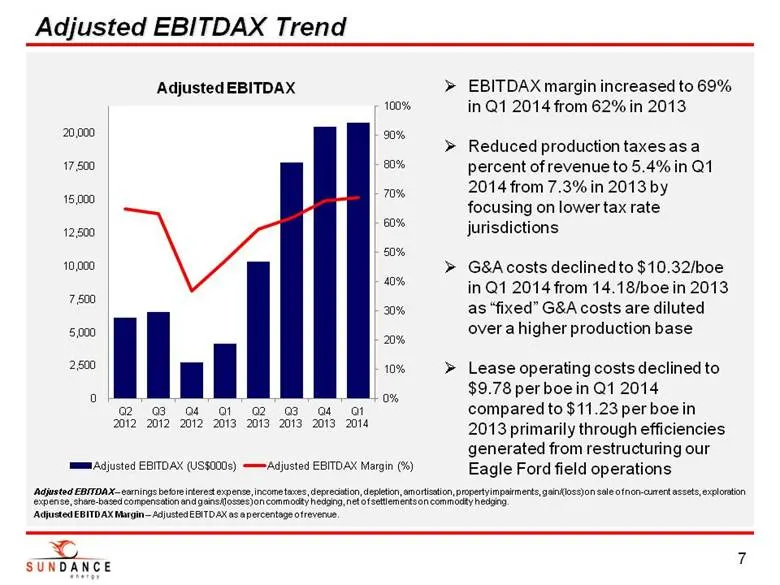
Adjusted EBITDAX – earnings before interest expense, income taxes, depreciation, depletion, amortisation, property impairments, gain/(loss) on sale of non-current assets, exploration expense, share-based compensation and gains/(losses) on commodity hedging, net of settlements on commodity hedging. A
Slide 8: Reserves Summary
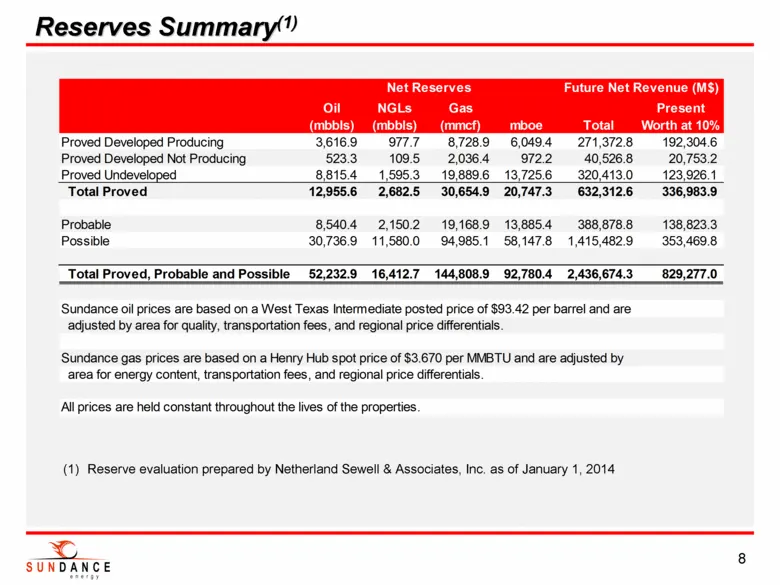
(1) Reserve evaluation prepared by Netherland Sewell & Associates, Inc. as of January 1, 2014 Reserves Summary(1) 8 Oil (mbbls) NGLs (mbbls) Gas (mmcf) mboe Total Present Worth at 10% Proved Developed Producing 3,616.9 977.7 8,728.9 6,049.4 271,372.8 192,304.6 Proved Developed Not Producing 523.3 10
Slide 9: Clear Visibility Towards Continued 1P Reserve Growth
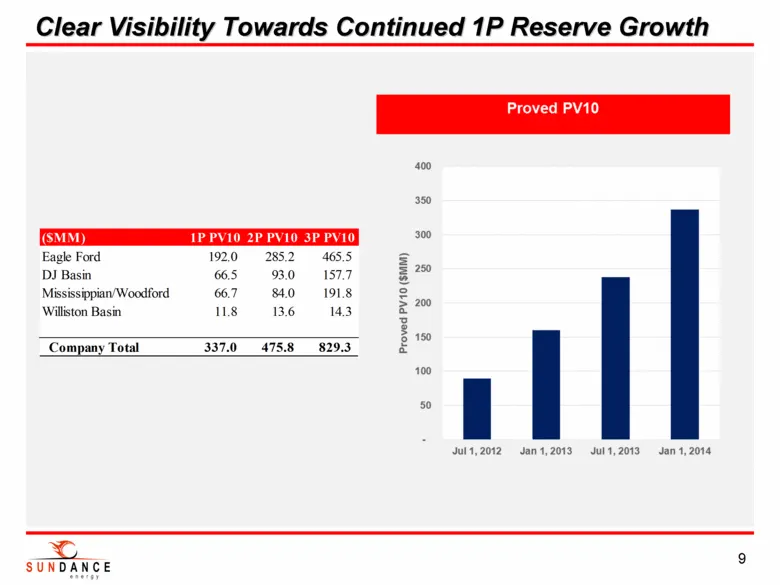
Clear Visibility Towards Continued 1P Reserve Growth 9 - 50 100 150 200 250 300 350 400 Jul 1, 2012 Jan 1, 2013 Jul 1, 2013 Jan 1, 2014 Proved PV10 ($MM) Proved PV10 ($MM) 1P PV10 2P PV10 3P PV10 Eagle Ford 192.0 285.2 465.5 DJ Basin 66.5 93.0 157.7 Mississippian/Woodford 66.7 84.0 191.8 Williston B
Slide 10: Diversified Assets in Leading US Liquids Basins
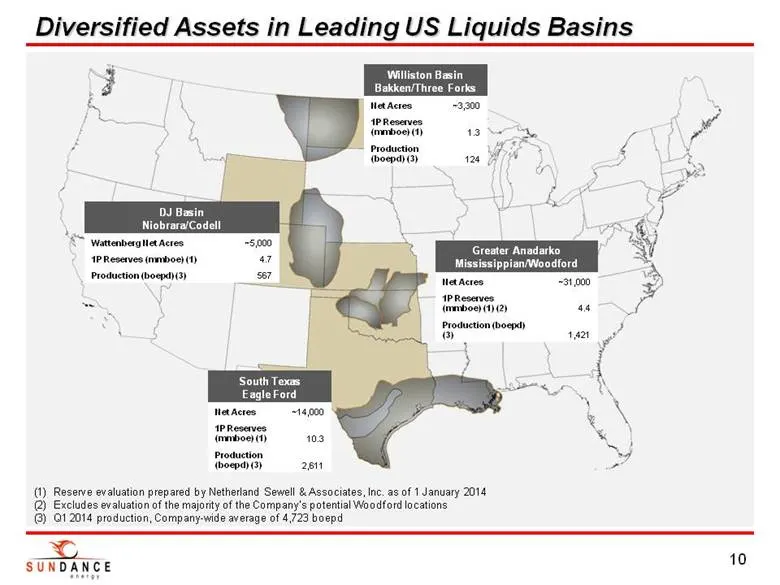
(1) Reserve evaluation prepared by Netherland Sewell & Associates, Inc. as of 1 January 2014 (2) Excludes evaluation of the majority of the Company’s potential Woodford locations (3) Q1 2014 production, Company-wide average of 4,723 boepd Diversified Assets in Leading US Liquids Basins 10 Greater An
Slide 11: Eagle Ford – Major Players
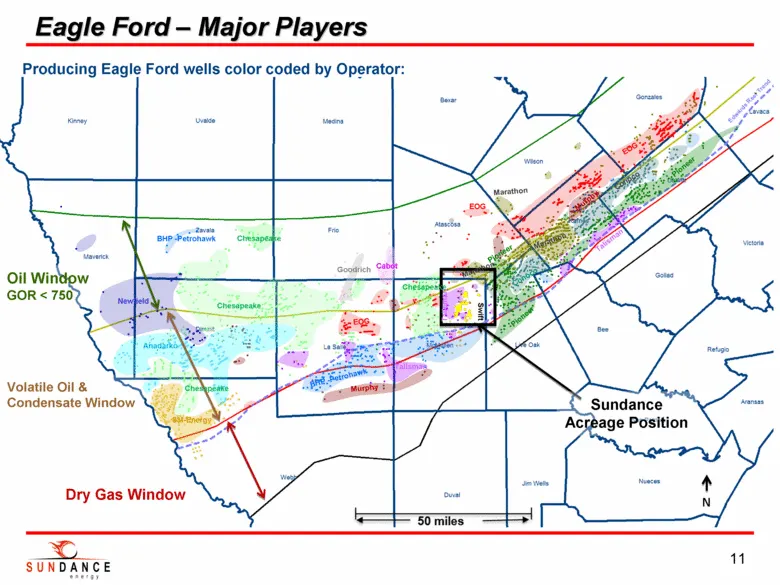
Eagle Ford – Major Players 11 Oil Window GOR < 750 Volatile Oil & Condensate Window Dry Gas Window Sundance Acreage Position EOG Newfield Chesapeake Anadarko SM-Energy Cabot Goodrich Chesapeake Chesapeake Talisman Talisman BHP -Petrohawk Chesapeake Swift 50 miles N Producing Eagle Ford wells color c
Slide 12: Eagle Ford Acreage Increased to 14,000 Net Acres
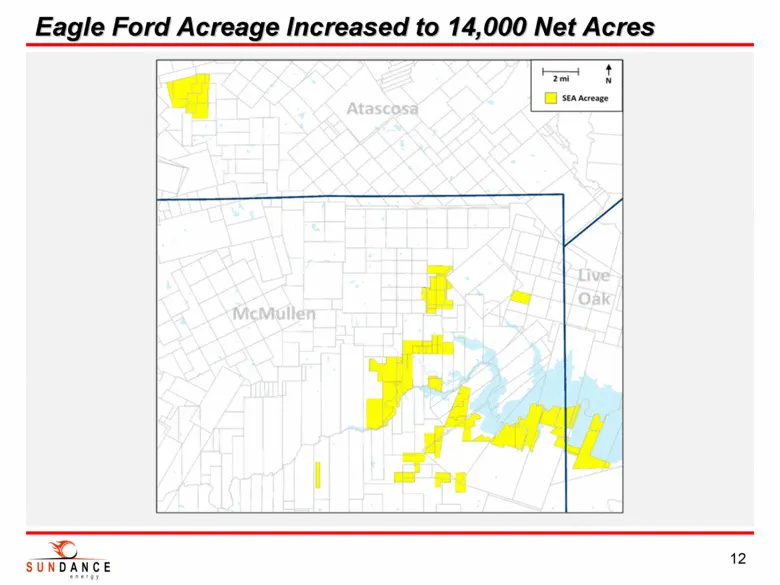
Eagle Ford Acreage Increased to 14,000 Net Acres 12
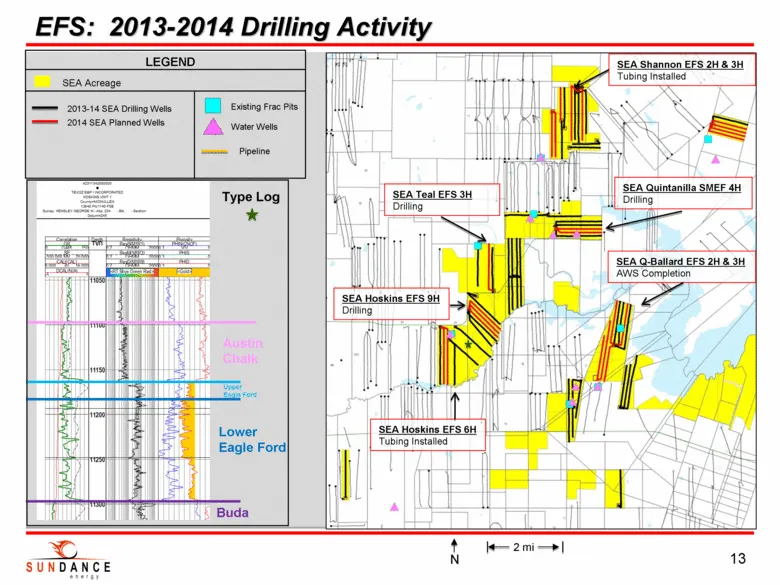
Slide 13: EFS: 2013-2014 Drilling Activity
EFS: 2013-2014 Drilling Activity Buda Lower Eagle Ford Upper Eagle Ford Austin Chalk Type Log SEA Shannon EFS 2H & 3H Tubing Installed SEA Hoskins EFS 6H Tubing Installed LEGEND SEA Acreage 2014 SEA Planned Wells 2013-14 SEA Drilling Wells Existing Frac Pits Pipeline Water Wells SEA Q-Ballard EFS 2H
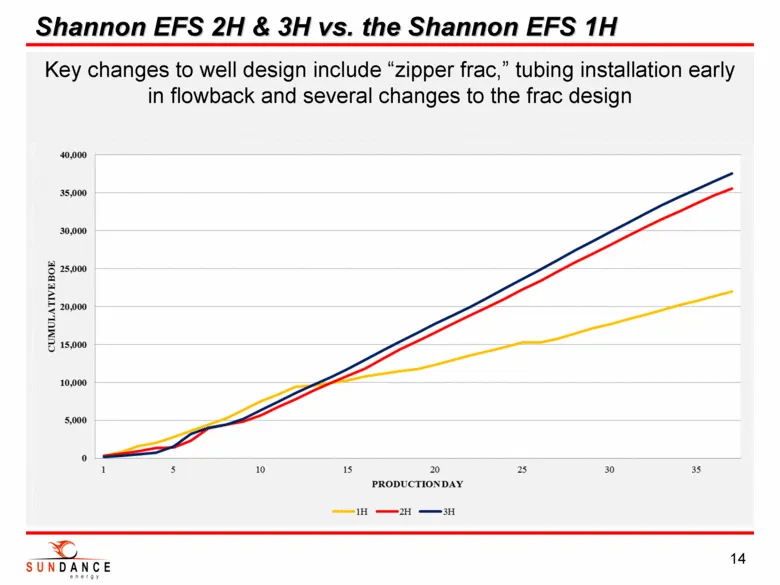
Slide 14: Shannon EFS 2H & 3H vs. the Shannon EFS 1H
Key changes to well design include “zipper frac,” tubing installation early in flowback and several changes to the frac design Shannon EFS 2H & 3H vs. the Shannon EFS 1H 14 0 5,000 10,000 15,000 20,000 25,000 30,000 35,000 40,000 1 5 10 15 20 25 30 35 CUMULATIVE BOE PRODUCTION DAY 1H 2H 3H
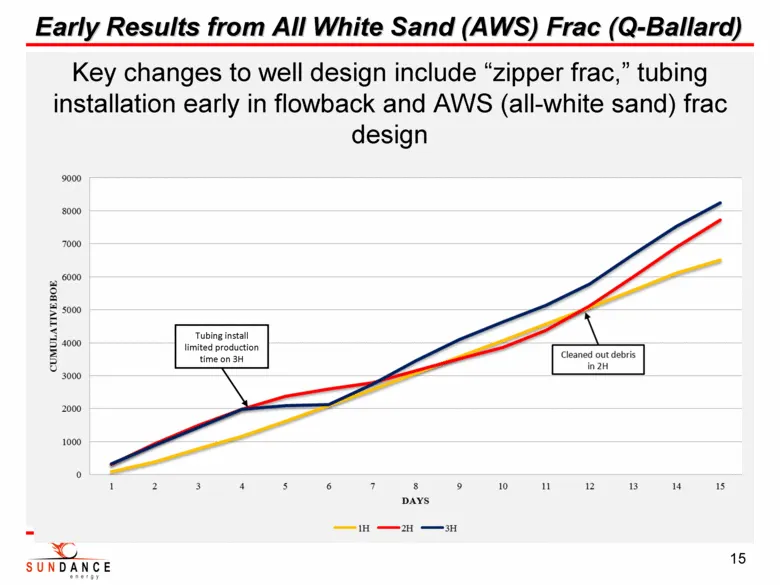
Slide 15: Early Results from All White Sand (AWS) Frac
Key changes to well design include “zipper frac,” tubing installation early in flowback and AWS (all-white sand) frac design Early Results from All White Sand (AWS) Frac (Q-Ballard) 15 0 1000 2000 3000 4000 5000 6000 7000 8000 9000 1 2 3 4 5 6 7 8 9 10 11 12 13 14 15 CUMULATIVE BOE DAYS 1H 2H 3H Cle
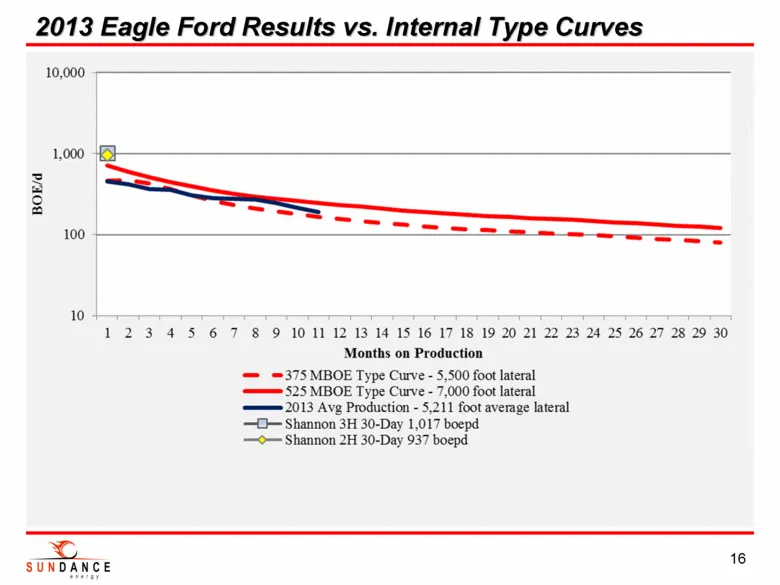
Slide 16: 2013 Eagle Ford Results vs. Internal Type Curves
2013 Eagle Ford Results vs. Internal Type Curves 16
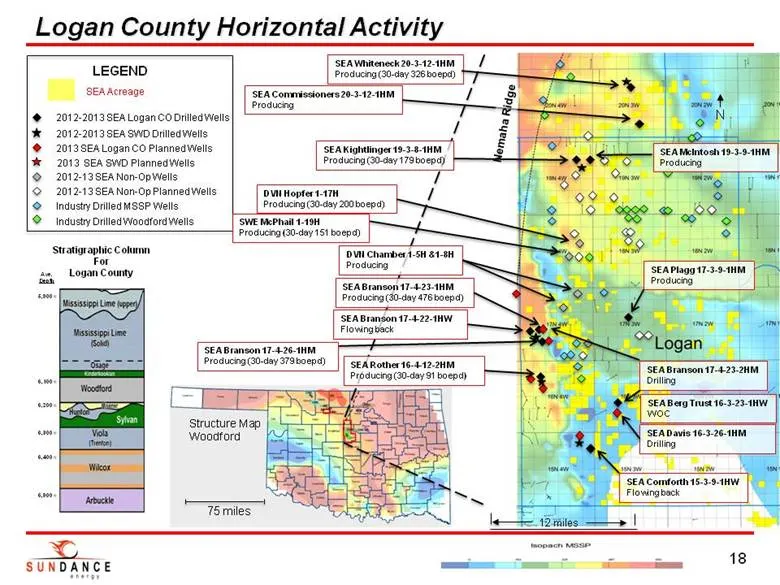
Slide 17: Logan County Horizontal Activity
18 Logan County Horizontal Activity 75 miles Structure Map Woodford LEGEND SEA Acreage 2013 SEA Logan CO Planned Wells 2012-2013 SEA Logan CO Drilled Wells 2012-13 SEA Non-Op Wells Industry Drilled MSSP Wells Industry Drilled Woodford Wells 2012-2013 SEA SWD Drilled Wells 2013 SEA SWD Planned Wells
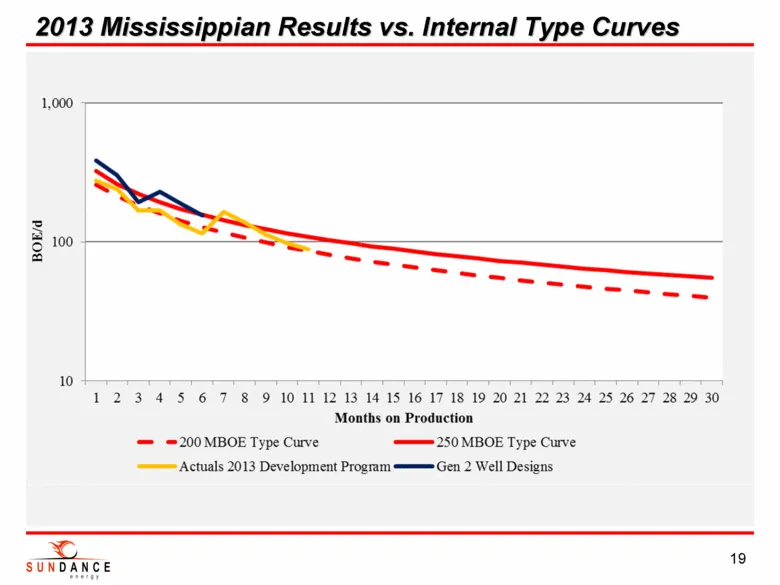
Slide 18: 2013 Mississippian Results vs. Internal Type Curves
2013 Mississippian Results vs. Internal Type Curves 19
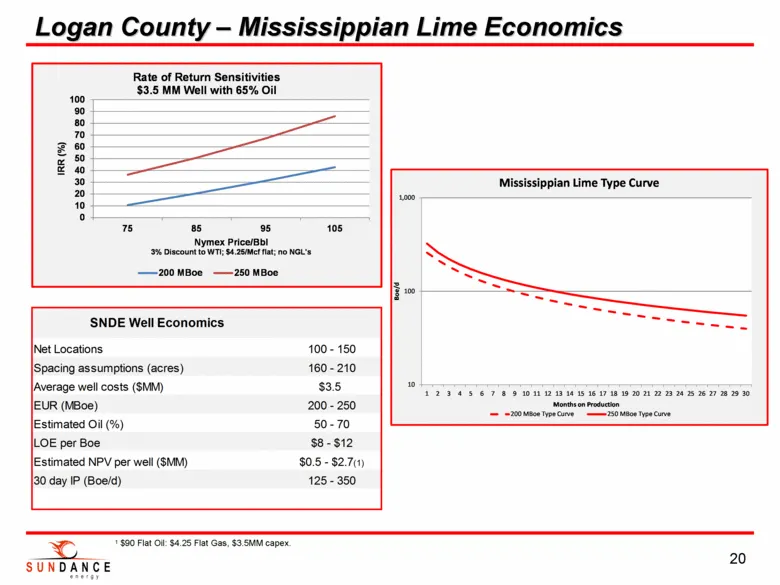
Slide 19: Logan County – Mississippian Lime Economics
Logan County – Mississippian Lime Economics 20 10 100 1,000 1 2 3 4 5 6 7 8 9 10 11 12 13 14 15 16 17 18 19 20 21 22 23 24 25 26 27 28 29 30 Boe/d Months on Production Mississippian Lime Type Curve 200 MBoe Type Curve 250 MBoe Type Curve Net Locations Spacing assumptions (acres) Average well costs (
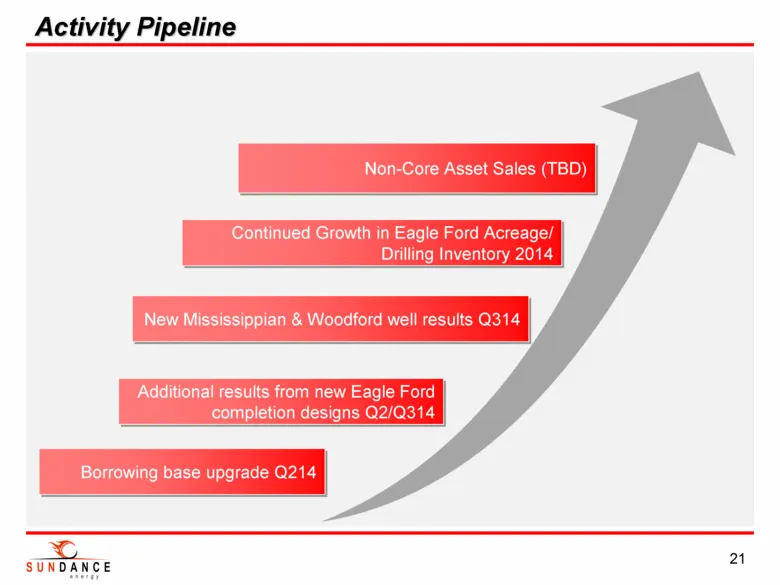
Slide 20: Activity Pipeline
Activity Pipeline 21 Borrowing base upgrade Q214 New Mississippian & Woodford well results Q314 Additional results from new Eagle Ford completion designs Q2/Q314 Continued Growth in Eagle Ford Acreage/ Drilling Inventory 2014 Non-Core Asset Sales (TBD)
Slide 21: Appendices
SUNDANCE Appendices 22
Slide 22: Board of Directors
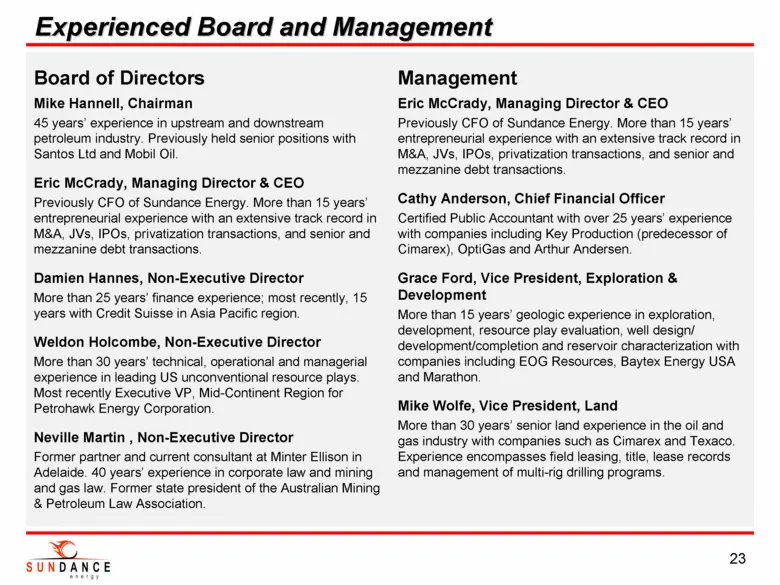
Board of Directors Mike Hannell, Chairman 45 years’ experience in upstream and downstream petroleum industry. Previously held senior positions with Santos Ltd and Mobil Oil. Eric McCrady, Managing Director & CEO Previously CFO of Sundance Energy. More than 15 years’ entrepreneurial experience with a
Slide 23: Reserve report pricing assumptions
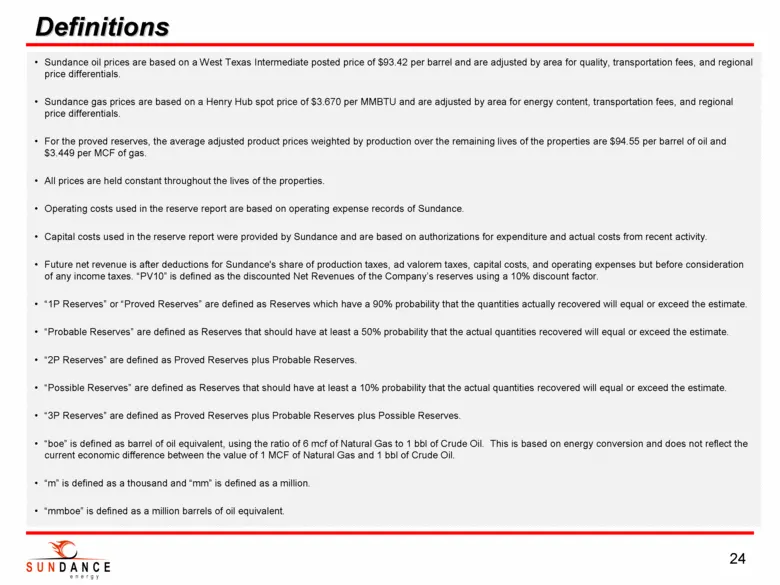
• Sundance oil prices are based on a West Texas Intermediate posted price of $93.42 per barrel and are adjusted by area for quality, transportation fees, and regional price differentials. • Sundance gas prices are based on a Henry Hub spot price of $3.670 per MMBTU and are adjusted by area for energ
Source: SEC EDGAR · 6-K filed Apr 30, 2014
More decks from Sundance Energy Inc
 Investor Presentation (February 2020)25 slides · Feb 10, 2020
 Sundance Energy Australia — Q3 2019 Earnings Presentation24 slides · Nov 18, 2019
 Sundance Energy Australia — Q2 2019 Earnings Presentation25 slides · Aug 16, 2019
 Sundance Energy Australia — Investor Presentation (July 2019)19 slides · Jul 24, 2019
 Sundance Energy Australia — Investor Presentation (June 2019)16 slides · Jun 3, 2019
 Sundance Energy Australia — Q1 2019 Earnings Presentation17 slides · May 21, 2019