Capital Bank Financial — Q1 2015 Earnings Presentation
21 slides from Capital Bank Financial's earnings presentation, Apr 23, 2015
Slide 1: 2015 First Quarter Earnings
2015 First Quarter Earnings April 23, 2015
Slide 2: Safe Harbor Statement
Safe Harbor Statement 2 4/23/2015 Forward-Looking Statements Information in this presentation contains forward-looking statements. Any statements about our expectations, beliefs, plans, predictions, forecasts, objectives, assumptions or future events or performance are not historical facts and may b
Slide 3: We've Built One Bank out of Seven Acquisitions
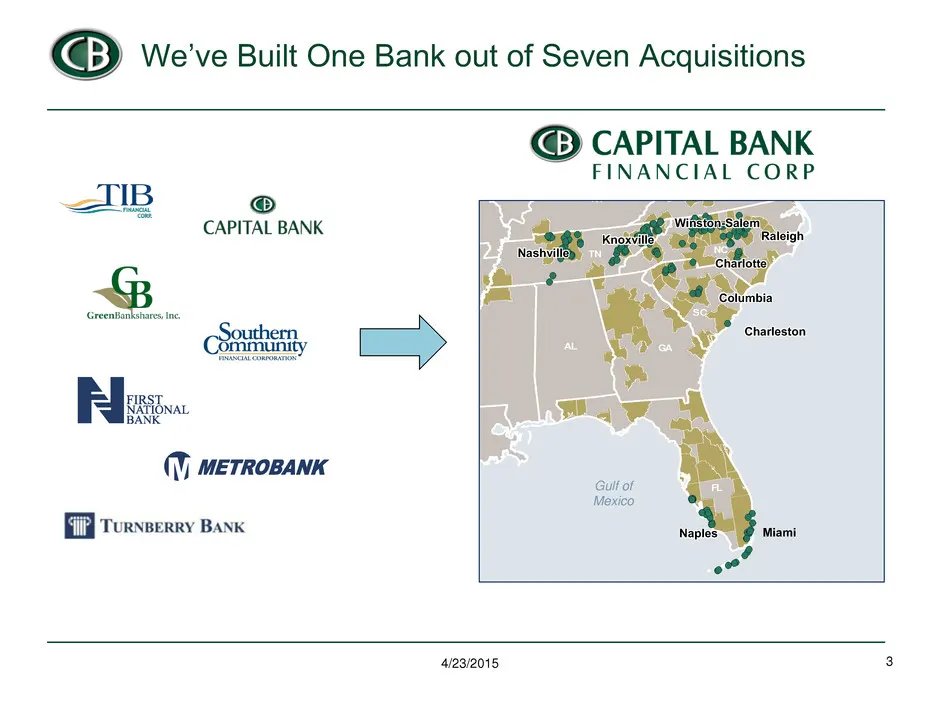
3 We’ve Built One Bank out of Seven Acquisitions 4/23/2015 TN KY NC GA SC AL WV VA FL 0 Gulf of Mexico Nashville ill ill ill Winston-Salem i - l i - l i - l Knoxville ill ill ill Naples l l l Miami Charlotte Ch rlottrlott rlott rlottrlott Raleigh l i l i l i Charleston rl rl rl Columbia Colu bi i
Slide 4: First Quarter Accomplishments
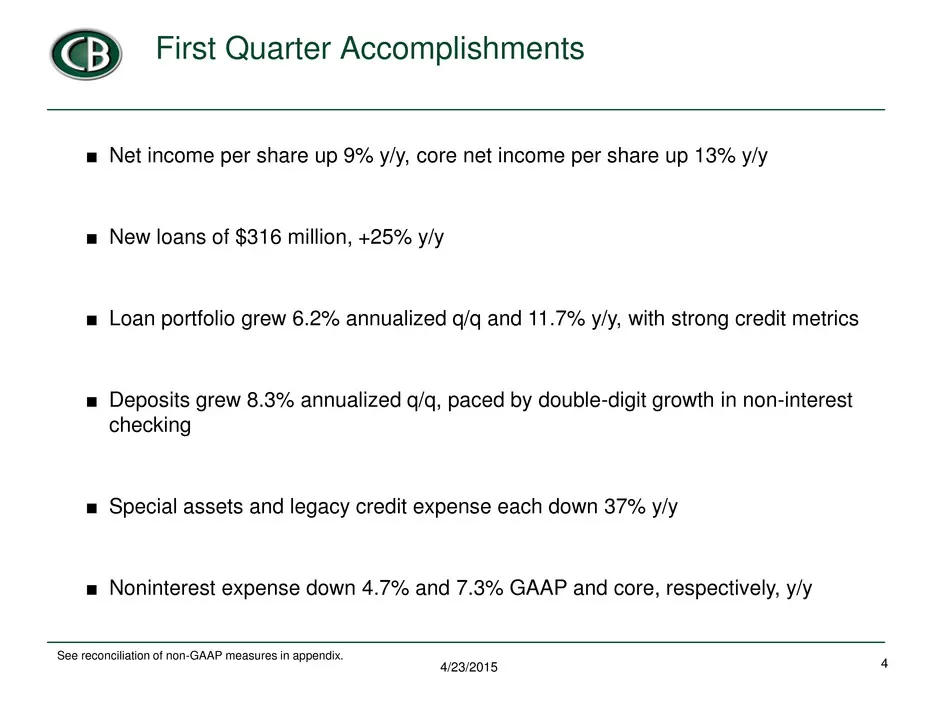
4 First Quarter Accomplishments ■ Net income per share up 9% y/y, core net income per share up 13% y/y ■ New loans of $316 million, +25% y/y ■ Loan portfolio grew 6.2% annualized q/q and 11.7% y/y, with strong credit metrics ■ Deposits grew 8.3% annualized q/q, paced by double-digit growth in non-in
Slide 5: First Quarter Financial Summary
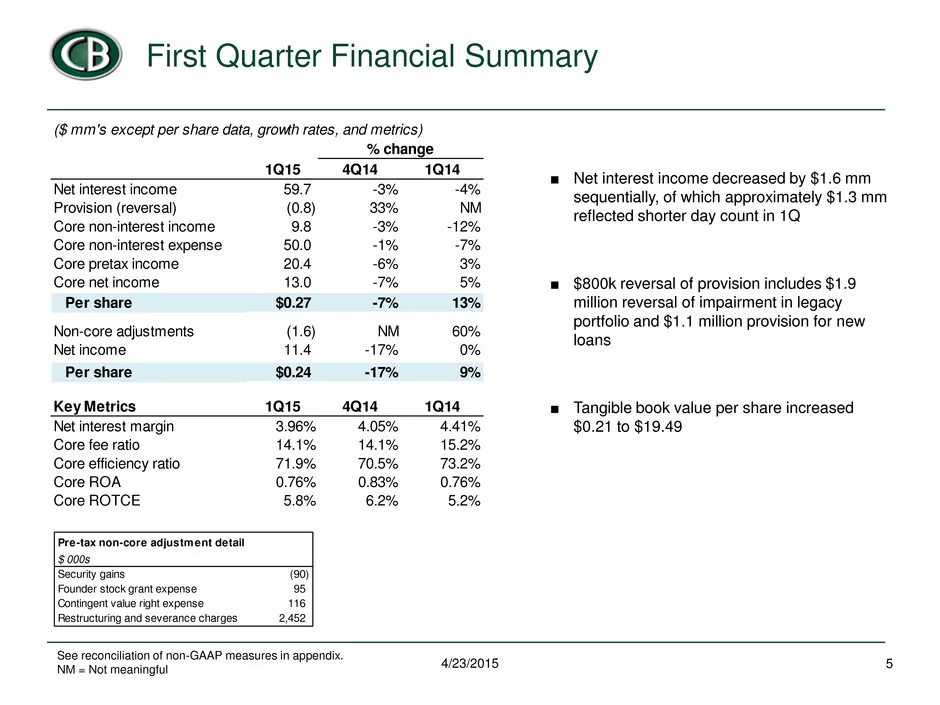
First Quarter Financial Summary 5 4/23/2015 See reconciliation of non-GAAP measures in appendix. NM = Not meaningful ■ Net interest income decreased by $1.6 mm sequentially, of which approximately $1.3 mm reflected shorter day count in 1Q ■ $800k reversal of provision includes $1.9 million reversal
Slide 6: New Loan Production Up 25% Y/Y
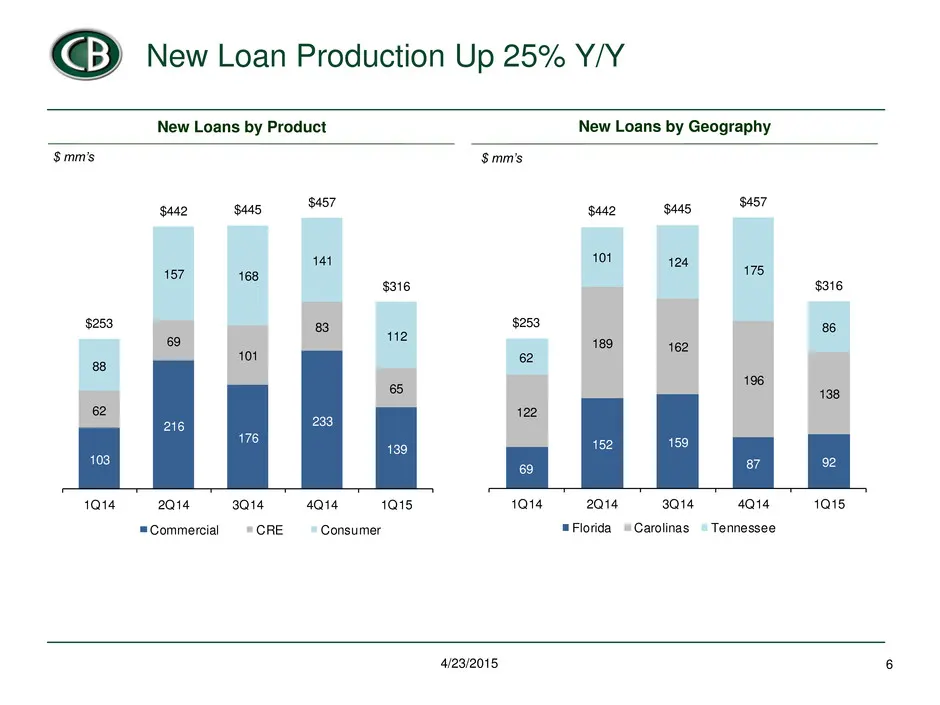
New Loan Production Up 25% Y/Y 6 4/23/2015 New Loans by Geography New Loans by Product $ mm’s $ mm’s 69 152 159 87 92 122 189 162 196 138 62 101 124 175 86$253 $442 $445 $457 $316 1Q14 2Q14 3Q14 4Q14 1Q15 Florida Carolinas Tennessee 103 216 176 233 139 62 69 101 83 65 88 157 168 141 112 $253 $442 $4
Slide 7: Checking Balances Pacing Deposit Growth
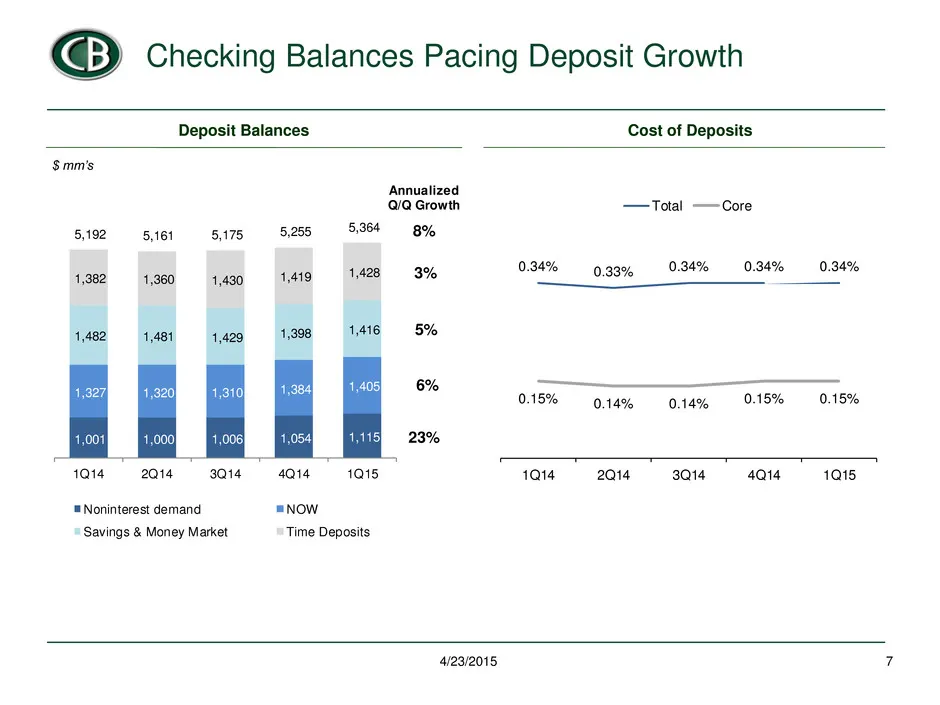
Checking Balances Pacing Deposit Growth 7 4/23/2015 Cost of Deposits Deposit Balances $ mm’s 1,001 1,000 1,006 1,054 1,115 1,327 1,320 1,310 1,384 1,405 1,482 1,481 1,429 1,398 1,416 1,382 1,360 1,430 1,419 1,428 5,192 5,161 5,175 5,255 5,364 1Q14 2Q14 3Q14 4Q14 1Q15 Noninterest demand NOW Savings &
Slide 8: NIM Compresses as Expected on New Loan Yields
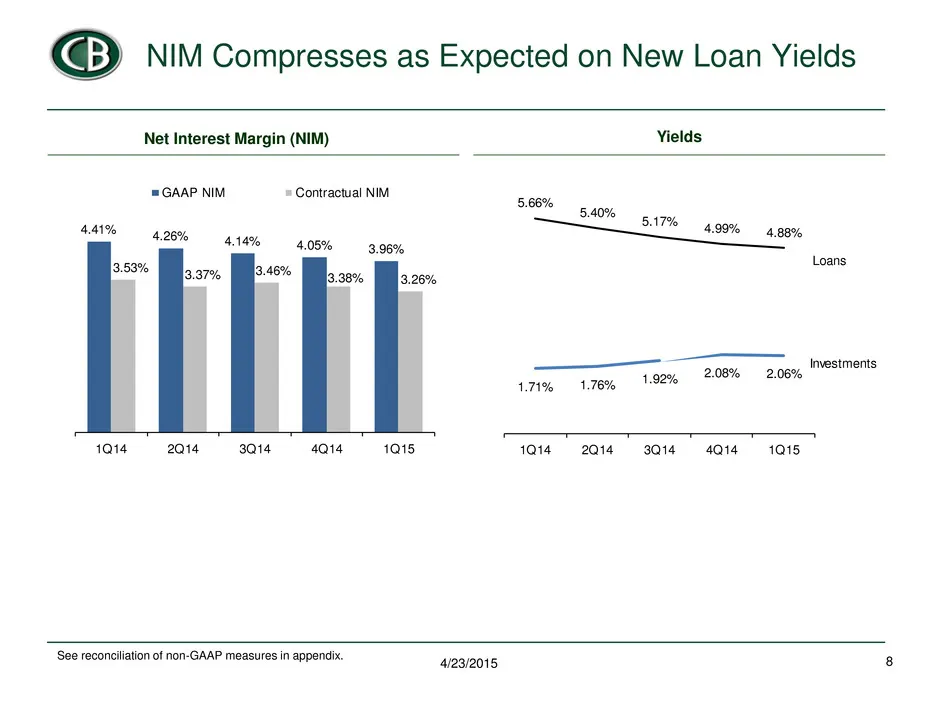
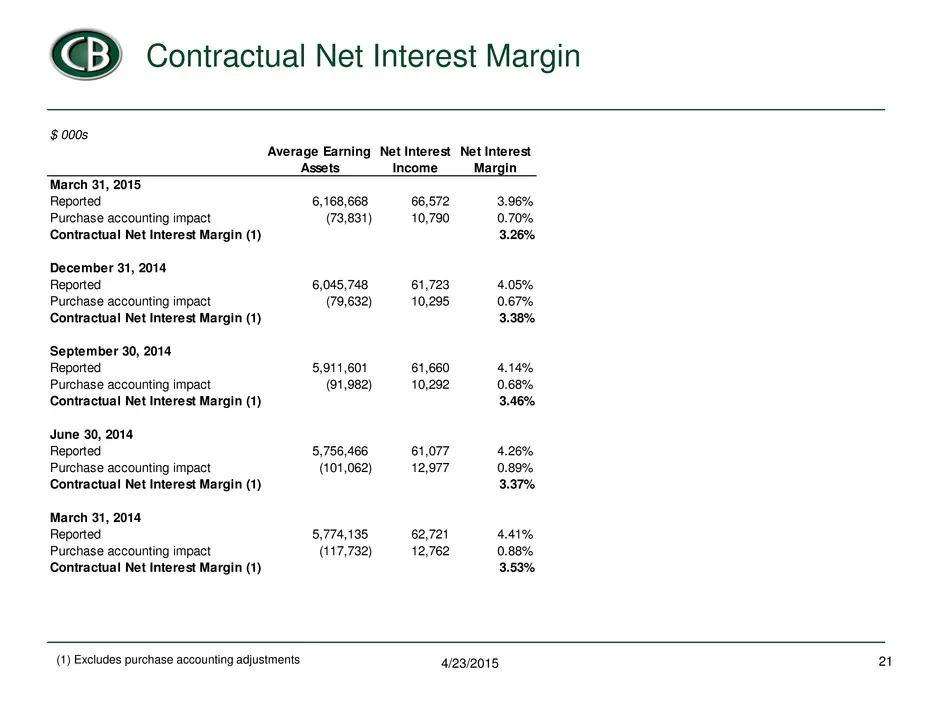
NIM Compresses as Expected on New Loan Yields 8 4/23/2015 Net Interest Margin (NIM) Yields See reconciliation of non-GAAP measures in appendix. 4.41% 4.26% 4.14% 4.05% 3.96% 3.53% 3.37% 3.46% 3.38% 3.26% 1Q14 2Q14 3Q14 4Q14 1Q15 GAAP NIM Contractual NIM5.66% 5.40% 5.17% 4.99% 4.88% 1.71% 1.76% 1.92%
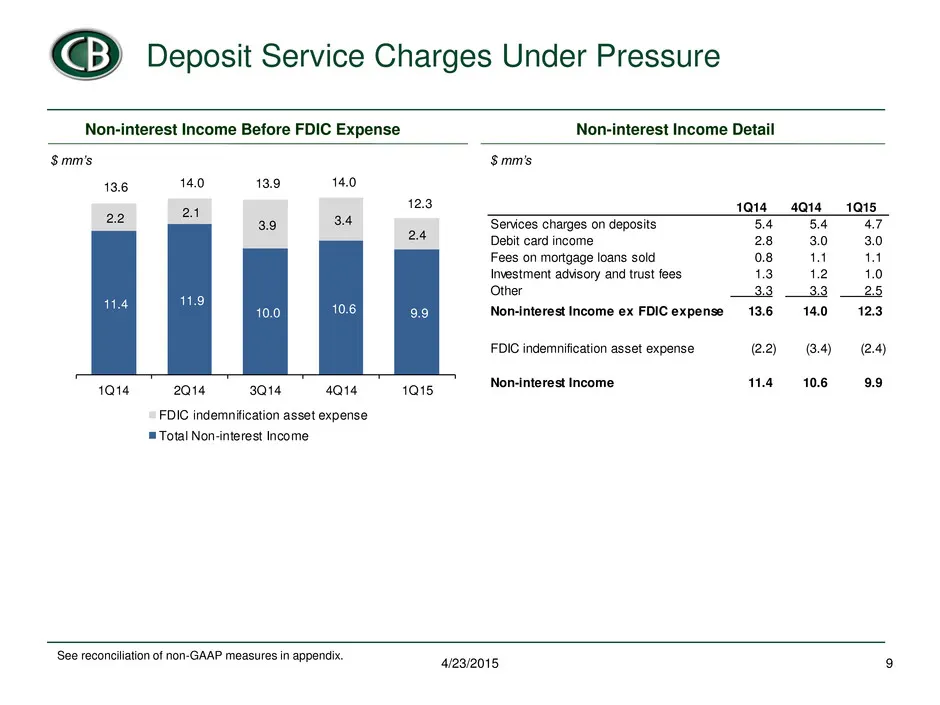
Slide 9: Deposit Service Charges Under Pressure
11.4 11.9 10.0 10.6 9.9 2.2 2.1 3.9 3.4 2.4 13.6 14.0 13.9 14.0 12.3 1Q14 2Q14 3Q14 4Q14 1Q15 FDIC indemnification asset expense Total Non-interest Income Deposit Service Charges Under Pressure 9 4/23/2015 Non-interest Income Before FDIC Expense $ mm’s See reconciliation of non-GAAP measures in appe
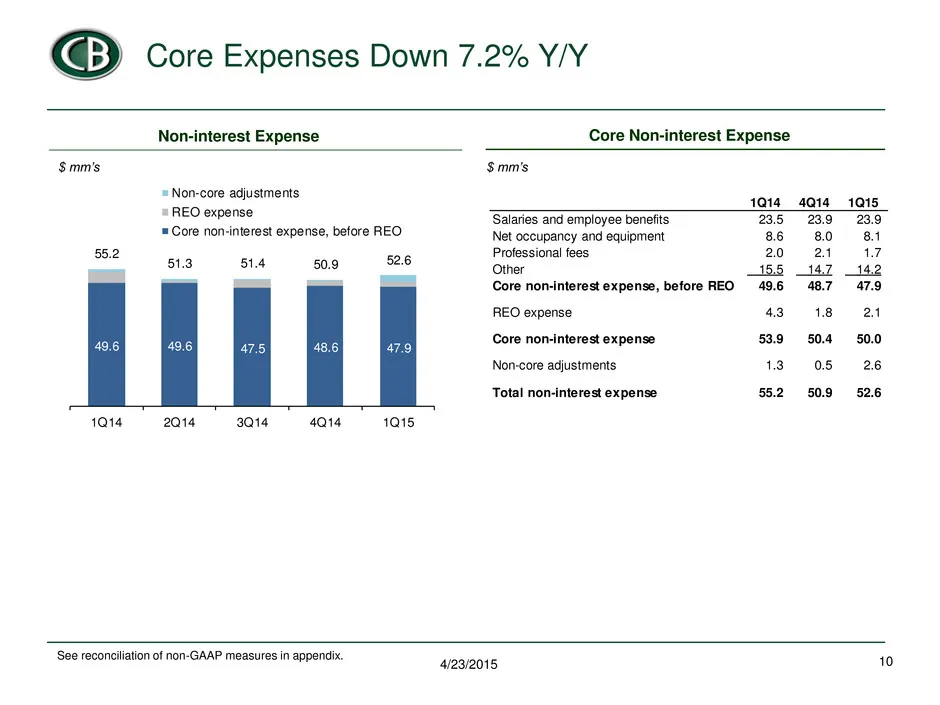
Slide 10: Core Expenses Down 7.2% Y/Y
Core Expenses Down 7.2% Y/Y 10 4/23/2015 Core Non-interest Expense $ mm’s See reconciliation of non-GAAP measures in appendix. Non-interest Expense 49.6 49.6 47.5 48.6 47.9 55.2 51.3 51.4 50.9 52.6 1Q14 2Q14 3Q14 4Q14 1Q15 Non-core adjustments REO expense Core non-interest expense, before REO 1Q14 4
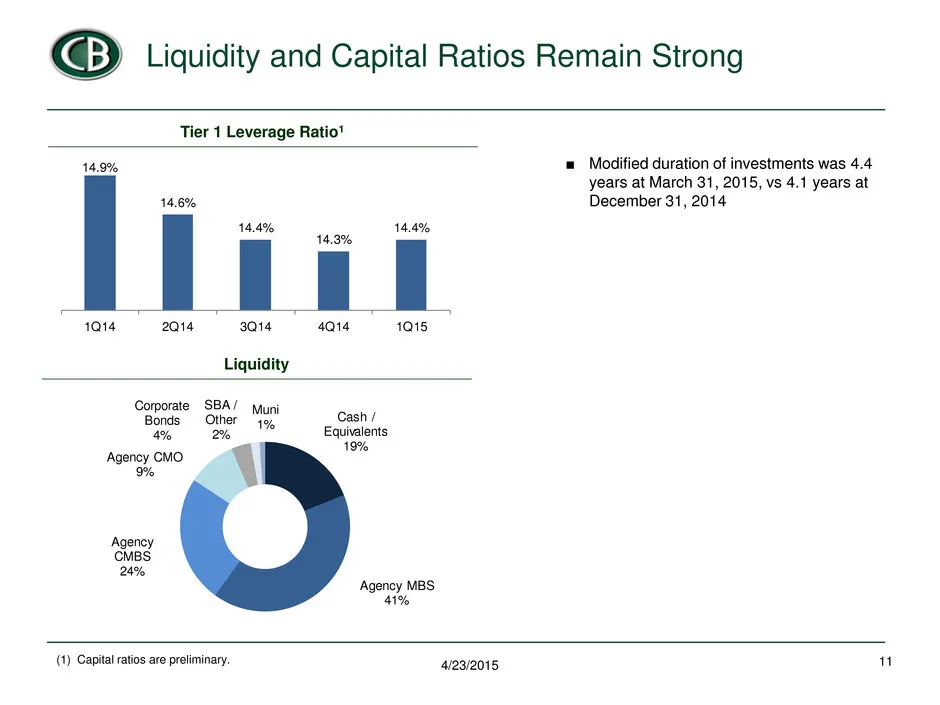
Slide 11: Liquidity and Capital Ratios Remain Strong
Liquidity and Capital Ratios Remain Strong 11 4/23/2015 ■ Modified duration of investments was 4.4 years at March 31, 2015, vs 4.1 years at December 31, 2014 Tier 1 Leverage Ratio1 (1) Capital ratios are preliminary. Liquidity Cash / Equivalents 19% Agency MBS 41% Agency CMBS 24% Agency CMO 9% Corpo
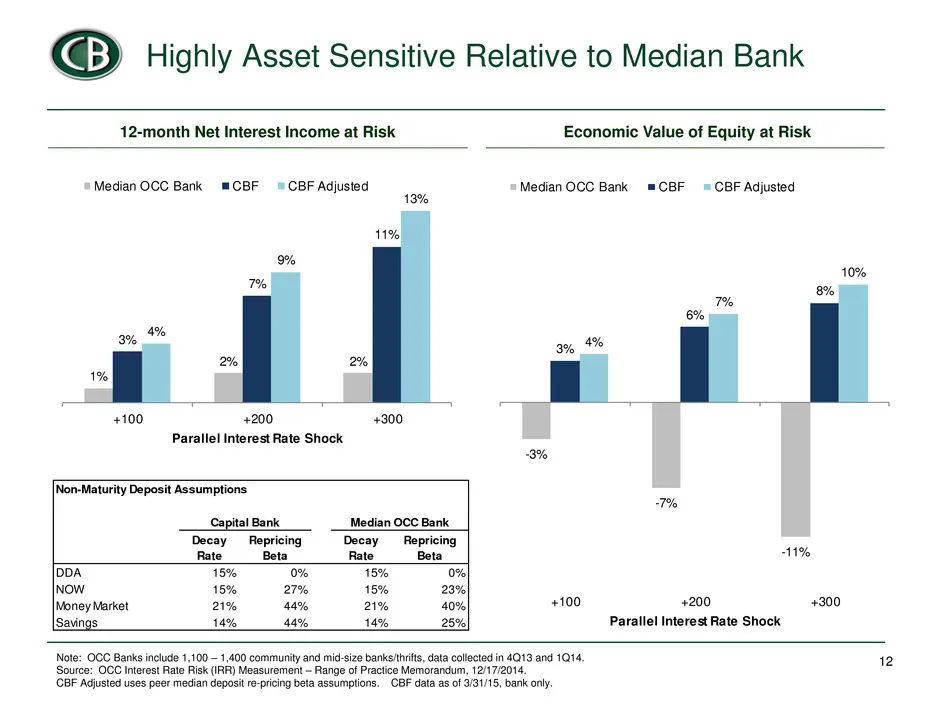
Slide 12: Highly Asset Sensitive Relative to Median Bank
Highly Asset Sensitive Relative to Median Bank 12 12-month Net Interest Income at Risk Economic Value of Equity at Risk Note: OCC Banks include 1,100 – 1,400 community and mid-size banks/thrifts, data collected in 4Q13 and 1Q14. Source: OCC Interest Rate Risk (IRR) Measurement – Range of Practice Me
Slide 13: Path to Profitability Target
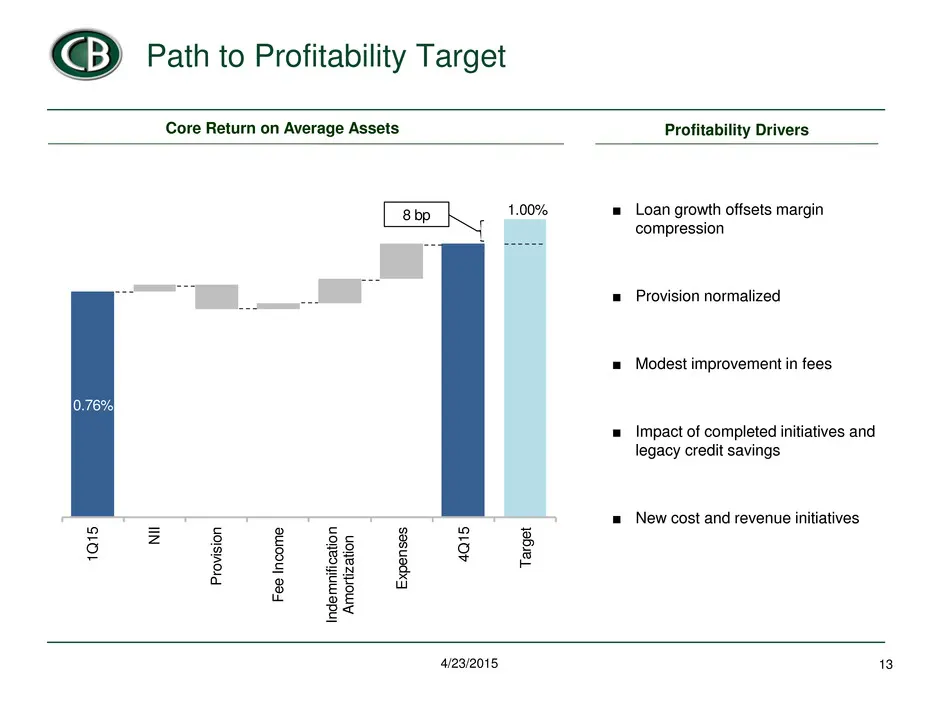
Path to Profitability Target 13 4/23/2015 Core Return on Average Assets ■ Loan growth offsets margin compression ■ Provision normalized ■ Modest improvement in fees ■ Impact of completed initiatives and legacy credit savings ■ New cost and revenue initiatives Profitability Drivers 0.76% 1.00% 1Q 15
Slide 14: New Loan Portfolio Performing Strongly
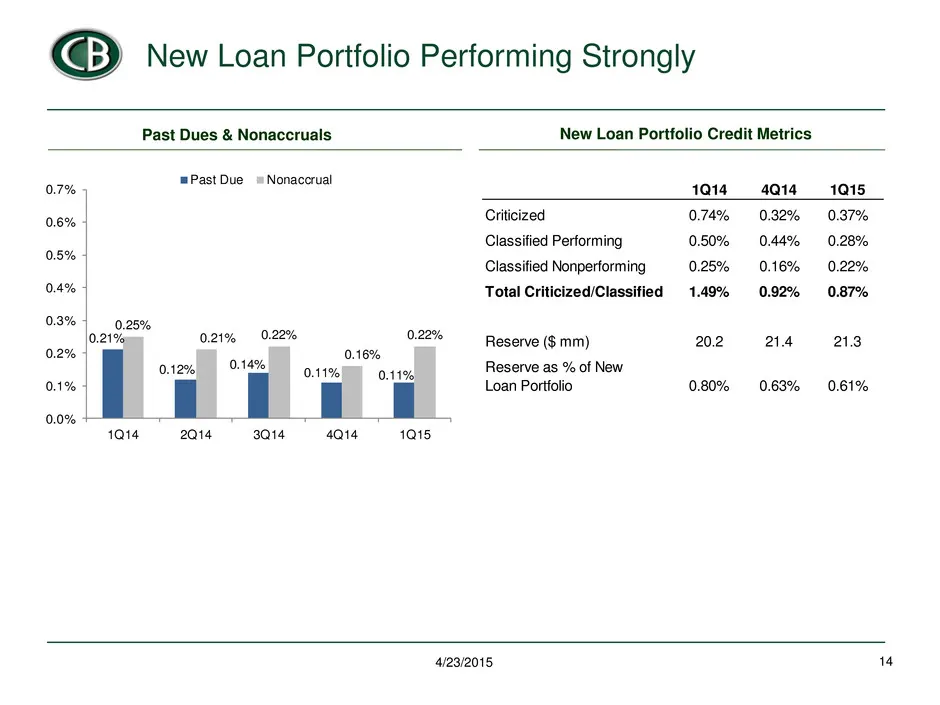
New Loan Portfolio Performing Strongly 14 4/23/2015 New Loan Portfolio Credit Metrics Past Dues & Nonaccruals 0.21% 0.12% 0.14% 0.11% 0.11% 0.25% 0.21% 0.22% 0.16% 0.22% 0.0% 0.1% 0.2% 0.3% 0.4% 0.5% 0.6% 0.7% 1Q14 2Q14 3Q14 4Q14 1Q15 Past Due Nonaccrual 1Q14 4Q14 1Q15 Criticized 0.74% 0.32% 0.37% C
Slide 15: Special Assets Down 59% Since 2012
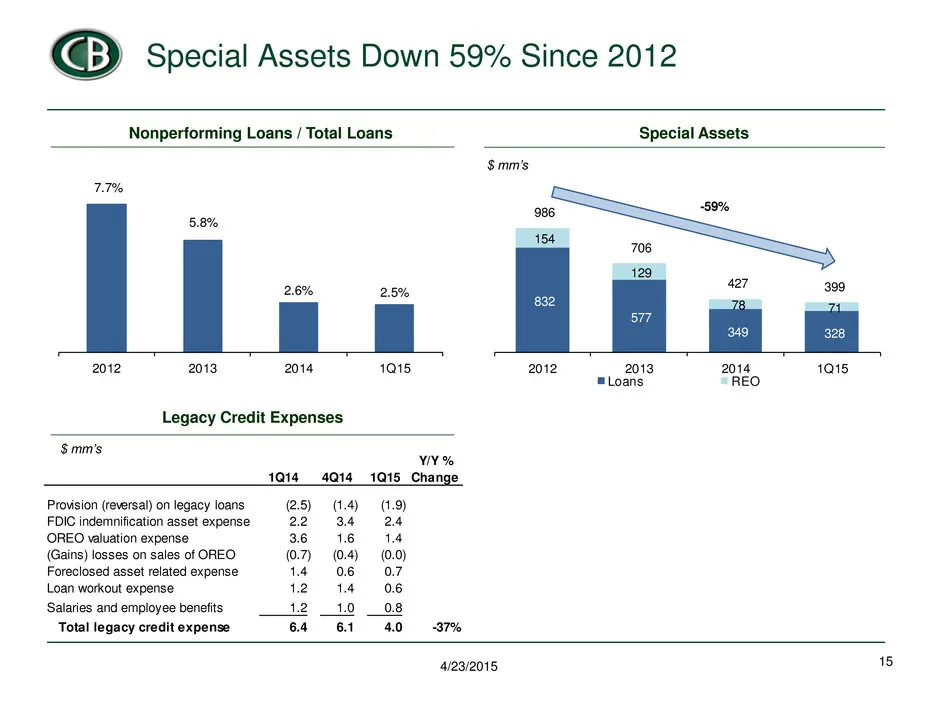
1Q14 4Q14 1Q15 Provision (reversal) on legacy loans (2.5) (1.4) (1.9) FDIC indemnification asset expense 2.2 3.4 2.4 OREO valuation expense 3.6 1.6 1.4 (Gains) losses on sales of OREO (0.7) (0.4) (0.0) Foreclosed asset related expense 1.4 0.6 0.7 Loan workout expense 1.2 1.4 0.6 Salaries and employe
Slide 16: Capital Bank Investment Highlights
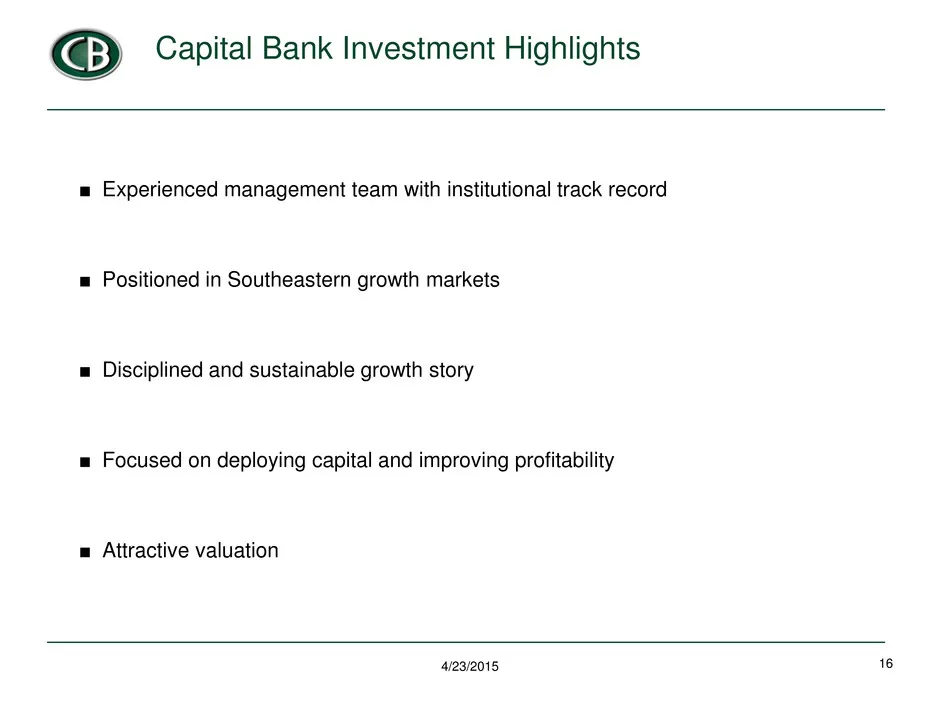
16 Capital Bank Investment Highlights ■ Experienced management team with institutional track record ; ■ Positioned in Southeastern growth markets ■ Disciplined and sustainable growth story ■ Focused on deploying capital and improving profitability ■ Attractive valuation 4/23/2015
Slide 17: Appendix
Appendix 17 4/23/2015
Slide 18: Reconciliation of Core Noninterest Income / Expense
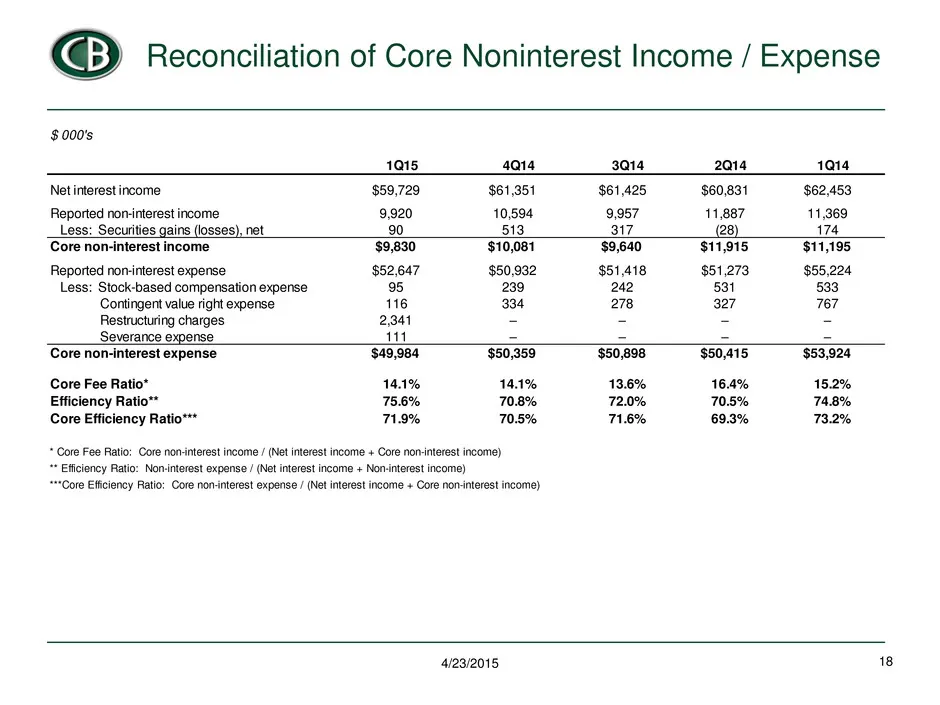
Reconciliation of Core Noninterest Income / Expense 18 4/23/2015 $ 000's 1Q15 4Q14 3Q14 2Q14 1Q14 Net interest income $59,729 $61,351 $61,425 $60,831 $62,453 Reported non-interest income 9,920 10,594 9,957 11,887 11,369 Less: Securities gains (losses), net 90 513 317 (28) 174 Core non-interest incom
Slide 19: Reconciliation of Core Net Income
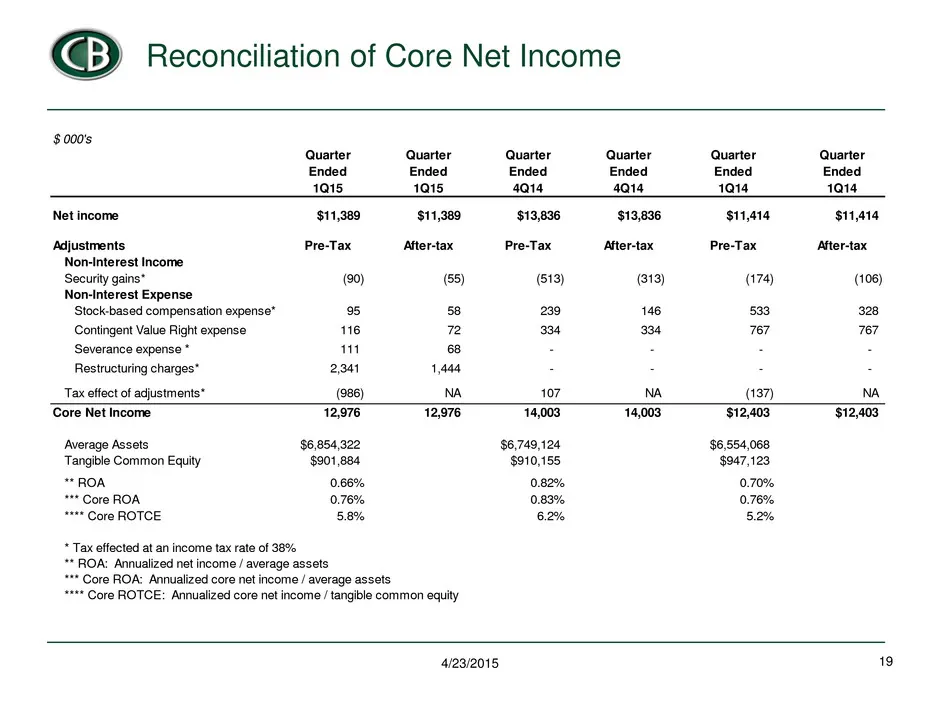
Reconciliation of Core Net Income 19 4/23/2015 $ 000's Quarter Quarter Quarter Quarter Quarter Quarter Ended Ended Ended Ended Ended Ended 1Q15 1Q15 4Q14 4Q14 1Q14 1Q14 $11,389 $11,389 $13,836 $13,836 $11,414 $11,414 Pre-Tax After-tax Pre-Tax After-tax Pre-Tax After-tax Non-Interest Income Security
Slide 20: Tangible Book Value
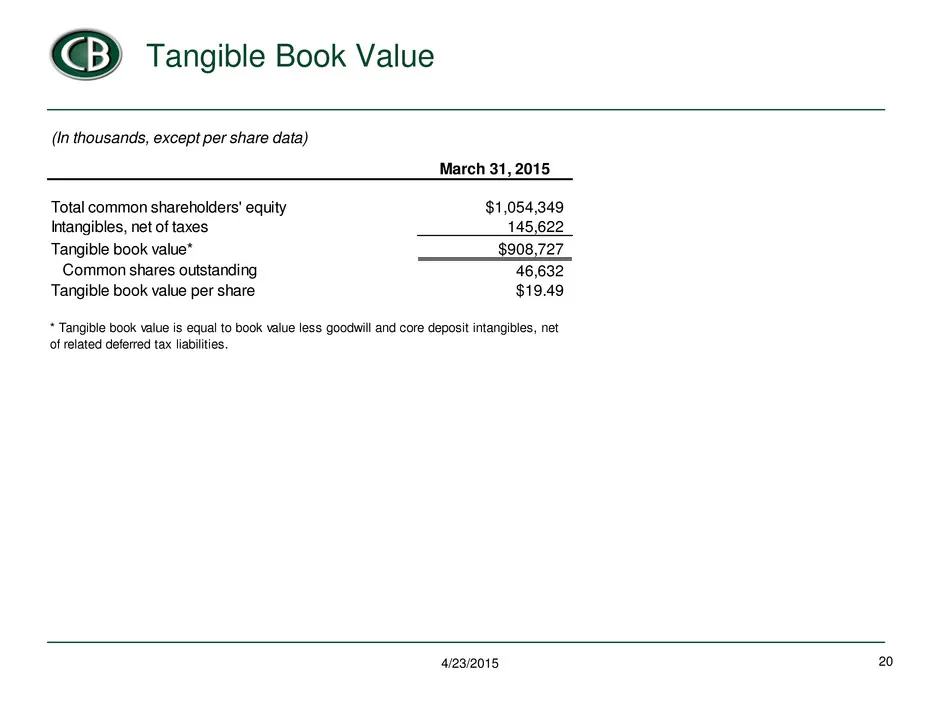
Tangible Book Value 20 4/23/2015 (In thousands, except per share data) March 31, 2015 Total common shareholders' equity $1,054,349 Intangibles, net of taxes 145,622 Tangible book value* $908,727 Common shares outstanding 46,632 Tangible book value per share $19.49 * Tangible book value is equal to b
Slide 21: Contractual Net Interest Margin
Contractual Net Interest Margin 21 4/23/2015 (1) Excludes purchase accounting adjustments $ 000s Average Earning Assets Net Interest Income Net Interest Margin March 31, 2015 Reported 6,168,668 66,572 3.96% Purchase accounting impact (73,831) 10,790 0.70% Contractual Net Interest Margin (1) 3.26% De
Source: SEC EDGAR · 8-K filed Apr 23, 2015
More decks from Capital Bank Financial Corp
 Q2 2017 Earnings Presentation22 slides · Jul 14, 2017
 Morgan Stanley Financial Services Conference 201715 slides · Jun 13, 2017
 Merger or Acquisition (June 2017)27 slides · Jun 6, 2017
 Merger or Acquisition (May 2017)17 slides · May 4, 2017
 Q1 2017 Earnings Presentation21 slides · Apr 21, 2017
 Q4 2016 Earnings Presentation25 slides · Jan 26, 2017