Burke & Herbert Financial Services Corp. · NASDAQ:BHRB
Burke & Herbert Financial Services — Q1 2023 Earnings Presentation
18 slides from Burke & Herbert Financial Services's earnings presentation, May 2023
Slide 1: 1Q23 Update
1Q23 Update (Nasdaq: BHRB) May 2023 1
Slide 2: Cautionary Statement Regarding Forward-Looking Information
Cautionary Statement Regarding Forward-Looking Information This presentation contains statements within the meaning of the Private Securities Litigation Reform Act of 1995. Forward-looking statements are neither historical facts nor assurances of future performance. Instead, they are based on curren
Slide 3: Introduction
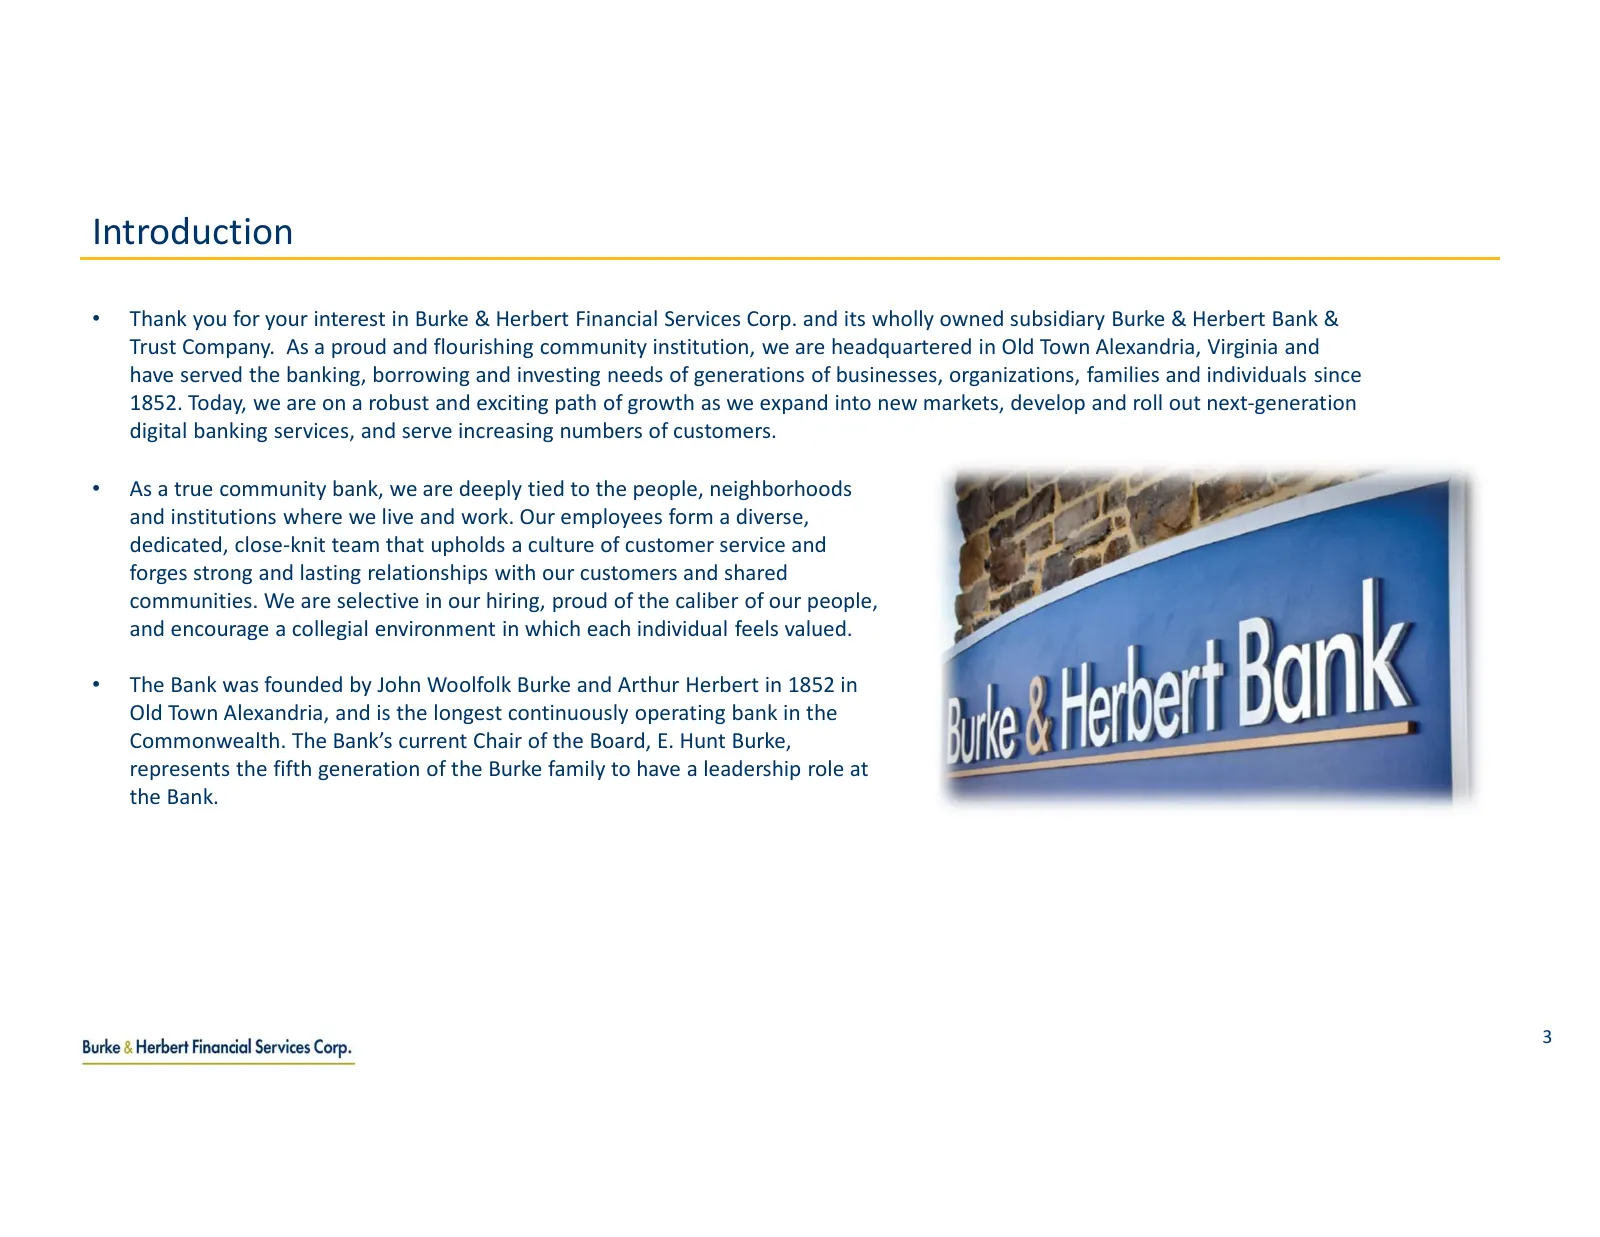
Introduction • Thank you for your interest in Burke & Herbert Financial Services Corp. and its wholly owned subsidiary Burke & Herbert Bank & Trust Company. As a proud and flourishing community institution, we are headquartered in Old Town Alexandria, Virginia and have served the banking, borrowing
Slide 4: Key Takeaways
Key Takeaways • Burke & Herbert Financial Services Corp. was established in September 2022 as the holding company for Burke & Herbert Bank & Trust Company, which has been offering banking services in Northern Virginia since 1852 • We have a seasoned executive management team and an experienced Board
Slide 5: Executive Team
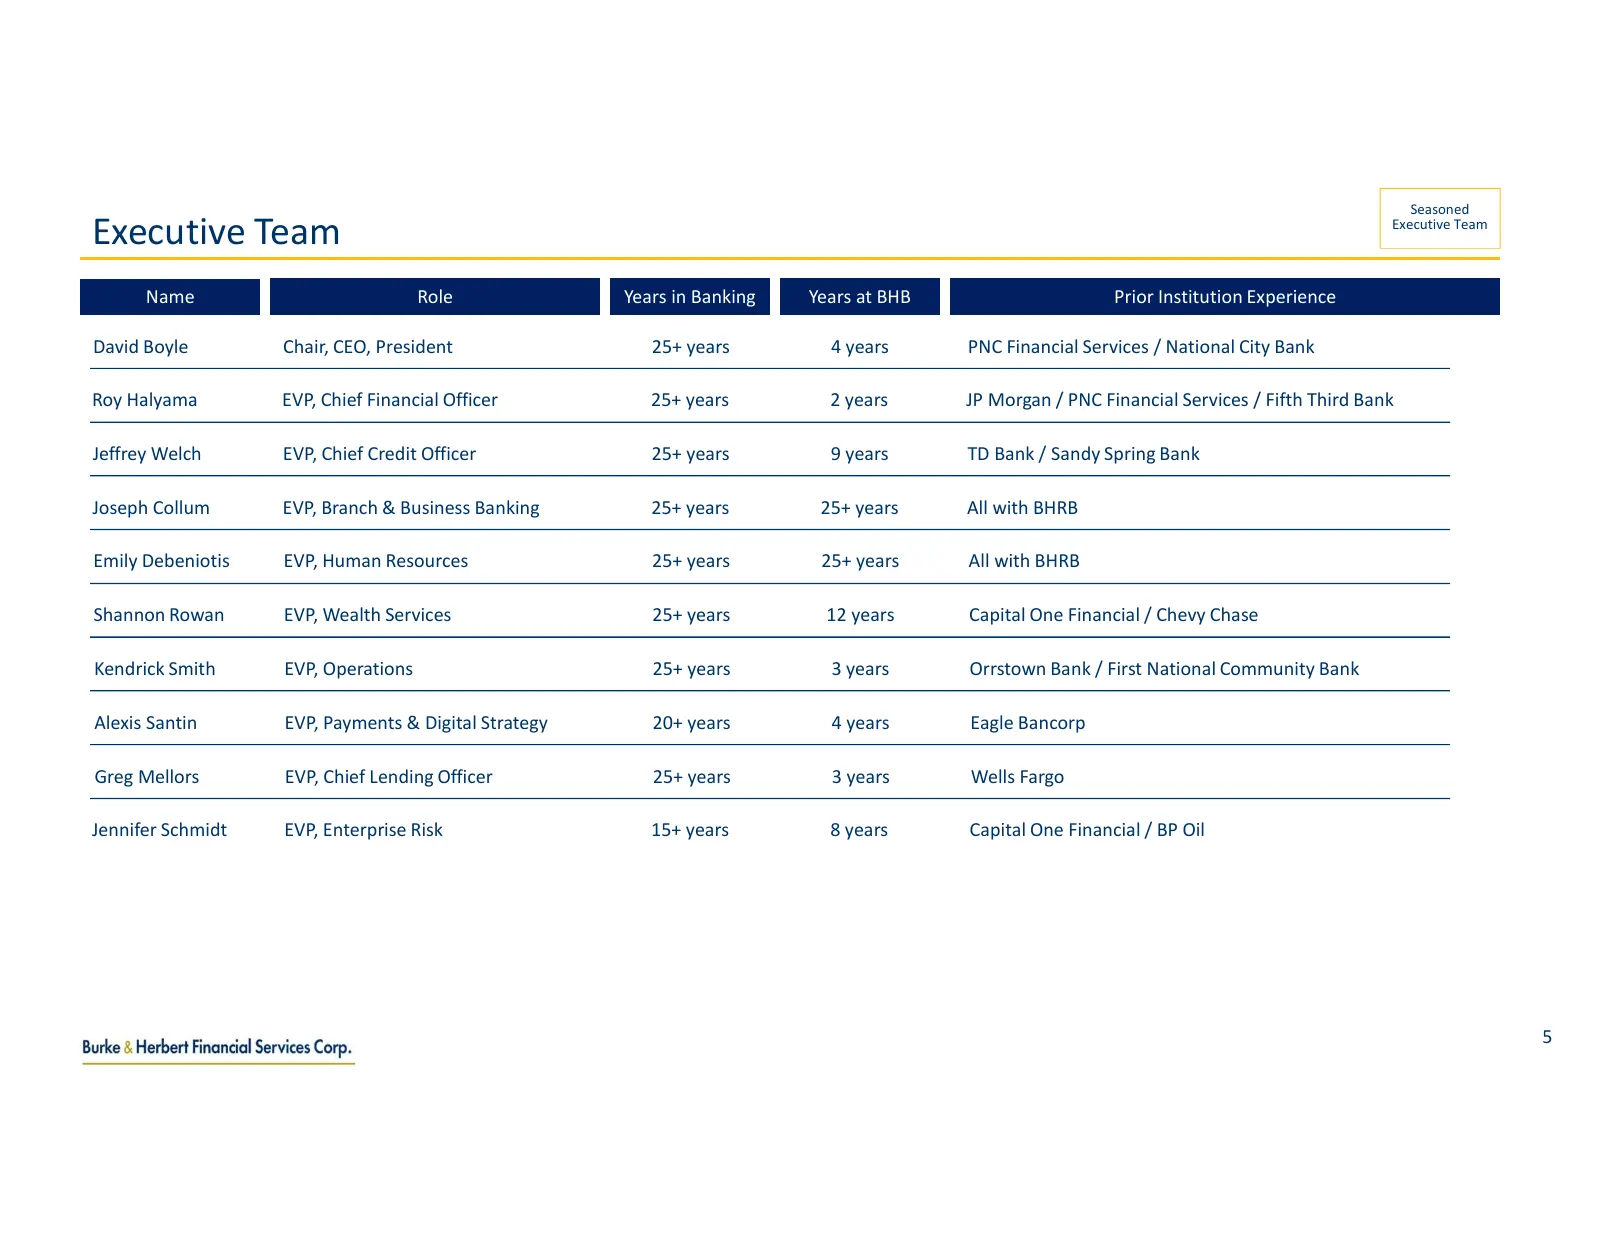
Seasoned Executive Team Executive Team Name Role Years in Banking Years at BHB Prior Institution Experience David Boyle Chair, CEO, President 25+ years 4 years PNC Financial Services / National City Bank Roy Halyama EVP, Chief Financial Officer 25+ years 2 years JP Morgan / PNC Financial Services /
Slide 6: Company Overview & Financial Performance
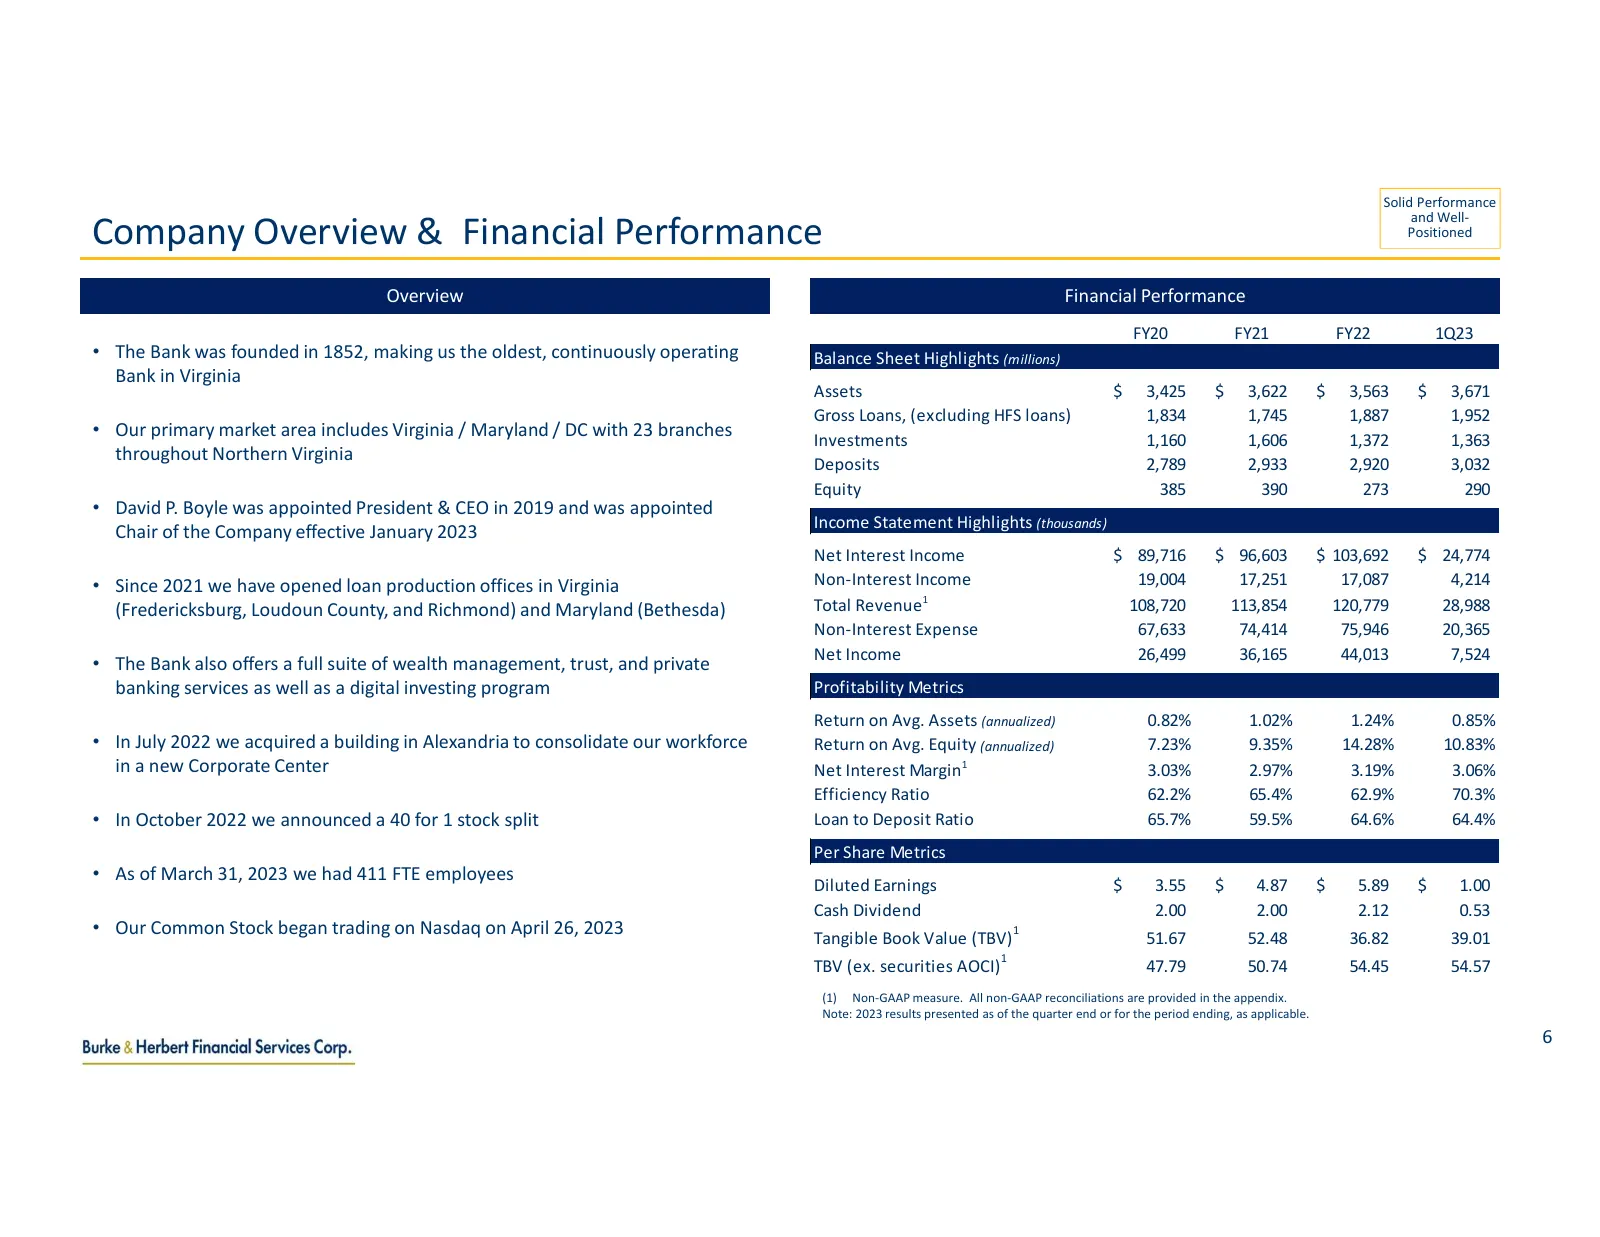
Solid Performance Company Overview & Financial Performance and Well- Positioned Overview Financial Performance FY20 FY21 FY22 1Q23 • The Bank was founded in 1852, making us the oldest, continuously operating Balance Sheet Highlights (millions) Bank in Virginia Assets $ 3,425 $ 3,622 $ 3,563 $ 3,671
Slide 7: Loan Portfolio as of 1Q23
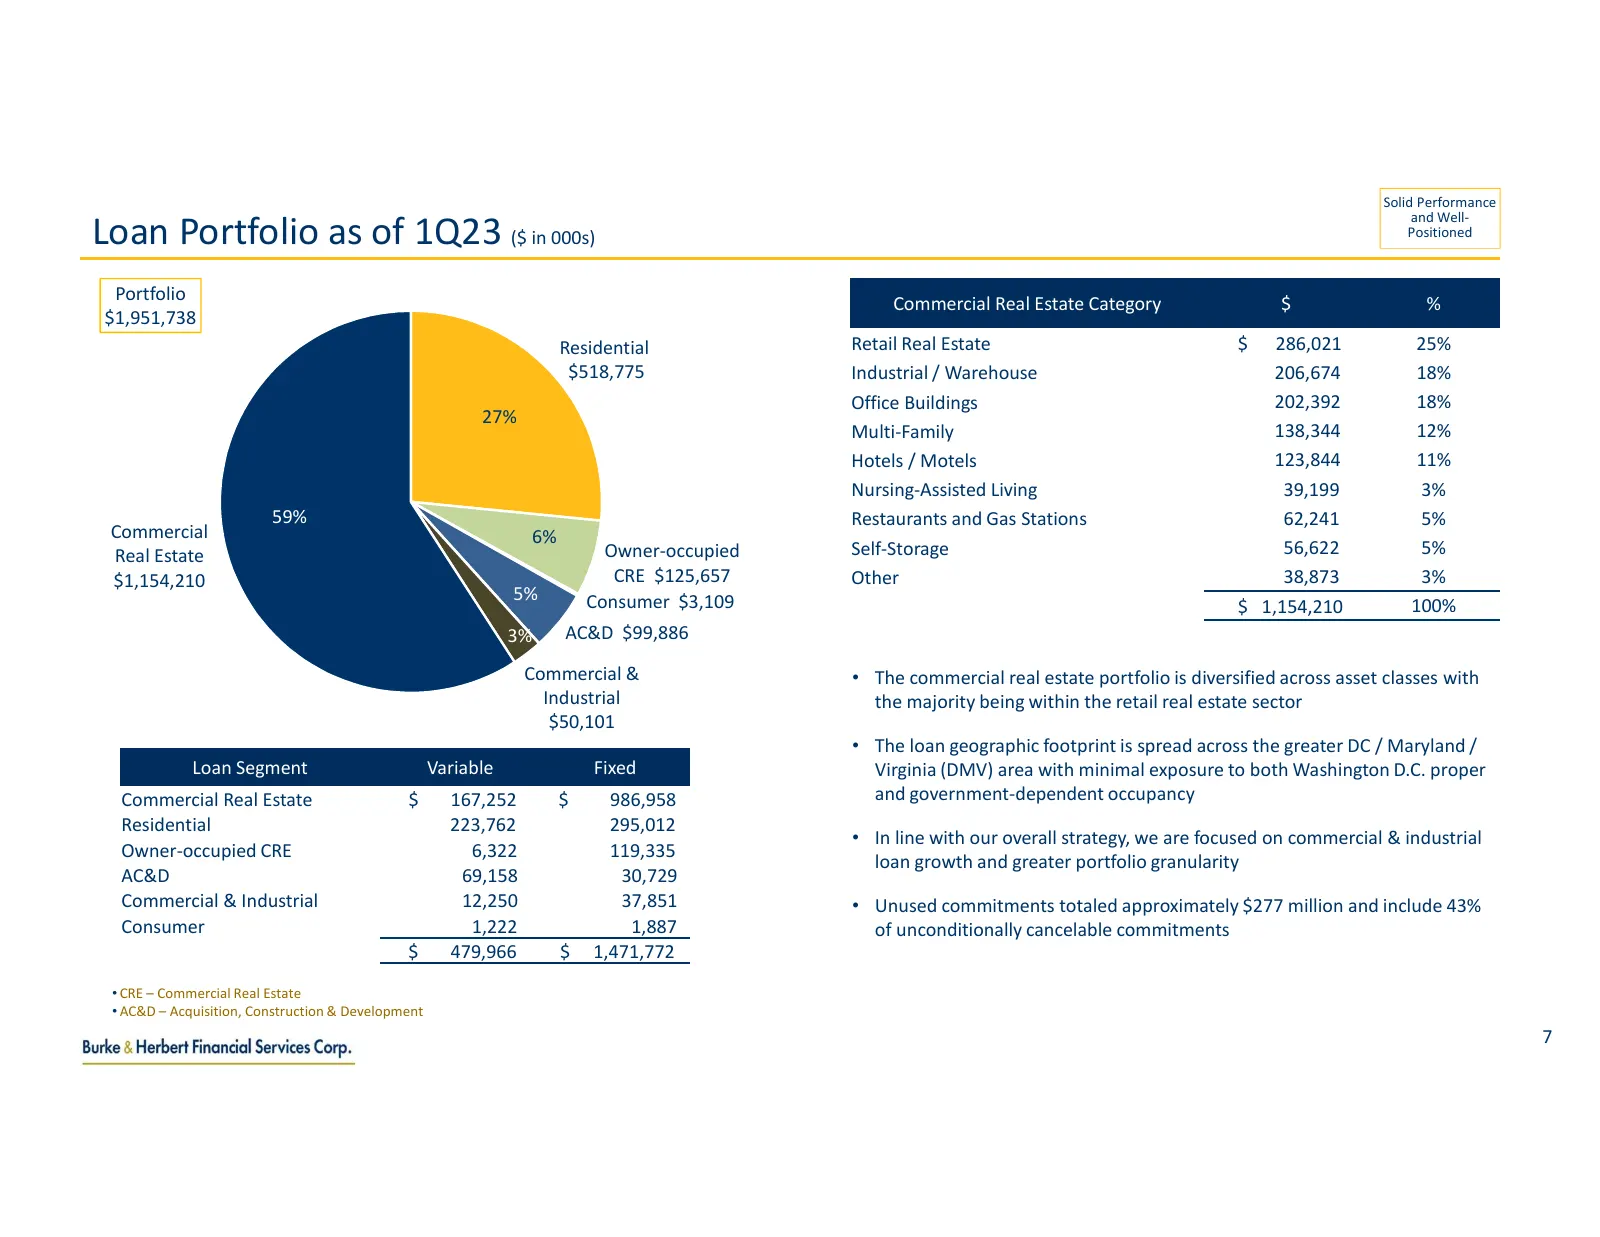
Solid Performance Loan Portfolio as of 1Q23 ($ in 000s) and Well- Positioned Portfolio Commercial Real Estate Category $ % $1,951,738 Residential Retail Real Estate $ 286,021 25% $518,775 Industrial / Warehouse 206,674 18% Office Buildings 202,392 18% 27% Multi-Family 138,344 12% Hotels / Motels 123
Slide 8: Security Portfolio as of 1Q23
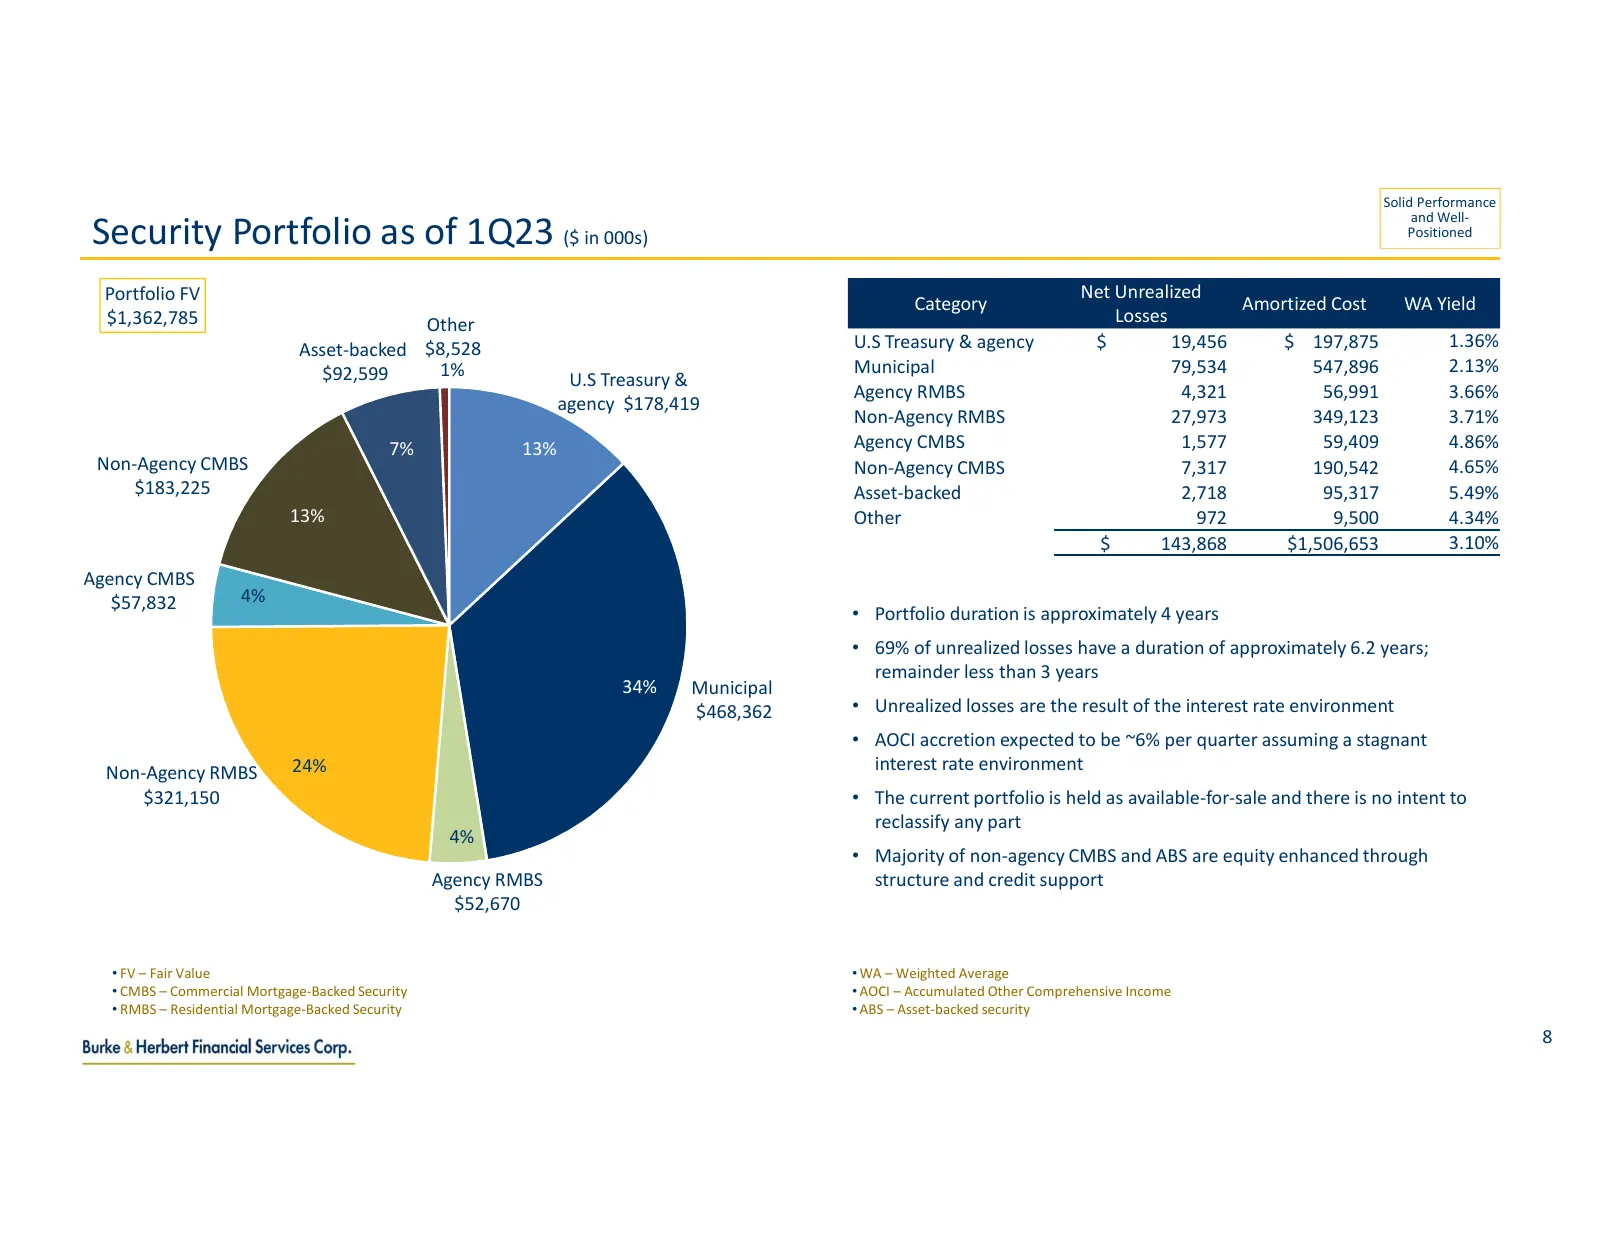
Solid Performance Security Portfolio as of 1Q23 ($ in 000s) and Well- Positioned Portfolio FV Net Unrealized Category Amortized Cost WA Yield $1,362,785 Other Losses Asset-backed $8,528 U.S Treasury & agency $ 19,456 $ 197,875 1.36% $92,599 1% Municipal 79,534 547,896 2.13% U.S Treasury & Agency RMB
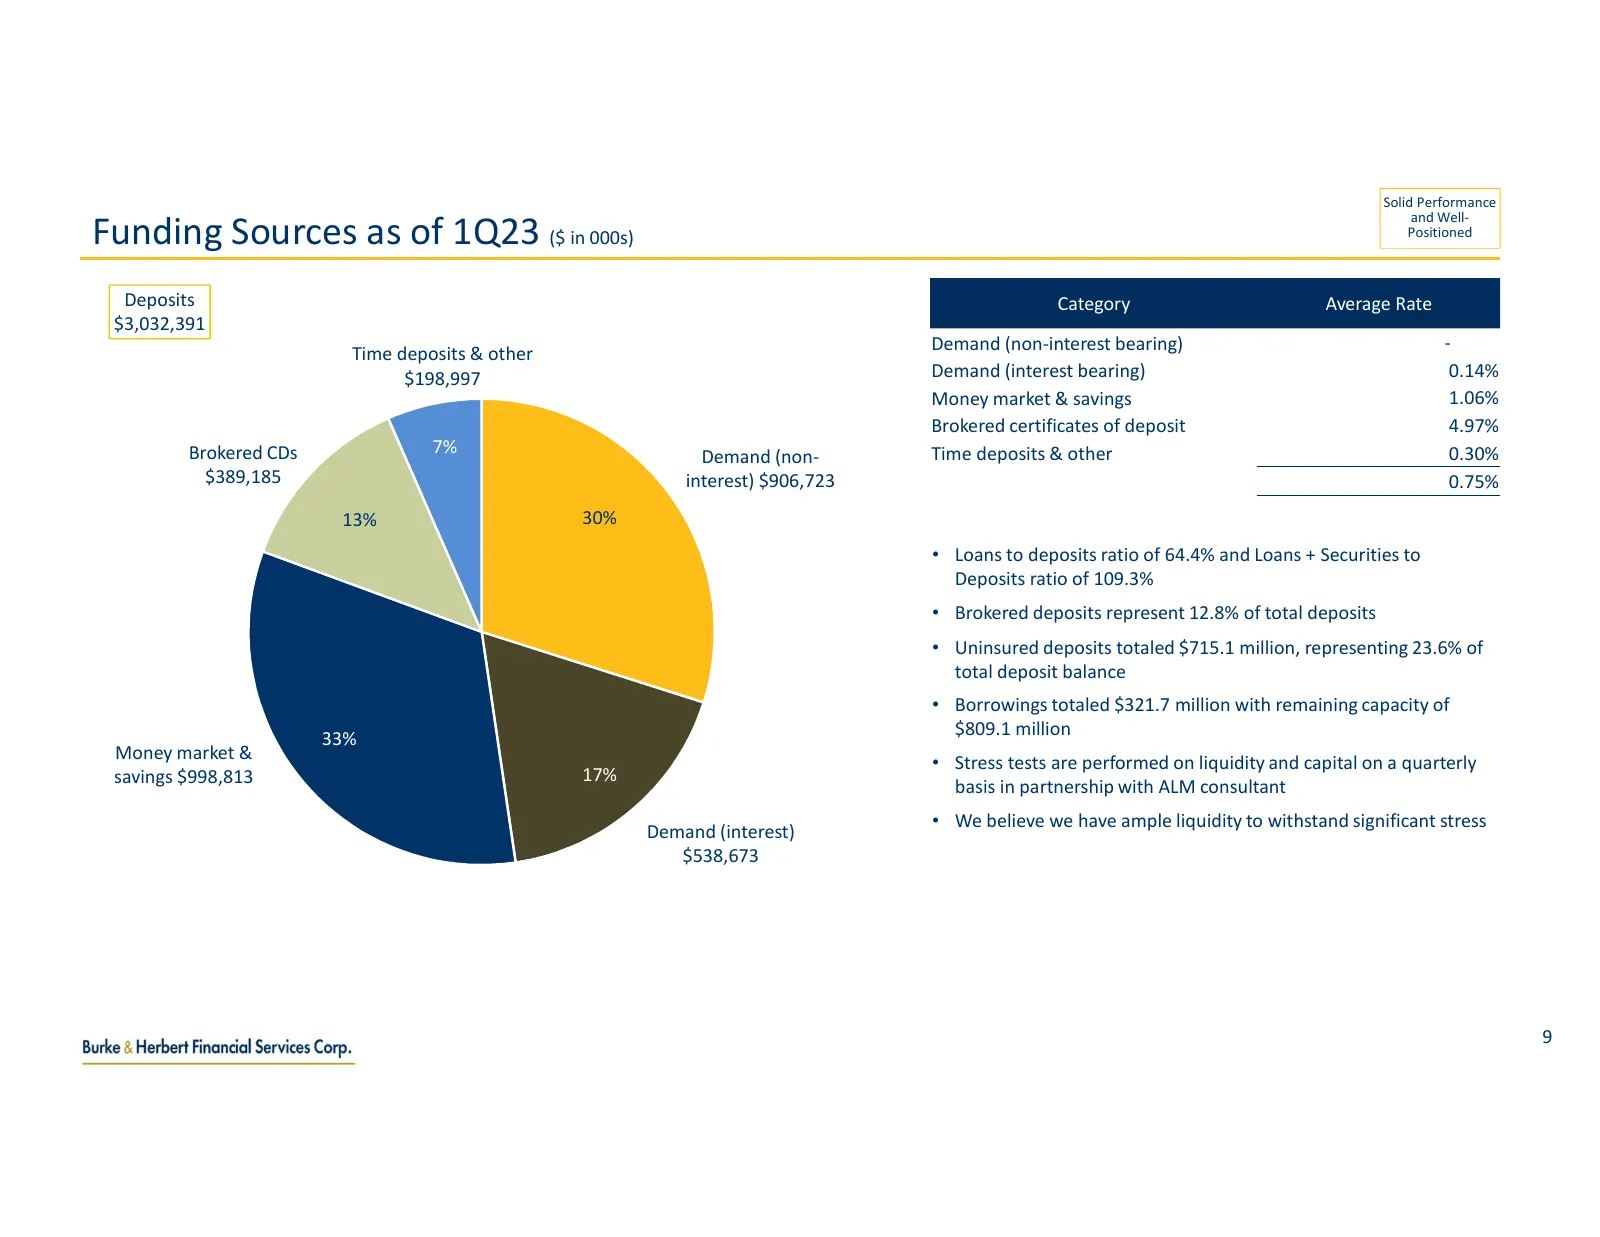
Slide 9: Funding Sources as of 1Q23
Solid Performance Funding Sources as of 1Q23 ($ in 000s) and Well- Positioned Deposits Category Average Rate $3,032,391 Demand (non-interest bearing) - Time deposits & other $198,997 Demand (interest bearing) 0.14% Money market & savings 1.06% Brokered certificates of deposit 4.97% Brokered CDs 7% T
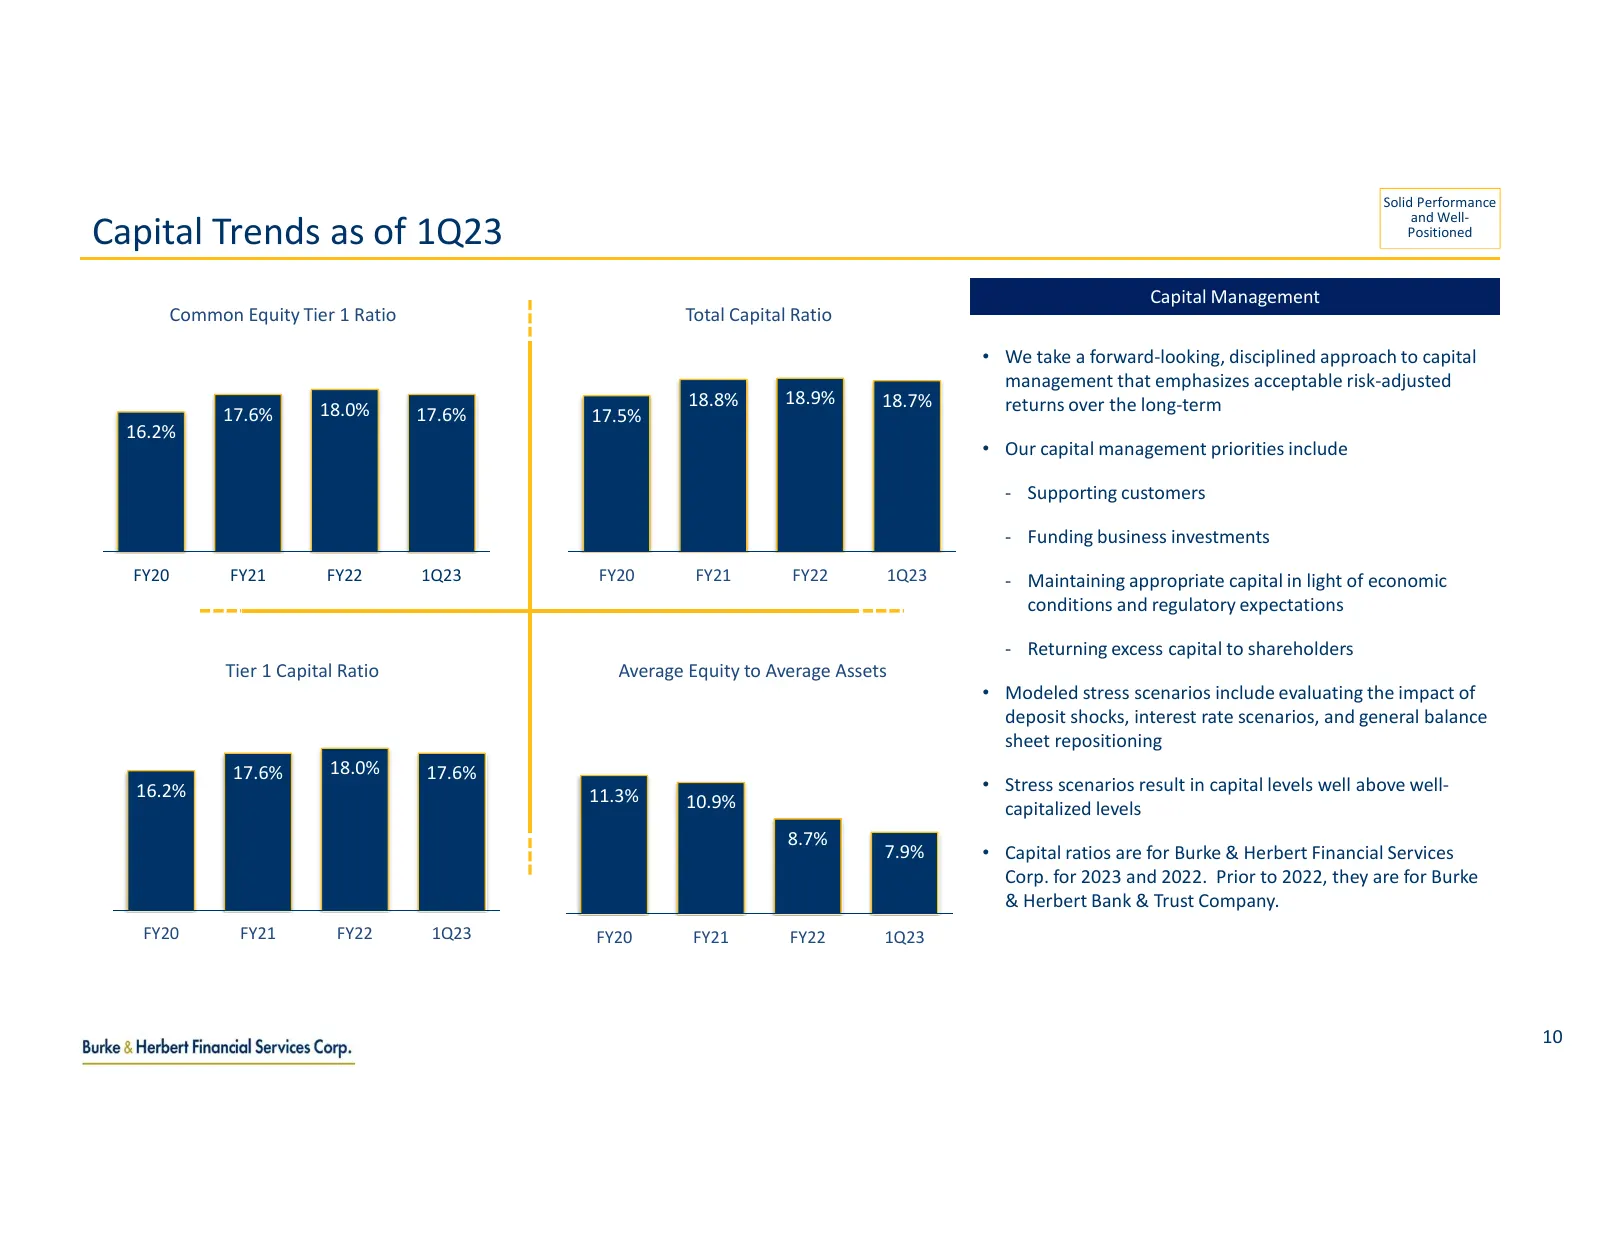
Slide 10: Capital Trends as of 1Q23
Solid Performance Capital Trends as of 1Q23 and Well- Positioned Capital Management Common Equity Tier 1 Ratio Total Capital Ratio • We take a forward-looking, disciplined approach to capital management that emphasizes acceptable risk-adjusted 18.8% 18.9% 18.7% returns over the long-term 17.6% 18.0%
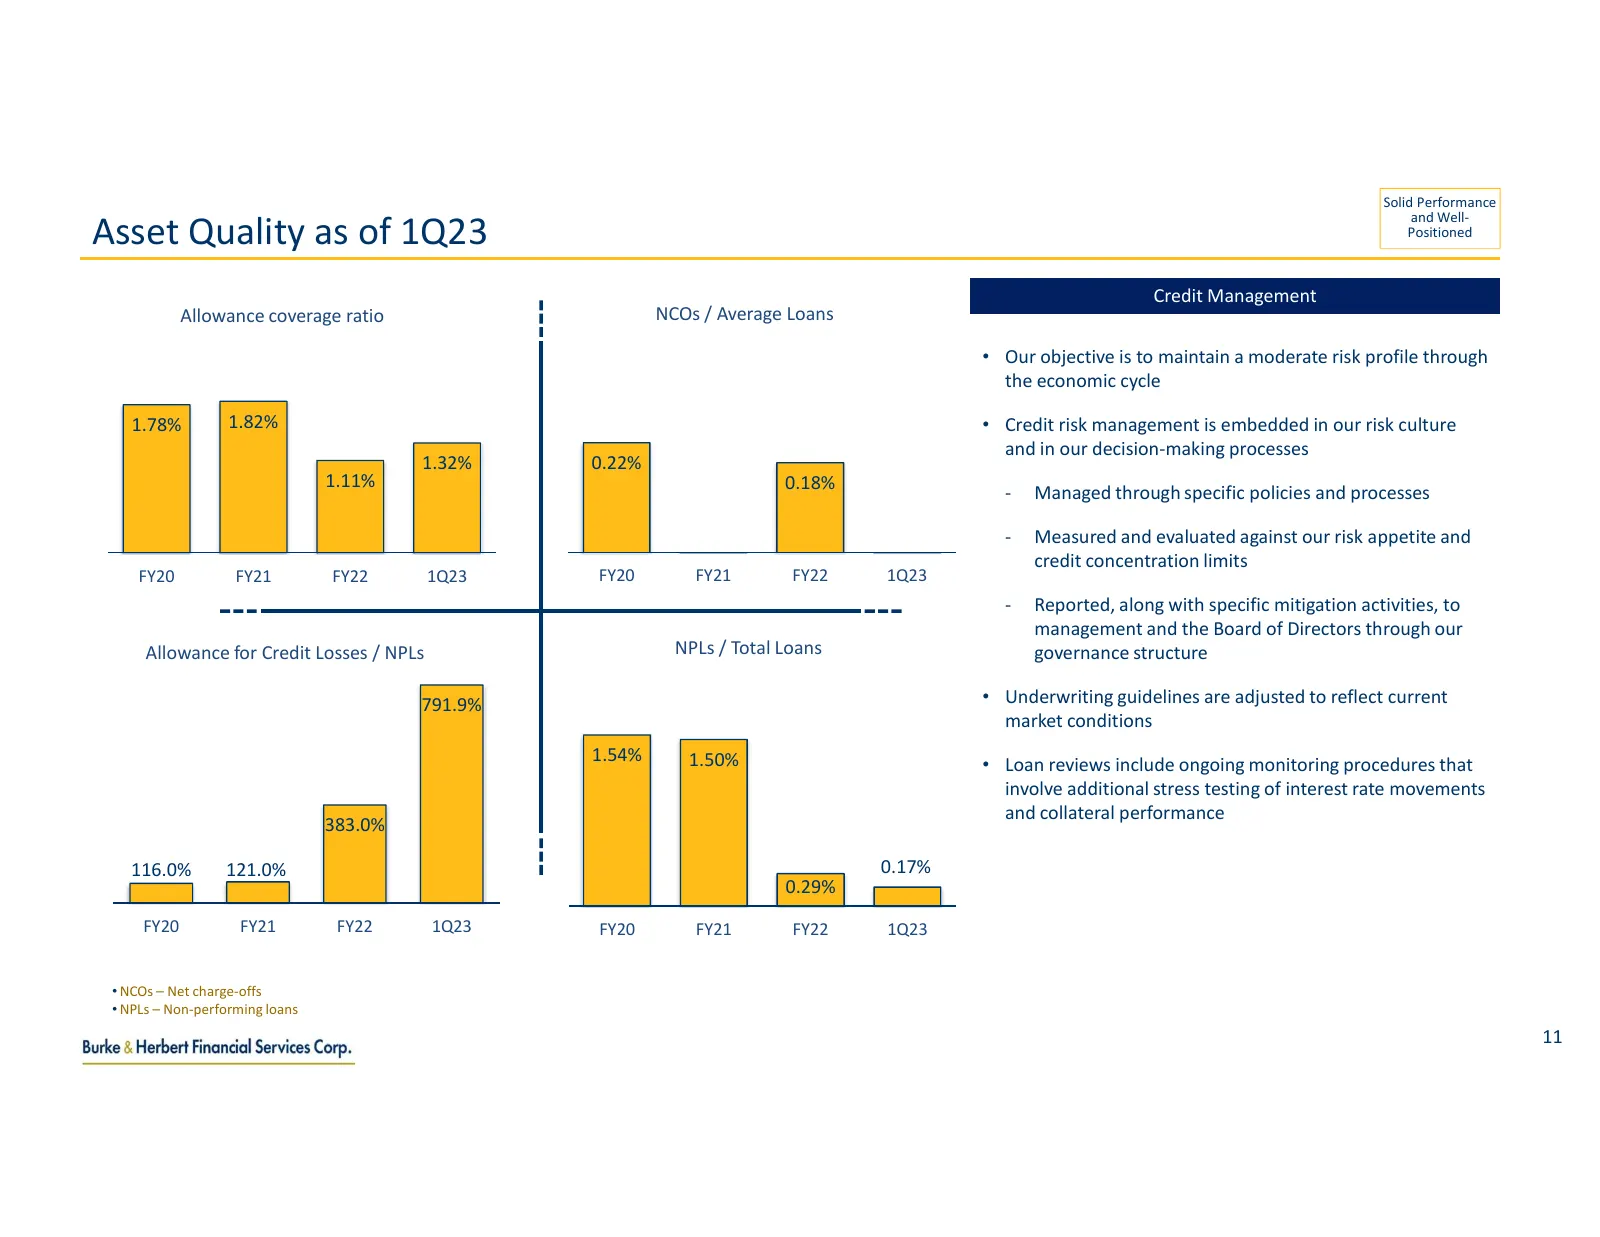
Slide 11: Asset Quality as of 1Q23
Solid Performance Asset Quality as of 1Q23 and Well- Positioned Credit Management Allowance coverage ratio NCOs / Average Loans • Our objective is to maintain a moderate risk profile through the economic cycle 1.78% 1.82% • Credit risk management is embedded in our risk culture and in our decision-m
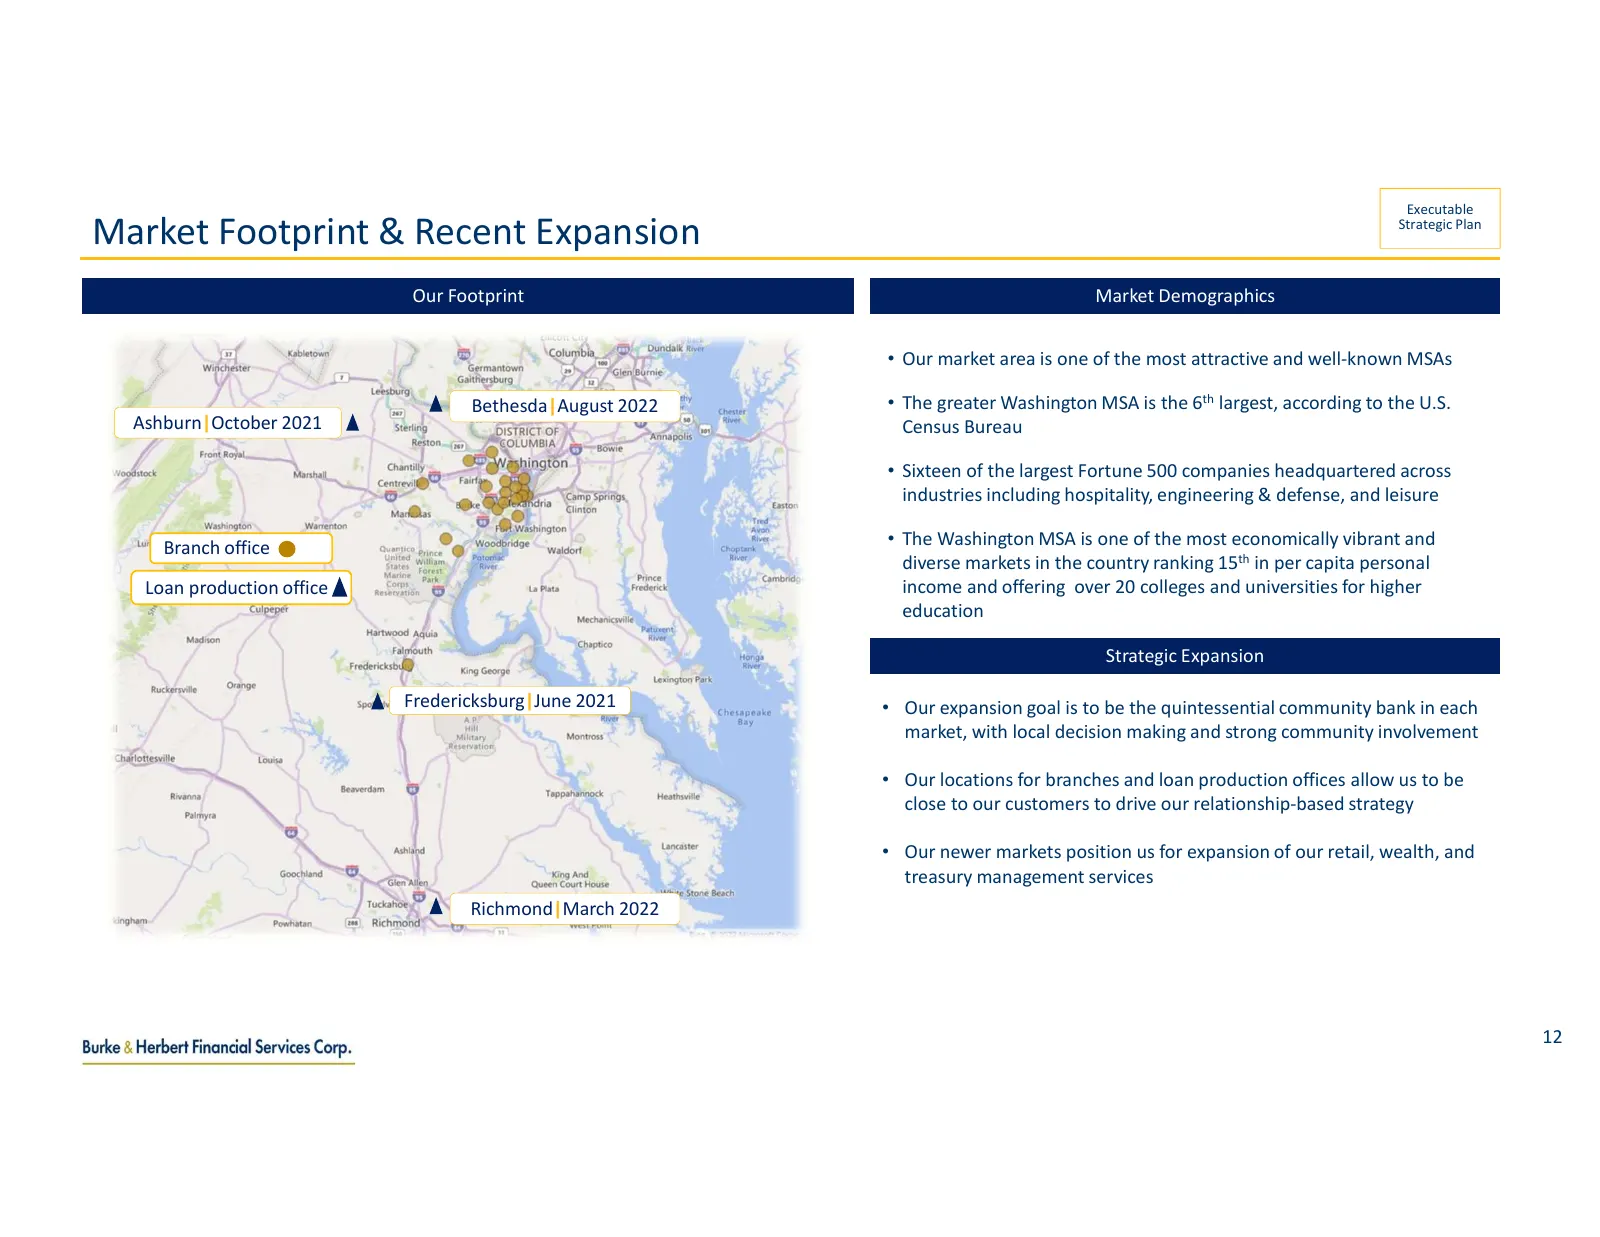
Slide 12: Market Footprint & Recent Expansion
Executable Market Footprint & Recent Expansion Strategic Plan Our Footprint Market Demographics • Our market area is one of the most attractive and well-known MSAs Bethesda|August 2022 • The greater Washington MSA is the 6th largest, according to the U.S. Ashburn|October 2021 Census Bureau • Sixteen
Slide 13: Transforming Digital Capabilities
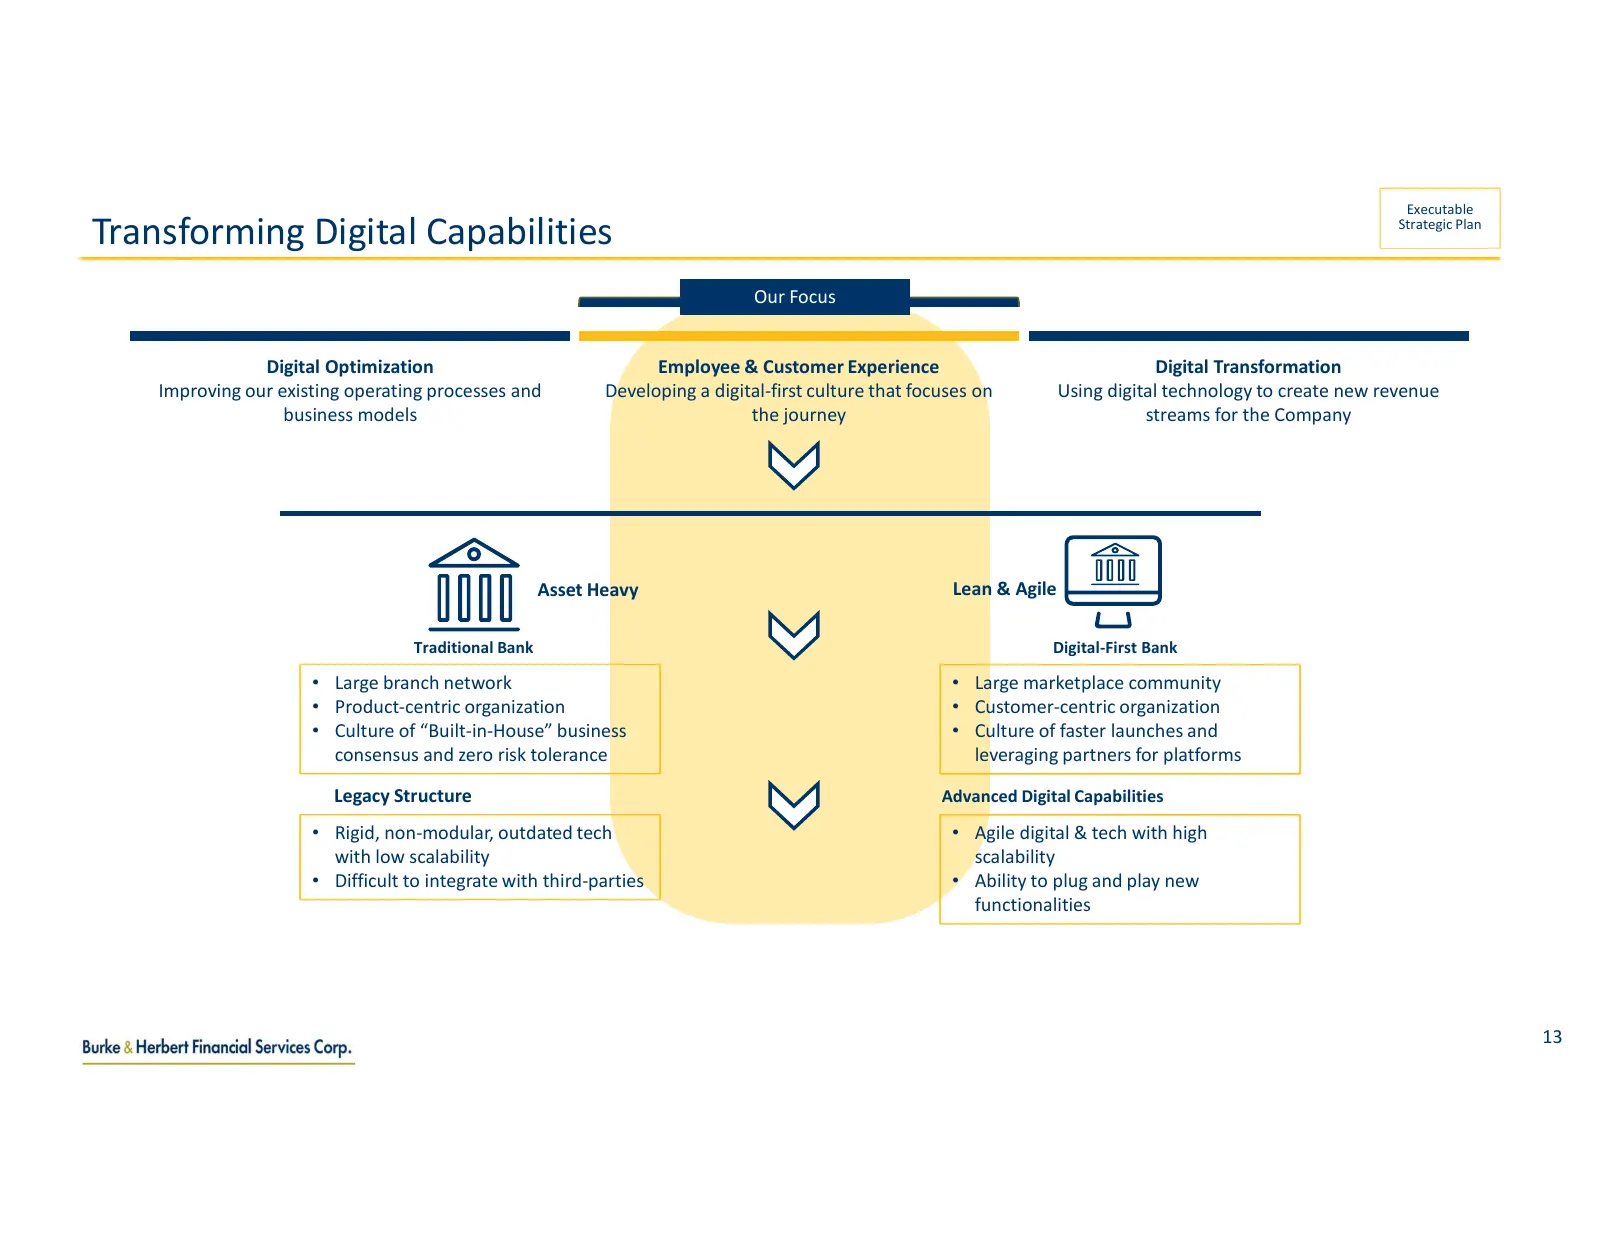
Executable Transforming Digital Capabilities Strategic Plan Our Focus Digital Optimization Employee & Customer Experience Digital Transformation Improving our existing operating processes and Developing a digital-first culture that focuses on Using digital technology to create new revenue business m
Slide 14: Fee-based Revenue
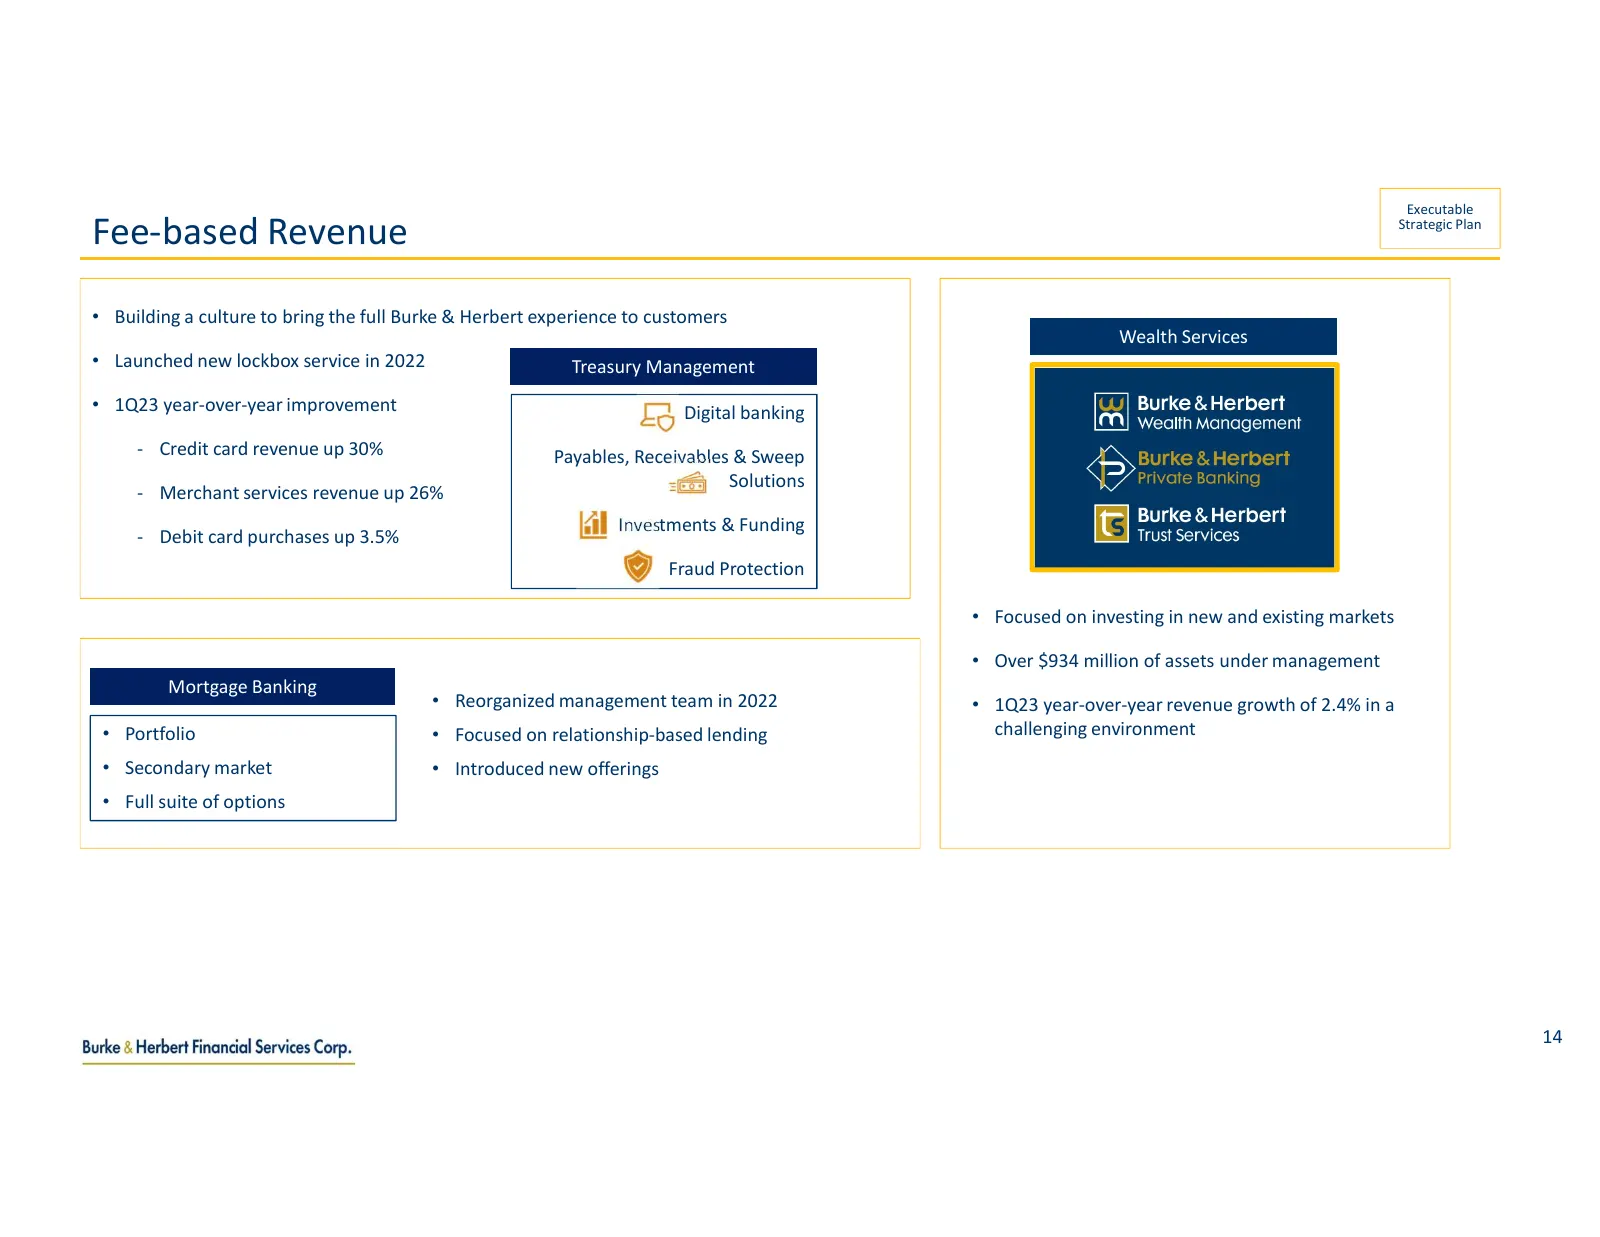
Executable Fee-based Revenue Strategic Plan • Building a culture to bring the full Burke & Herbert experience to customers Wealth Services • Launched new lockbox service in 2022 Treasury Management • 1Q23 year-over-year improvement Digital banking - Credit card revenue up 30% Payables, Receivables &
Slide 15: Final Thoughts
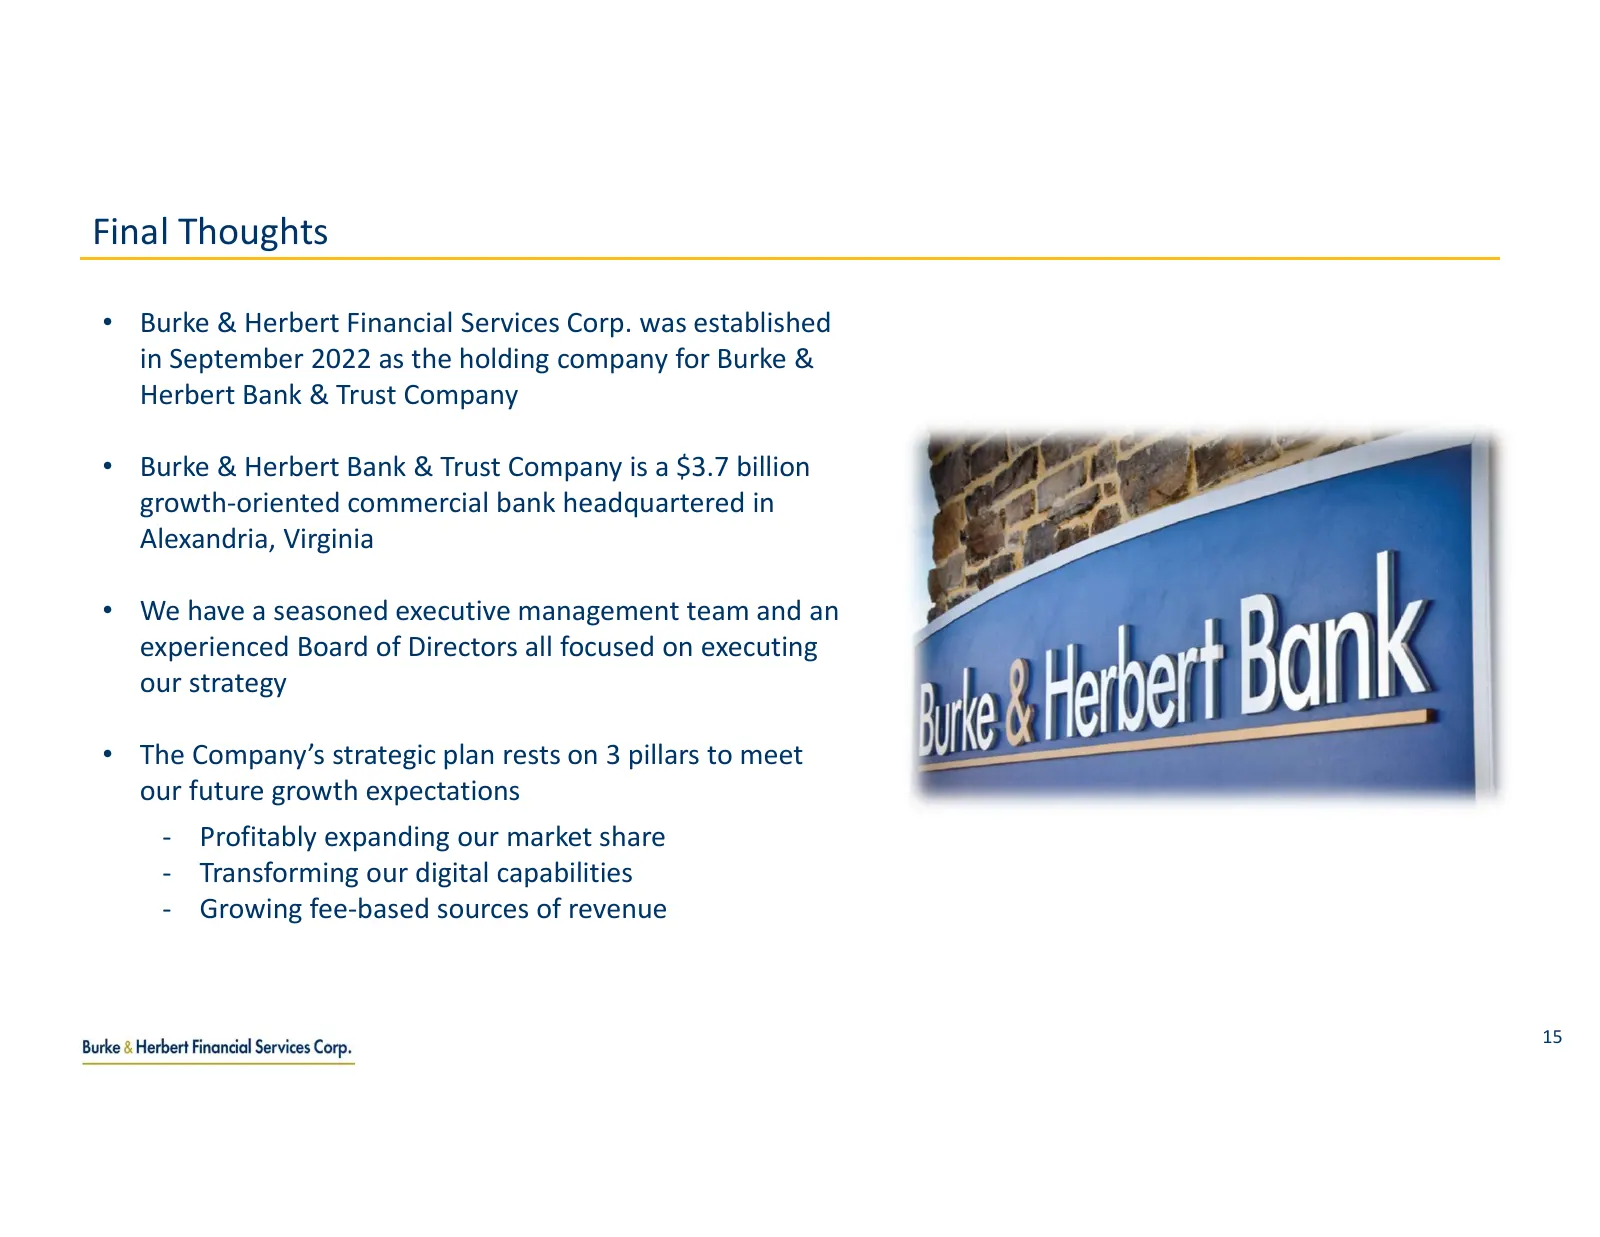
Final Thoughts • Burke & Herbert Financial Services Corp. was established in September 2022 as the holding company for Burke & Herbert Bank & Trust Company • Burke & Herbert Bank & Trust Company is a $3.7 billion growth-oriented commercial bank headquartered in Alexandria, Virginia • We have a seaso
Slide 16: Appendix: Notes on non-GAAP financial measures
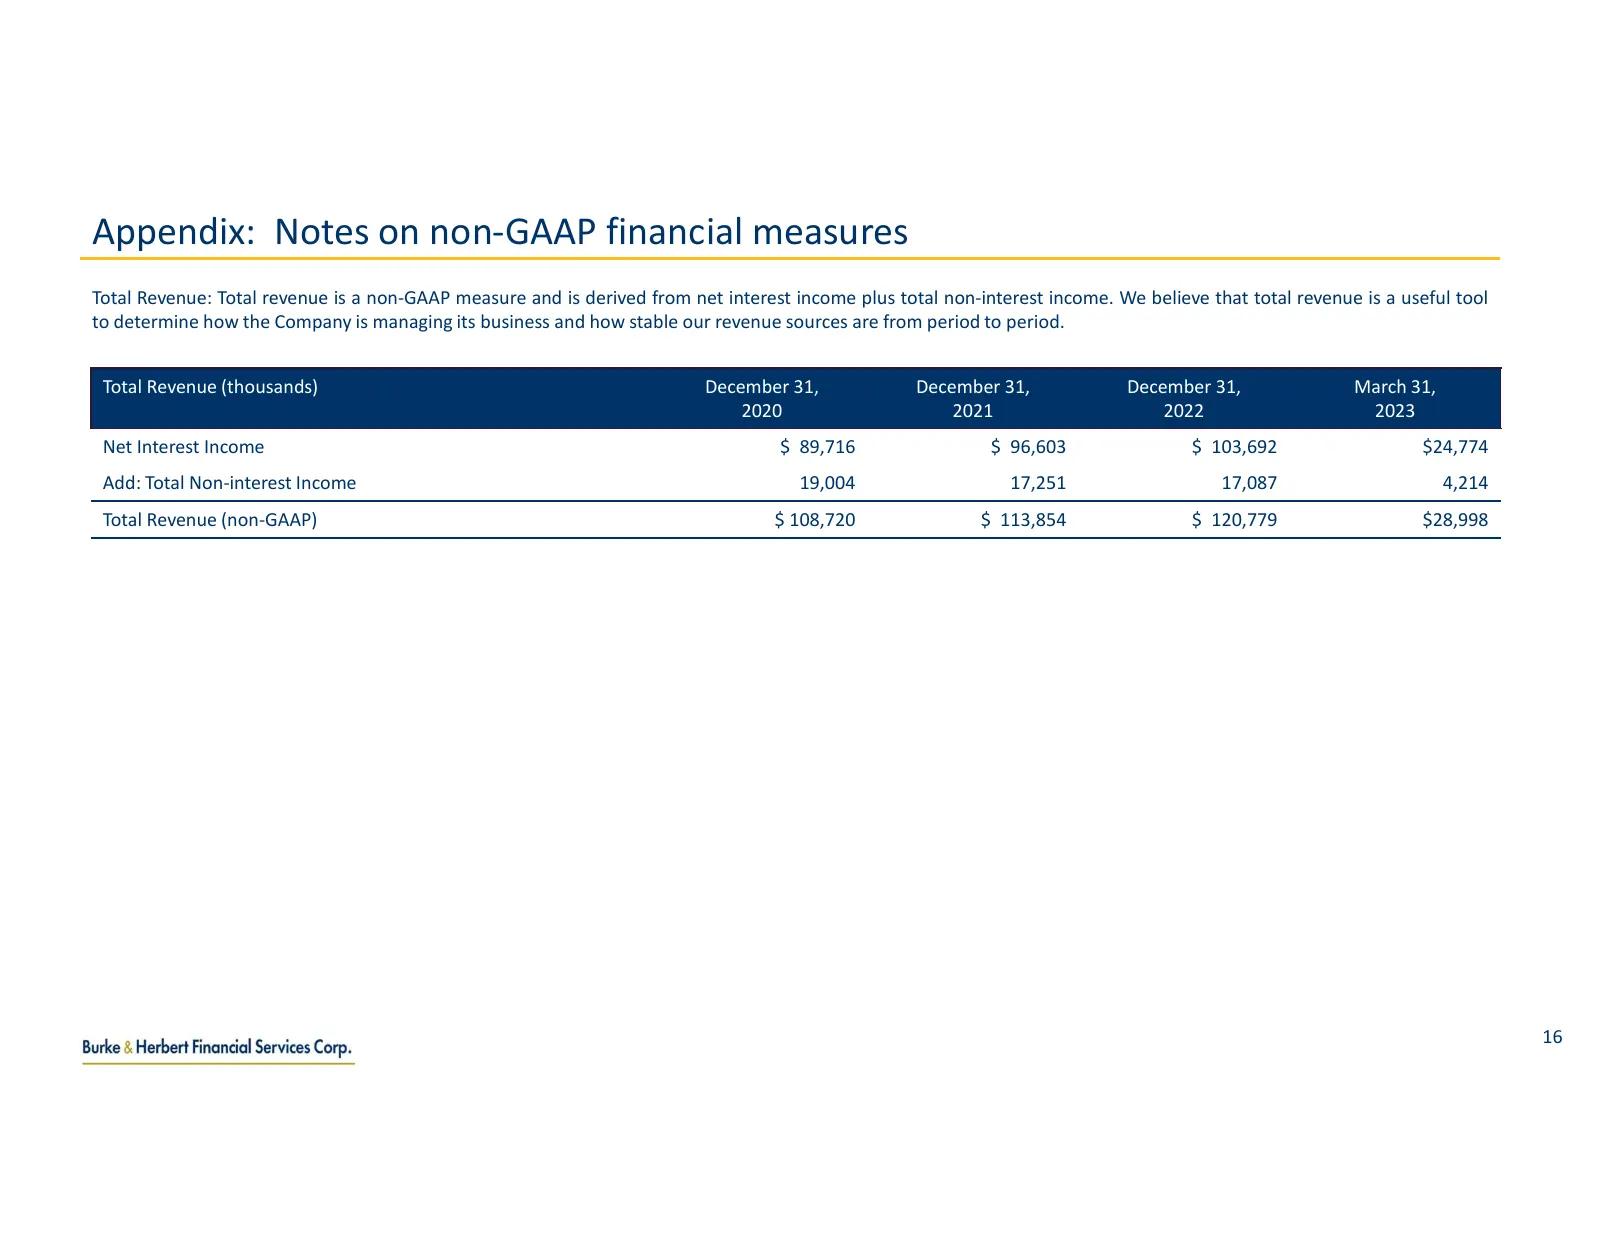
Appendix: Notes on non-GAAP financial measures Total Revenue: Total revenue is a non-GAAP measure and is derived from net interest income plus total non-interest income. We believe that total revenue is a useful tool to determine how the Company is managing its business and how stable our revenue so
Slide 17: Appendix: Notes on non-GAAP financial measures
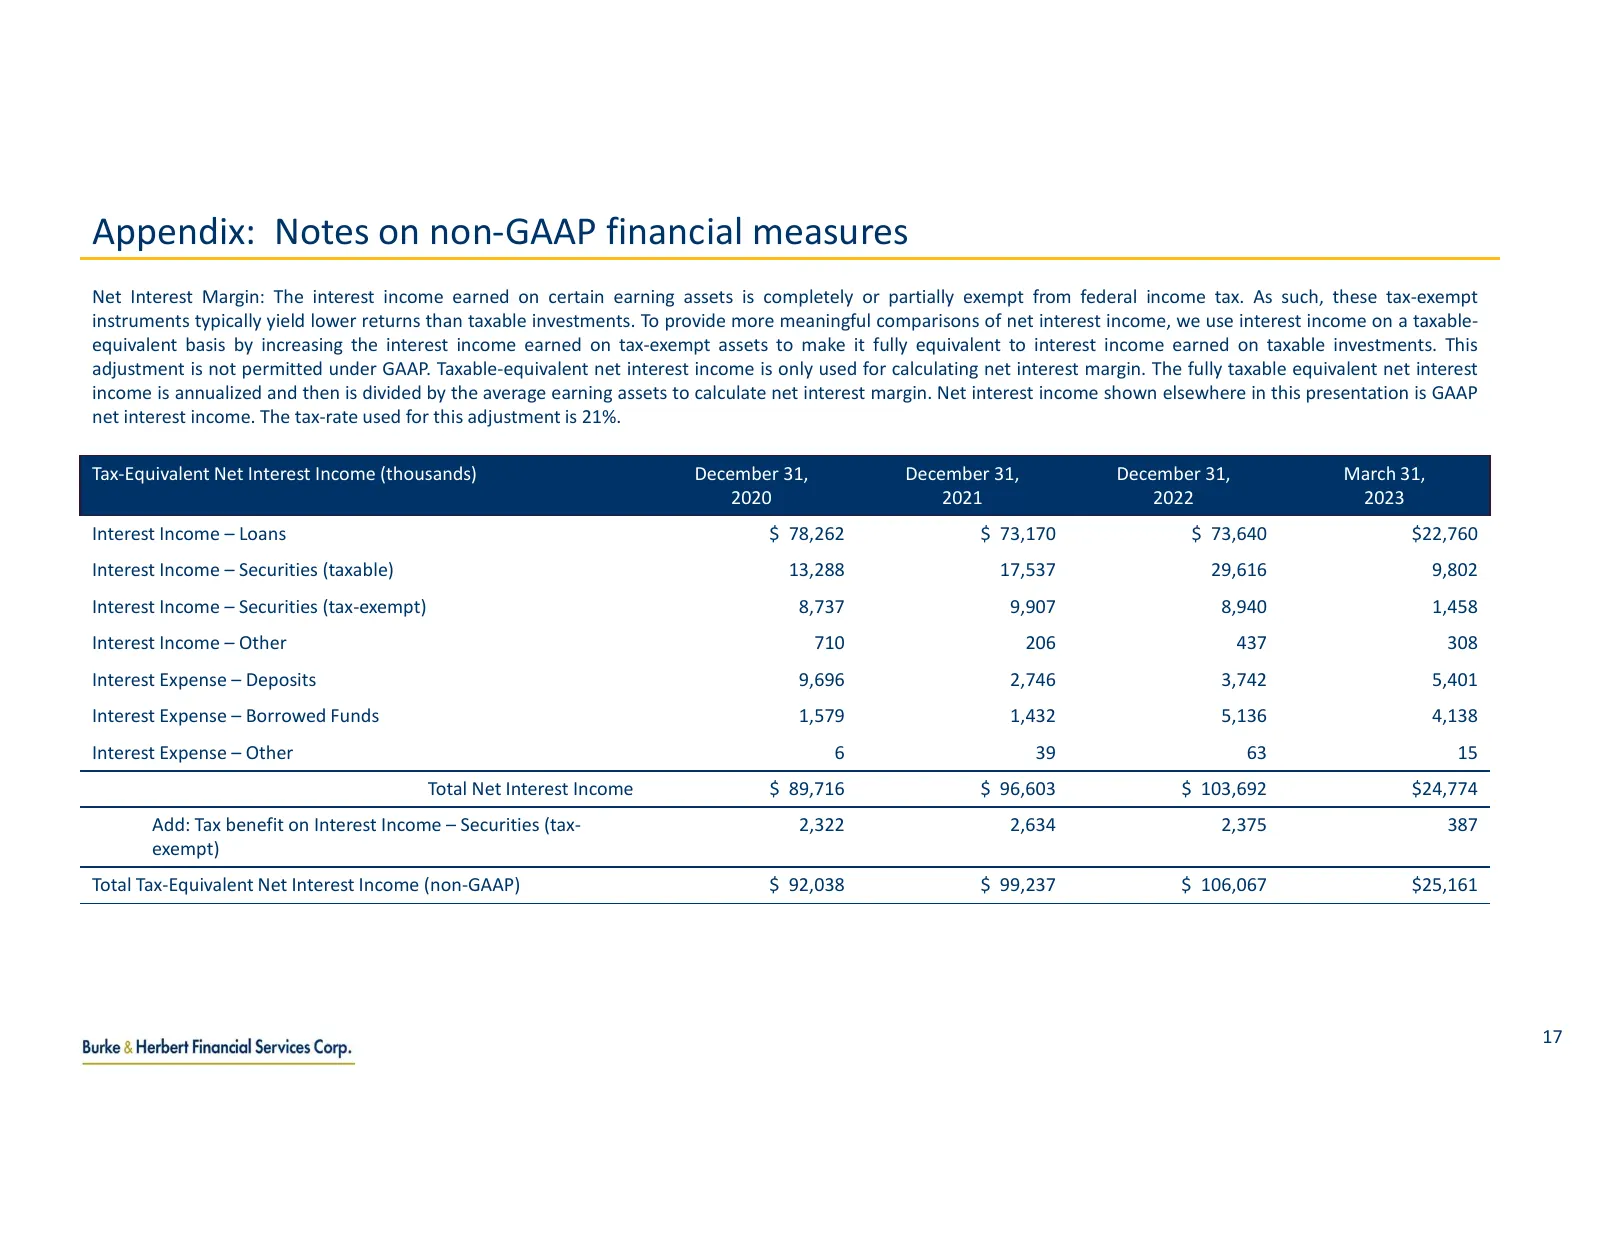
Appendix: Notes on non-GAAP financial measures Net Interest Margin: The interest income earned on certain earning assets is completely or partially exempt from federal income tax. As such, these tax-exempt instruments typically yield lower returns than taxable investments. To provide more meaningful
Slide 18: Appendix: Notes on non-GAAP financial measures
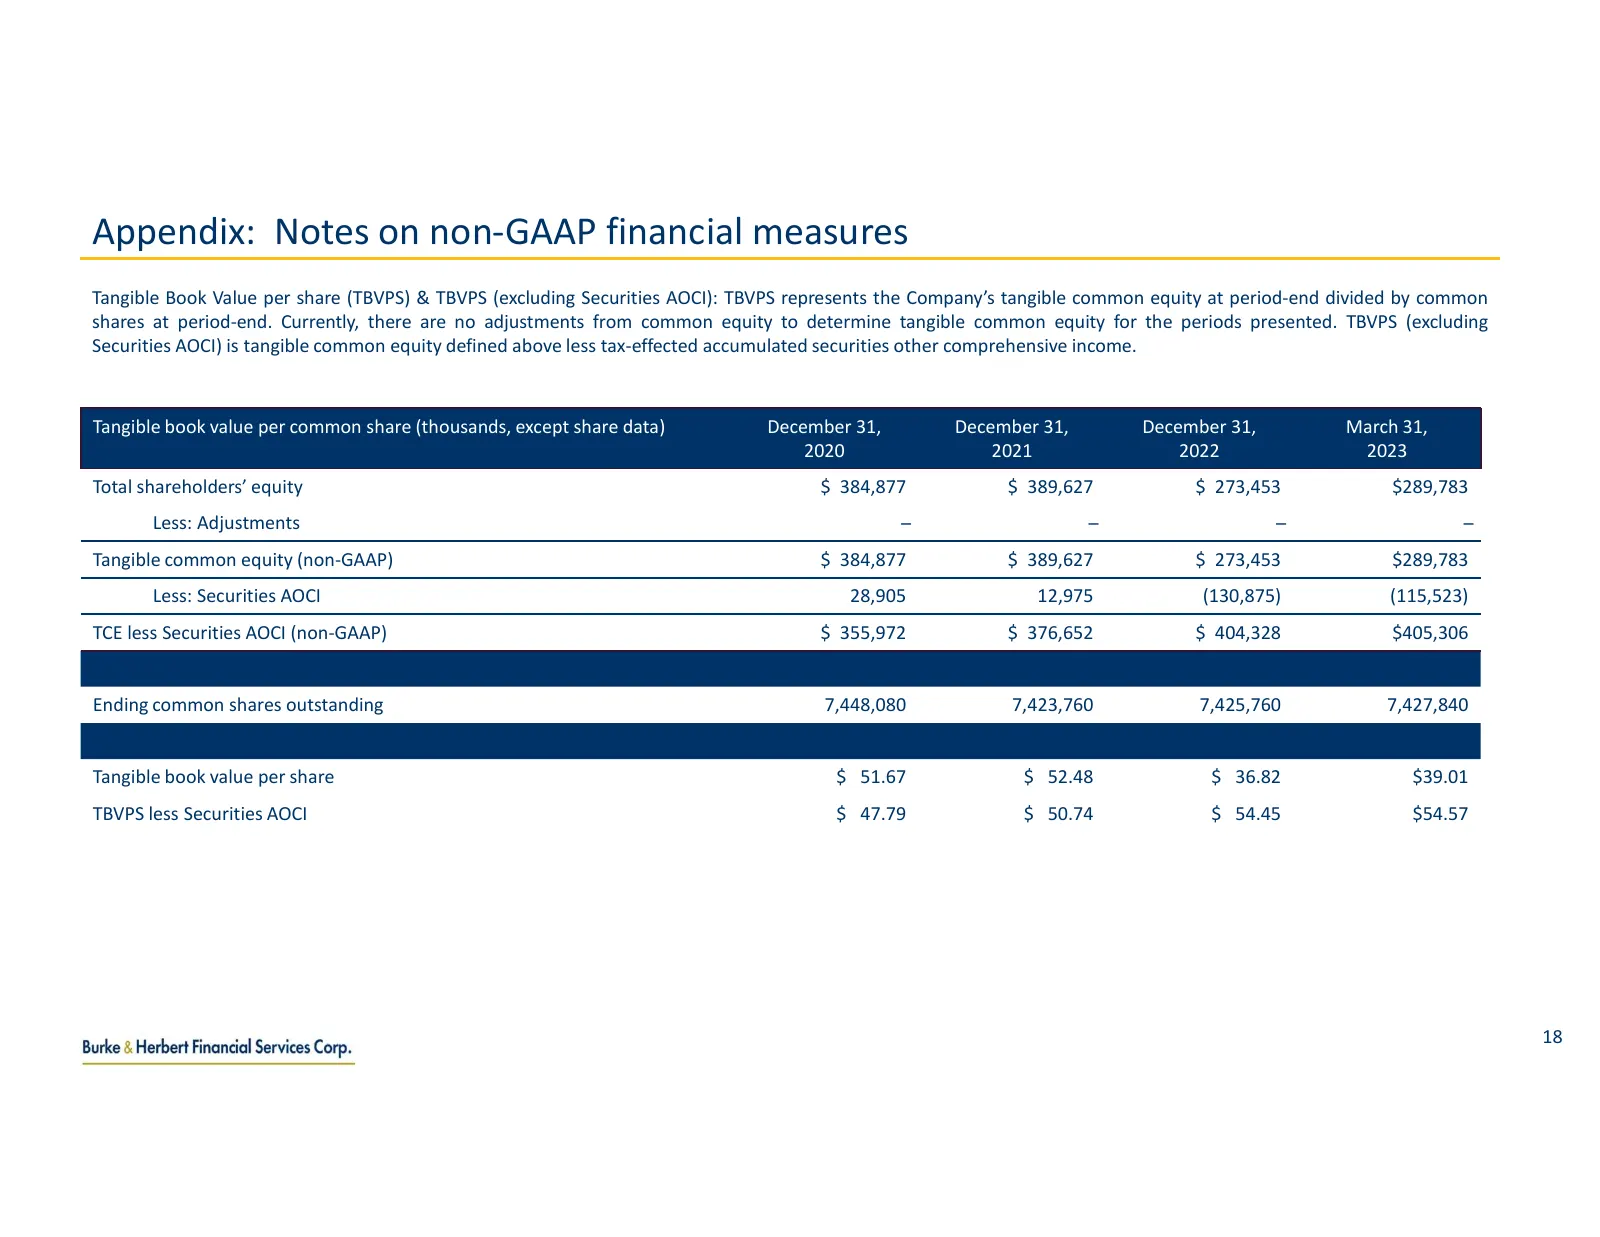
Appendix: Notes on non-GAAP financial measures Tangible Book Value per share (TBVPS) & TBVPS (excluding Securities AOCI): TBVPS represents the Company’s tangible common equity at period-end divided by common shares at period-end. Currently, there are no adjustments from common equity to determine ta
Source: company website
More decks from Burke & Herbert Financial Services Corp.
 Debt Investor Presentation (September 2026)46 slides · Sep 28, 2026
 Debt Investor Presentation (September 2026)43 slides · Sep 18, 2026
 Q2 2026 Earnings Presentation24 slides · July 2026
 Q1 2026 Earnings Presentation22 slides · April 2026
 Q4 2025 Earnings Presentation19 slides · January 2026
 Merger or Acquisition (December 2025)19 slides · Dec 18, 2025