American Railcar Industries Inc
American Railcar Industries — Investor Presentation (September 2016)
31 slides from American Railcar Industries's investor presentation, Sep 1, 2016
Slide 1: American Railcar Industries, Inc. Investor Presentation September 2016
American. Railcar Industries, Inc. INVESTOR PRESENTATION — SEPTEMBER 2016 INVESTOR CONTACT: (636) 940-6000 WEBSITE: AMERICANRAILCAR.COM
Slide 2: Forward Looking Disclaimer
Forward Looking Disclaimer ‘Safe Harbor Statement without limitation, statements onmenial, health, regulatory la ich may be st nange: the new business endeavors: the implementation, integration with other systems or Ser ae ‘of our new resource ae system; ae its. subsidiaries’ a in ARIS ings wih the
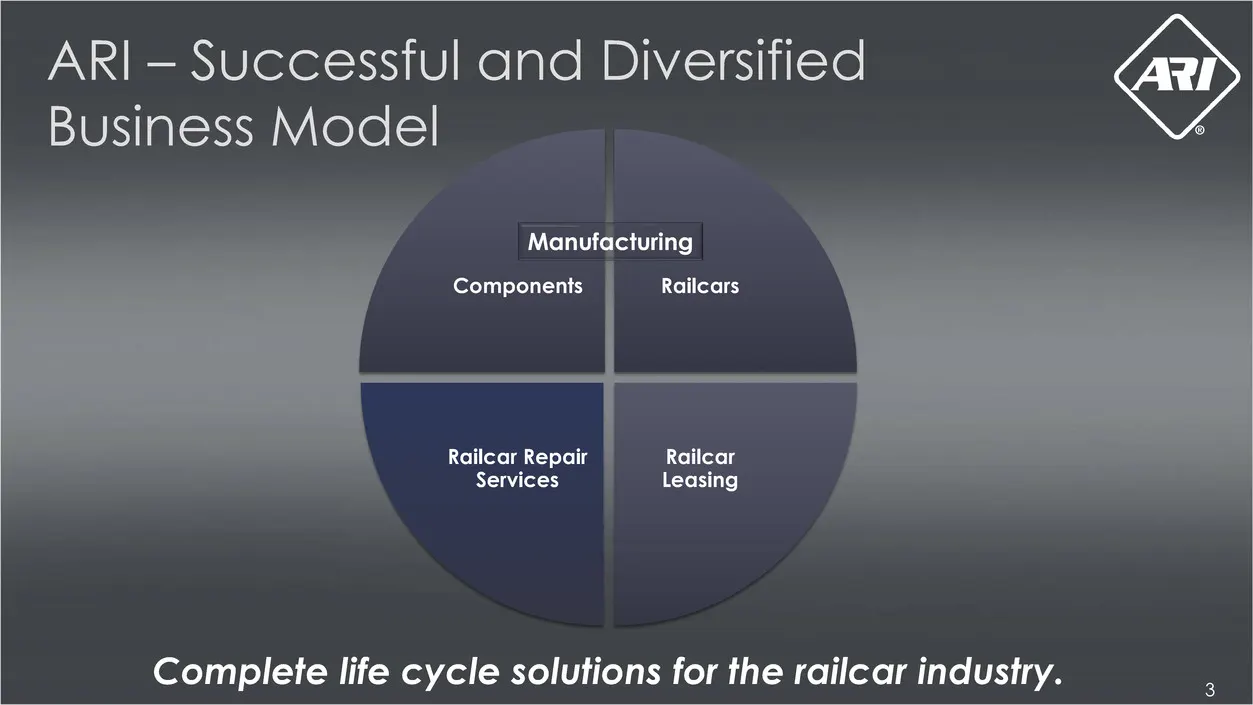
Slide 3: ARI — Successful and Diversified Business Model
ARI — Successful and Diversified Business Model Manufacturing Components Railcars Railcar Repair Railcar ervices Leasing Complete life cycle solutions for the railcar industry.
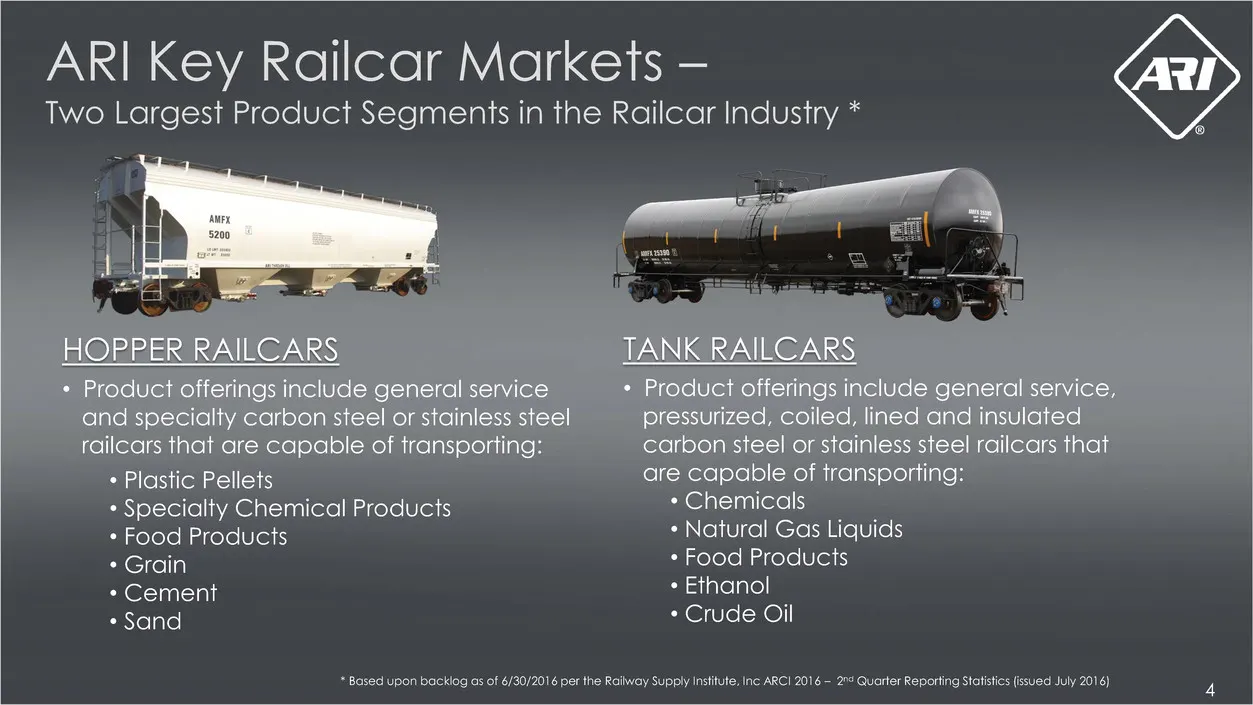
Slide 4: ARI Key Railcar Markets — Two Largest Product Segments
ARI Key Railcar Markets — Two Largest Product Segments in the Railcar Industry * HOPPER RAILCARS * Product offerings include general service ° and specialty carbon steel or stainless steel railcars that are capable of transporting: + Plastic Pellets * Specialty Chemical Products + Food Products * Gr
Slide 5: ARI Locations
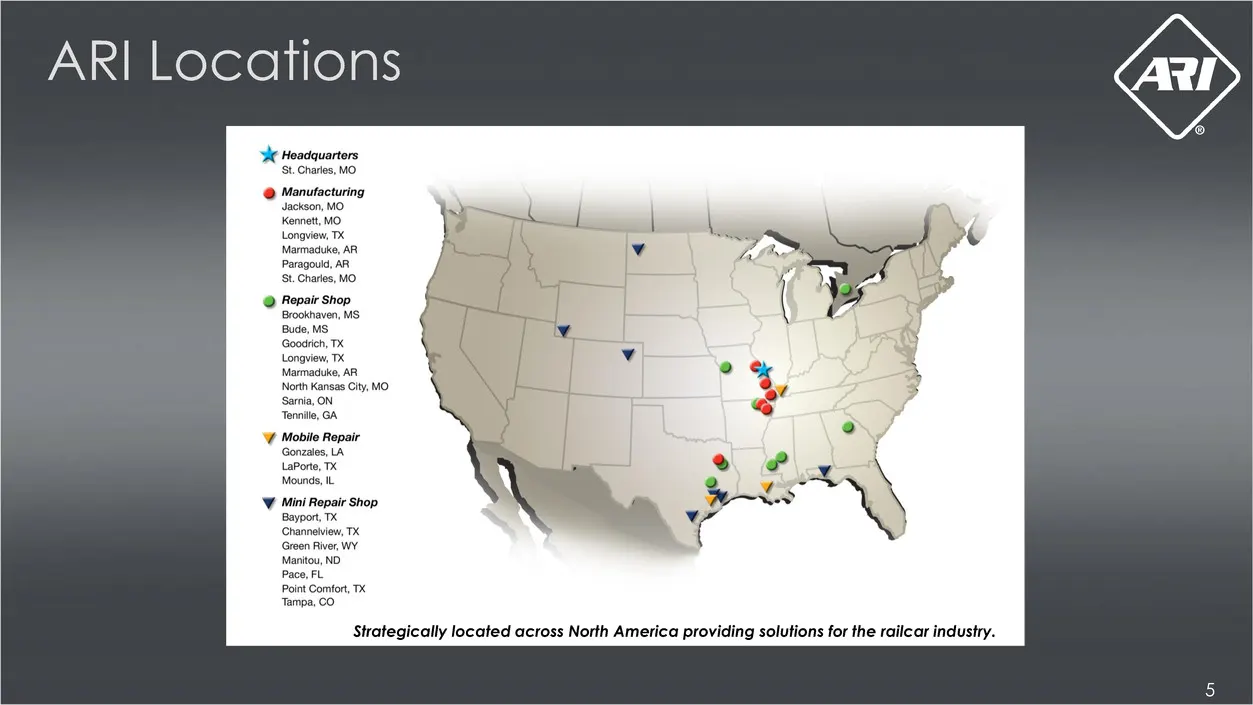
ARI Locations We Headquarters St. Chares, MO @ Manufacturing Jackson, MO @ Repair Shop Brookhaven, MS Longview, TX Marmaduke, AR, North Kansas City, MO ‘Sarnia, ON Tennille, GA Y Mobile Repair Gonzales, LA Tampa, CO Strategically located across North America providing solutions for the railcar indus
Slide 6: North American Fleet by Railcar Type
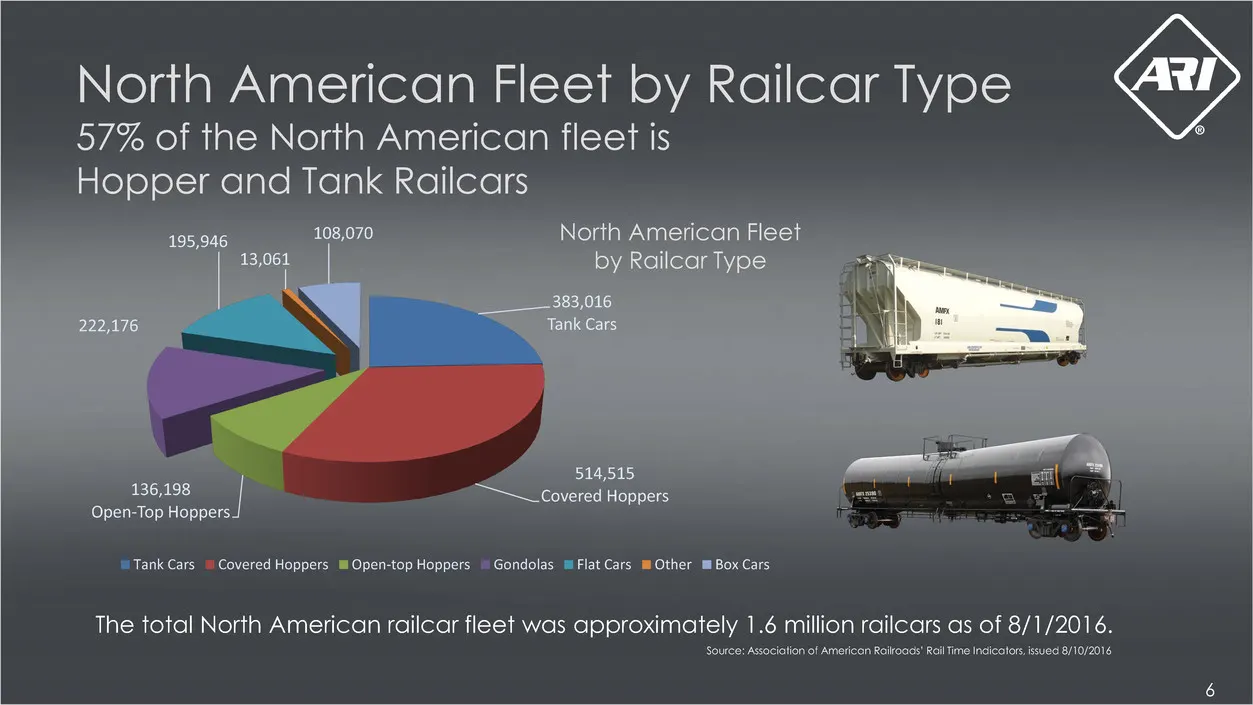
North American Fleet by Railcar Type 57% of the North American fleet is Hopper and Tank Railcars Open-Top Hoppers. j= Tank Cars “Covered Hoppers ™Open-top Hoppers Gondolas mFlat Cars mOther m Box Cars The total North American railcar fleet was approximately 1.6 million railcars as of 8/1/2016.
Slide 7: Cyclical Industry Trends
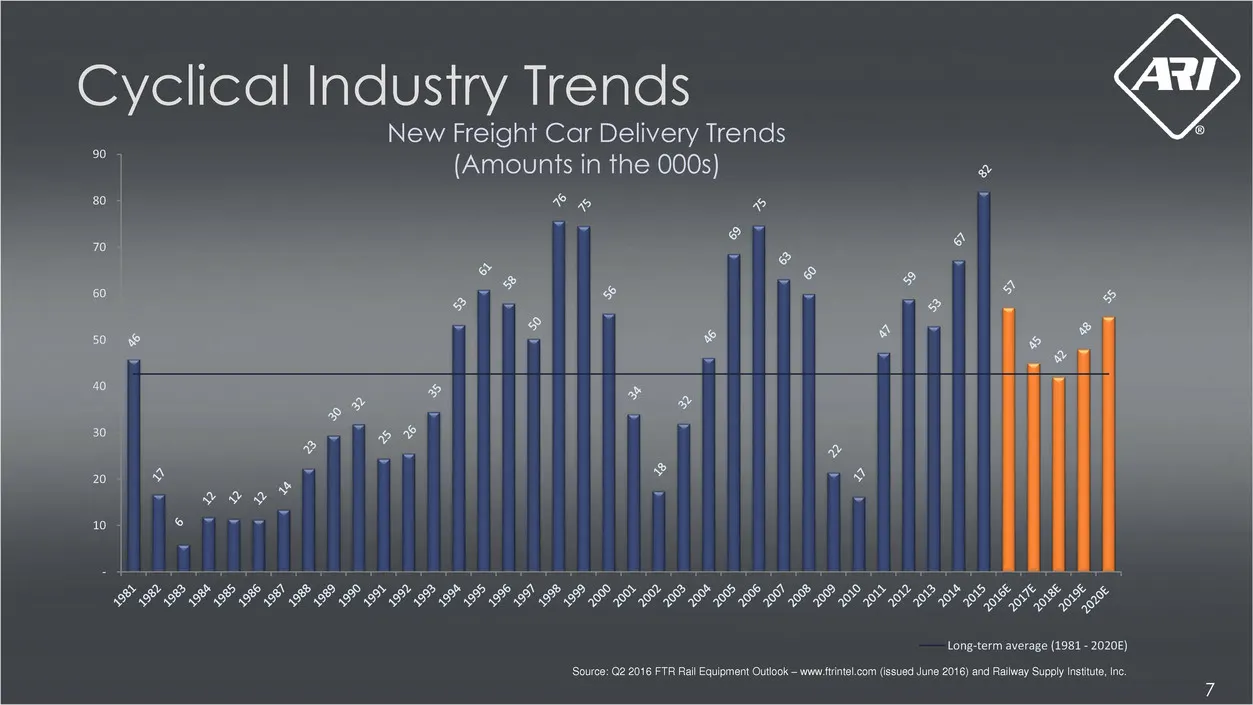
Cyclical Industry Trends New Freight Car Delivery Trends (Amounts in the 000s) oc 90 FI LILES ILI IIIS EIS IPE SSP PS FEISS PP PP PP PE NP SS Long-term average (1981 - 2020) Inc.
Slide 8: Largest Demand in Railcar Industry
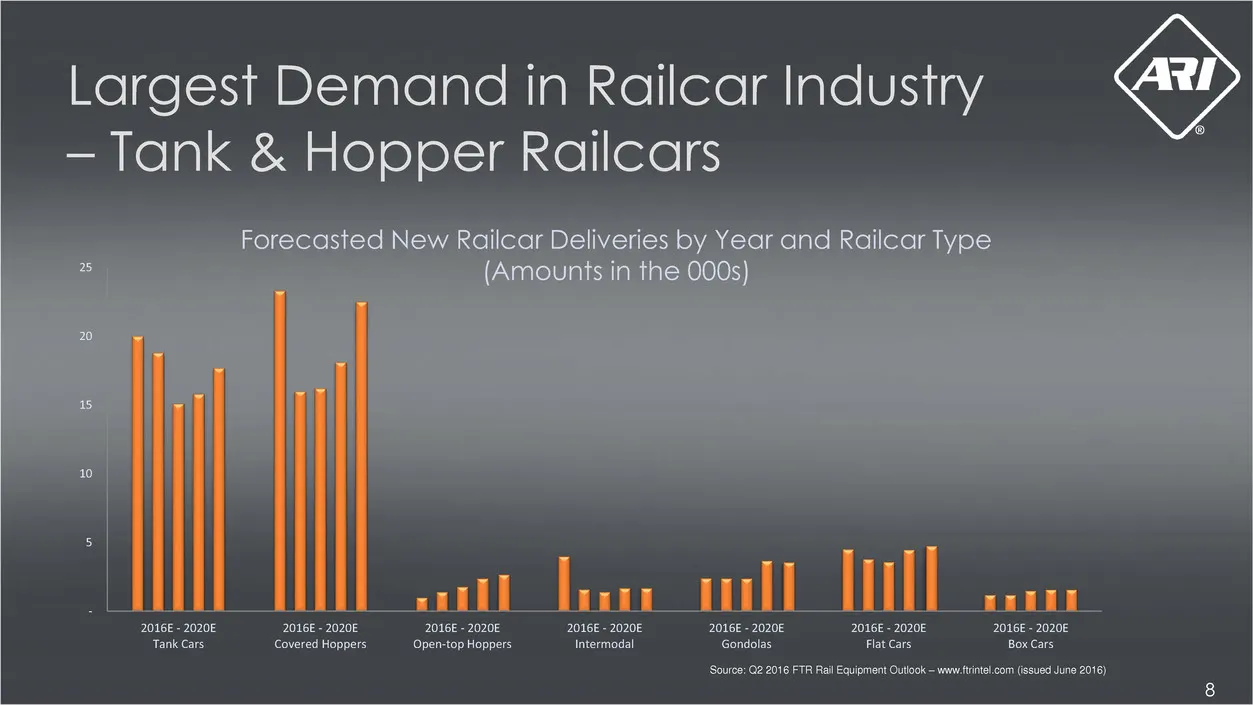
Largest Demand in Railcar Industry —Tank & Hopper Railcars Forecasted New Railcar Deliveries by Year and Railcar Type a (Amounts in the 000s) 20 15 10 5 ll | 2 lous will TMT, Pratt 2ouse 20208 2ou6e -2020€ me ae zoe aoe zoe 208 zoe. aoe zoe. moe TankCars Covered Hoppers -»««Open-topHoppers. «= Inter
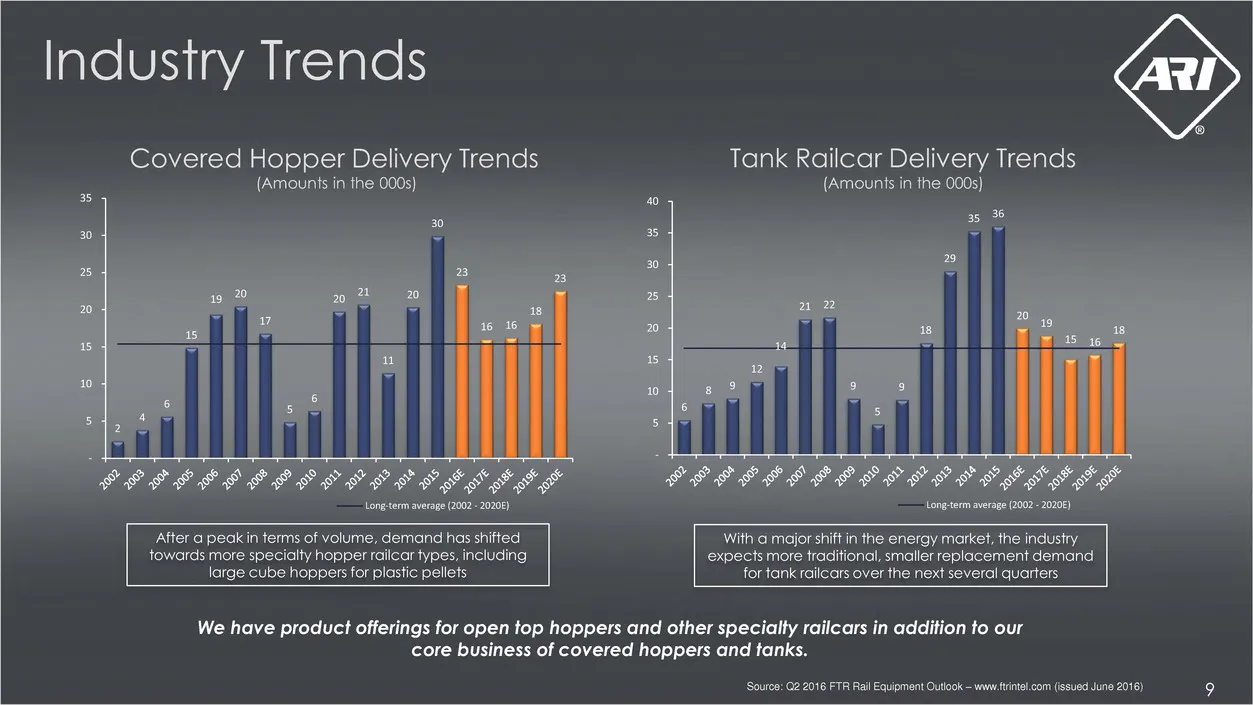
Slide 9: Industry Trends
Industry Trends Covered Hopper Delivery Trends (Amounts in the 000s) Tank Railcar Delivery Trends (Amounts in the 000s) aS After a peakin terms of volume, gest i shifted including large cube hoppers fo for sci pellets With a major shift in the energy market, the industry expects more traditional, sm
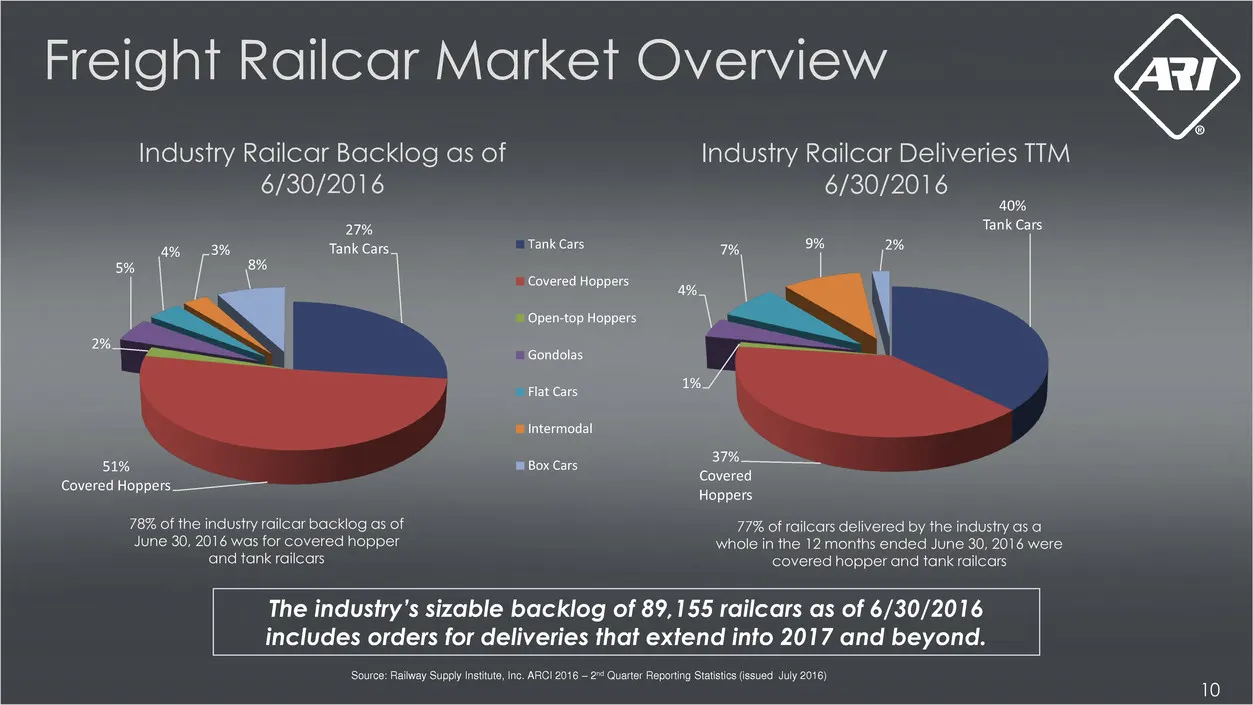
Slide 10: Freight Railcar Market Overview
Freight Railcar Market Overview Industry Railcar Backlog as of Industry Railcar Deliveries TIM 6/30/2016 6/30/2016 78% of the industry railcar backlog as of 77% of railcars delivered by the industry as a June 30, 2016 was for covered hopper whole in the 12 months ended June 30, 2016 were and tank ra
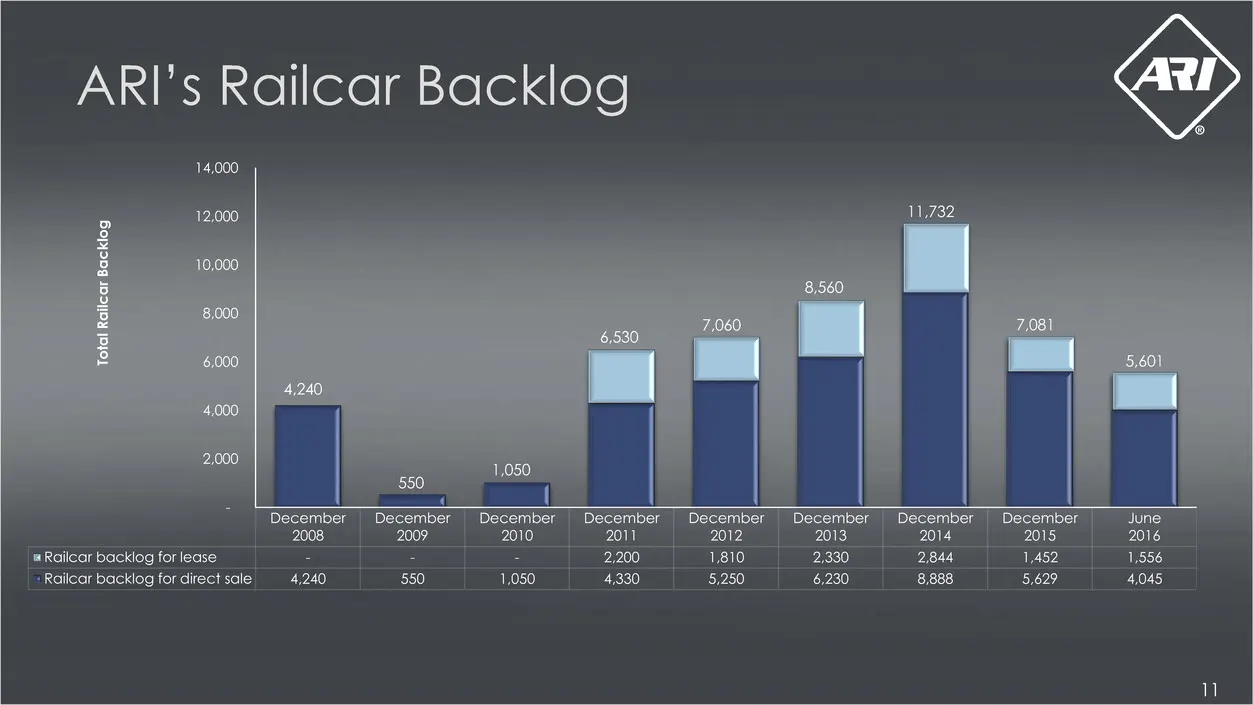
Slide 11: ARI's Railcar Backlog
ARI’s Railcar Backlog 14,000 sRailcar backlog forlease - + Railcar backlog for direct sale 4,240
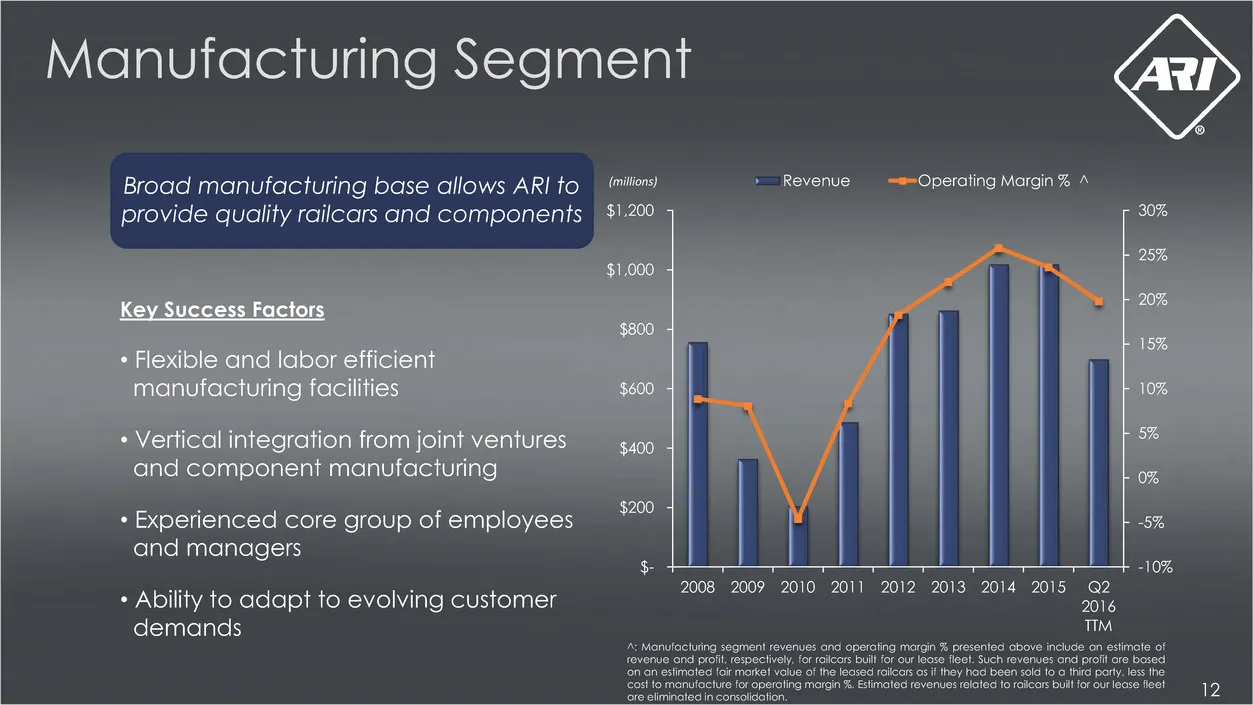
Slide 12: Manufacturing Segment
Manufacturing Segment Broad manufacturing base allows ARI to » Revenue ="=Operating Margin % 4 provide quality railcars and components + Experienced core group of employees and managers 2008 2009 2010 2011 2012 2013 2014 2015 Q2 2016 + Ability to adapt to evolving customer demands 11M ling margin i
Slide 13: Manufacturing Locations
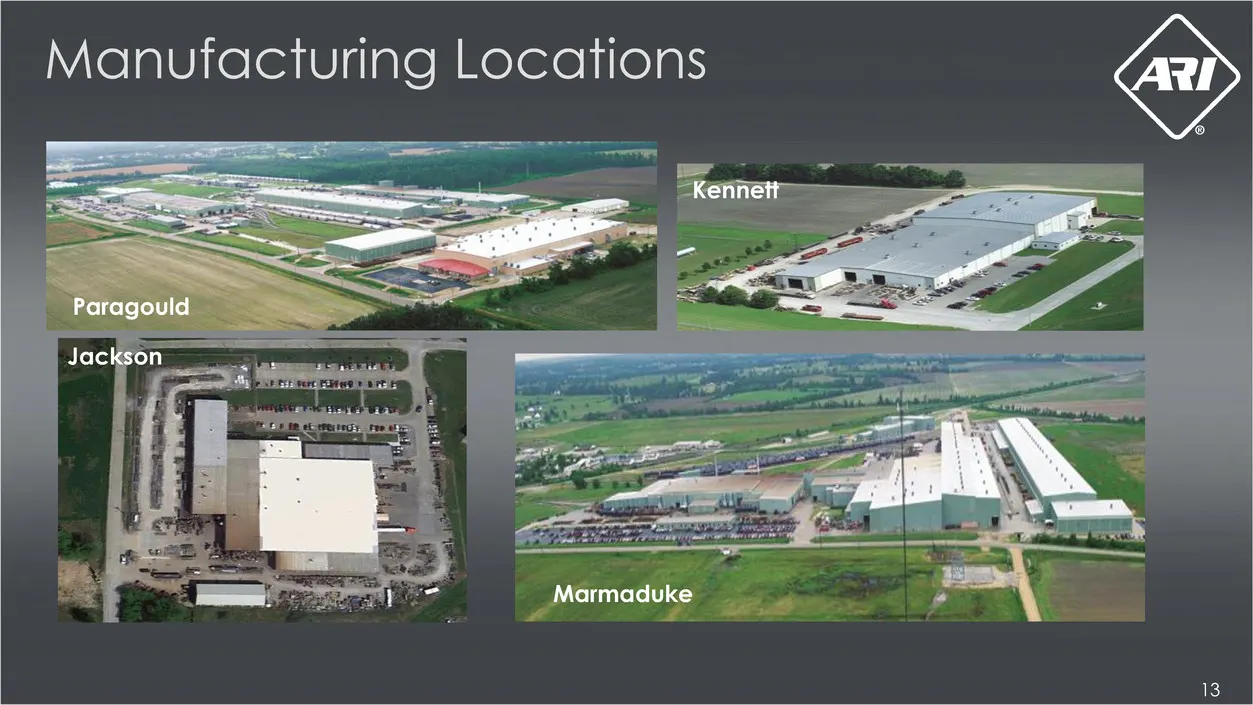
Manufacturing Locations
Slide 14: Flexible Manufacturing Plants
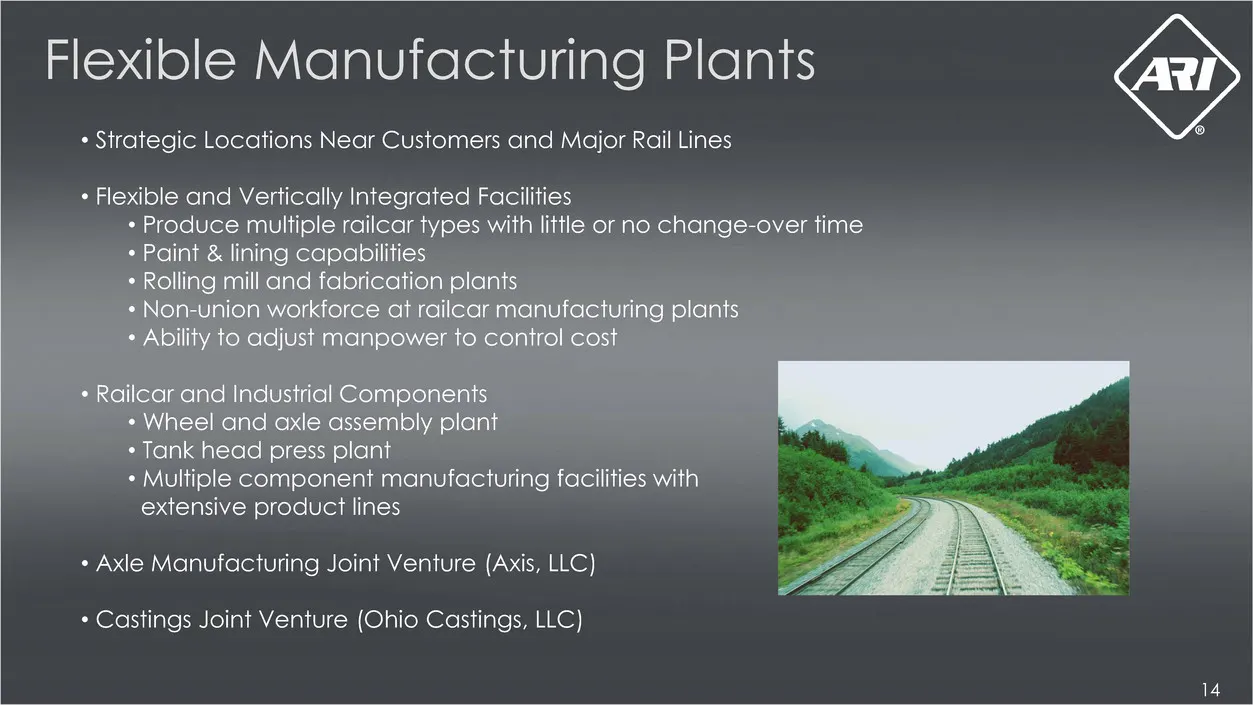
Flexible Manufacturing Plants + Strategic Locations Near Customers and Major Rail Lines + Flexible and Vertically Integrated Facilities + Produce multiple railcar types with little or no change-over time + Paint & lining capabilities * Rolling mill and fabrication plants * Non-union workforce at rai
Slide 15: Integrated Manufacturing
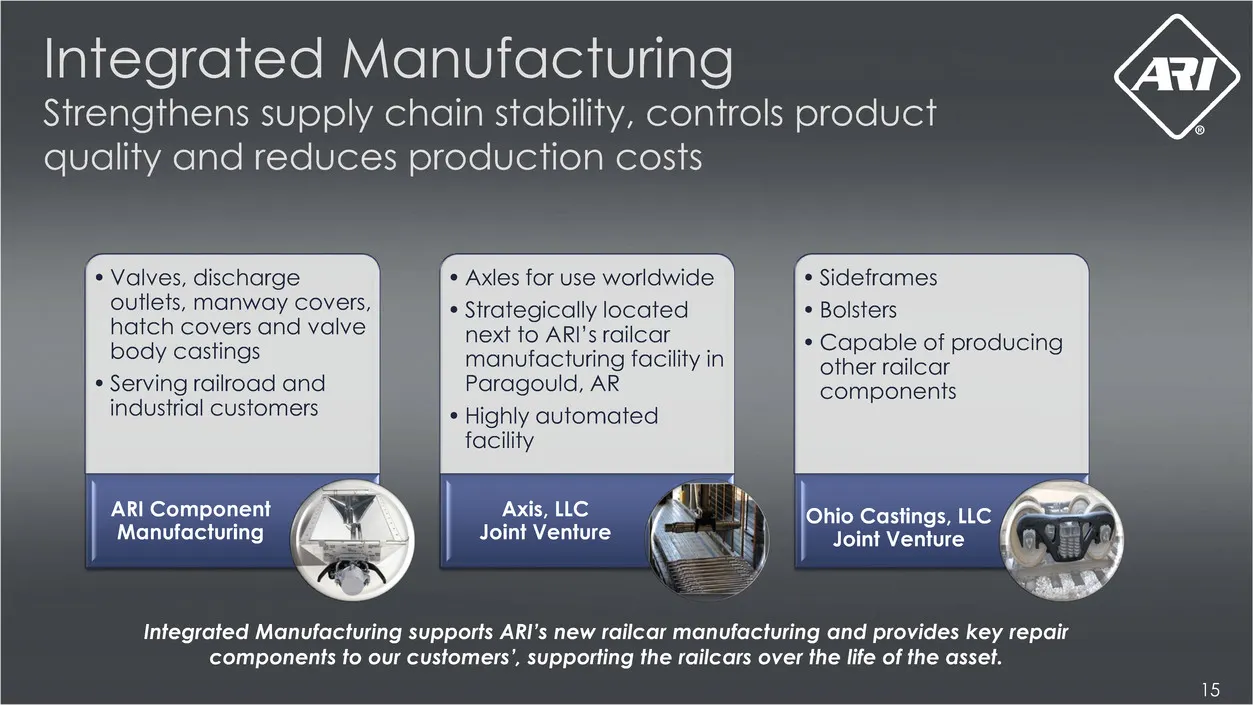
Integrated Manufacturing Strengthens supply chain stability, controls product quality and reduces production costs * Axles for use worldwide + Sideframes * Strategically located ¢ Bolsters next to ARI’s railcar 0G ble of produci manufacturing facility in tac seins! ¢ Valves, discharge outlets, manwa
Slide 16: Railcar Leasing Segment
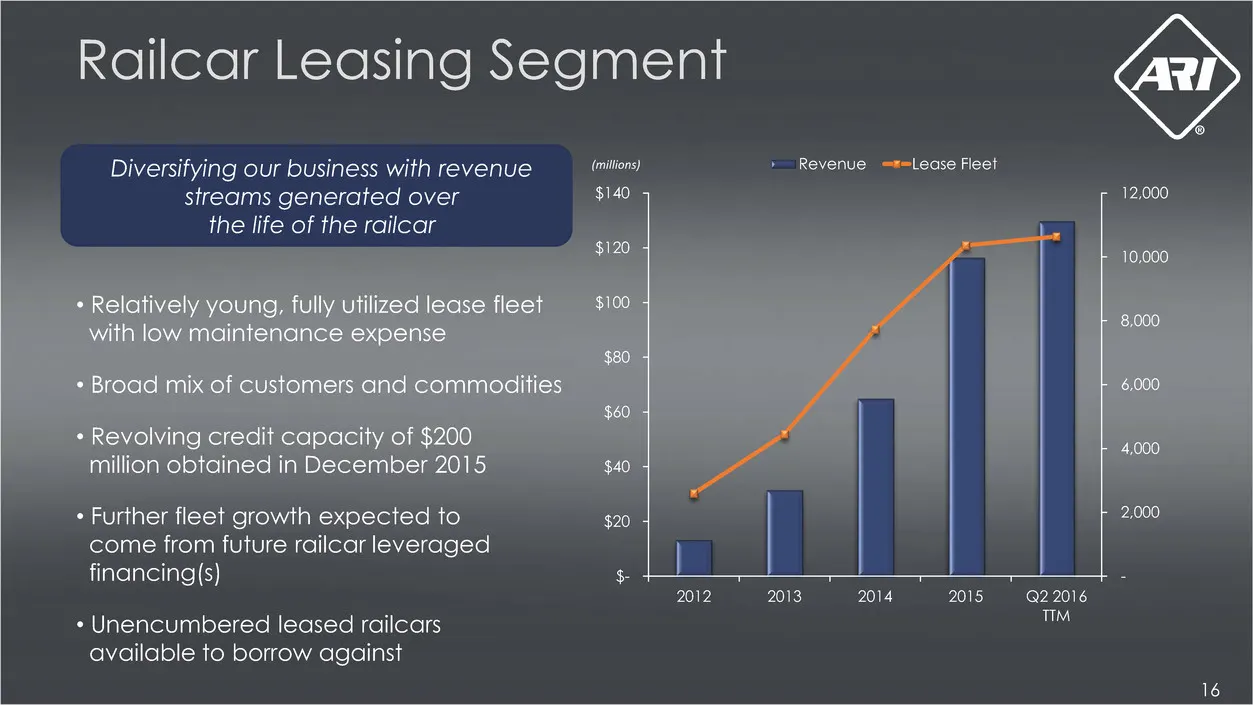
Railcar Leasing Segment Diversifying our business with revenue (eittons) streams generated over $140 the life of the railcar + Further fleet growth expected to come from future railcar leveraged lilaelarediate]()} Revenue ="=Lease Fleet + Unencumbered leased railcars available to borrow against 2015
Slide 17: Railcar Services Segment
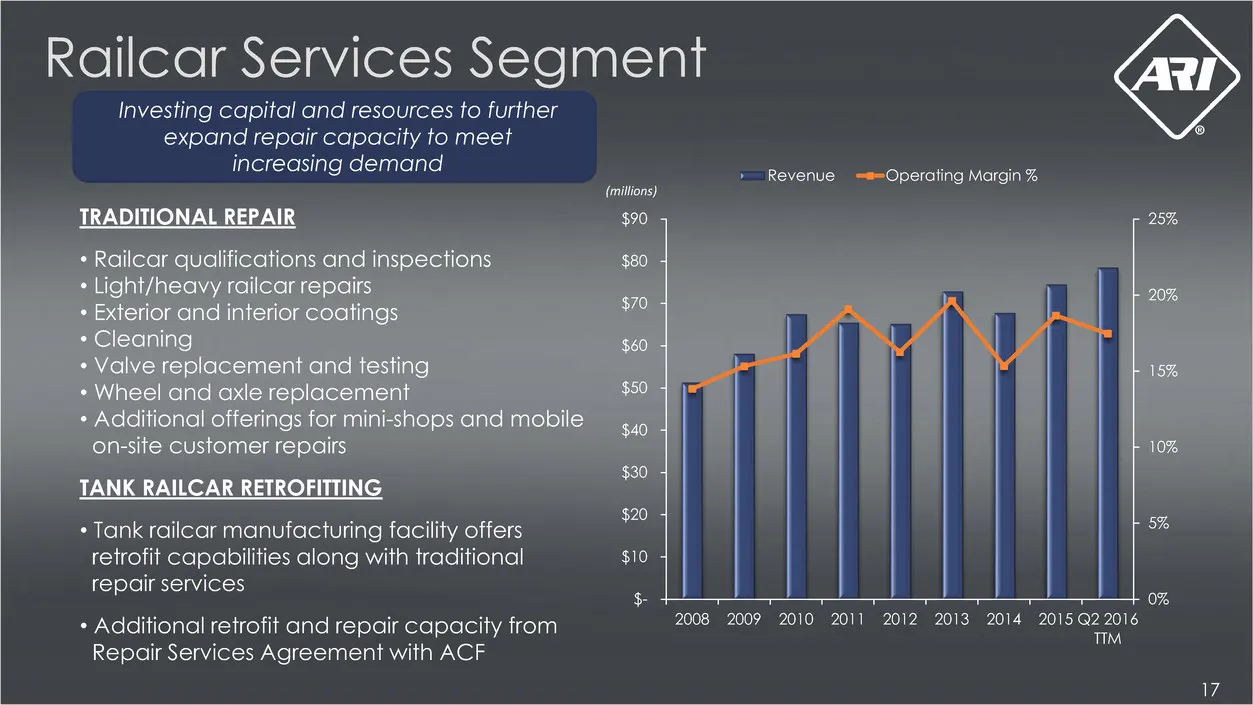
Railcar Services Segment Investing capital and resources to further expand repair capacity to meet increasing deman » Revenue =*=Operating Margin % * Tank railcar manufacturing facility offers retrofit capabilities along with traditional repair services + Additional retrofit and repair capacity from
Slide 18: Full Service Repair Shops
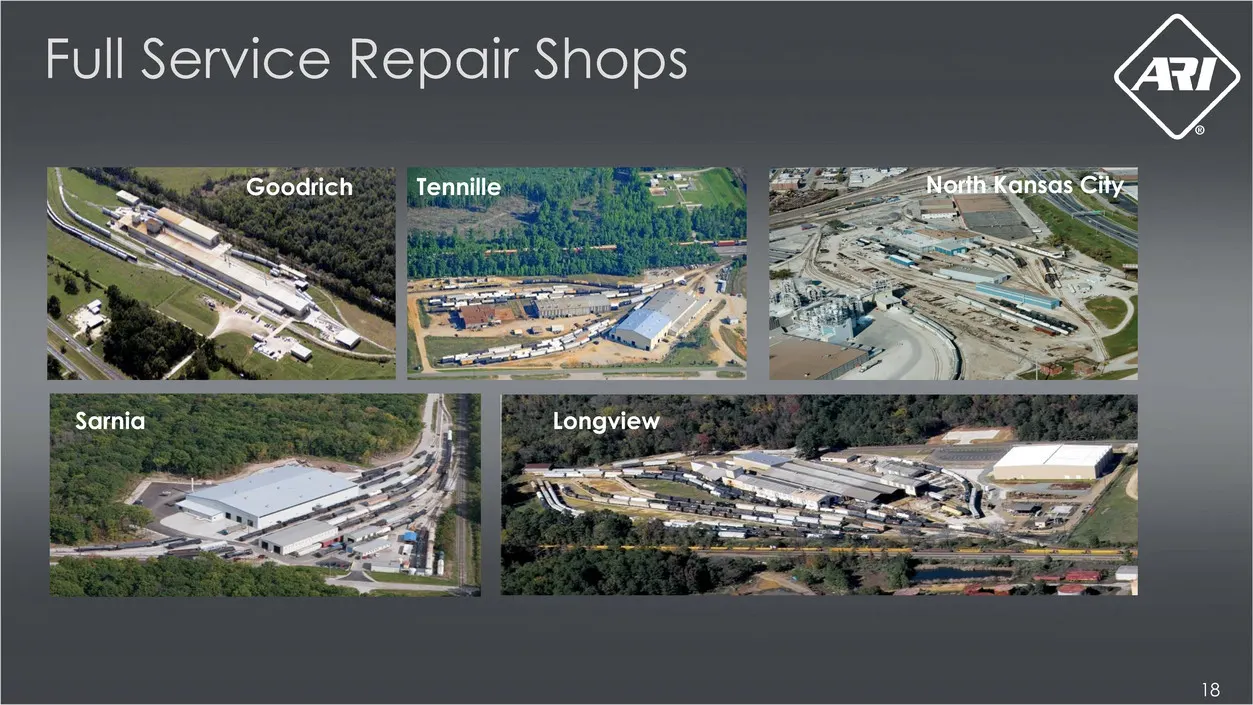
Full Service Repair Shops SS Sarnia
Slide 19: Full Service Repair Shops (continue)
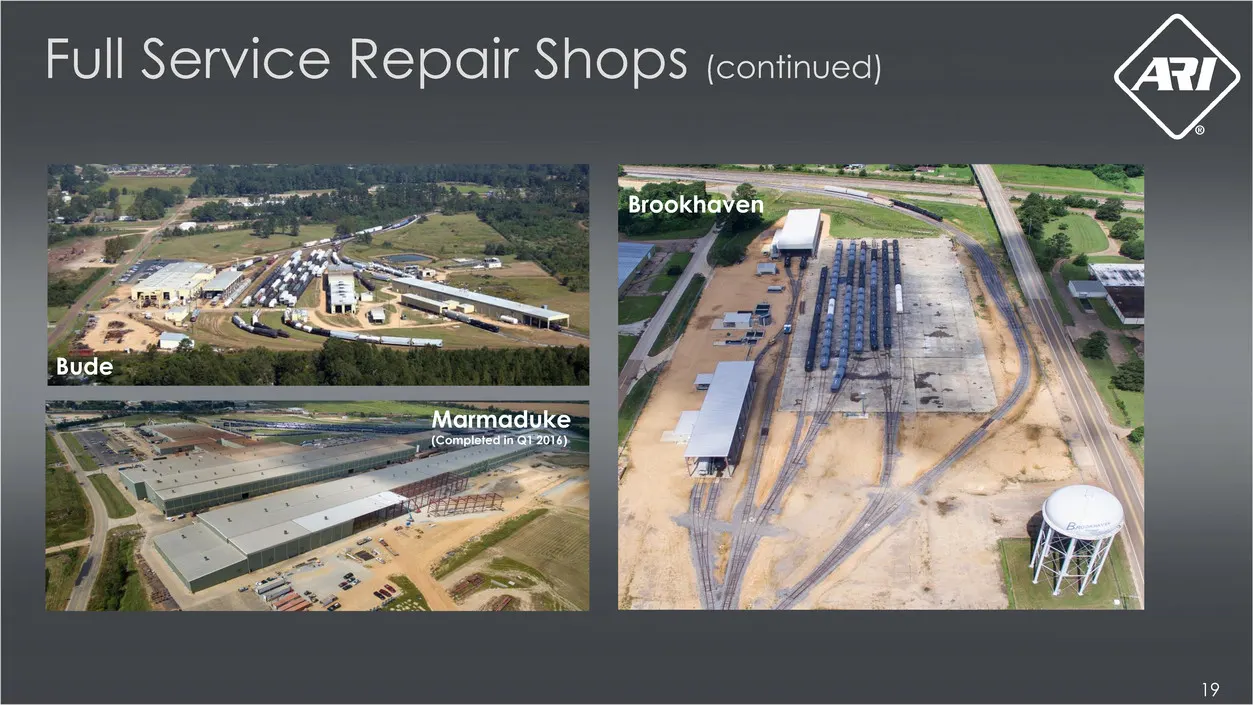
Full Service Repair SHOPS (continue)
Slide 20: Supporting the Growth of Demand for Repair Work
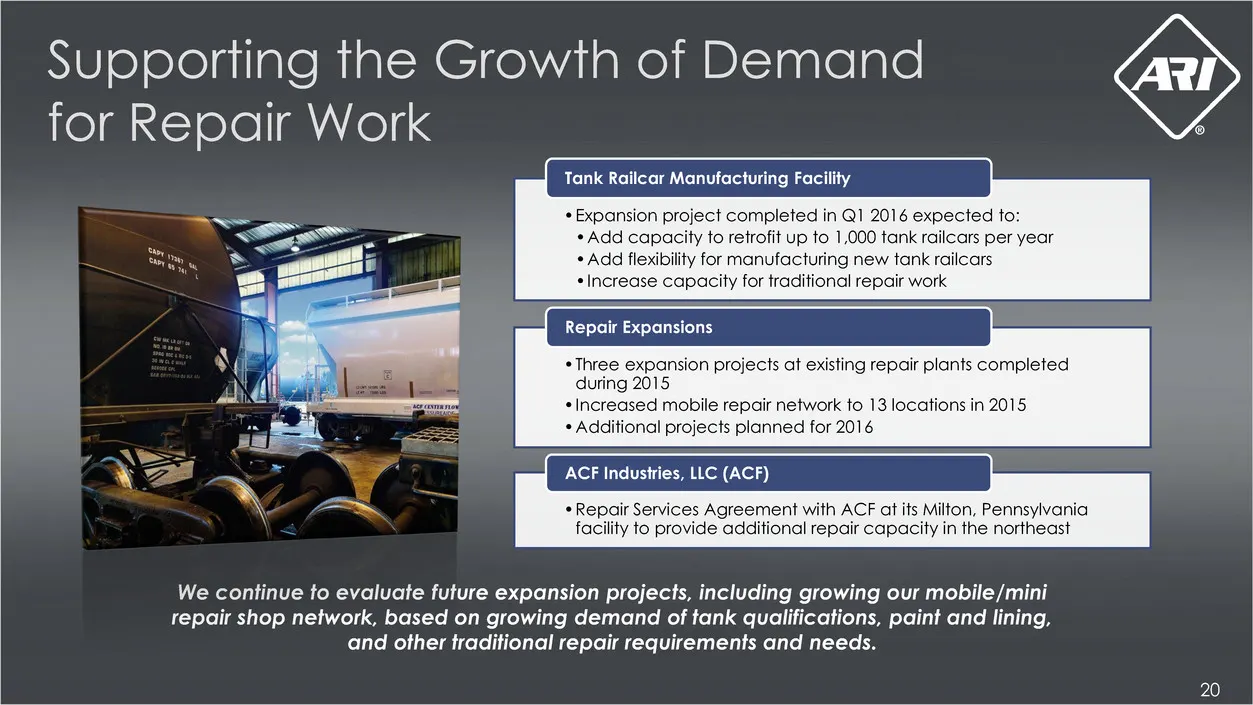
Supporting the Growth of Demand for Repair Work fo Tank Railcar Manufacturing Facility + Expansion project completed in Q1 2016 expected to: acity to retrofit up to 1,000 tank railcars per year * Add flexibility for manufacturing new tank railcars * Increase capacity for traditional repair work Repa
Slide 21: Growth and Cost Reduction Initiatives
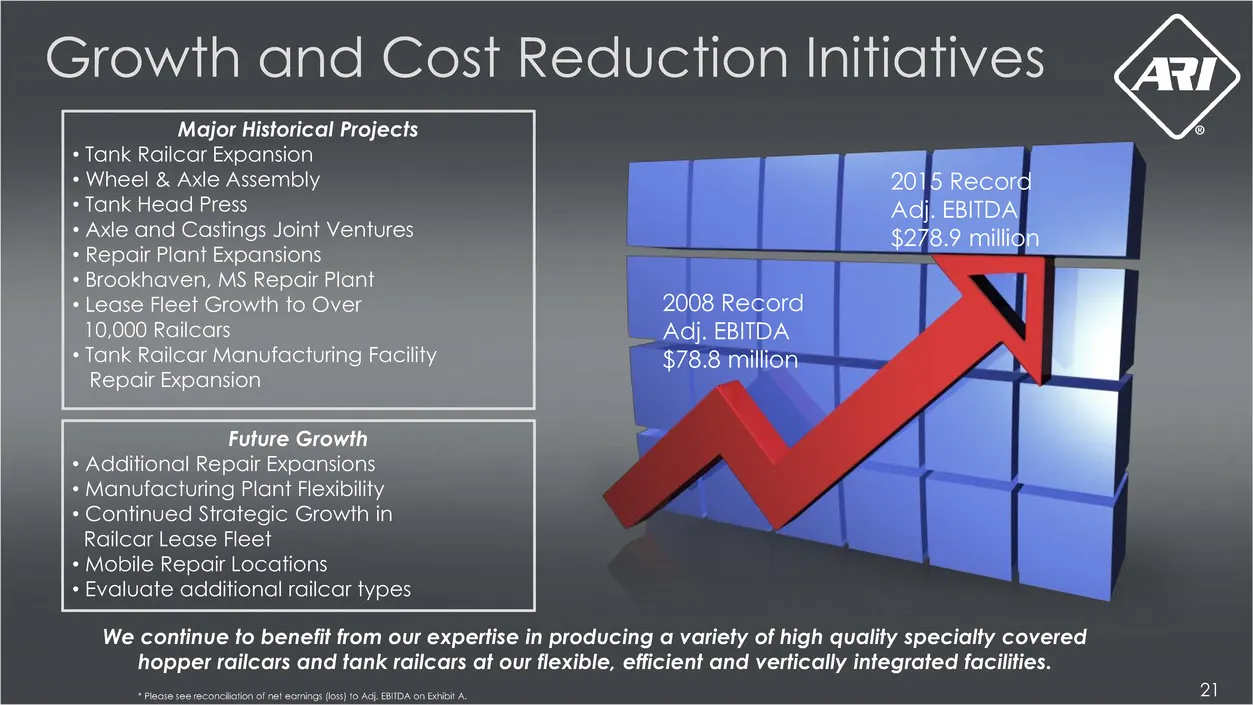
Growth and Cost Reduction Initiatives Major Historical Projects * Tank Railcar Expansion + Wheel & Axle Assembly + Tank Head Press + Axle and Castings Joint Ventures + Repair Plant Expansions + Brookhaven, MS Repair Plant + Lease Fleet Growth to Over 10,000 Railcars + Tank Railcar Manufacturing Faci
Slide 22: Objectives and Long-Term Strategies
Objectives and Long-Term Strategies We are focused on meeting the demands of the industry by offering new solutions ing designs, i tive thinking, and efficient production + Explore opportunities for product d + Improve operating efficiencies to stay competitive ¢ Further expand upon opportunities fo
Slide 23: Objectives and Long-Term Strategies (continued)
Objectives and Long-Term Strategies (continued) We remain committed to further expanding and di ifying our business model through railcar leasing and railcar services Railcar Services + Further expand railcar repair capabilities with existing repair plant expansions + Expand retrofit capabilities al
Slide 24: Strong Financial Profile
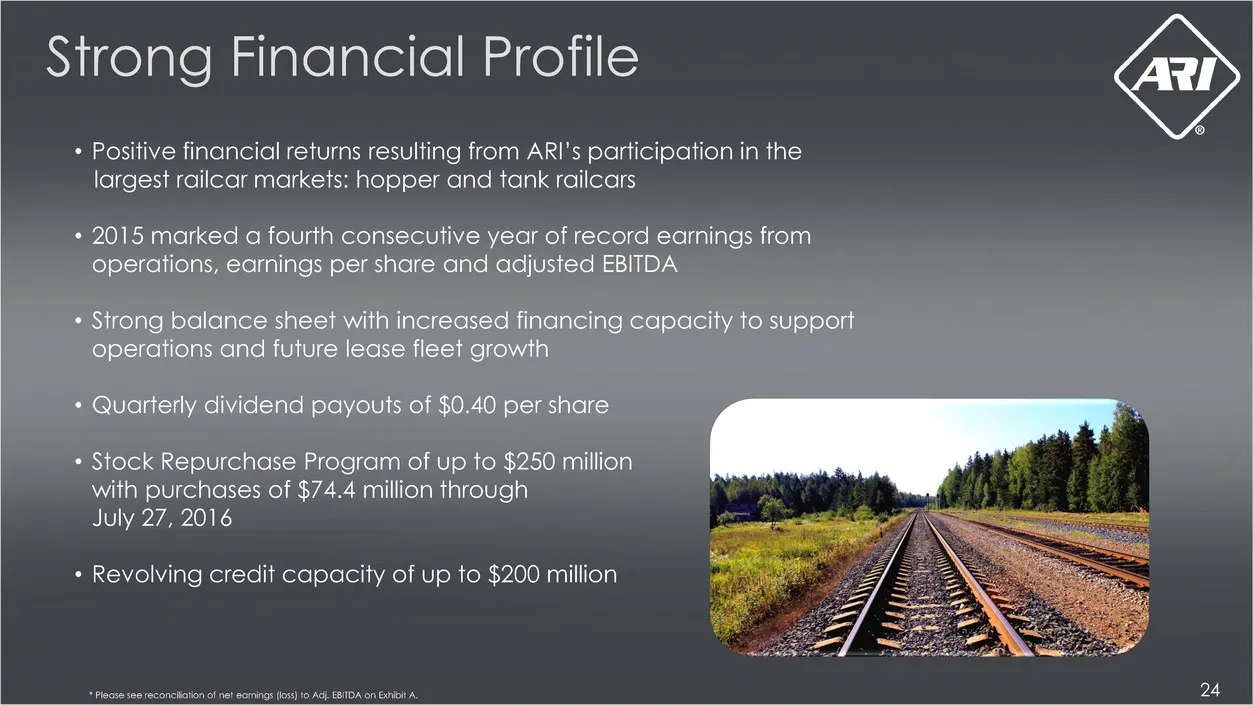
Strong Financial Profile CI * Positive financial returns resulting from ARI's participation in the largest railcar markets: hopper and tank railcars + 2015 marked a fourth consecutive year of record earnings from operations, earnings per share and adjusted EBITDA + Strong balance sheet with increase
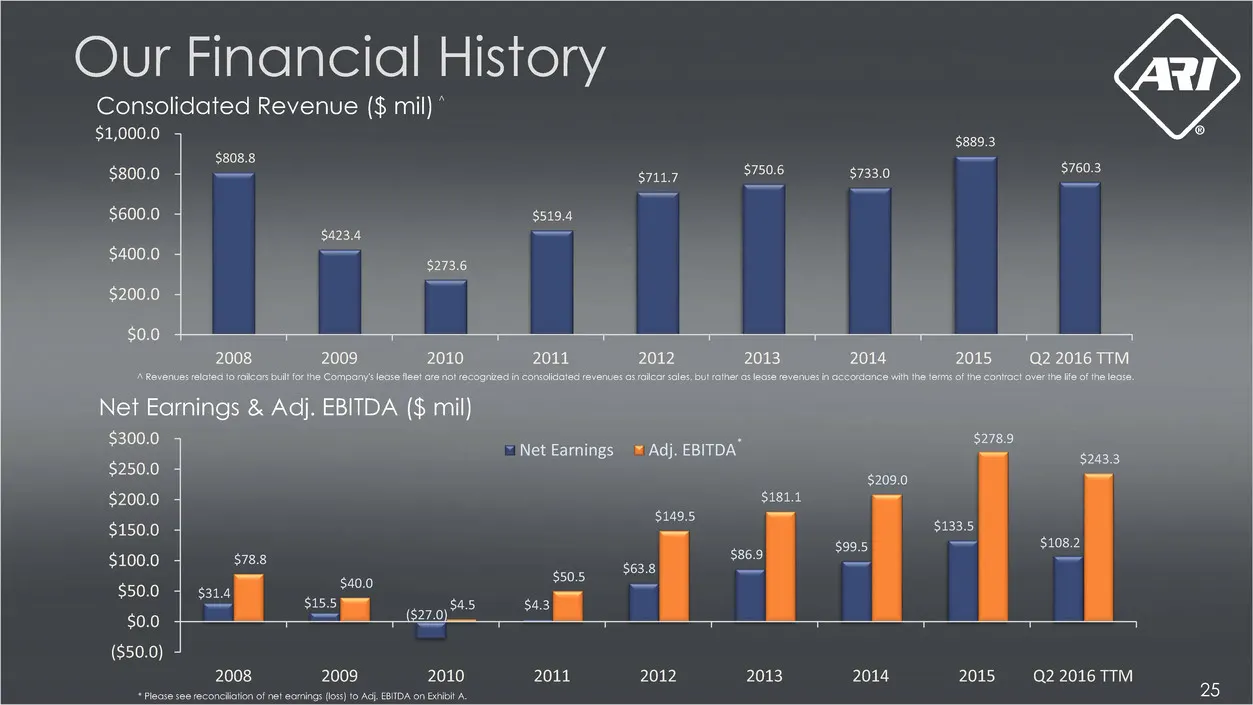
Slide 25: Our Financial History
Our Financial History Consolidated Revenue ($ mil) * $1,000.0 $800.0 $600.0 $750.6 2013 2014 2015 Q2 2016 TIM
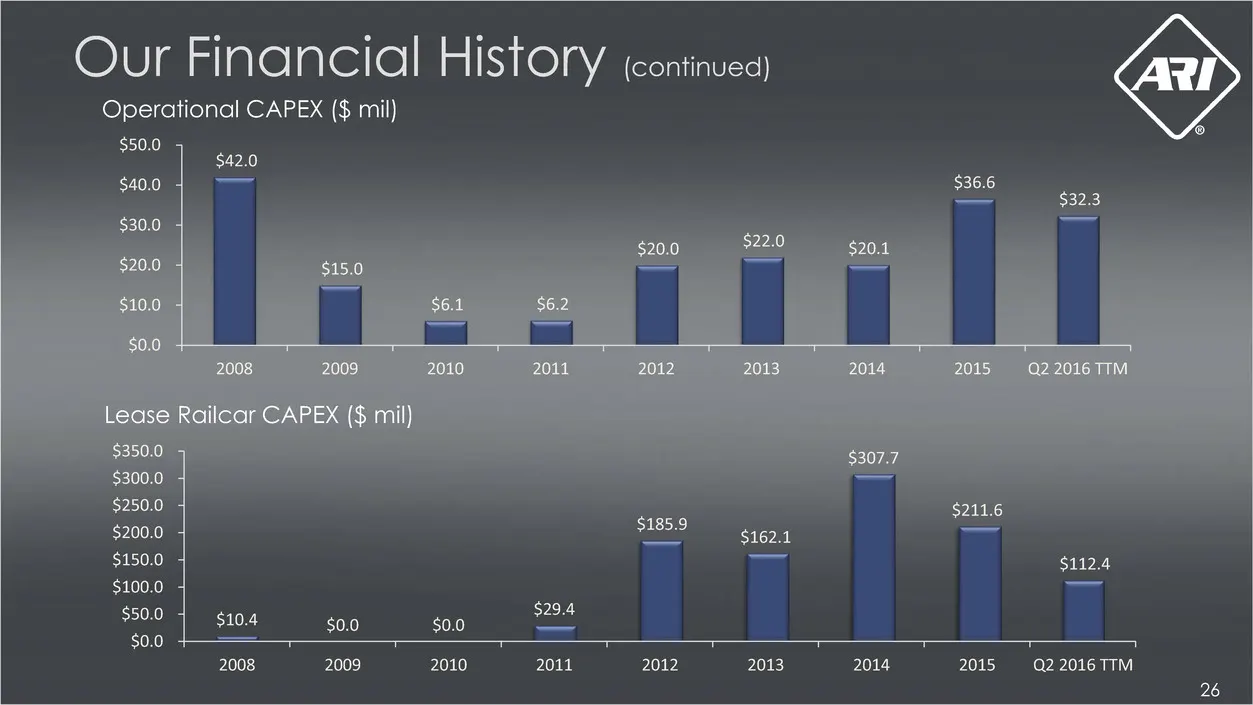
Slide 26: Our Financial History (continued)
Our Financial History (continued) Operational CAPEX ($ mil) $50.0 $40.0 $29.4 2011 2014 2015 Q2 2016 TIM
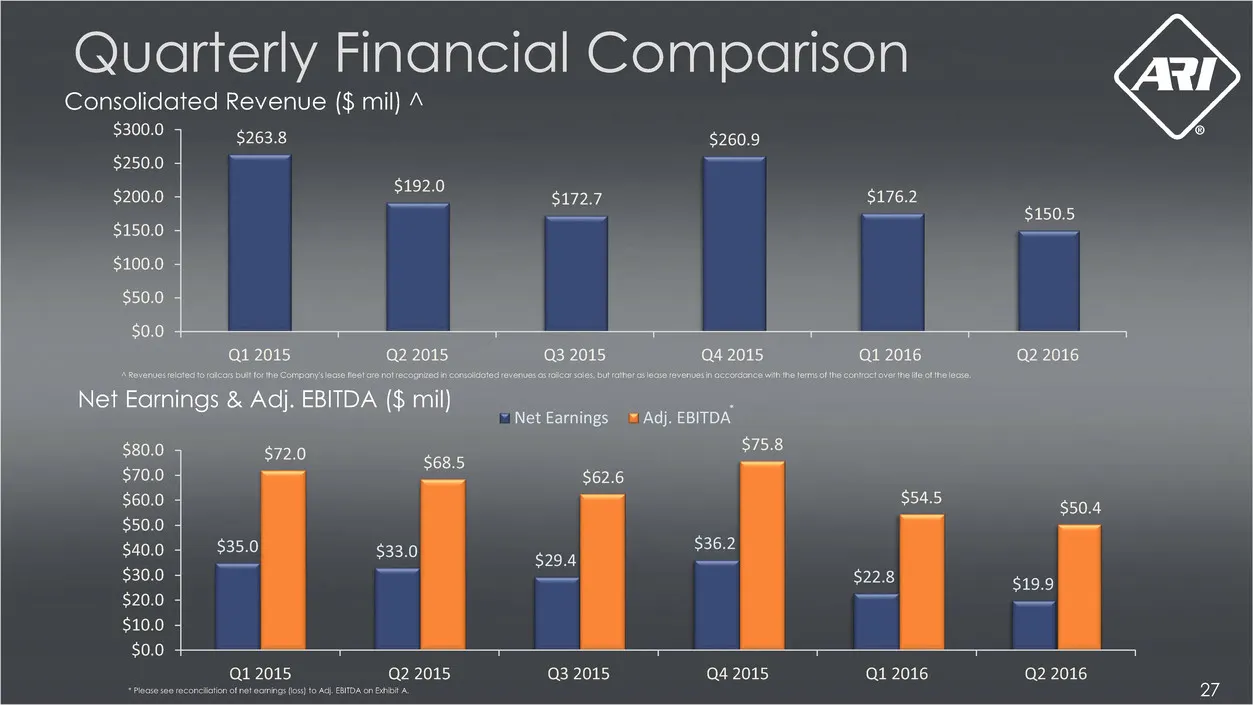
Slide 27: Quarterly Financial Comparison
Quarterly Financial Comparison Consolida $250.0 $200.0 $150.0 $100.0 $50.0 $0.0 ted Revenue ($ mil) 4 $263.8 $192.0 $172.7 $260.9 $176.2 $150.5 Qi 2015 Q2 2015 Q3 2015 Q4 2015 Qi 2016 Net Earni $80.0 $70.0 $60.0 $50.0 $40.0 $30.0 $20.0 $10.0 Ings & Adj. EBITDA ($ mil) hy $68.5 $35.0) $33.0 $0.0 Net
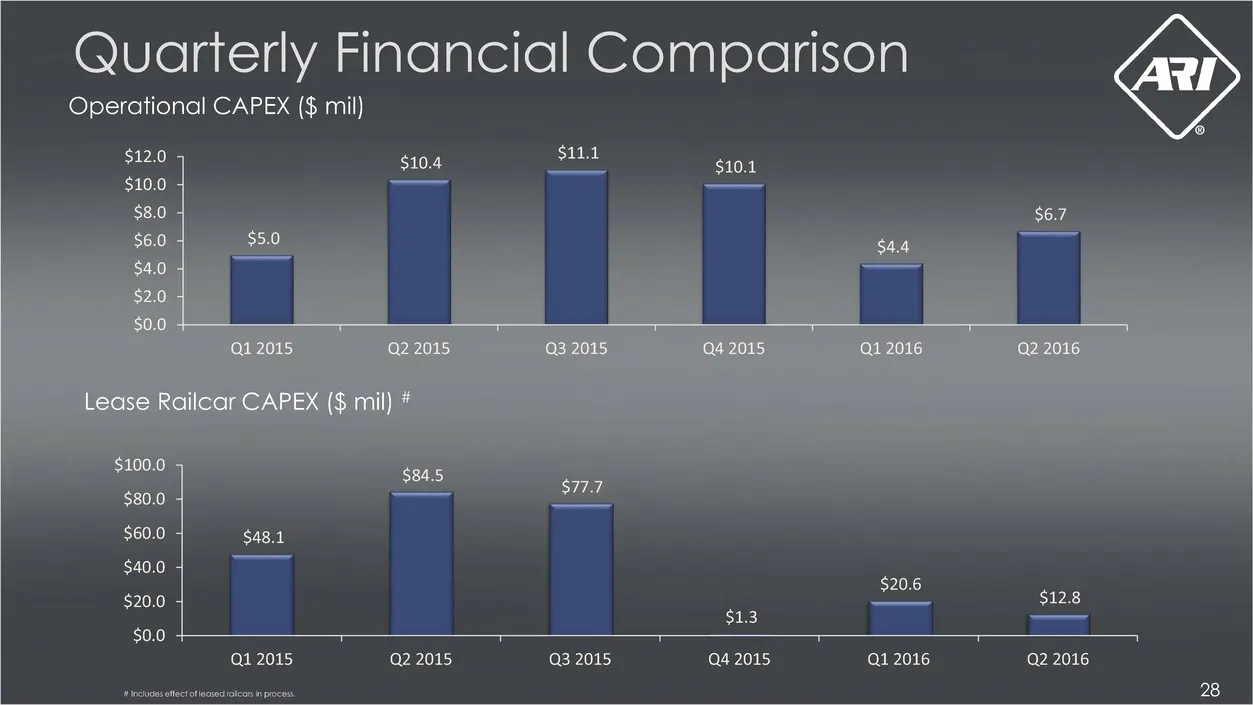
Slide 28: Quarterly Financial Comparison
Quarterly Financial Comparison Operational CAPEX ($ mil) $12.0 $11.4 $10.0 $20.6 $1.3 Qi 2015 Q3 2015 Q4 2015 Q1 2016 etfectot ected rotcas in proces
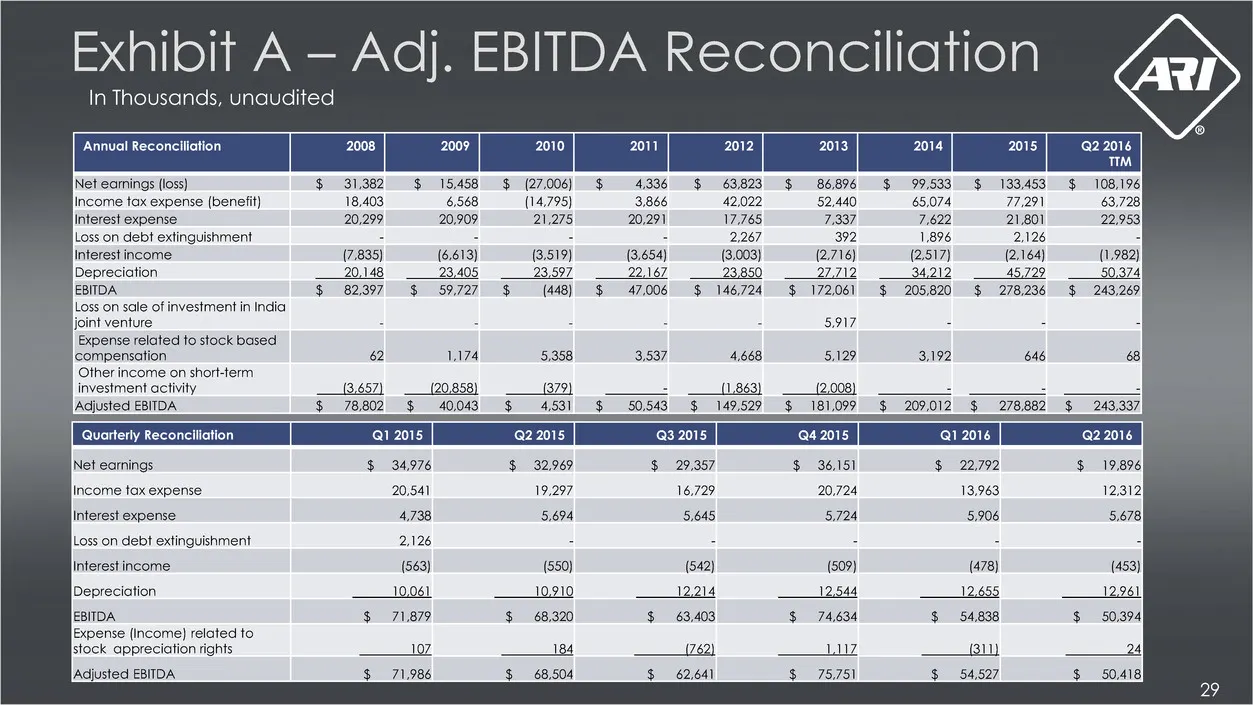
Slide 29: Exhibit A — Adj. EBITDA Reconciliation
Exhibit A — Adj. EBITDA Reconciliation In Thousands, unaudited Annual Reconciliation 2008 2011 2013 be ana (loss) $ 31382 «$15,458 (27,008) $ 4,336 $ 63823 $86,896 $133,453 tax expense (benefit) 6,568 3,866 42,022 65.0; 77.291 20,909 20.291 17,765) 21,801 : 2.26 39: E 2.126 (6.613) (Bi «st (3003) x
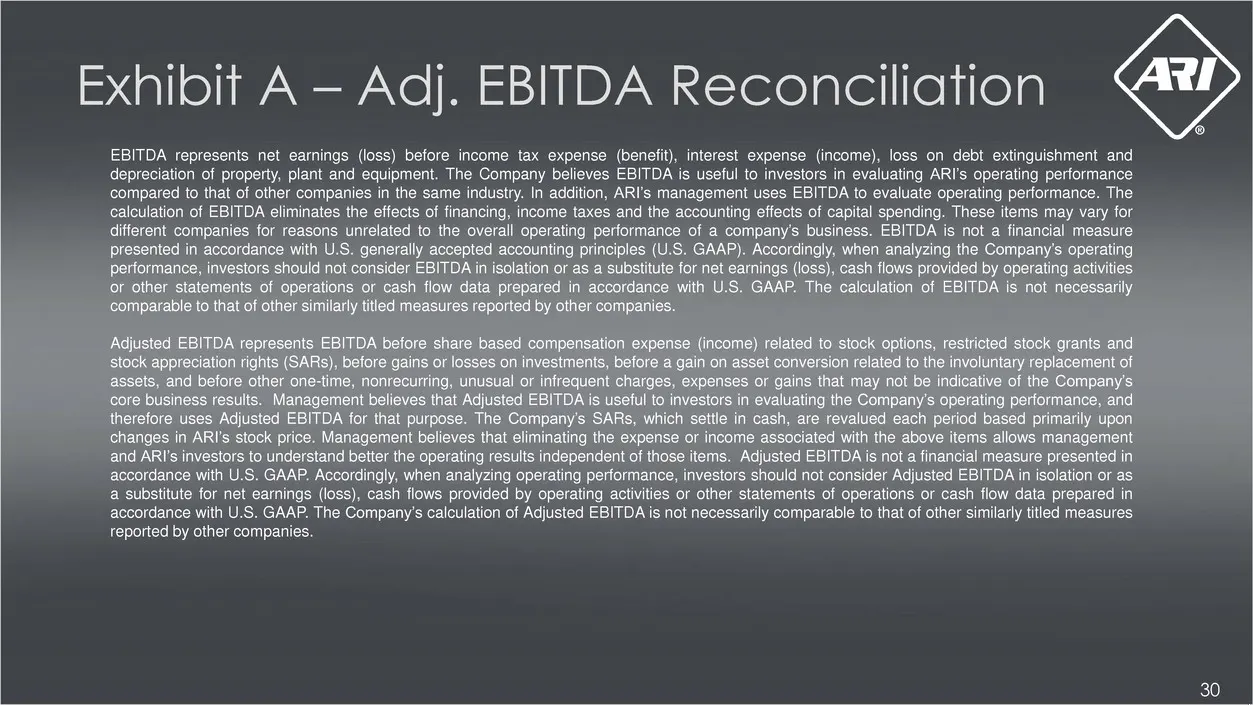
Slide 30: Exhibit A — Adj. EBITDA Reconciliation
Exhibit A — Adj. EBITDA Reconciliation EBITDA represents net eamings (loss) sain Income tax expense (benef), interest expense (Income), loss on debt CIEE and depreciation of property, plant and equipment. The Company believes EBITDA is useful to investors in evaluating ARI’s operating mance that of
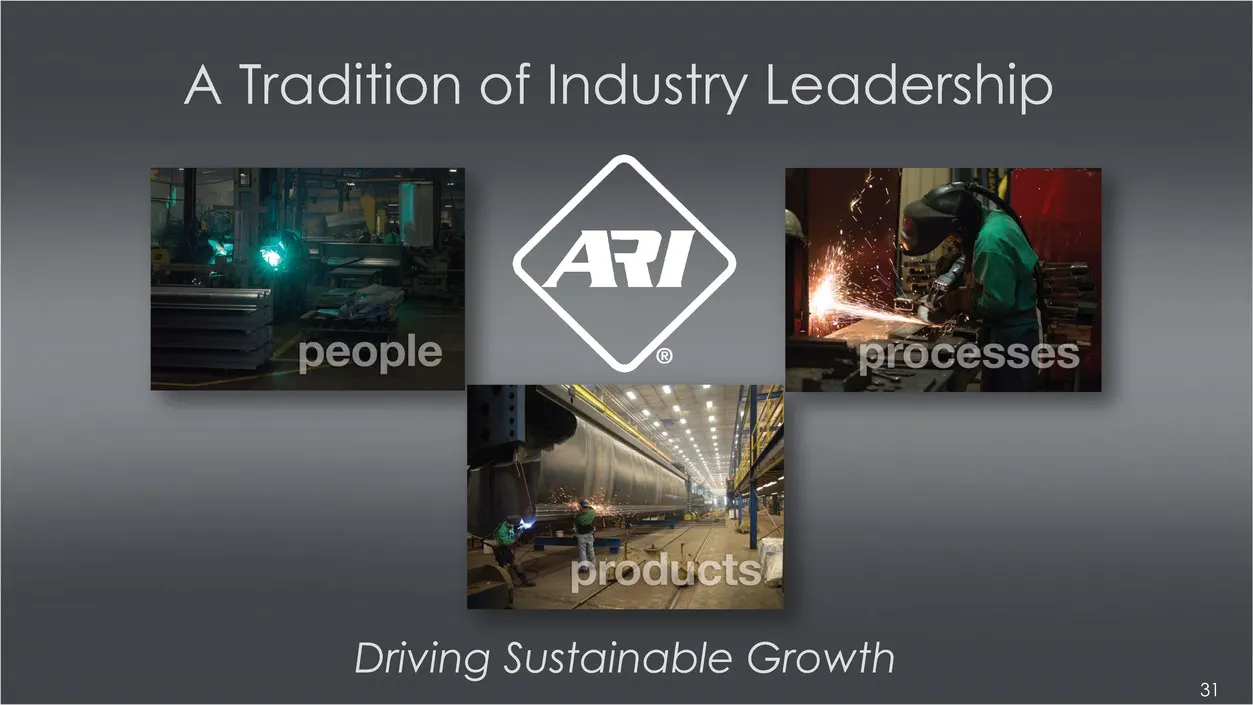
Slide 31: A Tradition of Industry Leadership
A Tradition of Industry Leadership
Source: SEC EDGAR · 8-K filed Sep 1, 2016
More decks from American Railcar Industries Inc
 Q3 2018 Earnings Presentation19 slides · Oct 30, 2018
 Investor Presentation (August 2018)26 slides · Aug 24, 2018
 Q2 2018 Earnings Presentation19 slides · Aug 1, 2018
 Q1 2018 Earnings Presentation18 slides · May 1, 2018
 Q4 2017 Earnings Presentation19 slides · Feb 23, 2018
 Cowen conference 201824 slides · Feb 6, 2018