Flutter Entertainment plc · NYSE:FLUT
Flutter Entertainment — Betfair Group — H1 FY12 Earnings Presentation
47 slides from Flutter Entertainment's earnings presentation, Dec 14, 2011
Slide 1: FY12 Interim Results
FY12 INTERIM RESULTS 14 December 2011
Slide 2: Disclaimer
DISCLAIMER This presentation and its contents may not be reproduced, redistributed or passed on, directly or indirectly, to any other person or published, in whole or in part for any purpose without the consent of Betfair Group plc ("Betfair"). This presentation does not constitute or form part of a
Slide 3: Introduction
INTRODUCTION David Yu – Chief Executive Officer
Slide 4: Delivering against our priorities
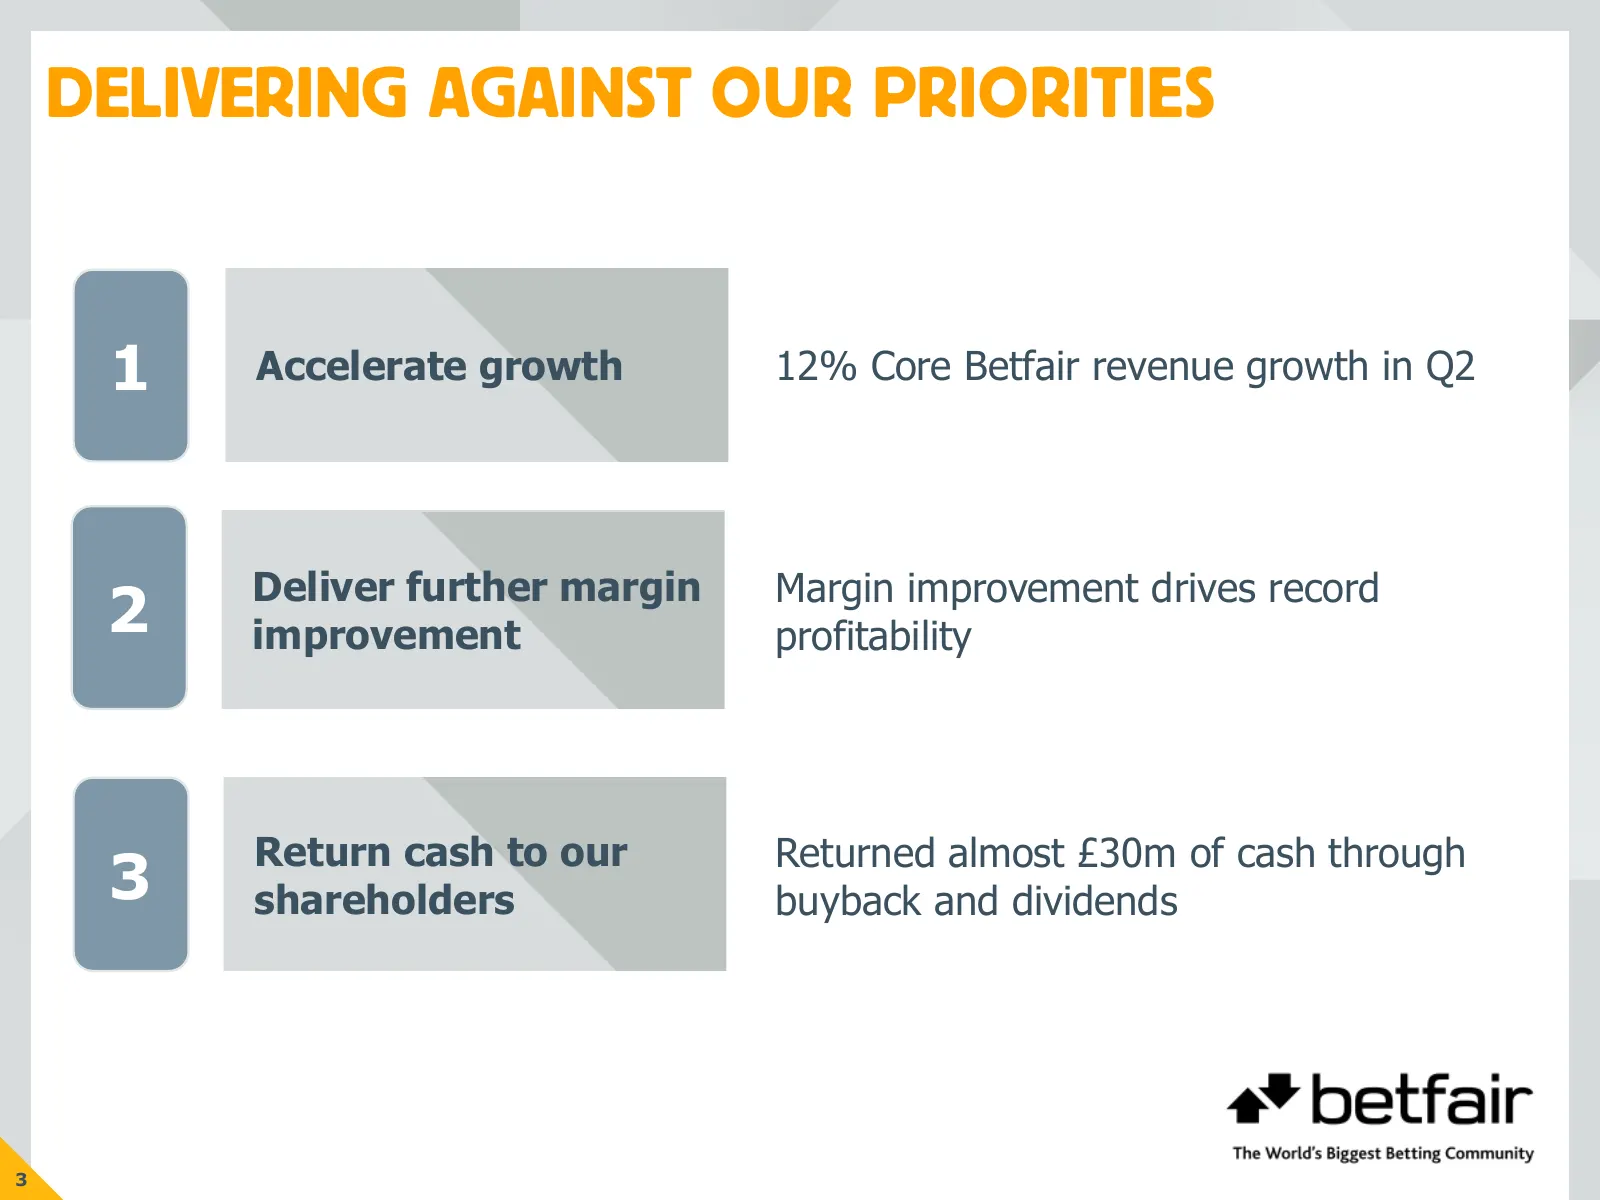
DELIVERING AGAINST OUR PRIORITIES 1 Accelerate growth 12% Core Betfair revenue growth in Q2 Deliver further margin Margin improvement drives record 2 improvement profitability Return cash to our Returned almost £30m of cash through 3 shareholders buyback and dividends 3
Slide 5: Operational highlights
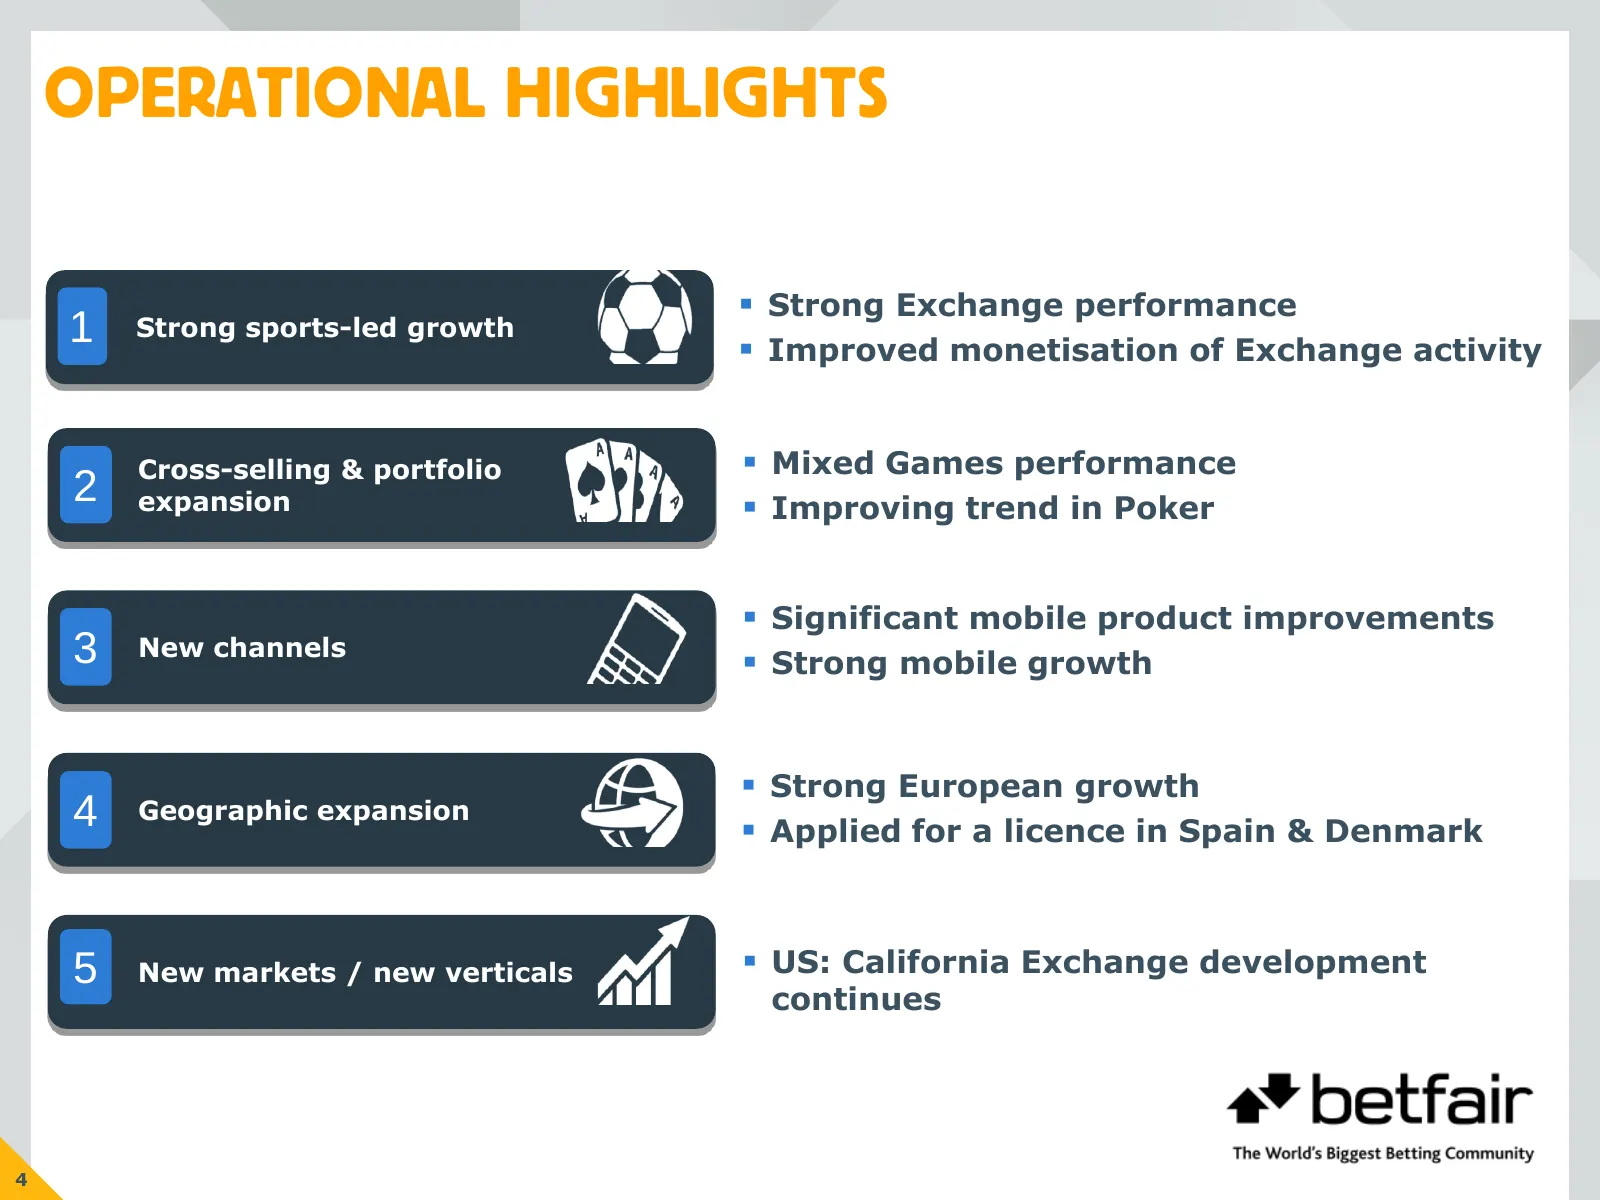
OPERATIONAL HIGHLIGHTS Strong Exchange performance 1 Strong sports-led growth Improved monetisation of Exchange activity Cross-selling & portfolio Mixed Games performance 2 expansion Improving trend in Poker Significant mobile product improvements 3 New channels Strong mobile growth St
Slide 6: Financial results
FINANCIAL RESULTS Stephen Morana – Chief Financial Officer
Slide 7: H1 summary
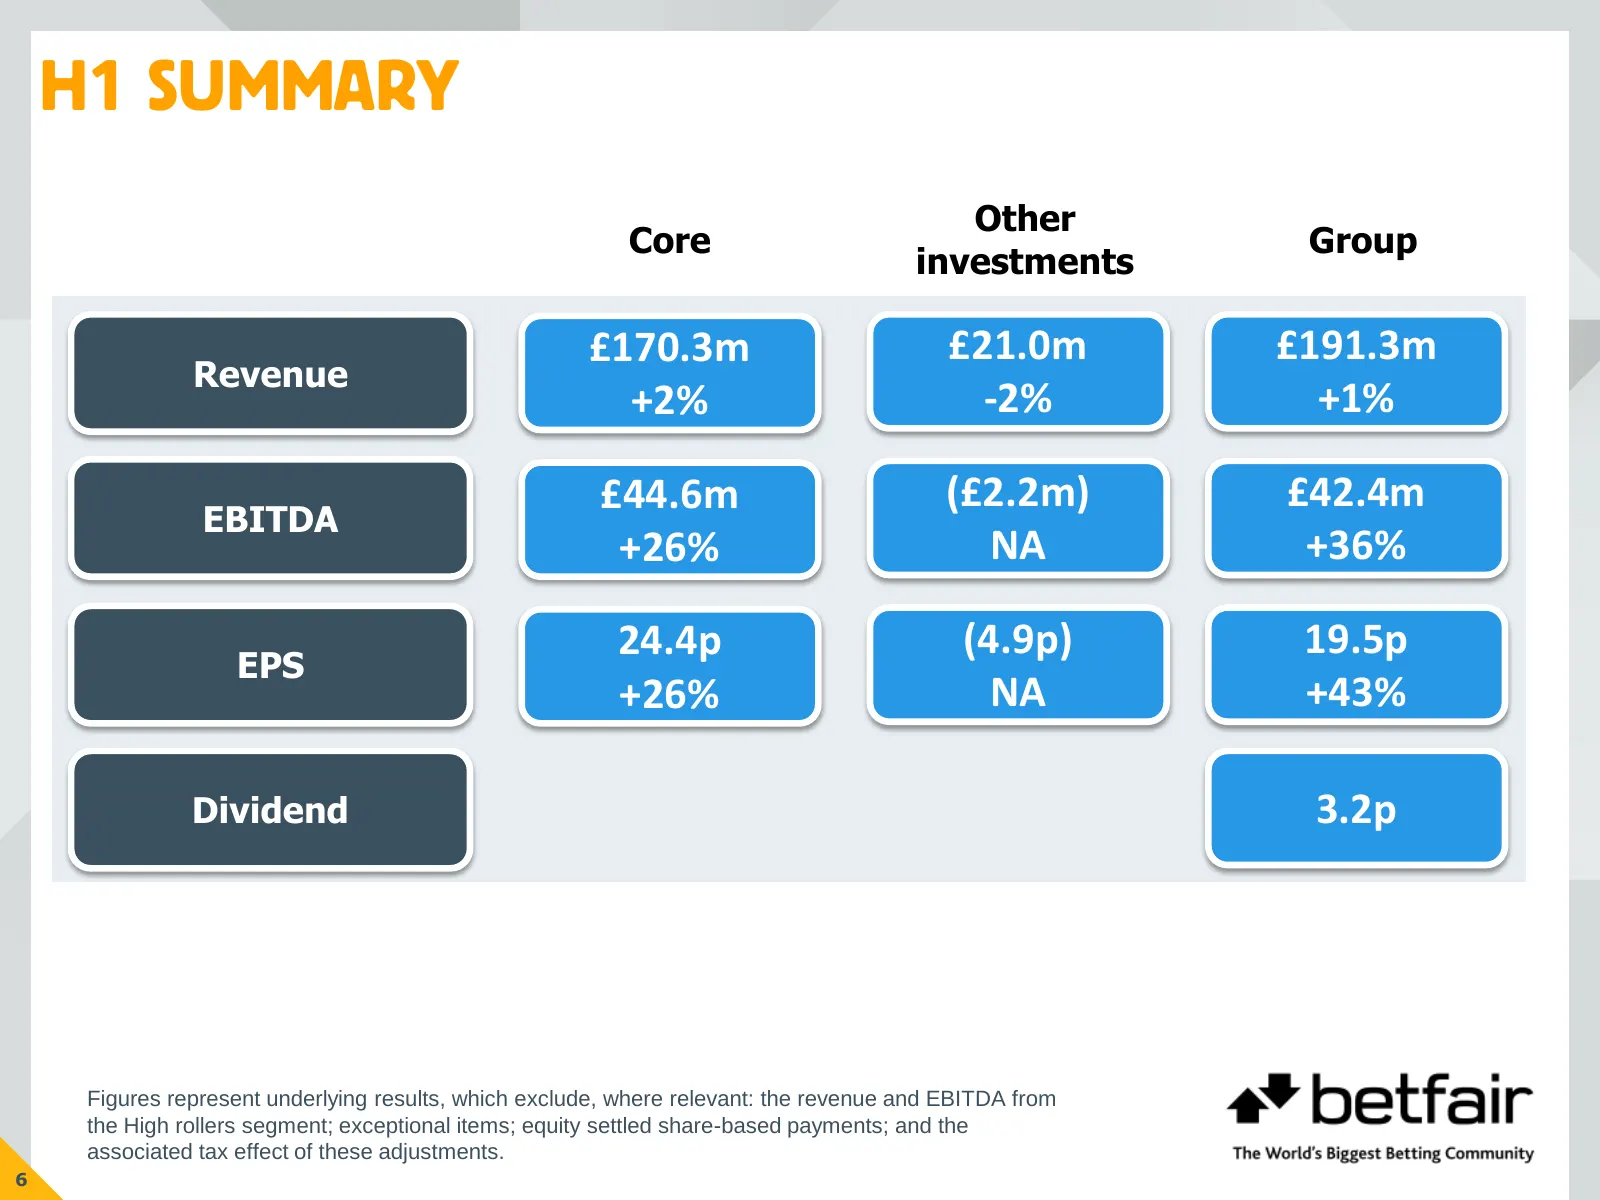
H1 SUMMARY Other Core Group investments £170.3m £21.0m £191.3m Revenue +2% -2% +1% £44.6m (£2.2m) £42.4m EBITDA +26% NA +36% 24.4p (4.9p) 19.5p EPS +26% NA +43% Dividend 3.2p Figures represent underlying results, which exclude, where relevant: the revenue and EBITDA from the High rollers segment; ex
Slide 8: Core Betfair: YoY revenue growth
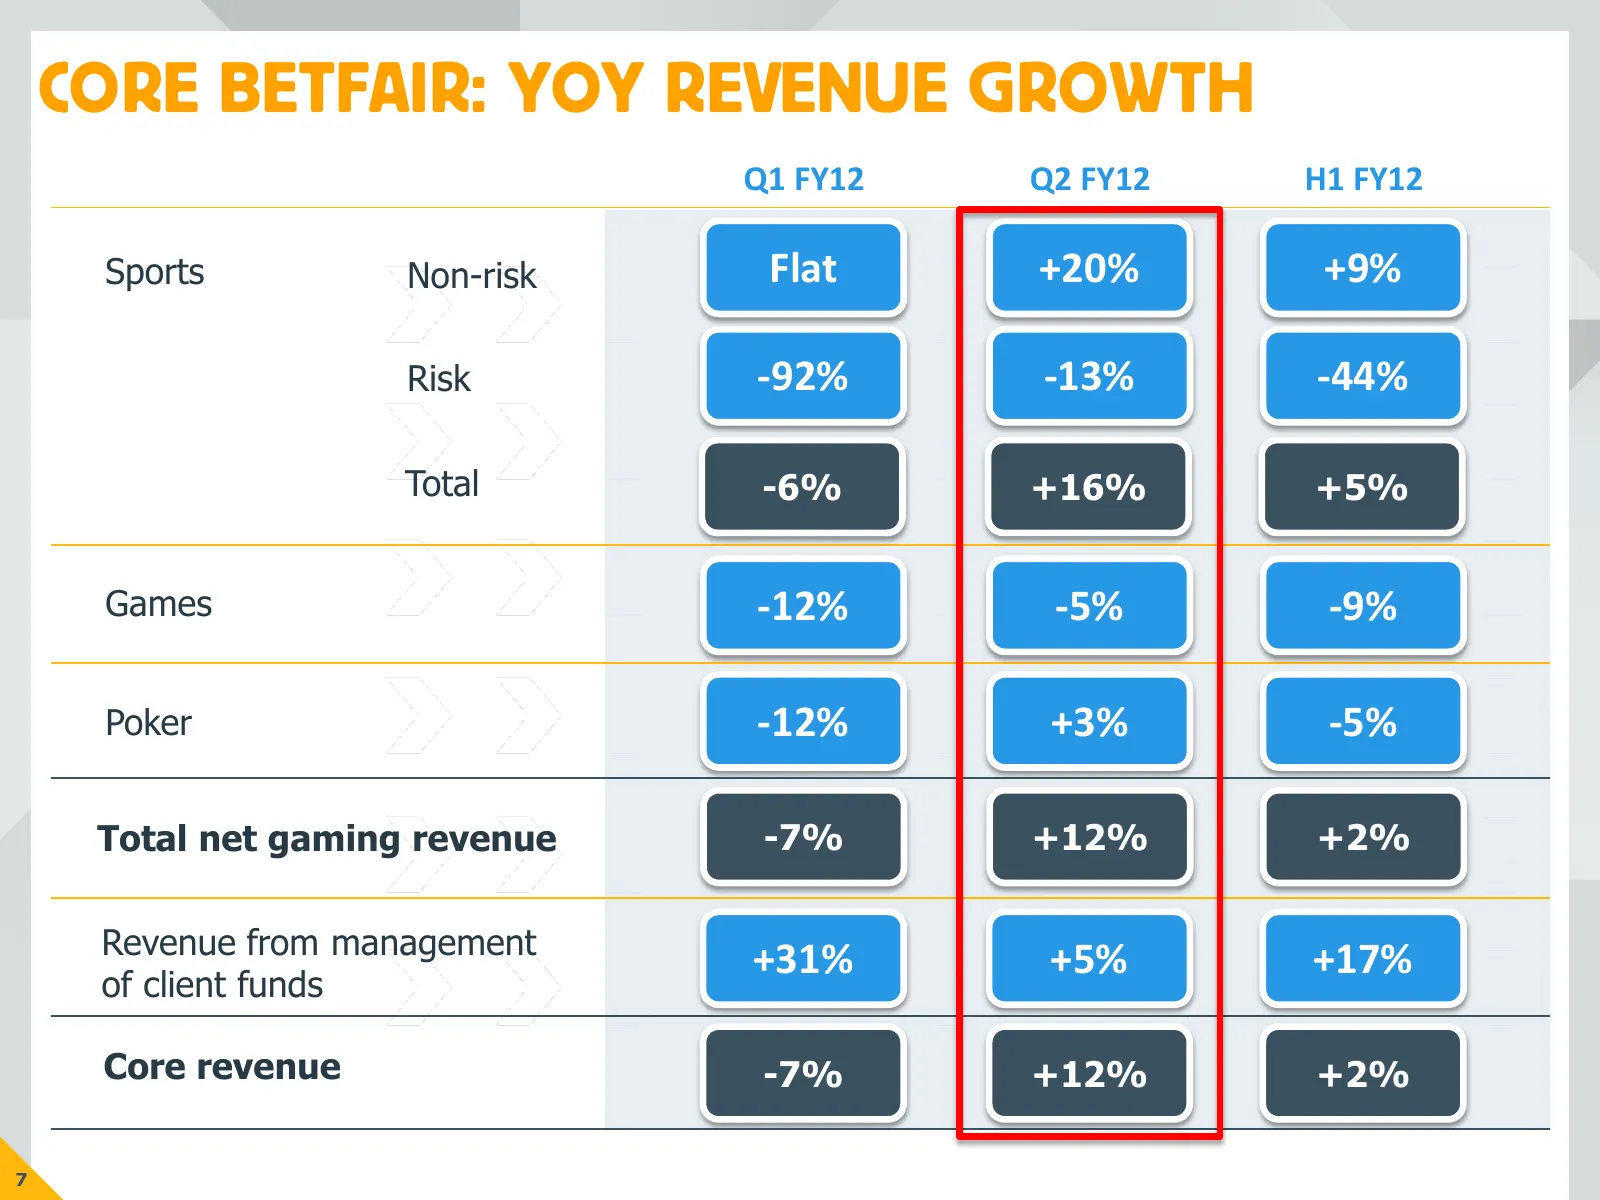
CORE BETFAIR: YOY REVENUE GROWTH Q1 FY12 Q2 FY12 H1 FY12 Sports Non-risk Flat +20% +9% Risk -92% -13% -44% Total -6% +16% +5% Games -12% -5% -9% Poker -12% +3% -5% Total net gaming revenue -7% +12% +2% Revenue from management +31% +5% +17% of client funds Core revenue -7% +12% +2% 7
Slide 9: Core Betfair: non-risk sports
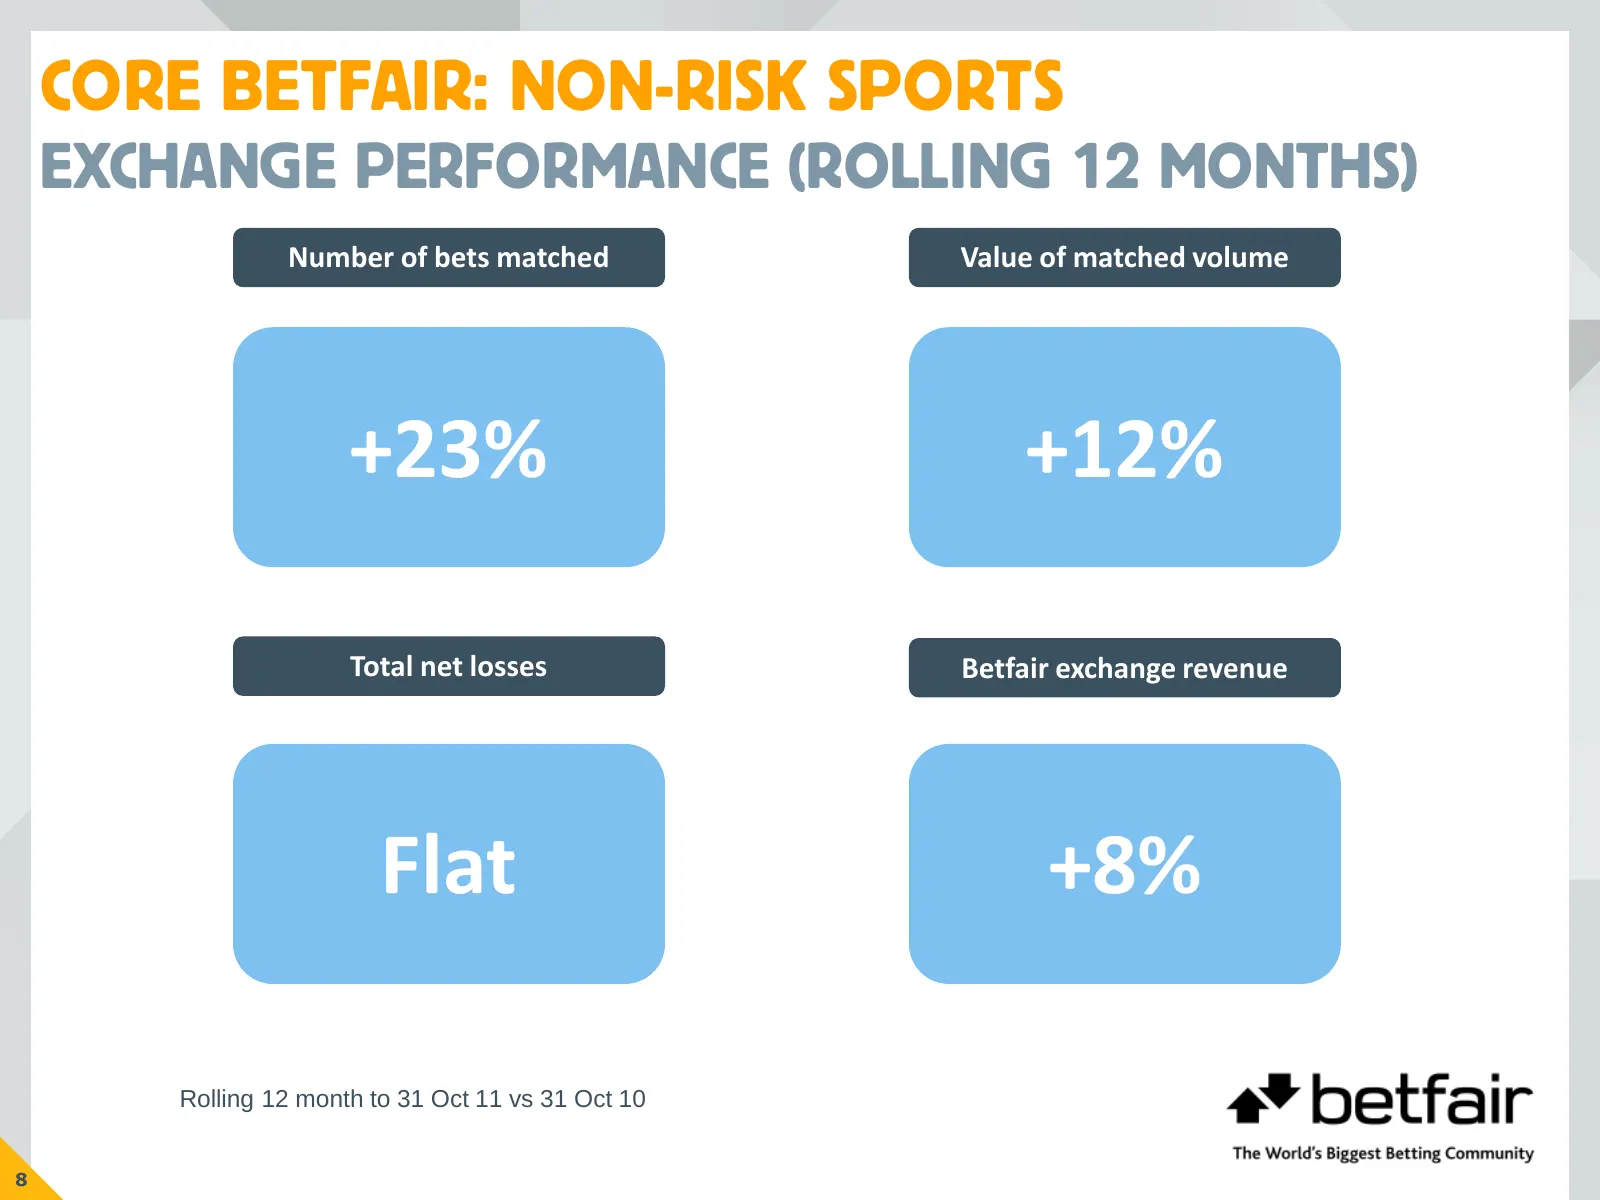
CORE BETFAIR: NON-RISK SPORTS EXCHANGE PERFORMANCE (ROLLING 12 MONTHS) Number of bets matched Value of matched volume +23% +12% Total net losses Betfair exchange revenue Flat +8% Rolling 12 month to 31 Oct 11 vs 31 Oct 10 8
Slide 10: Non-risk sports: improved monetisation - education
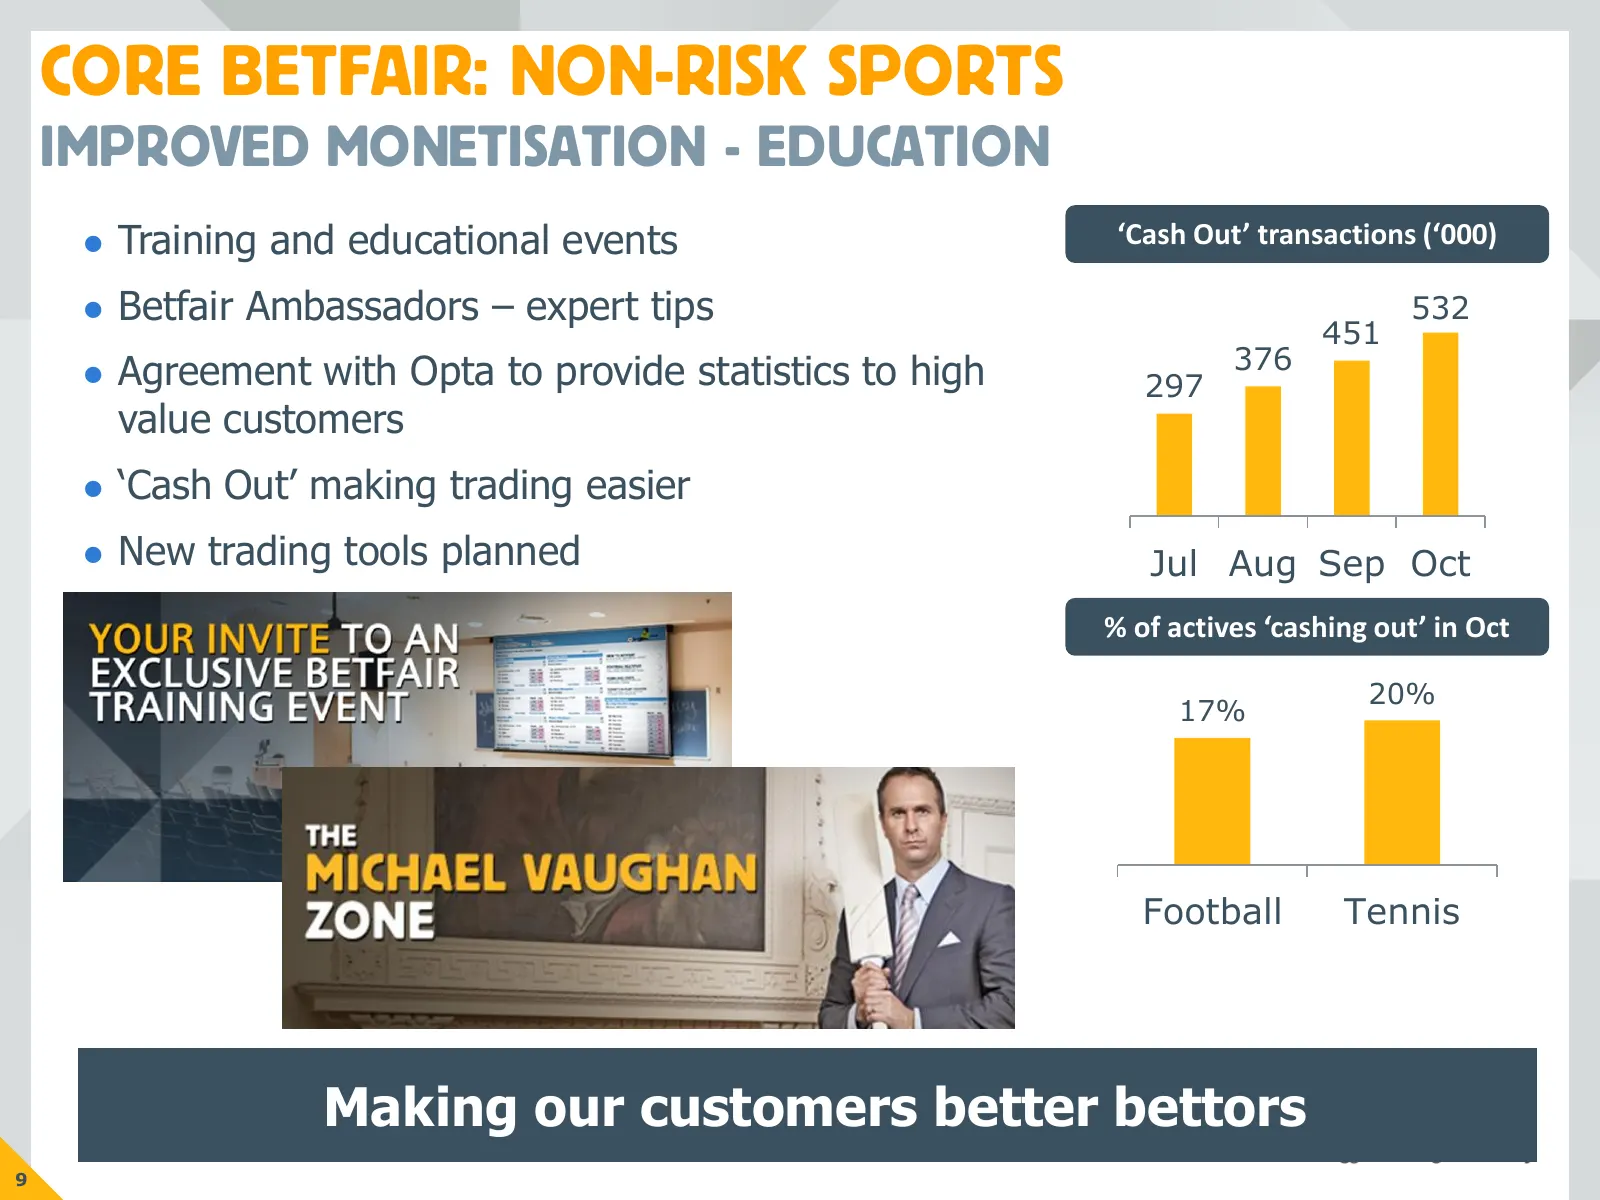
CORE BETFAIR: NON-RISK SPORTS IMPROVED MONETISATION - EDUCATION Training and educational events ‘Cash Out’ transactions (‘000) Betfair Ambassadors – expert tips 532 451 376 Agreement with Opta to provide statistics to high 297 value customers ‘Cash Out’ making trading easier New trading to
Slide 11: Non-risk sports: improved monetisation - pricing
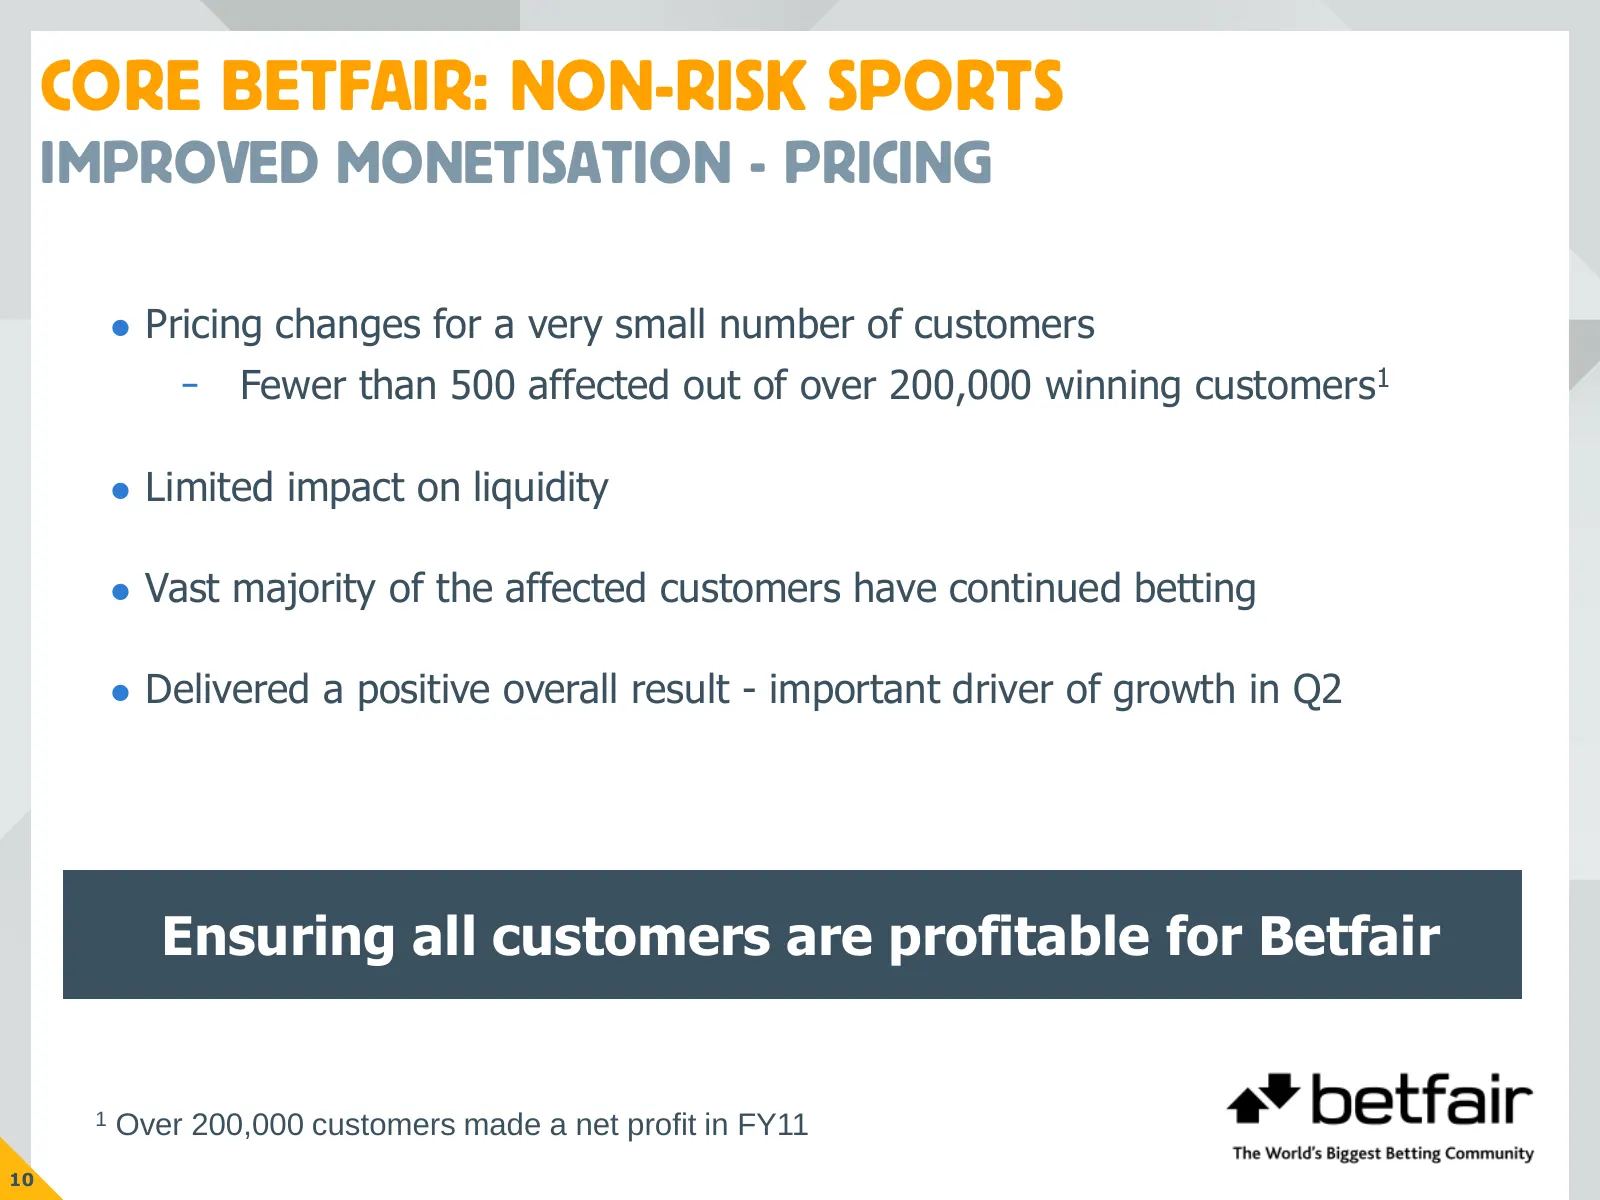
CORE BETFAIR: NON-RISK SPORTS IMPROVED MONETISATION - PRICING Pricing changes for a very small number of customers ̵ Fewer than 500 affected out of over 200,000 winning customers1 Limited impact on liquidity Vast majority of the affected customers have continued betting Delivered a positive
Slide 12: Core Betfair: KPIs
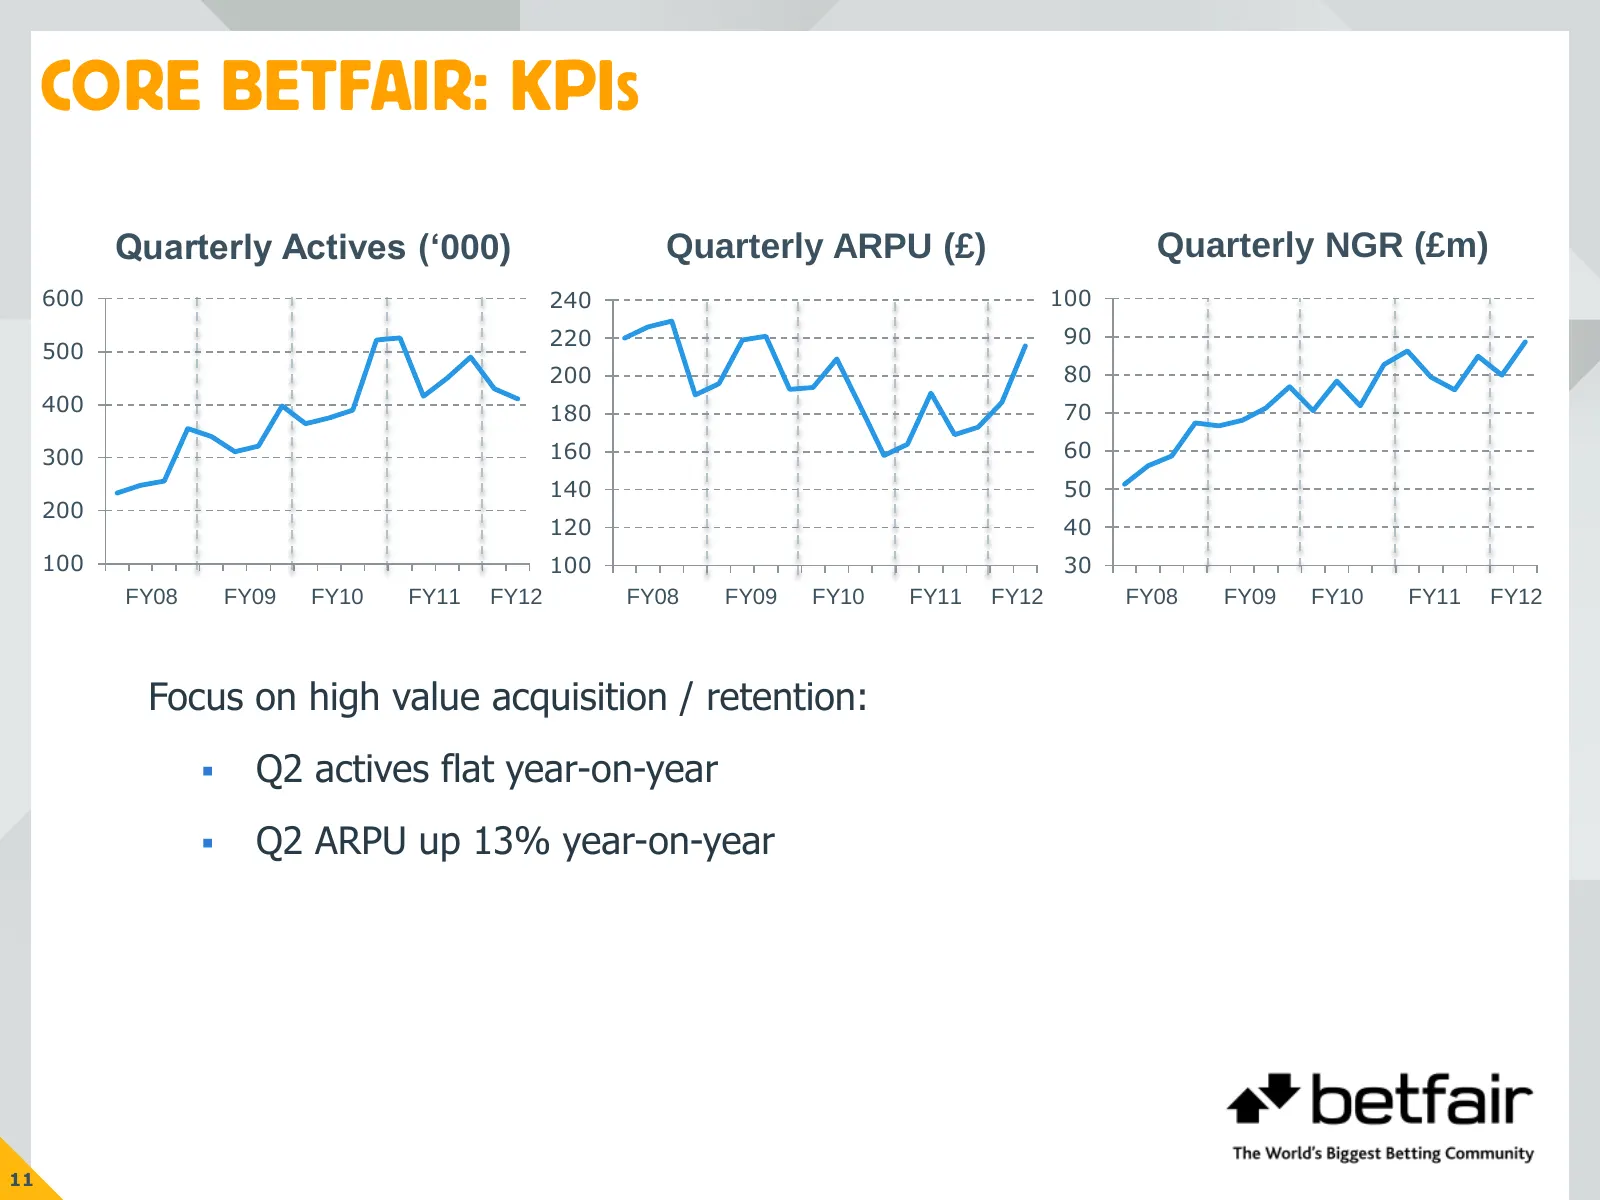
CORE BETFAIR: KPIS Quarterly Actives (‘000) Quarterly ARPU (£) Quarterly NGR (£m) 600 240 100 220 90 500 200 80 400 180 70 300 160 60 140 50 200 120 40 100 100 30 FY08 FY09 FY10 FY11 FY12 FY08 FY09 FY10 FY11 FY12 FY08 FY09 FY10 FY11 FY12 Focus on high value acquisition / retention: Q2 actives flat
Slide 13: Core Betfair: risk sports
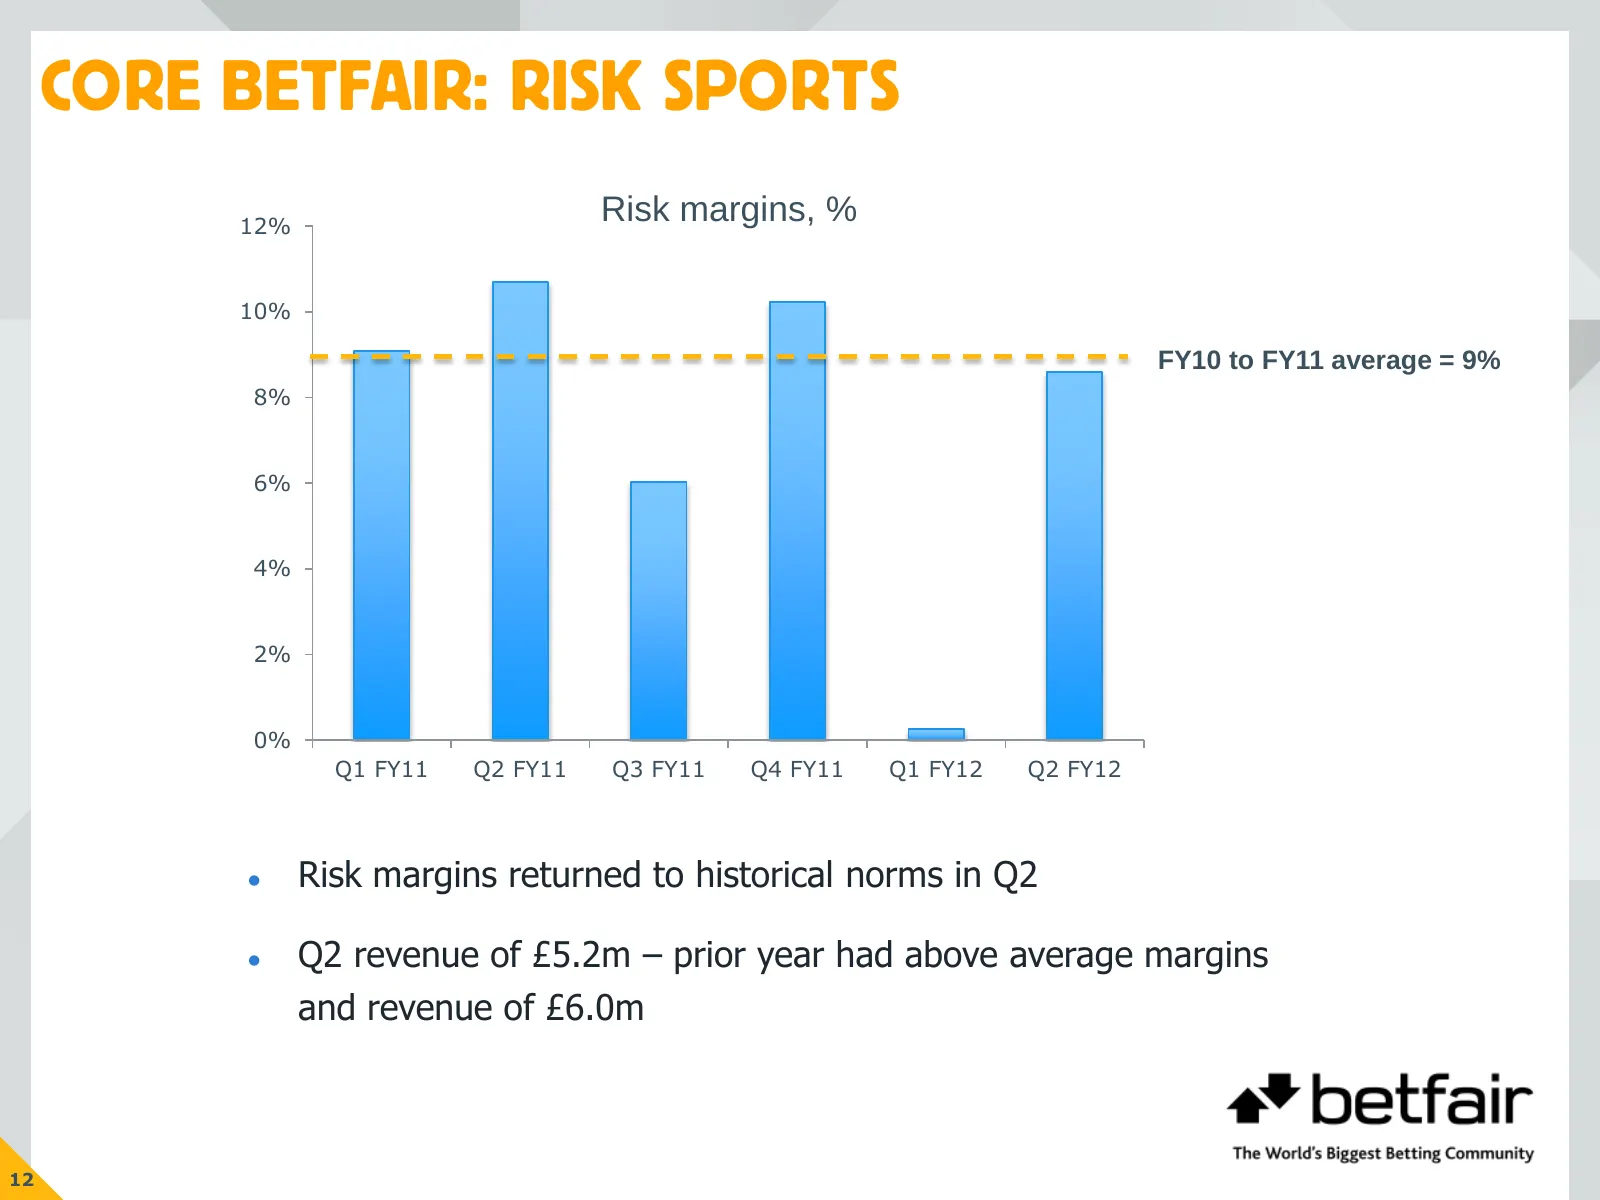
CORE BETFAIR: RISK SPORTS 12% Risk margins, % 10% FY10 to FY11 average = 9% 8% 6% 4% 2% 0% Q1 FY11 Q2 FY11 Q3 FY11 Q4 FY11 Q1 FY12 Q2 FY12 Risk margins returned to historical norms in Q2 Q2 revenue of £5.2m – prior year had above average margins and revenue of £6.0m 12
Slide 14: Core Betfair: costs
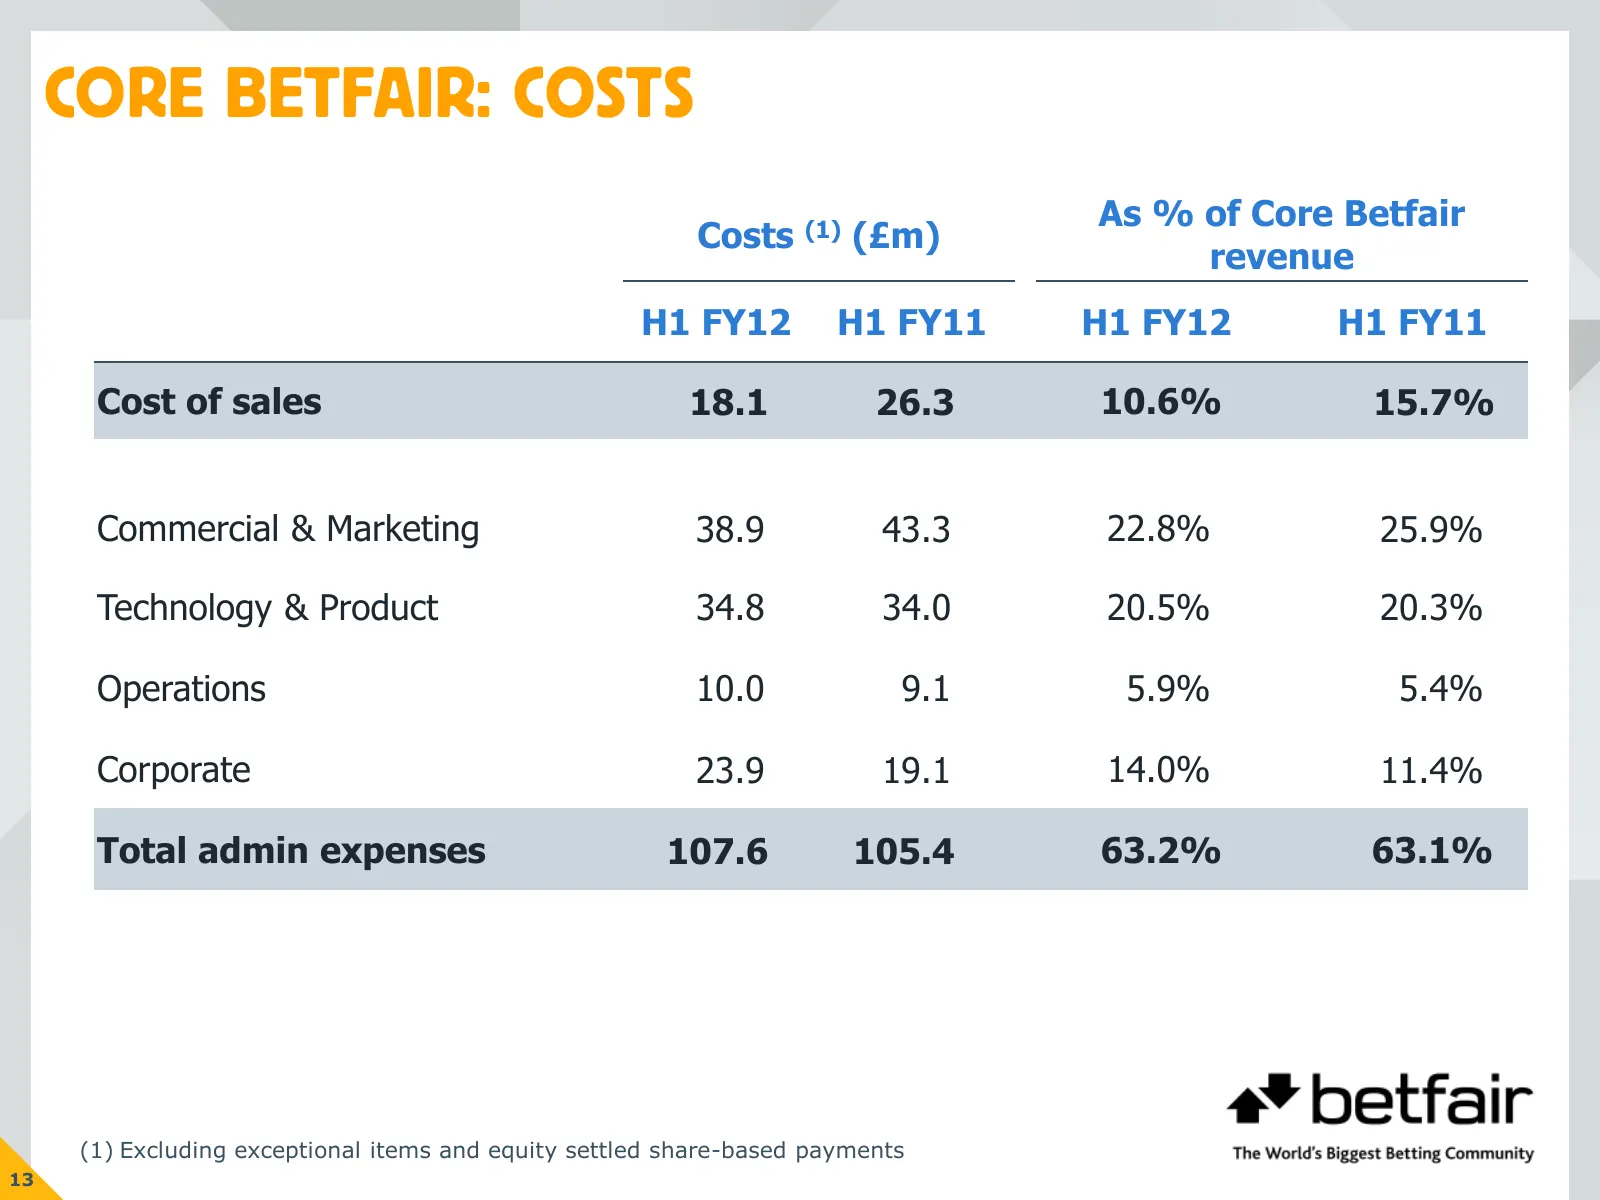
CORE BETFAIR: COSTS As % of Core Betfair Costs (1) (£m) revenue H1 FY12 H1 FY11 H1 FY12 H1 FY11 Cost of sales 18.1 26.3 10.6% 15.7% Commercial & Marketing 38.9 43.3 22.8% 25.9% Technology & Product 34.8 34.0 20.5% 20.3% Operations 10.0 9.1 5.9% 5.4% Corporate 23.9 19.1 14.0% 11.4% Total admin expens
Slide 15: Core Betfair: EBITDA development
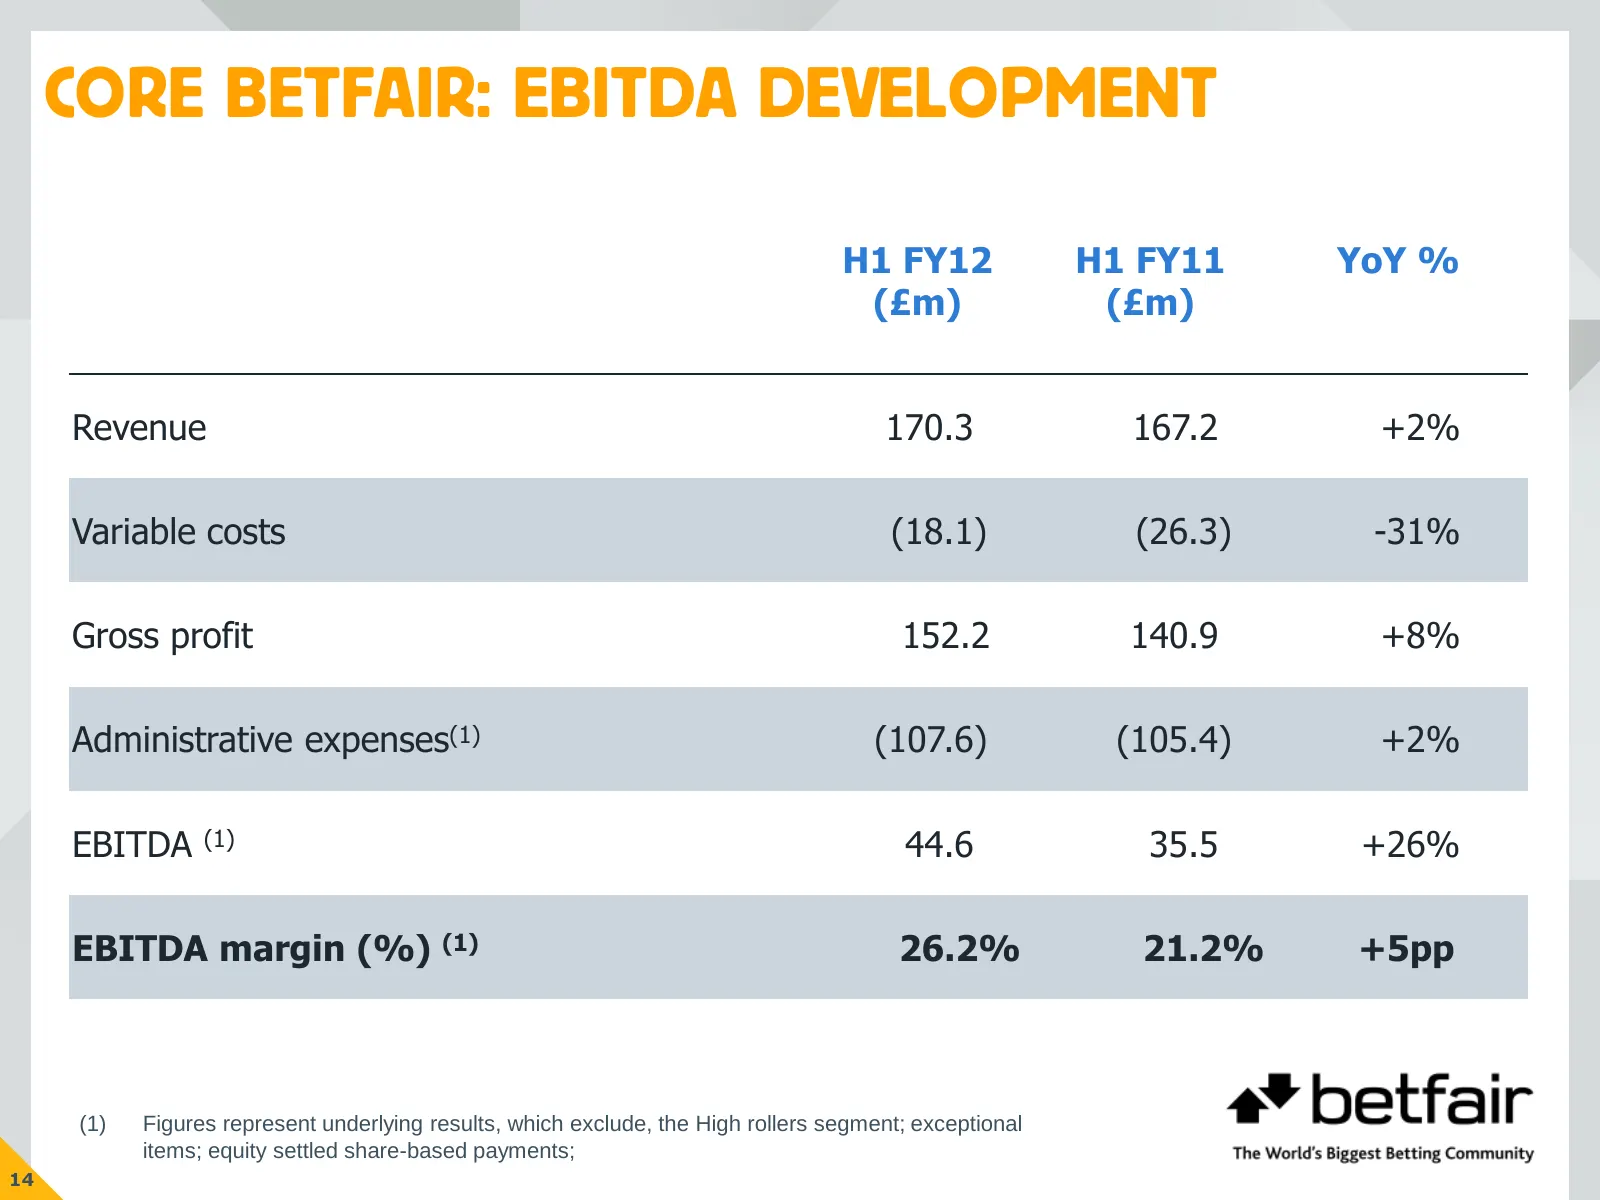
CORE BETFAIR: EBITDA DEVELOPMENT H1 FY12 H1 FY11 YoY % (£m) (£m) Revenue 170.3 167.2 +2% Variable costs (18.1) (26.3) -31% Gross profit 152.2 140.9 +8% Administrative expenses(1) (107.6) (105.4) +2% EBITDA (1) 44.6 35.5 +26% EBITDA margin (%) (1) 26.2% 21.2% +5pp (1) Figures represent underlying res
Slide 16: Other investments: Betfair US
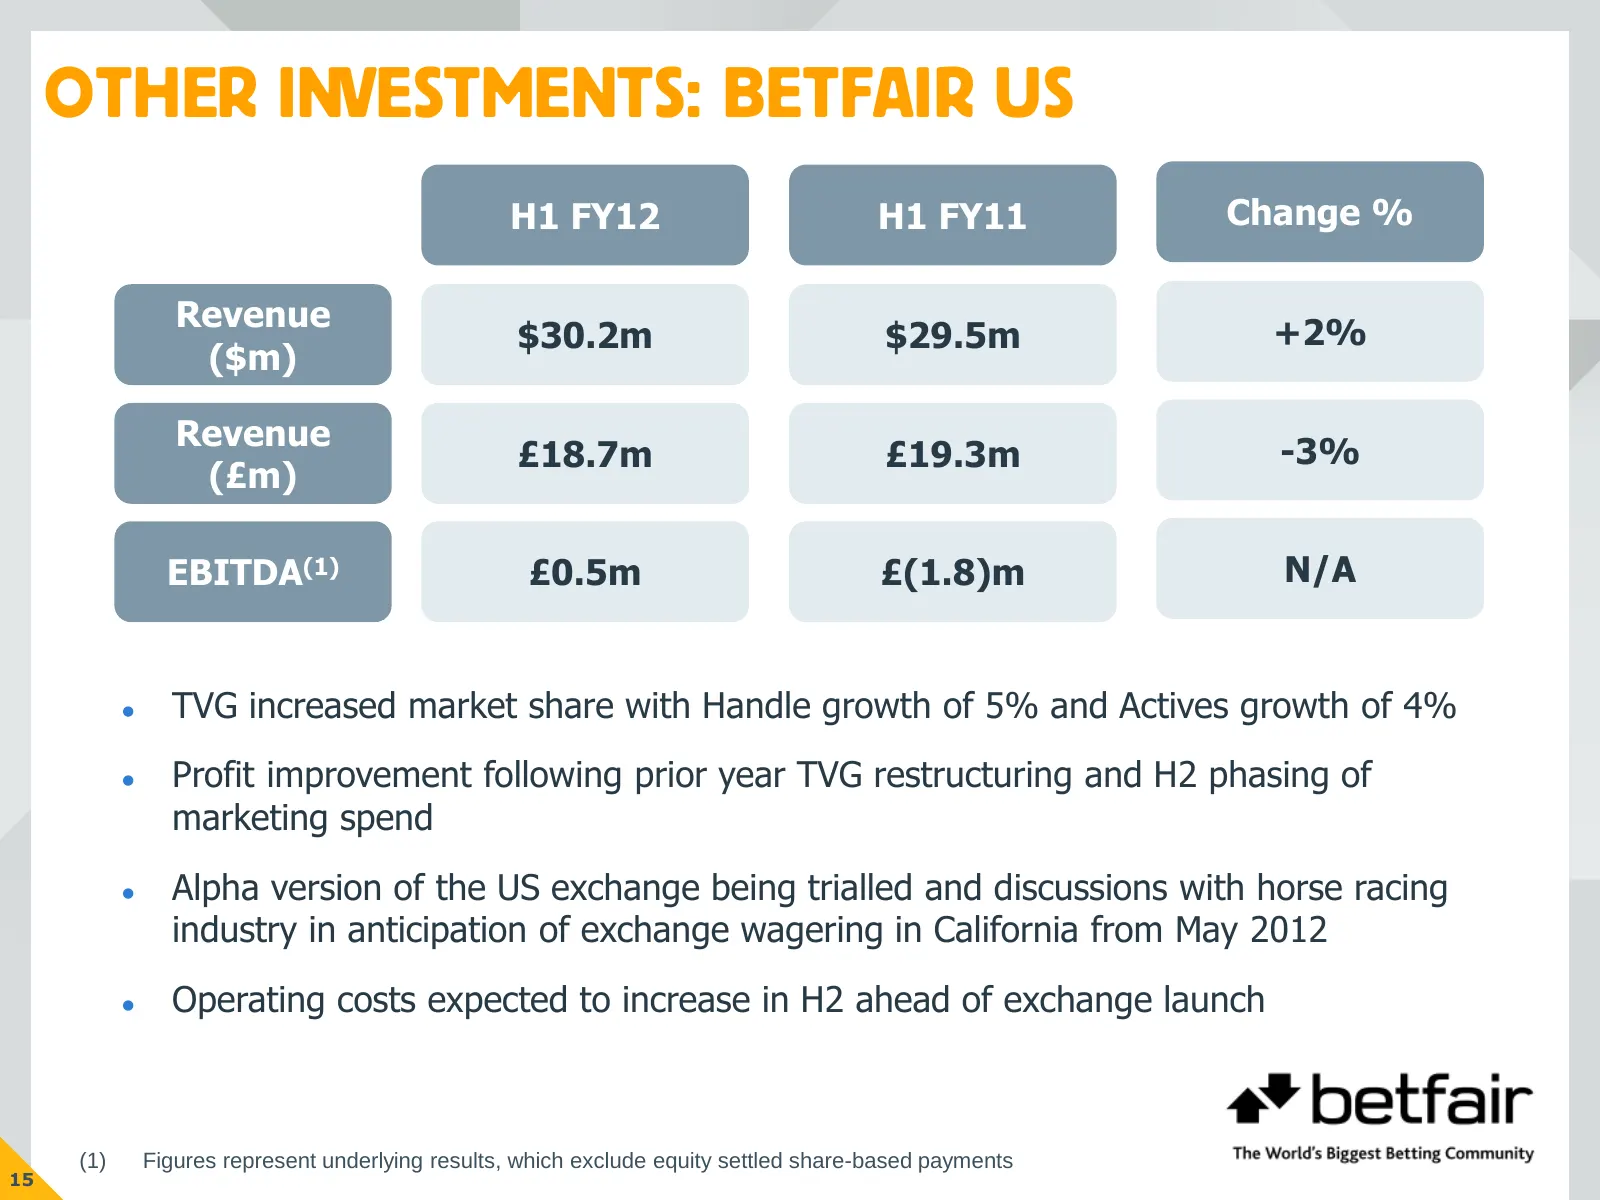
OTHER INVESTMENTS: BETFAIR US H1 FY12 H1 FY11 Change % Revenue $30.2m $29.5m +2% ($m) Revenue £18.7m £19.3m -3% (£m) EBITDA(1) £0.5m £(1.8)m N/A TVG increased market share with Handle growth of 5% and Actives growth of 4% Profit improvement following prior year TVG restructuring and H2 phasing o
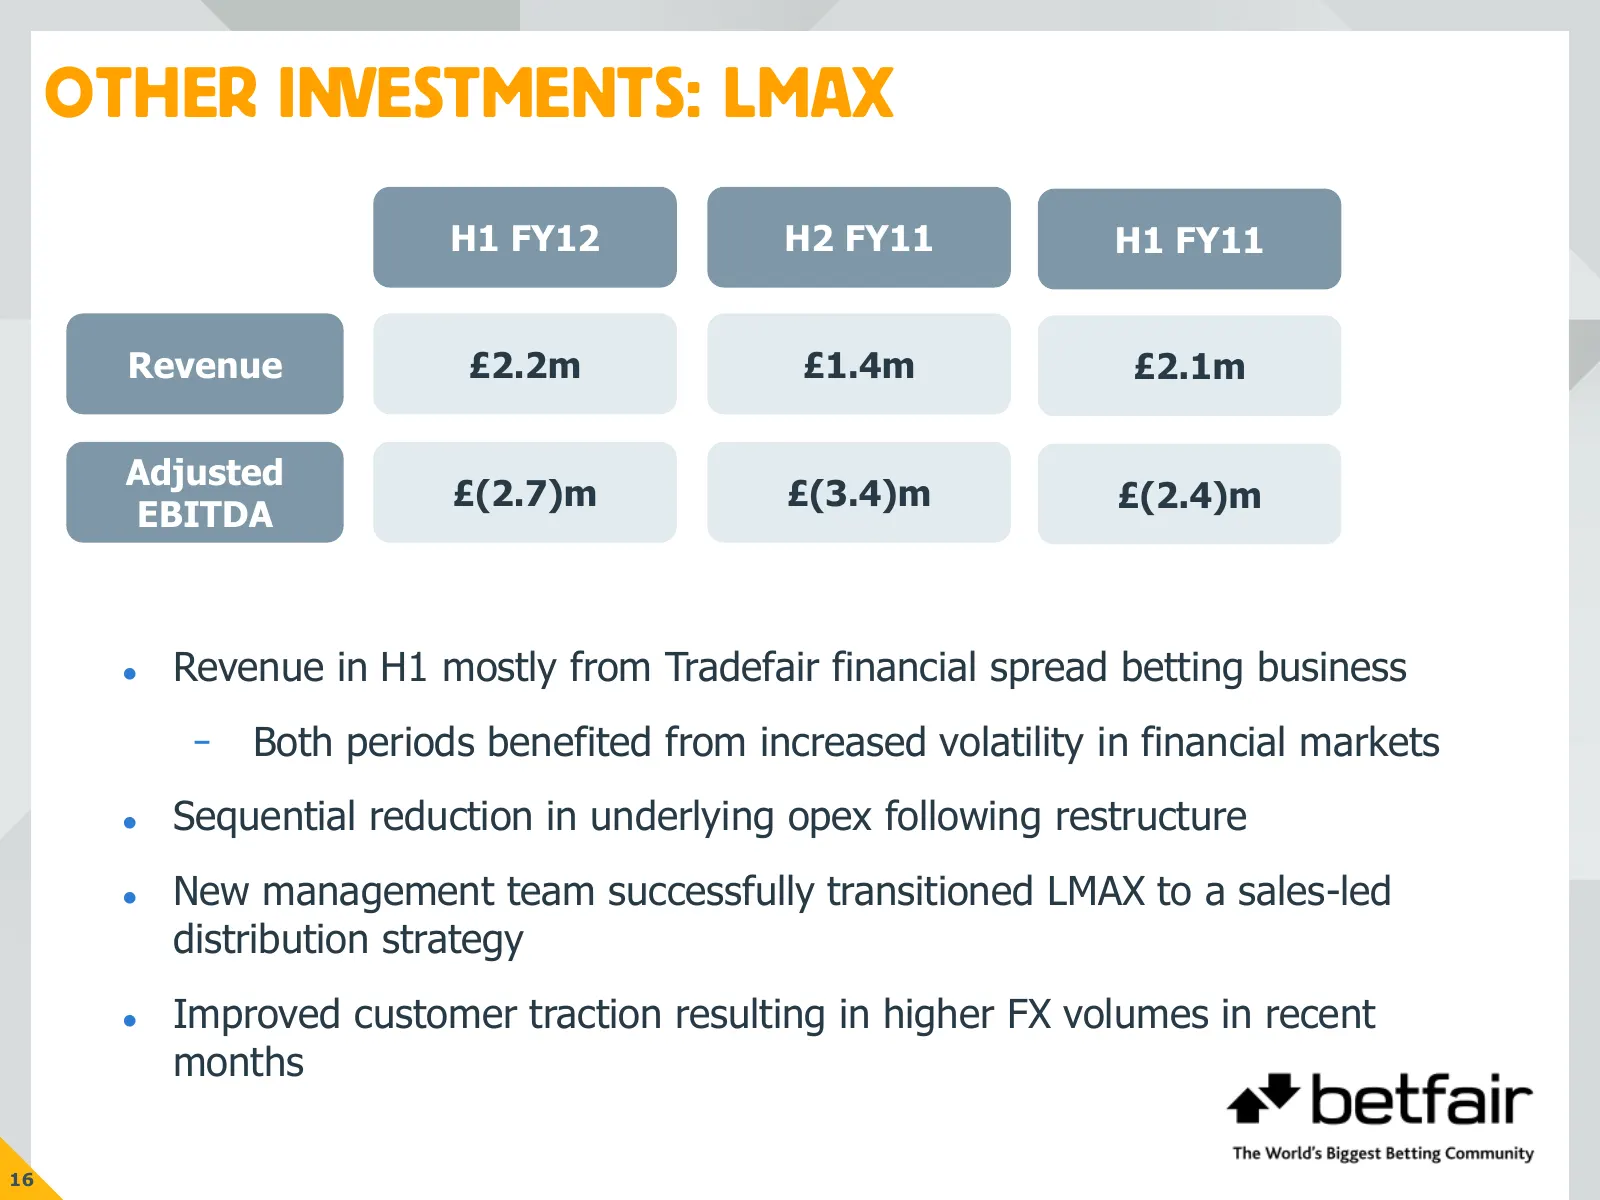
Slide 17: Other investments: LMAX
OTHER INVESTMENTS: LMAX H1 FY12 H2 FY11 H1 FY11 Revenue £2.2m £1.4m £2.1m Adjusted £(2.7)m £(3.4)m £(2.4)m EBITDA Revenue in H1 mostly from Tradefair financial spread betting business ̵ Both periods benefited from increased volatility in financial markets Sequential reduction in underlying opex
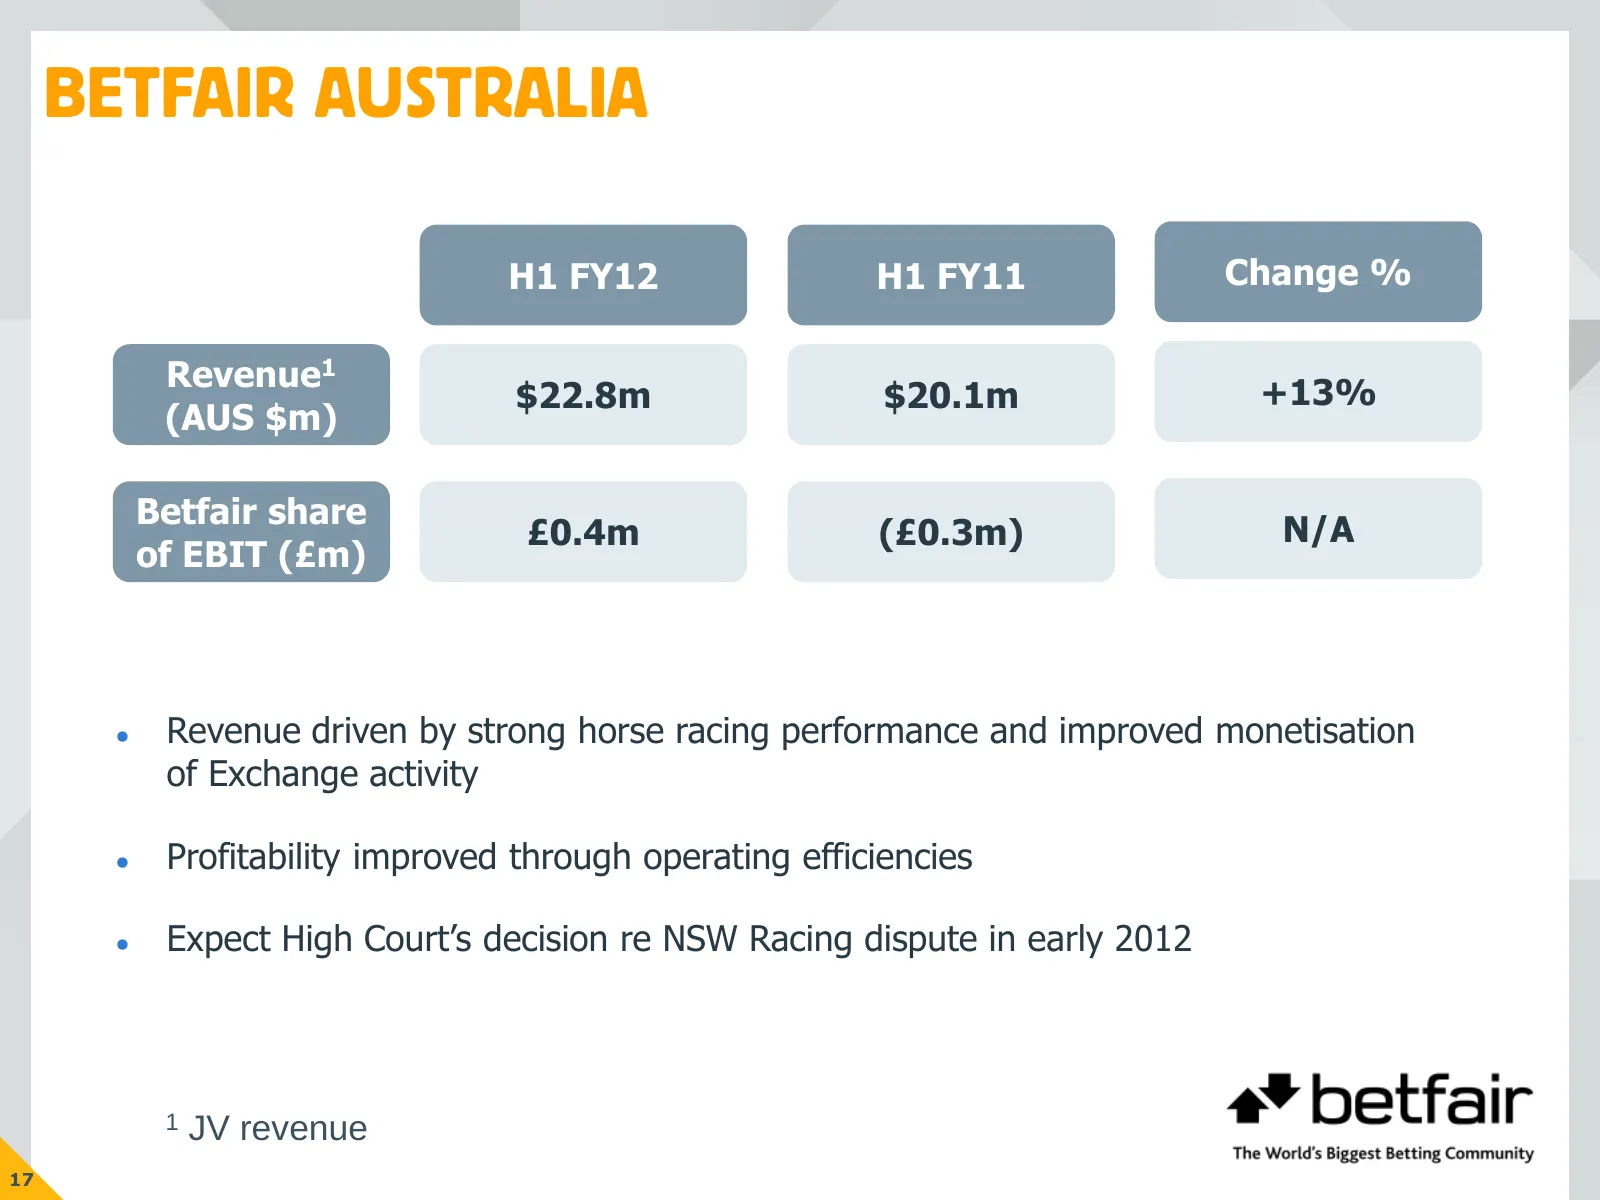
Slide 18: Betfair Australia
BETFAIR AUSTRALIA H1 FY12 H1 FY11 Change % Revenue1 $22.8m $20.1m +13% (AUS $m) Betfair share £0.4m (£0.3m) N/A of EBIT (£m) Revenue driven by strong horse racing performance and improved monetisation of Exchange activity Profitability improved through operating efficiencies Expect High Court’
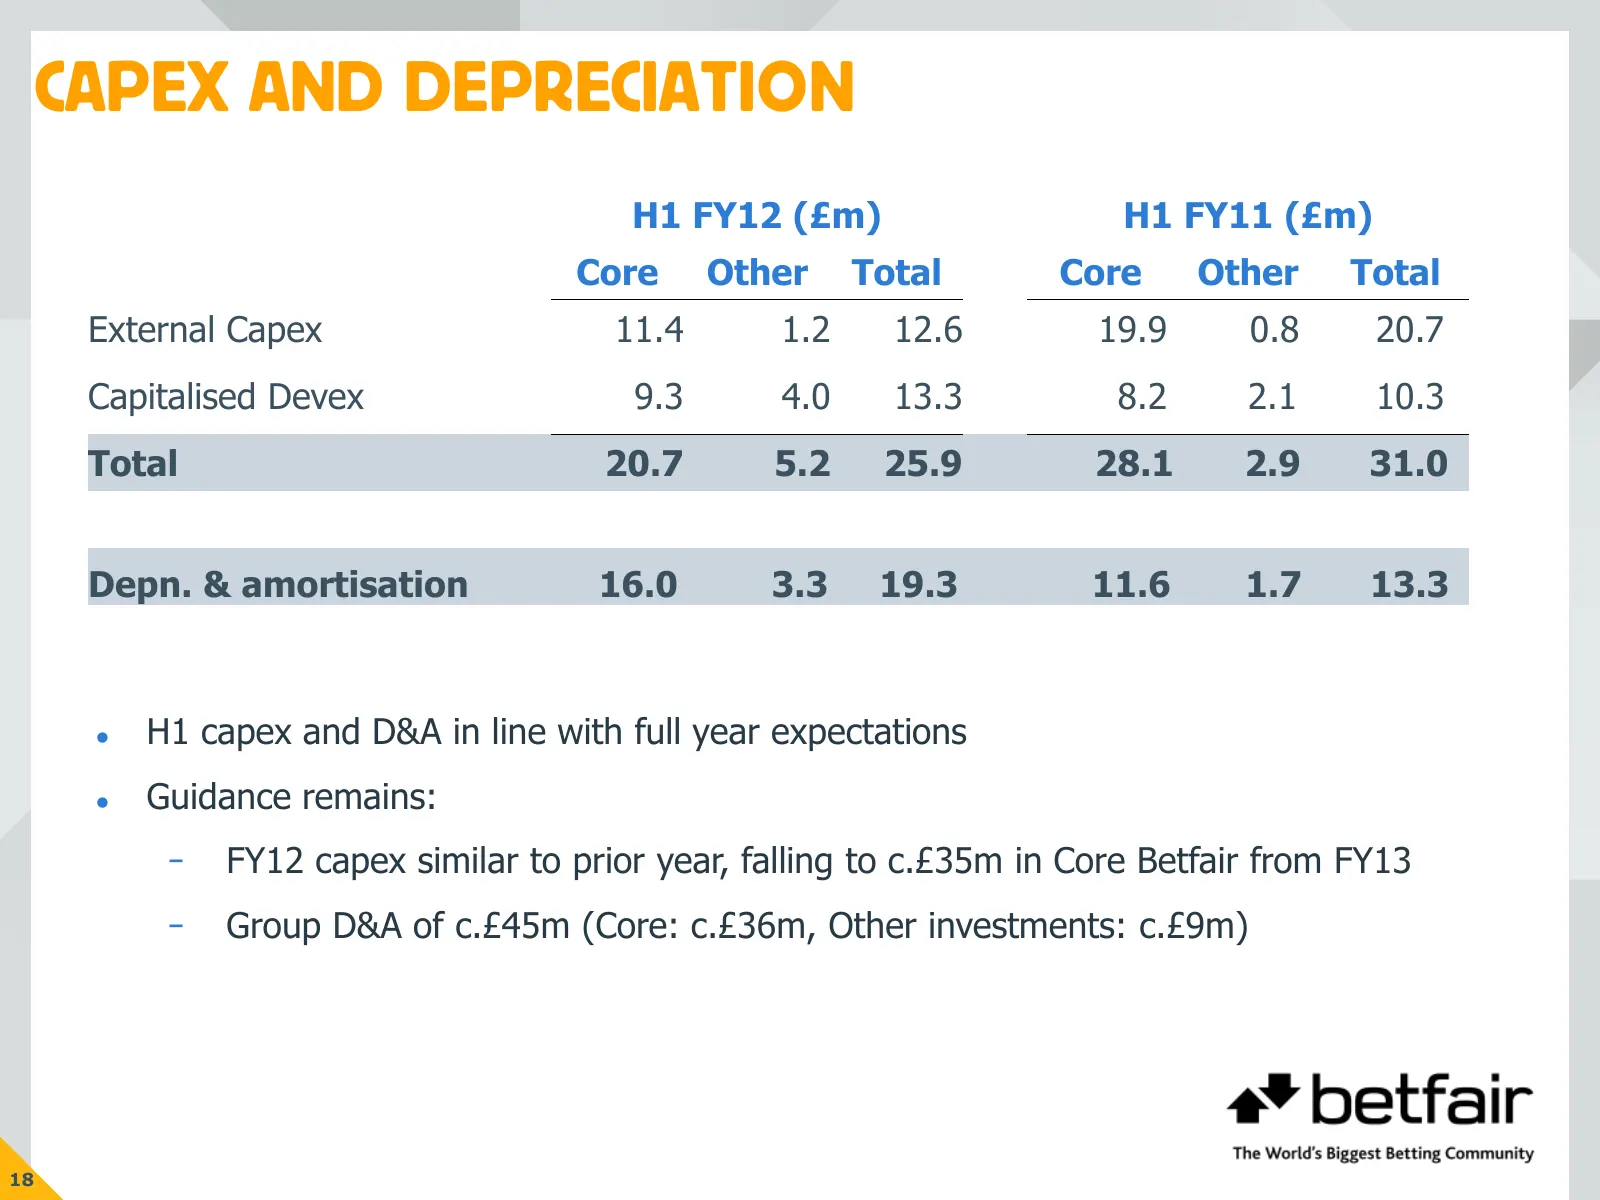
Slide 19: Capex and depreciation
CAPEX AND DEPRECIATION H1 FY12 (£m) H1 FY11 (£m) Core Other Total Core Other Total External Capex 11.4 1.2 12.6 19.9 0.8 20.7 Capitalised Devex 9.3 4.0 13.3 8.2 2.1 10.3 Total 20.7 5.2 25.9 28.1 2.9 31.0 Depn. & amortisation 16.0 3.3 19.3 11.6 1.7 13.3 H1 capex and D&A in line with full year expec
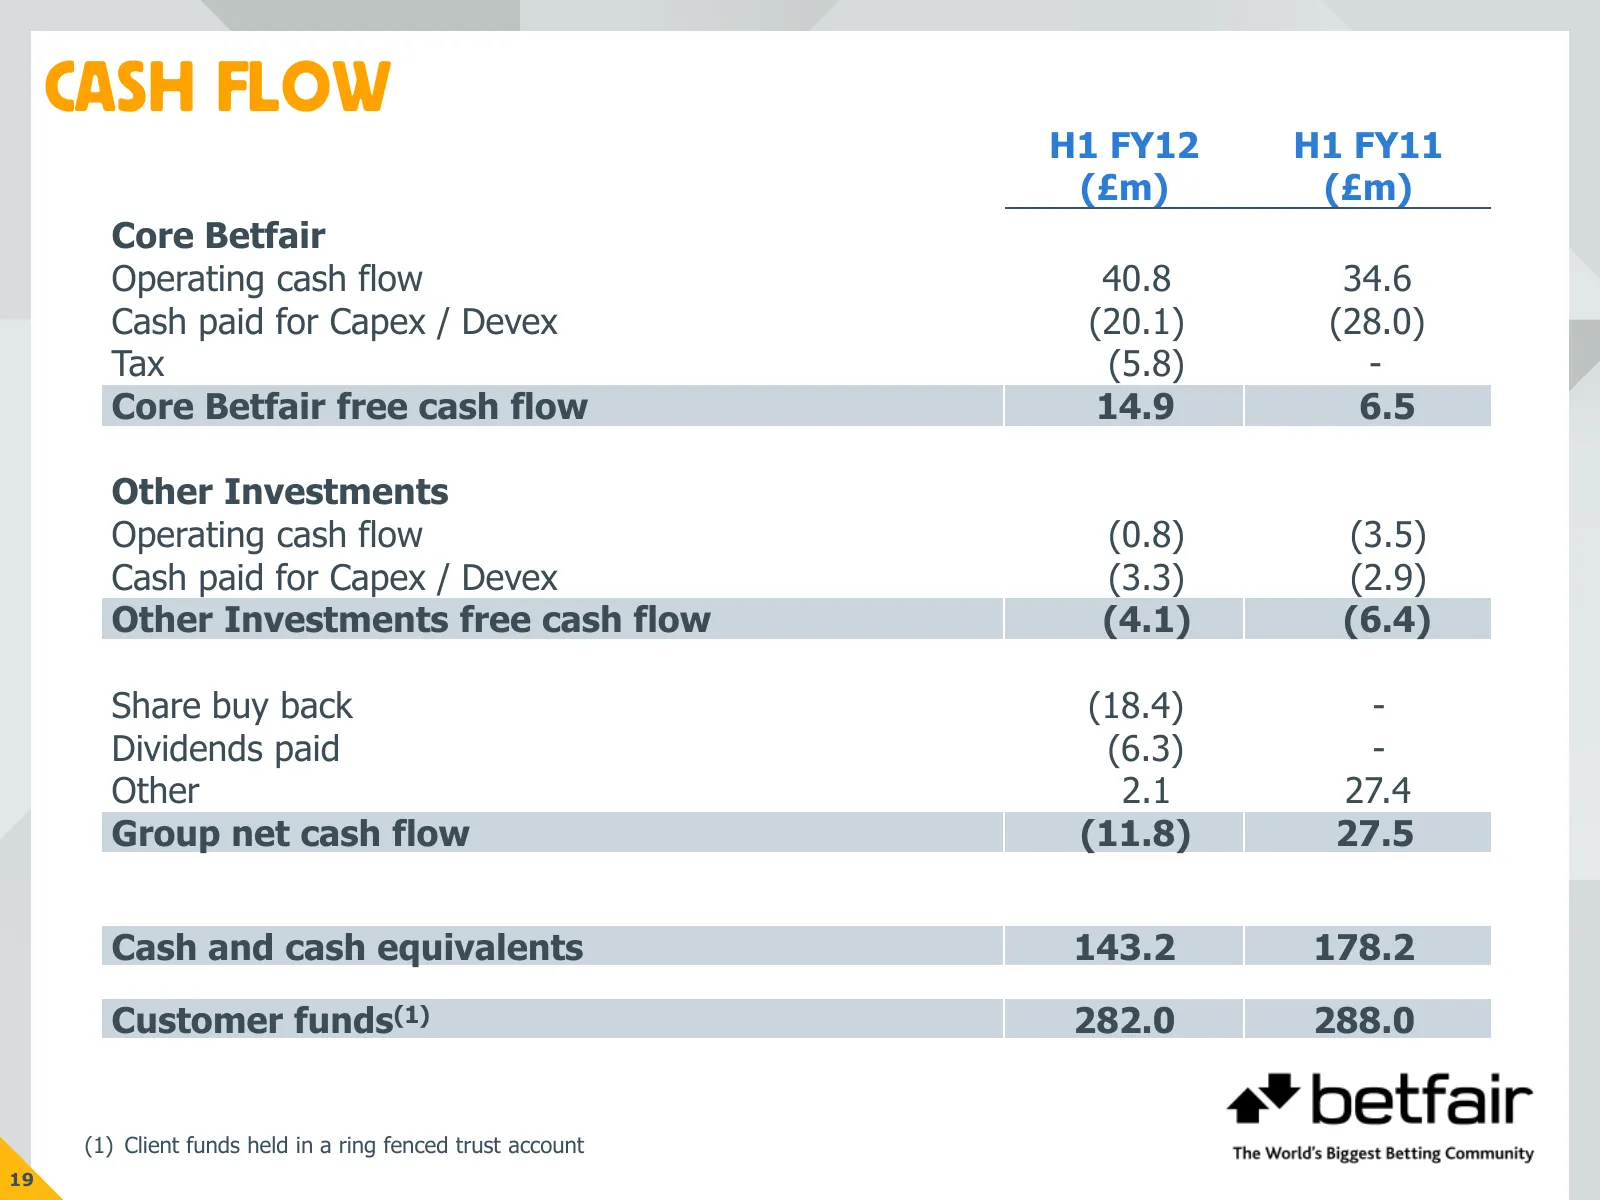
Slide 20: Cash flow
CASH FLOW H1 FY12 H1 FY11 (£m) (£m) Core Betfair Operating cash flow 40.8 34.6 Cash paid for Capex / Devex (20.1) (28.0) Tax (5.8) - Core Betfair free cash flow 14.9 6.5 Other Investments Operating cash flow (0.8) (3.5) Cash paid for Capex / Devex (3.3) (2.9) Other Investments free cash flow (4.1) (
Slide 21: Return of excess cash
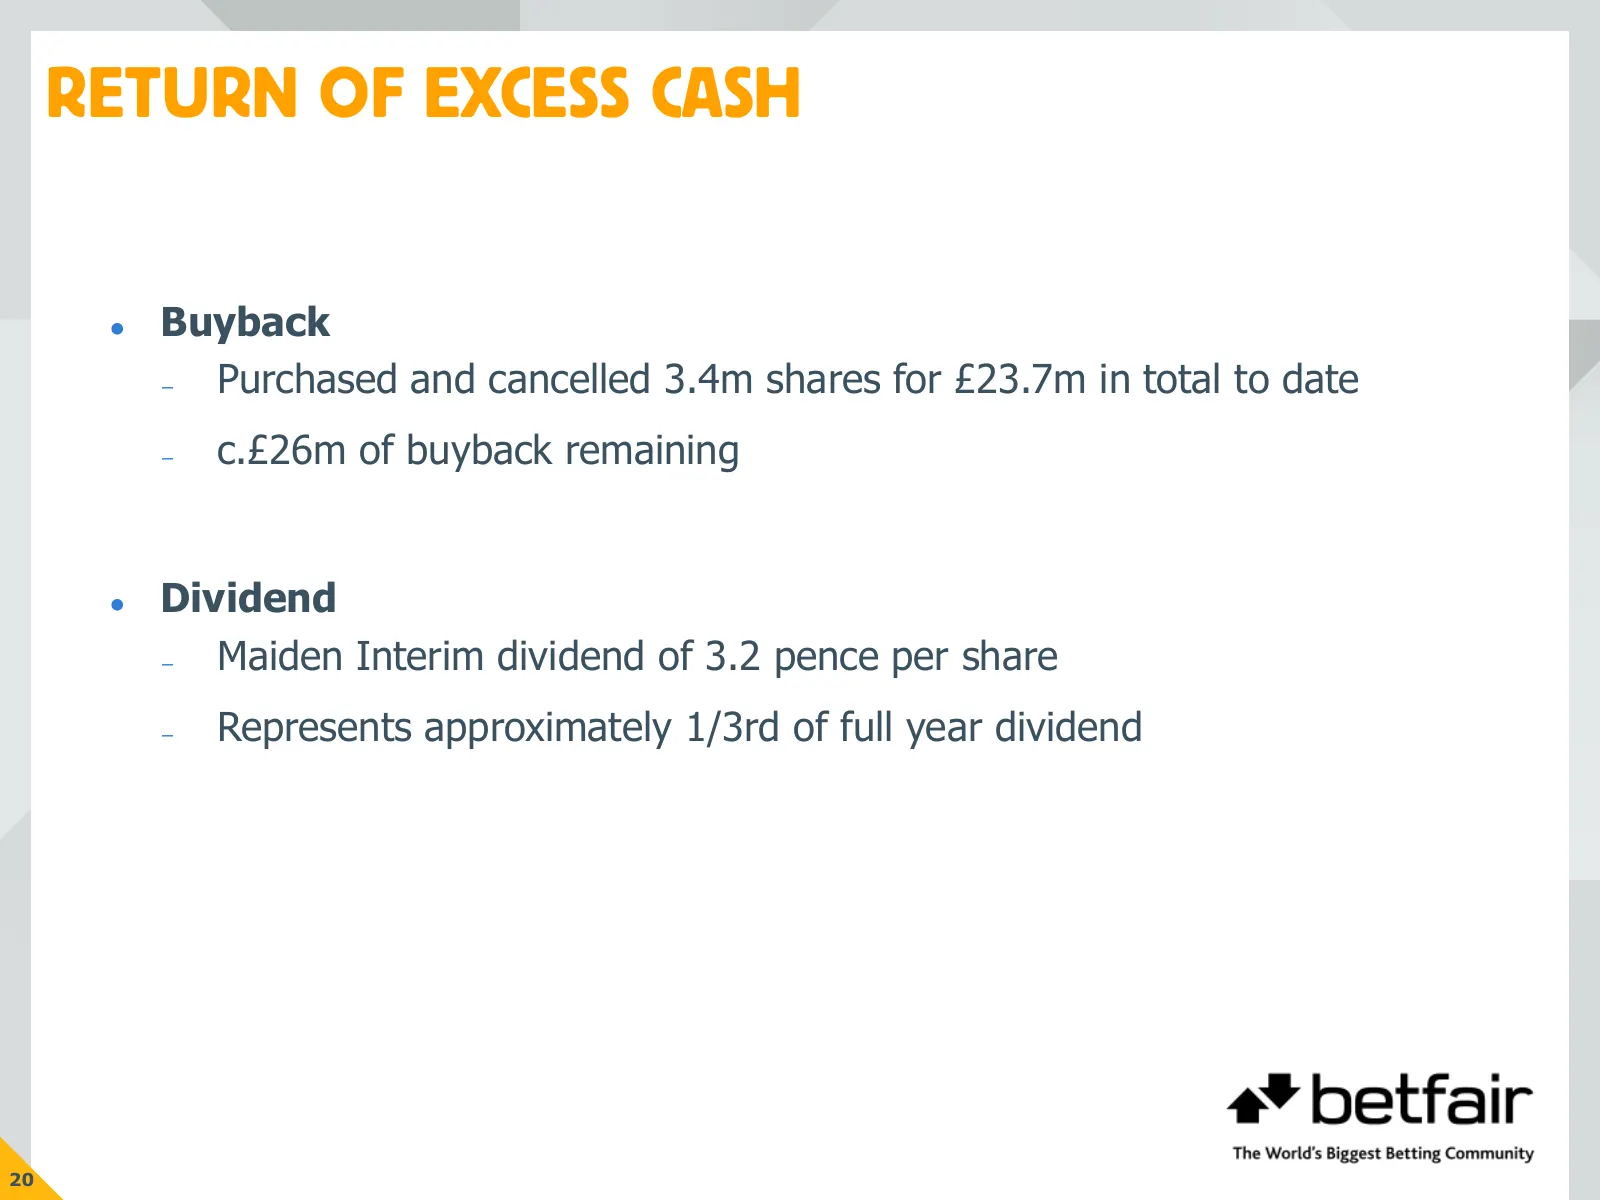
RETURN OF EXCESS CASH Buyback – Purchased and cancelled 3.4m shares for £23.7m in total to date – c.£26m of buyback remaining Dividend – Maiden Interim dividend of 3.2 pence per share – Represents approximately 1/3rd of full year dividend 20
Slide 22: Business review
BUSINESS REVIEW David Yu – Chief Executive Officer
Slide 23: Sports: customer experience
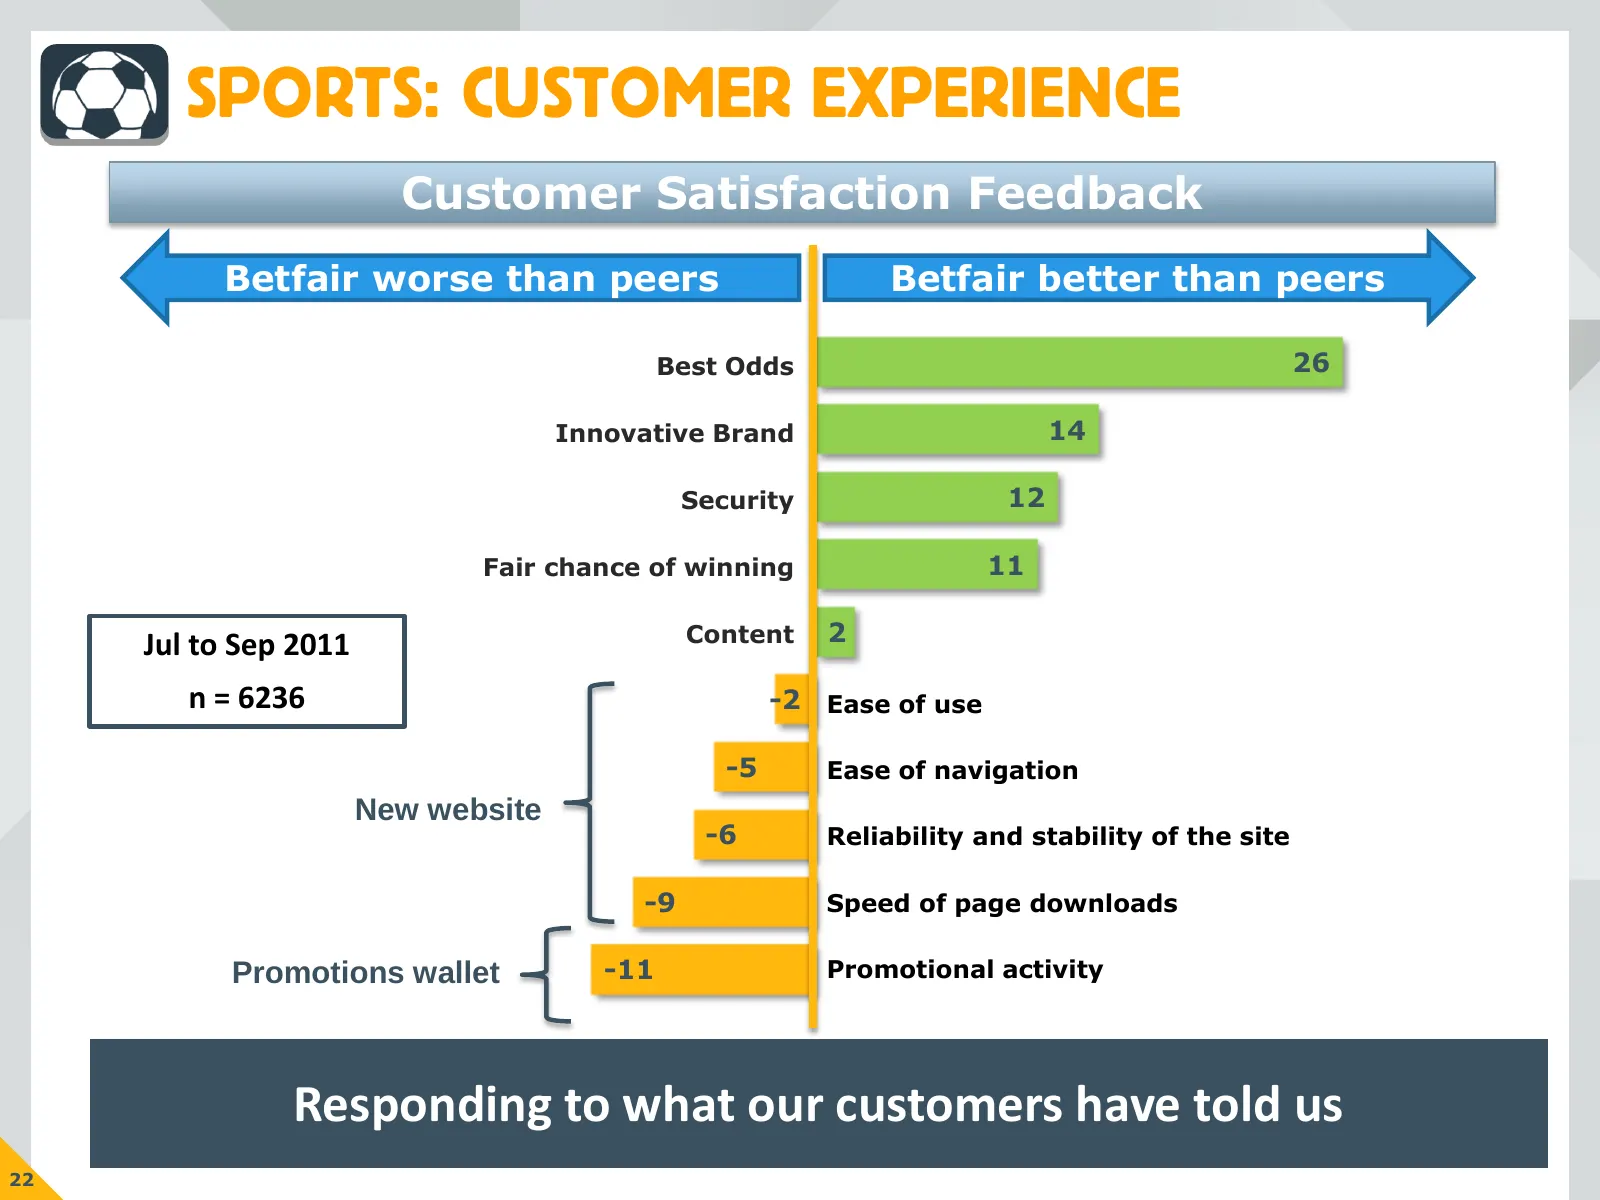
SPORTS: CUSTOMER EXPERIENCE Customer Satisfaction Feedback Betfair worse than peers Betfair better than peers Best Odds 26 Innovative Brand 14 Security 12 Fair chance of winning 11 Jul to Sep 2011 Content 2 n = 6236 -2 Ease of use -5 Ease of navigation New website -6 Reliability and stability of the
Slide 24: Sports: the exchange is better value (1)
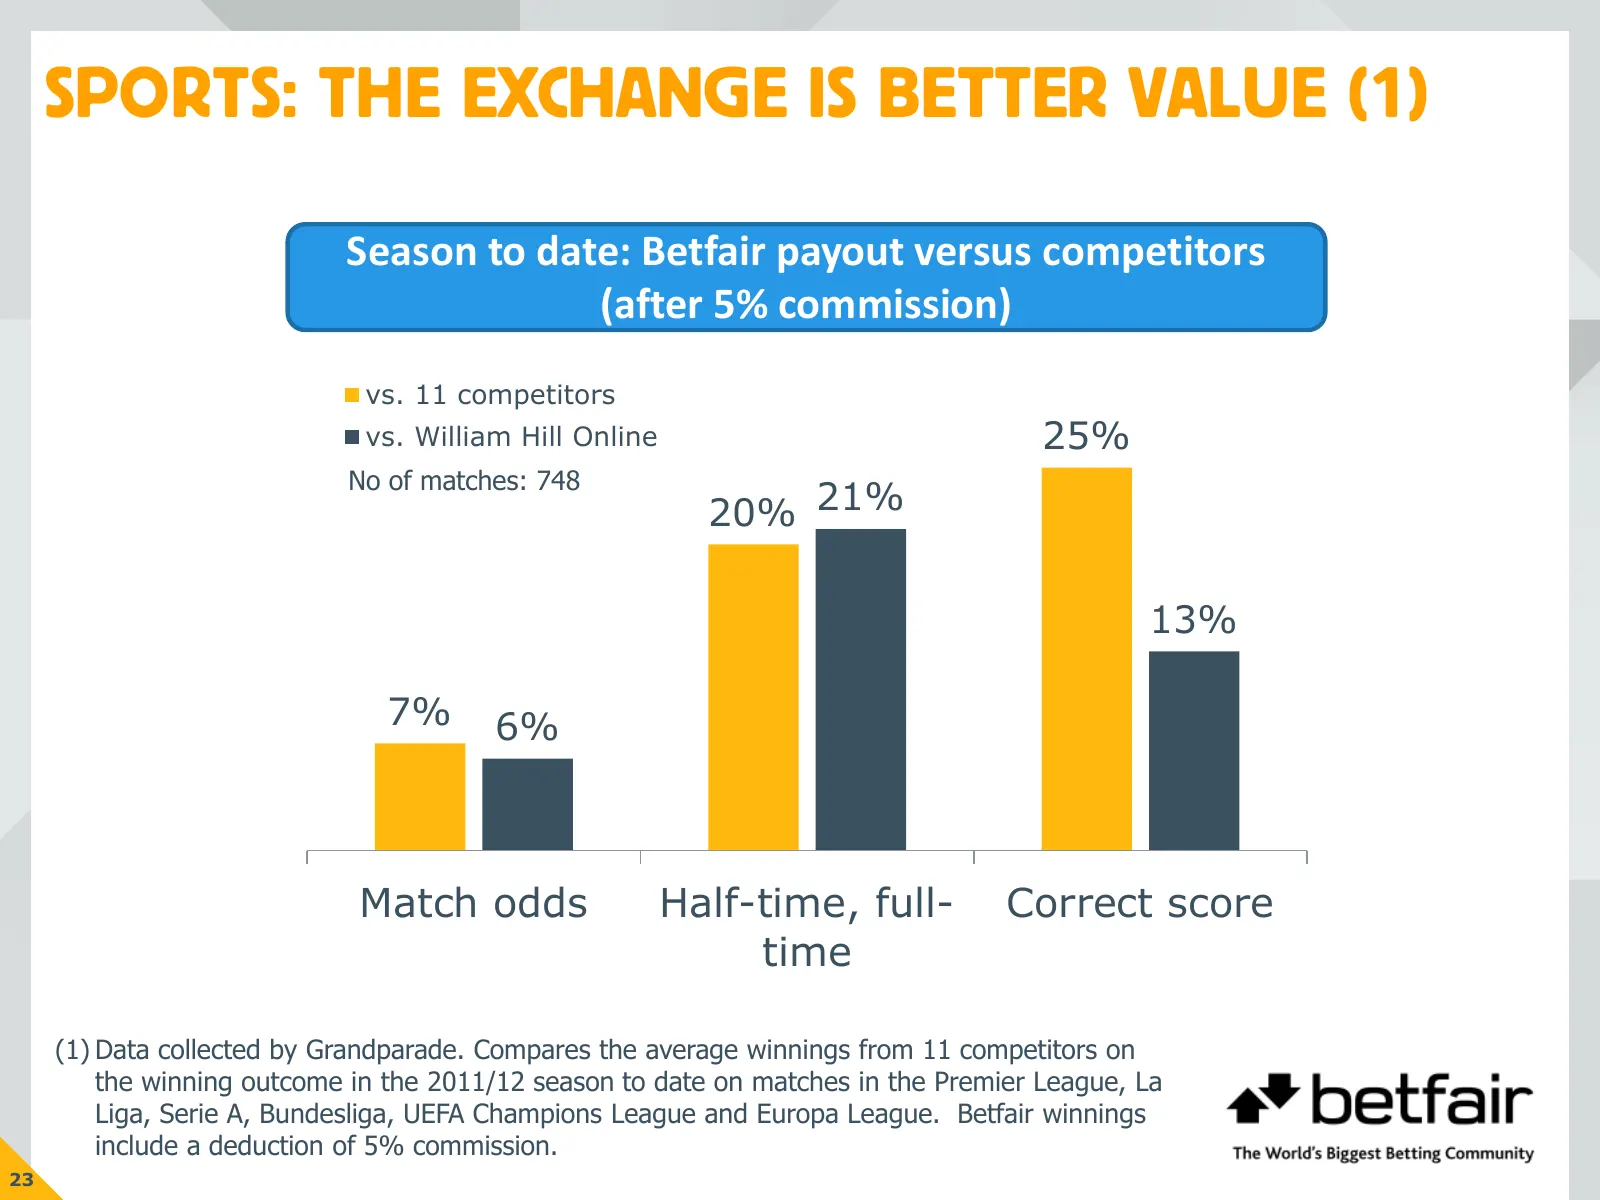
SPORTS: THE EXCHANGE IS BETTER VALUE (1) Season to date: Betfair payout versus competitors (after 5% commission) vs. 11 competitors vs. William Hill Online 25% No of matches: 748 20% 21% 13% 7% 6% Match odds Half-time, full- Correct score time (1) Data collected by Grandparade. Compares the average
Slide 25: Sports: the exchange is better value (2)
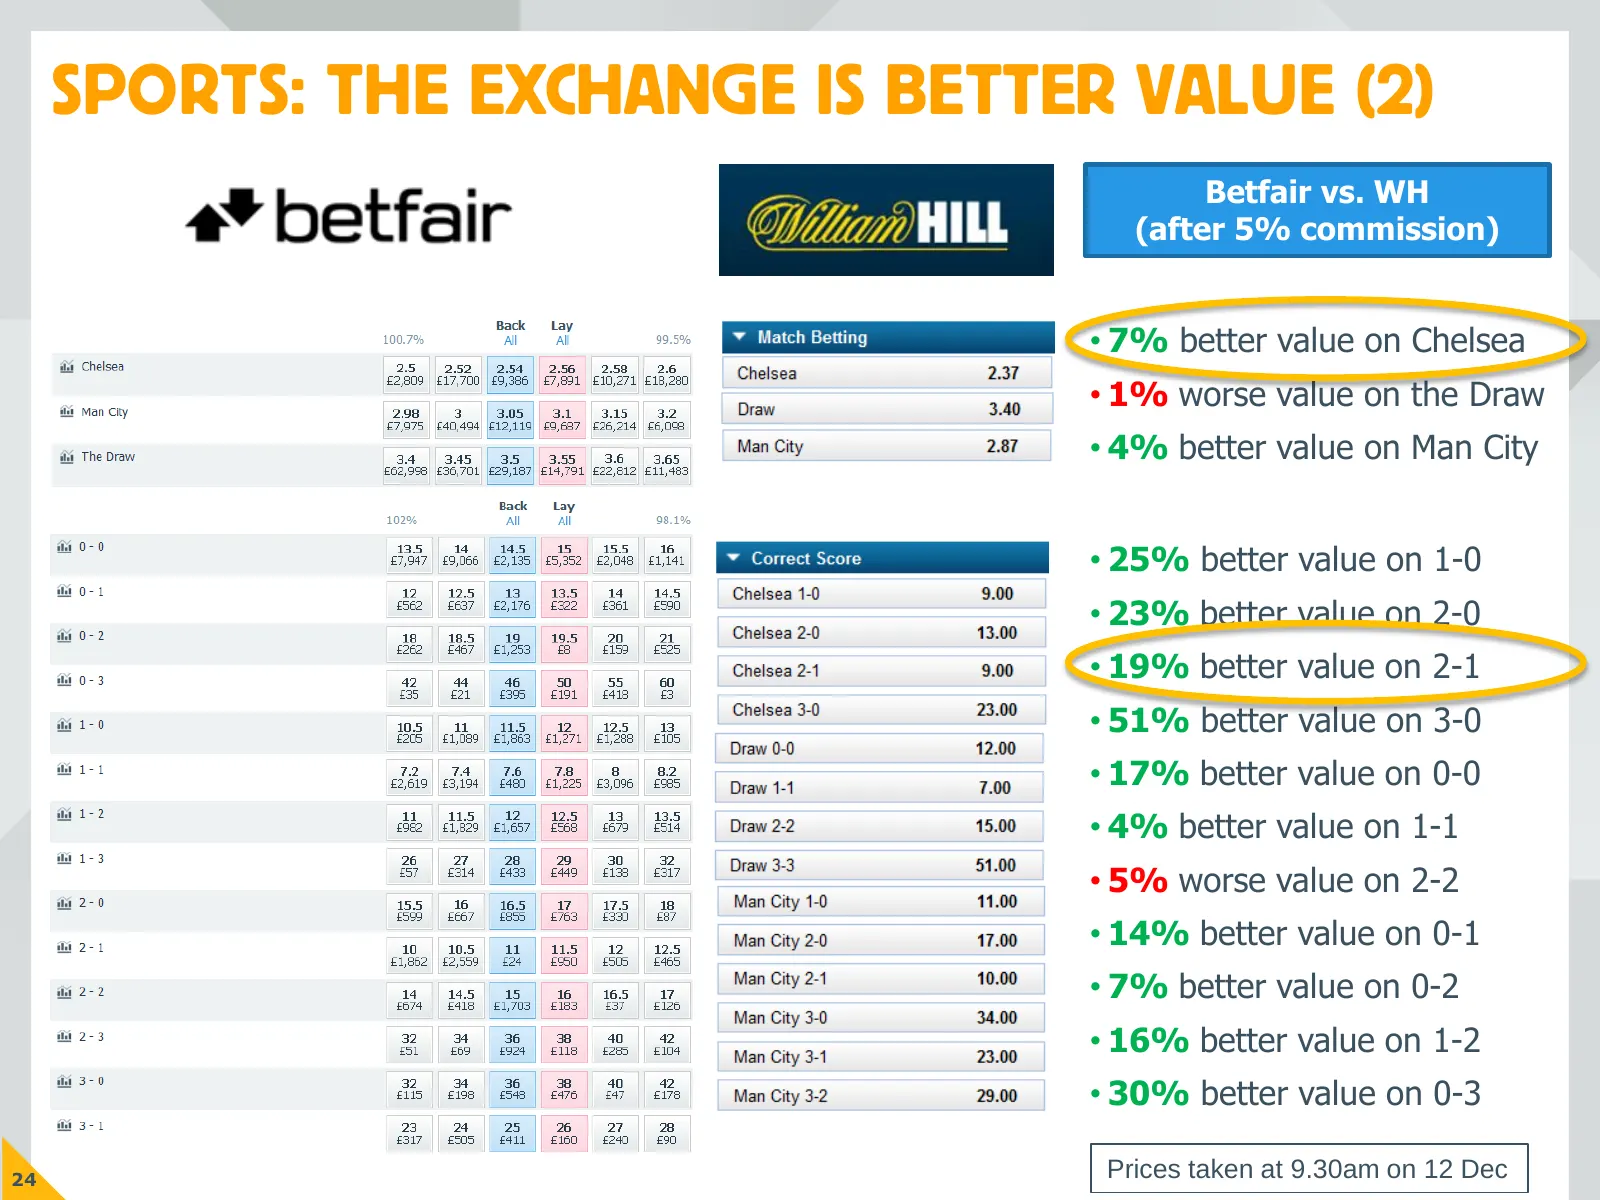
SPORTS: THE EXCHANGE IS BETTER VALUE (2) Betfair vs. WH (after 5% commission) • 7% better value on Chelsea • 1% worse value on the Draw • 4% better value on Man City • 25% better value on 1-0 • 23% better value on 2-0 • 19% better value on 2-1 • 51% better value on 3-0 • 17% better value on 0-0 • 4%
Slide 26: Sports: improved customer experience
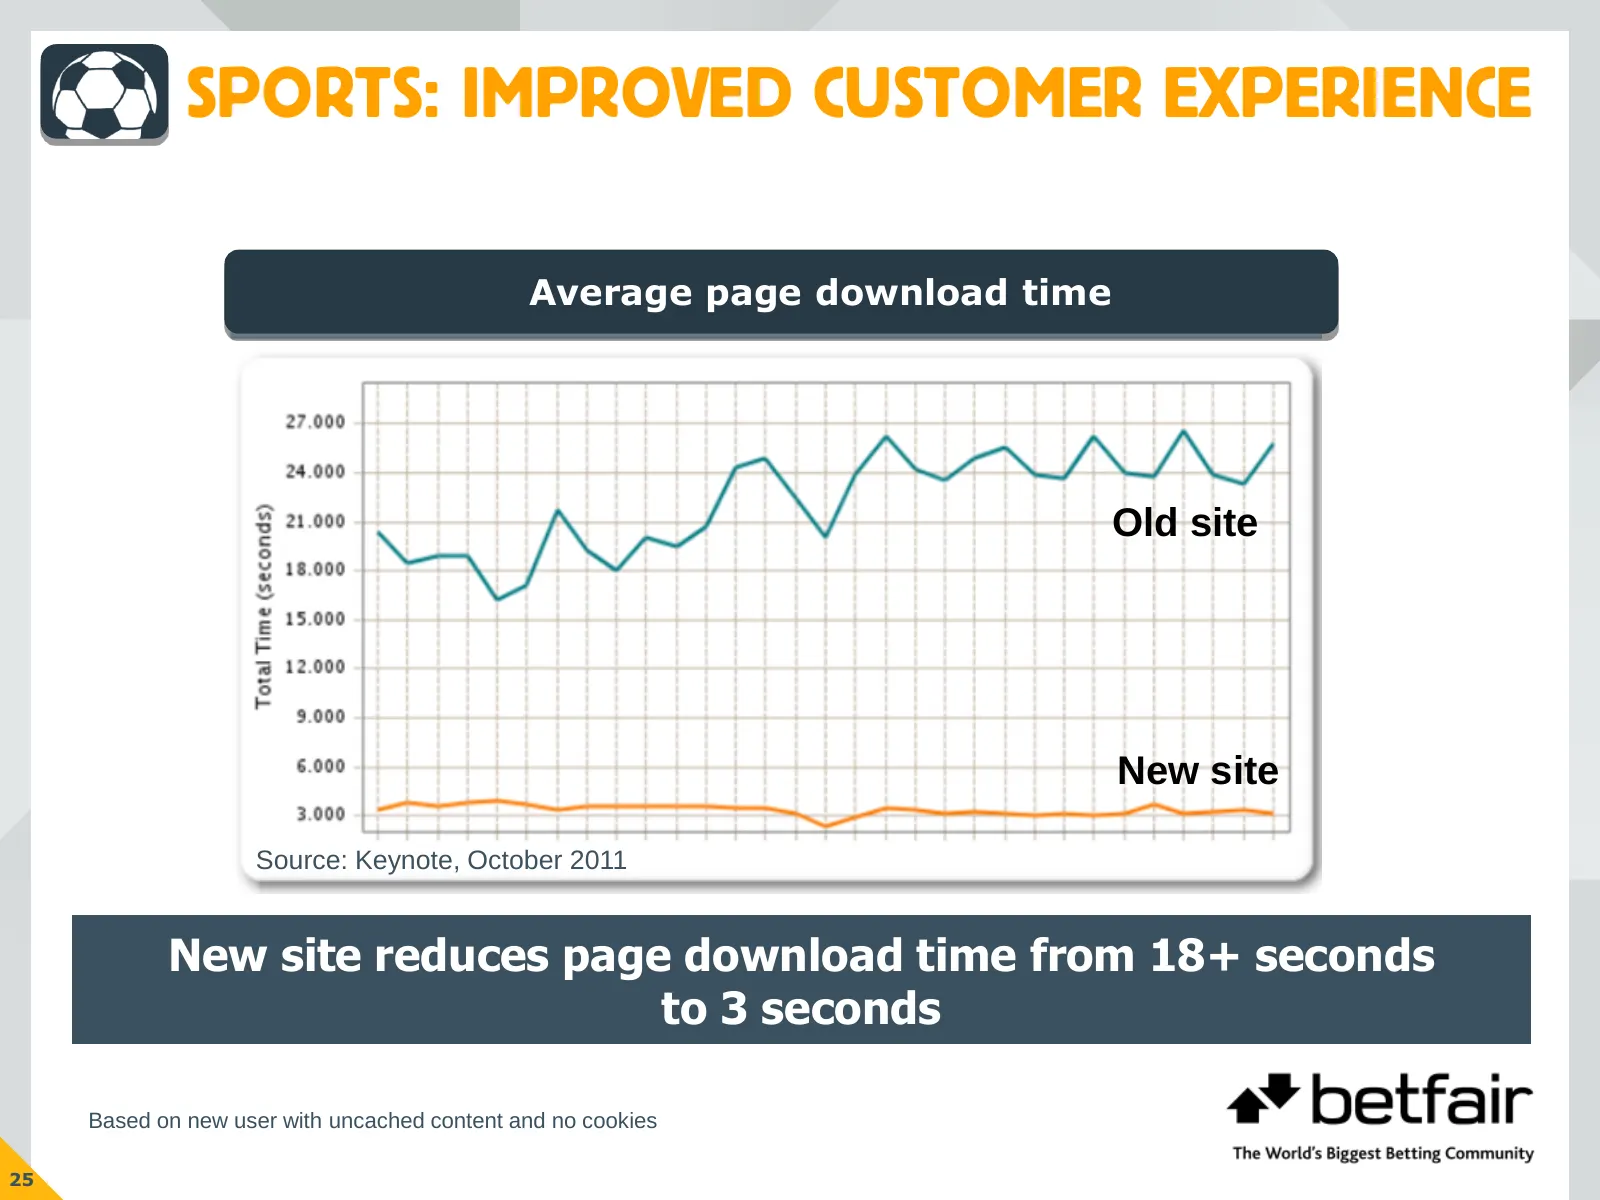
SPORTS: IMPROVED CUSTOMER EXPERIENCE Average page download time Old site New site Source: Keynote, October 2011 New site reduces page download time from 18+ seconds to 3 seconds Based on new user with uncached content and no cookies 25
Slide 27: Sports: improved customer experience
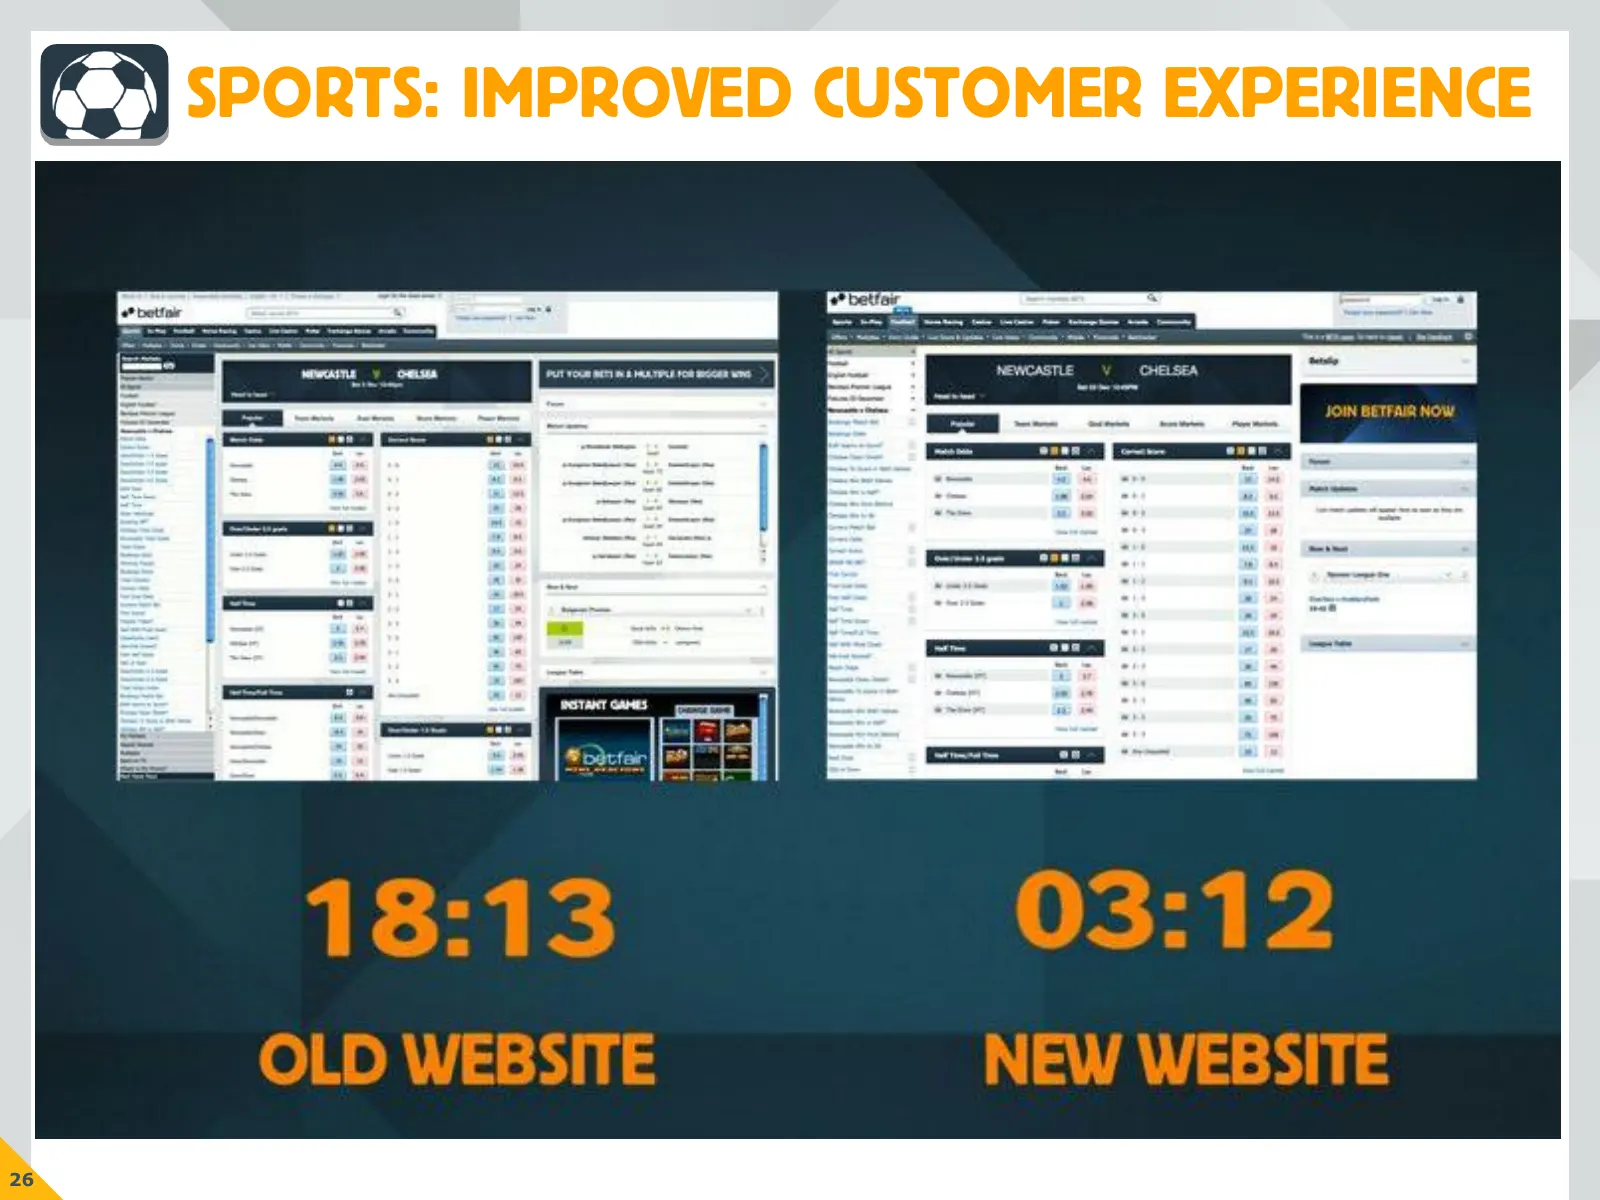
SPORTS: IMPROVED CUSTOMER EXPERIENCE 26
Slide 28: Sports: completing the sports offering
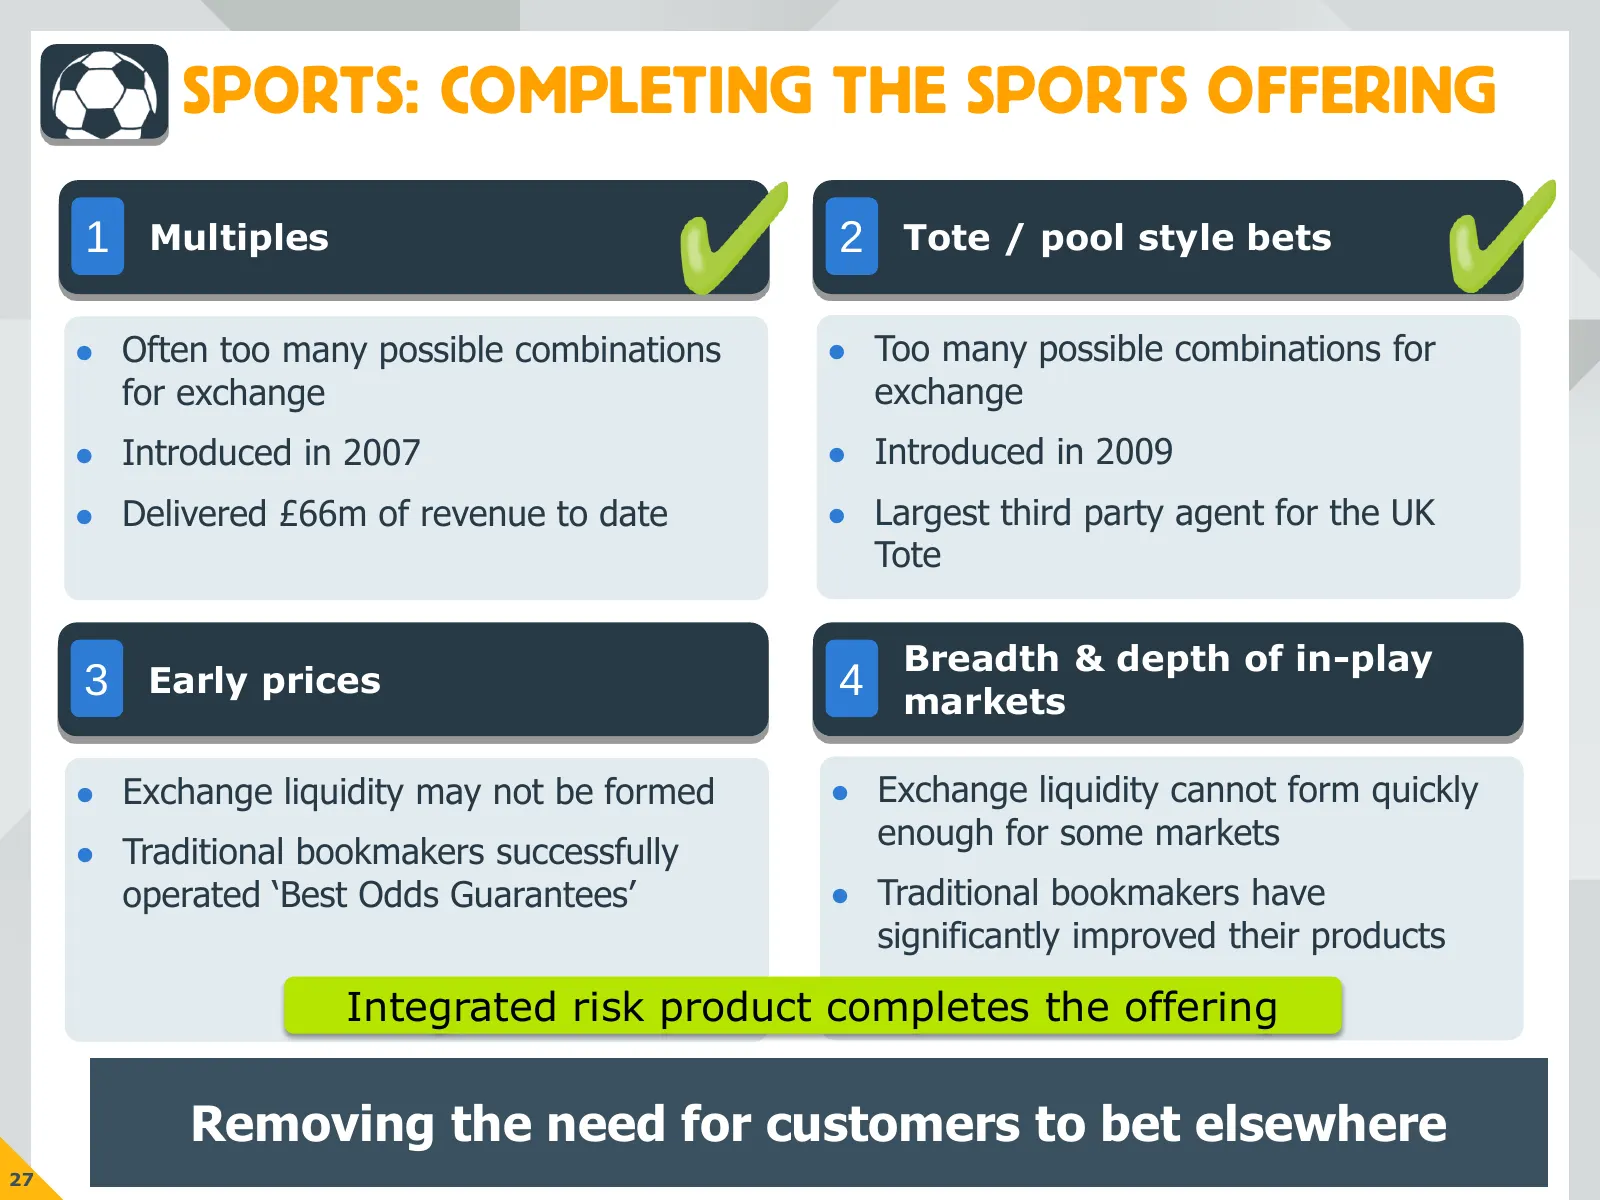
SPORTS: COMPLETING THE SPORTS OFFERING 1 Multiples 2 Tote / pool style bets Often too many possible combinations Too many possible combinations for for exchange exchange Introduced in 2007 Introduced in 2009 Delivered £66m of revenue to date Largest third party agent for the UK Tote Brea
Slide 29: Mobile: product strategy
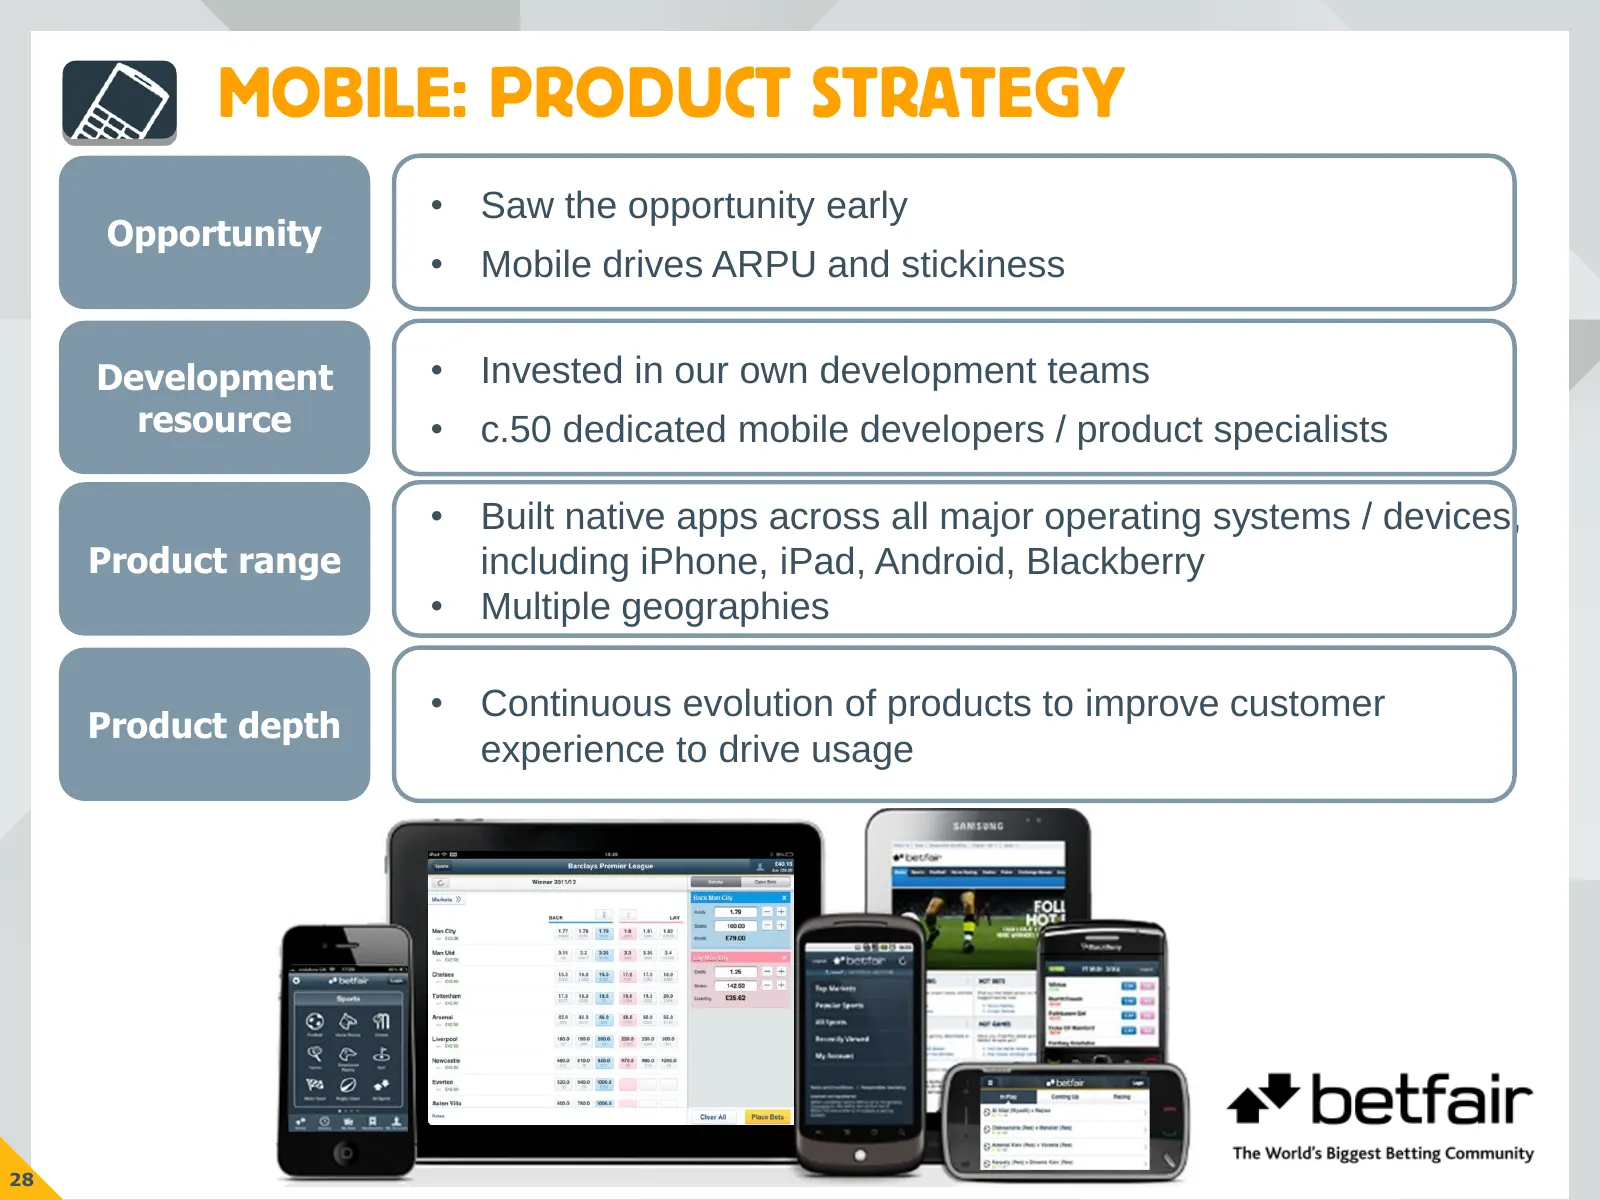
MOBILE: PRODUCT STRATEGY • Saw the opportunity early Opportunity • Mobile drives ARPU and stickiness Development • Invested in our own development teams resource • c.50 dedicated mobile developers / product specialists • Built native apps across all major operating systems / devices, Product range i
Slide 30: Mobile: product development
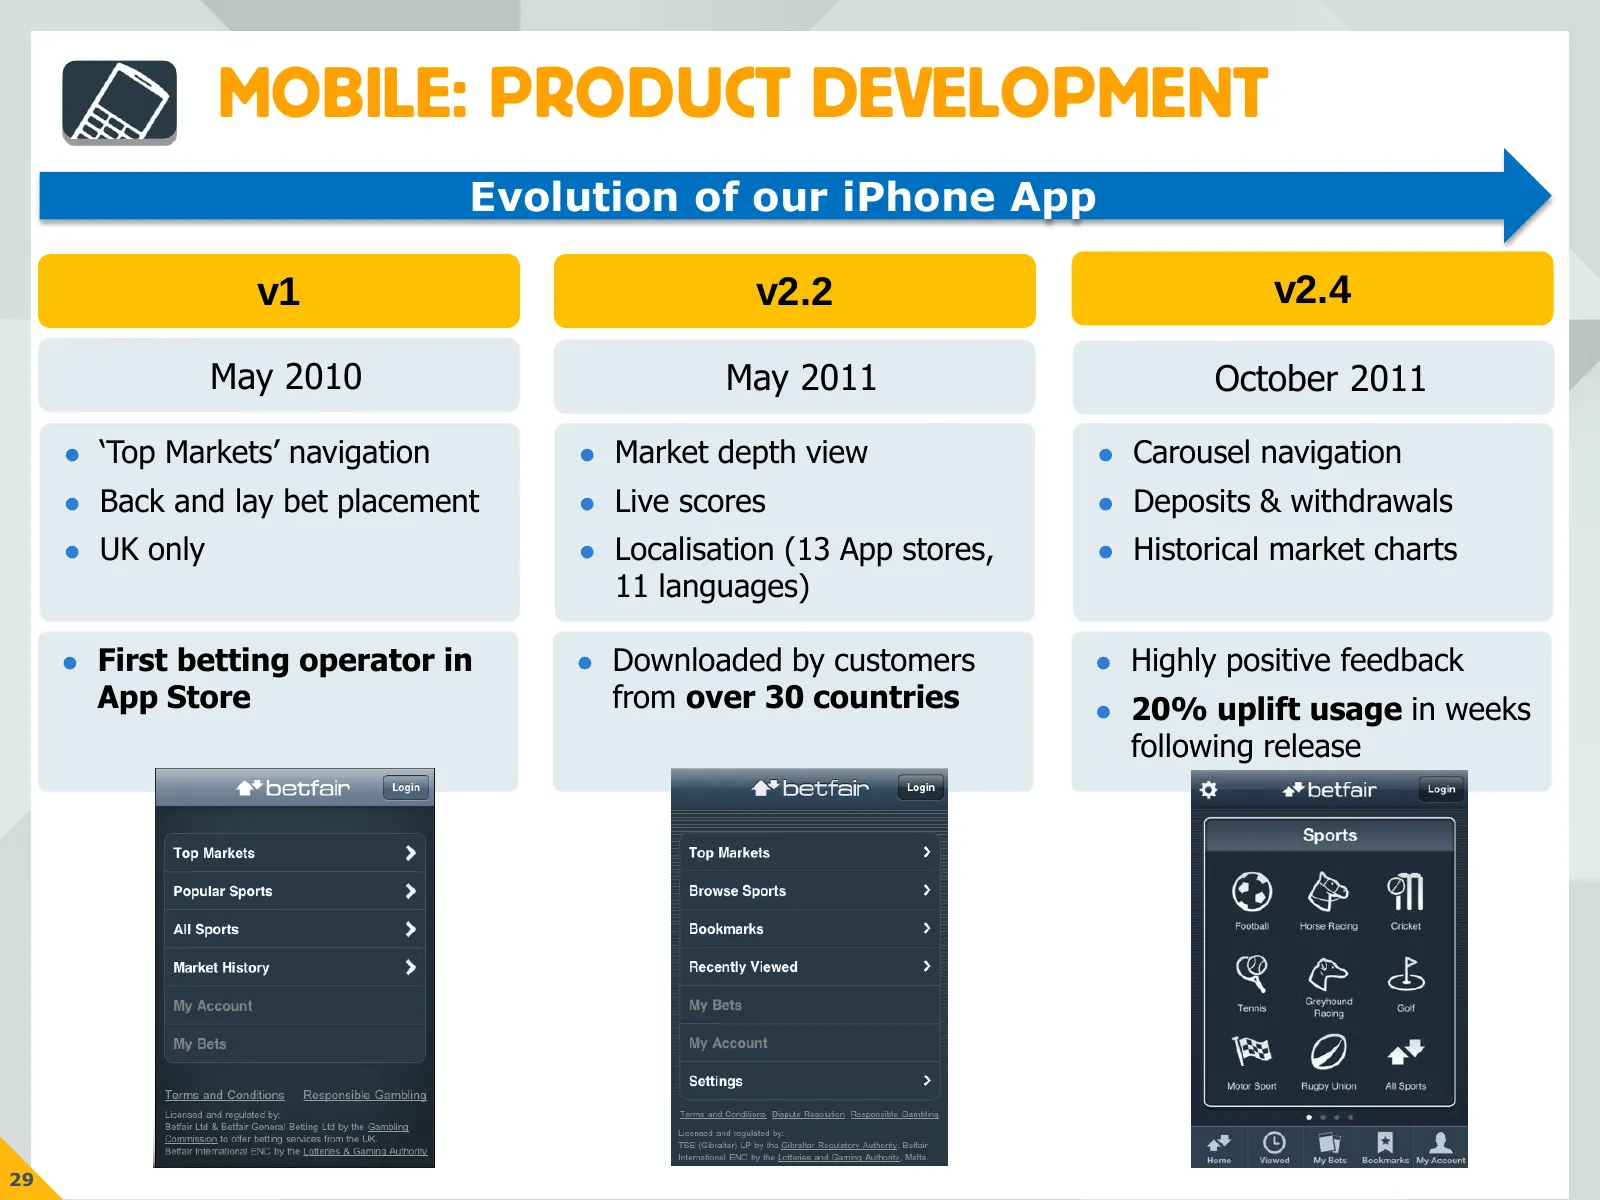
MOBILE: PRODUCT DEVELOPMENT Evolution of our iPhone App v1 v2.2 v2.4 May 2010 May 2011 October 2011 ‘Top Markets’ navigation Market depth view Carousel navigation Back and lay bet placement Live scores Deposits & withdrawals UK only Localisation (13 App stores, Historical market ch
Slide 31: Mobile: increasing awareness
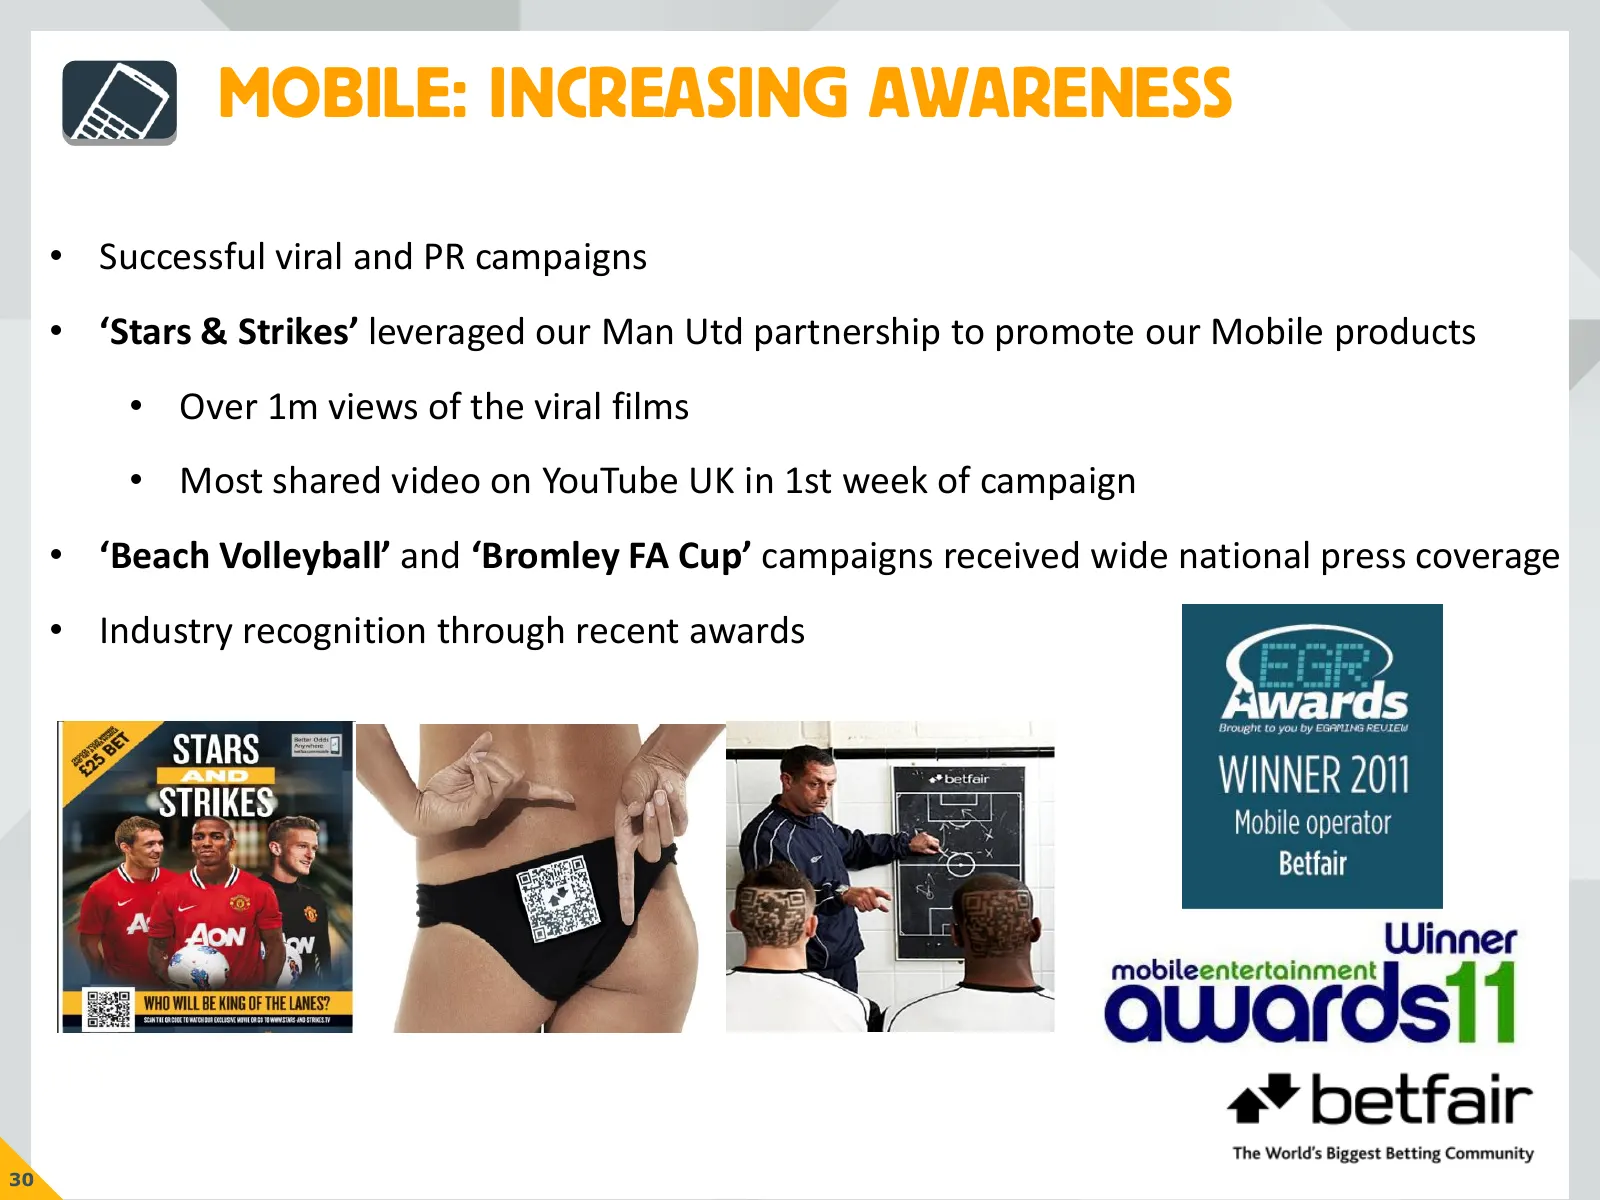
MOBILE: INCREASING AWARENESS • Successful viral and PR campaigns • ‘Stars & Strikes’ leveraged our Man Utd partnership to promote our Mobile products • Over 1m views of the viral films • Most shared video on YouTube UK in 1st week of campaign • ‘Beach Volleyball’ and ‘Bromley FA Cup’ campaigns recei
Slide 32: Mobile: delivering growth
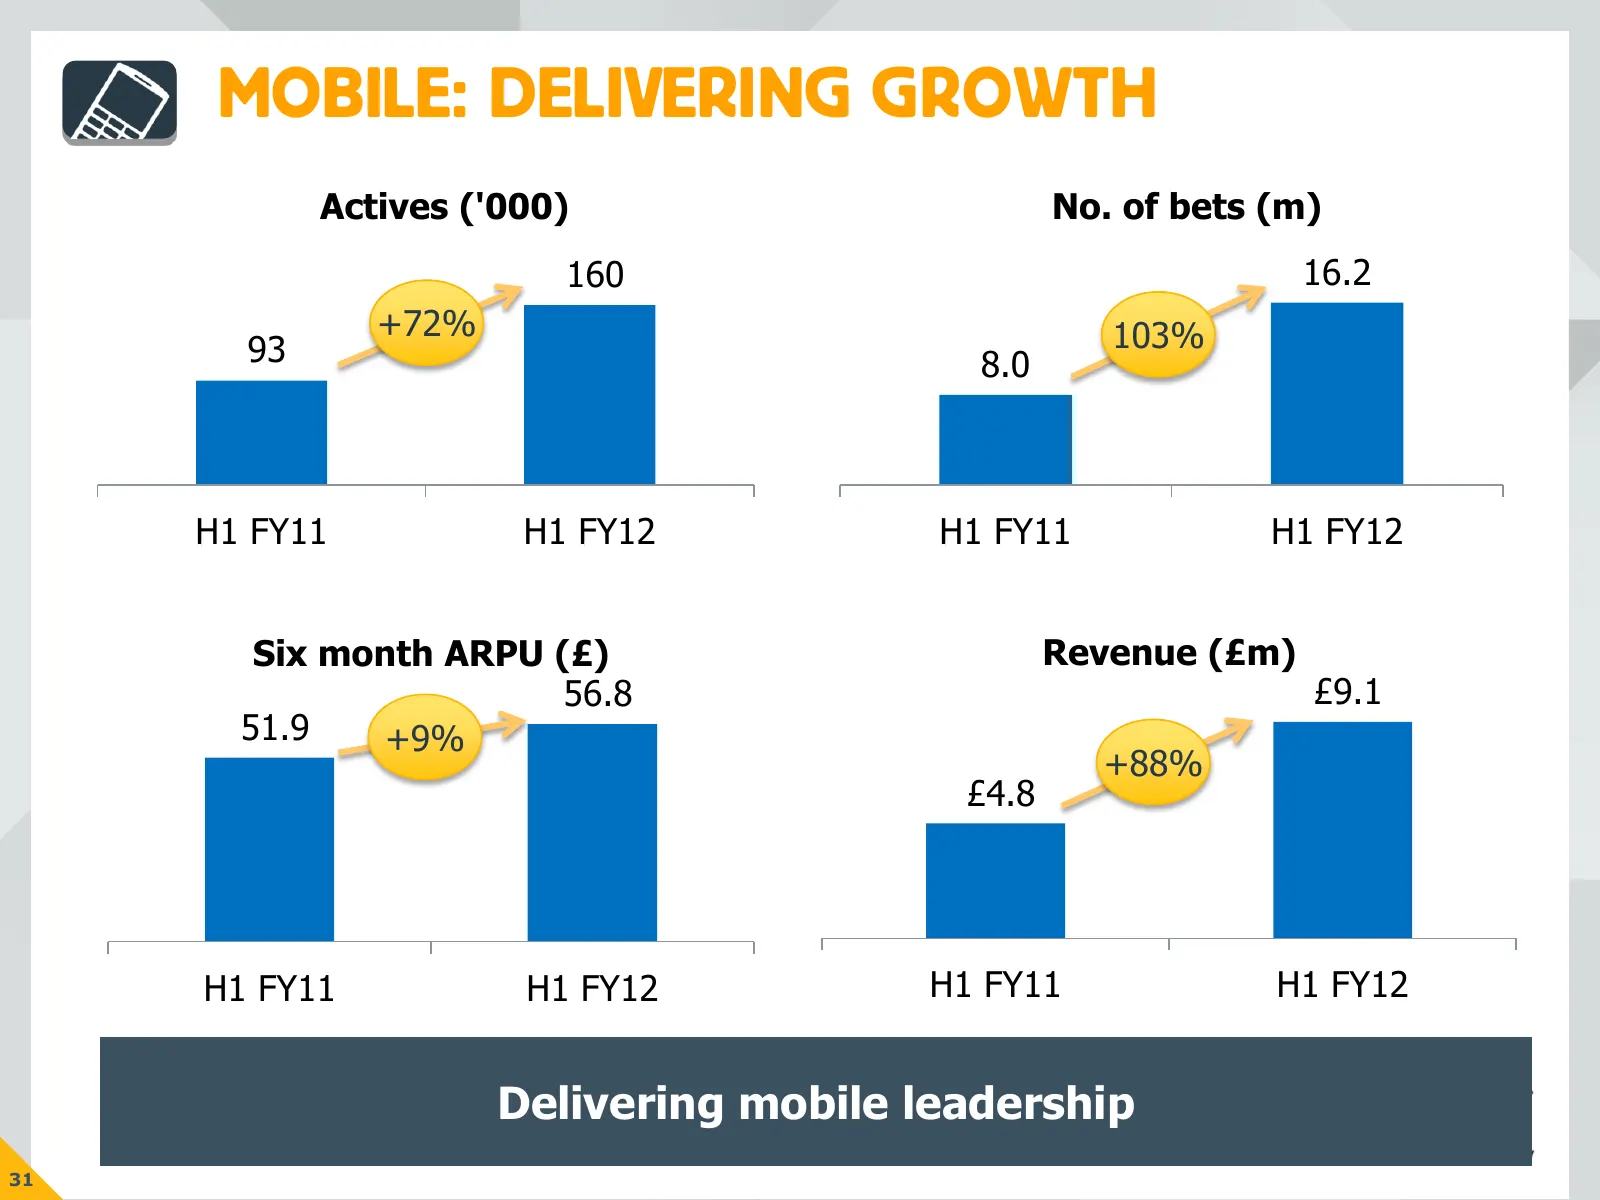
MOBILE: DELIVERING GROWTH Actives ('000) No. of bets (m) 160 16.2 +72% 103% 93 8.0 H1 FY11 H1 FY12 H1 FY11 H1 FY12 Six month ARPU (£) Revenue (£m) 56.8 £9.1 51.9 +9% +88% £4.8 H1 FY11 H1 FY12 H1 FY11 H1 FY12 Delivering mobile leadership 31
Slide 33: Technology re-architecture
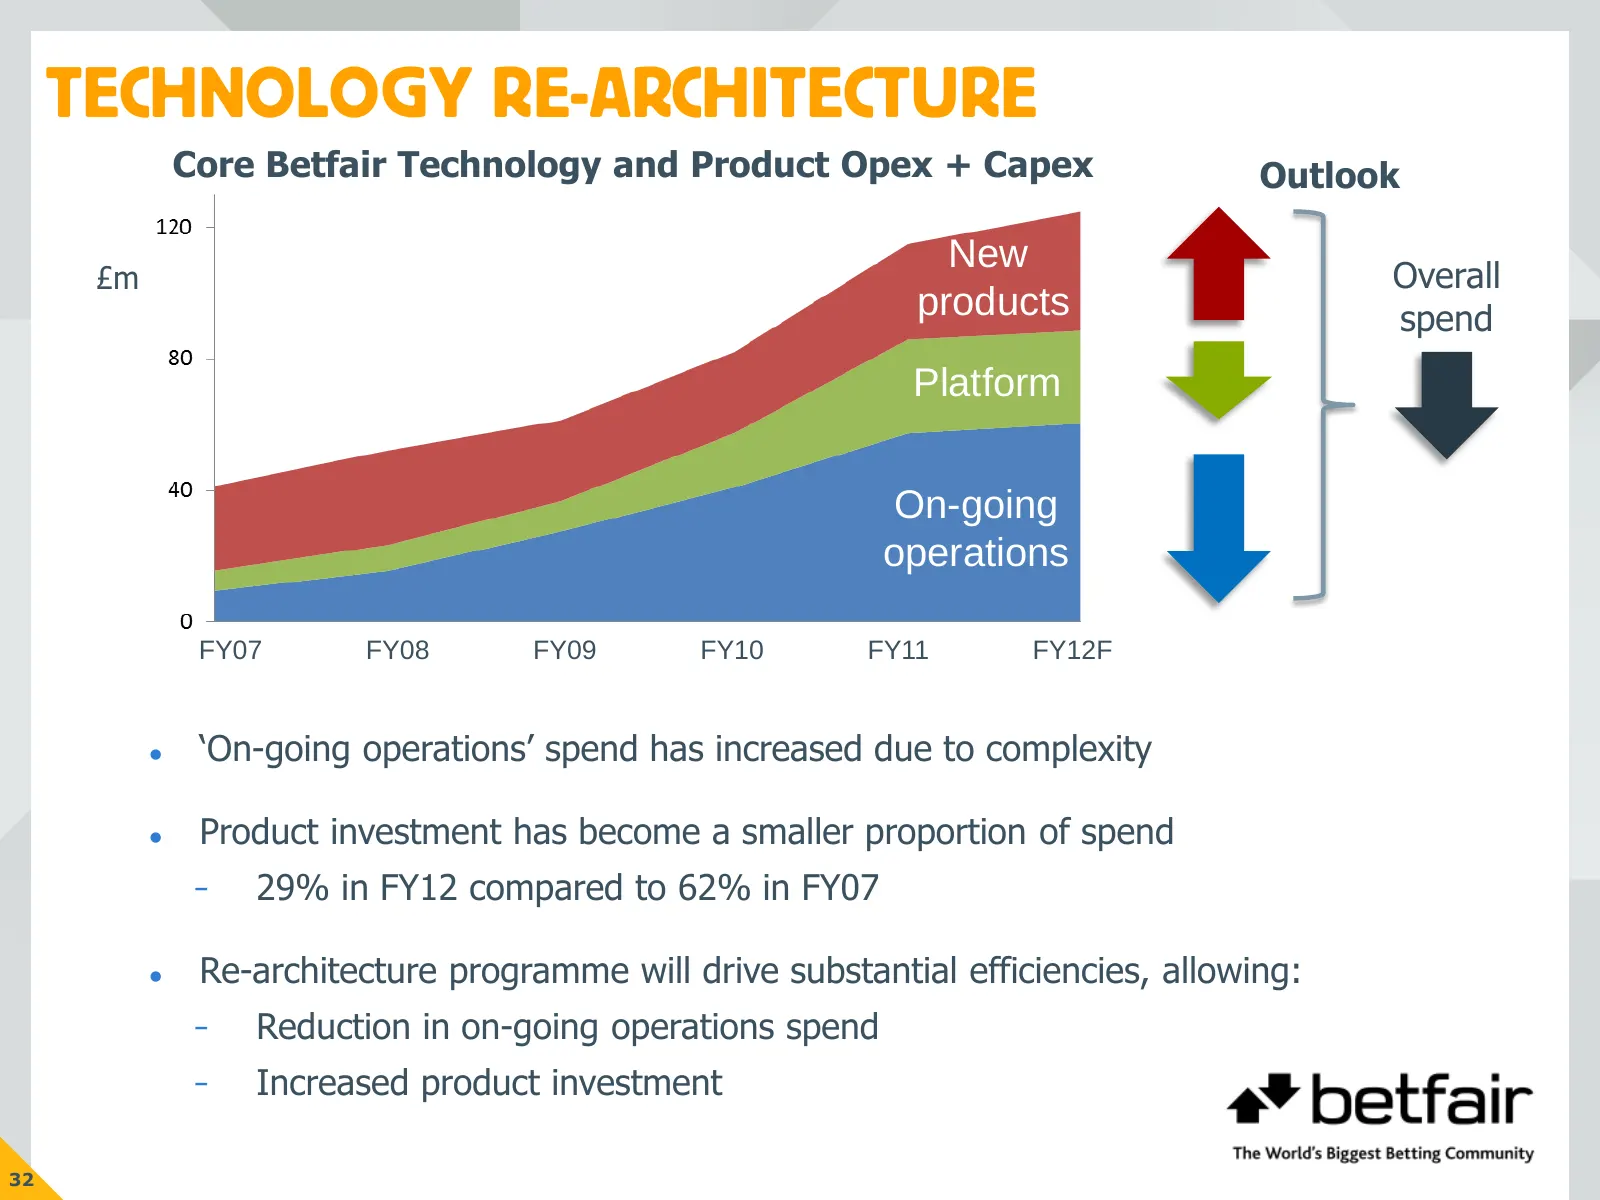
TECHNOLOGY RE-ARCHITECTURE Core Betfair Technology and Product Opex + Capex Outlook New £m Overall products spend Platform On-going operations FY07 FY08 FY09 FY10 FY11 FY12F ‘On-going operations’ spend has increased due to complexity Product investment has become a smaller proportion of spend ̵
Slide 34: Geographic expansion: regulation update
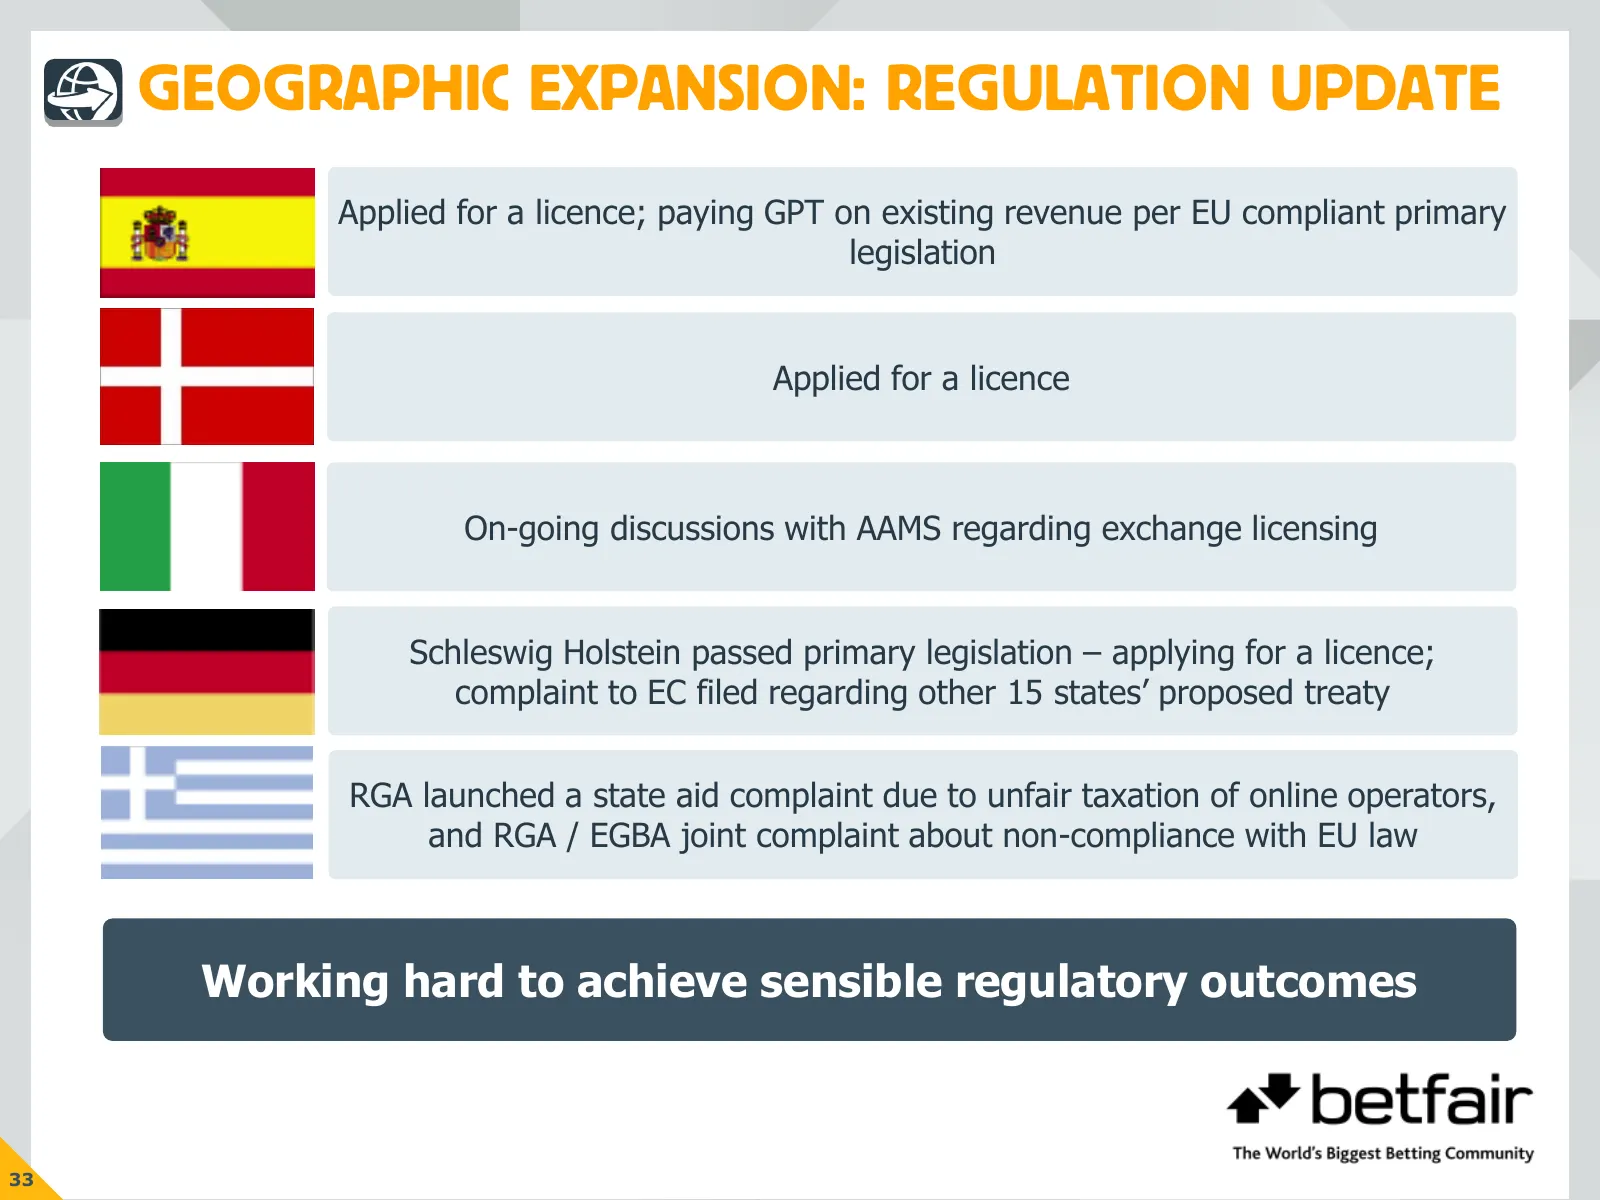
GEOGRAPHIC EXPANSION: REGULATION UPDATE Applied for a licence; paying GPT on existing revenue per EU compliant primary legislation Applied for a licence On-going discussions with AAMS regarding exchange licensing Schleswig Holstein passed primary legislation – applying for a licence; complaint to EC
Slide 35: Board & management
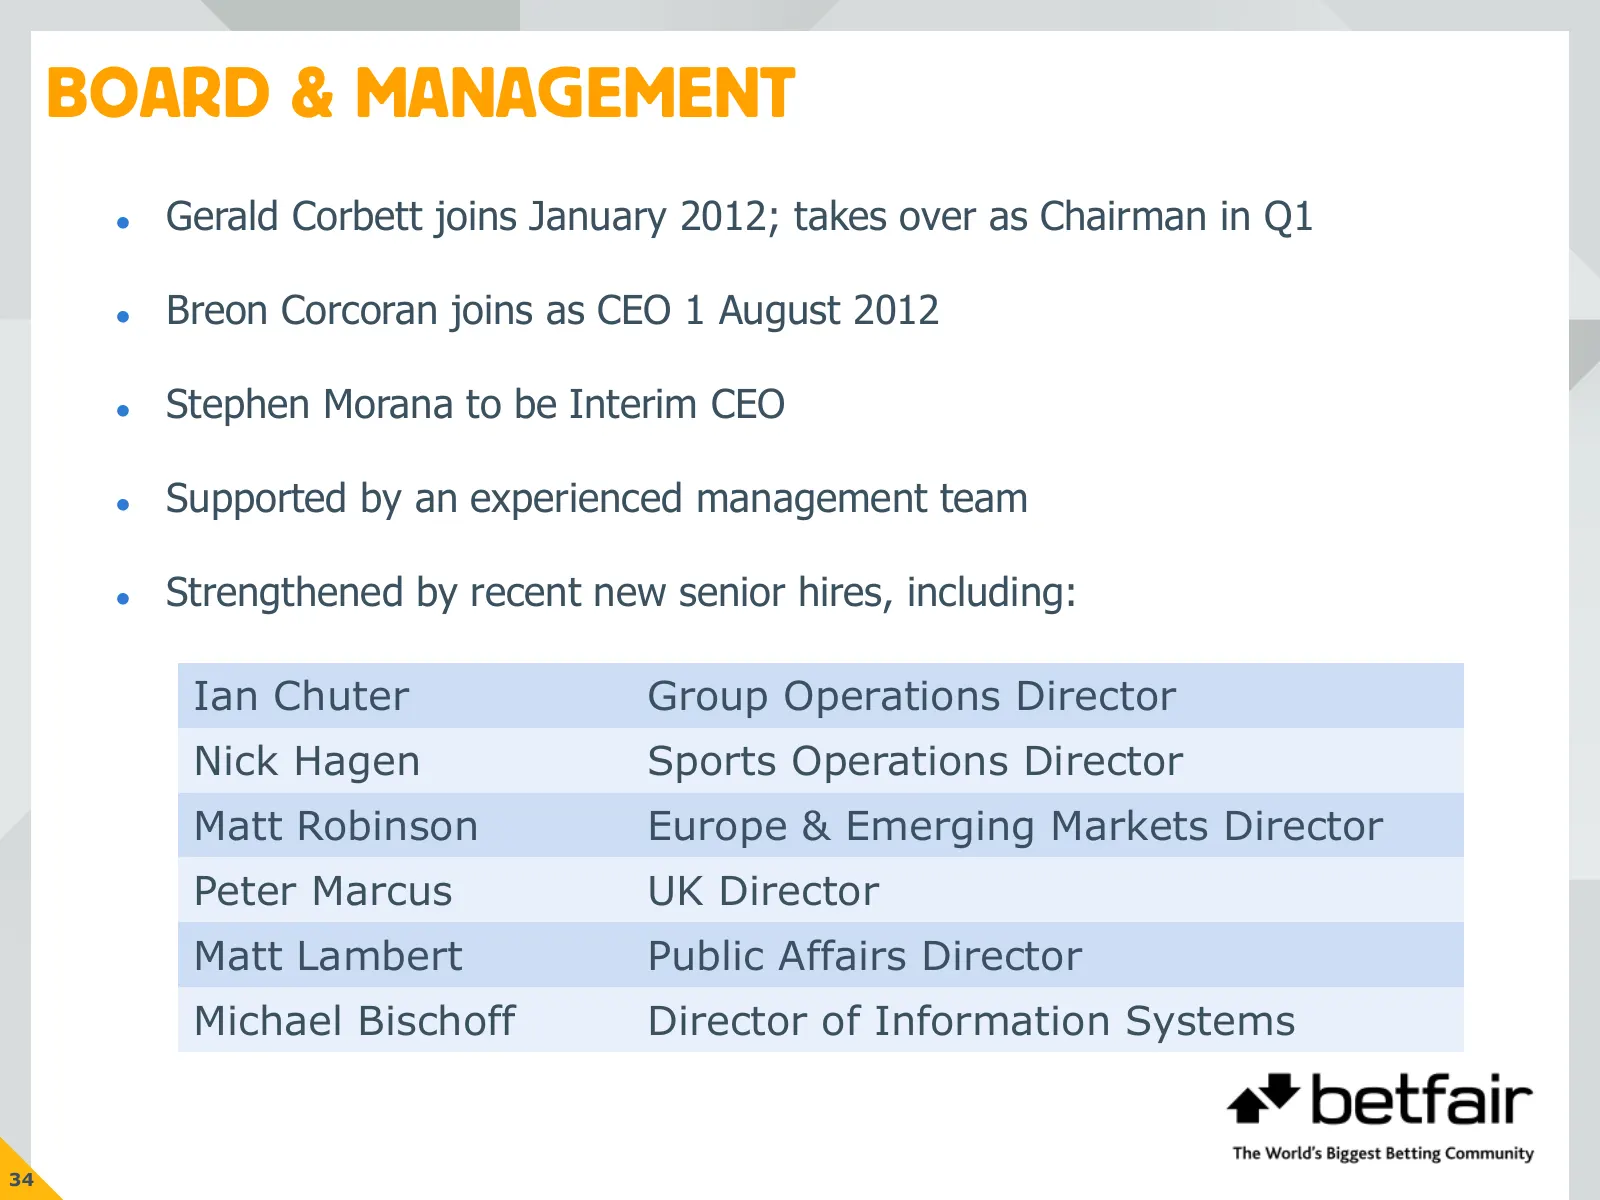
BOARD & MANAGEMENT Gerald Corbett joins January 2012; takes over as Chairman in Q1 Breon Corcoran joins as CEO 1 August 2012 Stephen Morana to be Interim CEO Supported by an experienced management team Strengthened by recent new senior hires, including: Ian Chuter Group Operations Director
Slide 36: Current trading and outlook
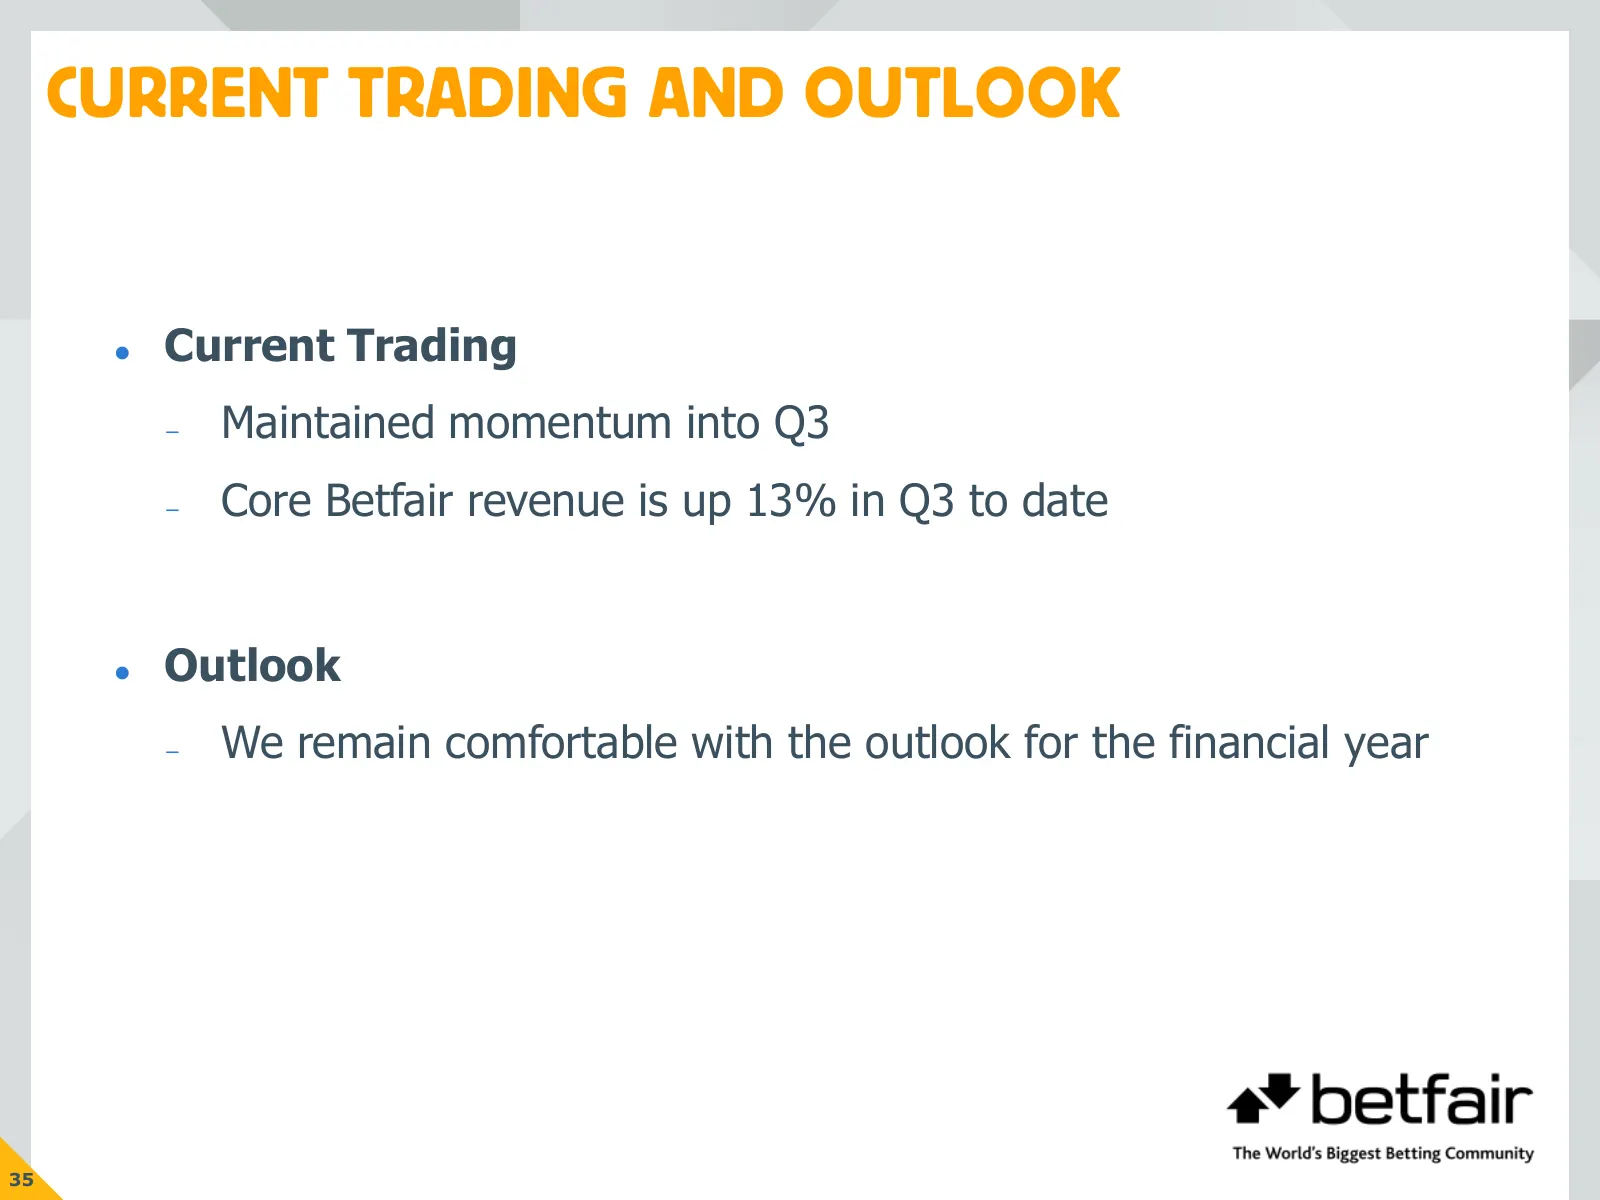
CURRENT TRADING AND OUTLOOK Current Trading – Maintained momentum into Q3 – Core Betfair revenue is up 13% in Q3 to date Outlook – We remain comfortable with the outlook for the financial year 35
Slide 37: Summary
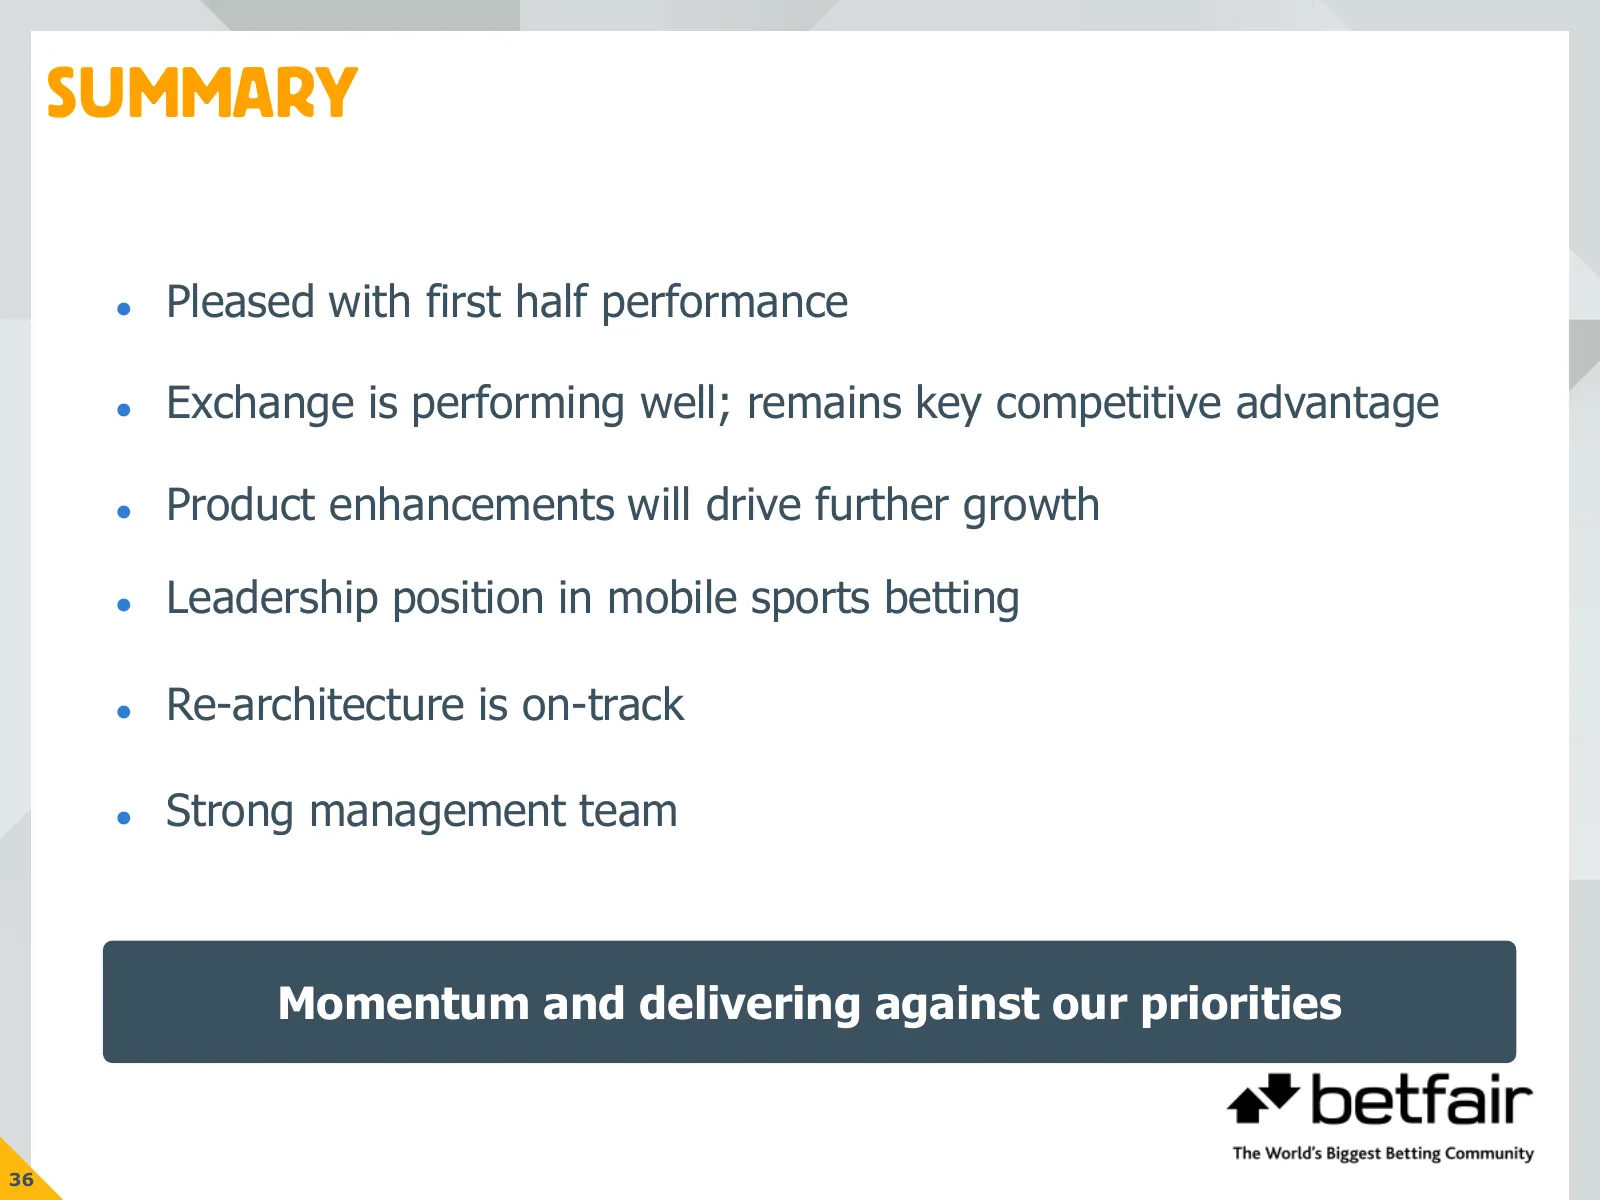
SUMMARY Pleased with first half performance Exchange is performing well; remains key competitive advantage Product enhancements will drive further growth Leadership position in mobile sports betting Re-architecture is on-track Strong management team Momentum and delivering against our pr

Slide 38: Appendix
a* betfair The World's Biggest Betting Community

Slide 39: A1: KPIs
A1: KPls a* betfair The World's Biggest Betting Community
Slide 40: A1: KPIs - by product, by half year
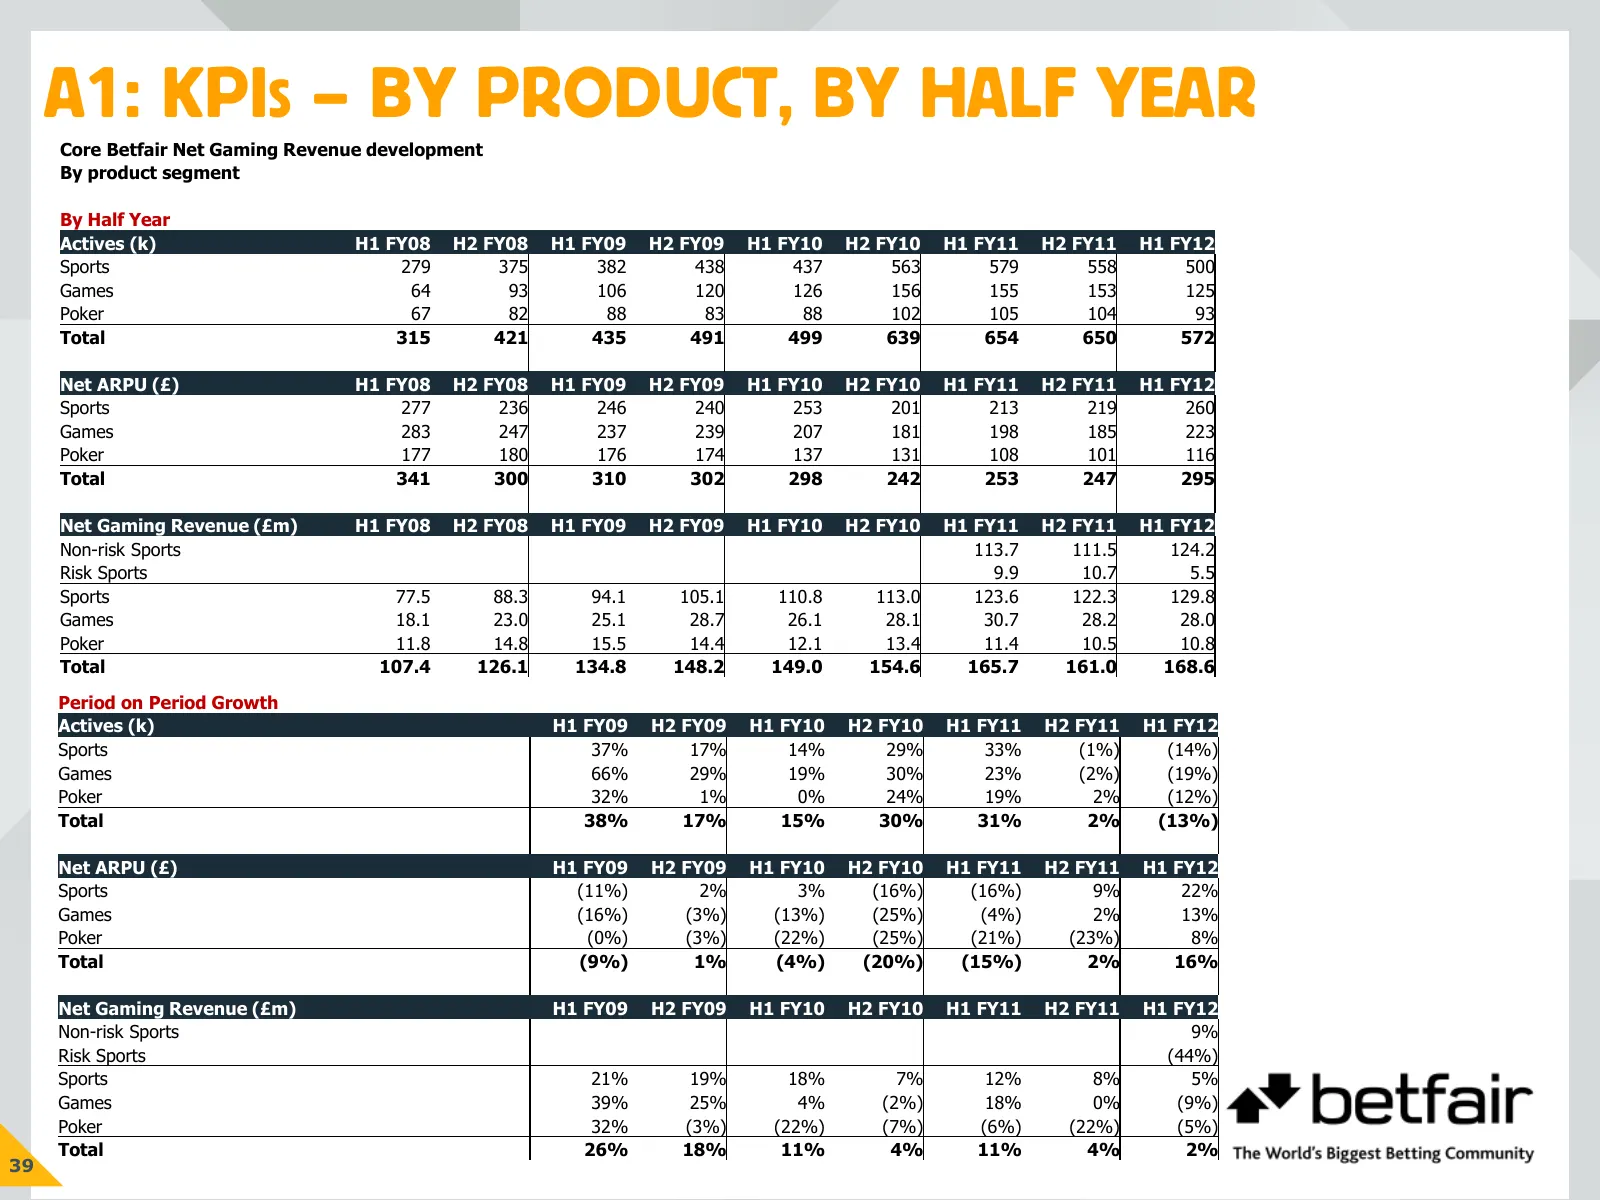
A1: KPIS – BY PRODUCT, BY HALF YEAR Core Betfair Net Gaming Revenue development By product segment By Half Year Actives (k) H1 FY08 H2 FY08 H1 FY09 H2 FY09 H1 FY10 H2 FY10 H1 FY11 H2 FY11 H1 FY12 Sports 279 375 382 438 437 563 579 558 500 Games 64 93 106 120 126 156 155 153 125 Poker 67 82 88 83 88
Slide 41: A1: KPIs - by product, by quarter
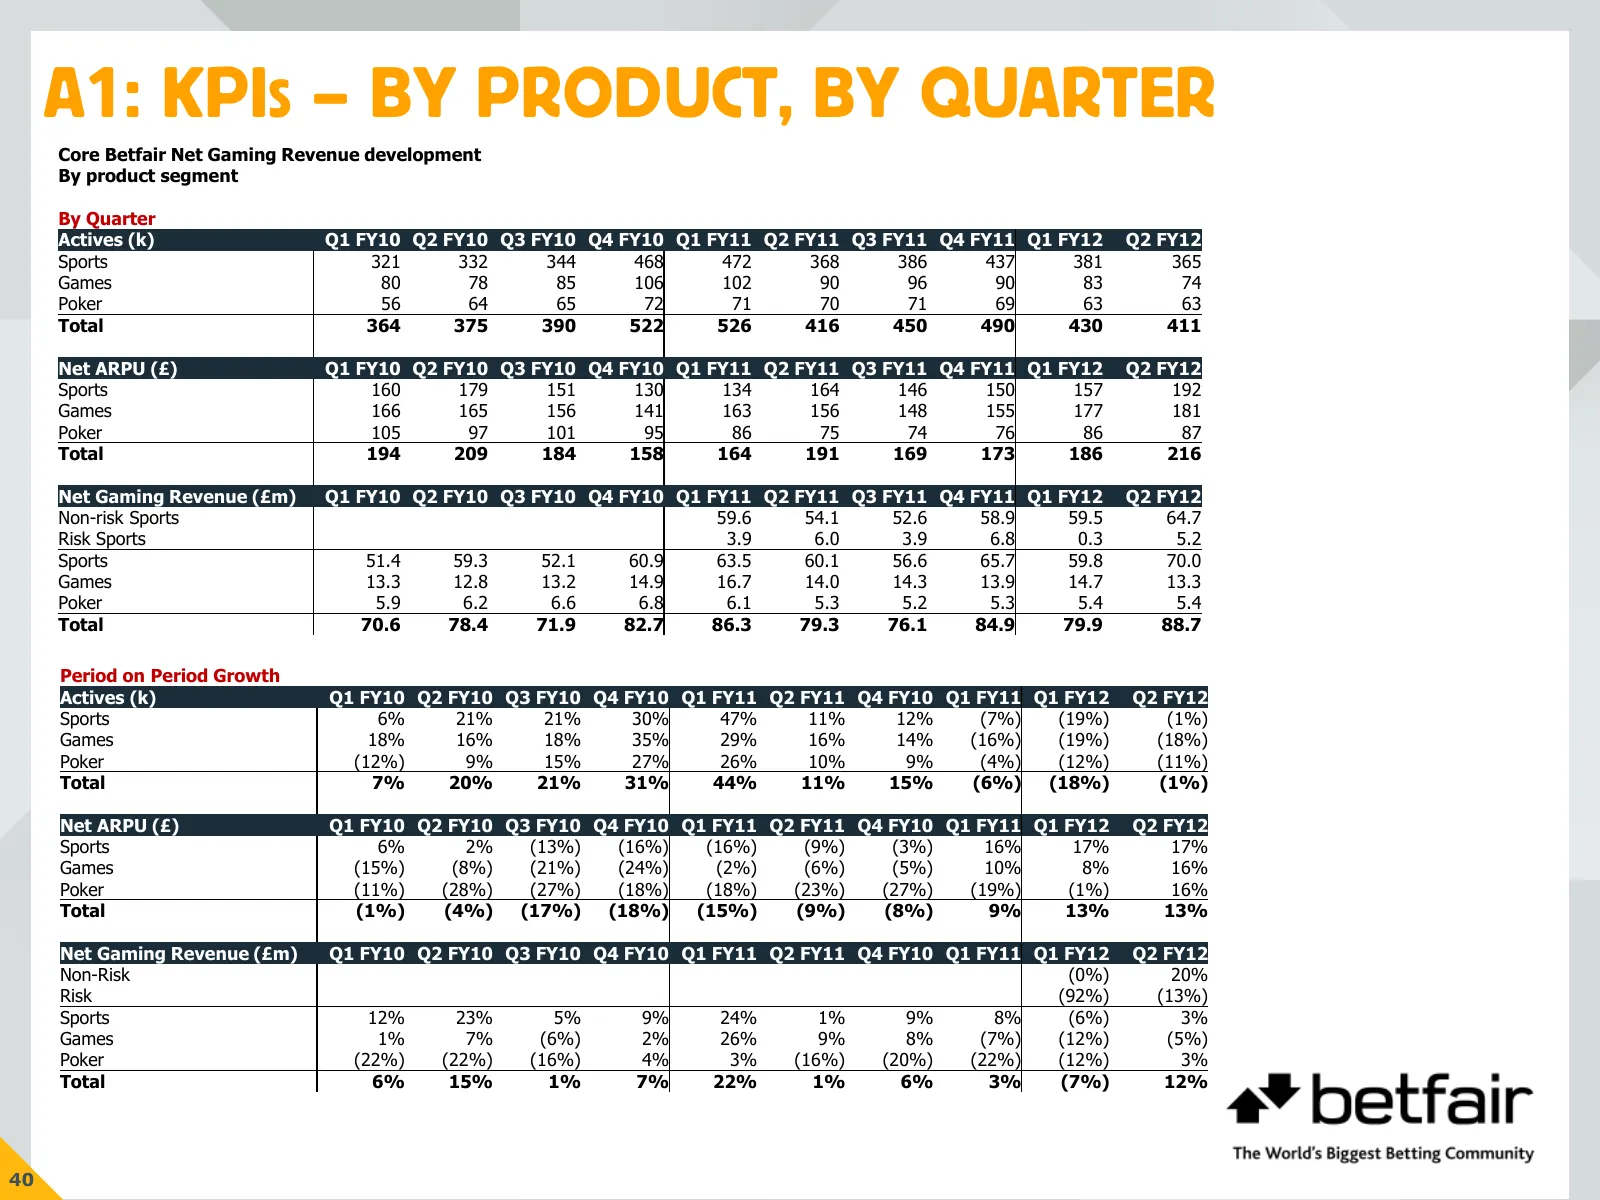
A1: KPIS – BY PRODUCT, BY QUARTER Core Betfair Net Gaming Revenue development By product segment By Quarter Actives (k) Q1 FY10 Q2 FY10 Q3 FY10 Q4 FY10 Q1 FY11 Q2 FY11 Q3 FY11 Q4 FY11 Q1 FY12 Q2 FY12 Sports 321 332 344 468 472 368 386 437 381 365 Games 80 78 85 106 102 90 96 90 83 74 Poker 56 64 65
Slide 42: A1: KPIs - by geography, by half year
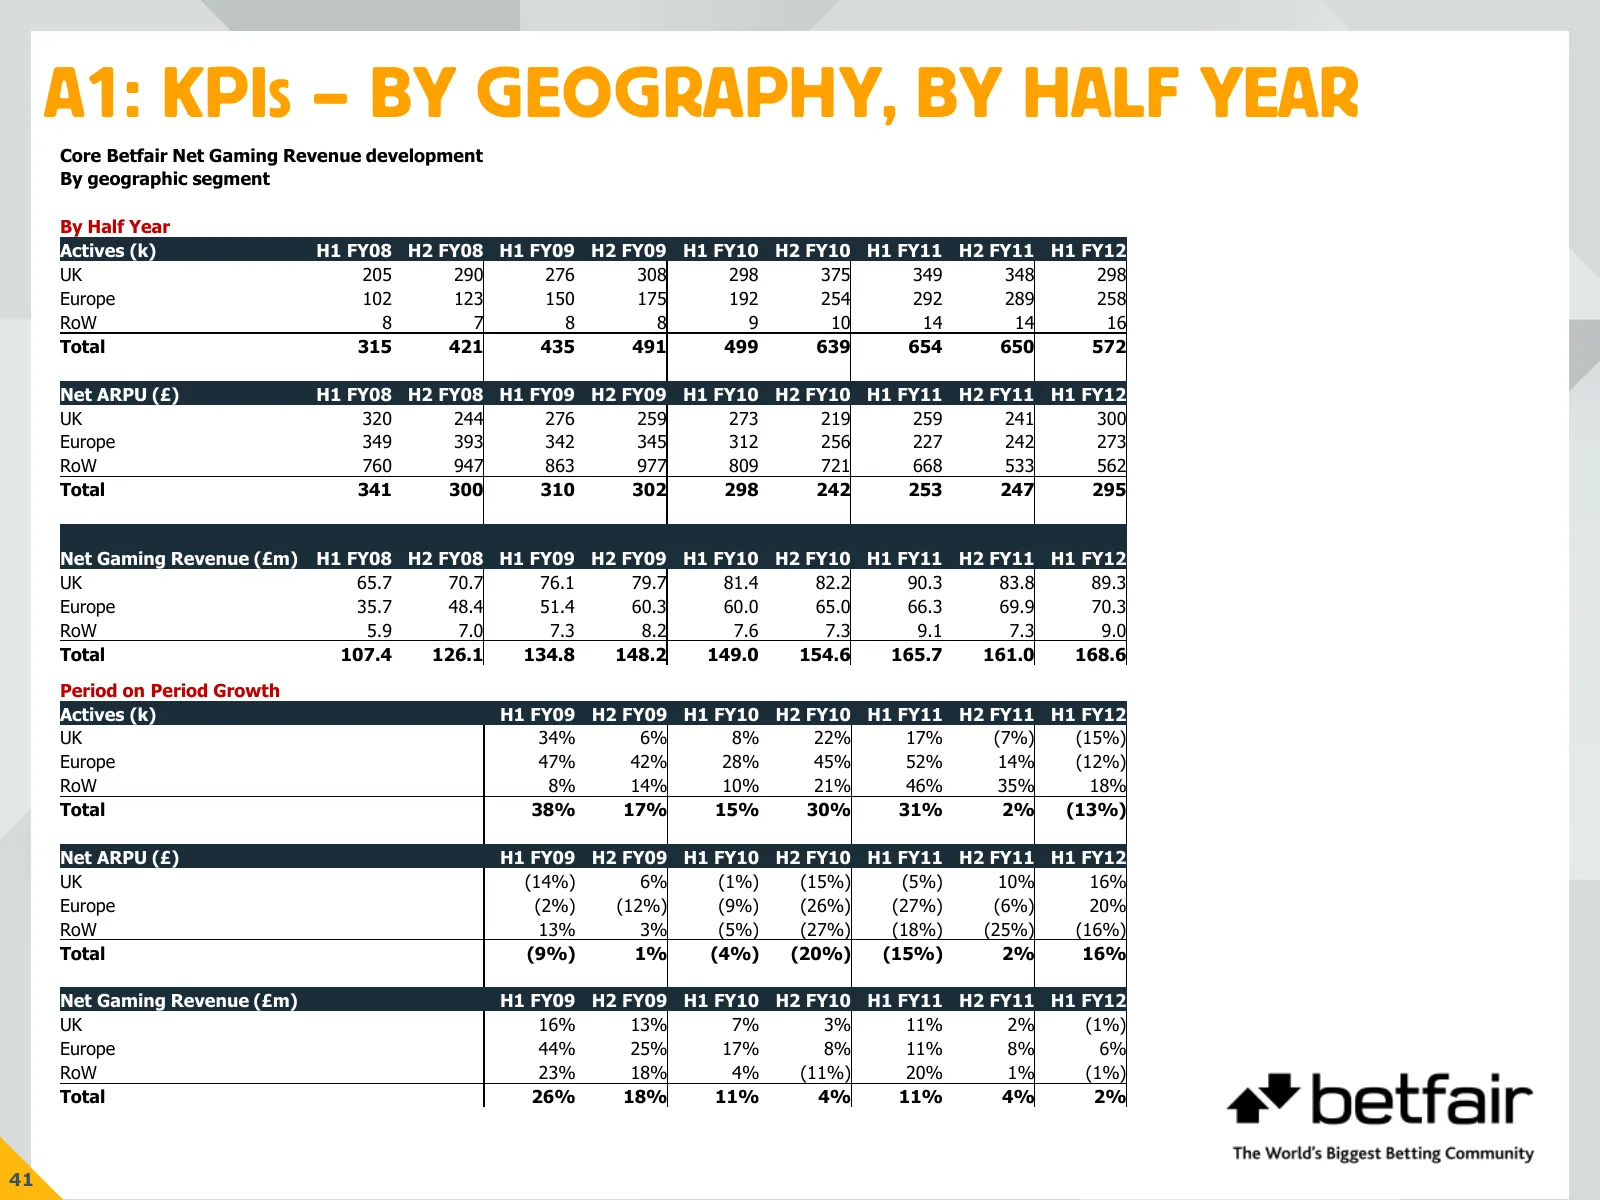
A1: KPIS – BY GEOGRAPHY, BY HALF YEAR Core Betfair Net Gaming Revenue development By geographic segment By Half Year Actives (k) H1 FY08 H2 FY08 H1 FY09 H2 FY09 H1 FY10 H2 FY10 H1 FY11 H2 FY11 H1 FY12 UK 205 290 276 308 298 375 349 348 298 Europe 102 123 150 175 192 254 292 289 258 RoW 8 7 8 8 9 10
Slide 43: A1: KPIs - by geography, by quarter
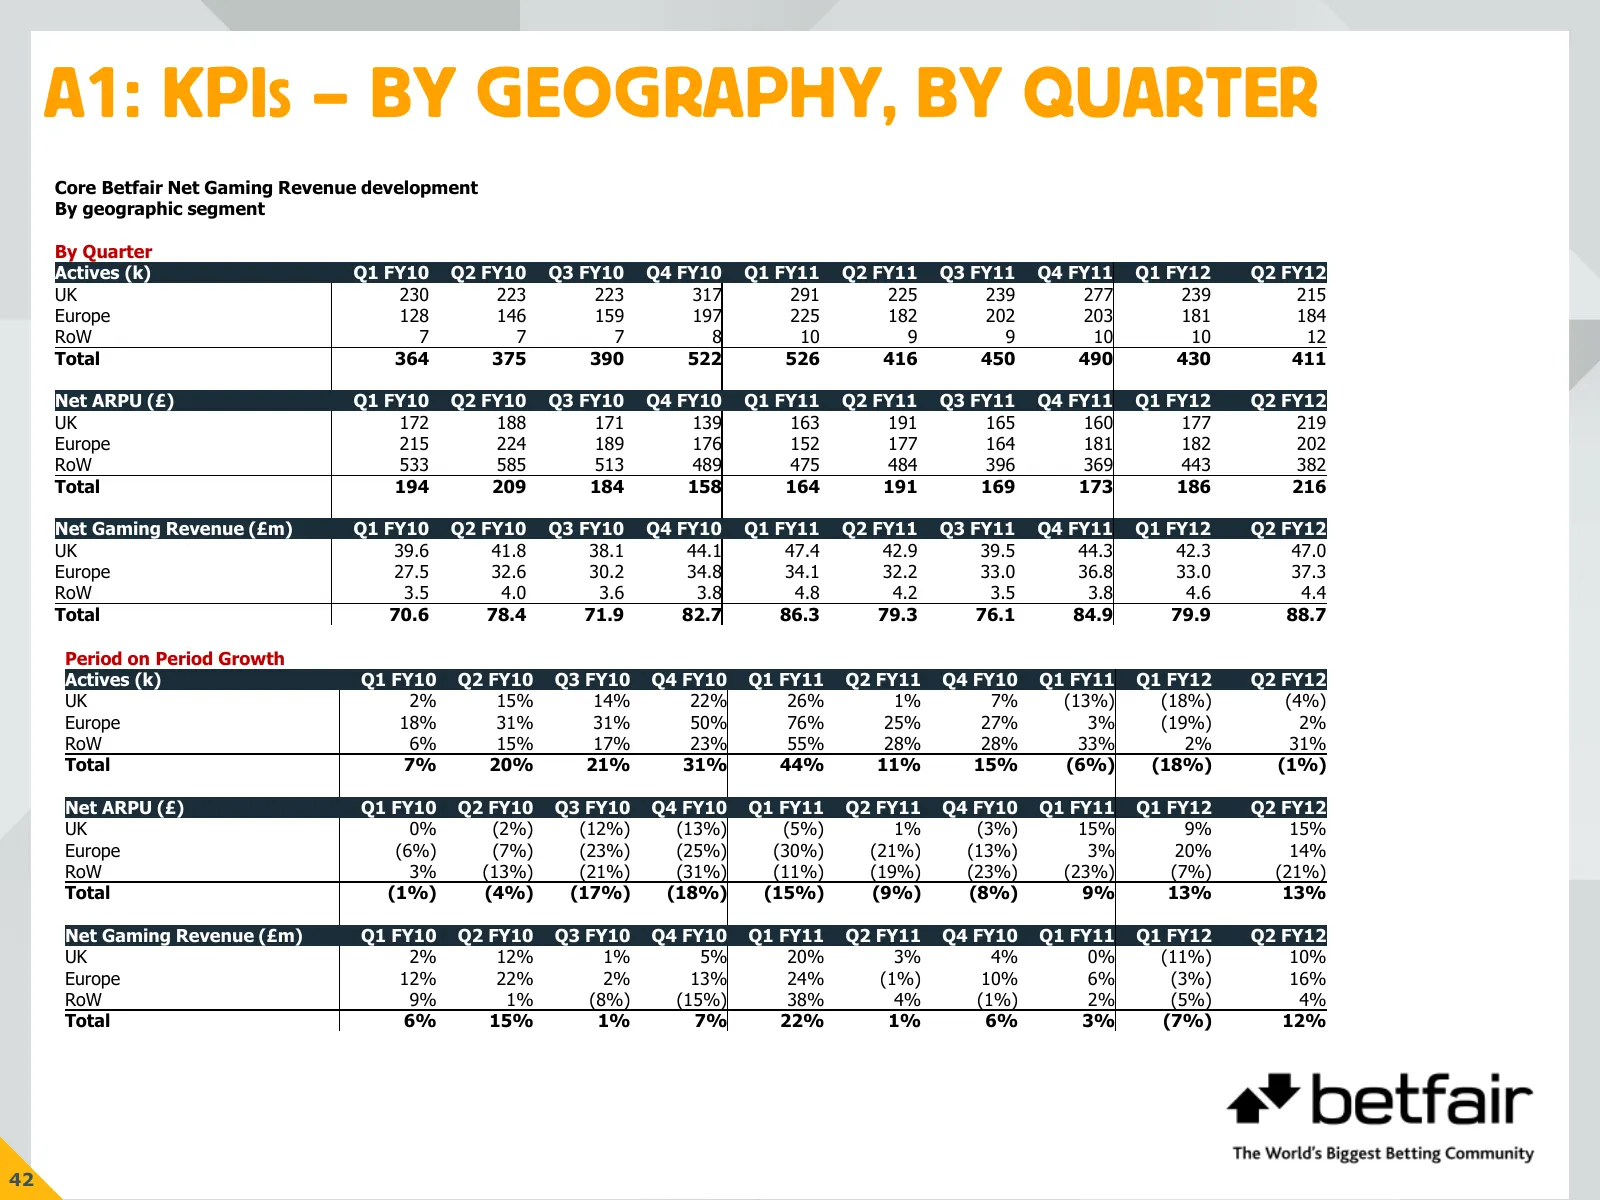
A1: KPIS – BY GEOGRAPHY, BY QUARTER Core Betfair Net Gaming Revenue development By geographic segment By Quarter Actives (k) Q1 FY10 Q2 FY10 Q3 FY10 Q4 FY10 Q1 FY11 Q2 FY11 Q3 FY11 Q4 FY11 Q1 FY12 Q2 FY12 UK 230 223 223 317 291 225 239 277 239 215 Europe 128 146 159 197 225 182 202 203 181 184 RoW 7
Slide 44: A2: Reported group income statement and adjustments
A2: REPORTED GROUP INCOME STATEMENT AND ADJUSTMENTS
Slide 45: A2: Underlying group income statement
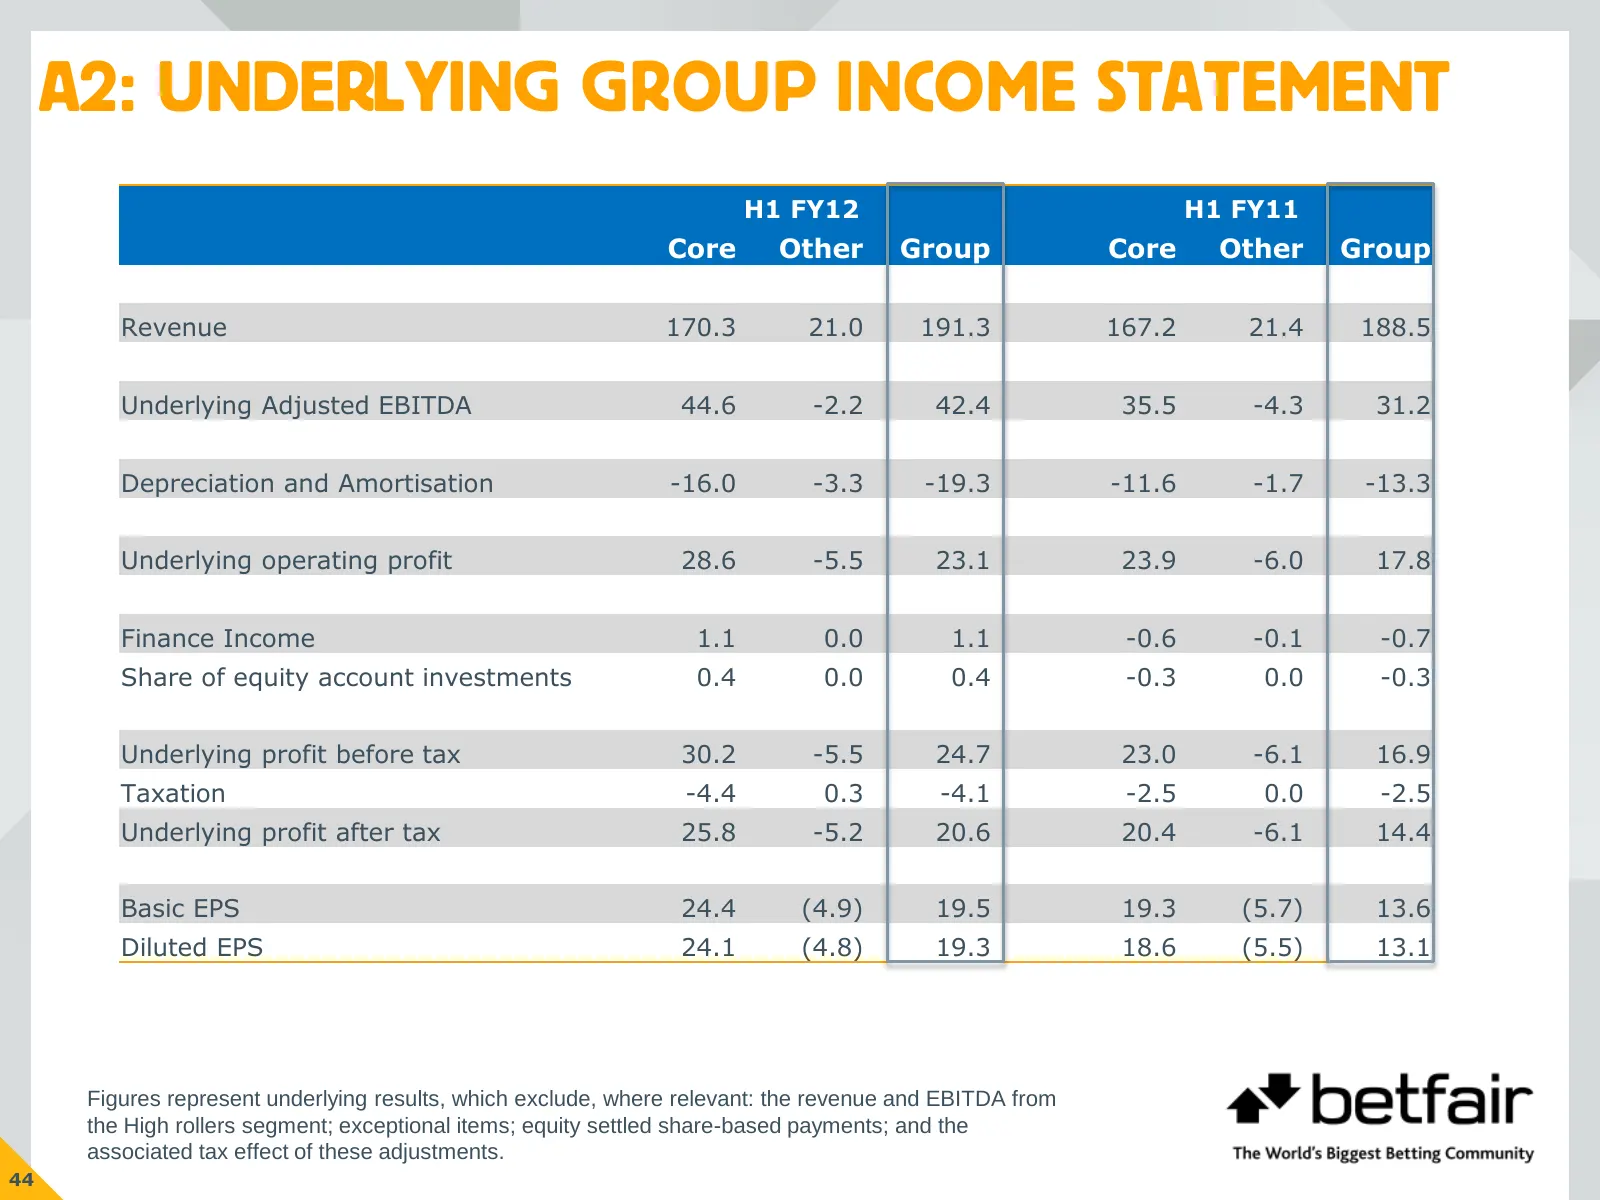
A2: UNDERLYING GROUP INCOME STATEMENT H1 FY12 H1 FY11 Core Other Group Core Other Group Revenue 170.3 21.0 191.3 167.2 21.4 188.5 Underlying Adjusted EBITDA 44.6 -2.2 42.4 35.5 -4.3 31.2 Depreciation and Amortisation -16.0 -3.3 -19.3 -11.6 -1.7 -13.3 Underlying operating profit 28.6 -5.5 23.1 23.9 -
Slide 46: A2: Adjustments
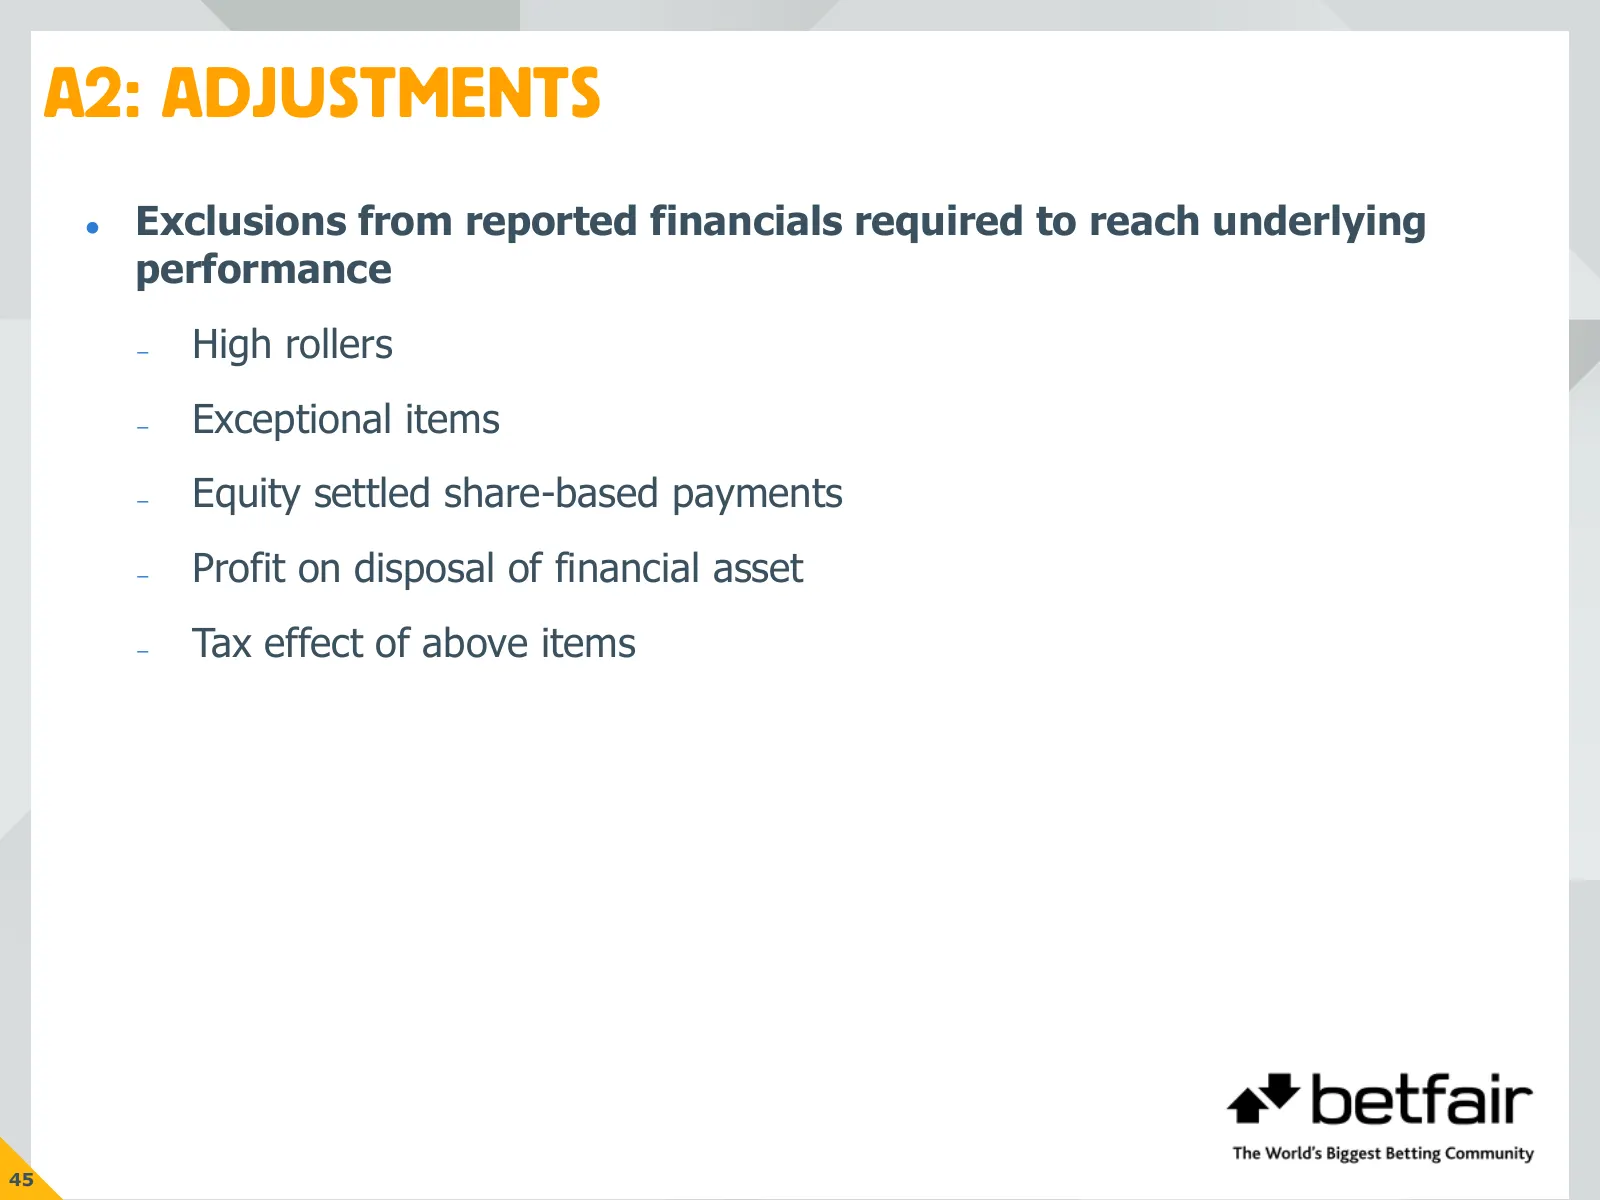
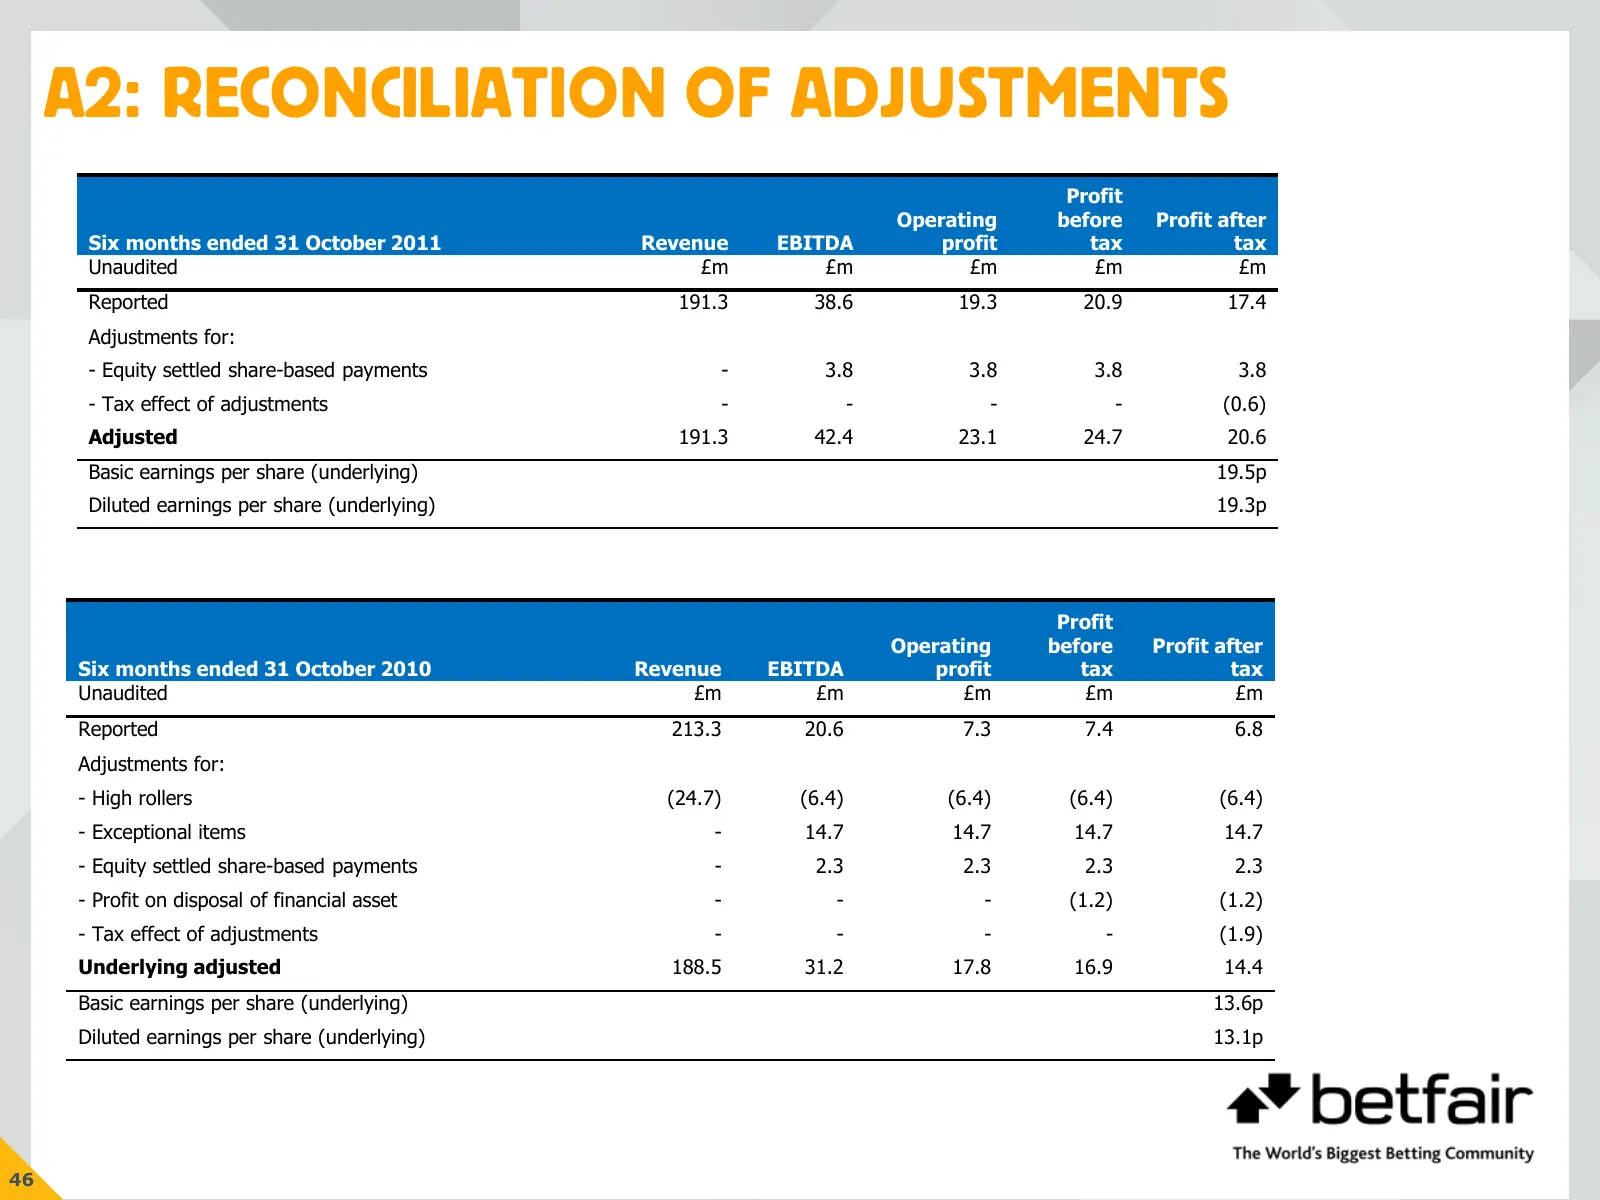
A2: ADJUSTMENTS Exclusions from reported financials required to reach underlying performance – High rollers – Exceptional items – Equity settled share-based payments – Profit on disposal of financial asset – Tax effect of above items 45
Slide 47: A2: Reconciliation of adjustments
A2: RECONCILIATION OF ADJUSTMENTS Profit Operating before Profit after Six months ended 31 October 2011 Revenue EBITDA profit tax tax Unaudited £m £m £m £m £m Reported 191.3 38.6 19.3 20.9 17.4 Adjustments for: - Equity settled share-based payments - 3.8 3.8 3.8 3.8 - Tax effect of adjustments - - -
Source: Internet Archive copy of flutter.com
More decks from Flutter Entertainment plc
 Q3 2026 Earnings Presentation15 slides · Nov 4, 2026
 Q2 2026 Earnings Presentation14 slides · Aug 5, 2026
 Investor Day (September 2024)152 slides · Sep 25, 2024
 Q2 2024 Earnings Presentation20 slides · Aug 13, 2024
 Q1 2024 Earnings Presentation20 slides · May 14, 2024
 FY2023 Earnings Presentation36 slides · Mar 26, 2024