SUSS MicroTec SE · XETR:SMHN
SUSS MicroTec — FY2019 Earnings Presentation
12 slides from SUSS MicroTec's earnings presentation, Apr 2, 2020

Slide 1: Annual Figures for Fiscal Year 2019
SUSS MICROTEC ANNUAL FIGURES FOR FISCAL YEAR 2019 APRIL 2, 2020 This presentation contains forward-looking statements relating to the business, financial performance and earnings of SUSS MicroTec SE and its subsidiaries and associates. Forward-looking statements are based on current plans, estimates
Slide 2: Financial Year 2019 at a Glance
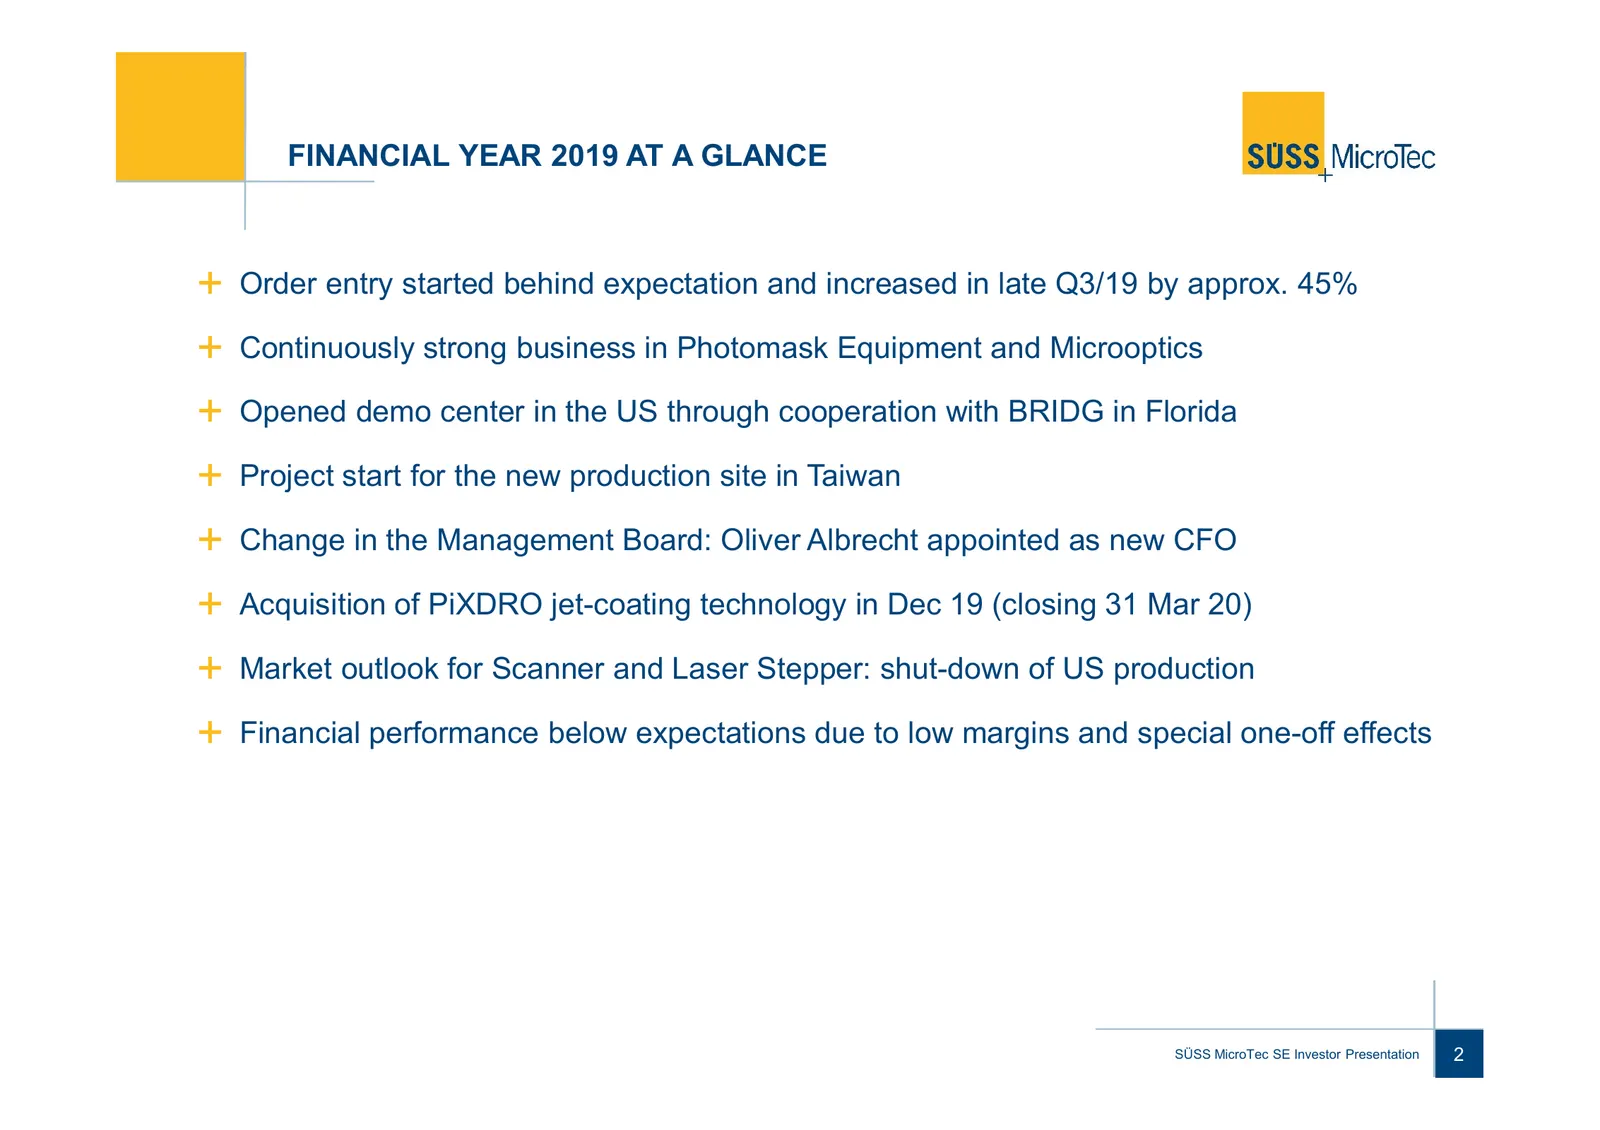
FINANCIAL YEAR 2019 AT A GLANCE Order entry started behind expectation and increased in late Q3/19 by approx. 45% Continuously strong business in Photomask Equipment and Microoptics Opened demo center in the US through cooperation with BRIDG in Florida Project start for the new production site in Ta
Slide 3: Key Group Figures 2019
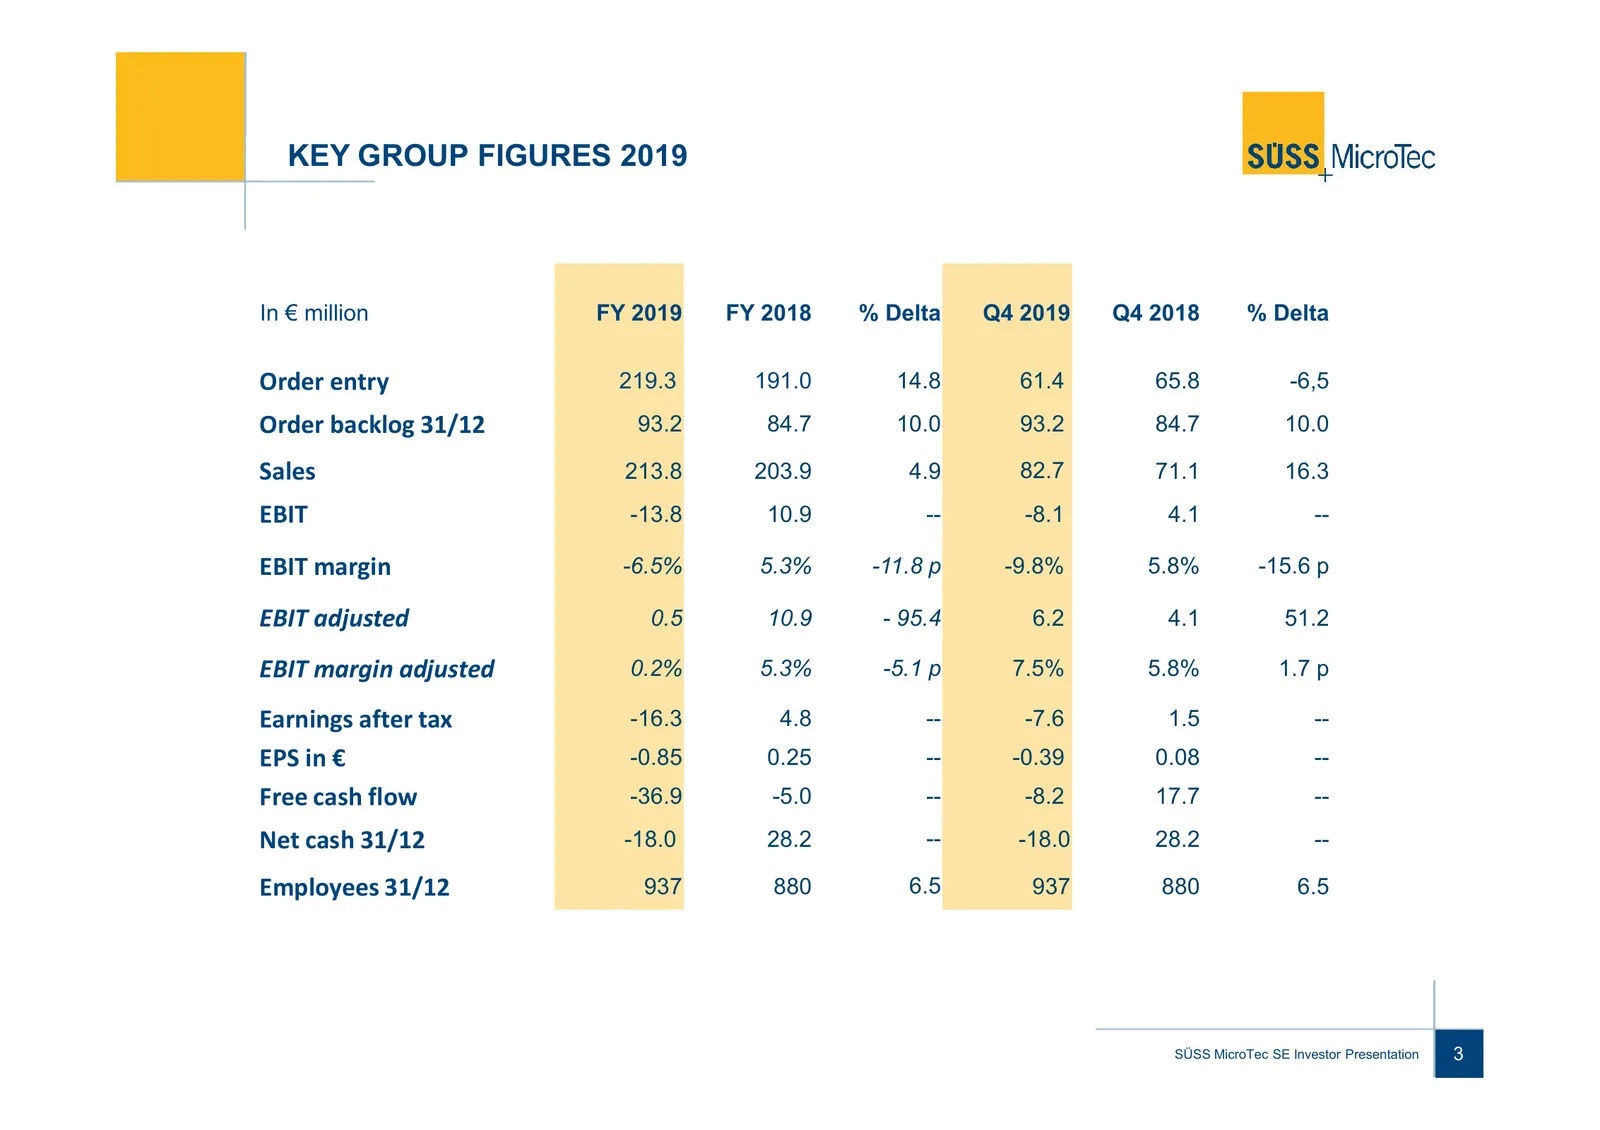
KEY GROUP FIGURES 2019 In € million FY 2019 FY 2018 % Delta Q4 2019 Q4 2018 % Delta Order entry 219.3 191.0 14.8 61.4 65.8 -6,5 Order backlog 31/12 93.2 84.7 10.0 93.2 84.7 10.0 Sales 213.8 203.9 4.9 82.7 71.1 16.3 EBIT -13.8 10.9 -- -8.1 4.1 -- EBIT margin -6.5% 5.3% -11.8 p -9.8% 5.8% -15.6 p EBIT
Slide 4: Segment Overview 2019
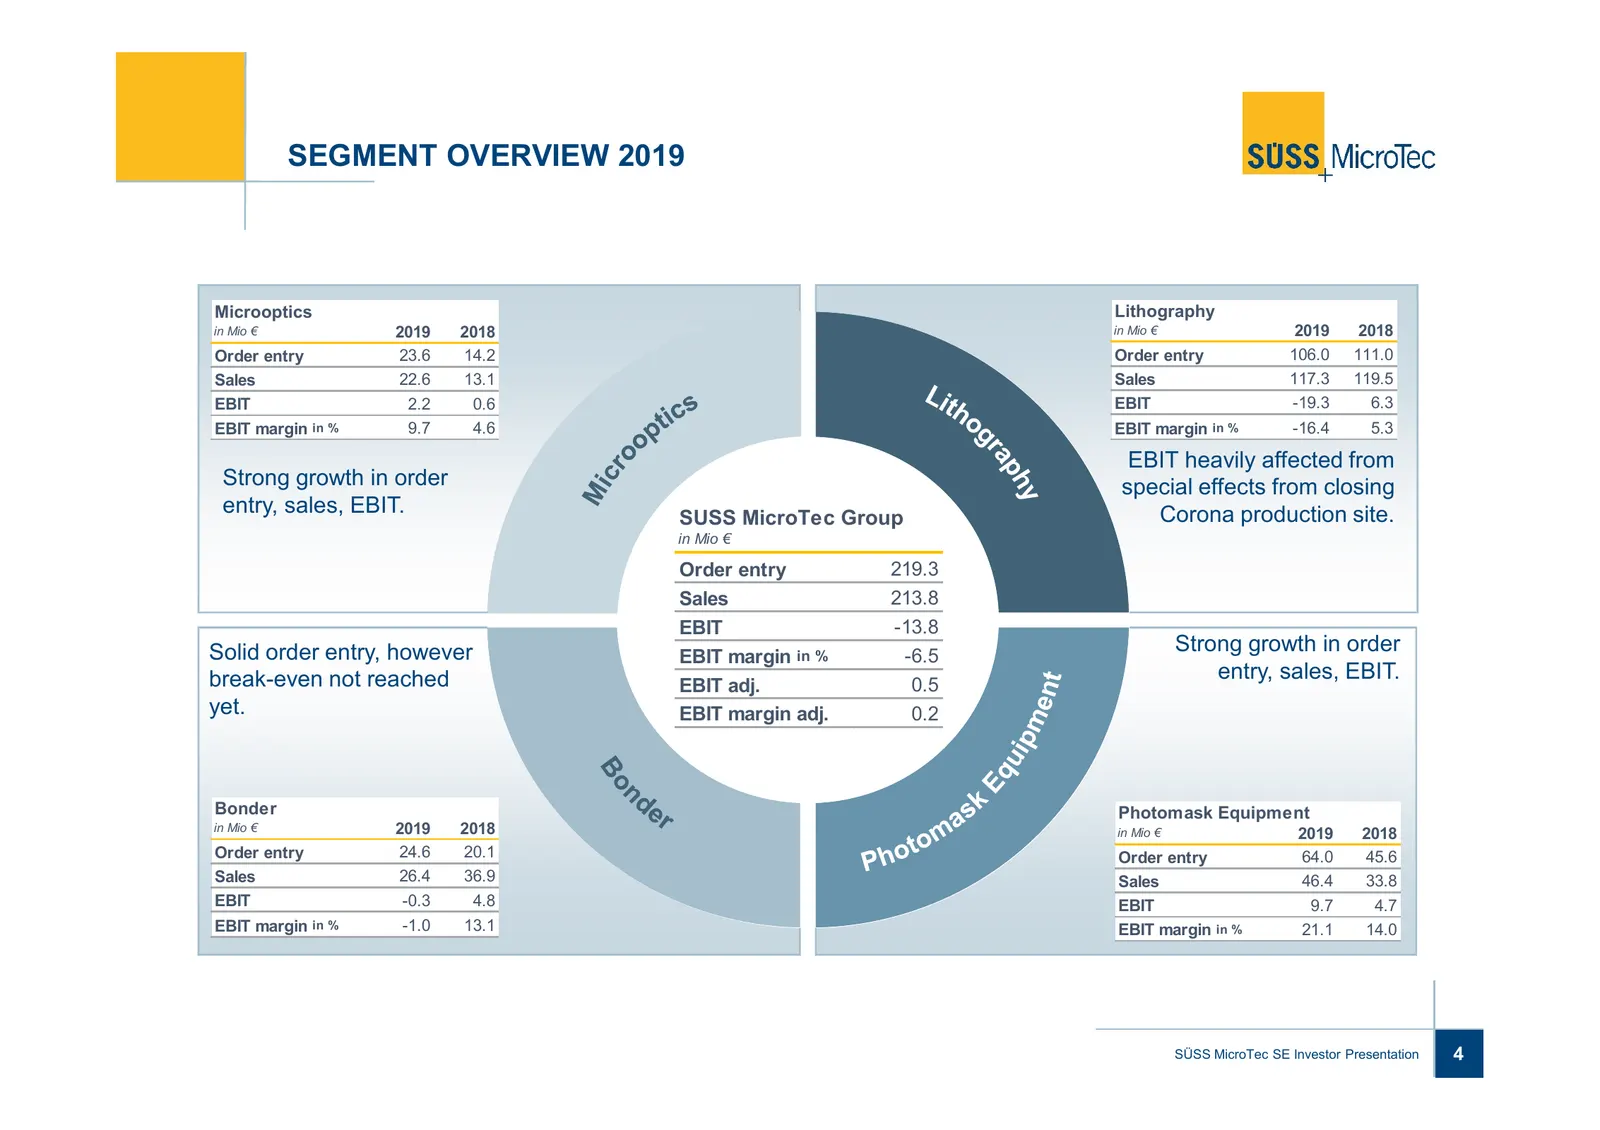
SEGMENT OVERVIEW 2019 Microoptics Lithography in Mio € 2019 2018 in Mio € 2019 2018 Order entry 23.6 14.2 Order entry 106.0 111.0 Sales 22.6 13.1 Sales 117.3 119.5 EBIT 2.2 0.6 EBIT -19.3 6.3 EBIT margin in % 9.7 4.6 EBIT margin in % -16.4 5.3 EBIT heavily affected from Strong growth in order specia
Slide 5: Order Entry: Quarterly Performance
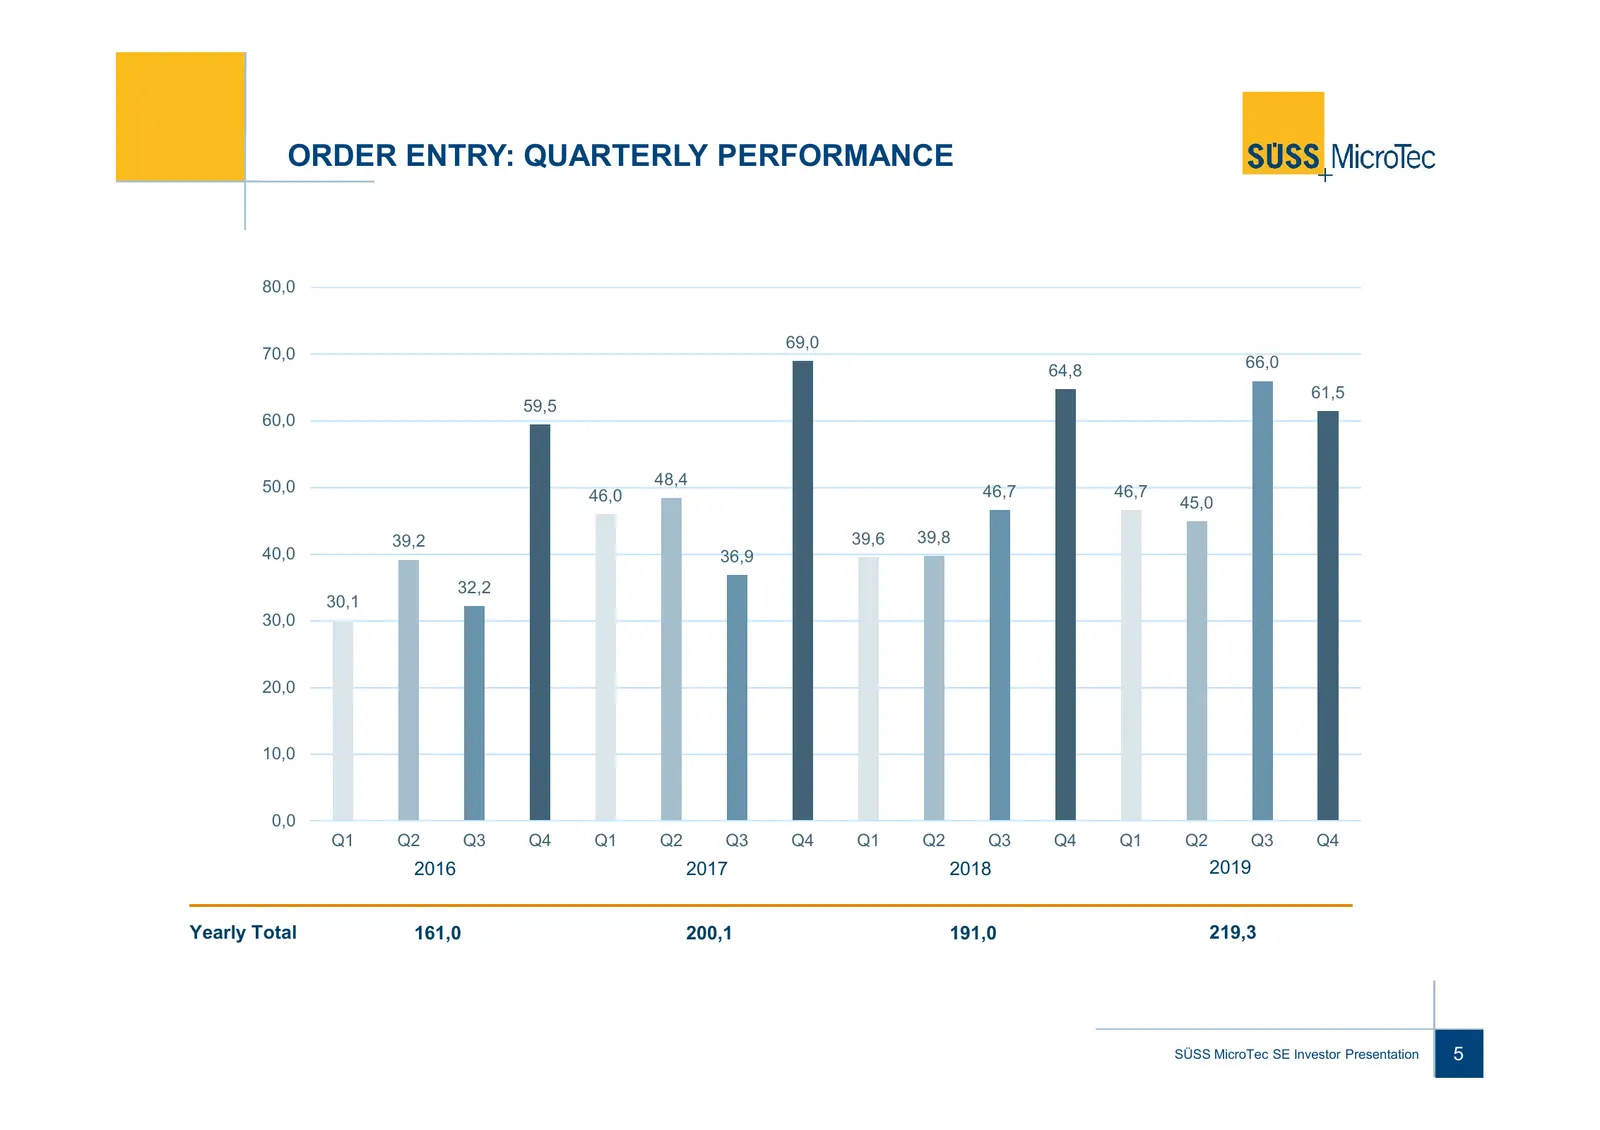
ORDER ENTRY: QUARTERLY PERFORMANCE 80,0 69,0 70,0 64,8 66,0 61,5 59,5 60,0 50,0 48,4 46,0 46,7 46,7 45,0 39,2 39,6 39,8 40,0 36,9 32,2 30,1 30,0 20,0 10,0 0,0 Q1 Q2 Q3 Q4 Q1 Q2 Q3 Q4 Q1 Q2 Q3 Q4 Q1 Q2 Q3 Q4 2016 2017 2018 2019 Yearly Total 161,0 200,1 191,0 219,3 SÜSS MicroTec SE Investor Presentati
Slide 6: Balance Sheet
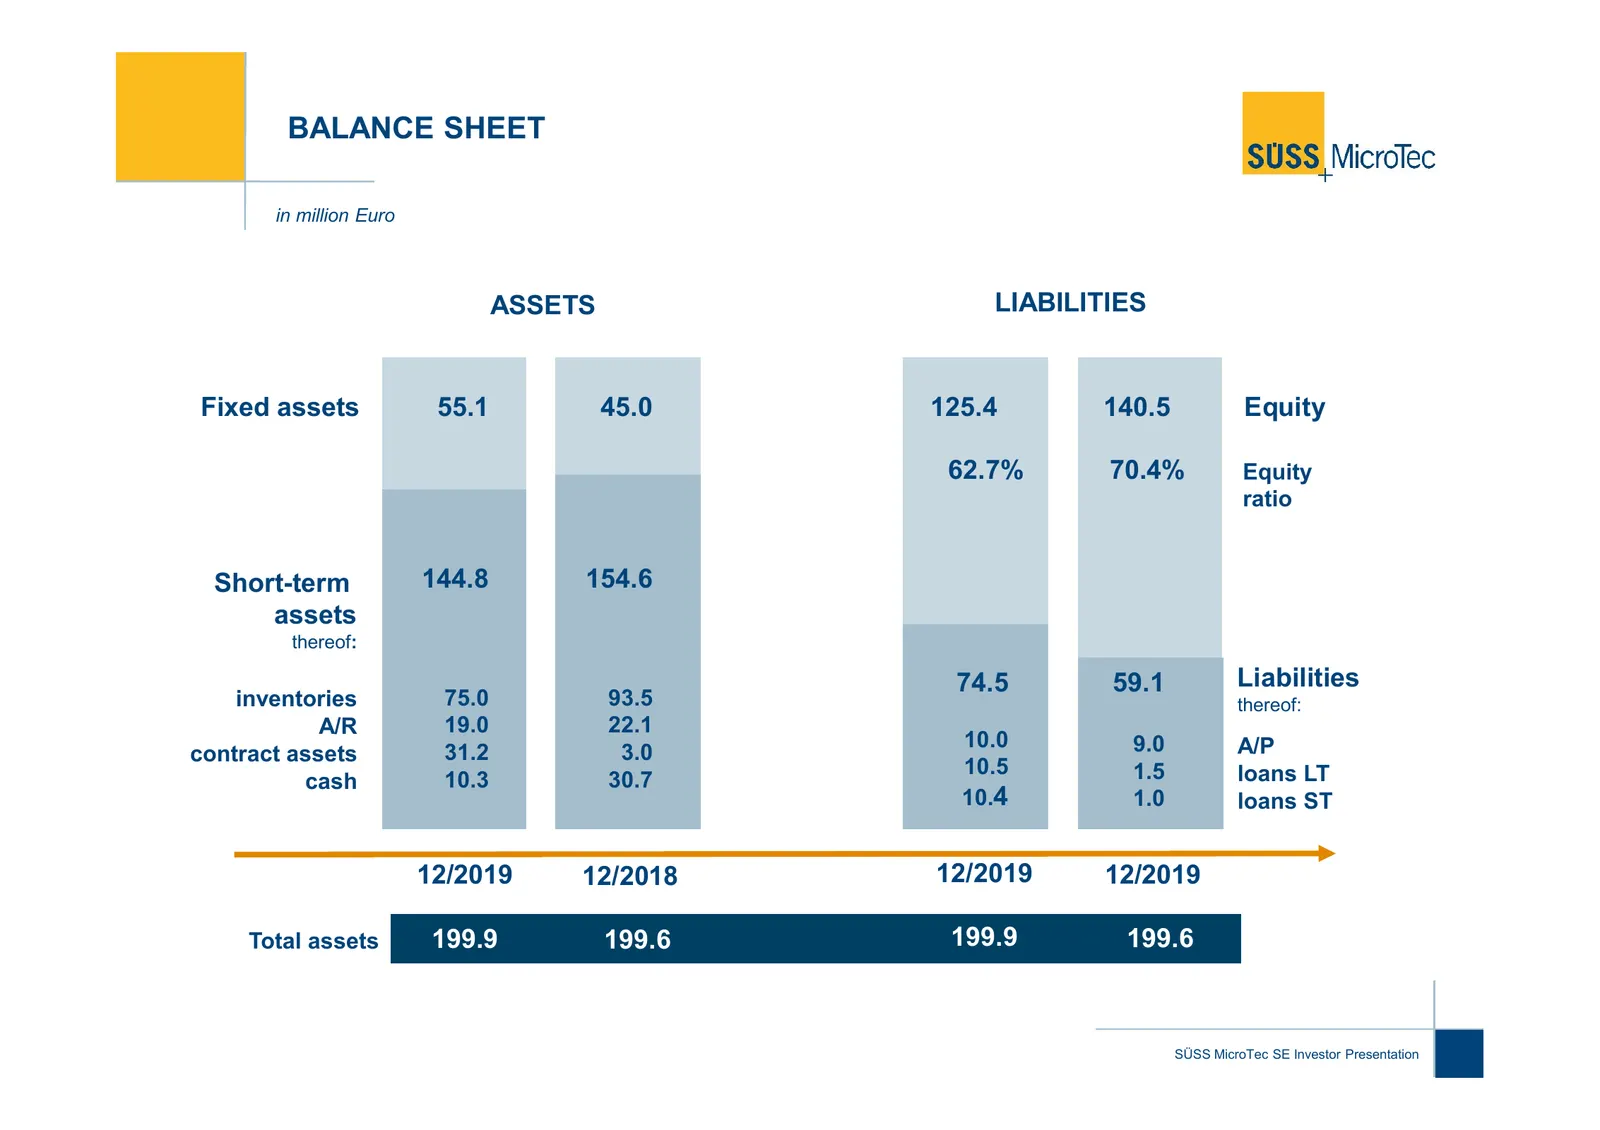
BALANCE SHEET in million Euro ASSETS LIABILITIES AKTIVA PASSIVA Fixed assets 55.1 45.0 125.4 140.5 Equity 62.7% 70.4% Equity ratio Short-term 144.8 154.6 assets thereof: 74.5 59.1 Liabilities inventories 75.0 93.5 thereof: A/R 19.0 22.1 10.0 9.0 A/P contract assets 31.2 3.0 10.5 1.5 loans LT cash 10
Slide 7: Bridge from Guidance to Final Results
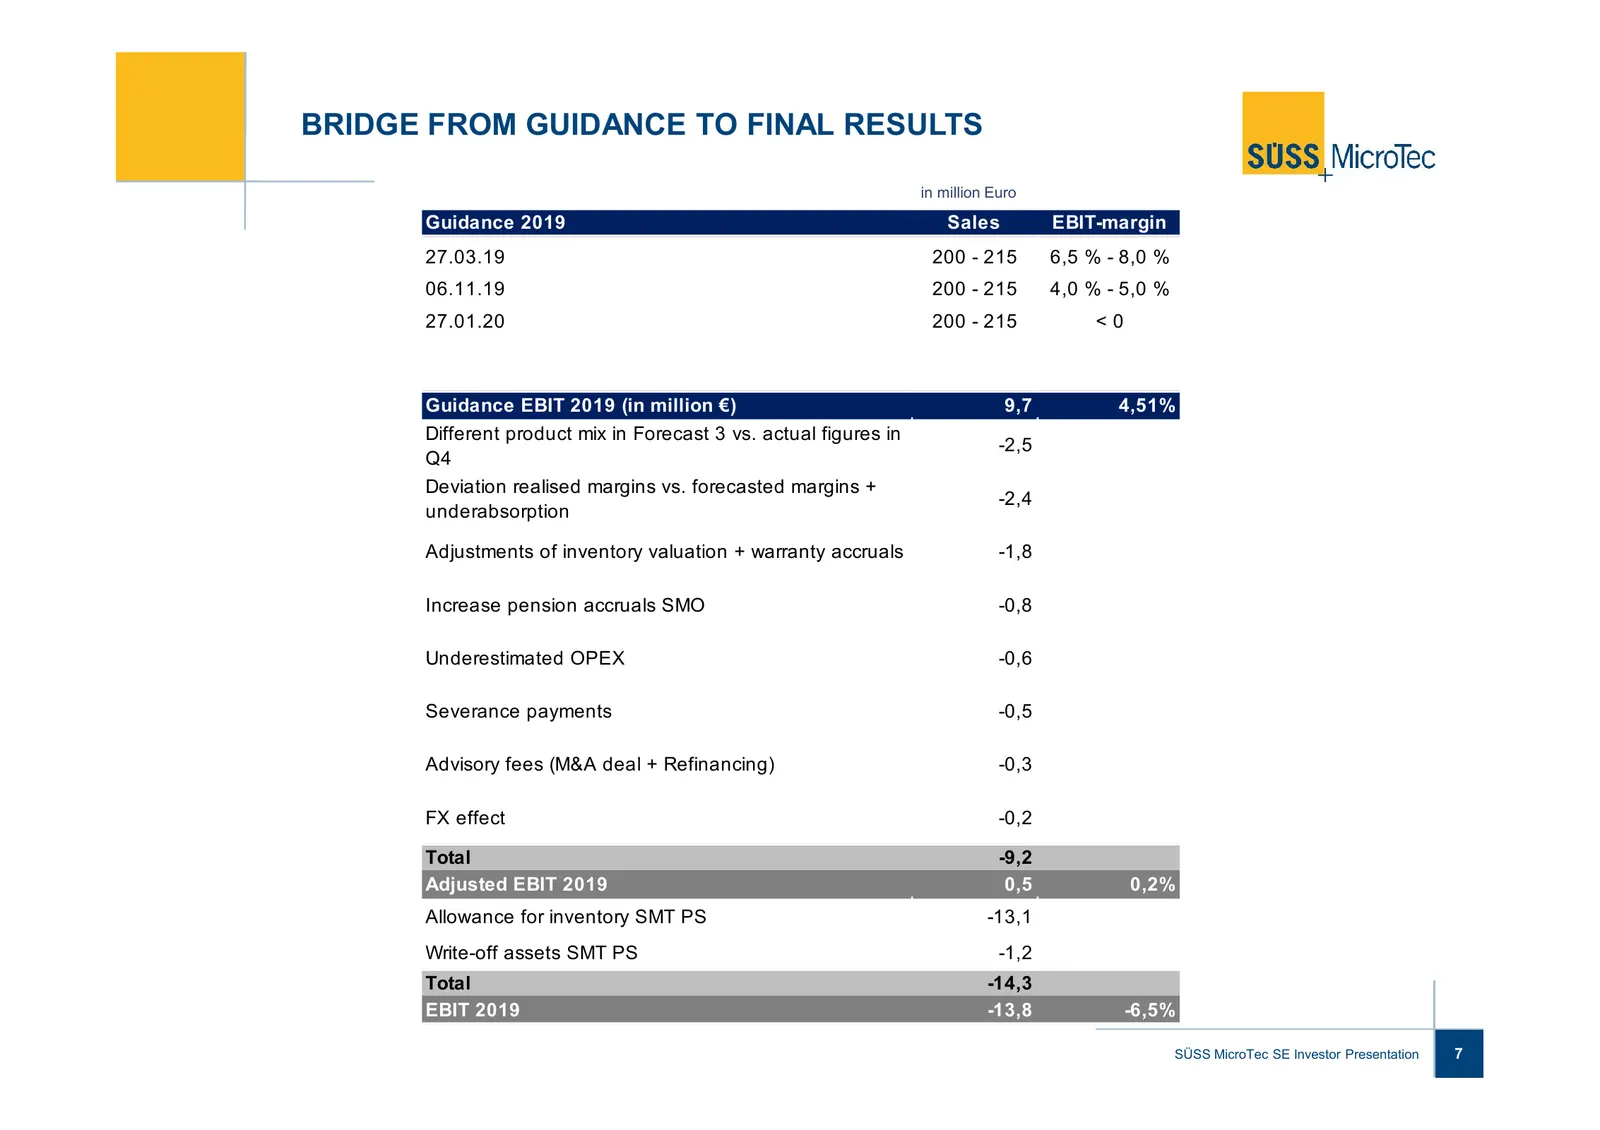
BRIDGE FROM GUIDANCE TO FINAL RESULTS in million Euro Guidance 2019 Sales EBIT-margin 27.03.19 200 - 215 6,5 % - 8,0 % 06.11.19 200 - 215 4,0 % - 5,0 % 27.01.20 200 - 215 <0 Guidance EBIT 2019 (in million €) 9,7 4,51% Different product mix in Forecast 3 vs. actual figures in -2,5 Q4 Deviation realis
Slide 8: Measures to Improve Profitability and Cash Flow
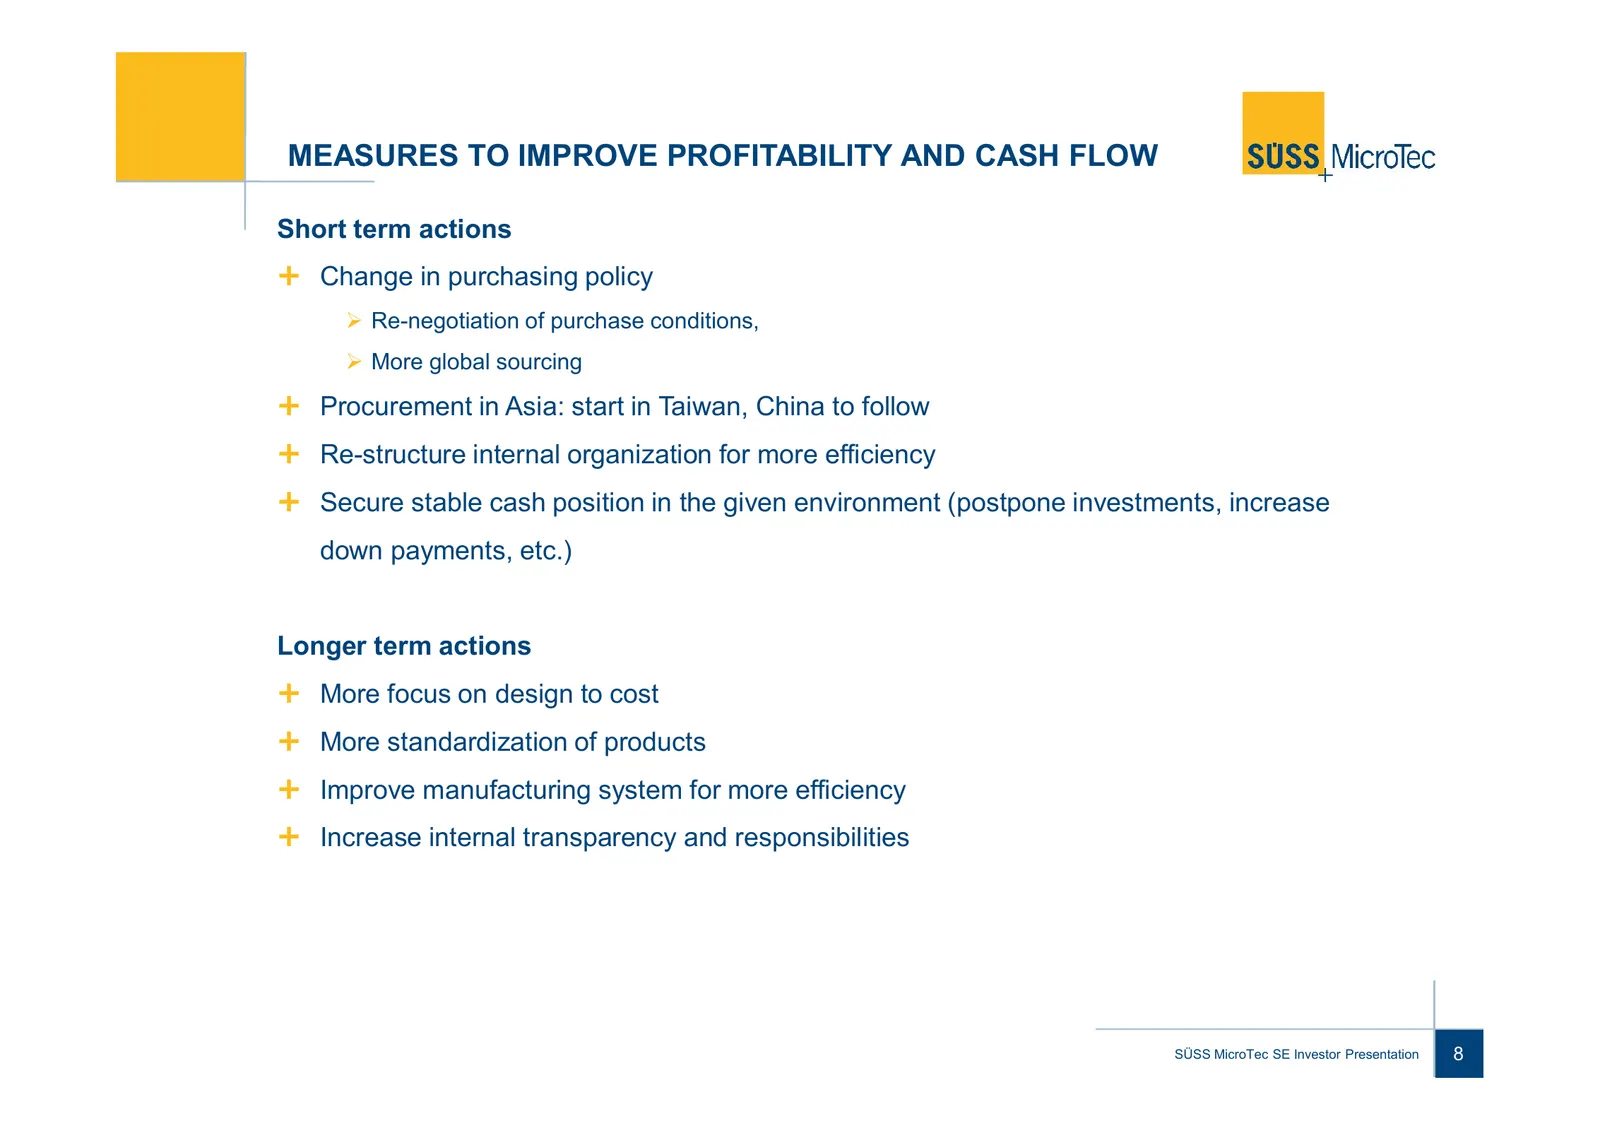
MEASURES TO IMPROVE PROFITABILITY AND CASH FLOW Short term actions Change in purchasing policy Re-negotiation of purchase conditions, More global sourcing Procurement in Asia: start in Taiwan, China to follow Re-structure internal organization for more efficiency Secure stable cash position in t
Slide 9: Strategic Decision: Product Discontinuation
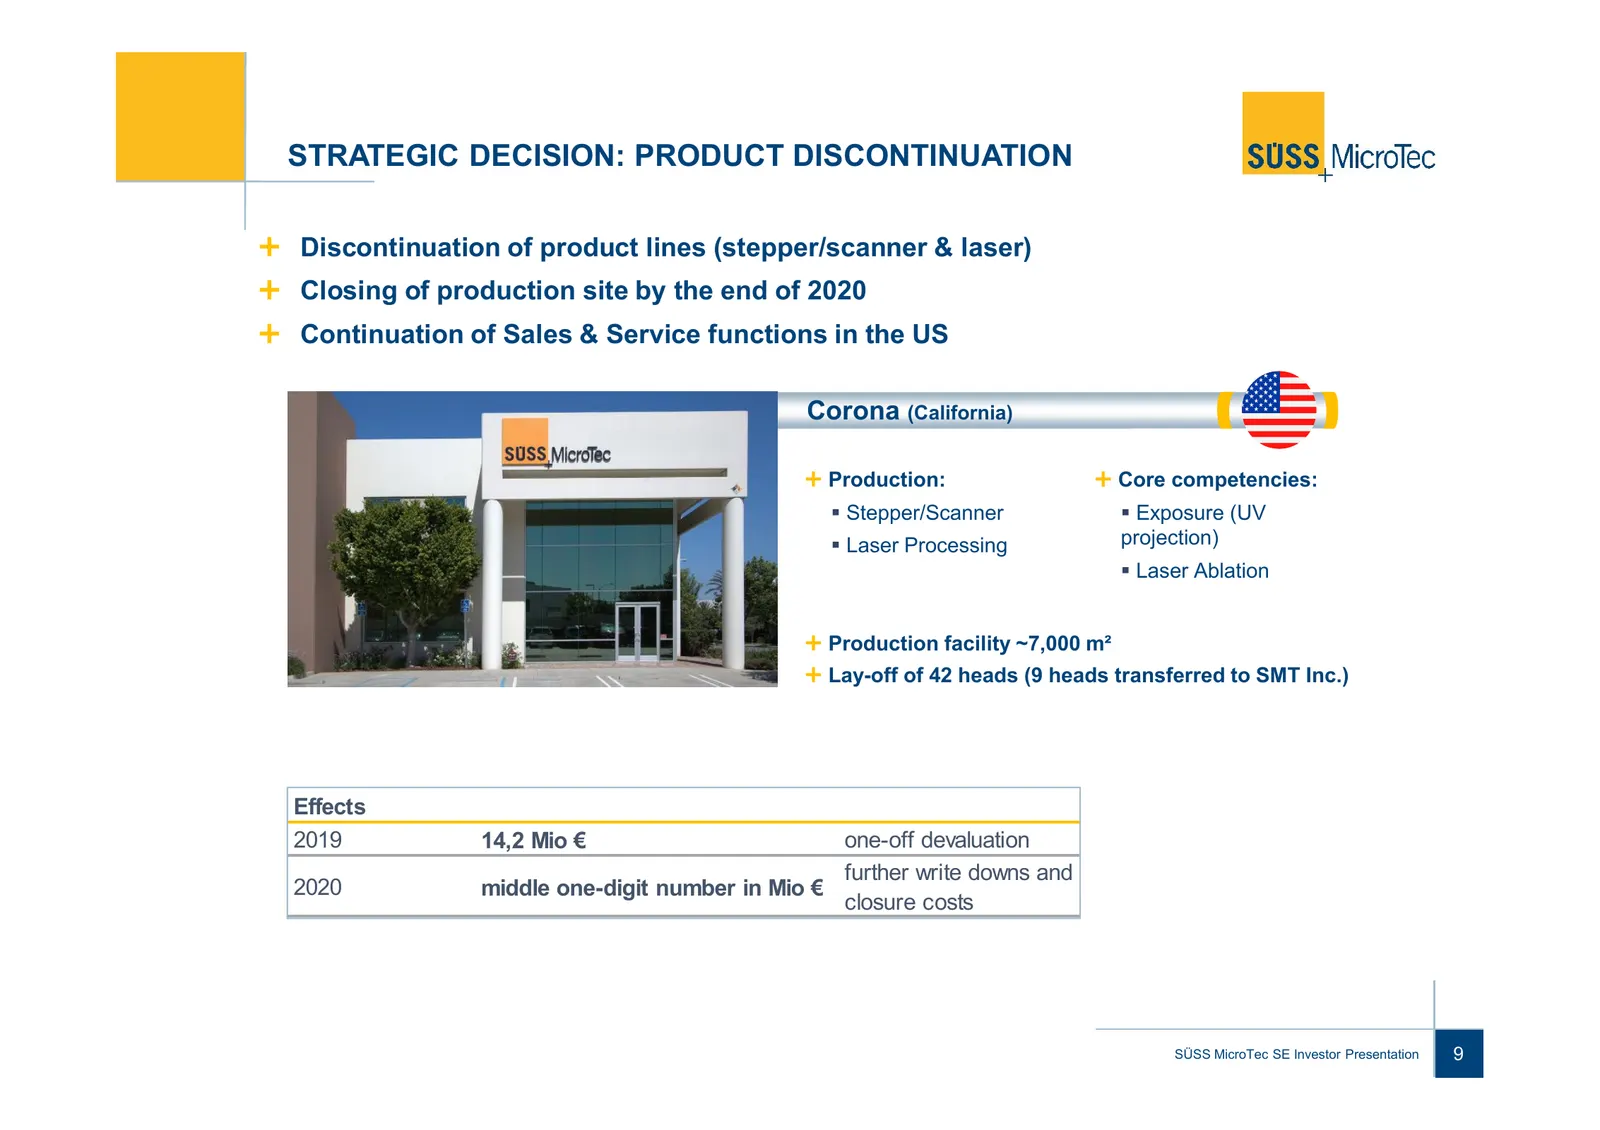
STRATEGIC DECISION: PRODUCT DISCONTINUATION Discontinuation of product lines (stepper/scanner & laser) Closing of production site by the end of 2020 Continuation of Sales & Service functions in the US Corona (California) Production: Core competencies: Stepper/Scanner Exposure (UV Laser Process
Slide 10: Sales 2019 per Region
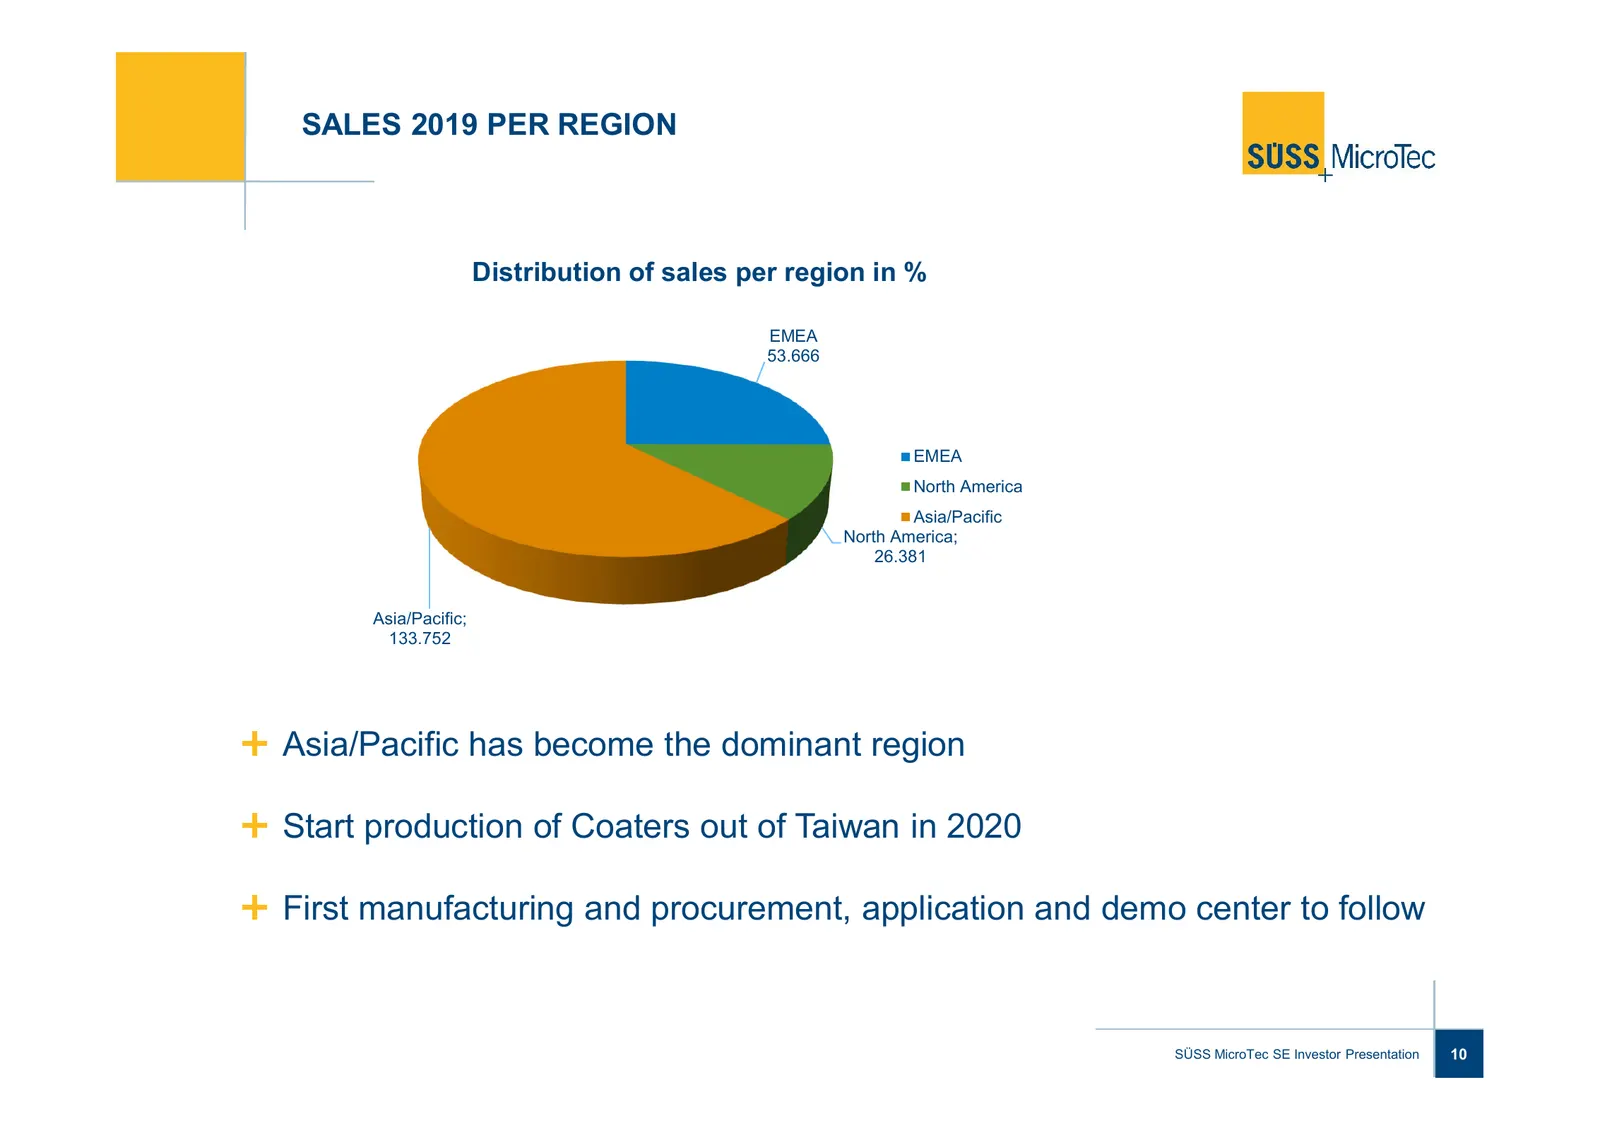
SALES 2019 PER REGION Distribution of sales per region in % EMEA 53.666 EMEA North America Asia/Pacific North America; 26.381 Asia/Pacific; 133.752 Asia/Pacific has become the dominant region Start production of Coaters out of Taiwan in 2020 First manufacturing and procurement, application and demo
Slide 11: Market Outlook
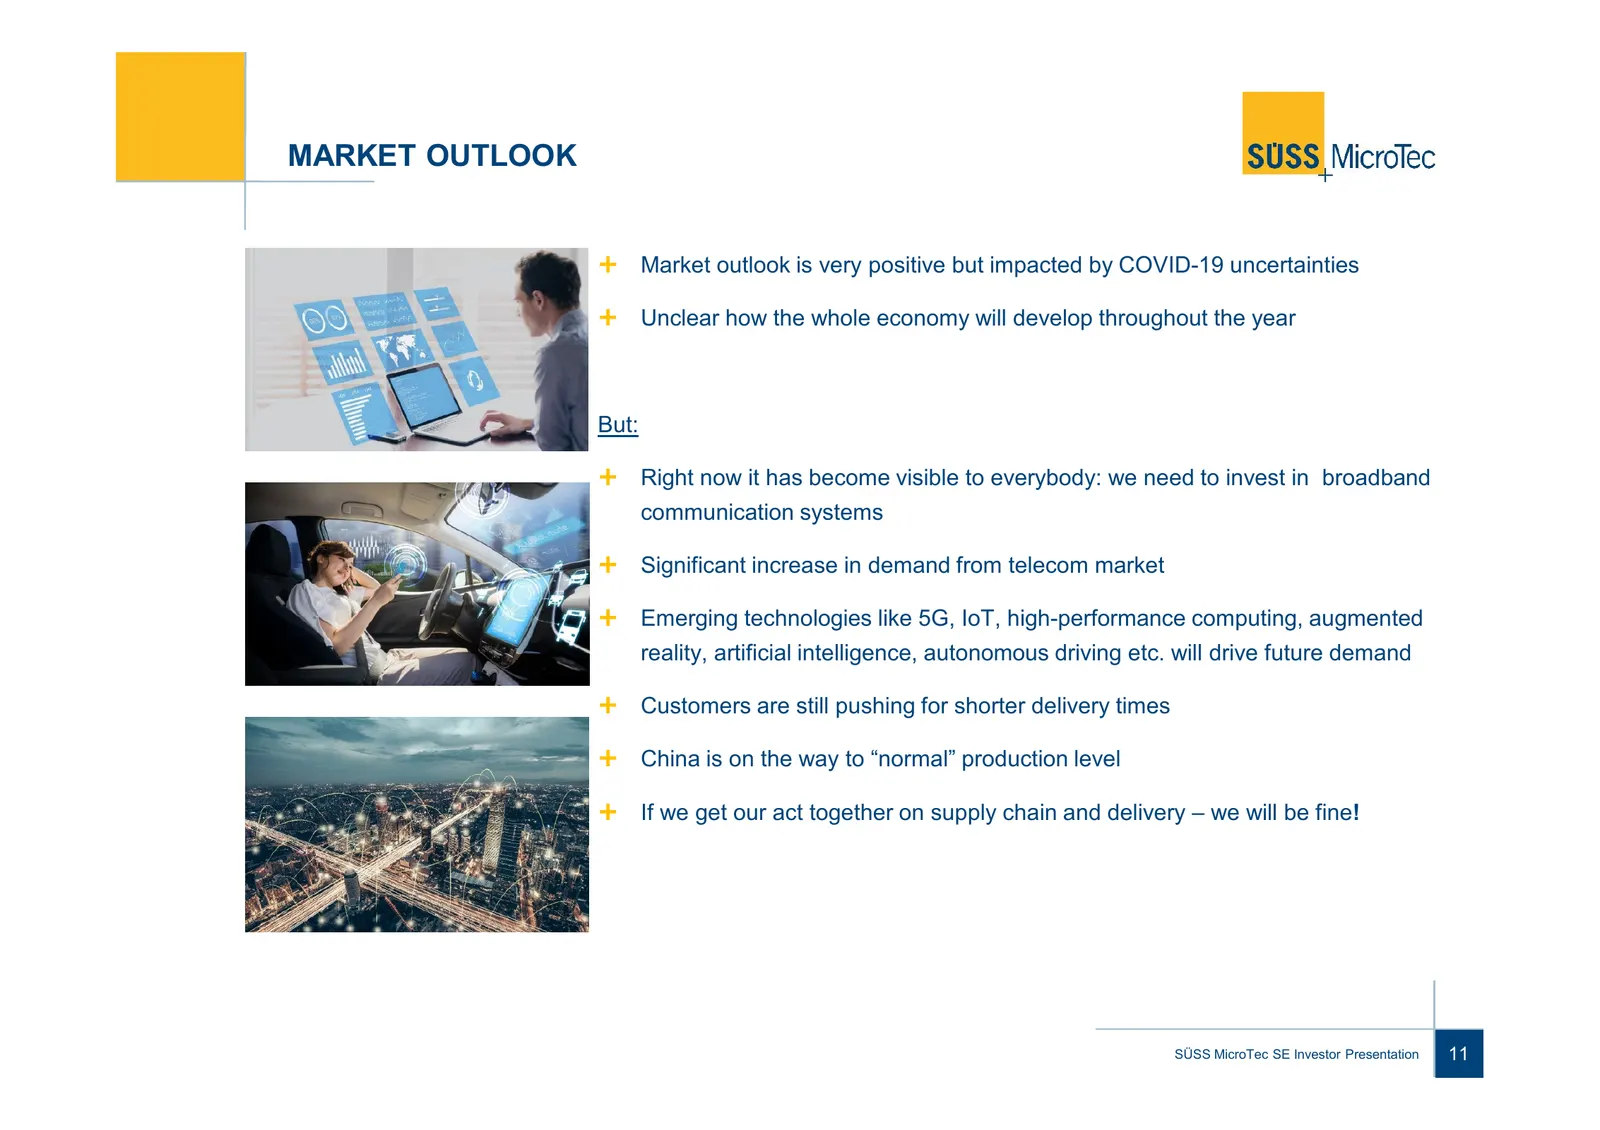
MARKET OUTLOOK Market outlook is very positive but impacted by COVID-19 uncertainties Unclear how the whole economy will develop throughout the year But: Right now it has become visible to everybody: we need to invest in broadband communication systems Significant increase in demand from telecom mar
Slide 12: Guidance 2020
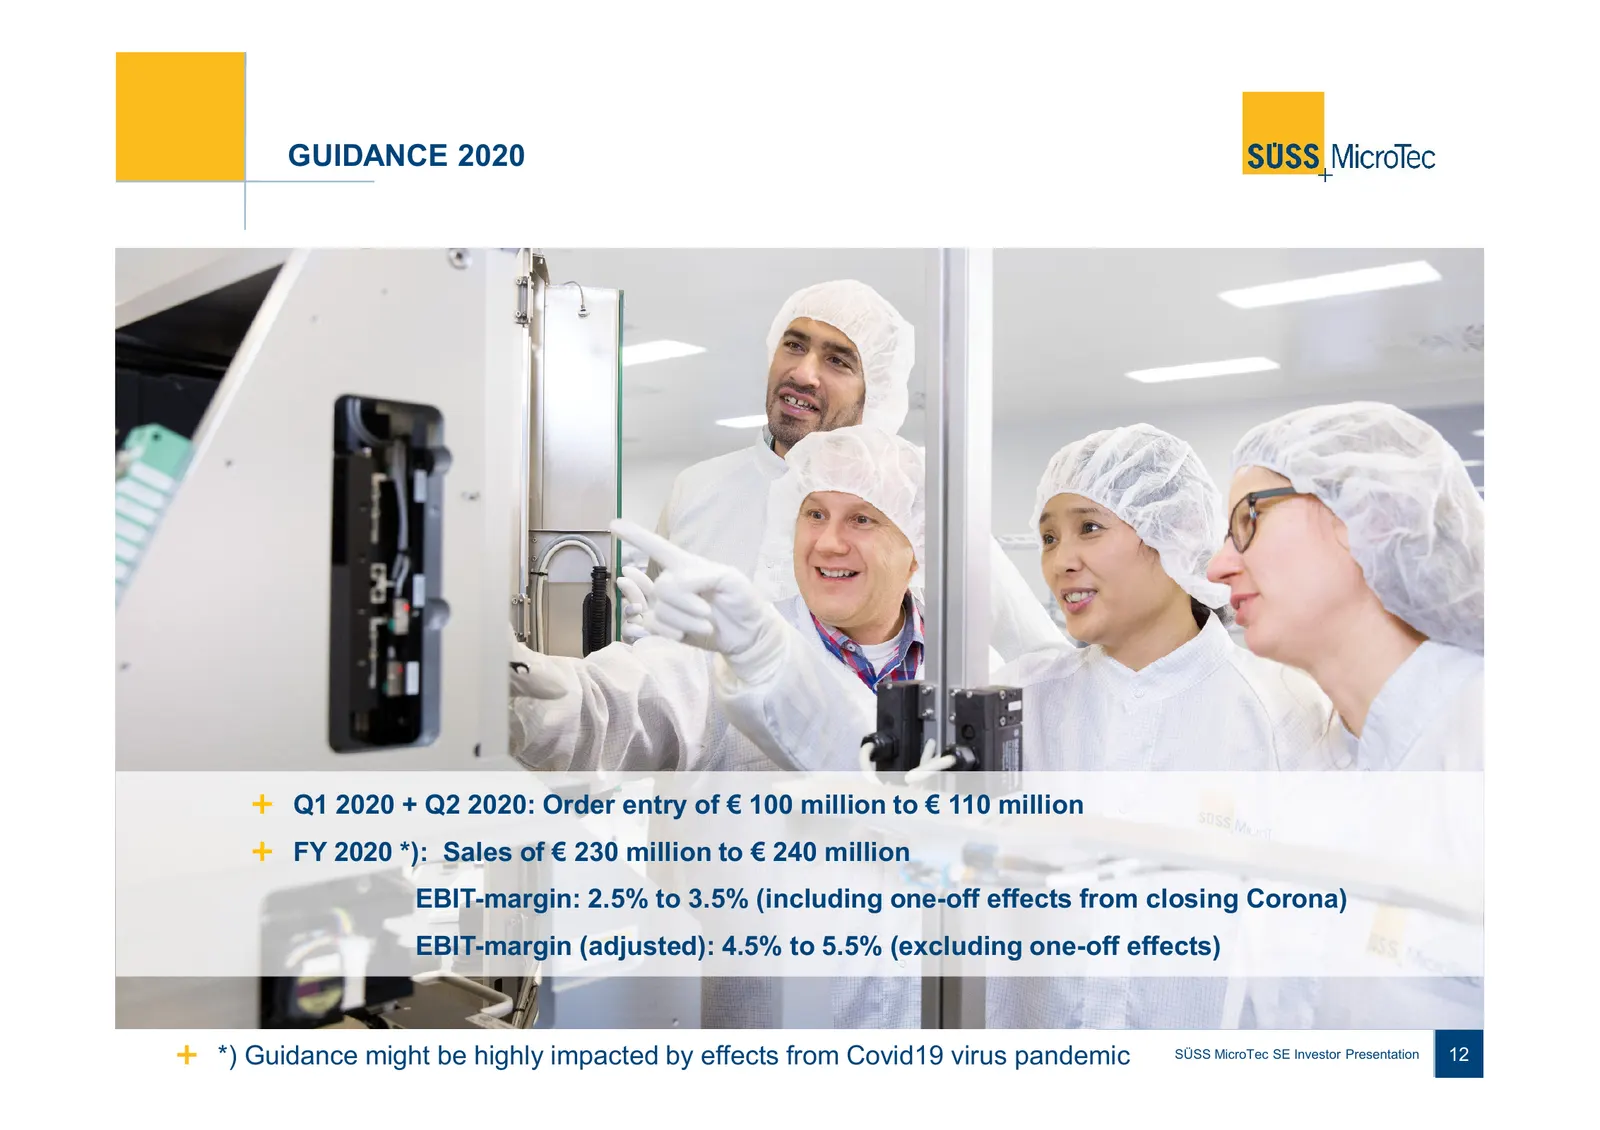
GUIDANCE 2020 Q1 2020 + Q2 2020: Order entry of € 100 million to € 110 million FY 2020 *): Sales of € 230 million to € 240 million EBIT-margin: 2.5% to 3.5% (including one-off effects from closing Corona) EBIT-margin (adjusted): 4.5% to 5.5% (excluding one-off effects) *) Guidance might be highly im
Source: Internet Archive copy of suss.com
More decks from SUSS MicroTec SE
 9M 2026 Earnings Presentation23 slides · Nov 5, 2026
 Investor Presentation (October 2026)41 slides · October 2026
 H1 2026 Earnings Presentation24 slides · Aug 6, 2026
 Q1 2026 Earnings Presentation19 slides · May 7, 2026
 FY2025 Earnings Presentation26 slides · Mar 30, 2026
 Investor Presentation (March 2026)42 slides · Mar 1, 2026