GAIN Capital — FY2018 Earnings Presentation
39 slides from GAIN Capital's earnings presentation, Feb 28, 2019
Slide 1: Q4 and Full Year 2018 Results
Q4and Full Year2018 Results February 2019 1
Slide 2: Safe Harbor Statement
SAFE HARBOR STATEMENT Forward Looking Statements In addition to historical information, this earnings presentation contains "forward-looking" statements that reflect management's expectations for the future. A variety of important factors could cause results to differ materially from such statements
Slide 3: 2018 - A Year in Review
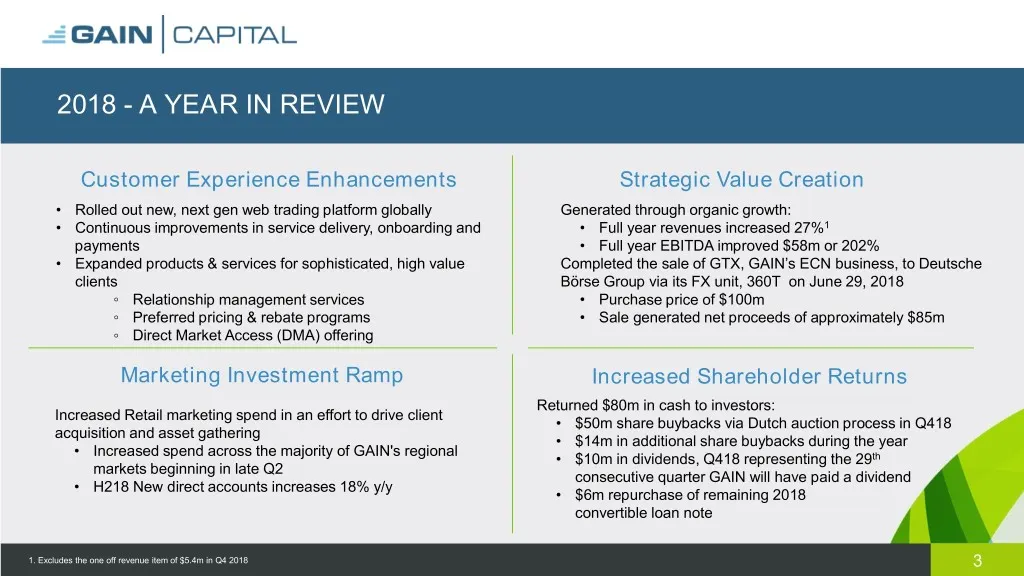
2018 - A YEAR IN REVIEW Customer Experience Enhancements Strategic Value Creation • Rolled out new, next gen web trading platform globally Generated through organic growth: • Continuous improvements in service delivery, onboarding and • Full year revenues increased 27%1 payments • Full year EBITDA i
Slide 4: Organic Efforts Are Showing Results
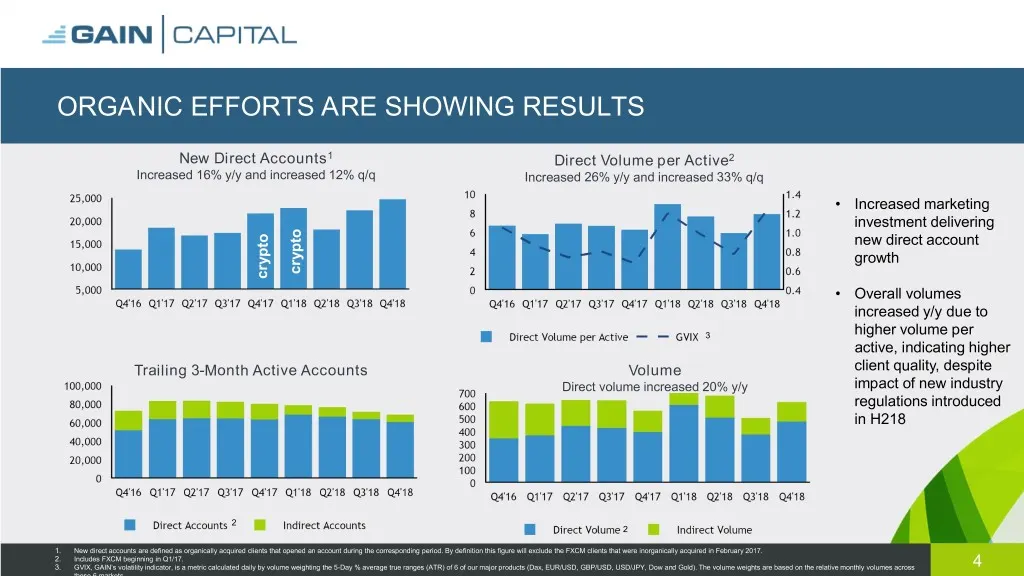
ORGANIC EFFORTS ARE SHOWING RESULTS New Direct Accounts1 Direct Volume per Active2 Increased 16% y/y and increased 12% q/q Increased 26% y/y and increased 33% q/q • Increased marketing investment delivering new direct account growth • Overall volumes increased y/y due to 3 higher volume per active,
Slide 5: ESMA Impact Mitigated by Successful Focus on High Value Clients
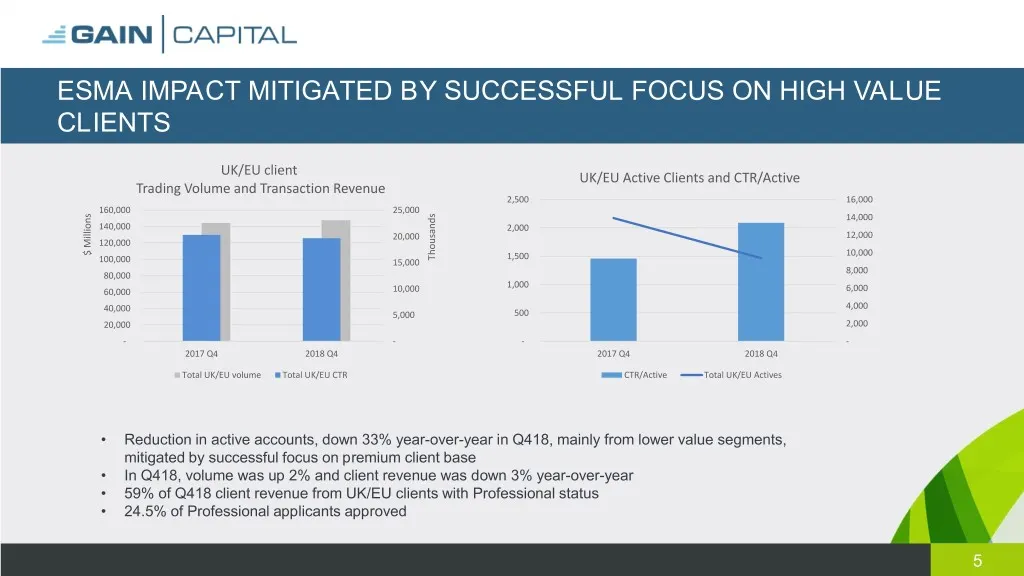
ESMA IMPACT MITIGATED BY SUCCESSFUL FOCUS ON HIGH VALUE CLIENTS UK/EU client UK/EU Active Clients and CTR/Active Trading Volume and Transaction Revenue 2,500 16,000 160,000 25,000 14,000 140,000 2,000 20,000 12,000 120,000 $ Millions $ 10,000 Thousands 1,500 100,000 15,000 8,000 80,000 1,000 60,000
Slide 6: Financial Review
GAIN | CAPITAL Financial Review
Slide 7: Key Financial Results & Operating Metrics
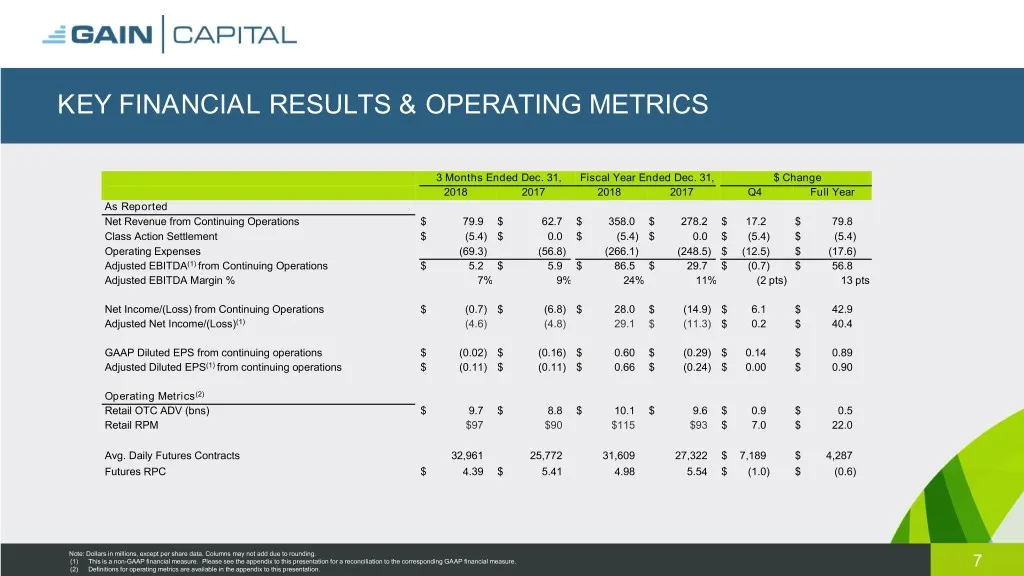
KEY FINANCIAL RESULTS & OPERATING METRICS 3 Months Ended Dec. 31, Fiscal Year Ended Dec. 31, $ Change 2018 2017 2018 2017 Q4 Full Year As Reported Net Revenue from Continuing Operations $ 79.9 $ 62.7 $ 358.0 $ 278.2 $ 17.2 $ 79.8 Class Action Settlement $ (5.4) $ 0.0 $ (5.4) $ 0.0 $ (5.4) $ (5.4) Op
Slide 8: Operating Segment Results: Retail
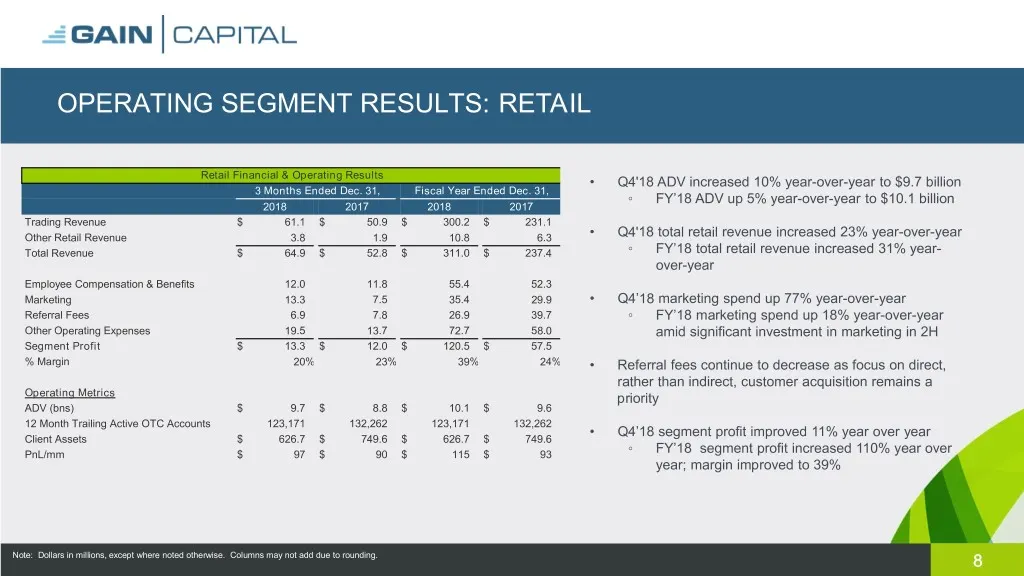
OPERATING SEGMENT RESULTS: RETAIL Retail Financial & Operating Results • Q4'18 ADV increased 10% year-over-year to $9.7 billion 3 Months Ended Dec. 31, Fiscal Year Ended Dec. 31, ◦ FY’18 ADV up 5% year-over-year to $10.1 billion 2018 2017 2018 2017 Trading Revenue $ 61.1 $ 50.9 $ 300.2 $ 231.1 Other
Slide 9: Operating Segment Results: Futures
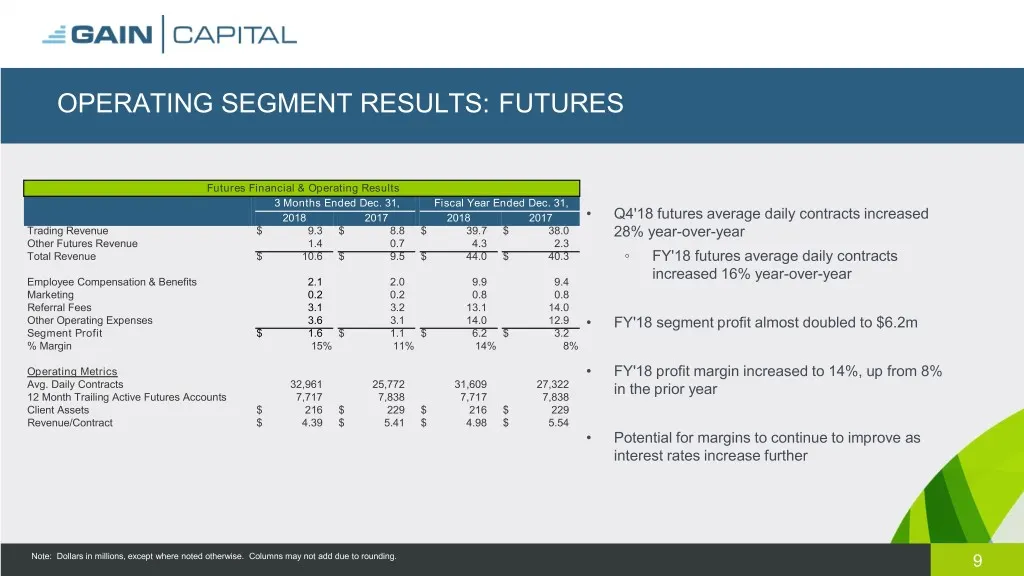
OPERATING SEGMENT RESULTS: FUTURES Futures Financial & Operating Results 3 Months Ended Dec. 31, Fiscal Year Ended Dec. 31, 2018 2017 2018 2017 • Q4'18 futures average daily contracts increased Trading Revenue $ 9.3 $ 8.8 $ 39.7 $ 38.0 28% year-over-year Other Futures Revenue 1.4 0.7 4.3 2.3 Total R
Slide 10: Overhead and Capex Overview
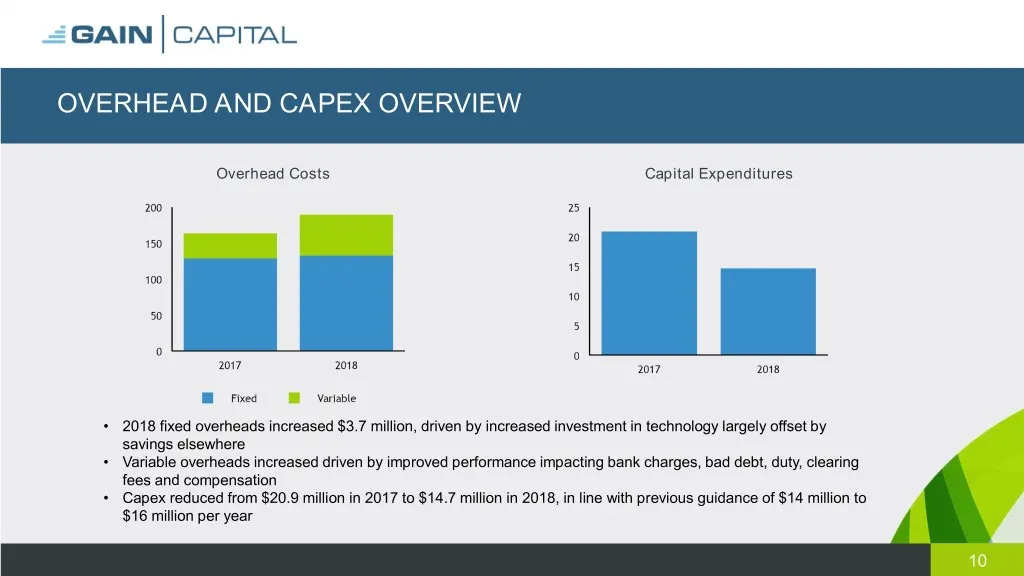
OVERHEAD AND CAPEX OVERVIEW Overhead Costs Capital Expenditures • 2018 fixed overheads increased $3.7 million, driven by increased investment in technology largely offset by savings elsewhere • Variable overheads increased driven by improved performance impacting bank charges, bad debt, duty, cleari
Slide 11: Strong Liquidity Position
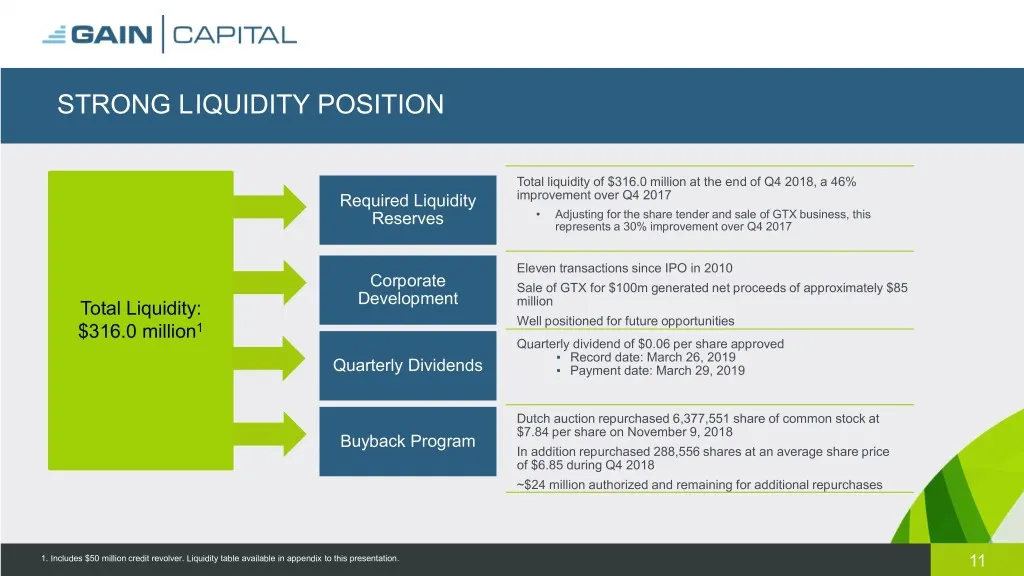
STRONG LIQUIDITY POSITION Total liquidity of $316.0 million at the end of Q4 2018, a 46% Required Liquidity improvement over Q4 2017 • Adjusting for the share tender and sale of GTX business, this Reserves represents a 30% improvement over Q4 2017 Eleven transactions since IPO in 2010 Corporate Sale
Slide 12: Long-Term Strategy
GAIN | CAPITAL Long-Term Strategy
Slide 13: Long-Term Strategic Priorities to Accelerate Organic Growth
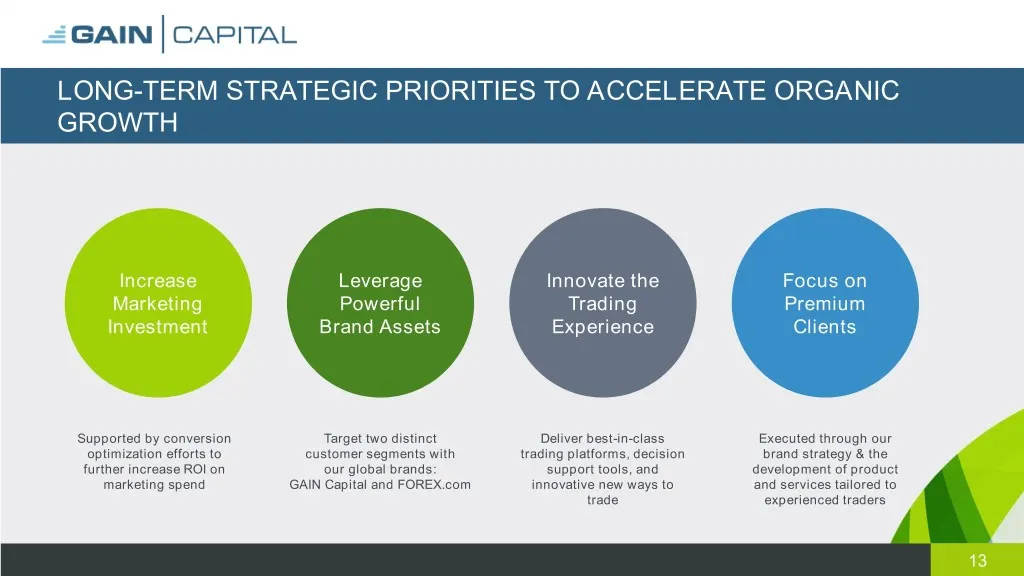
LONG-TERM STRATEGIC PRIORITIES TO ACCELERATE ORGANIC GROWTH Increase Leverage Innovate the Focus on Marketing Powerful Trading Premium Investment Brand Assets Experience Clients Supported by conversion Target two distinct Deliver best-in-class Executed through our optimization efforts to customer se
Slide 14: Accelerate Growth: Increase Marketing Investment
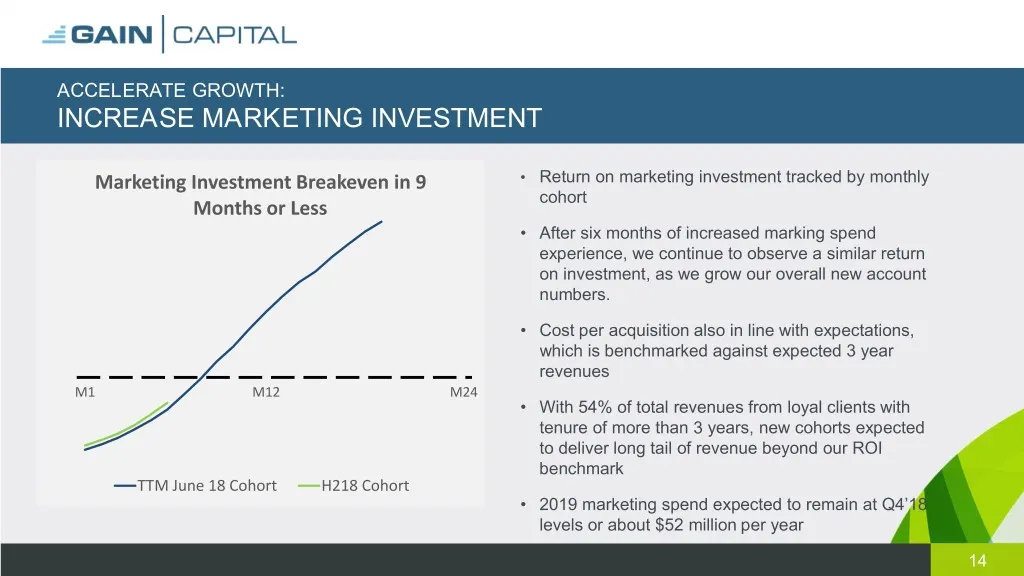
ACCELERATE GROWTH: INCREASE MARKETING INVESTMENT Marketing Investment Breakeven in 9 • Return on marketing investment tracked by monthly cohort Months or Less • After six months of increased marking spend experience, we continue to observe a similar return on investment, as we grow our overall new a
Slide 15: Accelerate Growth: Leverage Powerful Brand Assets
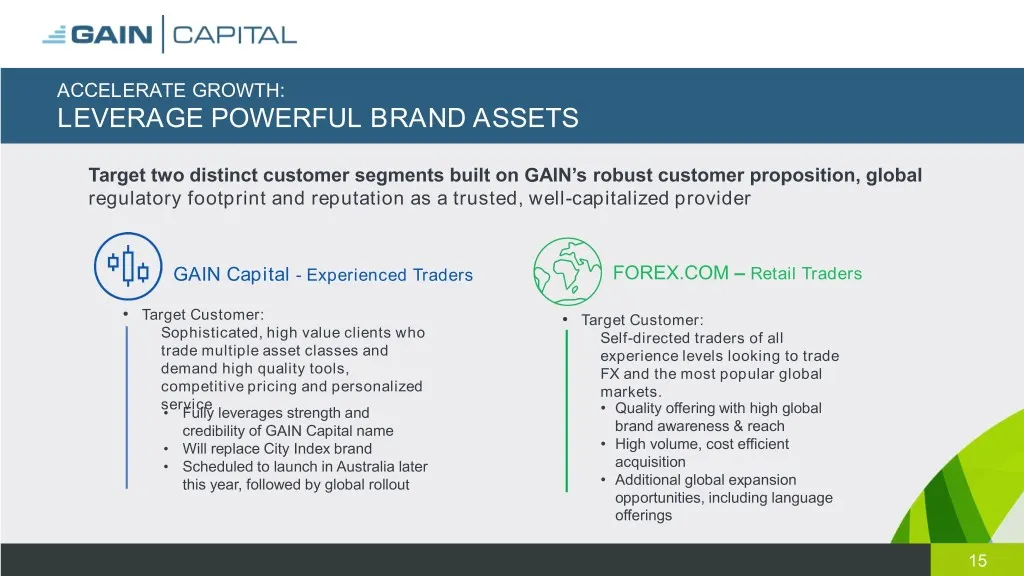
ACCELERATE GROWTH: LEVERAGE POWERFUL BRAND ASSETS Target two distinct customer segments built on GAIN’s robust customer proposition, global regulatory footprint and reputation as a trusted, well-capitalized provider GAIN Capital - Experienced Traders FOREX.COM – Retail Traders • Target Customer: • T
Slide 16: Accelerate Growth: Innovate the Trading Experience
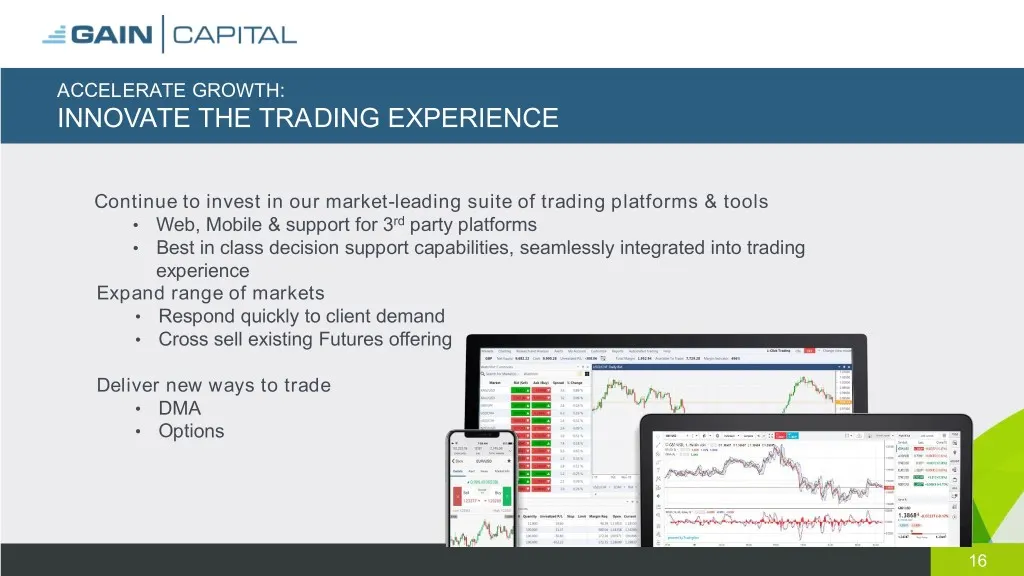
ACCELERATE GROWTH: INNOVATE THE TRADING EXPERIENCE Continue to invest in our market-leading suite of trading platforms & tools • Web, Mobile & support for 3rd party platforms • Best in class decision support capabilities, seamlessly integrated into trading experience Expand range of markets • Respon
Slide 17: Accelerate Growth: Focus on Premium Clients
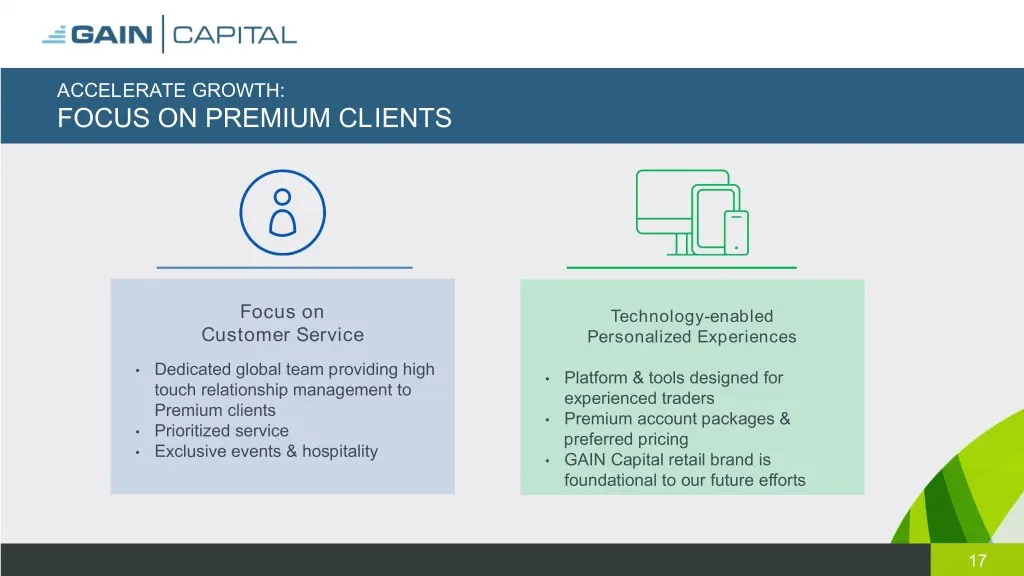
ACCELERATE GROWTH: FOCUS ON PREMIUM CLIENTS Focus on Technology-enabled Customer Service Personalized Experiences • Dedicated global team providing high • Platform & tools designed for touch relationship management to experienced traders Premium clients • Premium account packages & • Prioritized ser
Slide 18: Elements of Revenue Growth Through 2021
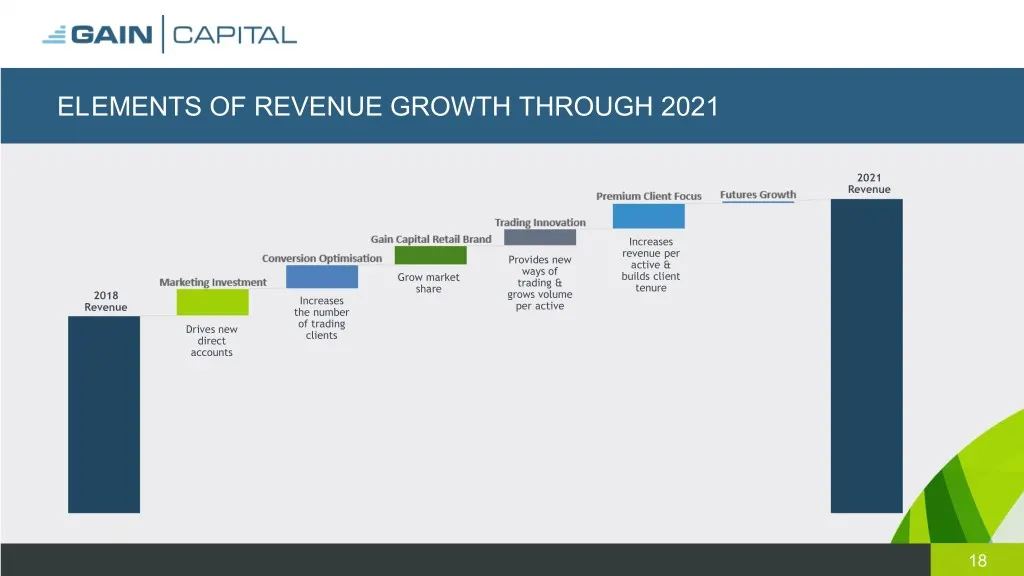
ELEMENTS OF REVENUE GROWTH THROUGH 2021 2021 Revenue Increases revenue per Provides new active & ways of Grow market builds client trading & share tenure 2018 grows volume Increases per active Revenue the number of trading Drives new clients direct accounts 18
Slide 19: 2021 Operating and Financial Targets
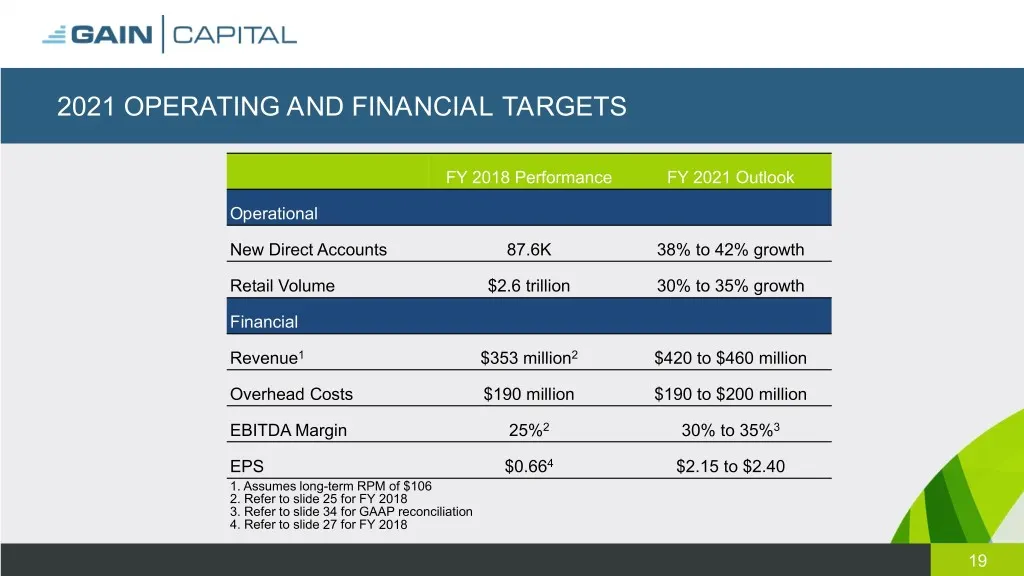
2021 OPERATING AND FINANCIAL TARGETS FY 2018 Performance FY 2021 Outlook Operational New Direct Accounts 87.6K 38% to 42% growth Retail Volume $2.6 trillion 30% to 35% growth Financial Revenue1 $353 million2 $420 to $460 million Overhead Costs $190 million $190 to $200 million EBITDA Margin 25%2 30%
Slide 20: Positioned to Deliver Long-Term Value
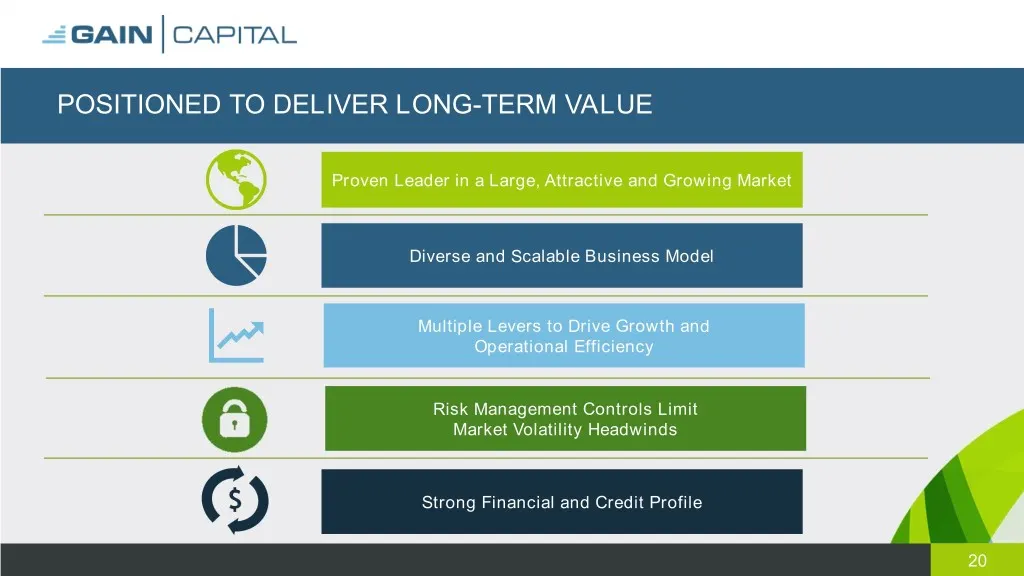
POSITIONED TO DELIVER LONG-TERM VALUE Proven Leader in a Large, Attractive and Growing Market Diverse and Scalable Business Model Multiple Levers to Drive Growth and Operational Efficiency Risk Management Controls Limit Market Volatility Headwinds Strong Financial and Credit Profile 20
Slide 21: Appendix
GAIN | CAPITAL Appendix
Slide 22: Consolidated Statement of Operations
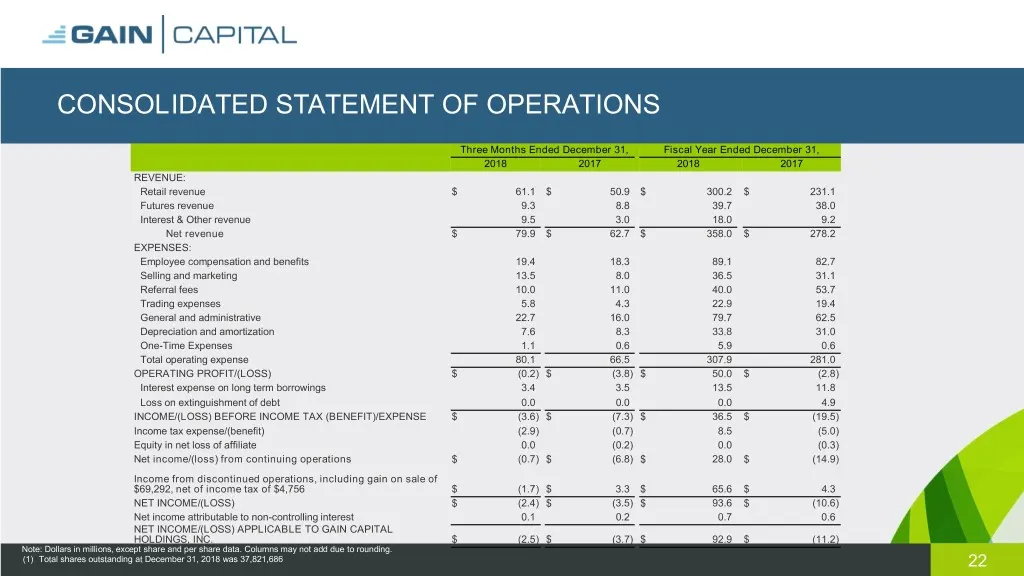
CONSOLIDATED STATEMENT OF OPERATIONS Three Months Ended December 31, Fiscal Year Ended December 31, 2018 2017 2018 2017 REVENUE: Retail revenue $ 61.1 $ 50.9 $ 300.2 $ 231.1 Futures revenue 9.3 8.8 39.7 38.0 Interest & Other revenue 9.5 3.0 18.0 9.2 Net revenue $ 79.9 $ 62.7 $ 358.0 $ 278.2 EXPENSES
Slide 23: Consolidated Balance Sheet
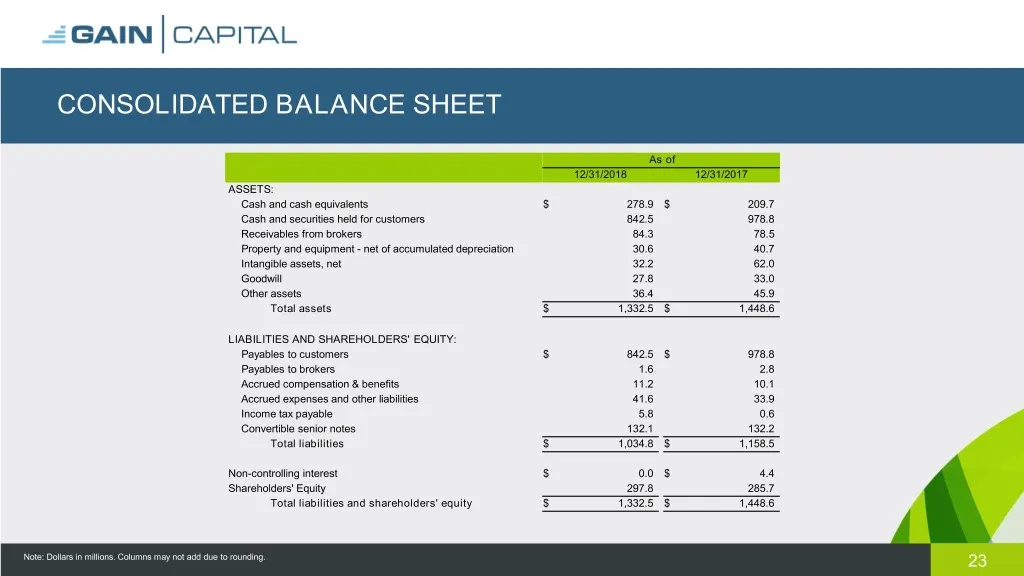
CONSOLIDATED BALANCE SHEET As of 12/31/2018 12/31/2017 ASSETS: Cash and cash equivalents $ 278.9 $ 209.7 Cash and securities held for customers 842.5 978.8 Receivables from brokers 84.3 78.5 Property and equipment - net of accumulated depreciation 30.6 40.7 Intangible assets, net 32.2 62.0 Goodwill
Slide 24: Liquidity
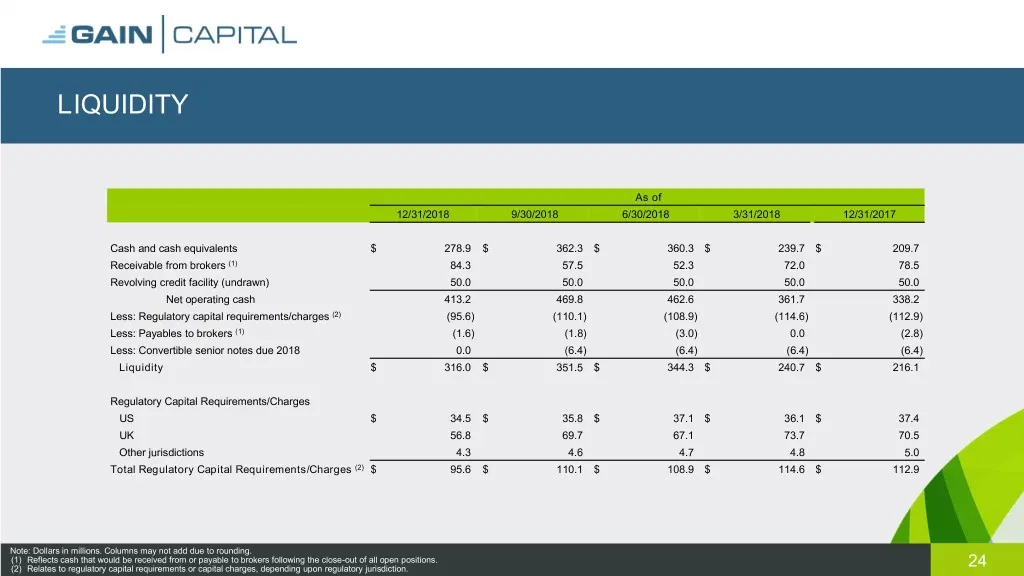
LIQUIDITY As of 12/31/2018 9/30/2018 6/30/2018 3/31/2018 12/31/2017 Cash and cash equivalents $ 278.9 $ 362.3 $ 360.3 $ 239.7 $ 209.7 Receivable from brokers (1) 84.3 57.5 52.3 72.0 78.5 Revolving credit facility (undrawn) 50.0 50.0 50.0 50.0 50.0 Net operating cash 413.2 469.8 462.6 361.7 338.2 Les
Slide 25: Group Adjusted EBITDA
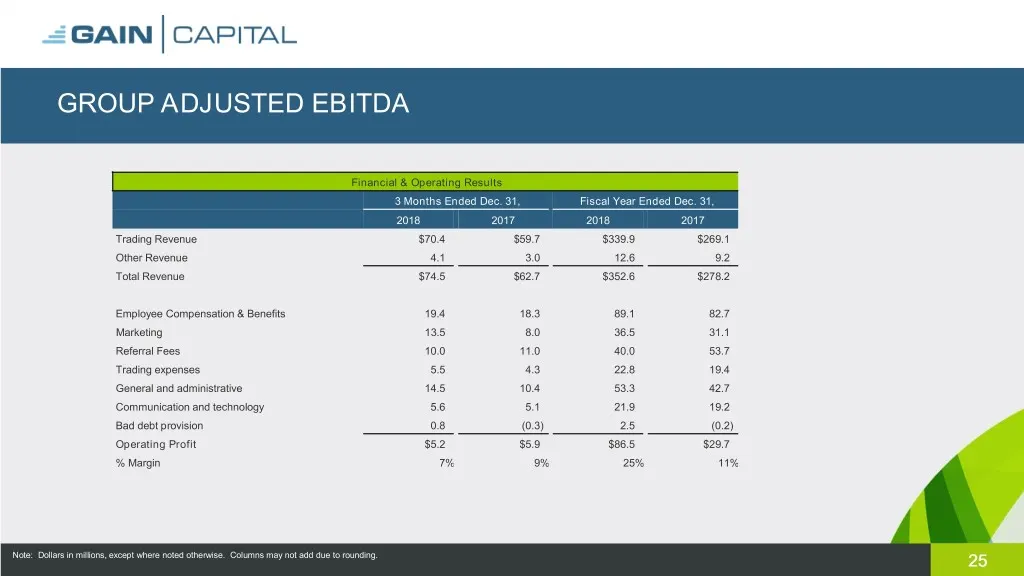
GROUP ADJUSTED EBITDA Financial & Operating Results 3 Months Ended Dec. 31, Fiscal Year Ended Dec. 31, 2018 2017 2018 2017 Trading Revenue $70.4 $59.7 $339.9 $269.1 Other Revenue 4.1 3.0 12.6 9.2 Total Revenue $74.5 $62.7 $352.6 $278.2 Employee Compensation & Benefits 19.4 18.3 89.1 82.7 Marketing 1
Slide 26: Adjusted EBITDA & Margin Reconciliation
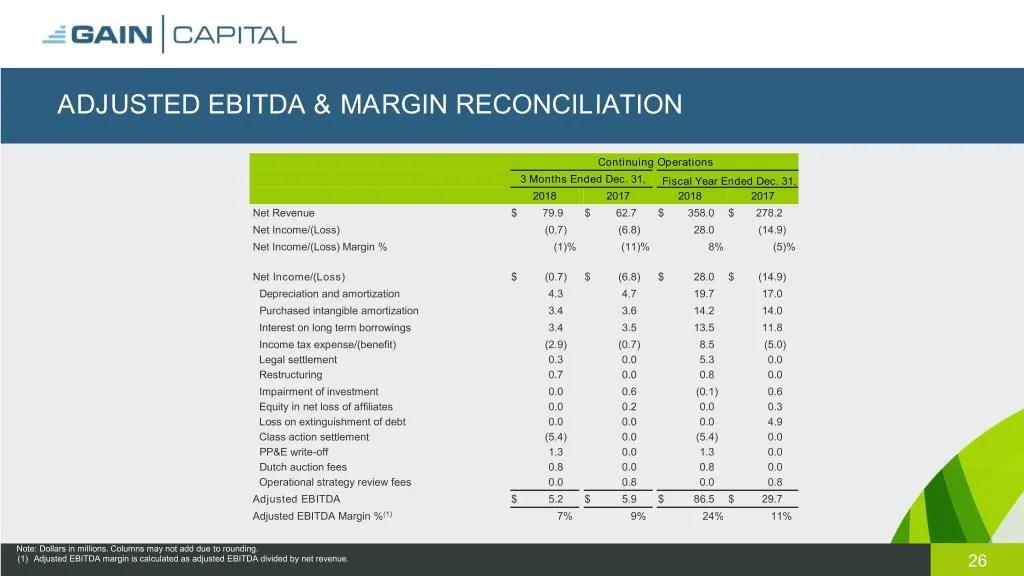
ADJUSTED EBITDA & MARGIN RECONCILIATION Continuing Operations 3 Months Ended Dec. 31, Fiscal Year Ended Dec. 31, 2018 2017 2018 2017 Net Revenue $ 79.9 $ 62.7 $ 358.0 $ 278.2 Net Income/(Loss) (0.7) (6.8) 28.0 (14.9) Net Income/(Loss) Margin % (1)% (11)% 8% (5)% Net Income/(Loss) $ (0.7) $ (6.8) $ 2
Slide 27: Adjusted Net Income and EPS Reconciliation
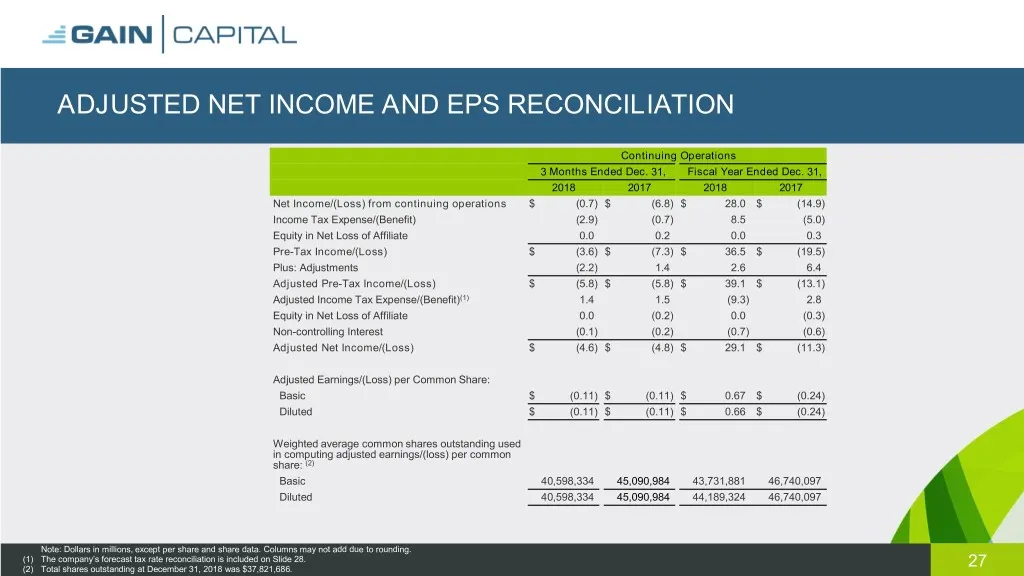
ADJUSTED NET INCOME AND EPS RECONCILIATION Continuing Operations 3 Months Ended Dec. 31, Fiscal Year Ended Dec. 31, 2018 2017 2018 2017 Net Income/(Loss) from continuing operations $ (0.7) $ (6.8) $ 28.0 $ (14.9) Income Tax Expense/(Benefit) (2.9) (0.7) 8.5 (5.0) Equity in Net Loss of Affiliate 0.0
Slide 28: Adjusted Income Tax (Expense)/Benefit Reconciliation
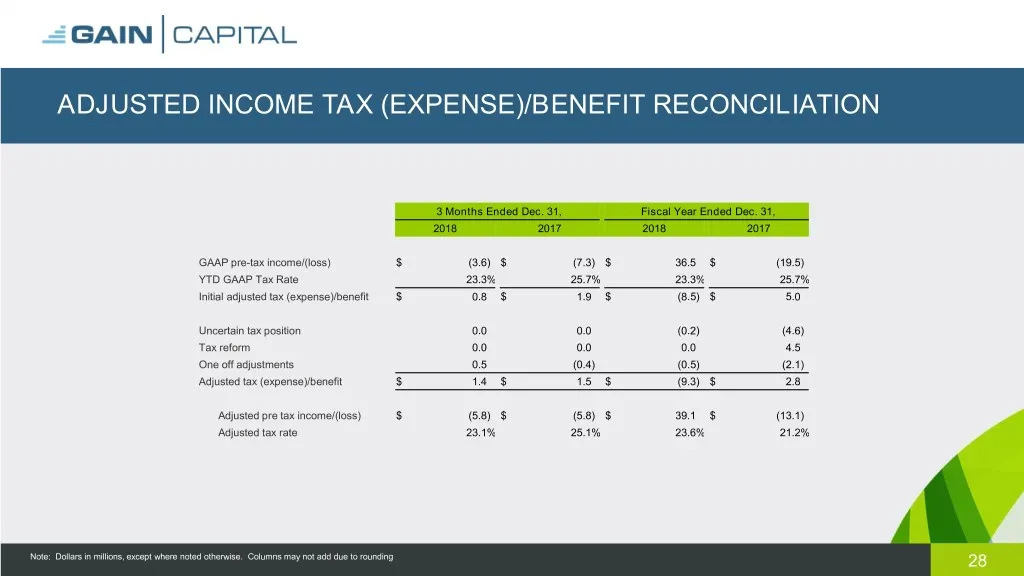
ADJUSTED INCOME TAX (EXPENSE)/BENEFIT RECONCILIATION 3 Months Ended Dec. 31, Fiscal Year Ended Dec. 31, 2018 2017 2018 2017 GAAP pre-tax income/(loss) $ (3.6) $ (7.3) $ 36.5 $ (19.5) YTD GAAP Tax Rate 23.3% 25.7% 23.3% 25.7% Initial adjusted tax (expense)/benefit $ 0.8 $ 1.9 $ (8.5) $ 5.0 Uncertain
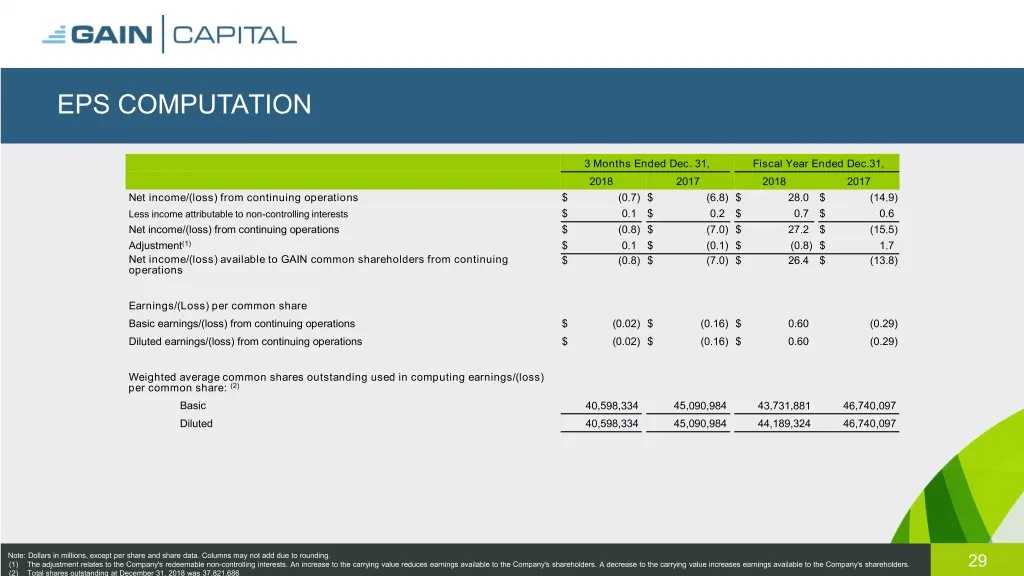
Slide 29: EPS Computation
EPS COMPUTATION 3 Months Ended Dec. 31, Fiscal Year Ended Dec.31, 2018 2017 2018 2017 Net income/(loss) from continuing operations $ (0.7) $ (6.8) $ 28.0 $ (14.9) Less income attributable to non-controlling interests $ 0.1 $ 0.2 $ 0.7 $ 0.6 Net income/(loss) from continuing operations $ (0.8) $ (7.0
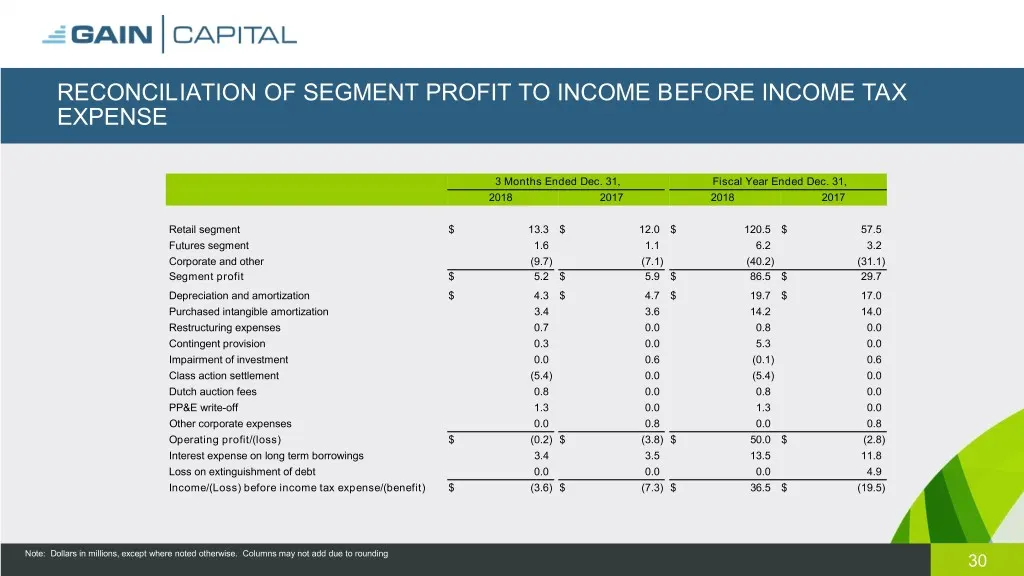
Slide 30: Reconciliation of Segment Profit to Income Before Income Tax Expense
RECONCILIATION OF SEGMENT PROFIT TO INCOME BEFORE INCOME TAX EXPENSE 3 Months Ended Dec. 31, Fiscal Year Ended Dec. 31, 2018 2017 2018 2017 Retail segment $ 13.3 $ 12.0 $ 120.5 $ 57.5 Futures segment 1.6 1.1 6.2 3.2 Corporate and other (9.7) (7.1) (40.2) (31.1) Segment profit $ 5.2 $ 5.9 $ 86.5 $ 29
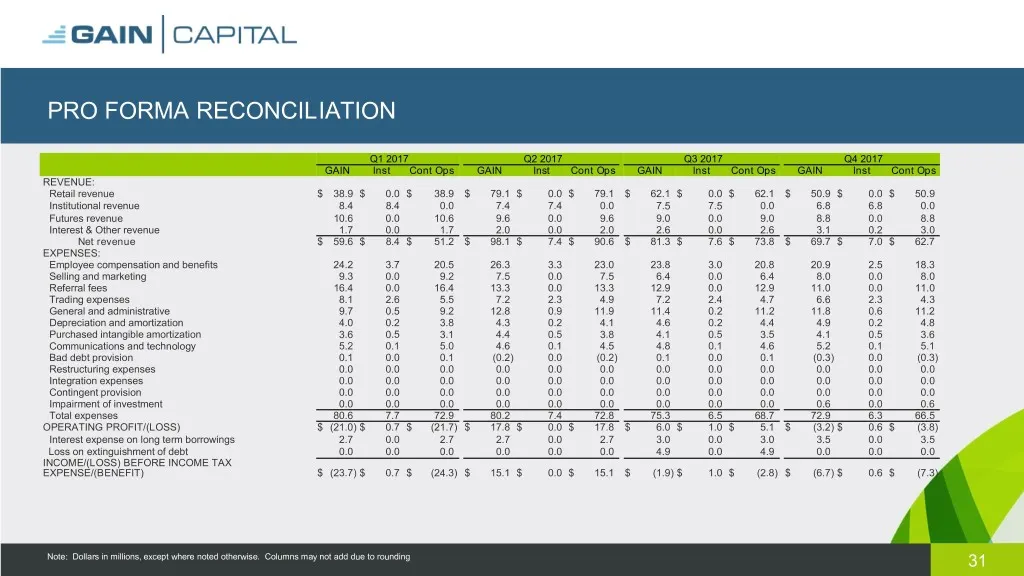
Slide 31: Pro Forma Reconciliation 2017
PRO FORMA RECONCILIATION Q1 2017 Q2 2017 Q3 2017 Q4 2017 GAIN Inst Cont Ops GAIN Inst Cont Ops GAIN Inst Cont Ops GAIN Inst Cont Ops REVENUE: Retail revenue $ 38.9 $ 0.0 $ 38.9 $ 79.1 $ 0.0 $ 79.1 $ 62.1 $ 0.0 $ 62.1 $ 50.9 $ 0.0 $ 50.9 Institutional revenue 8.4 8.4 0.0 7.4 7.4 0.0 7.5 7.5 0.0 6.8 6
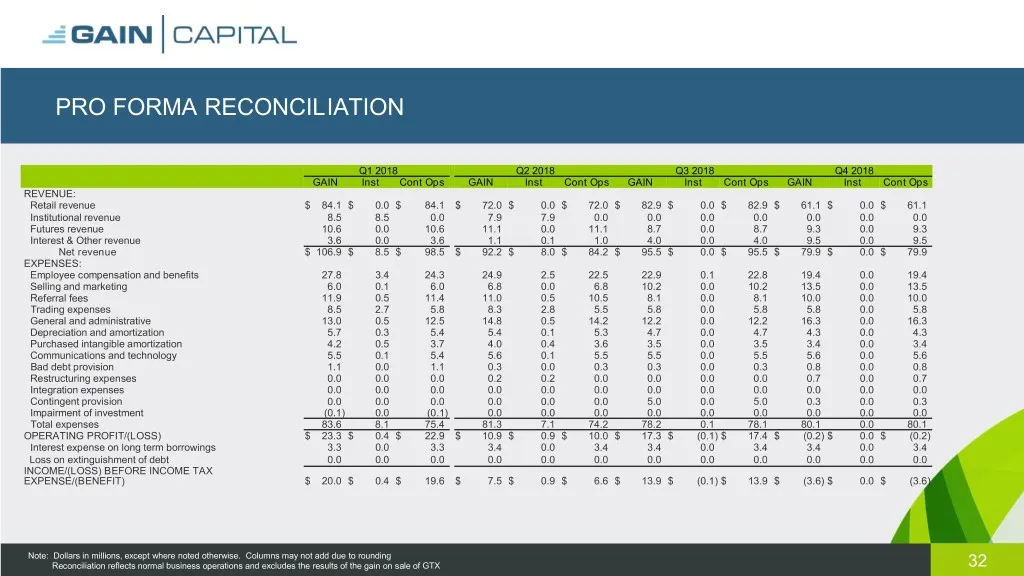
Slide 32: Pro Forma Reconciliation 2018
PRO FORMA RECONCILIATION Q1 2018 Q2 2018 Q3 2018 Q4 2018 GAIN Inst Cont Ops GAIN Inst Cont Ops GAIN Inst Cont Ops GAIN Inst Cont Ops REVENUE: Retail revenue $ 84.1 $ 0.0 $ 84.1 $ 72.0 $ 0.0 $ 72.0 $ 82.9 $ 0.0 $ 82.9 $ 61.1 $ 0.0 $ 61.1 Institutional revenue 8.5 8.5 0.0 7.9 7.9 0.0 0.0 0.0 0.0 0.0 0
Slide 33: Discontinued Operations
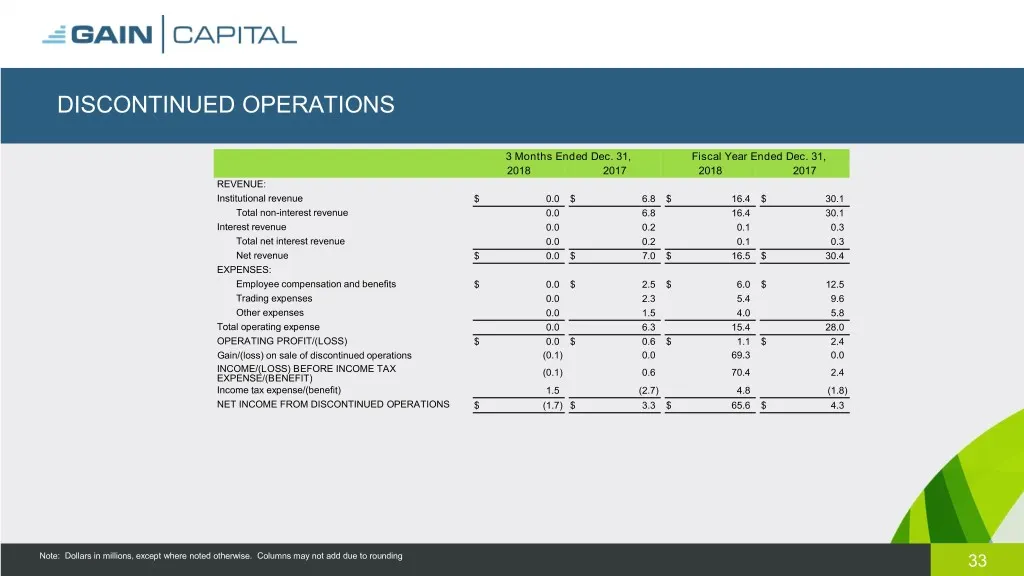
DISCONTINUED OPERATIONS 3 Months Ended Dec. 31, Fiscal Year Ended Dec. 31, 2018 2017 2018 2017 REVENUE: Institutional revenue $ 0.0 $ 6.8 $ 16.4 $ 30.1 Total non-interest revenue 0.0 6.8 16.4 30.1 Interest revenue 0.0 0.2 0.1 0.3 Total net interest revenue 0.0 0.2 0.1 0.3 Net revenue $ 0.0 $ 7.0 $ 1
Slide 34: 2021 Reconciliation of GAAP Net Income Margin to Adjusted EBITDA Margin
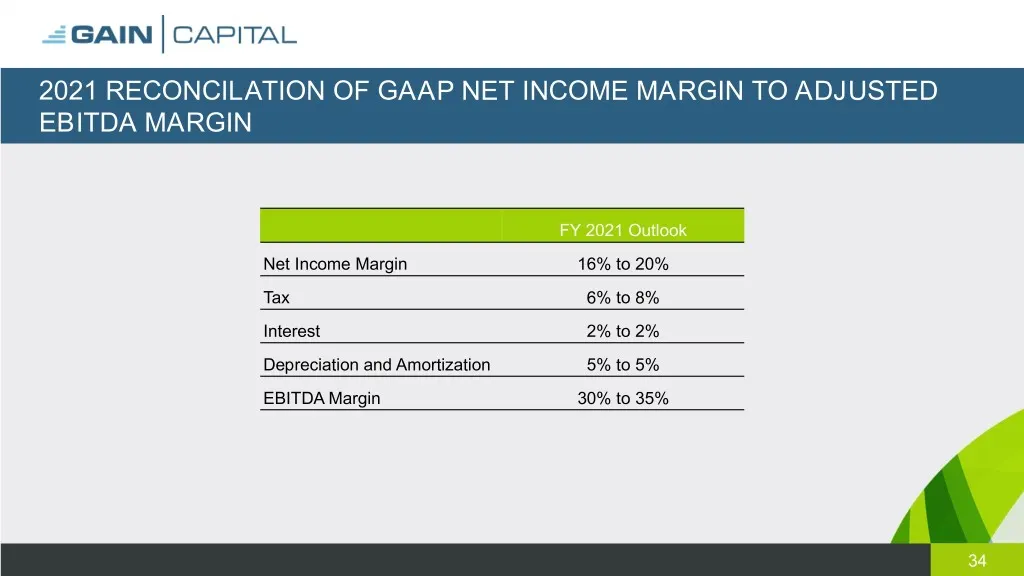
2021 RECONCILATION OF GAAP NET INCOME MARGIN TO ADJUSTED EBITDA MARGIN FY 2021 Outlook Net Income Margin 16% to 20% Tax 6% to 8% Interest 2% to 2% Depreciation and Amortization 5% to 5% EBITDA Margin 30% to 35% 34
Slide 35: Retail Revenue Per Million
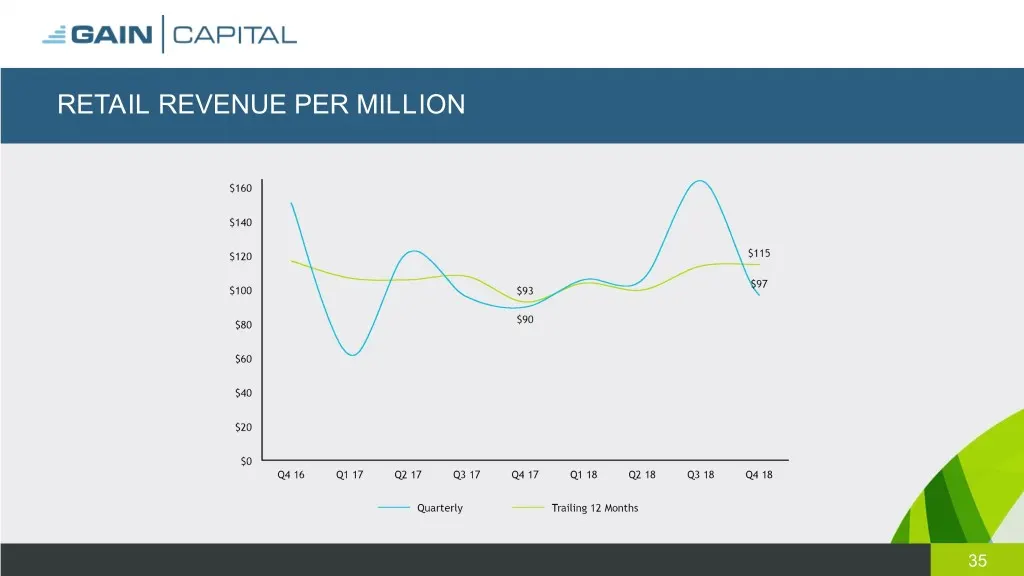
RETAIL REVENUE PER MILLION 35
Slide 36: Operating Segment Results: Corporate & Other
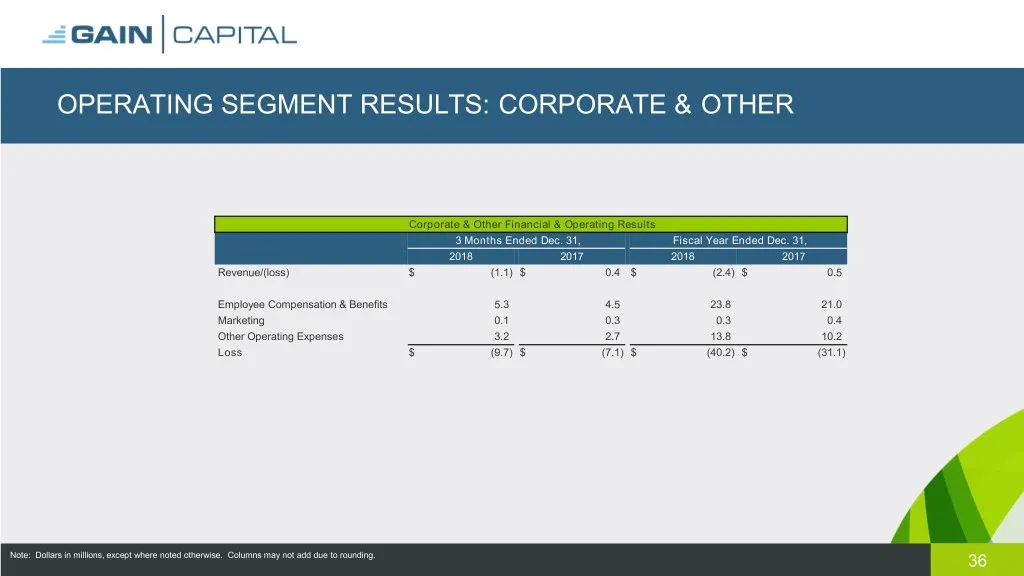
OPERATING SEGMENT RESULTS: CORPORATE & OTHER Corporate & Other Financial & Operating Results 3 Months Ended Dec. 31, Fiscal Year Ended Dec. 31, 2018 2017 2018 2017 Revenue/(loss) $ (1.1) $ 0.4 $ (2.4) $ 0.5 Employee Compensation & Benefits 5.3 4.5 23.8 21.0 Marketing 0.1 0.3 0.3 0.4 Other Operating
Slide 37: Quarterly Operating Metrics
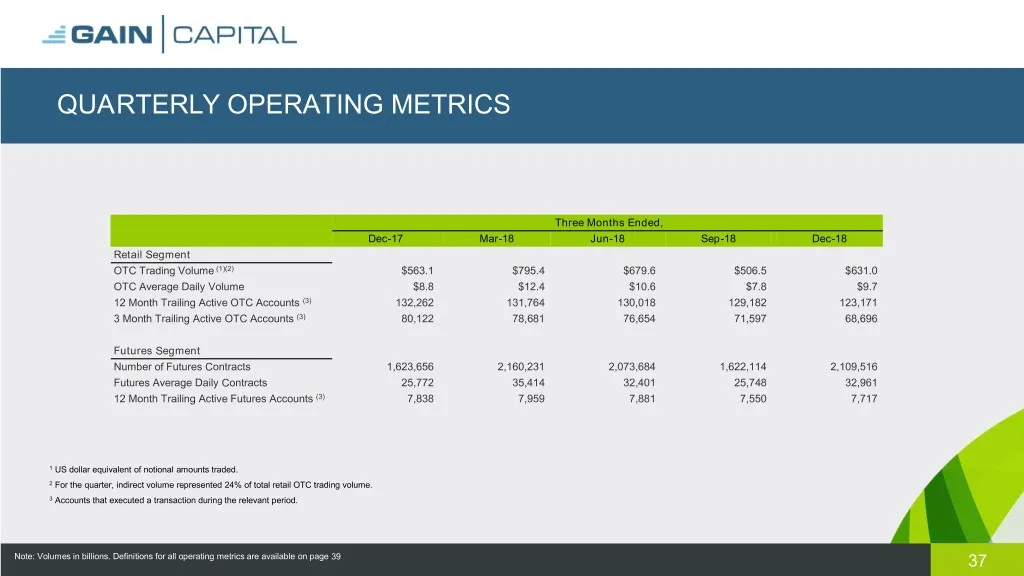
QUARTERLY OPERATING METRICS Three Months Ended, Dec-17 Mar-18 Jun-18 Sep-18 Dec-18 Retail Segment OTC Trading Volume (1)(2) $563.1 $795.4 $679.6 $506.5 $631.0 OTC Average Daily Volume $8.8 $12.4 $10.6 $7.8 $9.7 12 Month Trailing Active OTC Accounts (3) 132,262 131,764 130,018 129,182 123,171 3 Month
Slide 38: January 2019 Operating Metrics
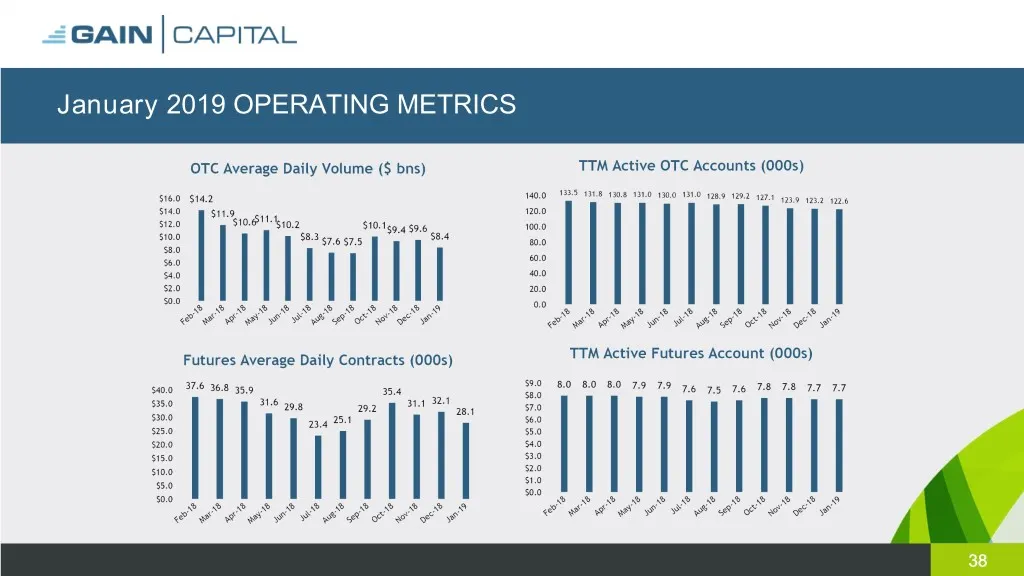
January 2019 OPERATING METRICS 38
Slide 39: Definition of Metrics
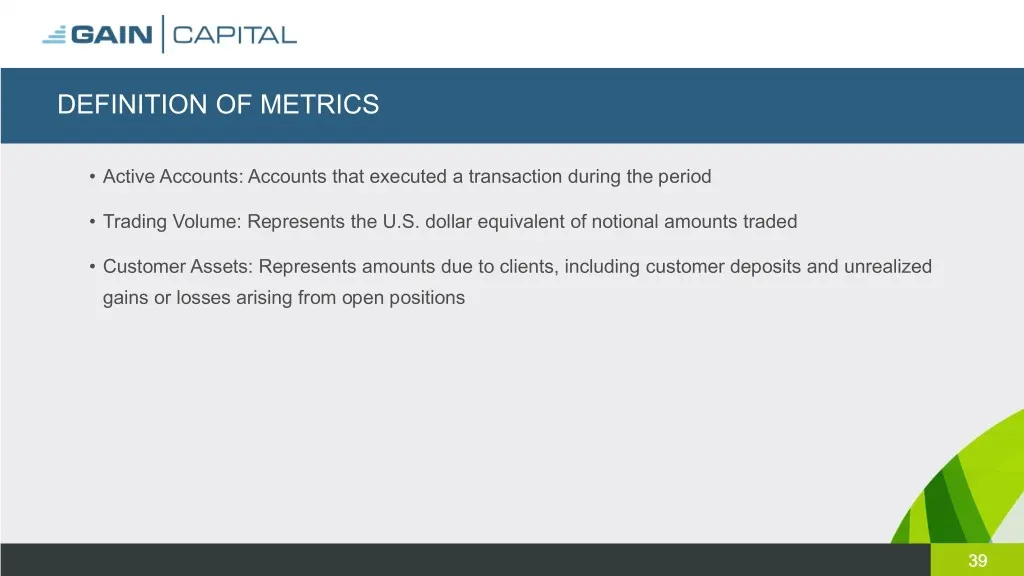
DEFINITION OF METRICS • Active Accounts: Accounts that executed a transaction during the period • Trading Volume: Represents the U.S. dollar equivalent of notional amounts traded • Customer Assets: Represents amounts due to clients, including customer deposits and unrealized gains or losses arising
Source: SEC EDGAR · 8-K filed Feb 28, 2019
More decks from GAIN Capital Holdings Inc
 Q2 2020 Earnings Presentation24 slides · Jul 23, 2020
 Merger or Acquisition (May 2020)10 slides · May 15, 2020
 Q1 2020 Earnings Presentation25 slides · Apr 23, 2020
 FY2019 Earnings Presentation35 slides · Feb 27, 2020
 Q3 2019 Earnings Presentation32 slides · Oct 25, 2019
 Q2 2019 Earnings Presentation33 slides · Jul 25, 2019