Swisher Hygiene — Investor Presentation (June 2013)
27 slides from Swisher Hygiene's investor presentation, Jun 27, 2013
Slide 1: Investor Presentation June 2013
SWISHER Investor Presentation June 2013

Slide 2: Forward Looking Information
FORWARD LOOKING INFORMATION This presentation includes financial forecasts, projections and other forward- looking statements regarding Swisher Hygiene Inc., its business and prospects. This forward-looking information is based on management assumptions and expectations which, while considered reaso
Slide 3: How We Got Here
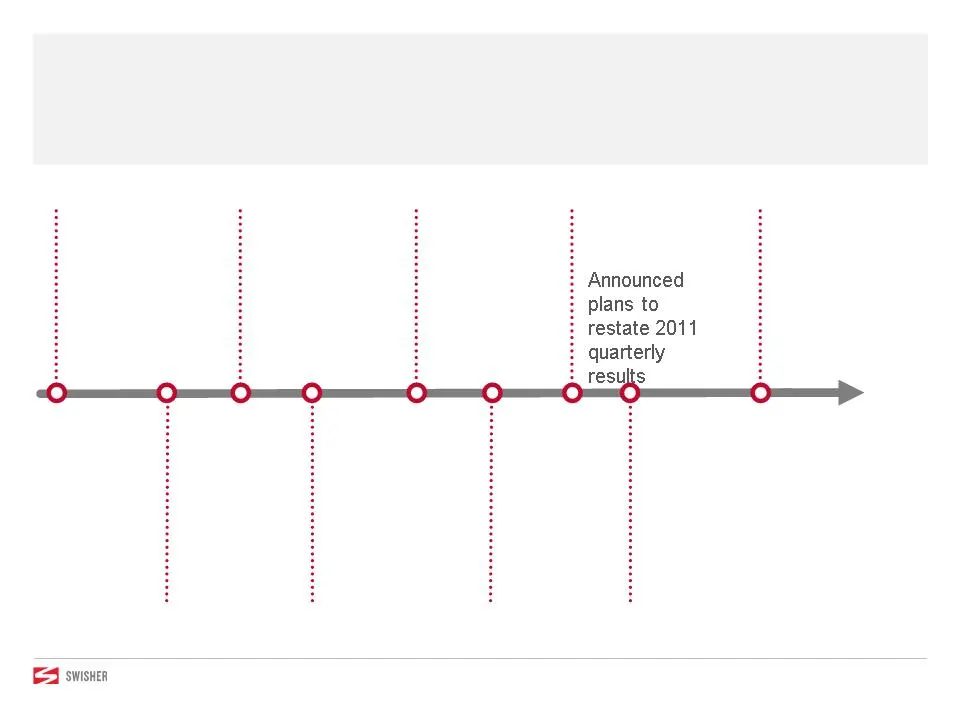
HOW WE GOT HERE Acquired by Steve Berrard and Wayne Huizenga Began trading on NASDAQ; Acquired 63 businesses 2012 (Q4) Sold waste operations Merged with CoolBrands and began trading on TSX Completed all SEC filings and regained NASDAQ and TSX compliance Expanded chemical service offering after succe

Slide 4: Restatement and Compliance
RESTATEMENT AND COMPLIANCE Restatement had Significant Effect on 2012 Results » Major investment of management time » Significant accounting, legal and consulting costs, which continued until we became a current filer in May 2013 and regained NASDAQ and TSX compliance in June » Lost revenue and acco

Slide 5: But We Did Not Sit Still
BUT WE DID NOT SIT STILL Laid the Foundation for 2013 and Future Initiatives » Key additions to management team » Implementation of operation and financial initiatives » Handheld route technology » Consolidation of multiple databases » Integration of tuck-in acquisitions » Shift to internal manufact

Slide 6: Business Model
BUSINESS MODEL

Slide 7: Swisher At-A-Glance
SWISHER AT-A-GLANCE Key Differentiators to Build Around » Leading provider of essential hygiene and sanitizing solutions » National chemical service footprint » 50,000 customers and 800 distributors » Strategic manufacturing plant locations » $230 million of 2012 revenue » Leverageable route network
Slide 8: Core Solutions
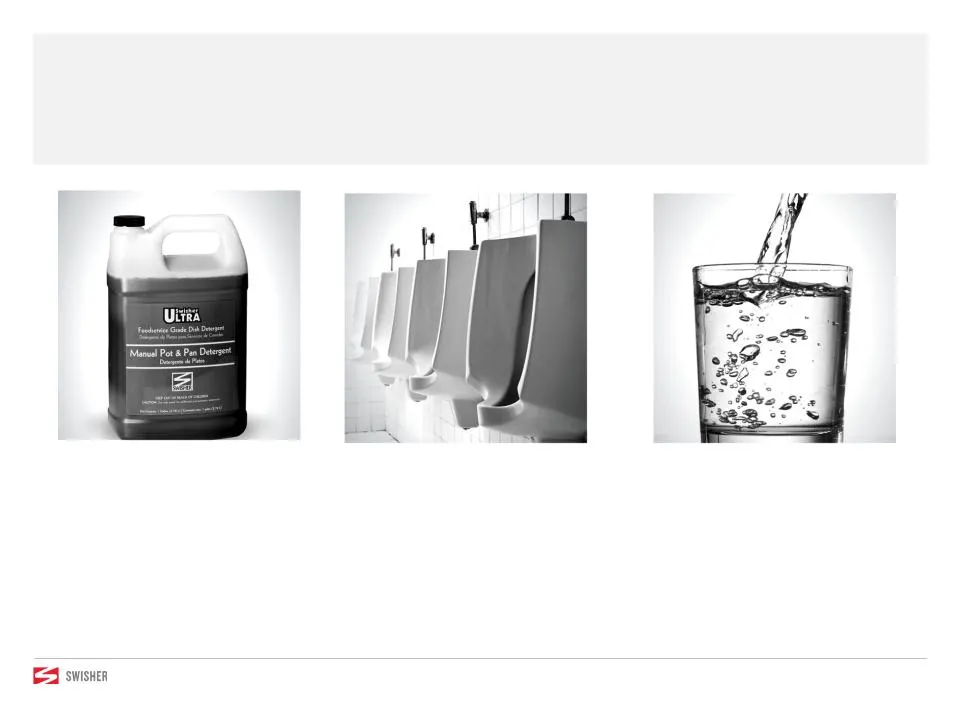
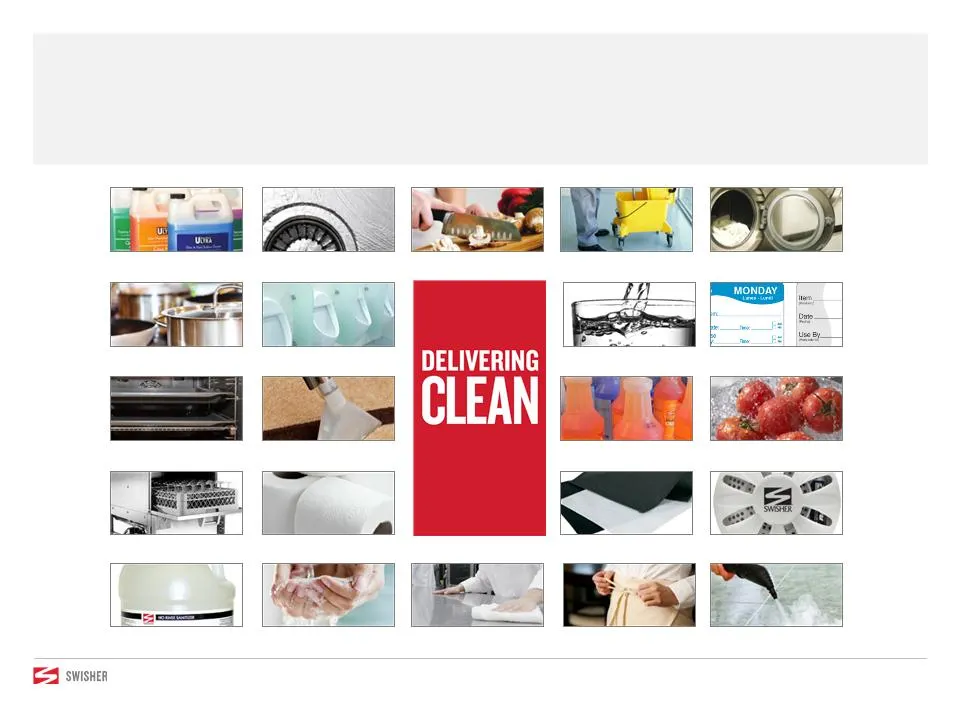
CORE SOLUTIONS We Deliver Clean CHEMICAL » General Cleaning » Warewashing » Laundry » Specialty HYGIENE » Restroom Care » Hand Hygiene » Paper Products » Air Care FACILITY SERVICES » Water Filtration » Drainline Treatment » Bar Towels and Aprons » Floor Mats and Mops
Slide 9: Business Model
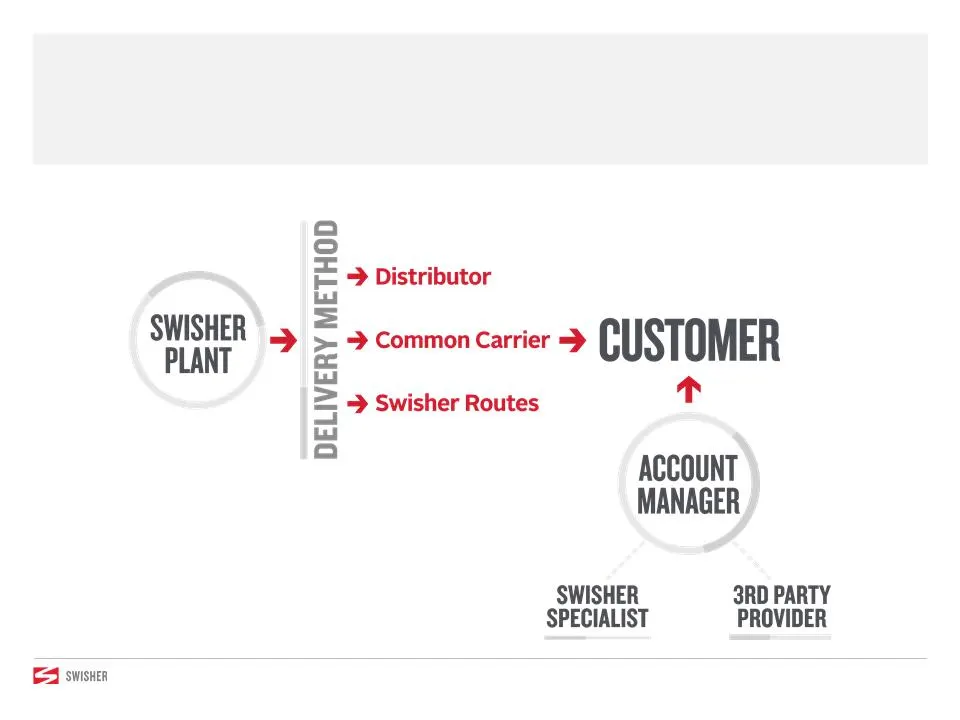
BUSINESS MODEL Leveraging Account Relationship and Delivery Options
Slide 10: Business Model and Position
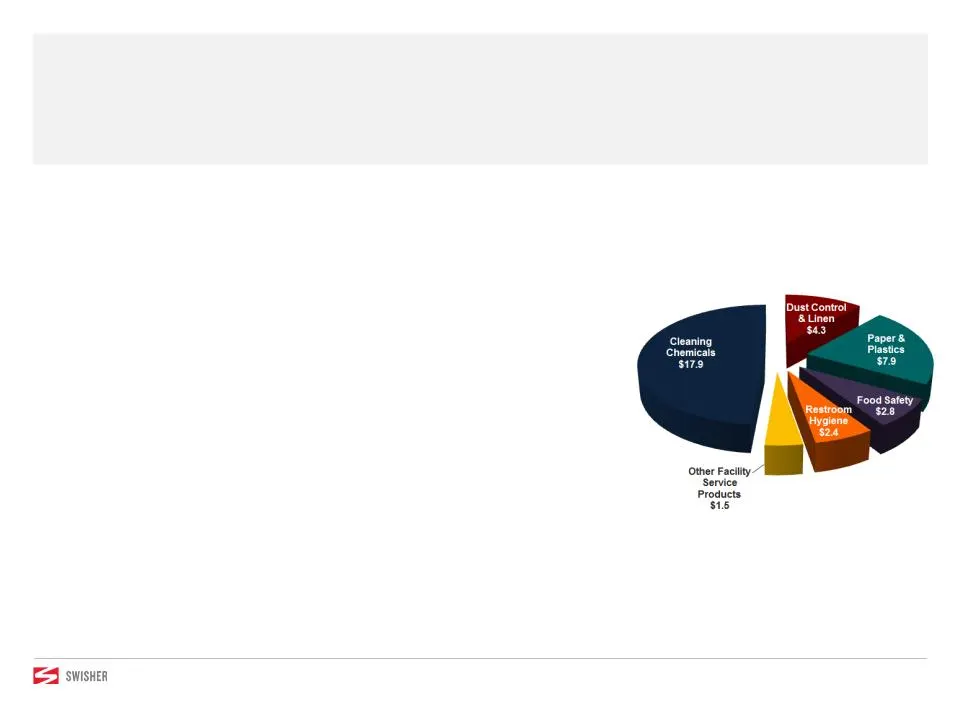
» Products that are critical to our customers » $35 billion market opportunity » Scalable structure with significant leverage from incremental revenue » Recurring revenue » Key differentiators in place to generate ongoing organic growth and profitability BUSINESS MODEL AND POSITION Secured Strong Po

Slide 11: Operational Plan
OPERATIONAL PLAN
Slide 12: Four Point Plan
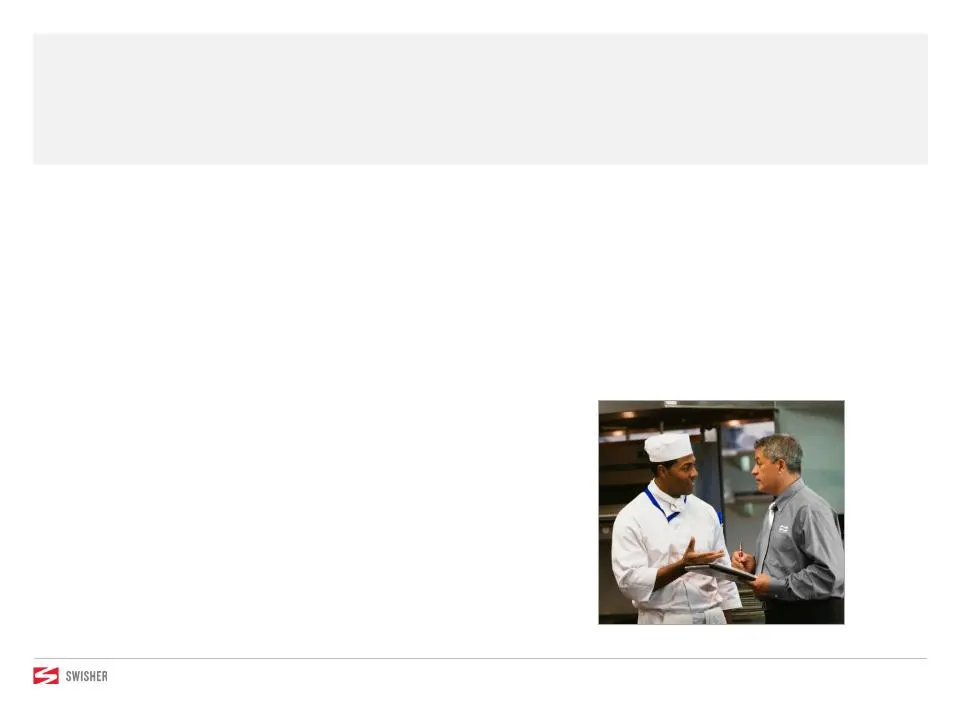
» Enhance customer service and satisfaction » Strengthen the team » Simplify and standardize the business model » Operational simplification » Supply chain rationalization » Financial process improvement » Brand and product enhancement » Balanced sales strategy FOUR POINT PLAN Keys to Maximizing Cus
Slide 13: Impact of the Plan
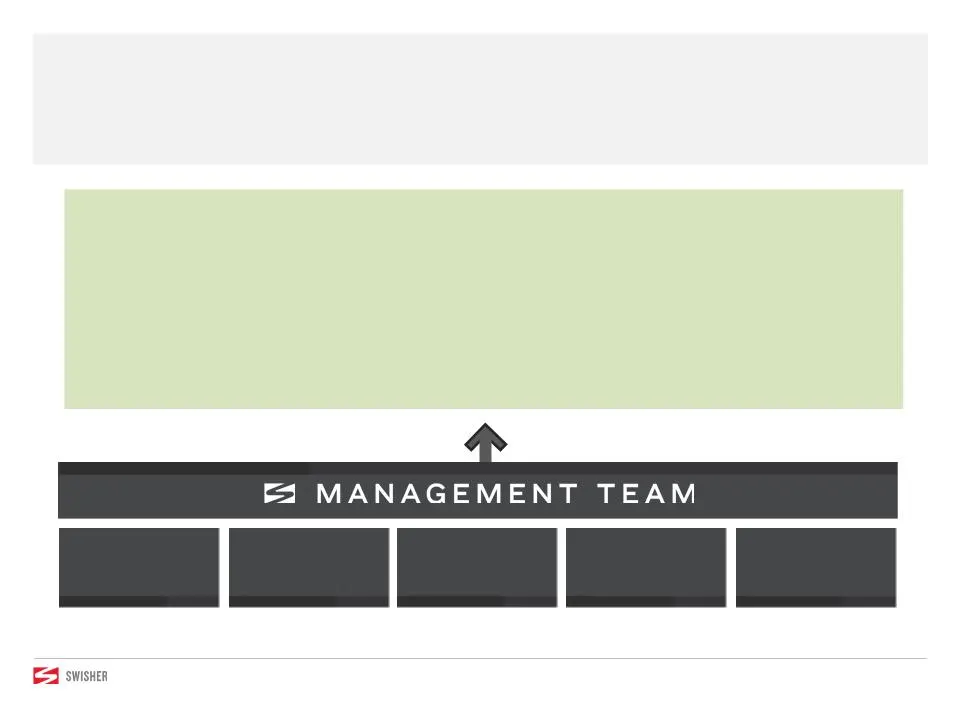
Brand Consolidation Internal Manufacturing Acquisition Integration Database Consolidation Handheld Deployment IMPACT OF THE PLAN 2012 Initiatives Provided Basis for Continued Progress » Sustainable organic revenue growth » $10 million of 2013 annualized expense savings, starting primarily in 2 nd ha
Slide 14: Operational Simplification
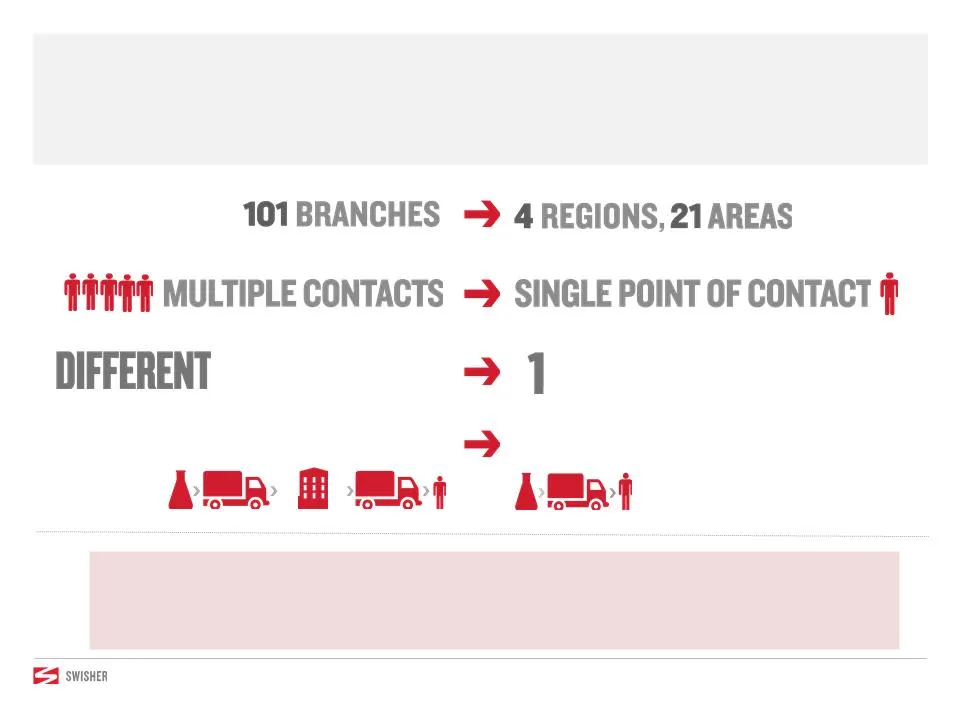
OPERATIONAL SIMPLIFICATION Consolidating Service and Support Infrastructure PREVIOUS DELIVERY METHOD Swisher Plant to Branches to Customer NEW & SIMPLE Delivery Method OPERATING MODELS OPERATING MODEL » 35% reduction in square footage in 2013 and 2014 » SG&A reduction in Q3 2013 through Q1 2014
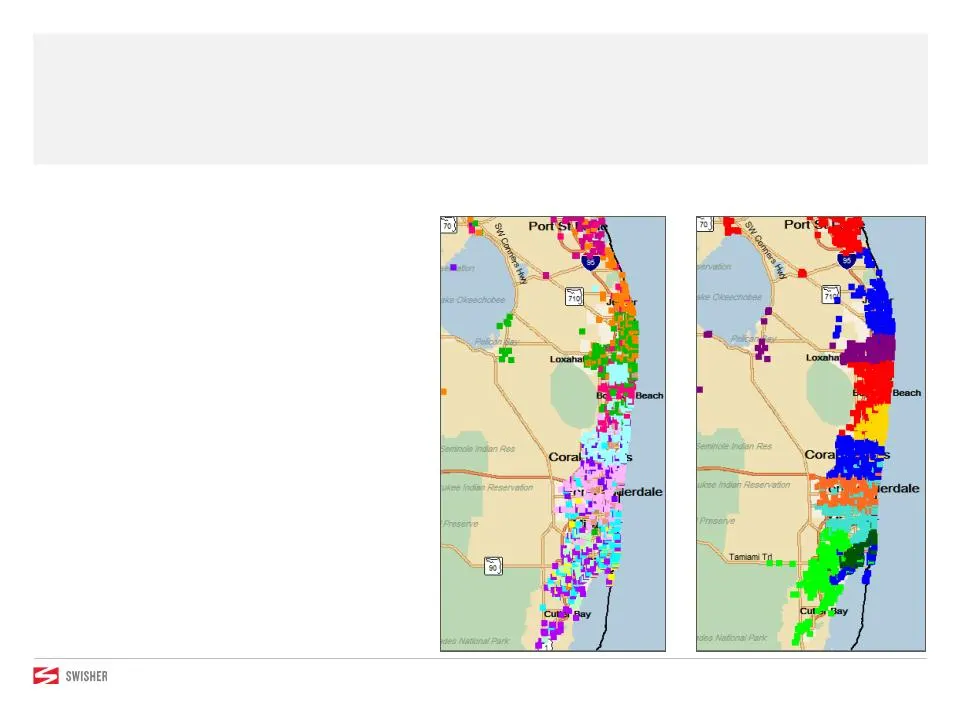
Slide 15: Supply Chain Rationalization: Route Consolidations
» 20-30% reduction in miles driven » 10-20% increase in revenue per service employee » Improved inventory control » Route expense reduction in Q3’13 through Q2’14 SUPPLY CHAIN RATIONALIZATION Route Consolidations Reduce Costs and Increase Customer Contact Before After
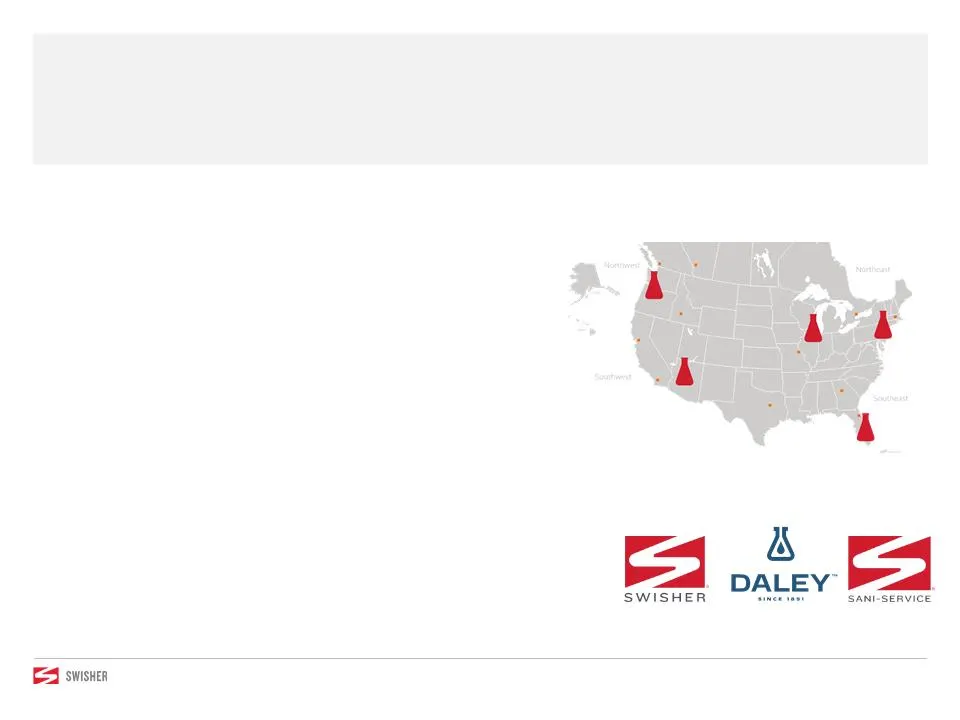
Slide 16: Supply Chain Rationalization: Plant Consolidations
SUPPLY CHAIN RATIONALIZATION Plant Consolidations Reduce Multiple Costs » Improves speed and flexibility » 20-30% reduction in plant inventories » 50+% reduction in chemical SKUs » 70% current plant capacity available » Cost of Sales reduction in Q3’13 through Q1’14 Transition from 8 to 5 plants Tra
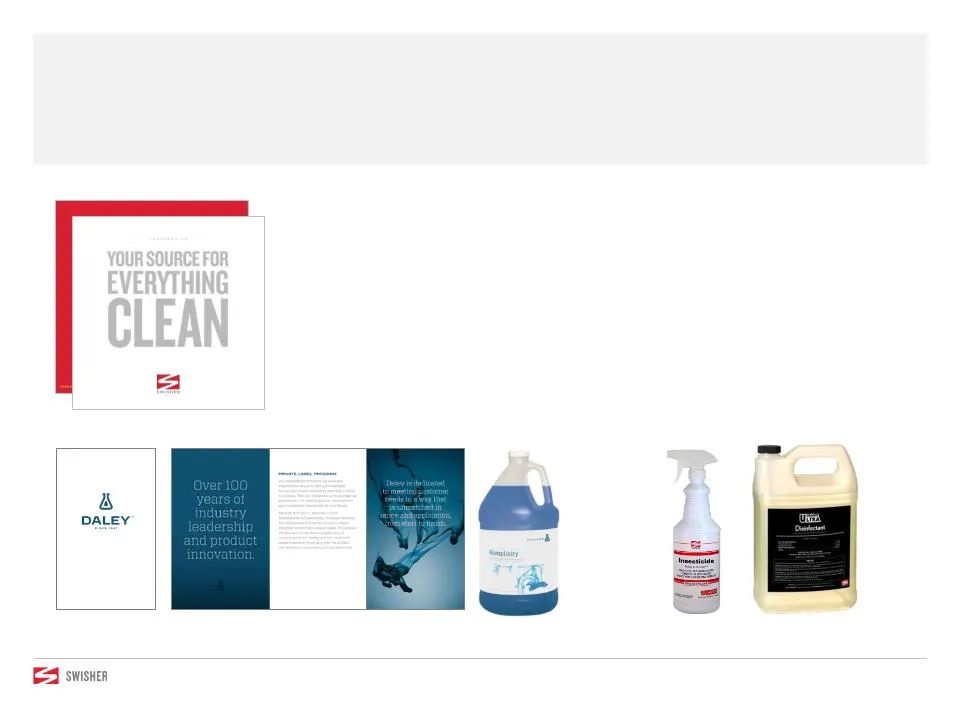
Slide 17: Brand & Product Enhancement
BRAND & PRODUCT ENHANCEMENT Elevating our Brand and Product Offering » Increases awareness » Strengthens price flexibility » Reduces costs through brand consolidation » Streamlines product offering Brand Enhancement Product Innovation Sales Support
Slide 18: Balanced Sales Strategy
BALANCED SALES STRATEGY Finding the Best Mix of Upsells, Field Sales and Multi-unit Sales Focus All products & services to key market segments Target Distributor relationships, corporate sourced agreements and large independents Focus All products & services to key market segments Target Corporate r
Slide 19: Upselling a Wide Range of Needed Products and Services
Upselling a Wide Range of Needed Products and Services BALANCED SALES STRATEGY Food Safety Treatment Water Filtration Aprons & Chef Wear Floor Care Restroom Sanitation Bathroom Cleaners Floor Mats & Mops Dish Machine Products Pot & Pan Detergents Warewash Equipment Specialty Products Drainline Treat
Slide 20: GPOs and Distributors to Accelerate New Account Sales
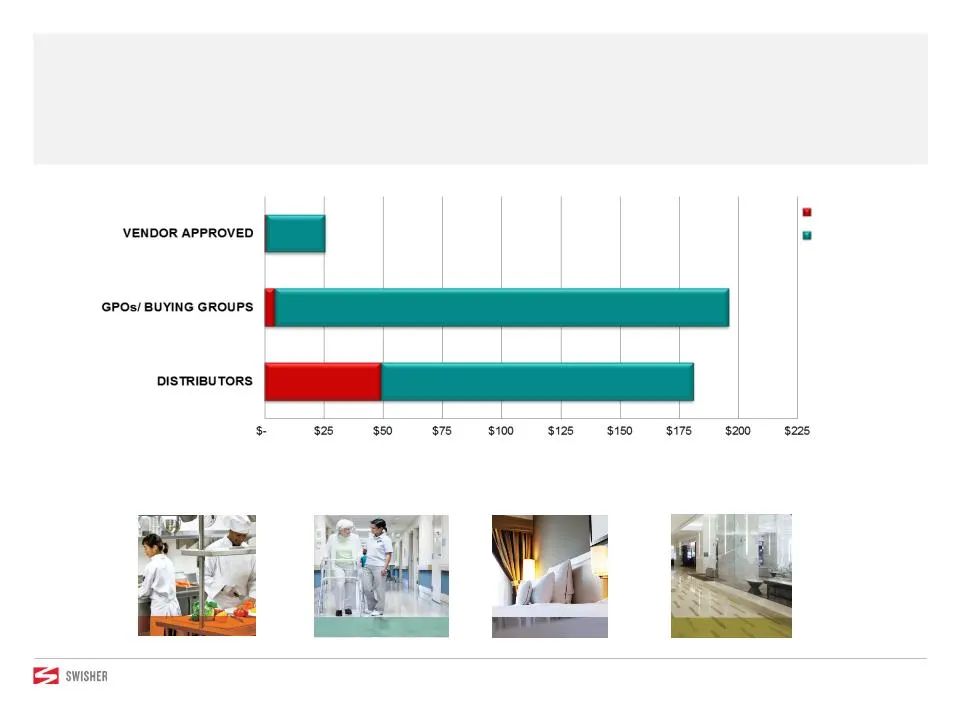
FOODSERVICE HEALTHCARE HOSPITALITY RETAIL GPOs and Distributors to Accelerate New Account Sales BALANCED SALES STRATEGY $ MILLIONS Penetration of Current Relationships Opportunities Cross Multiple Verticals Current Revenue Potential Revenue

Slide 21: Looking Ahead
LOOKING AHEAD

Slide 22: 2013 Strategy and Tactics
2013 STRATEGY AND TACTICS Focus on Chemicals and Hygiene » Focus on core chemical and hygiene operations » Continue to aggressively implement four point plan » Increase sales through combination of customer upsell and balanced mix of new sales » Reduce expenses through standardization, simplificatio

Slide 23: Impact of Plan on Future Results
IMPACT OF PLAN ON FUTURE RESULTS Recap of Previously Disclosed Outlook » Sequential revenue growth beginning in 2013 » Reduction in investigation and review-related expenses and other professional fees in 2 nd quarter of 2013 » Significant expense reductions beginning in 3 rd quarter of 2013 » Annua
Slide 24: Q1 Results and Future Targets
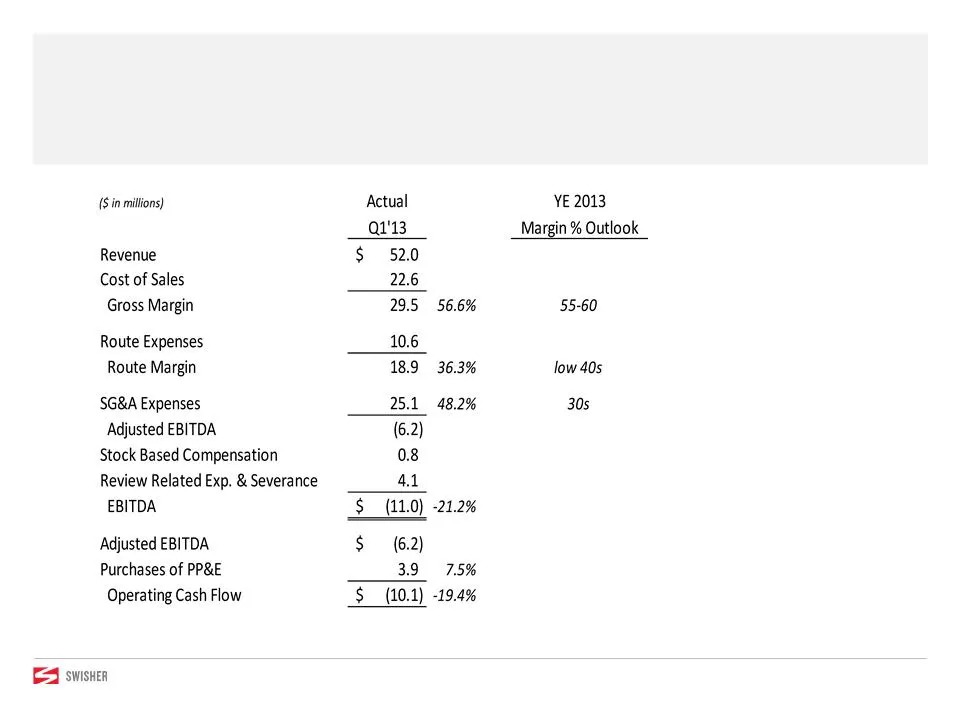
Q1 RESULTS AND FUTURE TARGETS Recap of Previously Disclosed Outlook » Most Gross Margin and Route Margin improvements beginning in 3 rd quarter of 2013 » Plans for continued reduction in SG&A as a percentage of revenue » 2013 PP&E purchases expected to be in $12-$15 million range, tied to new sales

Slide 25: Balance Sheet and Equity
BALANCE SHEET AND EQUITY Strong Balance Sheet » 175 million shares outstanding » Traded on NASDAQ: SWSH and TSX: SWI » Balance sheet at March 31, 2013 » $56 million of cash and $12 million of debt » $68 million of total working capital » $48 million of PP&E » Capitalization (@$.85/share) » Market ca

Slide 26: Conclusion
CONCLUSION The Opportunity is Bigger Today Than Originally Envisioned » Large industry with attractive business characteristics and demand still exists for an alternative chemical provider » Focus will be on leveraging unique position within the hygiene and chemical portion of our $35 billion market
Slide 27: Contact Information: Swisher Investor Services
CONTACT INFORMATION: SWISHER INVESTOR SERVICES (704) 602-7116 INVESTORRELATIONS@SWSH.COM
Source: SEC EDGAR · 8-K filed Jun 27, 2013
More decks from Swisher Hygiene Inc
 17th Annual ICR XChange (January 2015)13 slides · Jan 12, 2015
 Shareholder Meeting (May 2014)19 slides · May 15, 2014
 Baird's 2014 Business Solutions Conference11 slides · Feb 25, 2014
 16th Annual ICR XChange (January 2014)20 slides · Jan 13, 2014
 Shareholder Meeting (June 2013)26 slides · Jun 5, 2013
 15th Annual ICR XChange (January 2013)20 slides · Jan 16, 2013