Kennedy-Wilson Holdings Inc. · NYSE:KW
Kennedy-Wilson — Q2 2021 Earnings Presentation
39 slides from Kennedy-Wilson's earnings presentation, August 2021
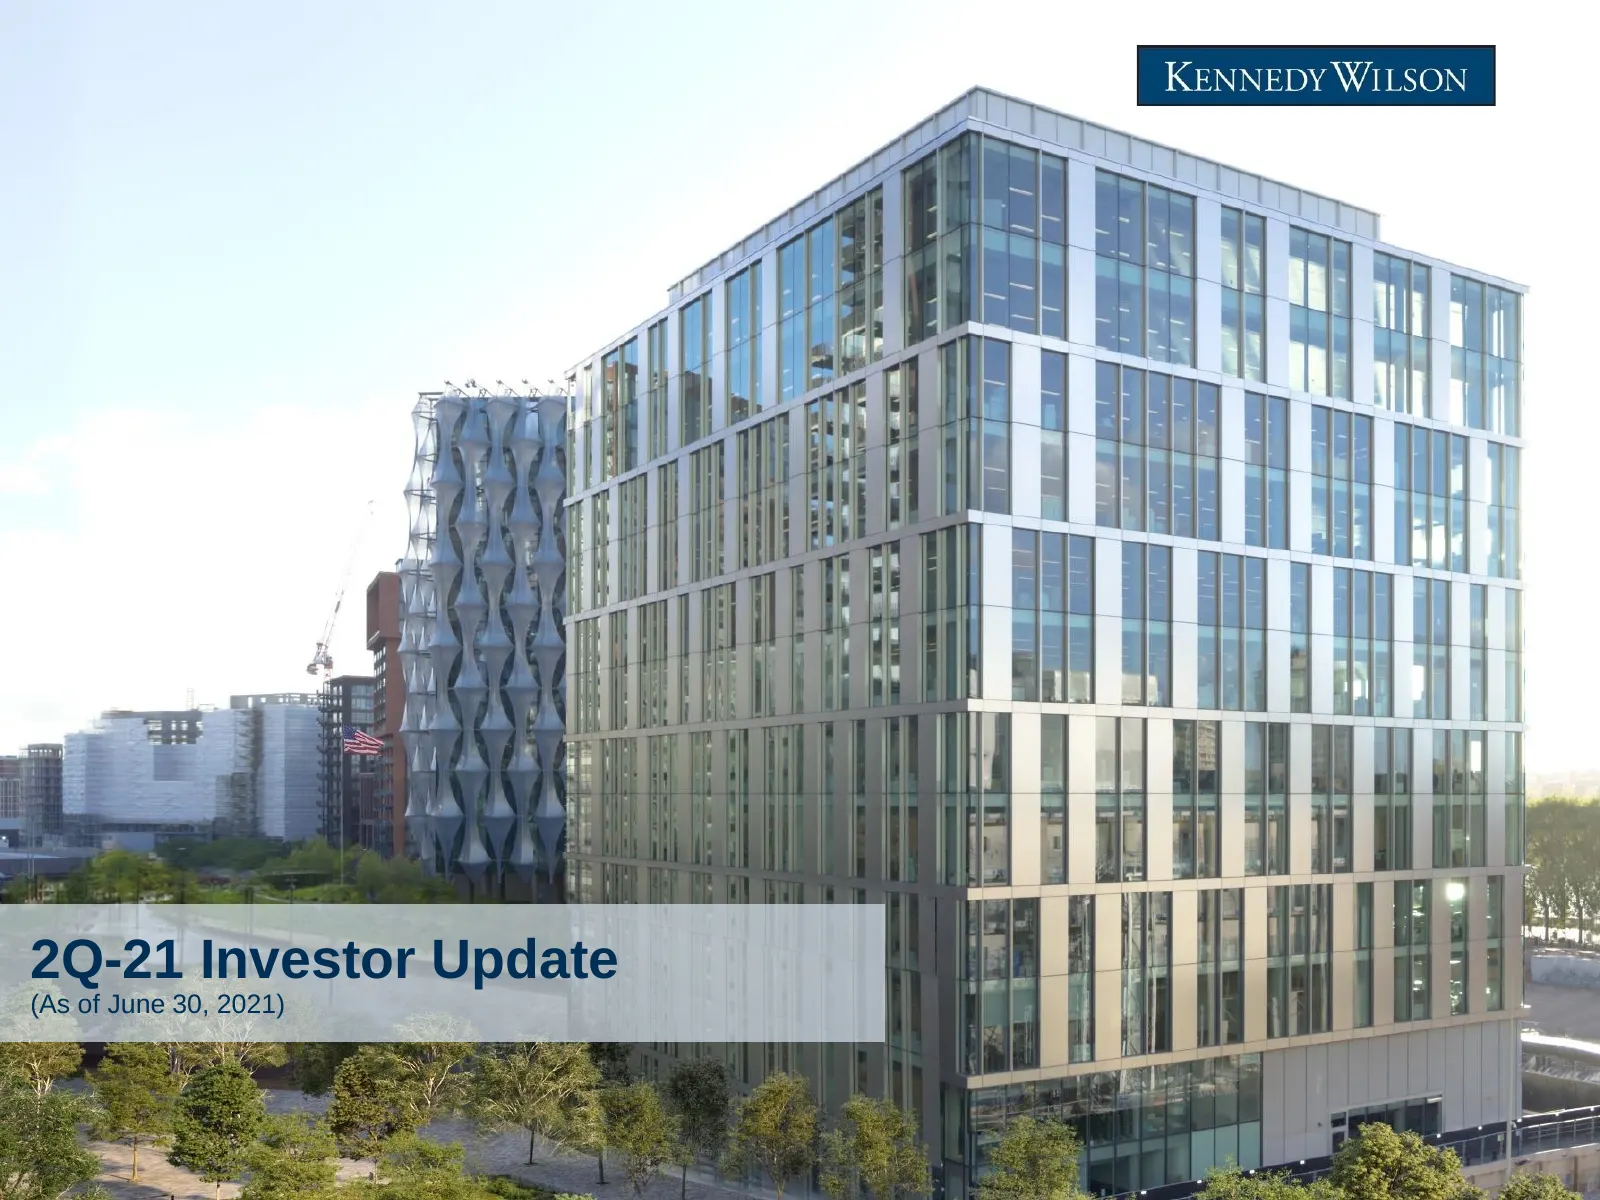
Slide 1: 2Q-21 Investor Update
2Q-21 Investor Update (As of June 30, 2021)
Slide 2: Disclaimer/Forward-Looking Statements
Disclaimer/Forward-Looking Statements Statements made by us in this presentation and in other reports and ability to acquire additional real estate assets; continued high levels of, or statements released by us that are not historical facts constitute “forward- increases in, unemployment and a gener
Slide 3: Table of Contents
Table of Contents Page Strategic Review 3 Financial Review 17 Western U.S. Markets 20 European Markets 25 Appendix 32 2 2Q-21 INVESTOR UPDATE
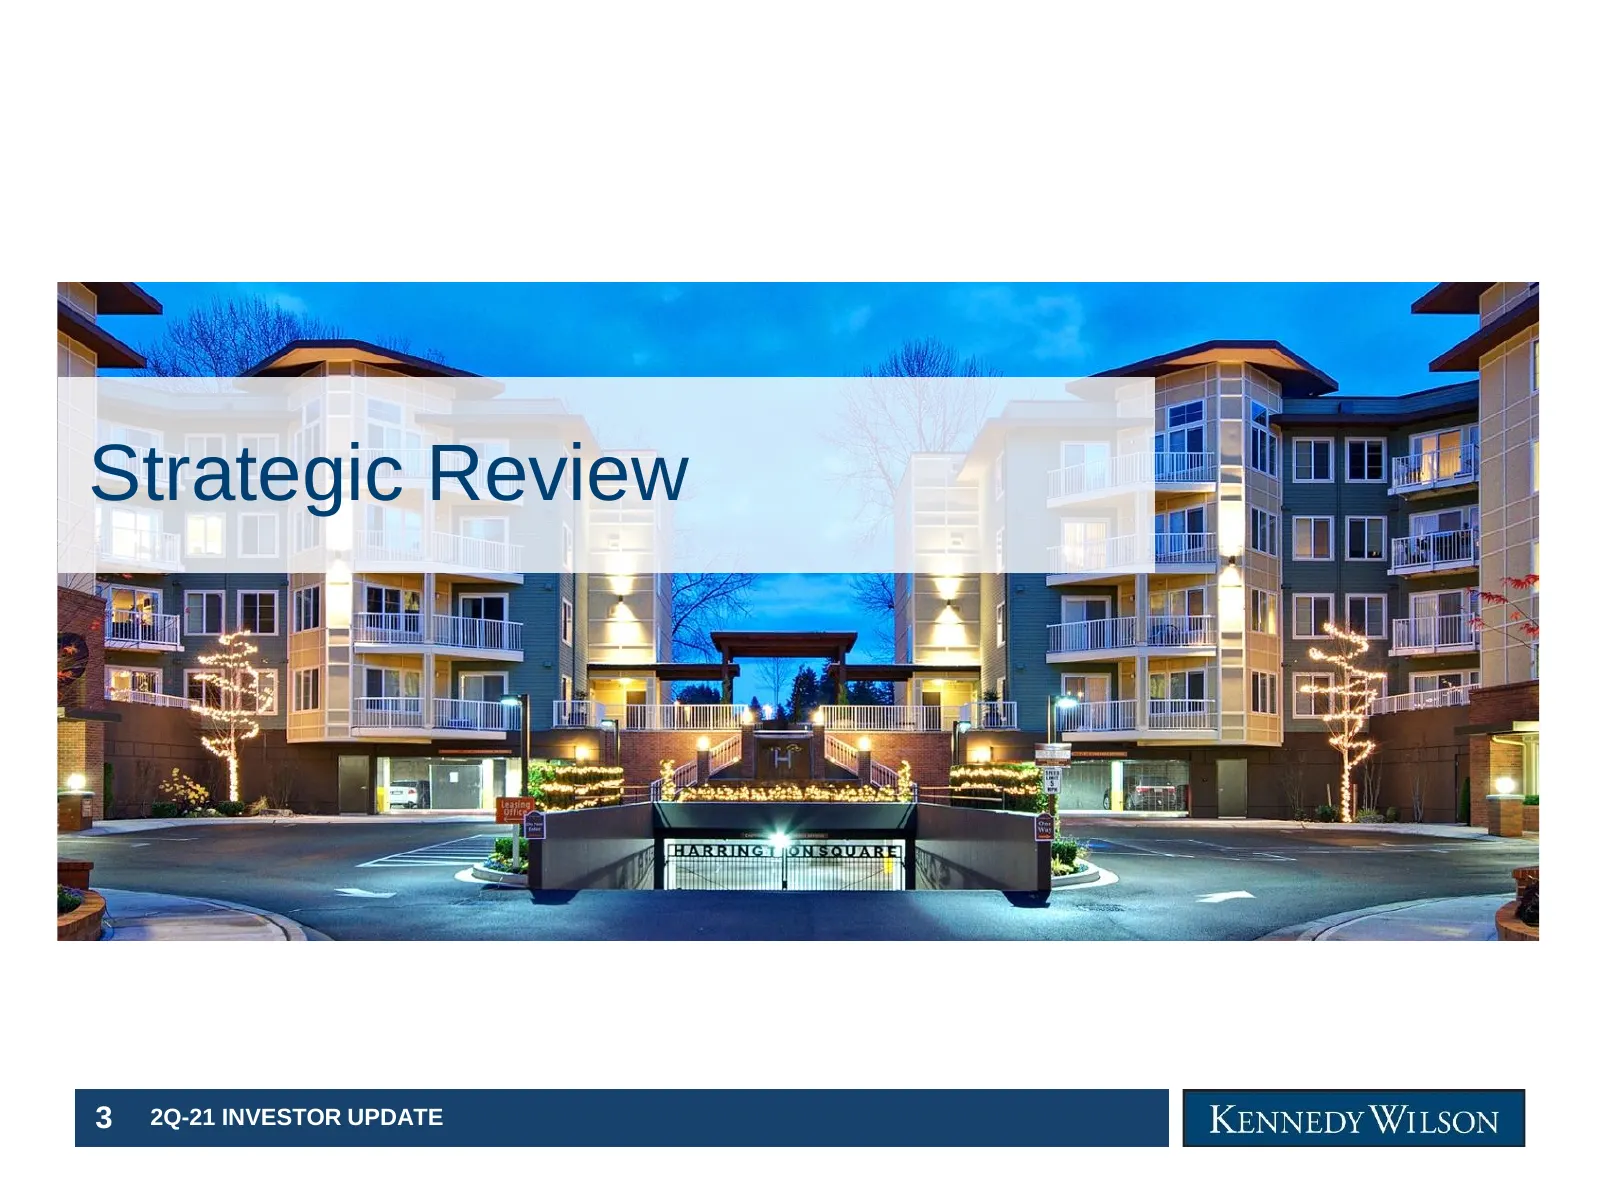
Slide 4: Strategic Review
Overview Strategic Review 3 2Q-21 INVESTOR UPDATE
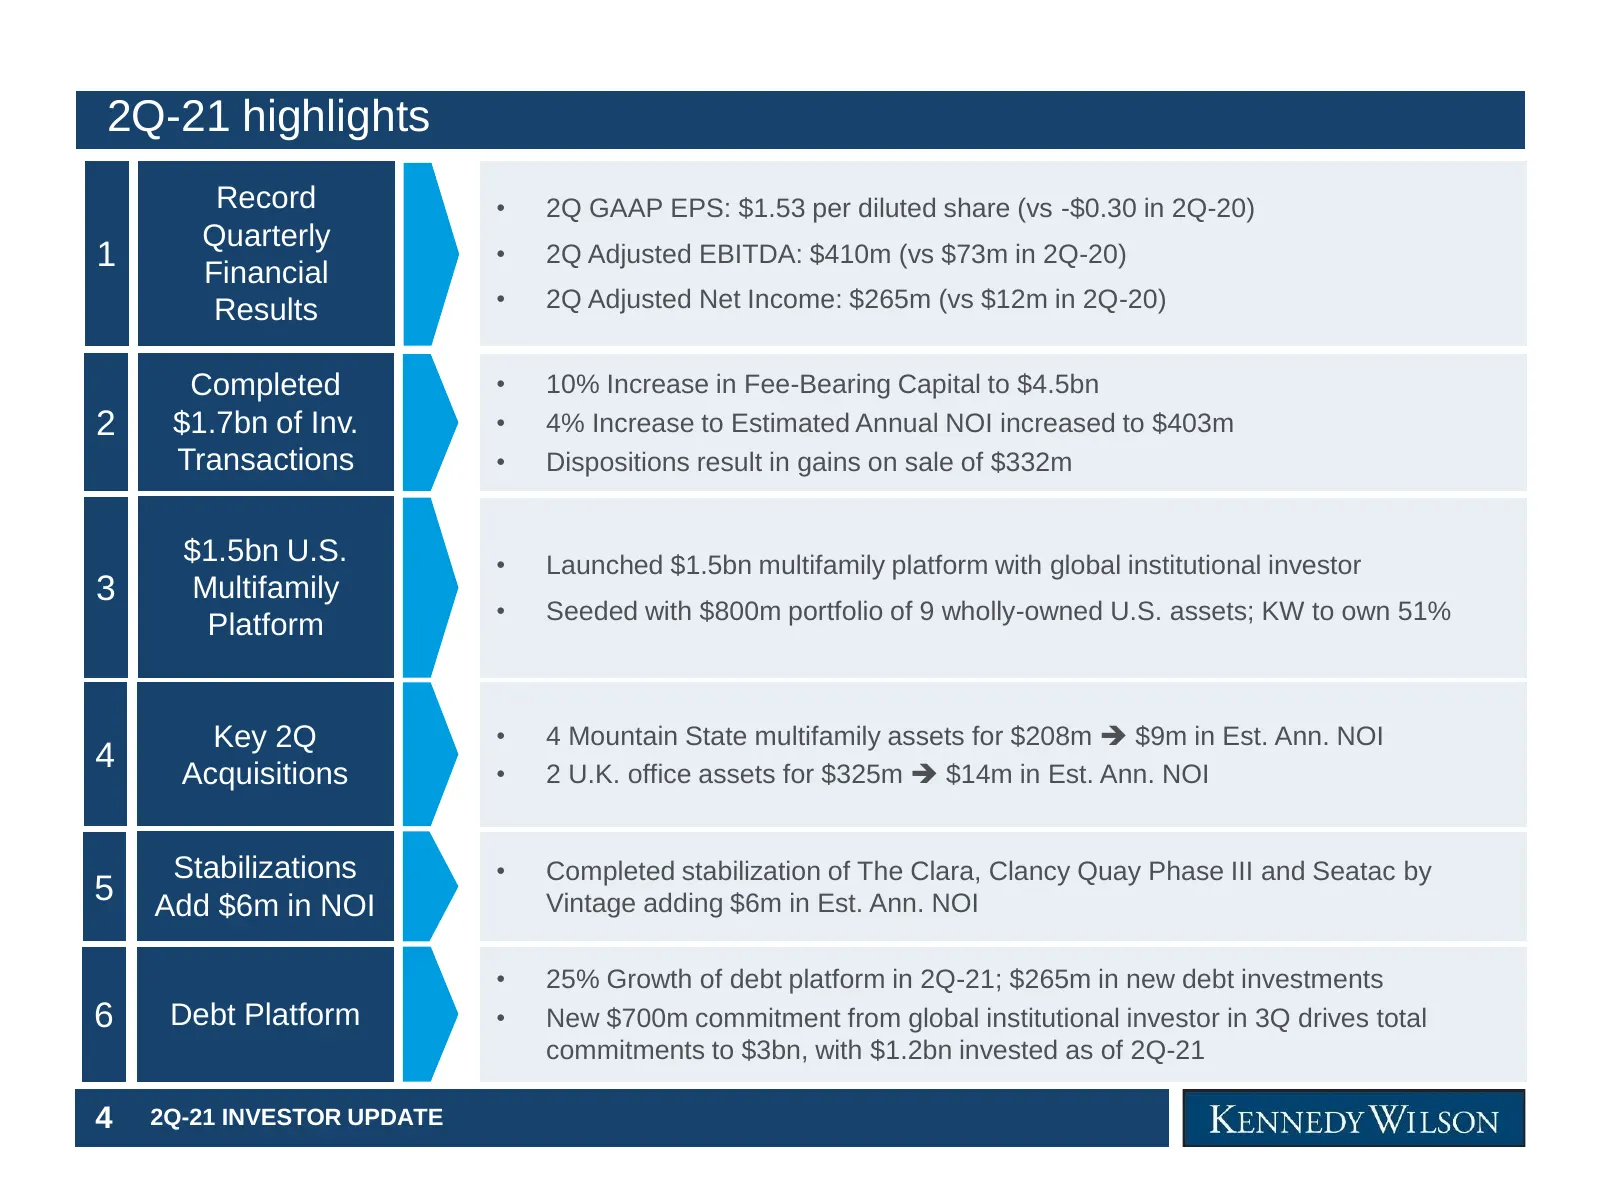
Slide 5: 2Q-21 highlights
2Q-21 highlights Record • 2Q GAAP EPS: $1.53 per diluted share (vs -$0.30 in 2Q-20) Quarterly 1 • 2Q Adjusted EBITDA: $410m (vs $73m in 2Q-20) Financial Results • 2Q Adjusted Net Income: $265m (vs $12m in 2Q-20) Completed • 10% Increase in Fee-Bearing Capital to $4.5bn 2 $1.7bn of Inv. • 4% Increase
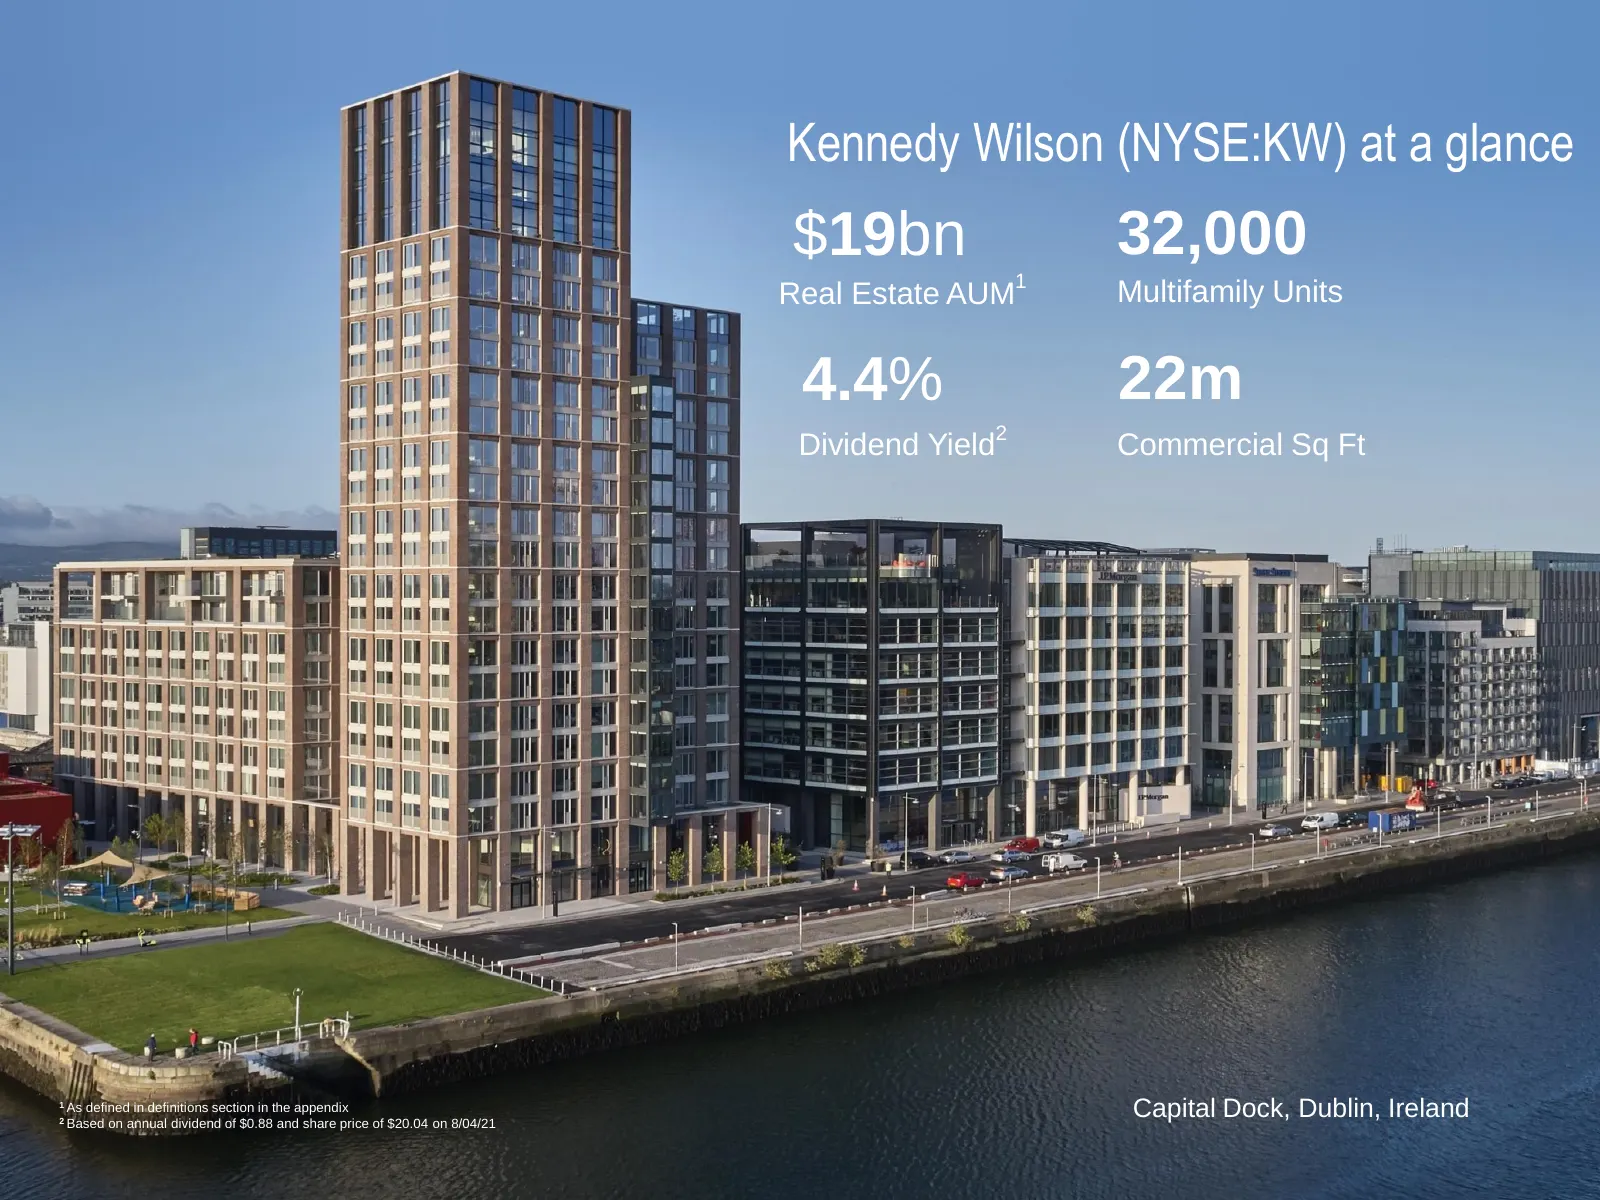
Slide 6: Kennedy Wilson (NYSE:KW) at a glance
Kennedy Wilson (NYSE:KW) at a glance $19bn 32,000 Real Estate AUM1 Multifamily Units 4.4% 22m Dividend Yield2 Commercial Sq Ft 1 As defined in definitions section in the appendix 5 2Q-21 INVESTOR UPDATE 2 Based on annual dividend of $0.88 and share price of $20.04 on 8/04/21 Capital Dock, Dublin, Ir

Slide 7: About Kennedy Wilson
About Kennedy Wilson We are a leading global real estate investment company. We own, operate and invest in real estate directly and through our investment management platform. We focus on multifamily and office properties located in the Western U.S., UK, and Ireland. Office: 150 El Camino Multifamil
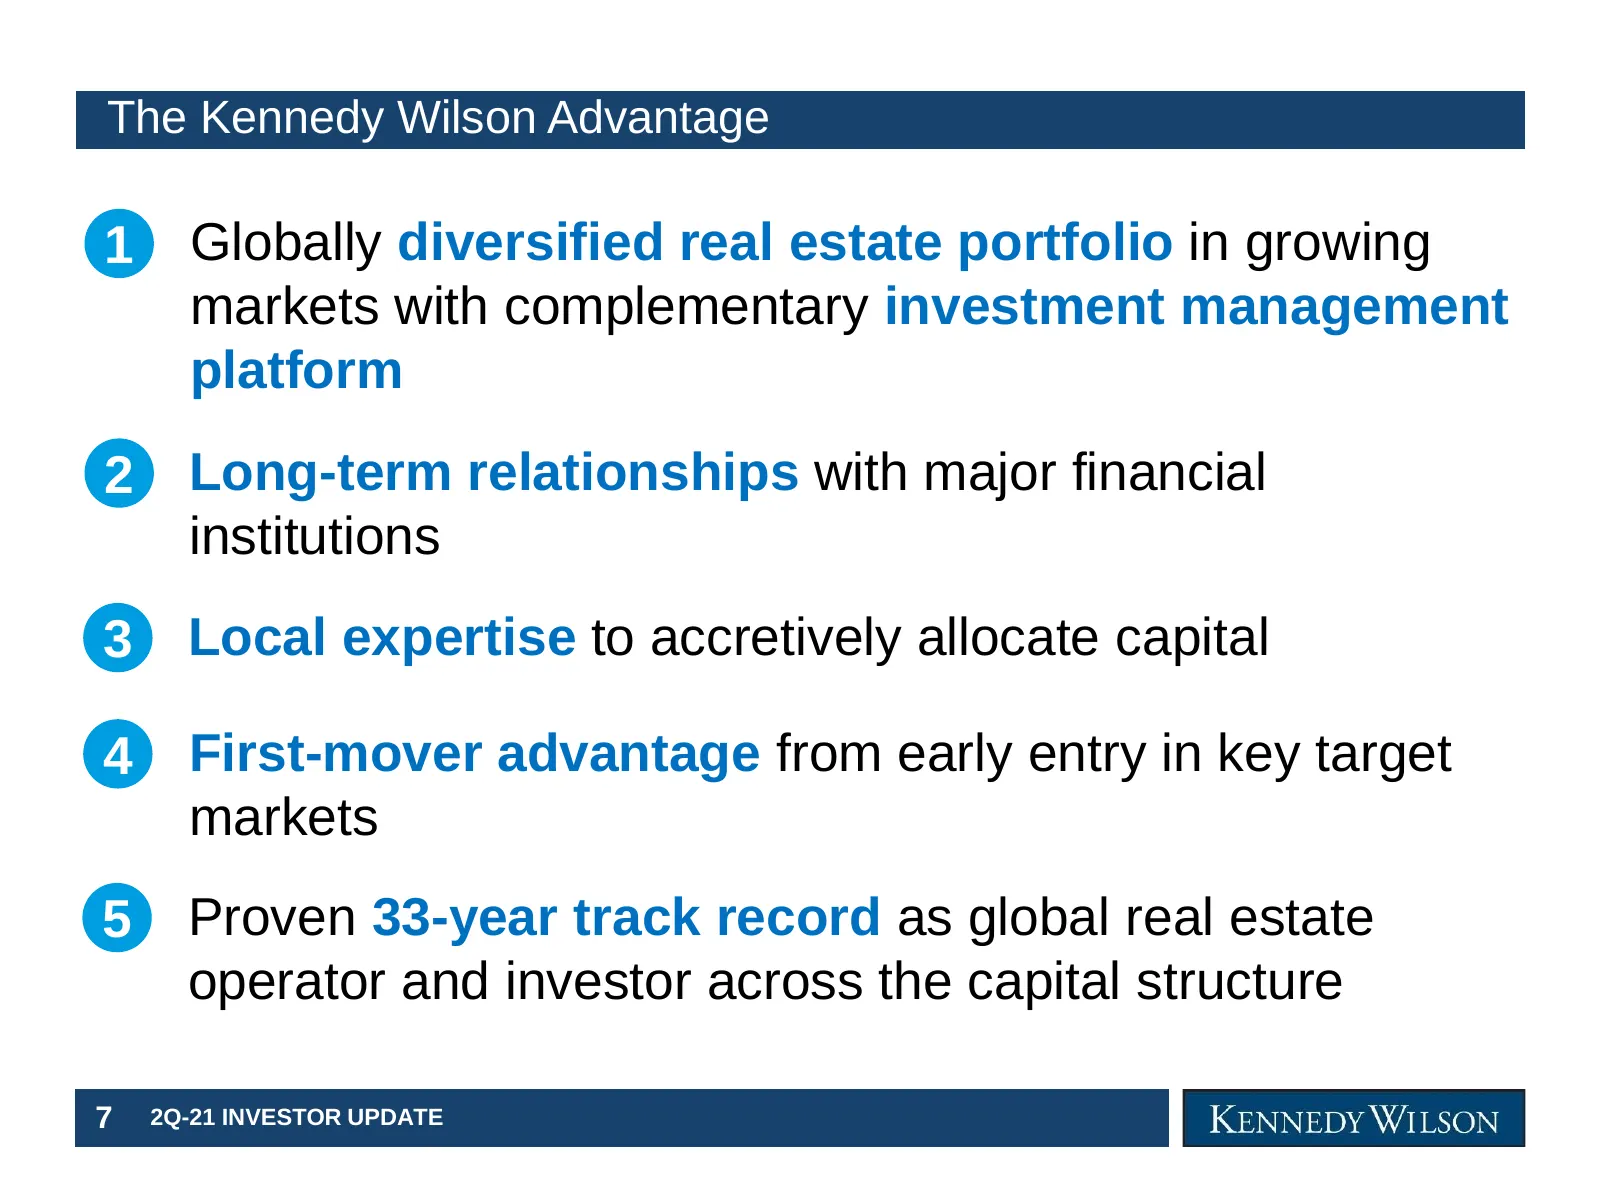
Slide 8: The Kennedy Wilson Advantage
The Kennedy Wilson Advantage 1 Globally diversified real estate portfolio in growing markets with complementary investment management platform 2 Long-term relationships with major financial institutions 3 Local expertise to accretively allocate capital 4 First-mover advantage from early entry in key

Slide 9: Real Estate Portfolio and Value Creation Opportunities
Real Estate Portfolio and Value Creation Opportunities 8 2Q-21 INVESTOR UPDATE
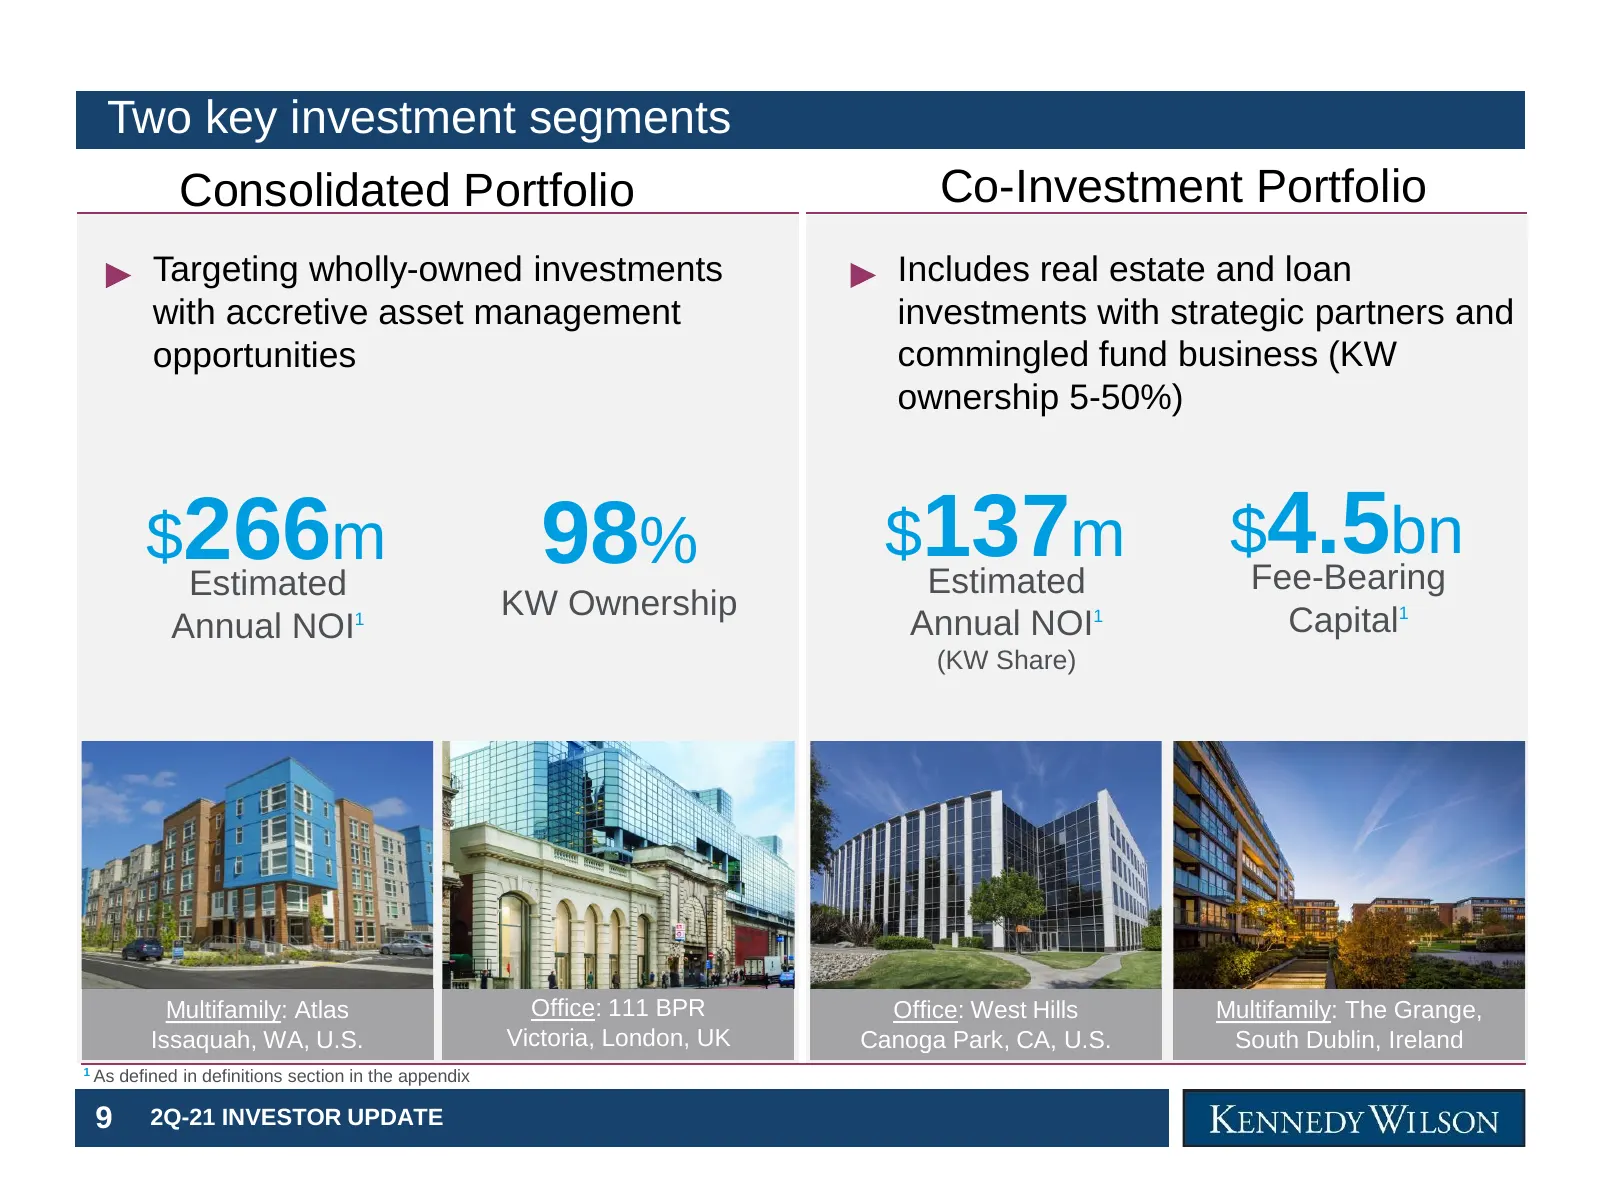
Slide 10: Two key investment segments
Two key investment segments Consolidated Portfolio Co-Investment Portfolio Targeting wholly-owned investments Includes real estate and loan with accretive asset management investments with strategic partners and opportunities commingled fund business (KW ownership 5-50%) $266m 98% $137m $4.5bn Estim
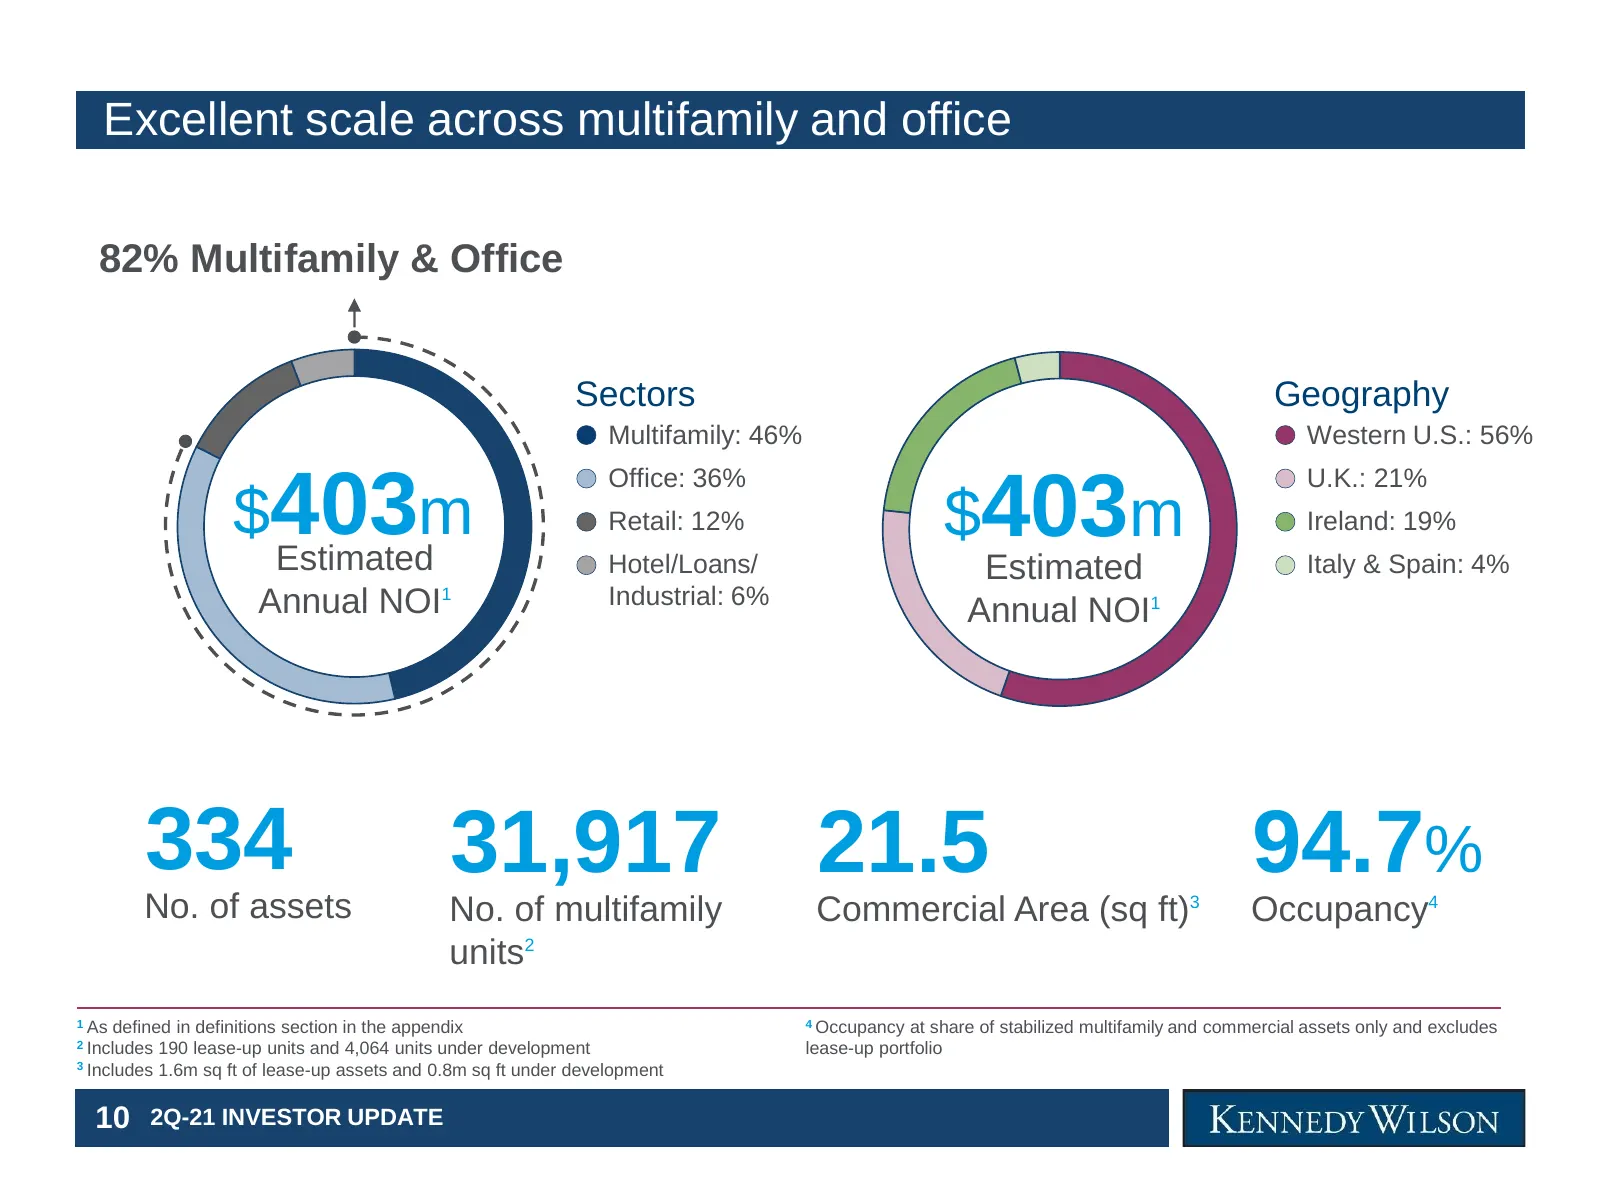
Slide 11: Excellent scale across multifamily and office
Excellent scale across multifamily and office 82% Multifamily & Office Sectors Geography Multifamily: 46% Western U.S.: 56% Office: 36% U.K.: 21% $403m Retail: 12% $403m Ireland: 19% Estimated Hotel/Loans/ Estimated Italy & Spain: 4% Annual NOI1 Industrial: 6% Annual NOI1 334 31,917 21.5 94.7% No. o
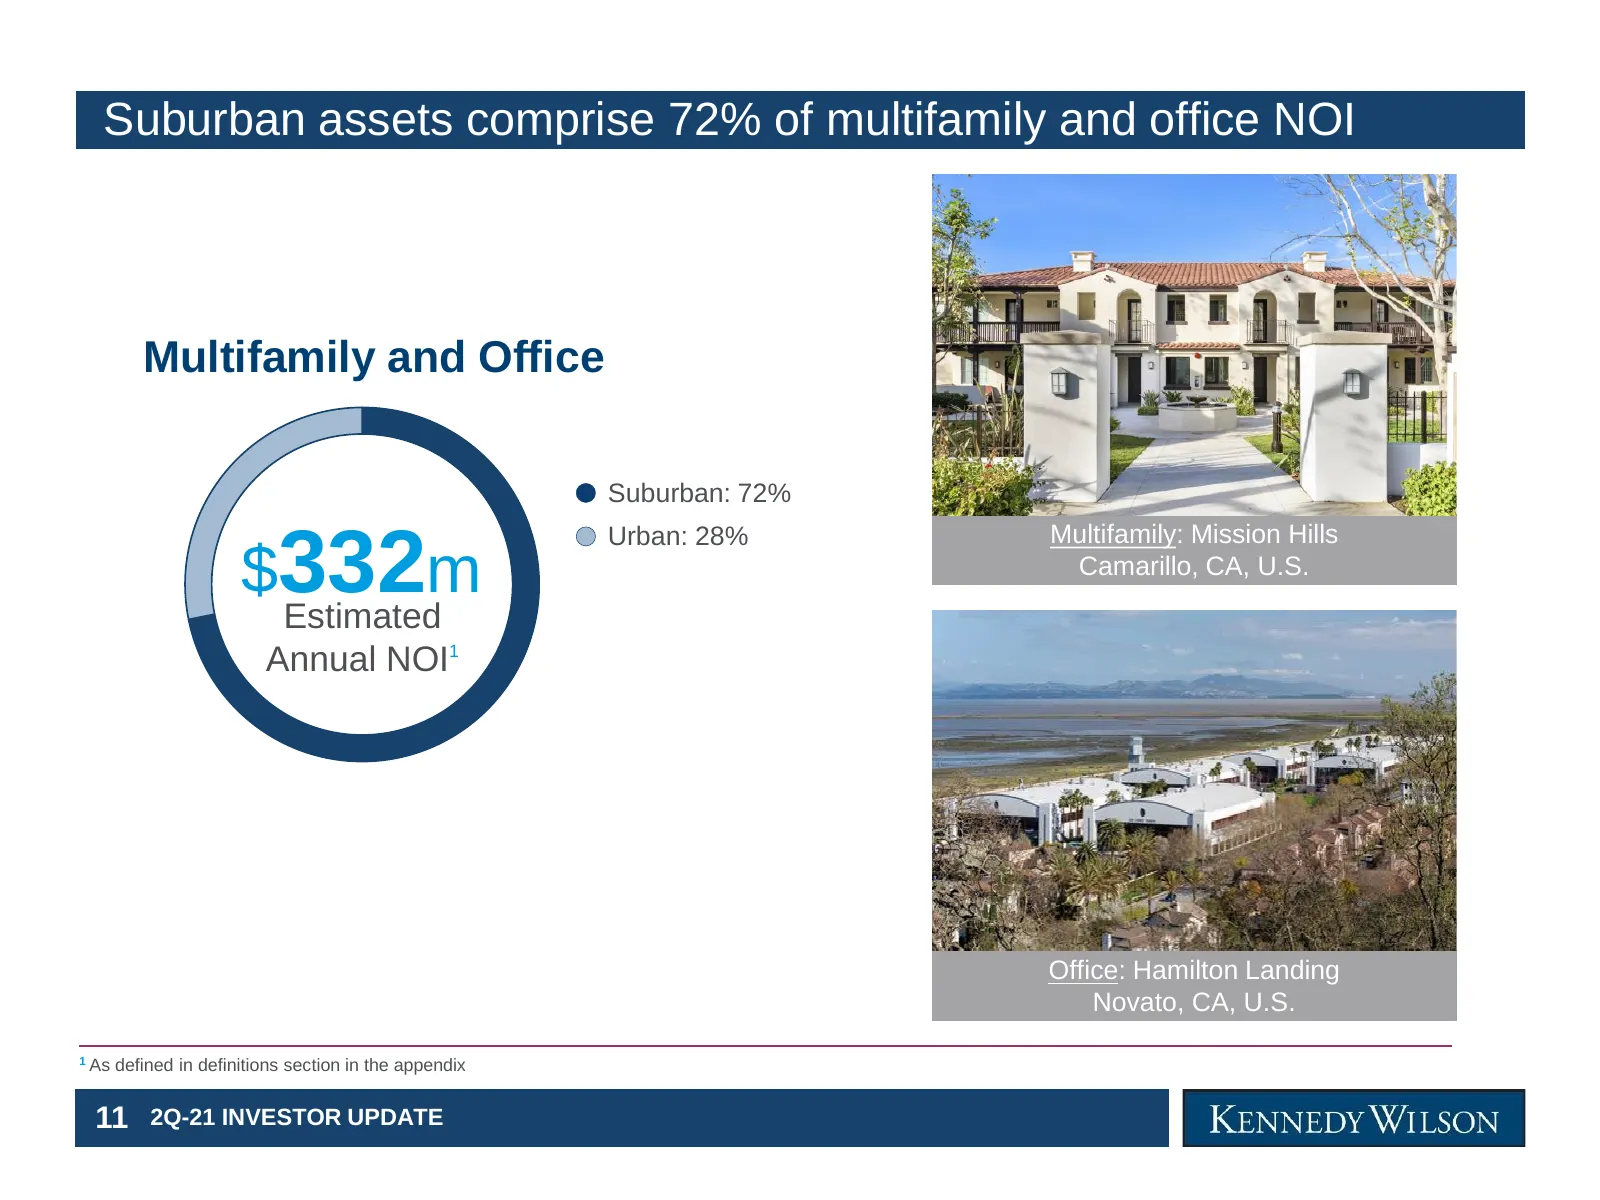
Slide 12: Suburban assets comprise 72% of multifamily and office NOI
Suburban assets comprise 72% of multifamily and office NOI Multifamily and Office Suburban: 72% Urban: 28% Multifamily: Mission Hills $332m Camarillo, CA, U.S. Estimated Annual NOI1 Office: Hamilton Landing Novato, CA, U.S. 1 As defined in definitions section in the appendix 11 2Q-21 INVESTOR UPDATE
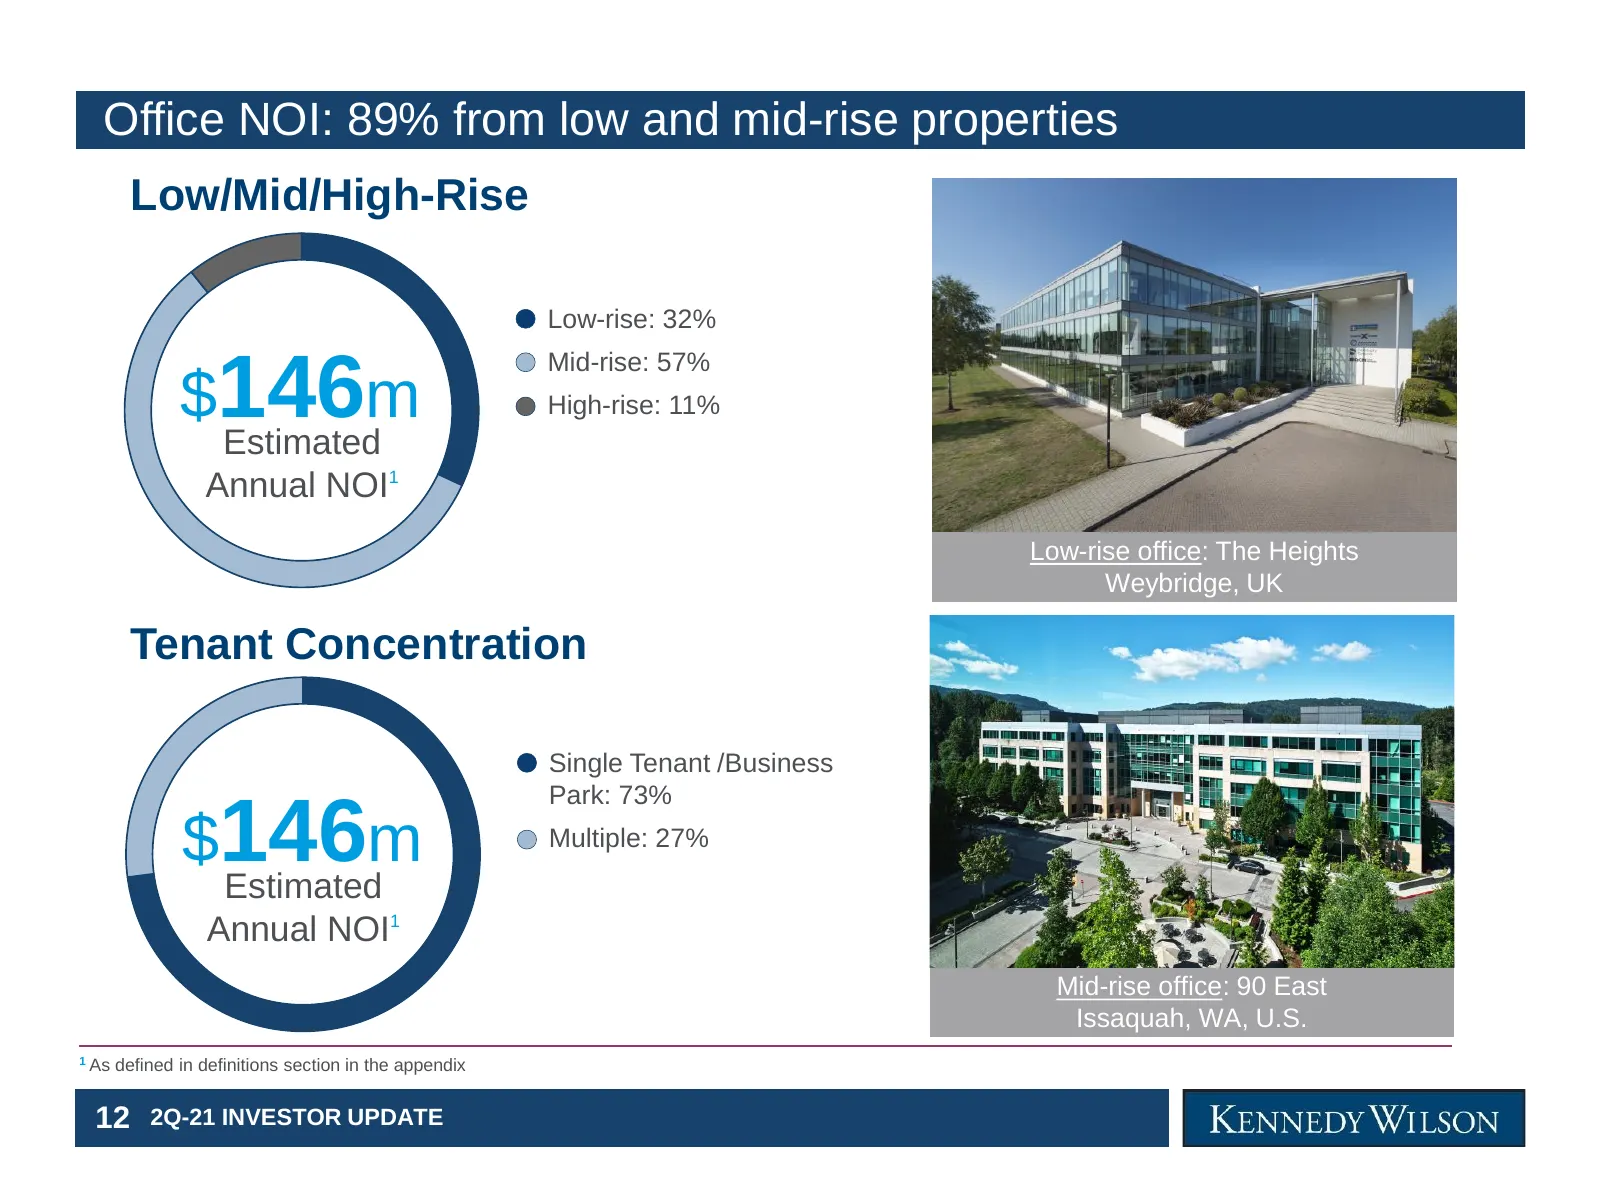
Slide 13: Office NOI: 89% from low and mid-rise properties
Office NOI: 89% from low and mid-rise properties Low/Mid/High-Rise Low-rise: 32% Mid-rise: 57% $146m High-rise: 11% Estimated Annual NOI1 Low-rise office: The Heights Weybridge, UK Tenant Concentration Single Tenant /Business Park: 73% $146m Multiple: 27% Estimated Annual NOI1 Mid-rise office: 90 Ea
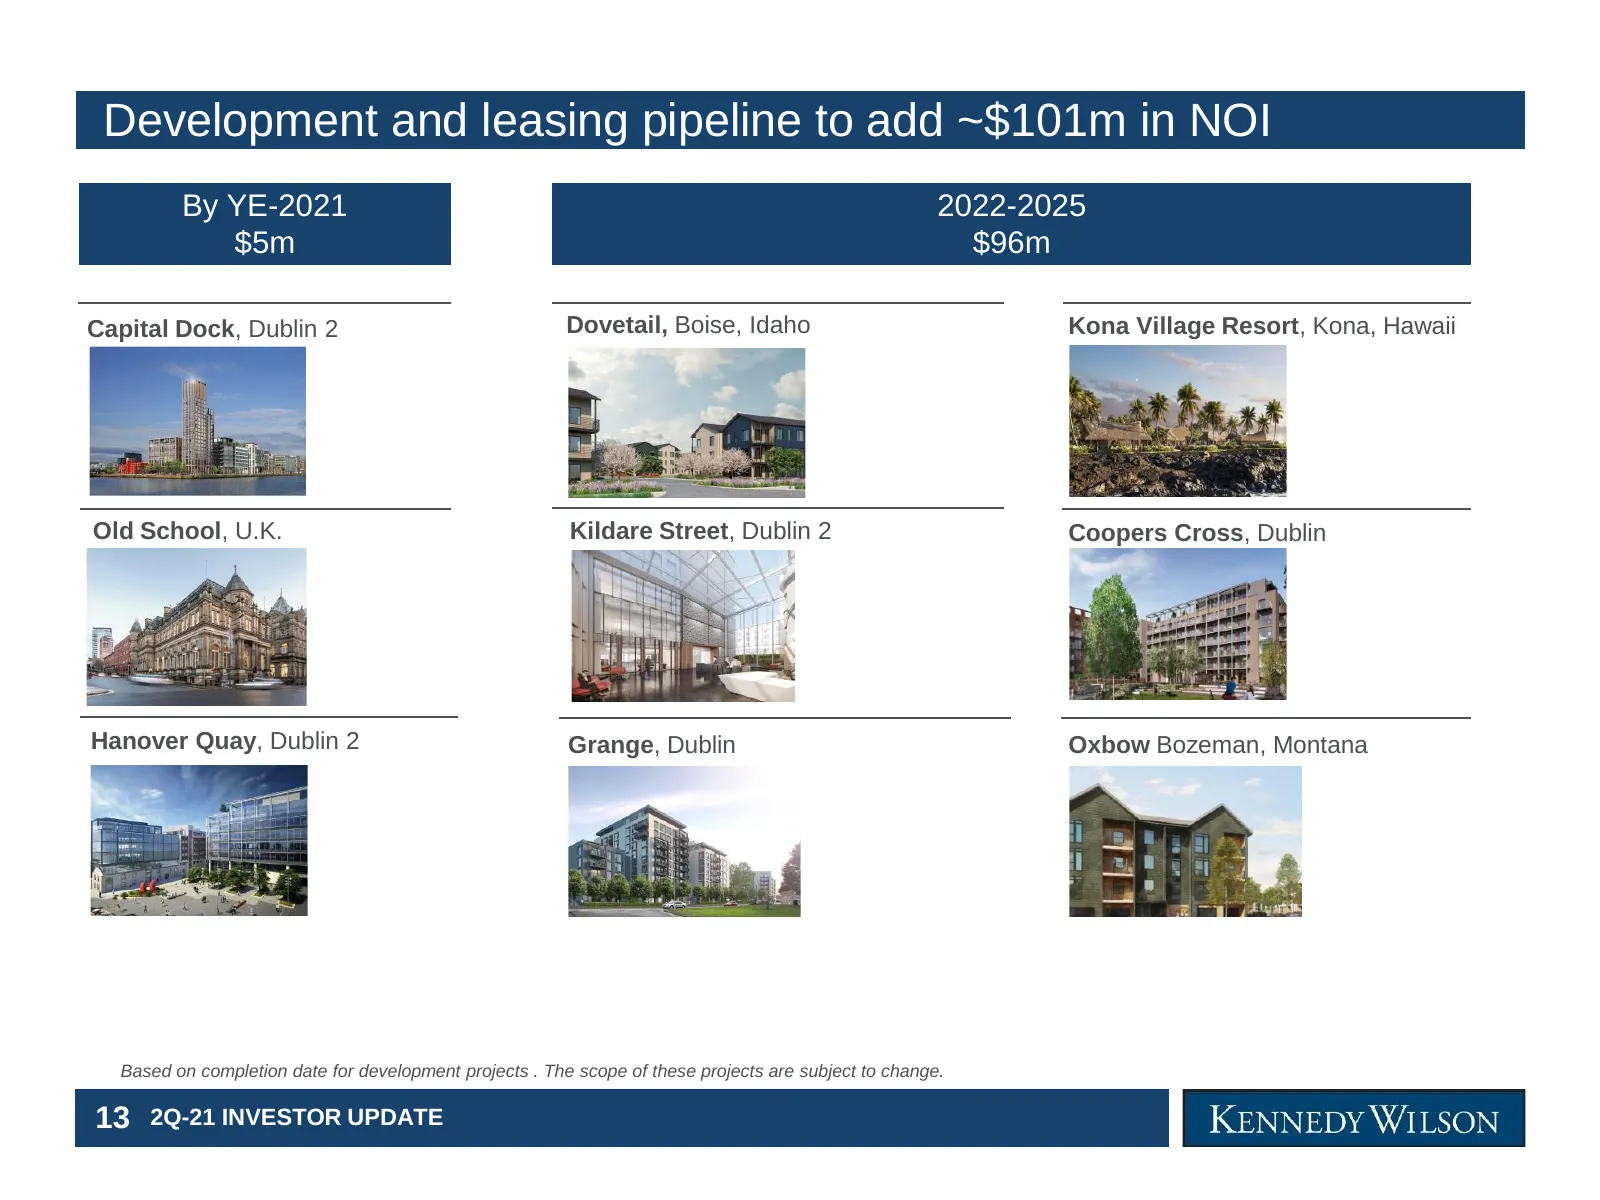
Slide 14: Development and leasing pipeline to add ~$101m in NOI
Development and leasing pipeline to add ~$101m in NOI By YE-2021 2022-2025 $5m $96m Capital Dock, Dublin 2 Dovetail, Boise, Idaho Kona Village Resort, Kona, Hawaii Old School, U.K. Kildare Street, Dublin 2 Coopers Cross, Dublin Hanover Quay, Dublin 2 Grange, Dublin Oxbow Bozeman, Montana Based on co
Slide 15: NOI delivery from completion of development & future leasing
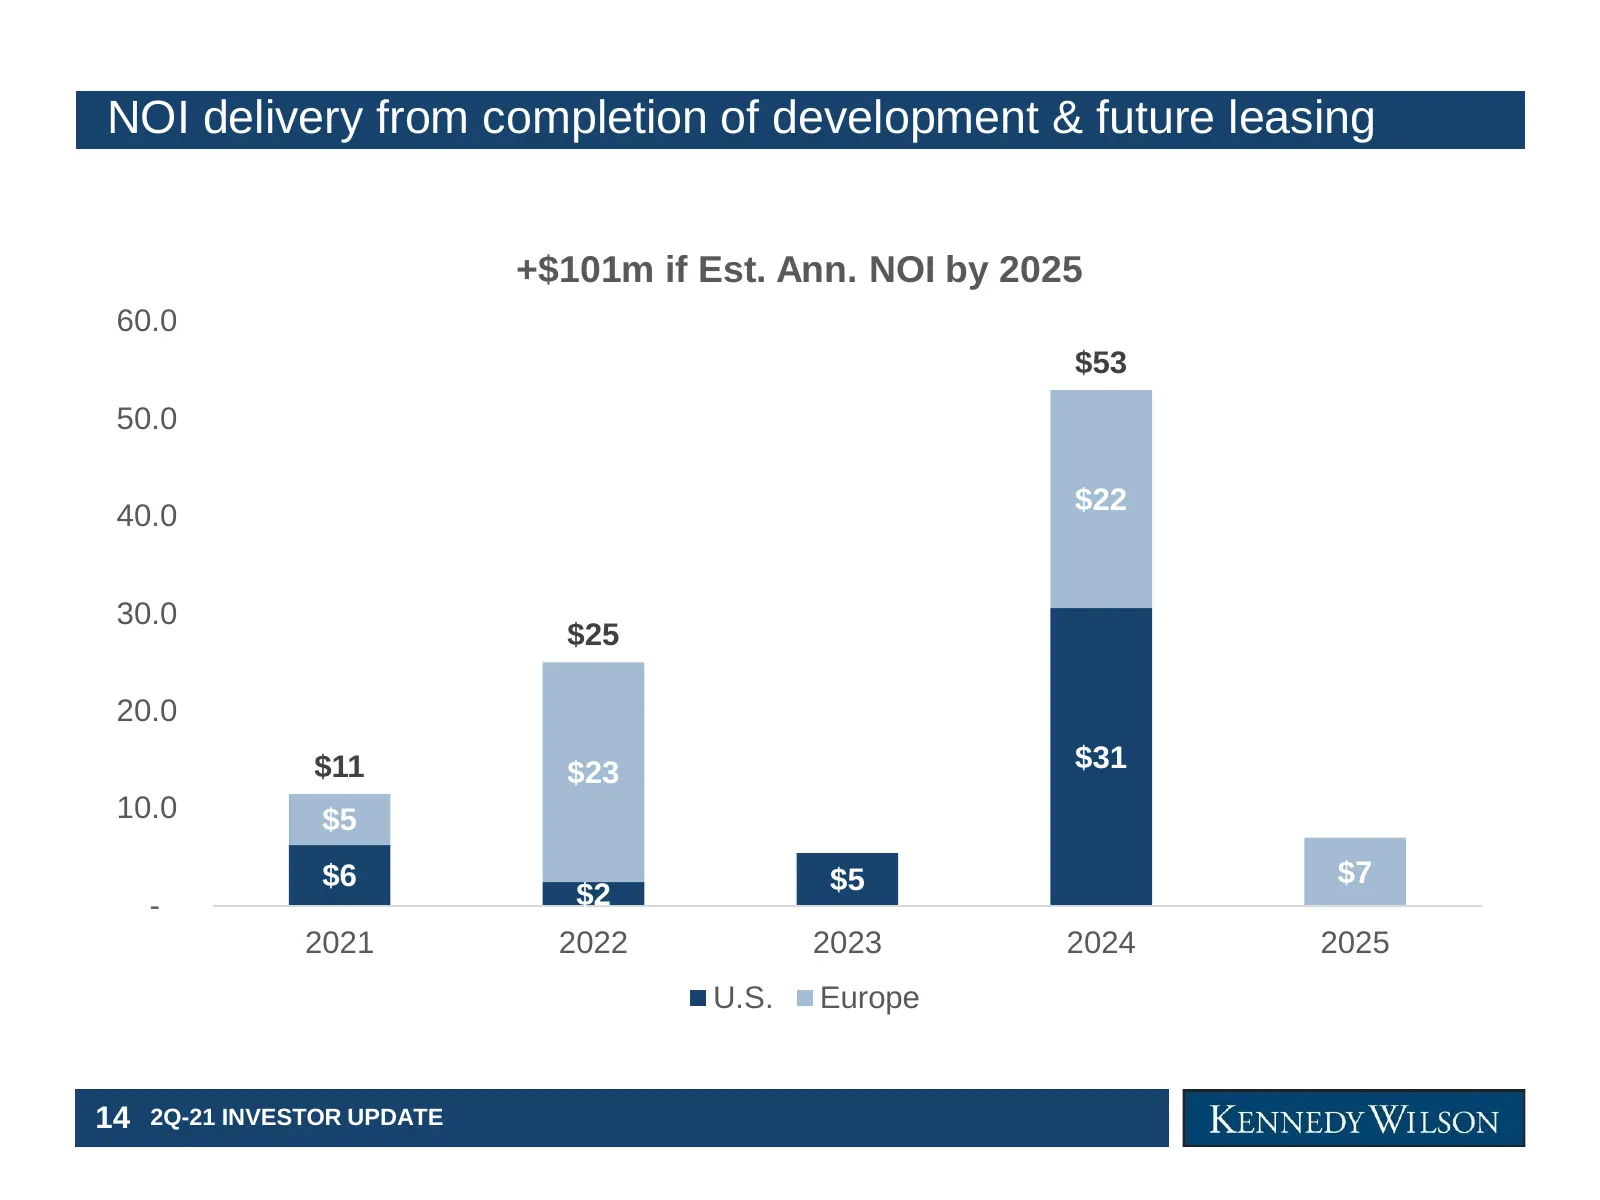
NOI delivery from completion of development & future leasing +$101m if Est. Ann. NOI by 2025 60.0 $53 50.0 $22 40.0 30.0 $25 20.0 $11 $23 $31 10.0 $5 $6 $5 $7 - $2 2021 2022 2023 2024 2025 U.S. Europe 14 2Q-21 INVESTOR UPDATE
Slide 16: Investment Management Platform
Investment Management Platform 15 2Q-21 INVESTOR UPDATE
Slide 17: Fee-Bearing Capital raised from broad institutional investor base
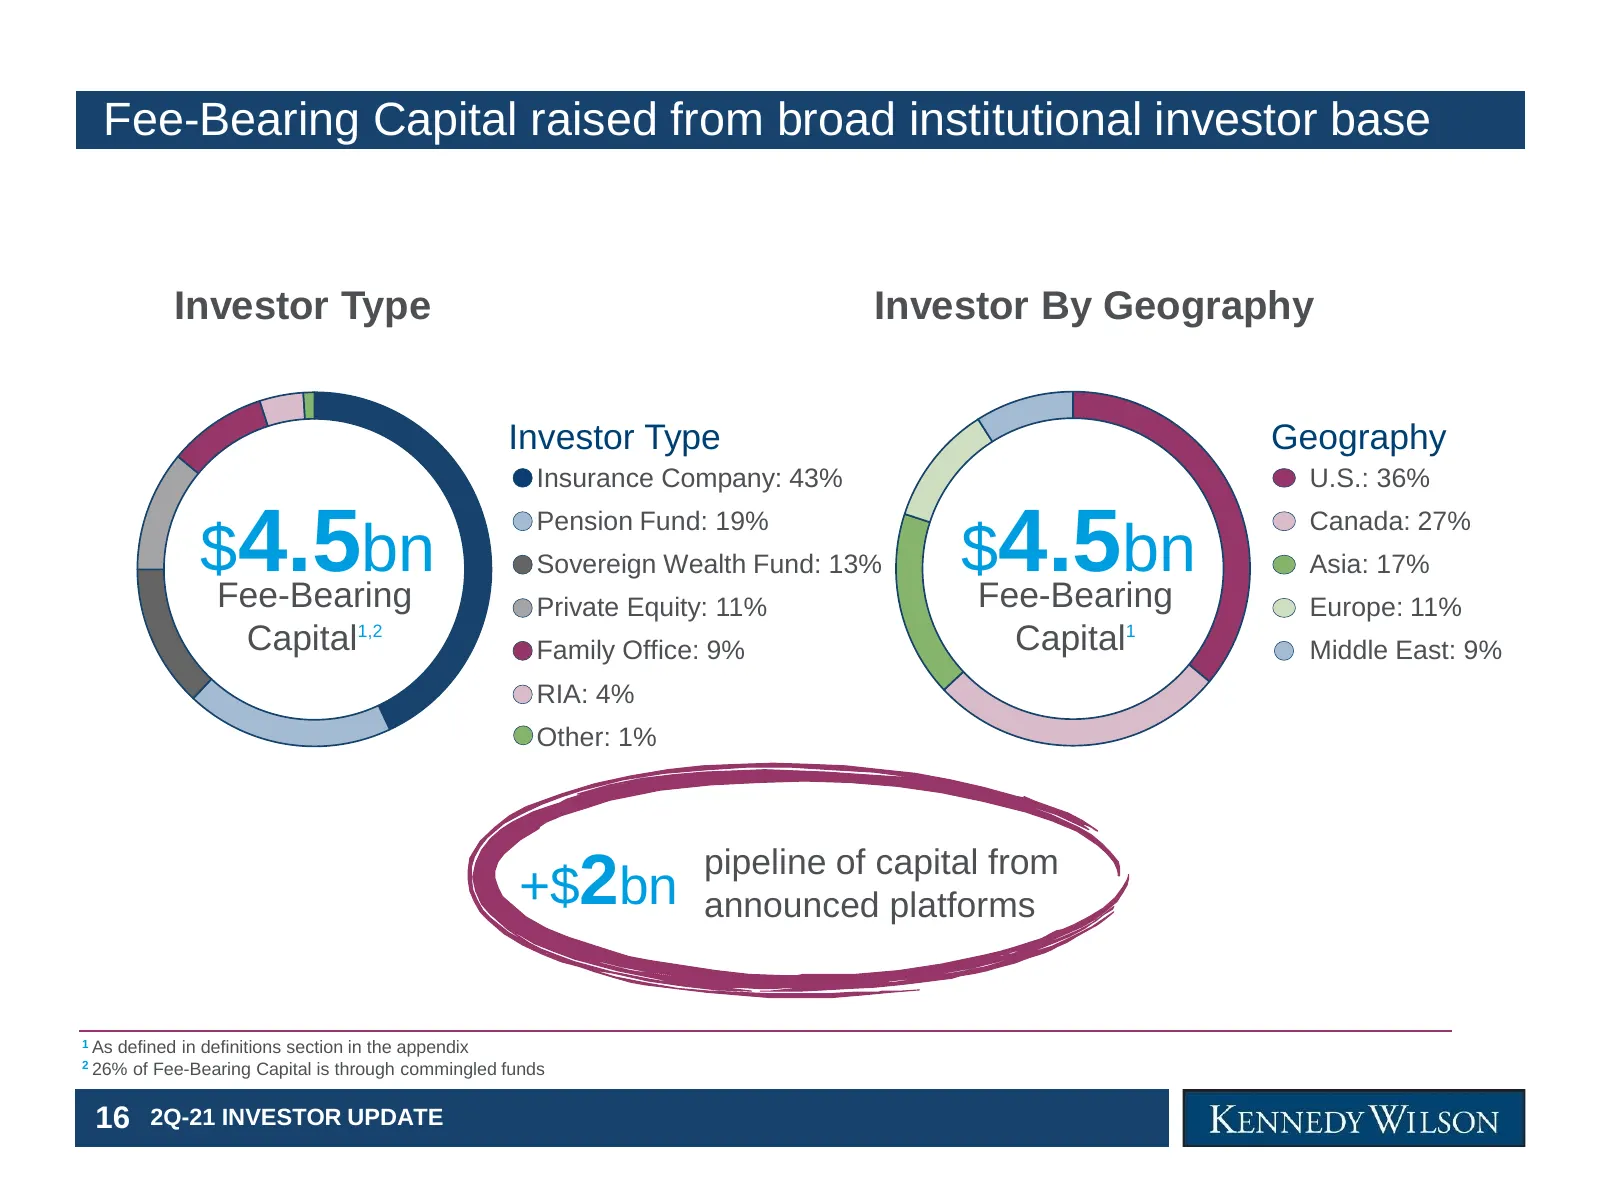
Fee-Bearing Capital raised from broad institutional investor base Investor Type Investor By Geography Investor Type Geography Insurance Company: 43% U.S.: 36% $4.5bn $4.5bn Pension Fund: 19% Canada: 27% Sovereign Wealth Fund: 13% Asia: 17% Fee-Bearing Private Equity: 11% Fee-Bearing Europe: 11% Capi
Slide 18: Financial Review
Overview Financial Review 17 2Q-21 INVESTOR UPDATE
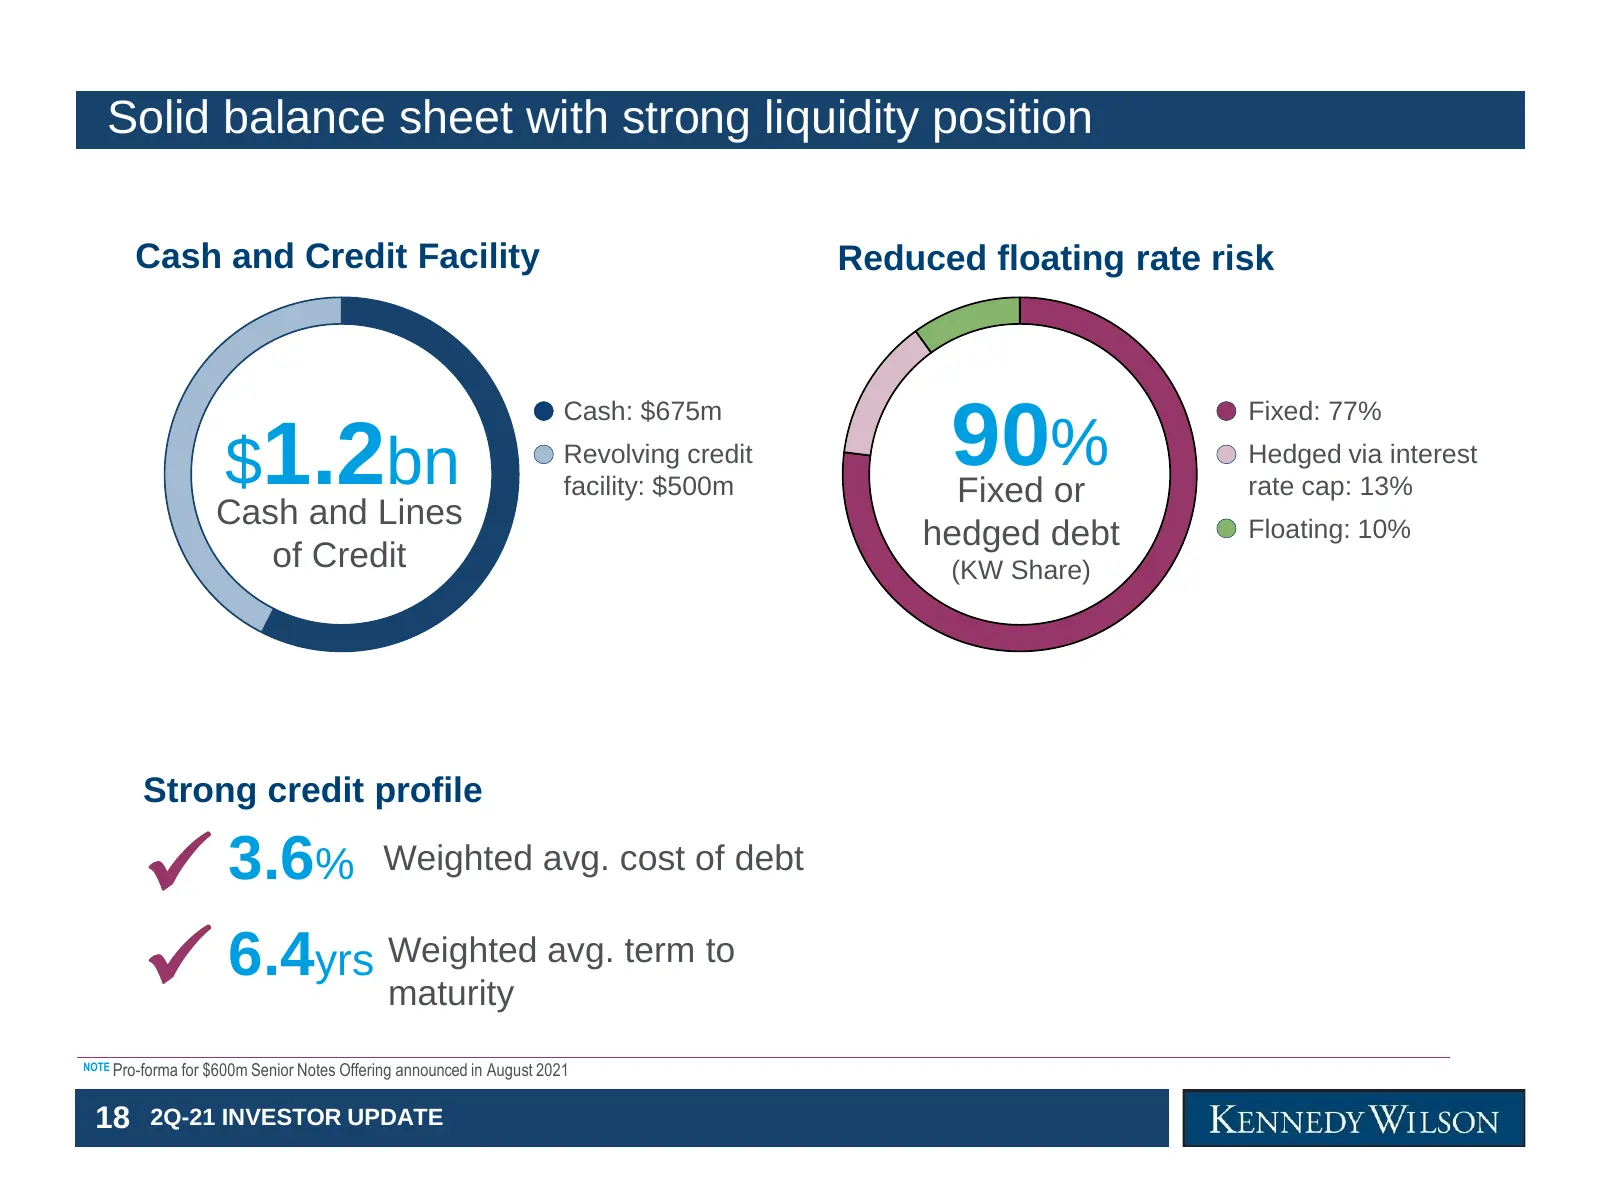
Slide 19: Solid balance sheet with strong liquidity position
Solid balance sheet with strong liquidity position Cash and Credit Facility Reduced floating rate risk Cash: $675m Fixed: 77% $1.2bn Revolving credit facility: $500m 90% Fixed or Hedged via interest rate cap: 13% Cash and Lines Floating: 10% hedged debt of Credit (KW Share) Strong credit profile ✓ 3
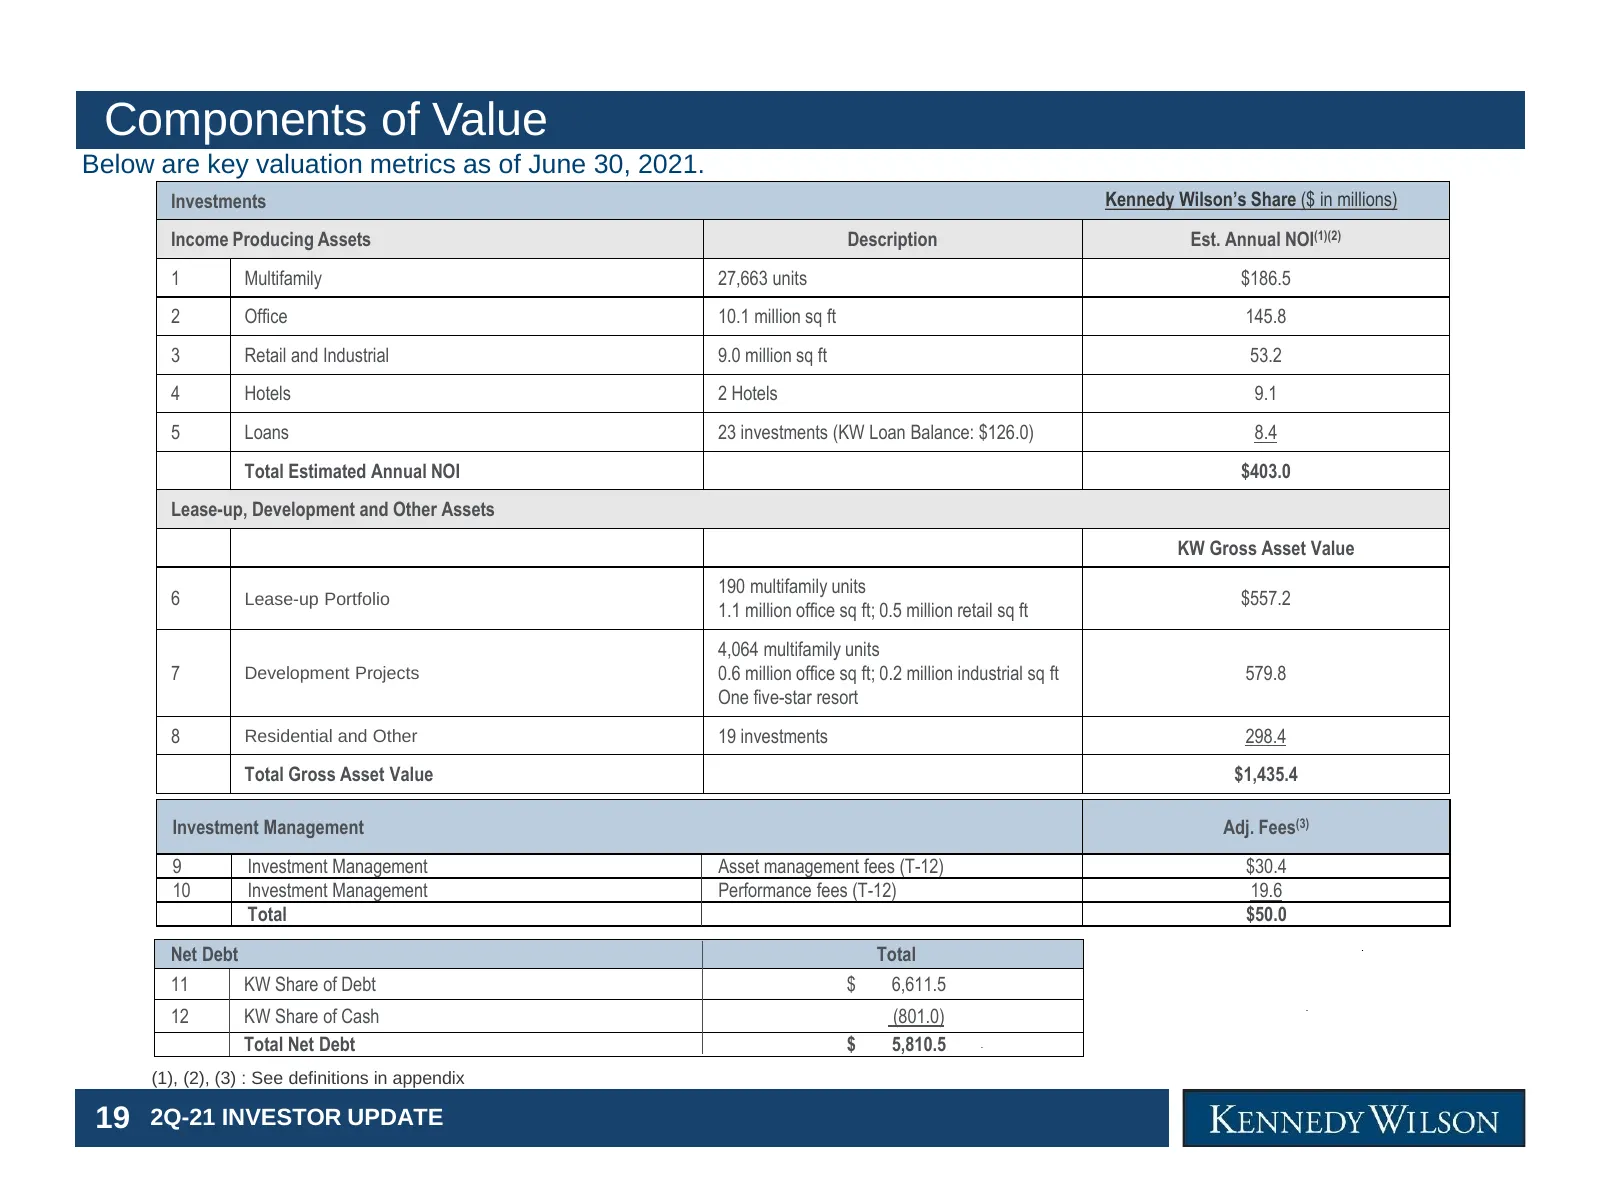
Slide 20: Components of Value
Components of Value Below are key valuation metrics as of June 30, 2021. Investments Kennedy Wilson’s Share ($ in millions) Income Producing Assets Description Est. Annual NOI(1)(2) 1 Multifamily 27,663 units $186.5 2 Office 10.1 million sq ft 145.8 3 Retail and Industrial 9.0 million sq ft 53.2 4 H
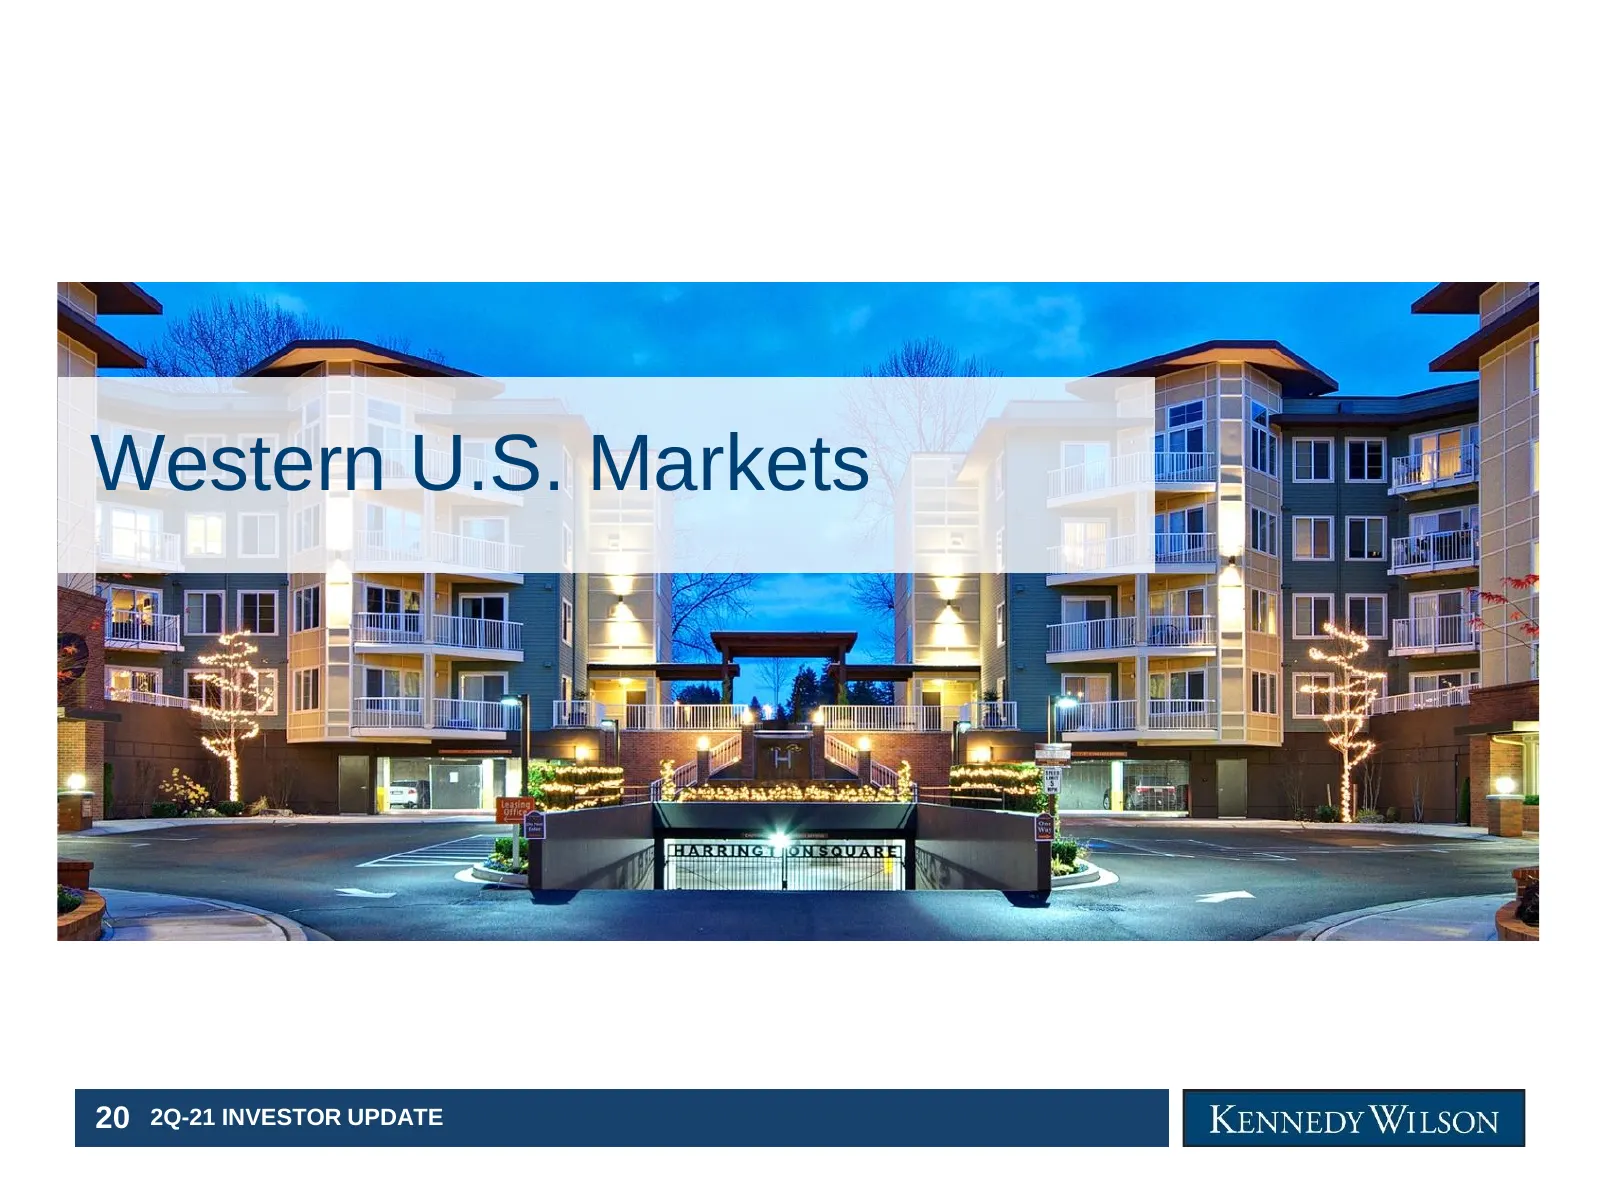
Slide 21: Western U.S. Markets
Western U.S. Markets 20 2Q-21 INVESTOR UPDATE
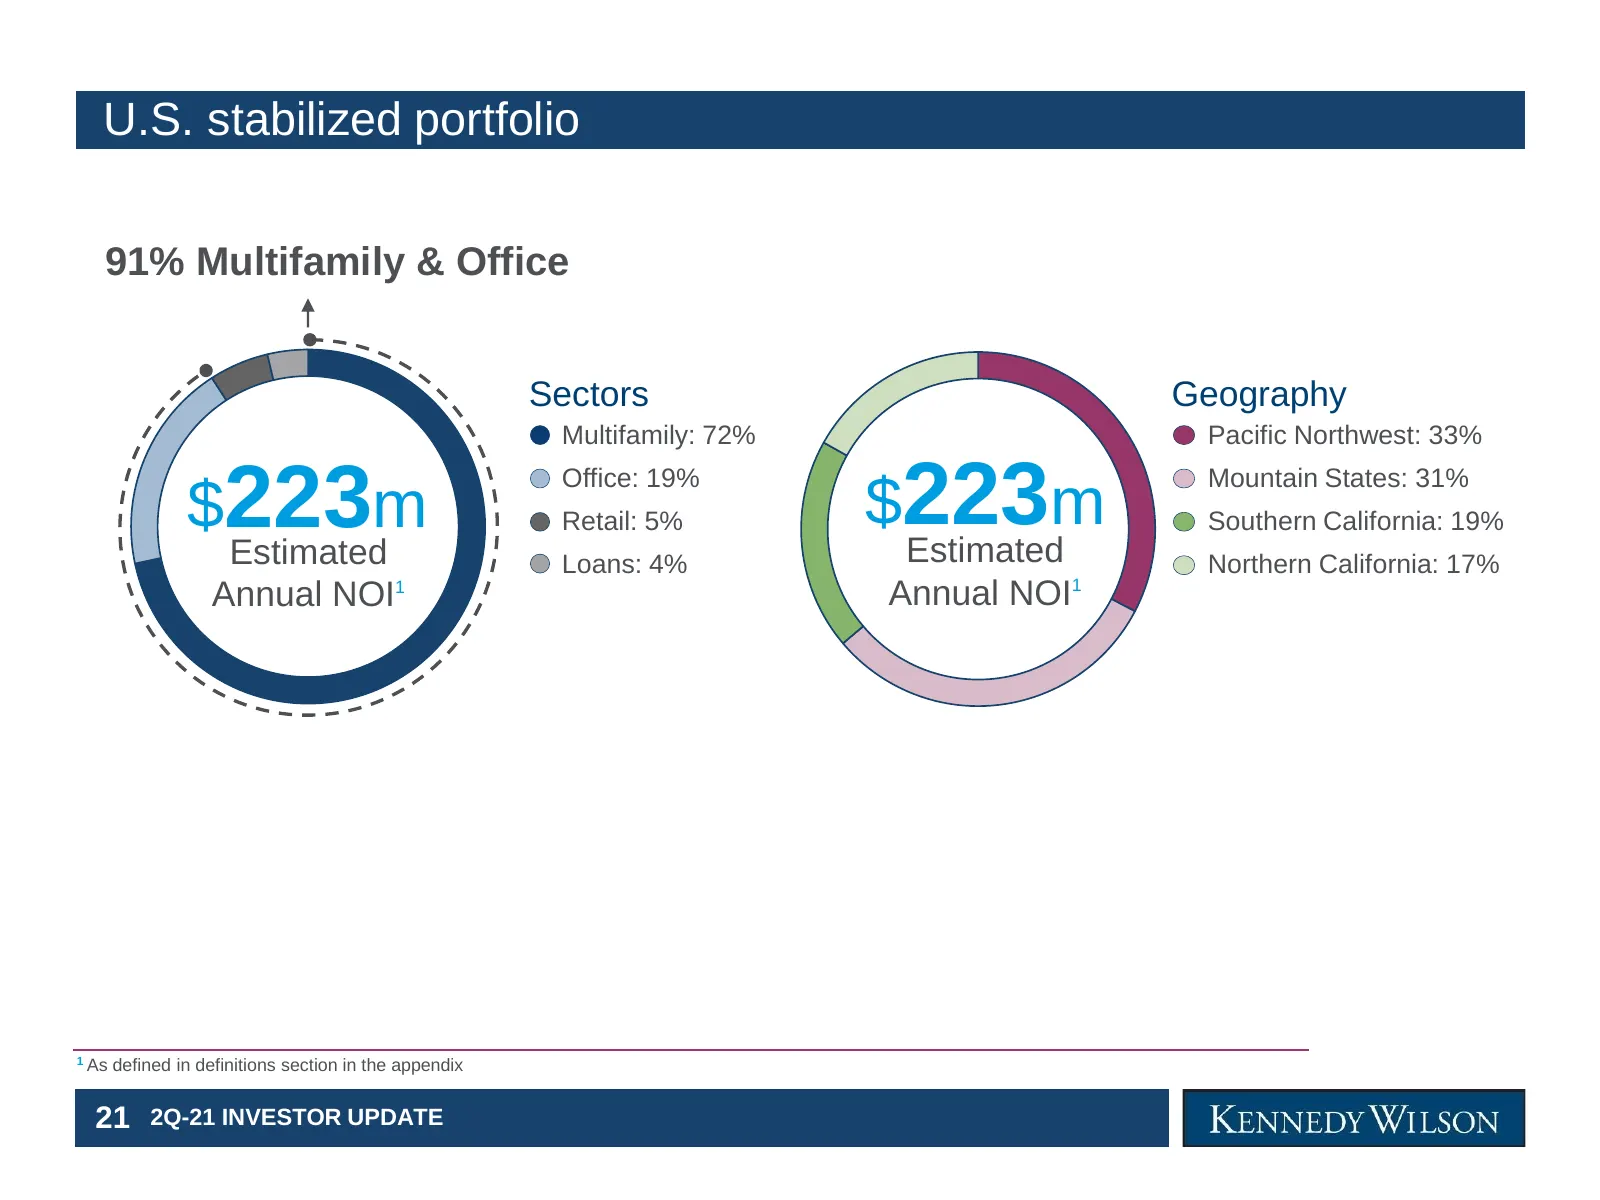
Slide 22: U.S. stabilized portfolio
U.S. stabilized portfolio 91% Multifamily & Office Sectors Geography Multifamily: 72% Pacific Northwest: 33% $223m $223m Office: 19% Mountain States: 31% Retail: 5% Southern California: 19% Estimated Loans: 4% Estimated Northern California: 17% Annual NOI1 Annual NOI1 1 As defined in definitions sec
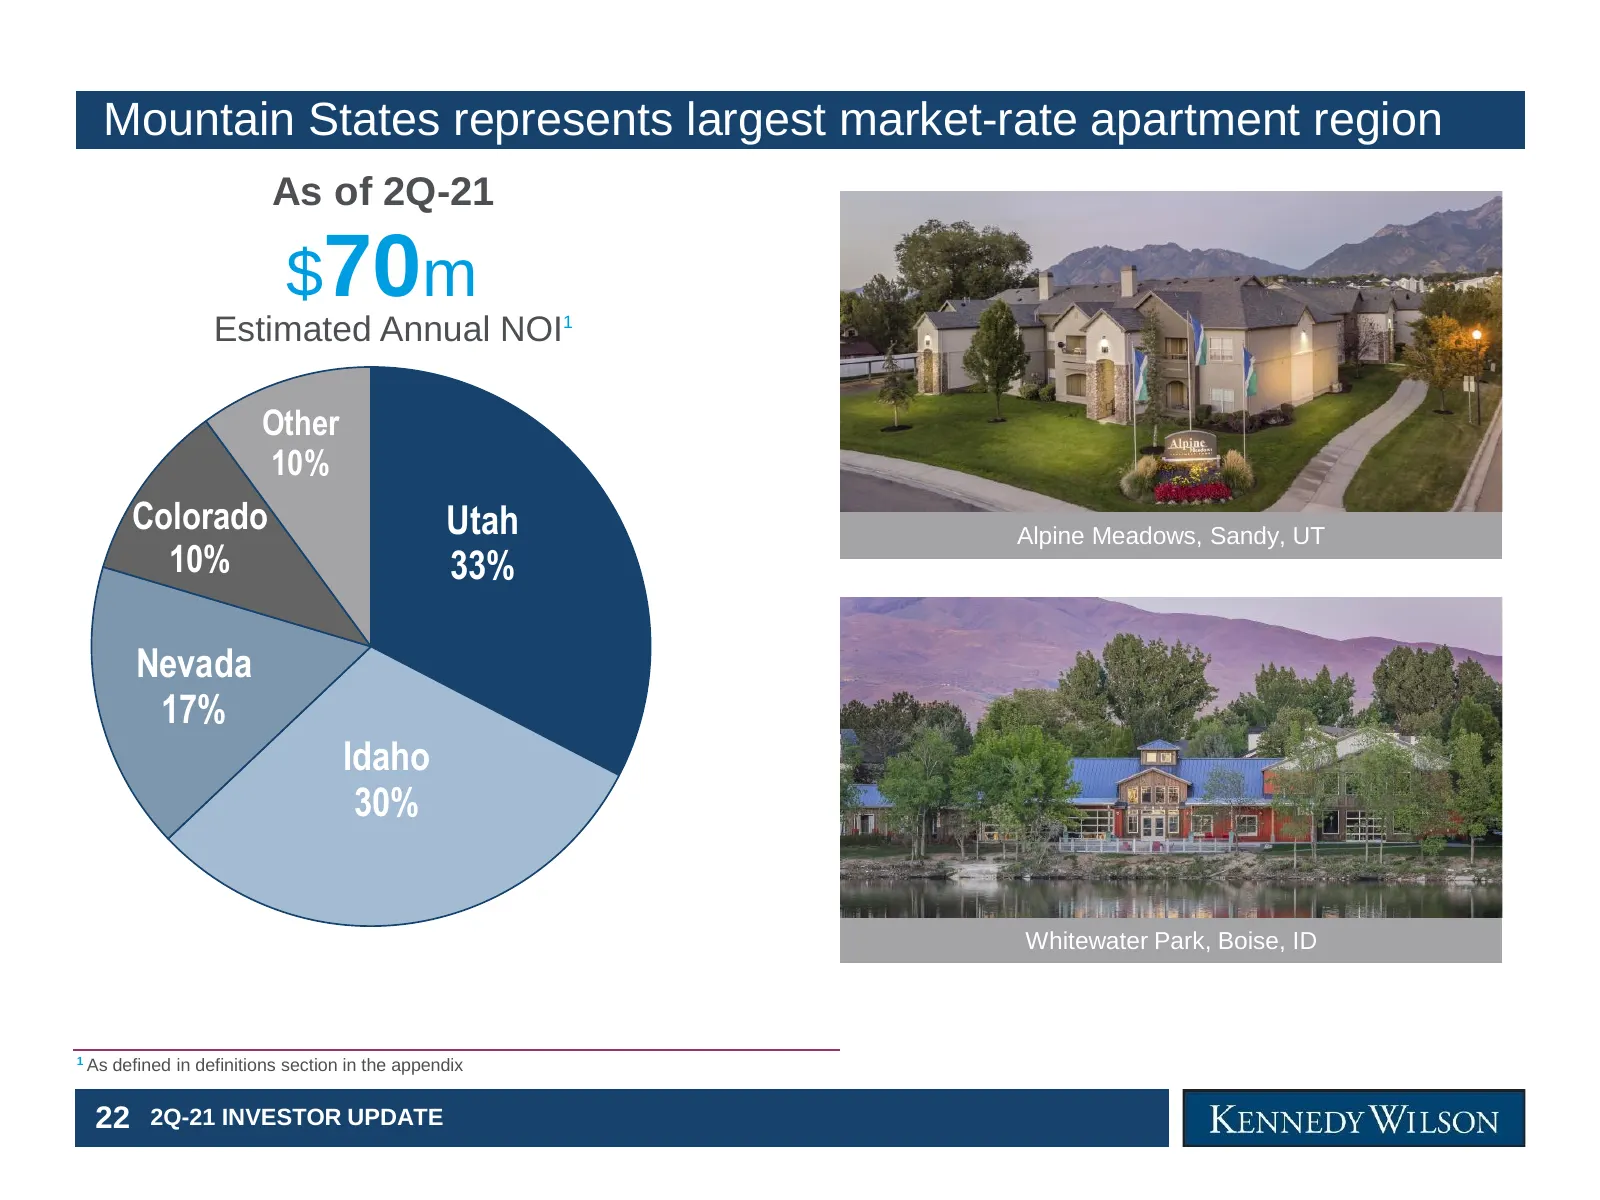
Slide 23: Mountain States represents largest market-rate apartment region
Mountain States represents largest market-rate apartment region As of 2Q-21 $70m Estimated Annual NOI1 Other 10% Colorado Utah Alpine Meadows, Sandy, UT 10% 33% Nevada 17% Idaho 30% Whitewater Park, Boise, ID 1 As defined in definitions section in the appendix 22 2Q-21 INVESTOR UPDATE
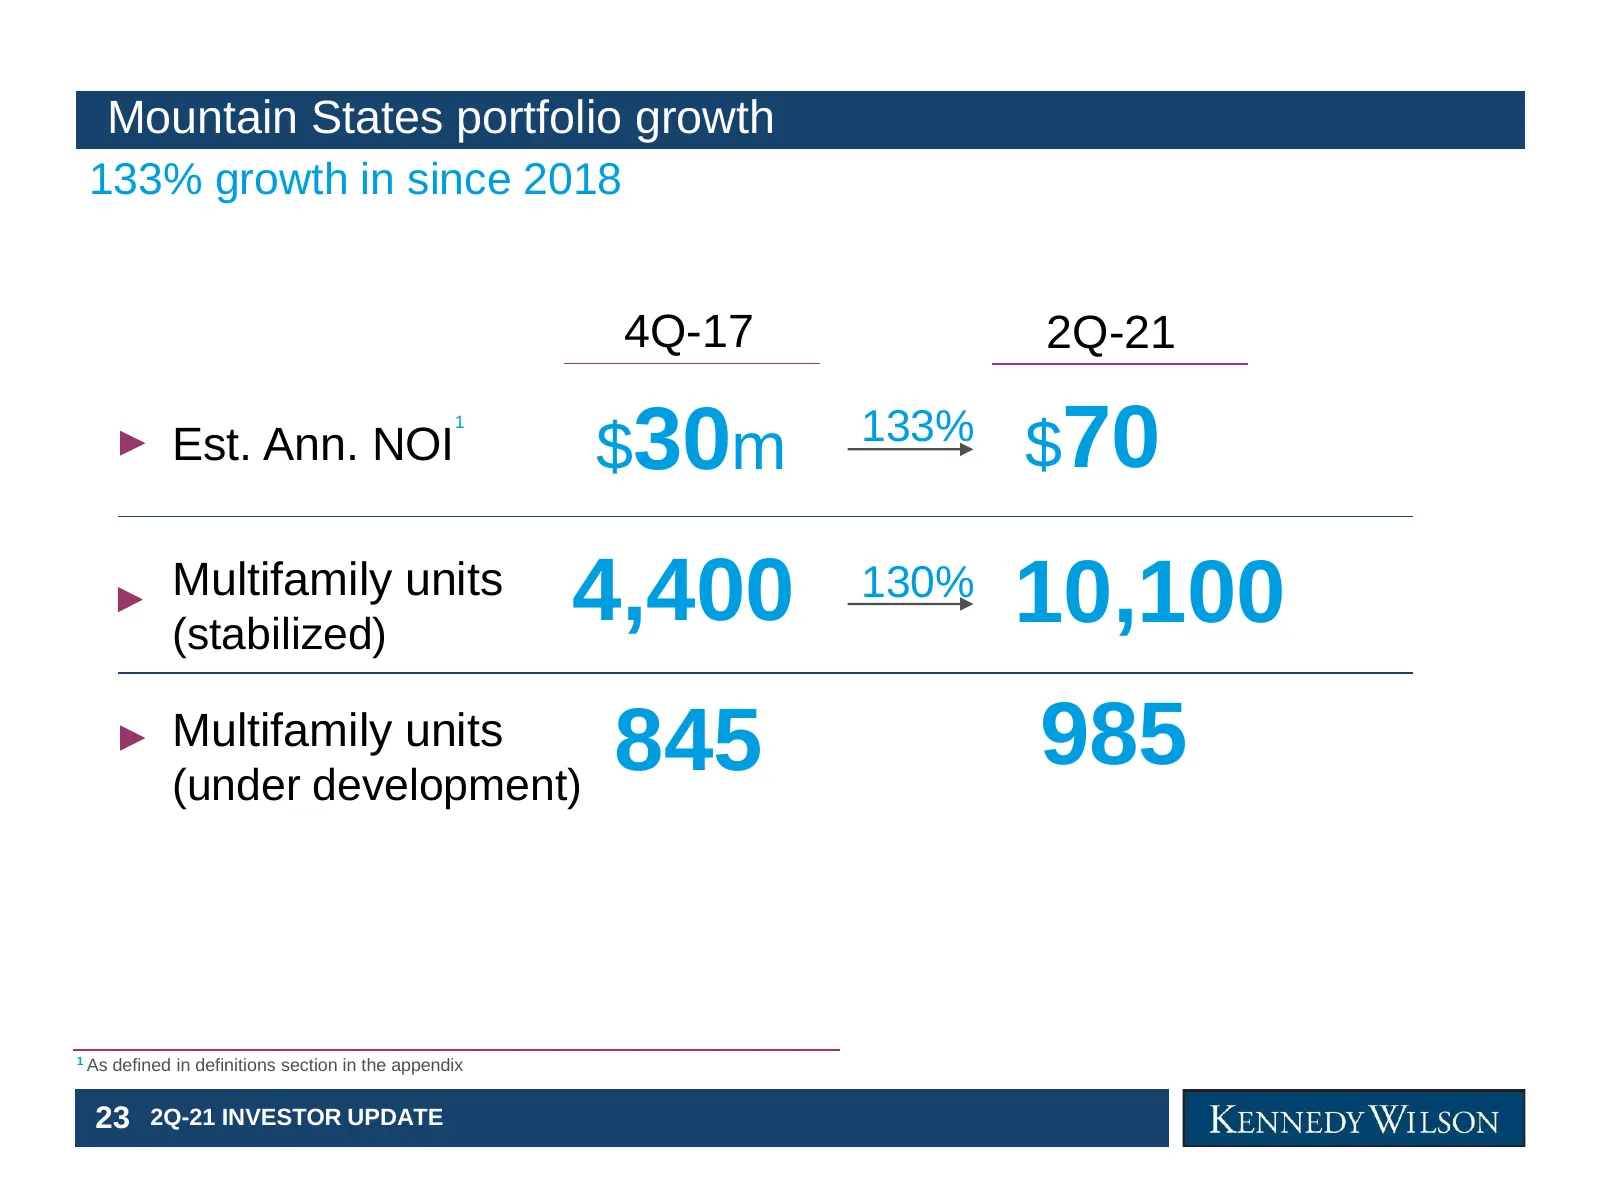
Slide 24: Mountain States portfolio growth
Mountain States portfolio growth 133% growth in since 2018 4Q-17 2Q-21 $30m 133% $70 1 Est. Ann. NOI Multifamily units (stabilized) 4,400 130% 10,100 Multifamily units (under development) 845 985 1 As defined in definitions section in the appendix 23 2Q-21 INVESTOR UPDATE
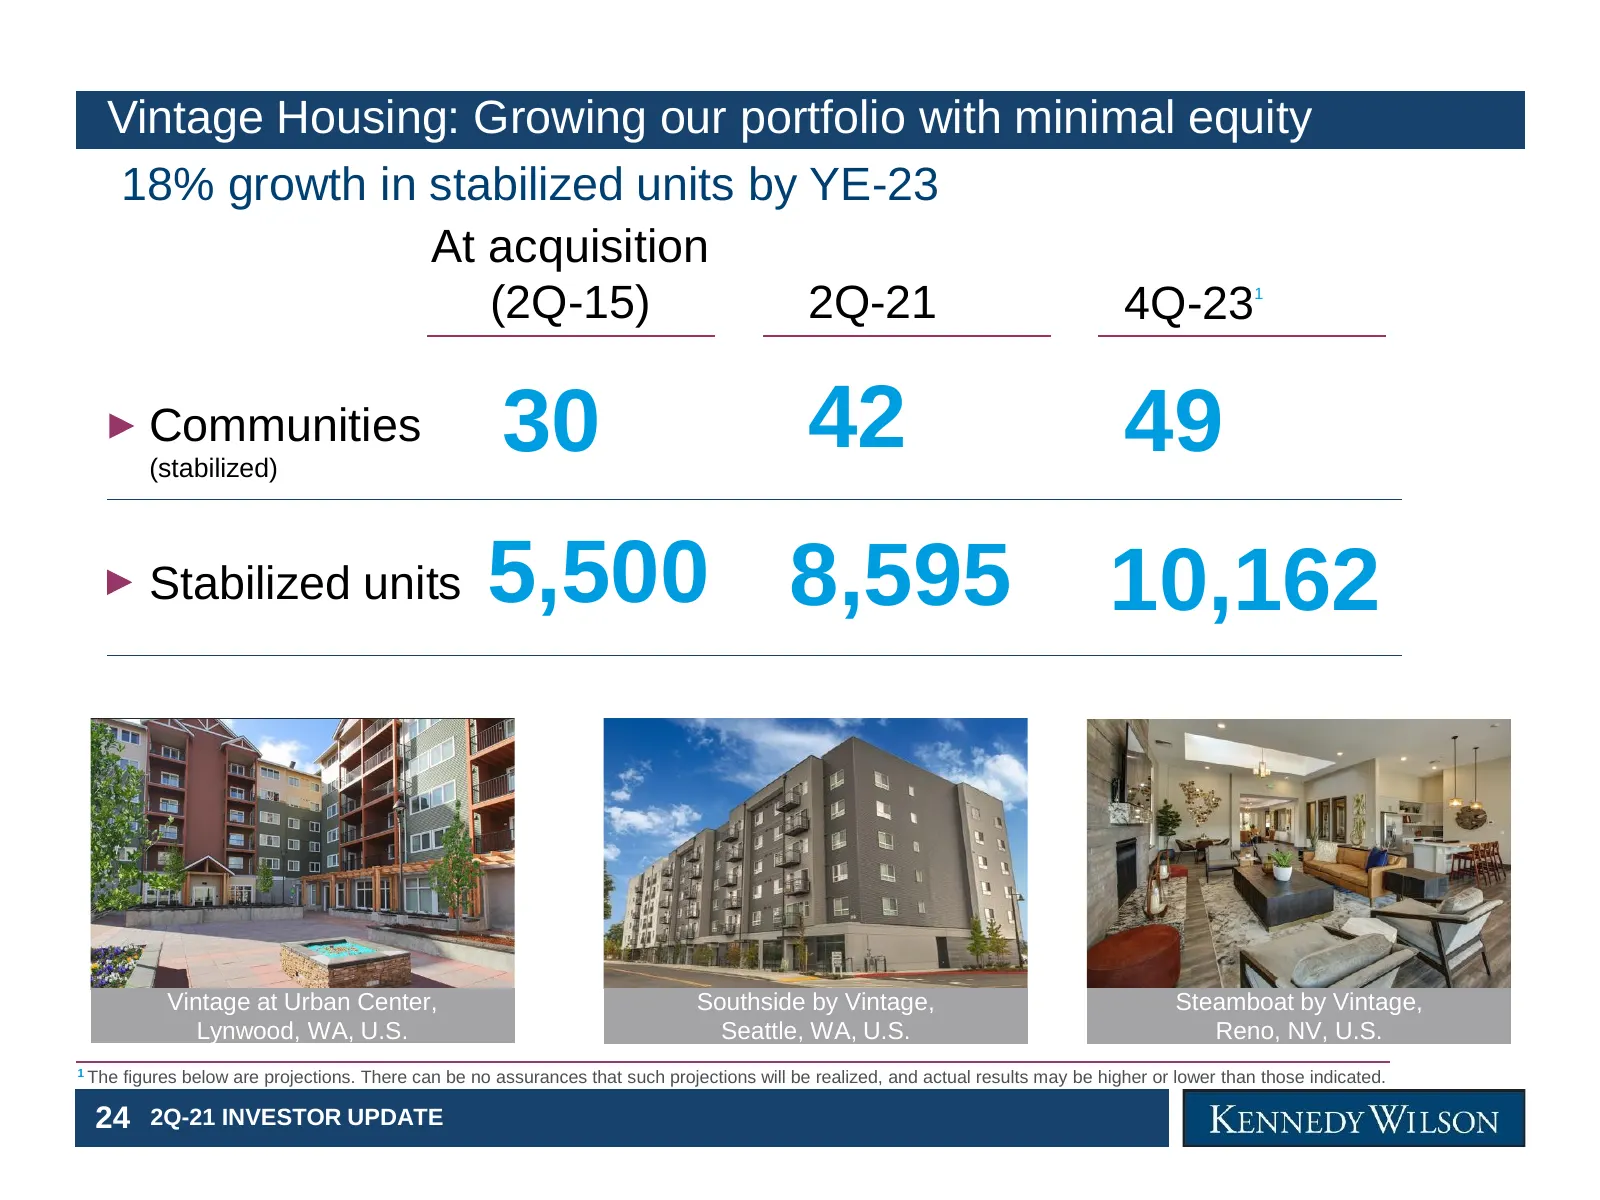
Slide 25: Vintage Housing: Growing our portfolio with minimal equity
Vintage Housing: Growing our portfolio with minimal equity 18% growth in stabilized units by YE-23 At acquisition (2Q-15) 2Q-21 4Q-23 1 Communities (stabilized) 30 42 49 Stabilized units 5,500 8,595 10,162 Vintage at Urban Center, Southside by Vintage, Steamboat by Vintage, Lynwood, WA, U.S. Seattle
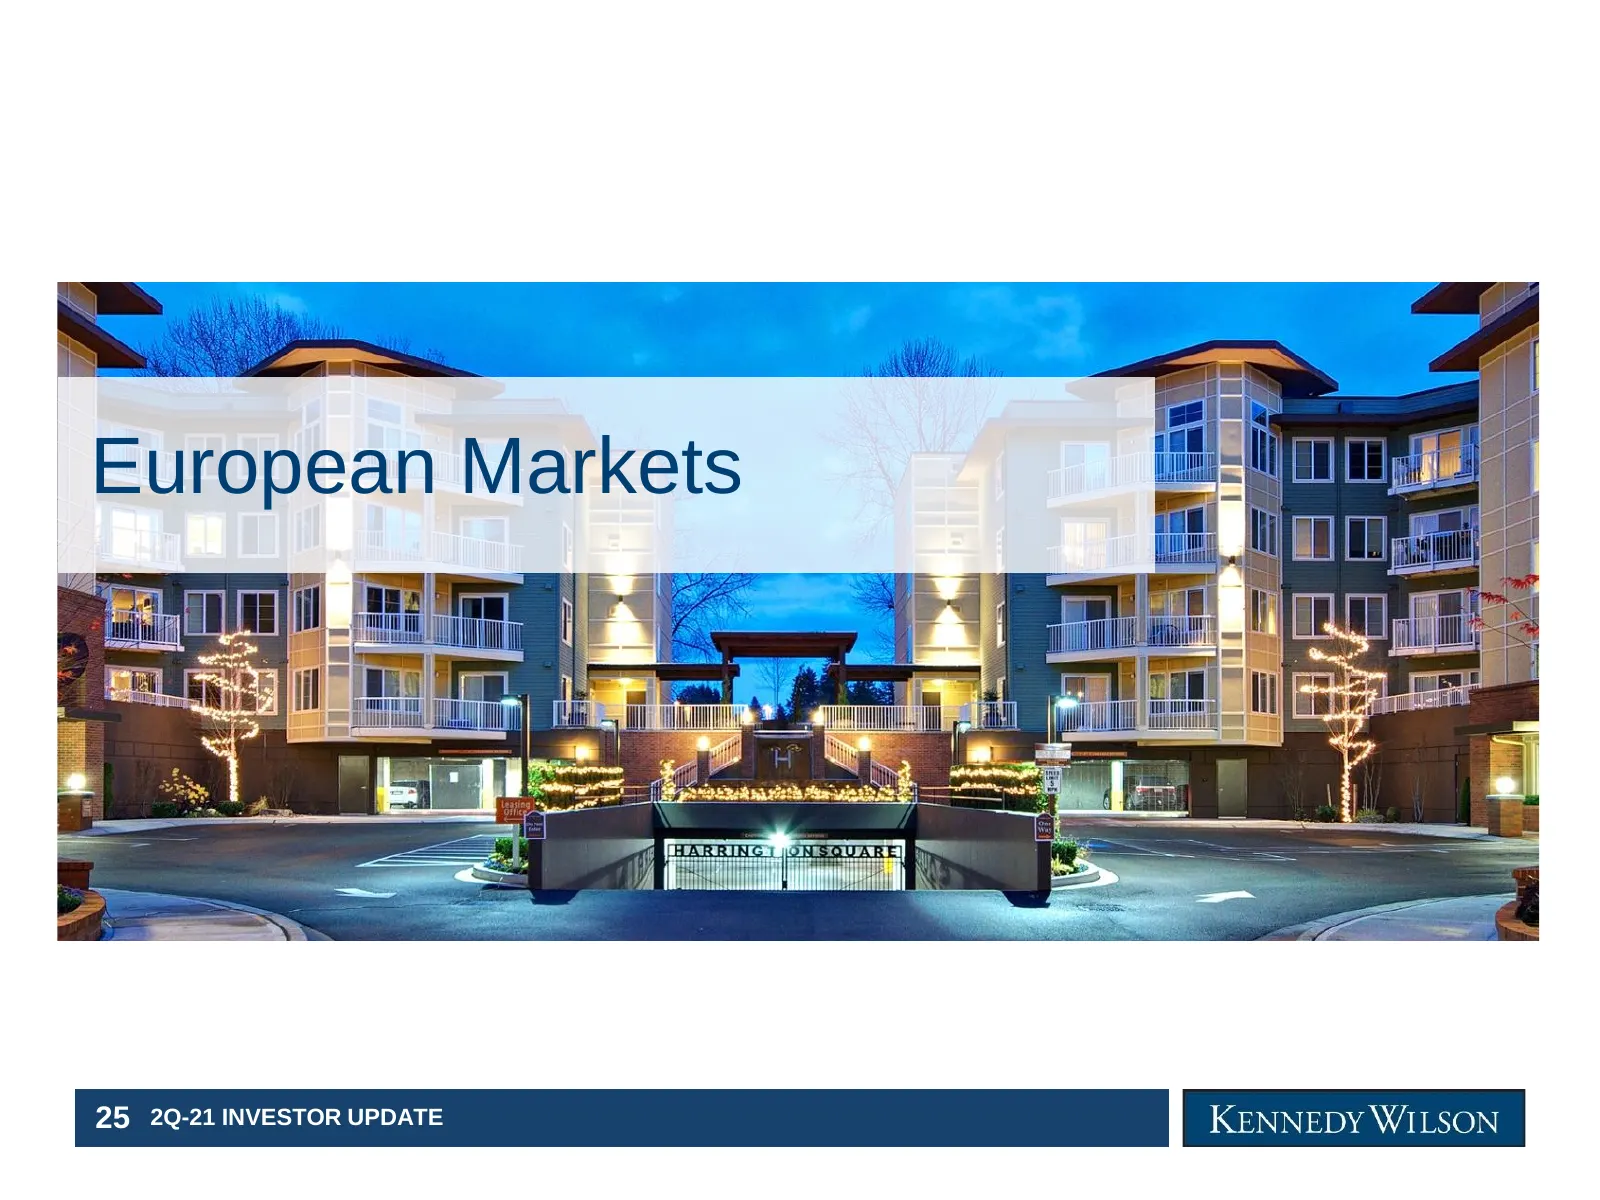
Slide 26: European Markets
European Markets 25 2Q-21 INVESTOR UPDATE
Slide 27: Europe stabilized portfolio
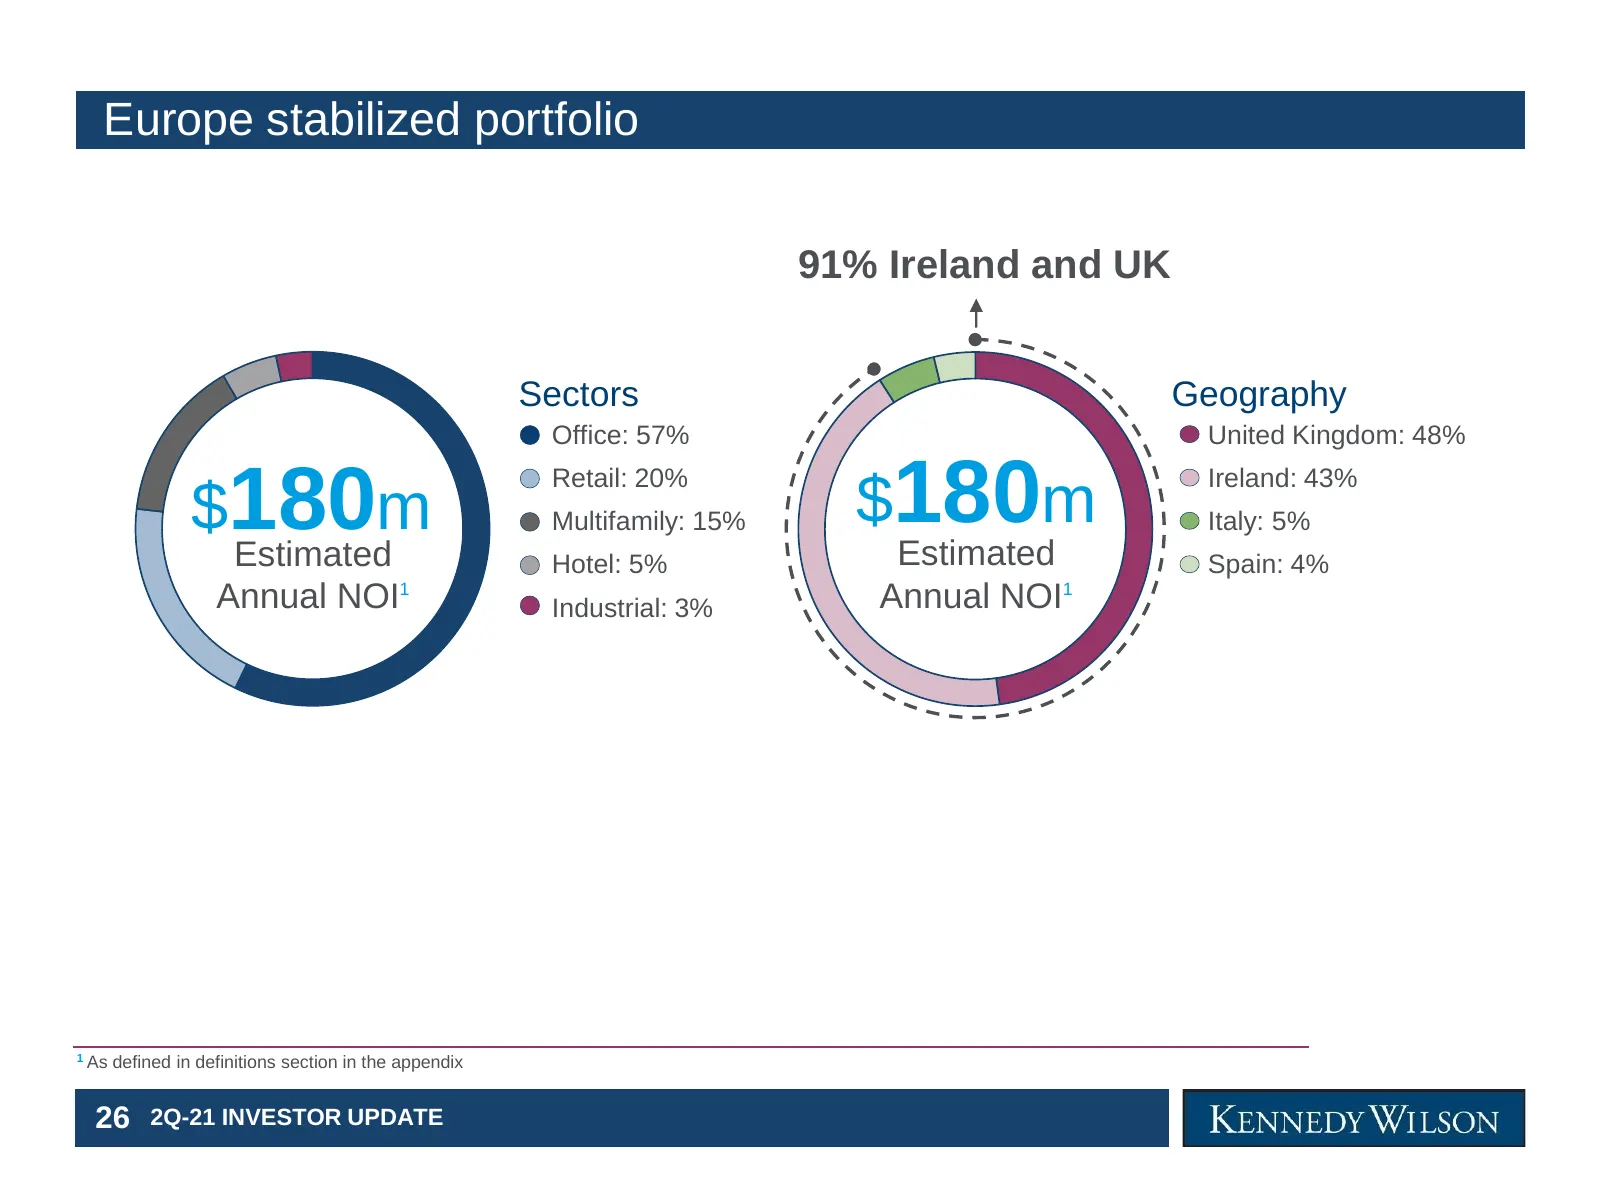
Europe stabilized portfolio 91% Ireland and UK Sectors Geography Office: 57% United Kingdom: 48% $180m $180m Retail: 20% Ireland: 43% Multifamily: 15% Italy: 5% Estimated Hotel: 5% Estimated Spain: 4% Annual NOI1 Industrial: 3% Annual NOI1 1 As defined in definitions section in the appendix 26 2Q-21
Slide 28: Irish multifamily: market imbalance creates opportunity
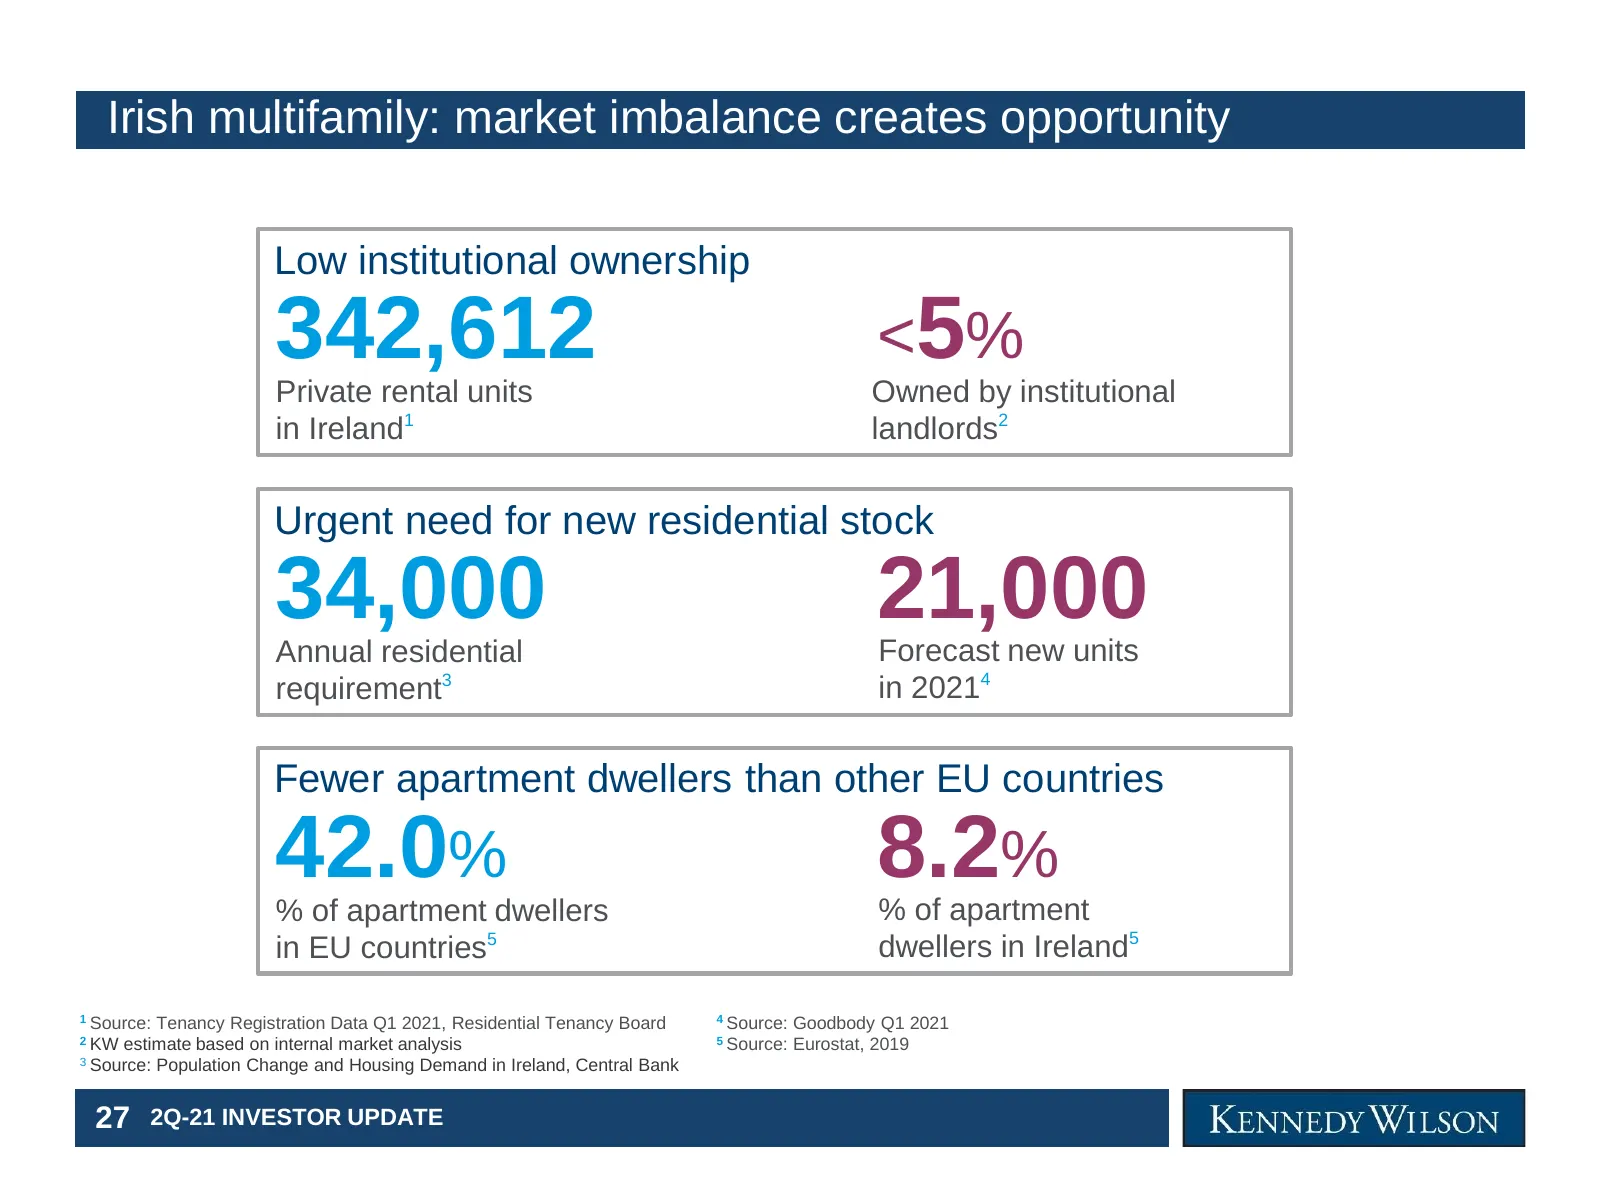
Irish multifamily: market imbalance creates opportunity Low institutional ownership 342,612 Private rental units <5% Owned by institutional in Ireland1 landlords2 Urgent need for new residential stock 34,000 Annual residential 21,000 Forecast new units requirement3 in 20214 Fewer apartment dwellers
Slide 29: Ireland: KW's dominant presence in Dublin
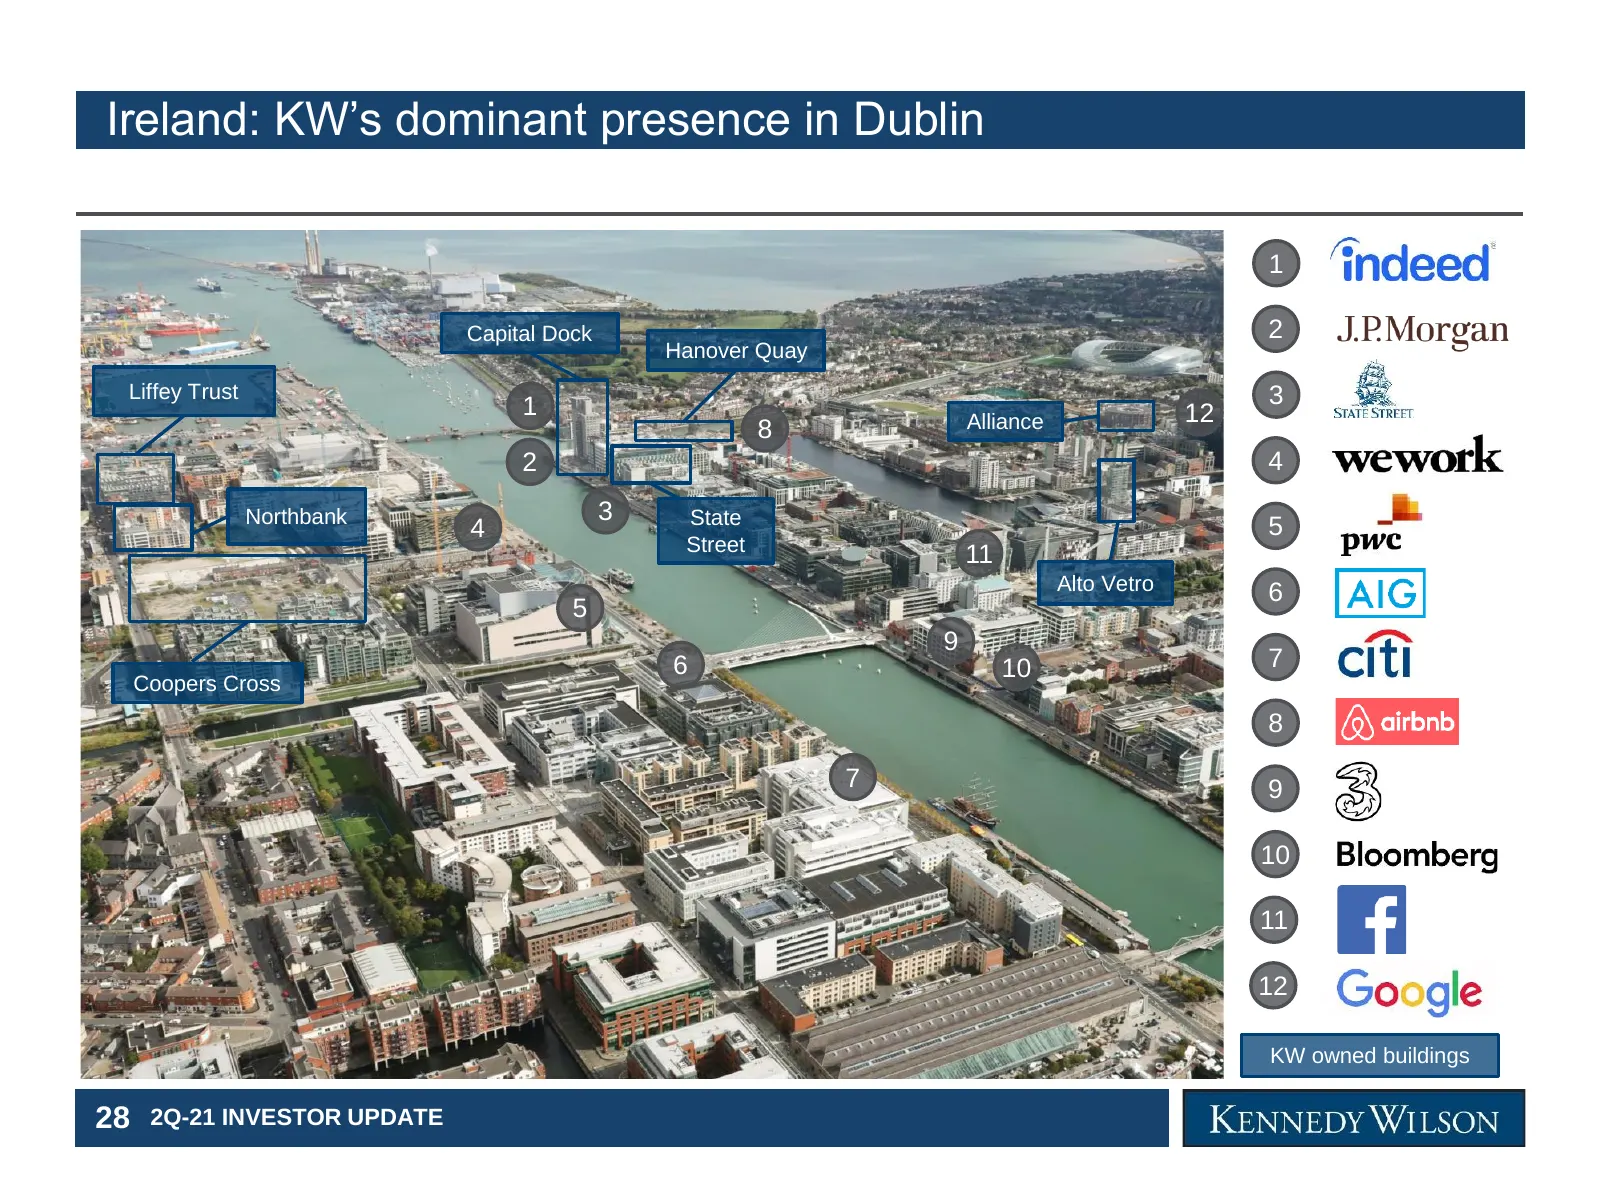
Ireland: KW’s dominant presence in Dublin 1 Capital Dock 2 Hanover Quay Liffey Trust 3 1 12 8 Alliance 2 4 Northbank 3 State 4 5 Street 11 Alto Vetro 6 5 9 6 10 7 Coopers Cross 8 7 9 10 11 12 KW owned buildings 28 2Q-21 INVESTOR UPDATE
Slide 30: Ireland: resilient growth market opportunity
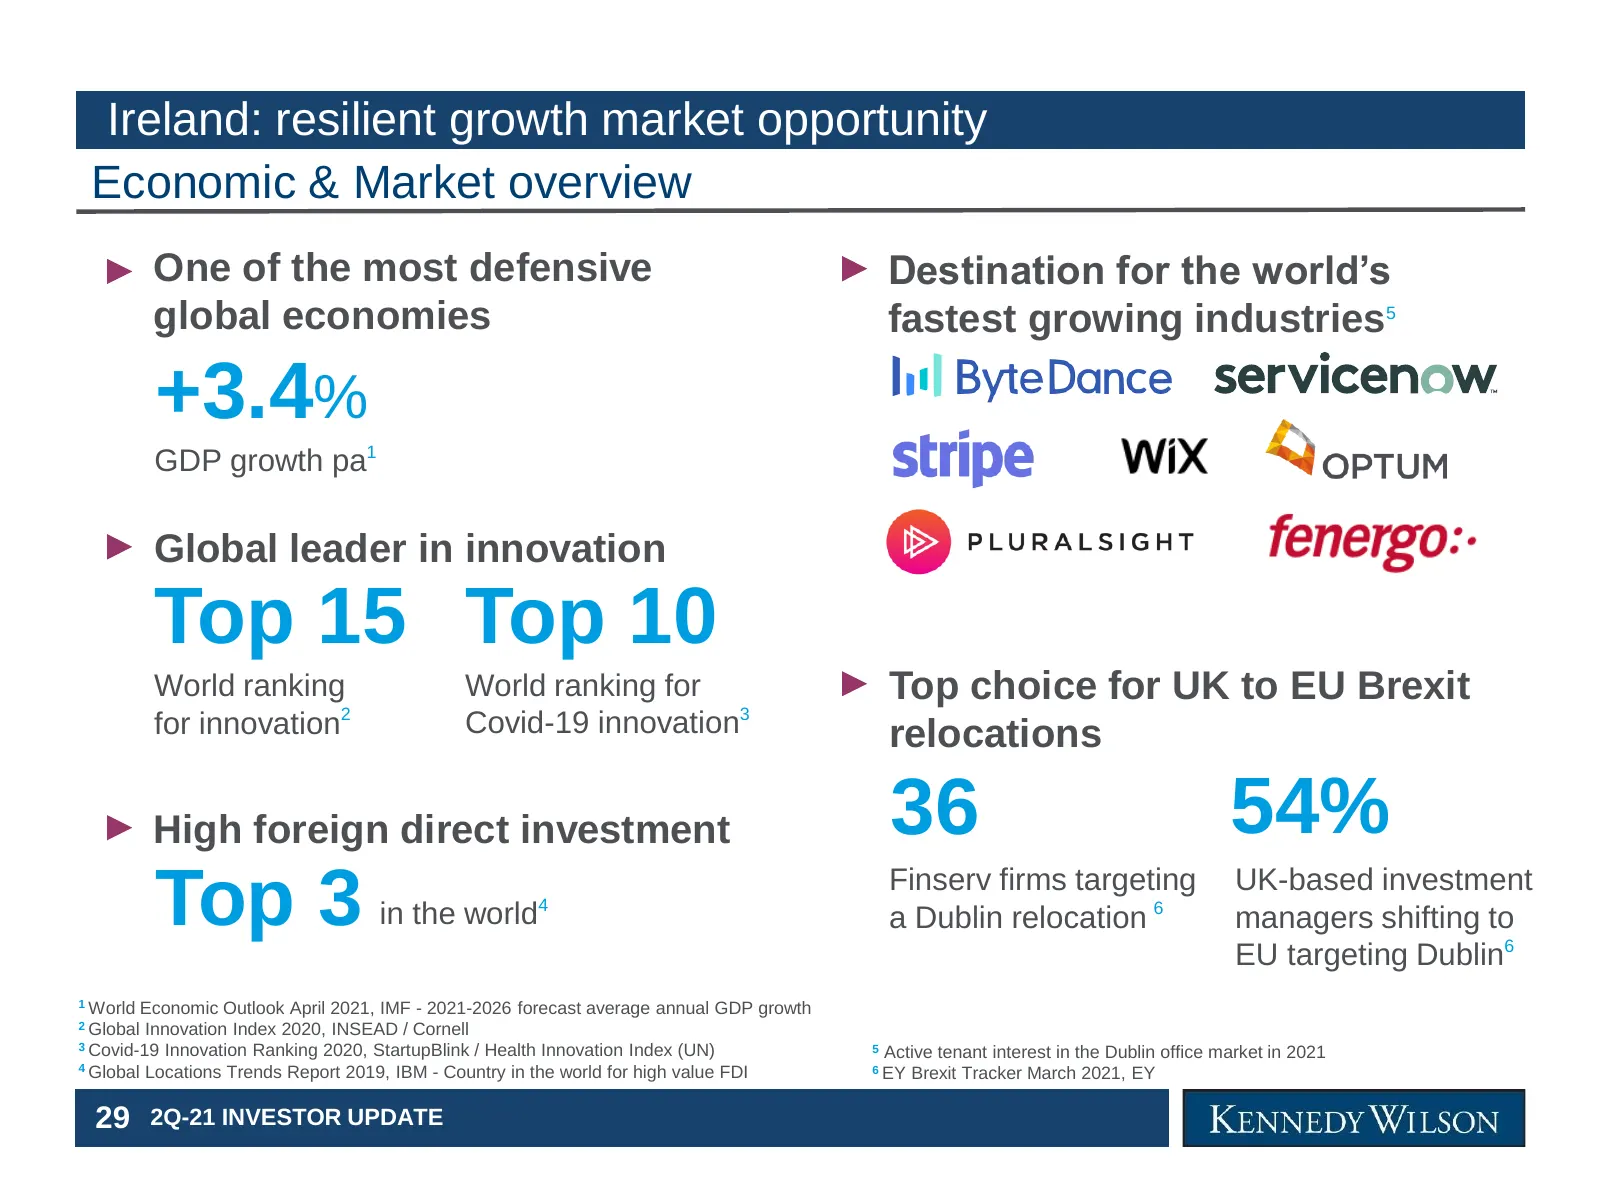
Ireland: resilient growth market opportunity Economic & Market overview One of the most defensive Destination for the world’s global economies fastest growing industries5 +3.4% GDP growth pa1 Global leader in innovation Top 15 Top 10 World ranking World ranking for Top choice for UK to EU Brexit for
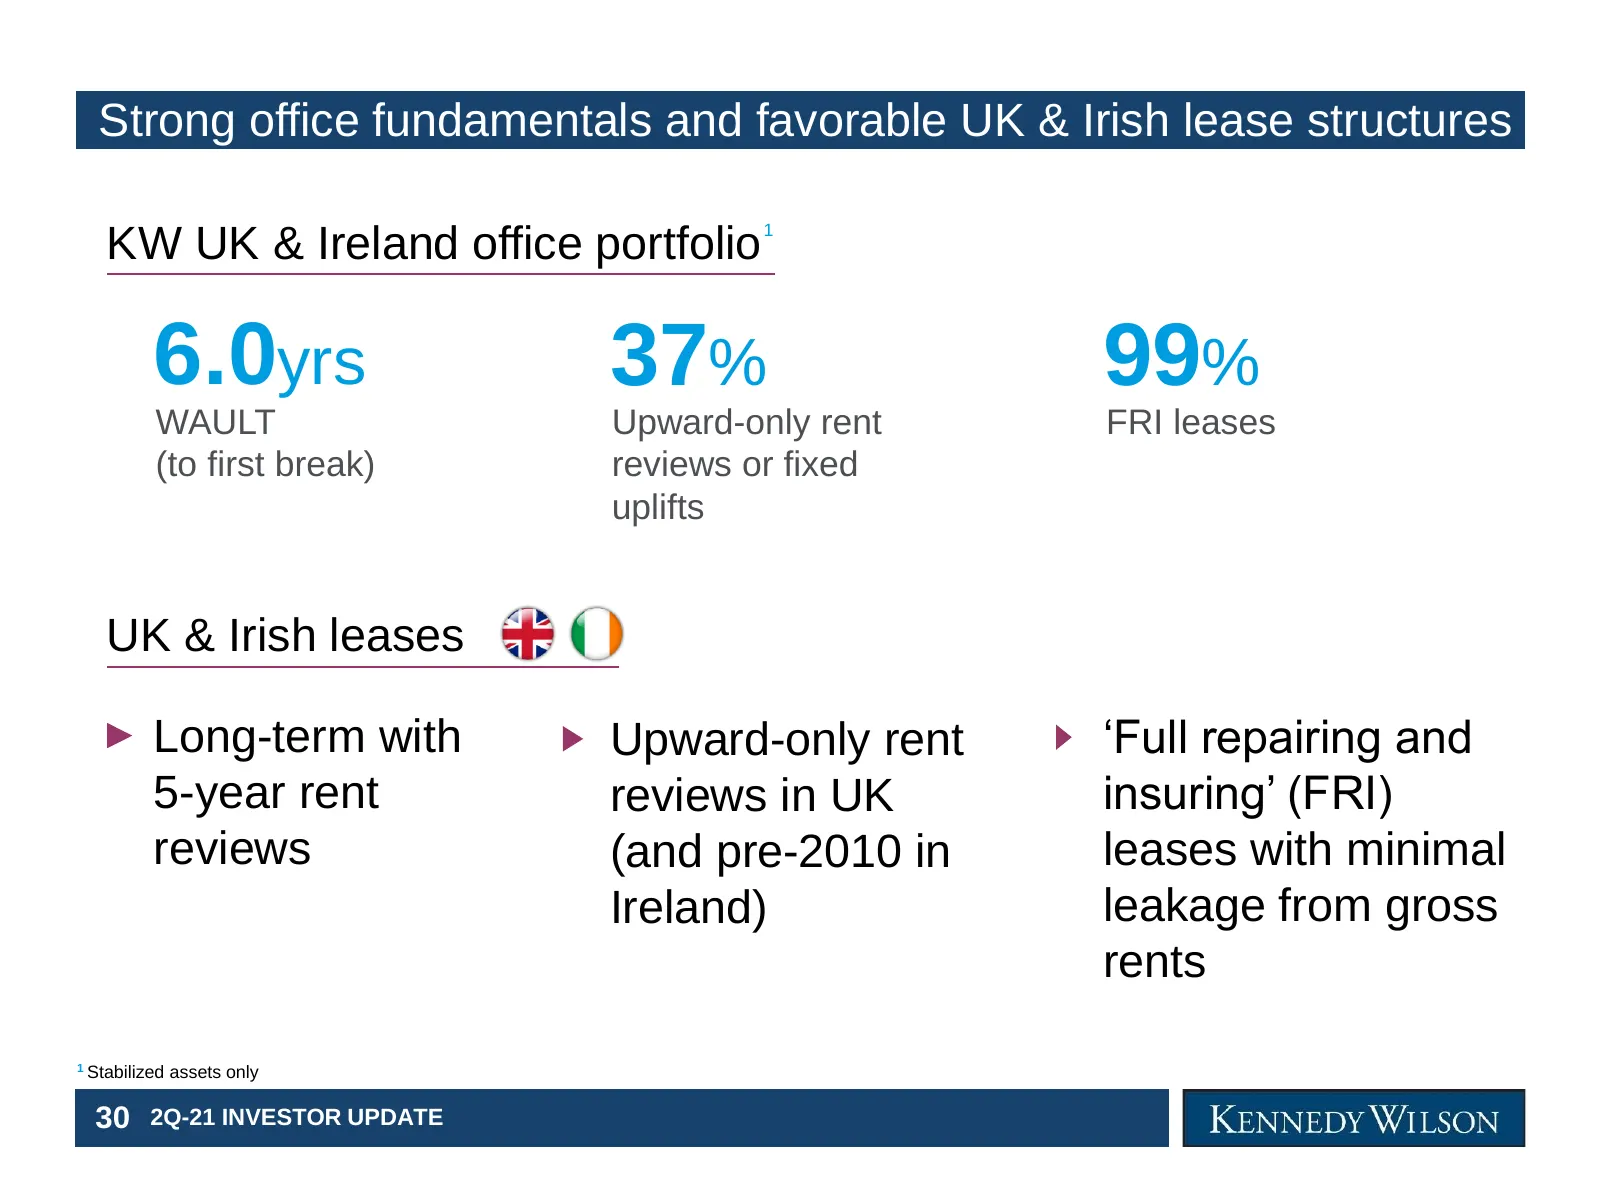
Slide 31: Strong office fundamentals and favorable UK & Irish lease structures
Strong office fundamentals and favorable UK & Irish lease structures 1 KW UK & Ireland office portfolio 6.0yrs 37% 99% WAULT Upward-only rent FRI leases (to first break) reviews or fixed uplifts UK & Irish leases Long-term with Upward-only rent ‘Full repairing and 5-year rent reviews in UK insuring’
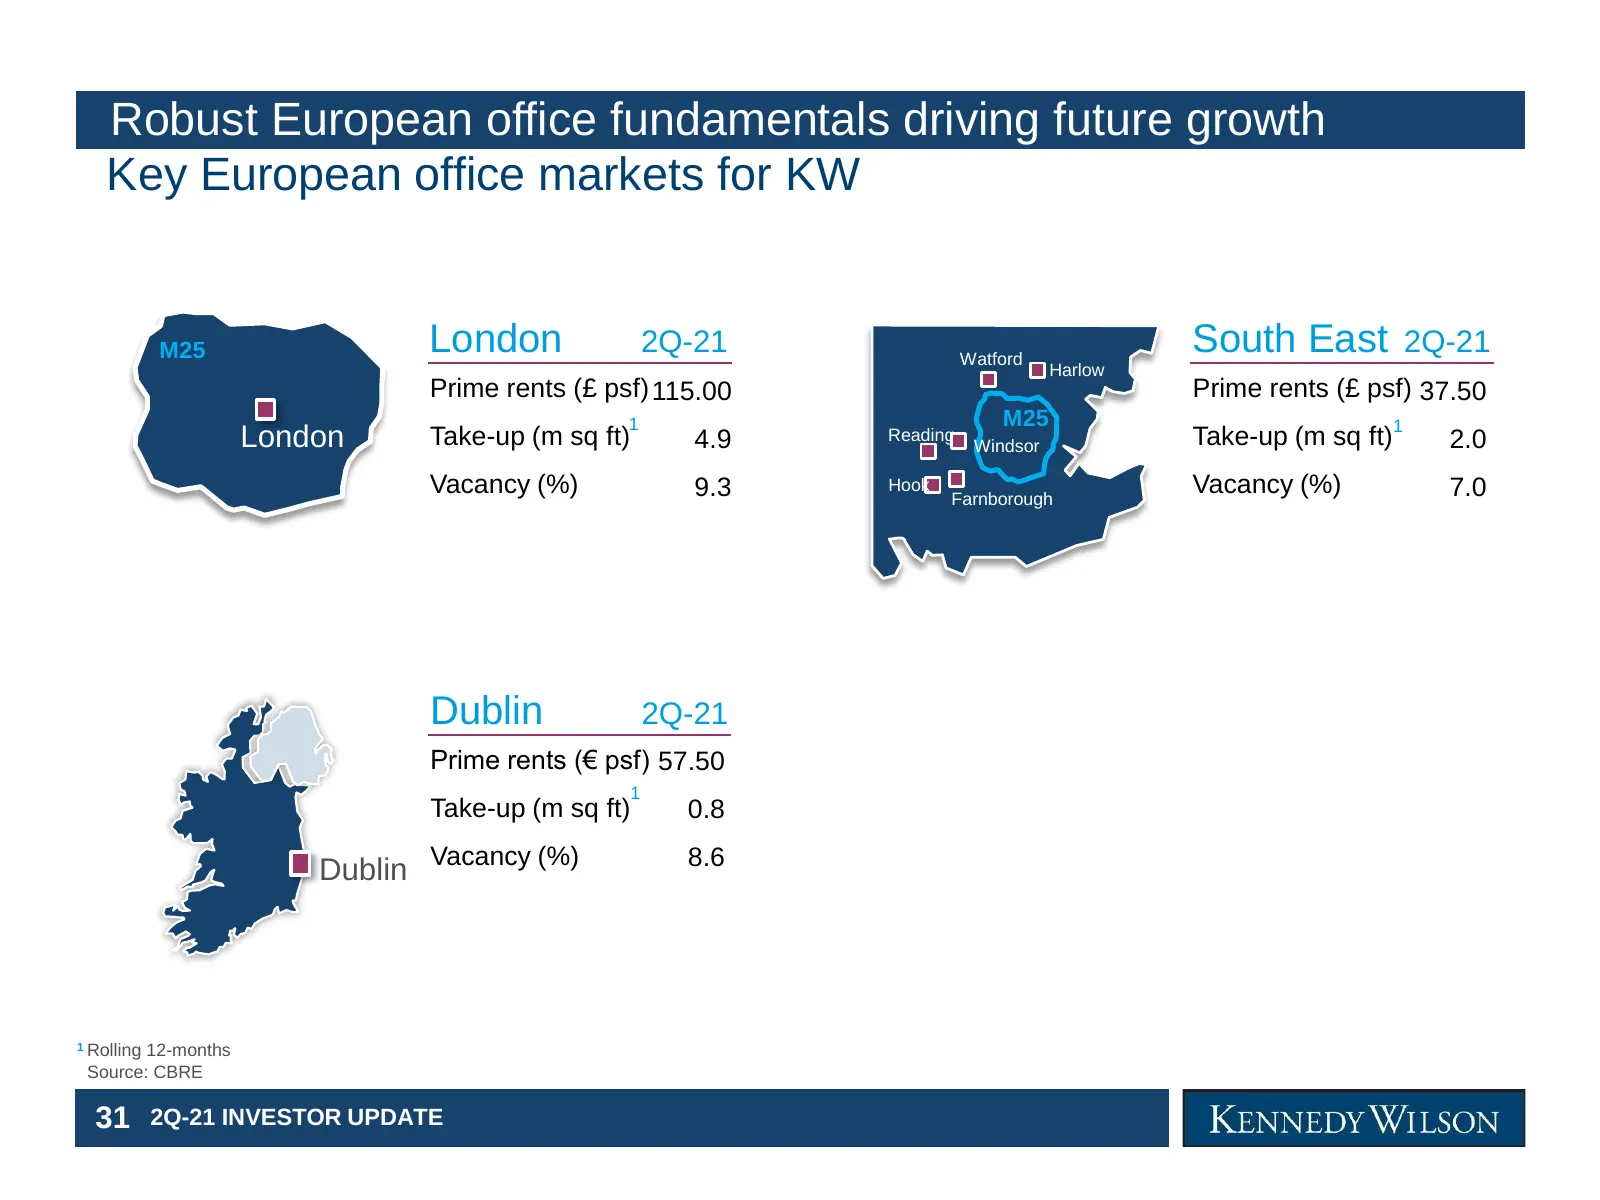
Slide 32: Robust European office fundamentals driving future growth
Robust European office fundamentals driving future growth Key European office markets for KW M25 London 2Q-21 Watford South East 2Q-21 Harlow Prime rents (£ psf) 115.00 Prime rents (£ psf) 37.50 1 M25 London Take-up (m sq ft) 4.9 Reading Windsor Take-up (m sq ft)1 2.0 Vacancy (%) 9.3 Hook Farnboroug
Slide 33: Appendix
Overview Appendix 32 2Q-21 INVESTOR UPDATE
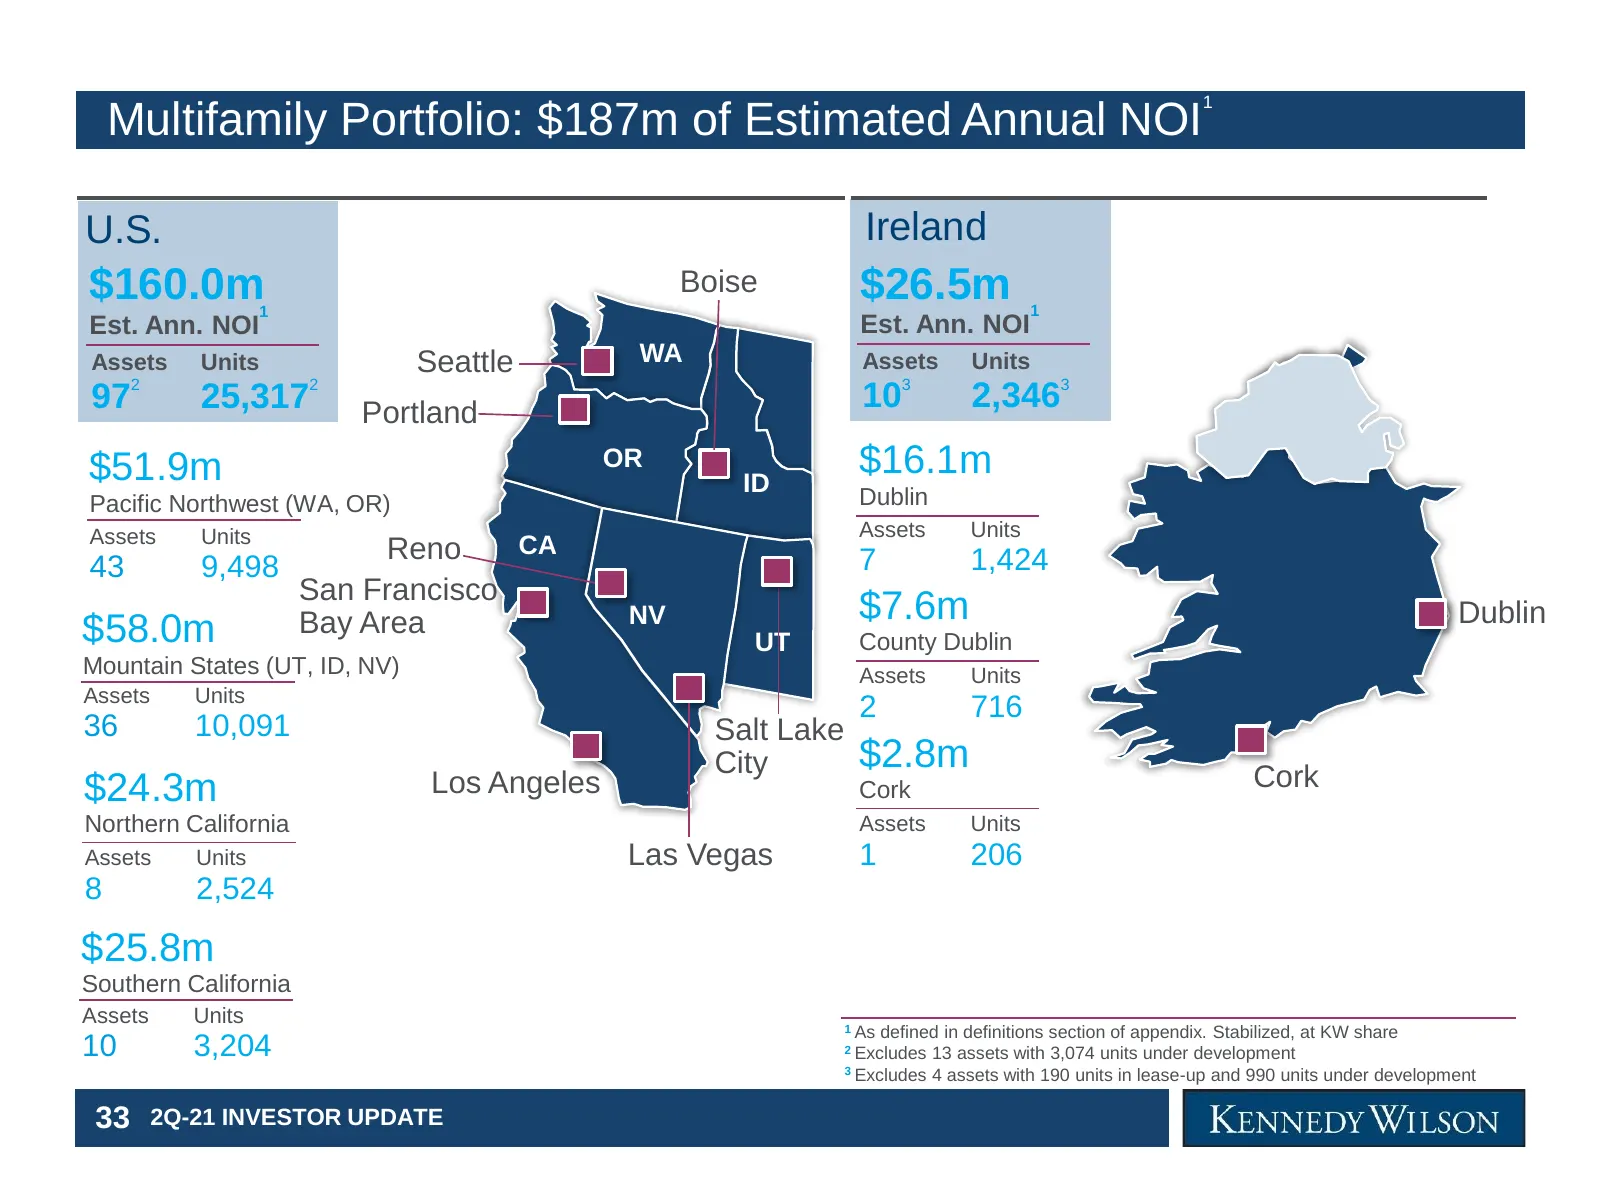
Slide 34: Multifamily Portfolio: $187m of Estimated Annual NOI
1 Multifamily Portfolio: $187m of Estimated Annual NOI U.S. Ireland $160.0m 1 Boise $26.5m 1 Est. Ann. NOI Est. Ann. NOI Assets Units Seattle WA Assets Units 3 97 2 25,317 2 Portland 10 2,3463 $51.9m OR ID $16.1m Pacific Northwest (WA, OR) Dublin Assets Units Assets Units Reno CA 43 9,498 7 1,424 Sa
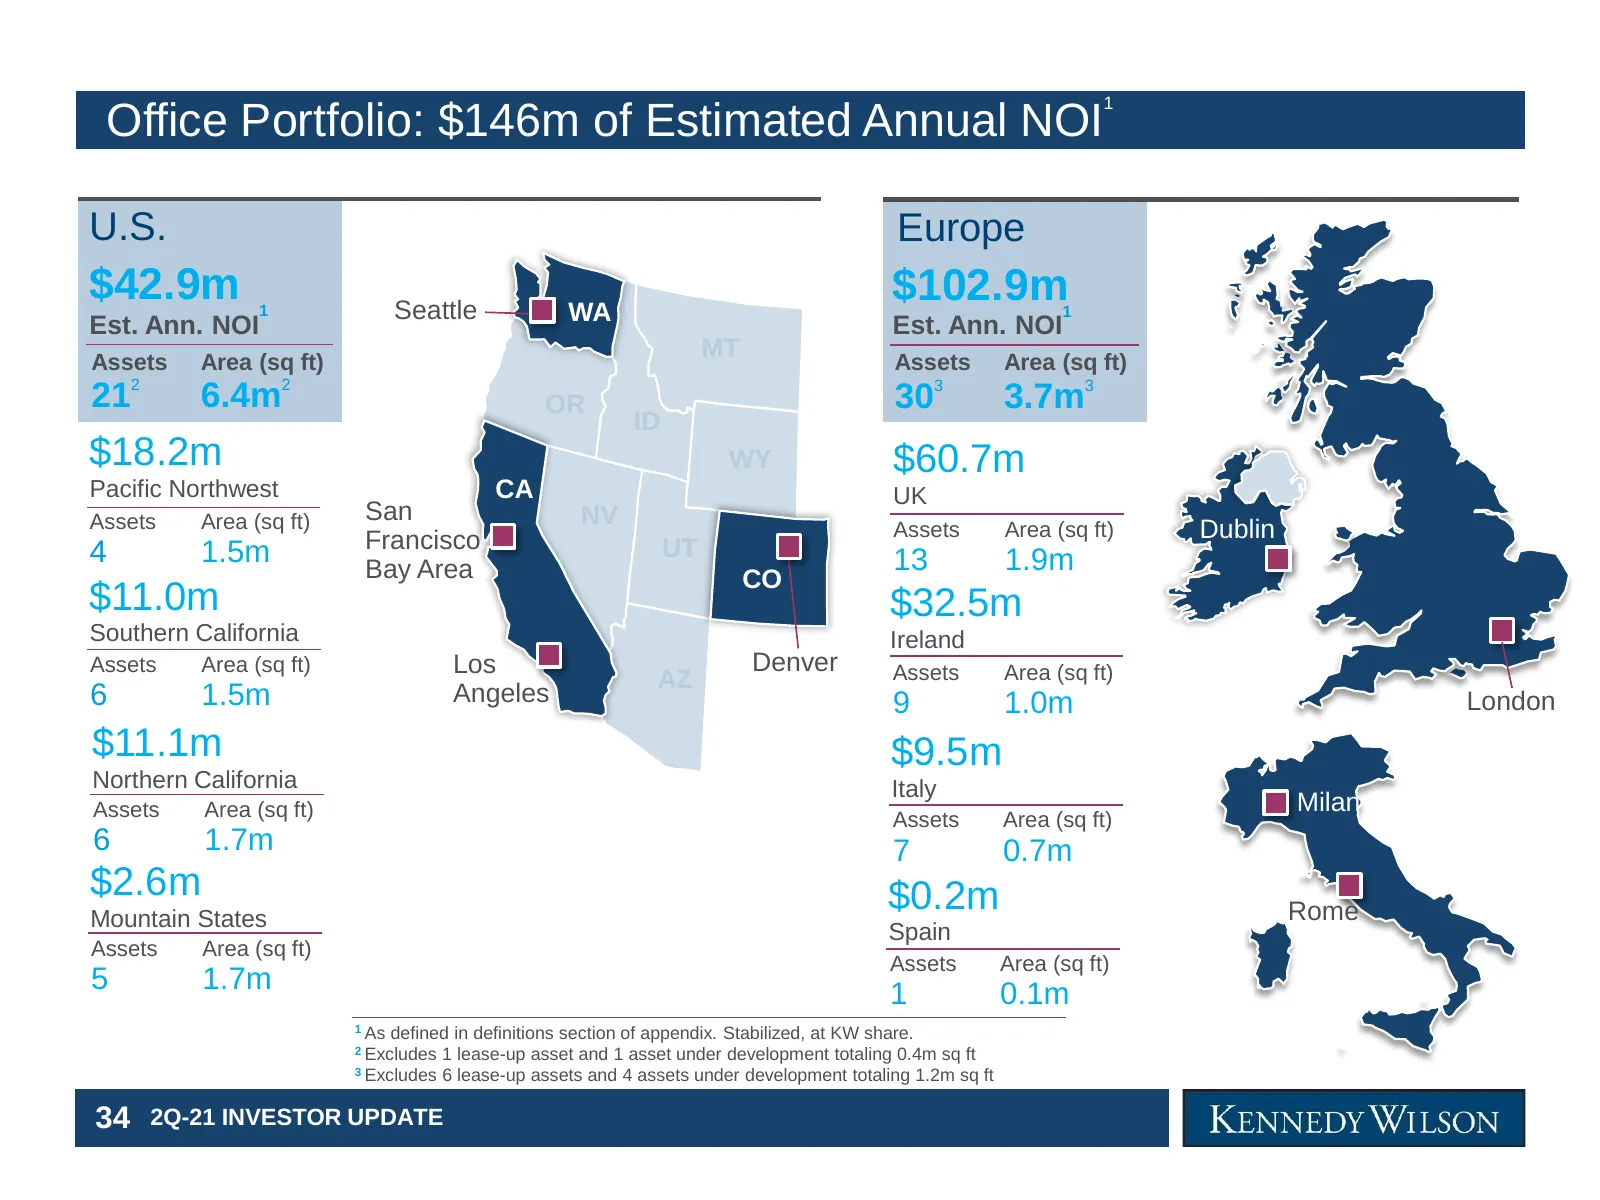
Slide 35: Office Portfolio: $146m of Estimated Annual NOI
1 Office Portfolio: $146m of Estimated Annual NOI U.S. Europe $42.9m Seattle $102.9m Est. Ann. NOI 1 WA Est. Ann. NOI 1 Assets Area (sq ft) MT Assets Area (sq ft) 2 2 3 21 6.4m OR 30 3.7m3 ID $18.2m WY $60.7m Pacific Northwest CA UK Assets Area (sq ft) San NV Francisco Assets Area (sq ft) Dublin 4 1
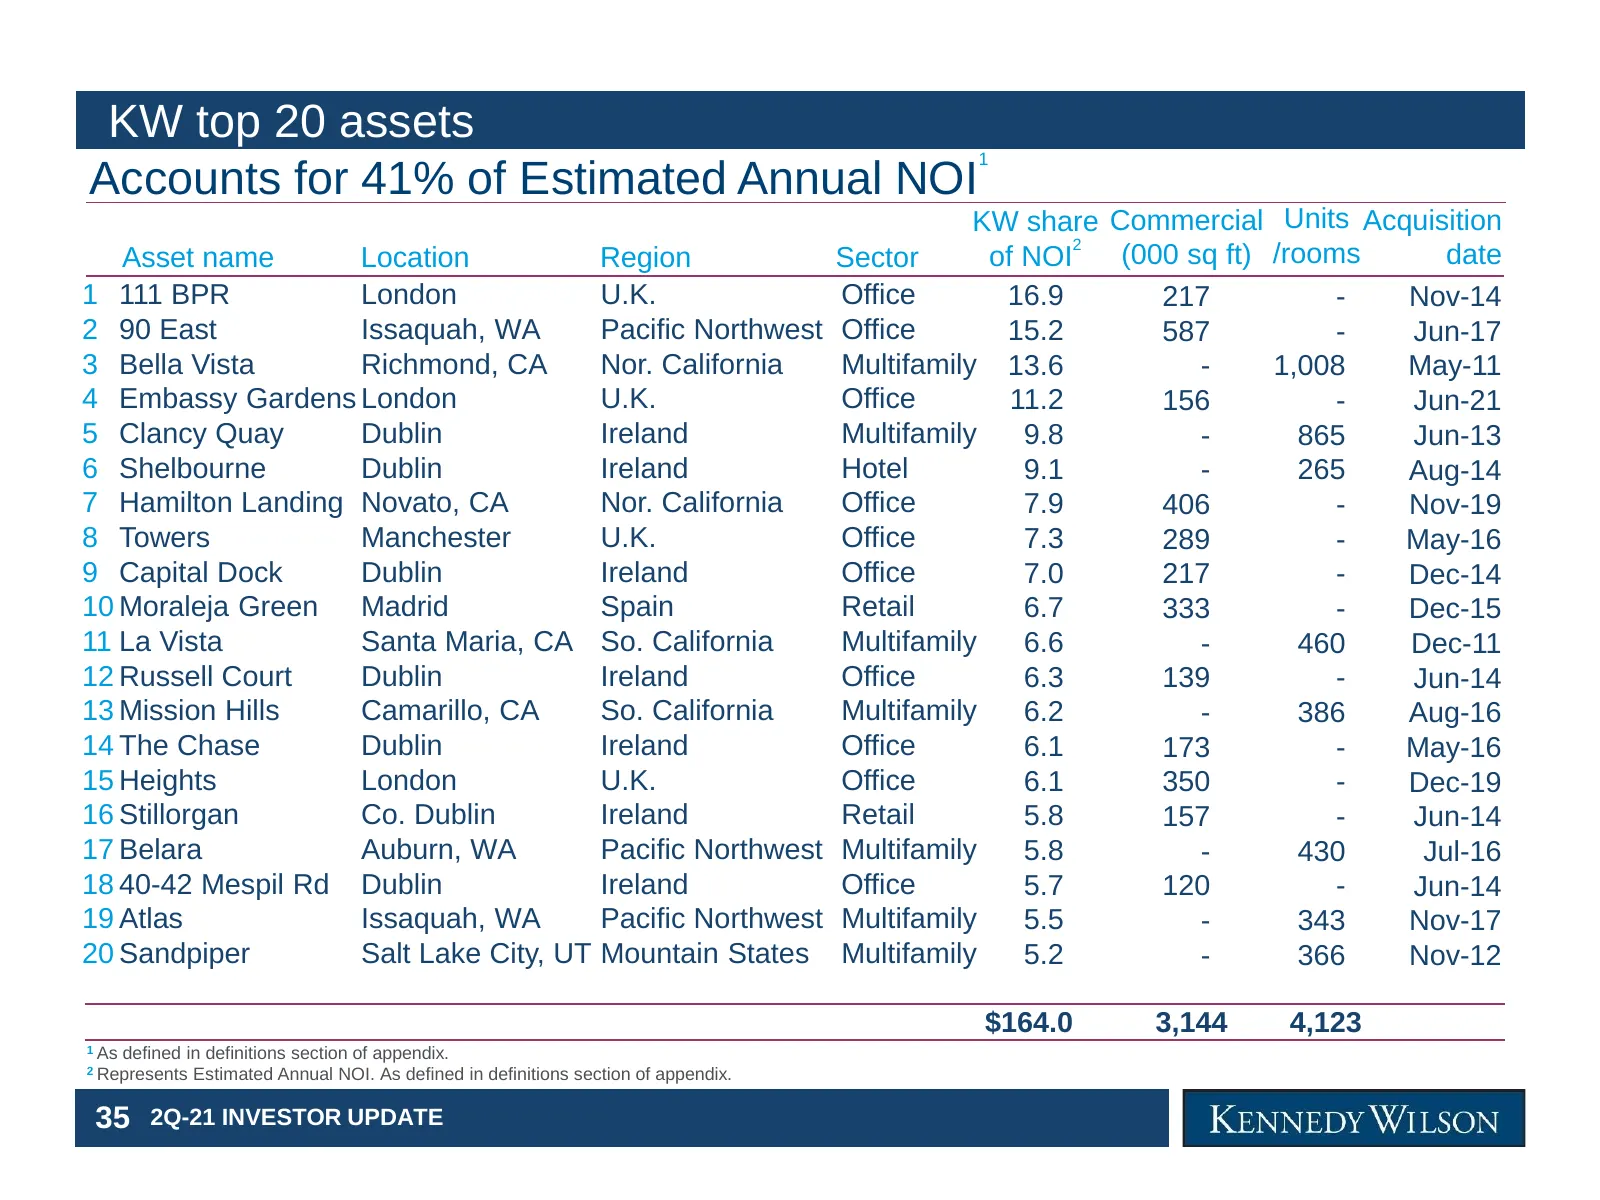
Slide 36: KW top 20 assets
KW top 20 assets 1 Accounts for 41% of Estimated Annual NOI KW share Commercial Units Acquisition 2 Asset name Location Region Sector of NOI (000 sq ft) /rooms date 1 111 BPR London U.K. Office 16.9 217 - Nov-14 2 90 East Issaquah, WA Pacific Northwest Office 15.2 587 - Jun-17 3 Bella Vista Richmond
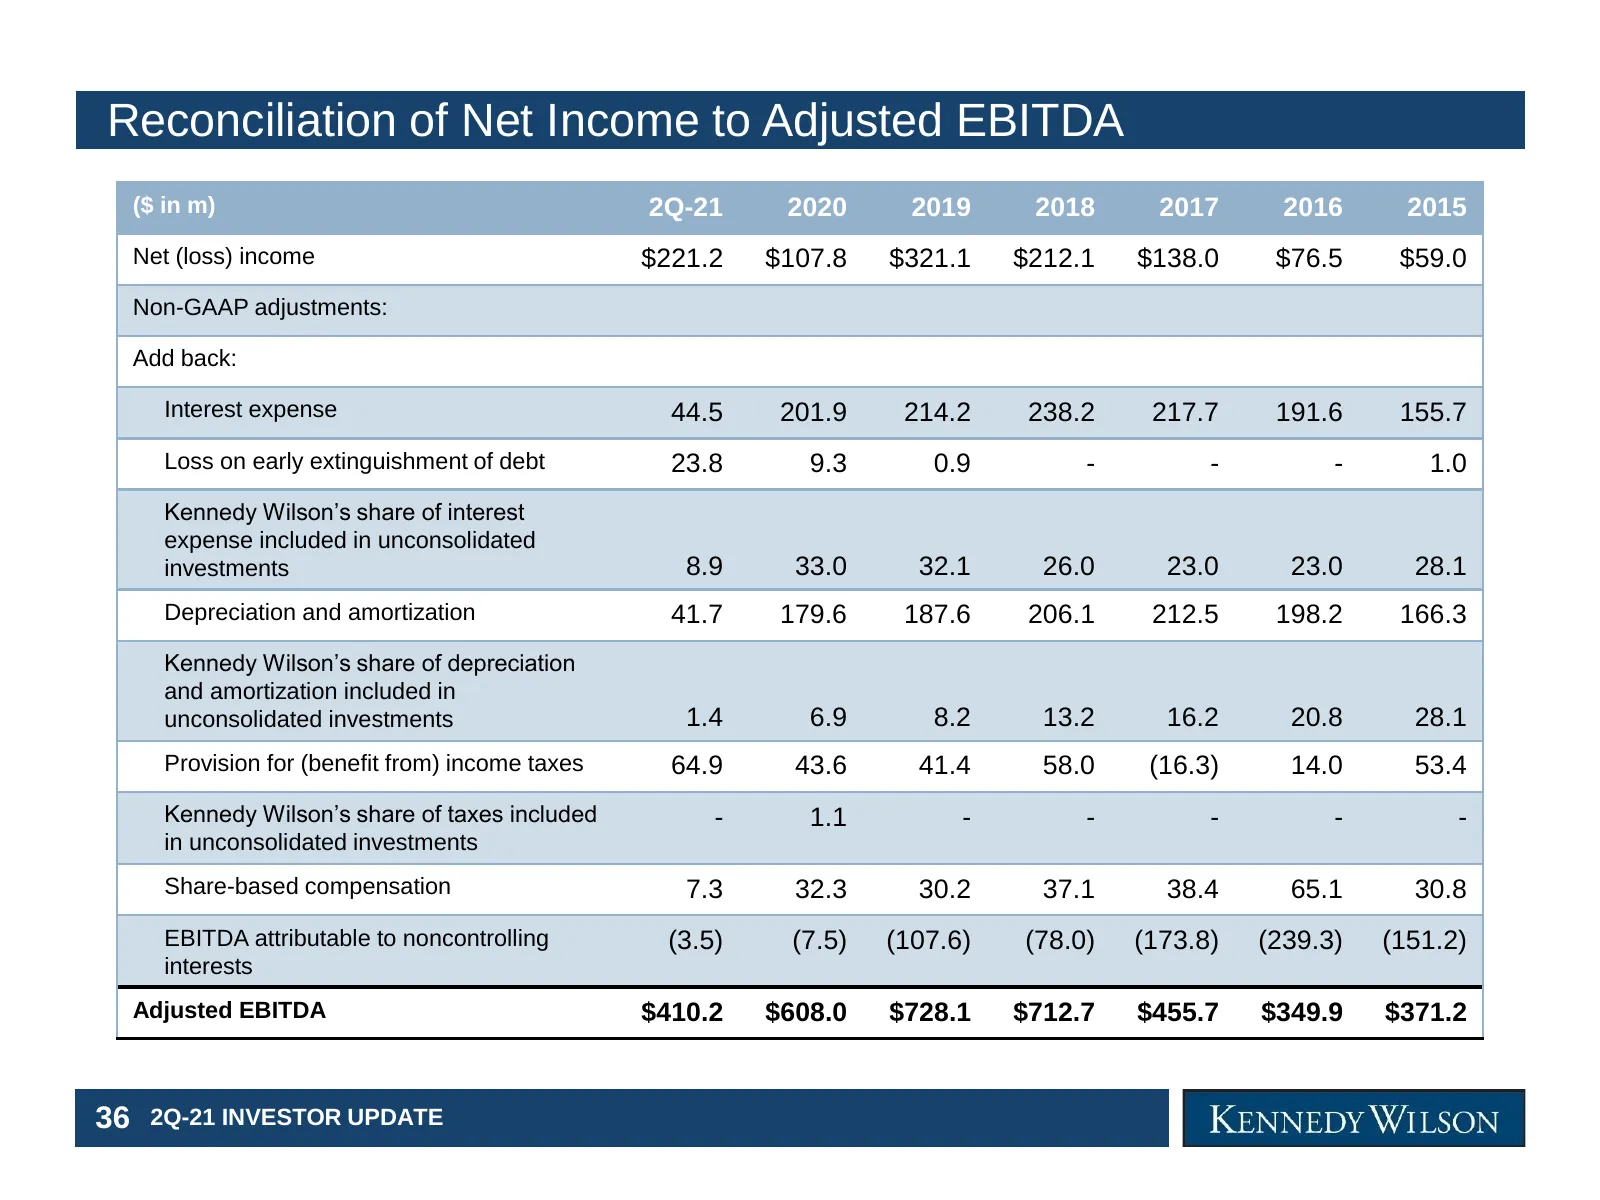
Slide 37: Reconciliation of Net Income to Adjusted EBITDA
Reconciliation of Net Income to Adjusted EBITDA ($ in m) 2Q-21 2020 2019 2018 2017 2016 2015 Net (loss) income $221.2 $107.8 $321.1 $212.1 $138.0 $76.5 $59.0 Non-GAAP adjustments: Add back: Interest expense 44.5 201.9 214.2 238.2 217.7 191.6 155.7 Loss on early extinguishment of debt 23.8 9.3 0.9 -
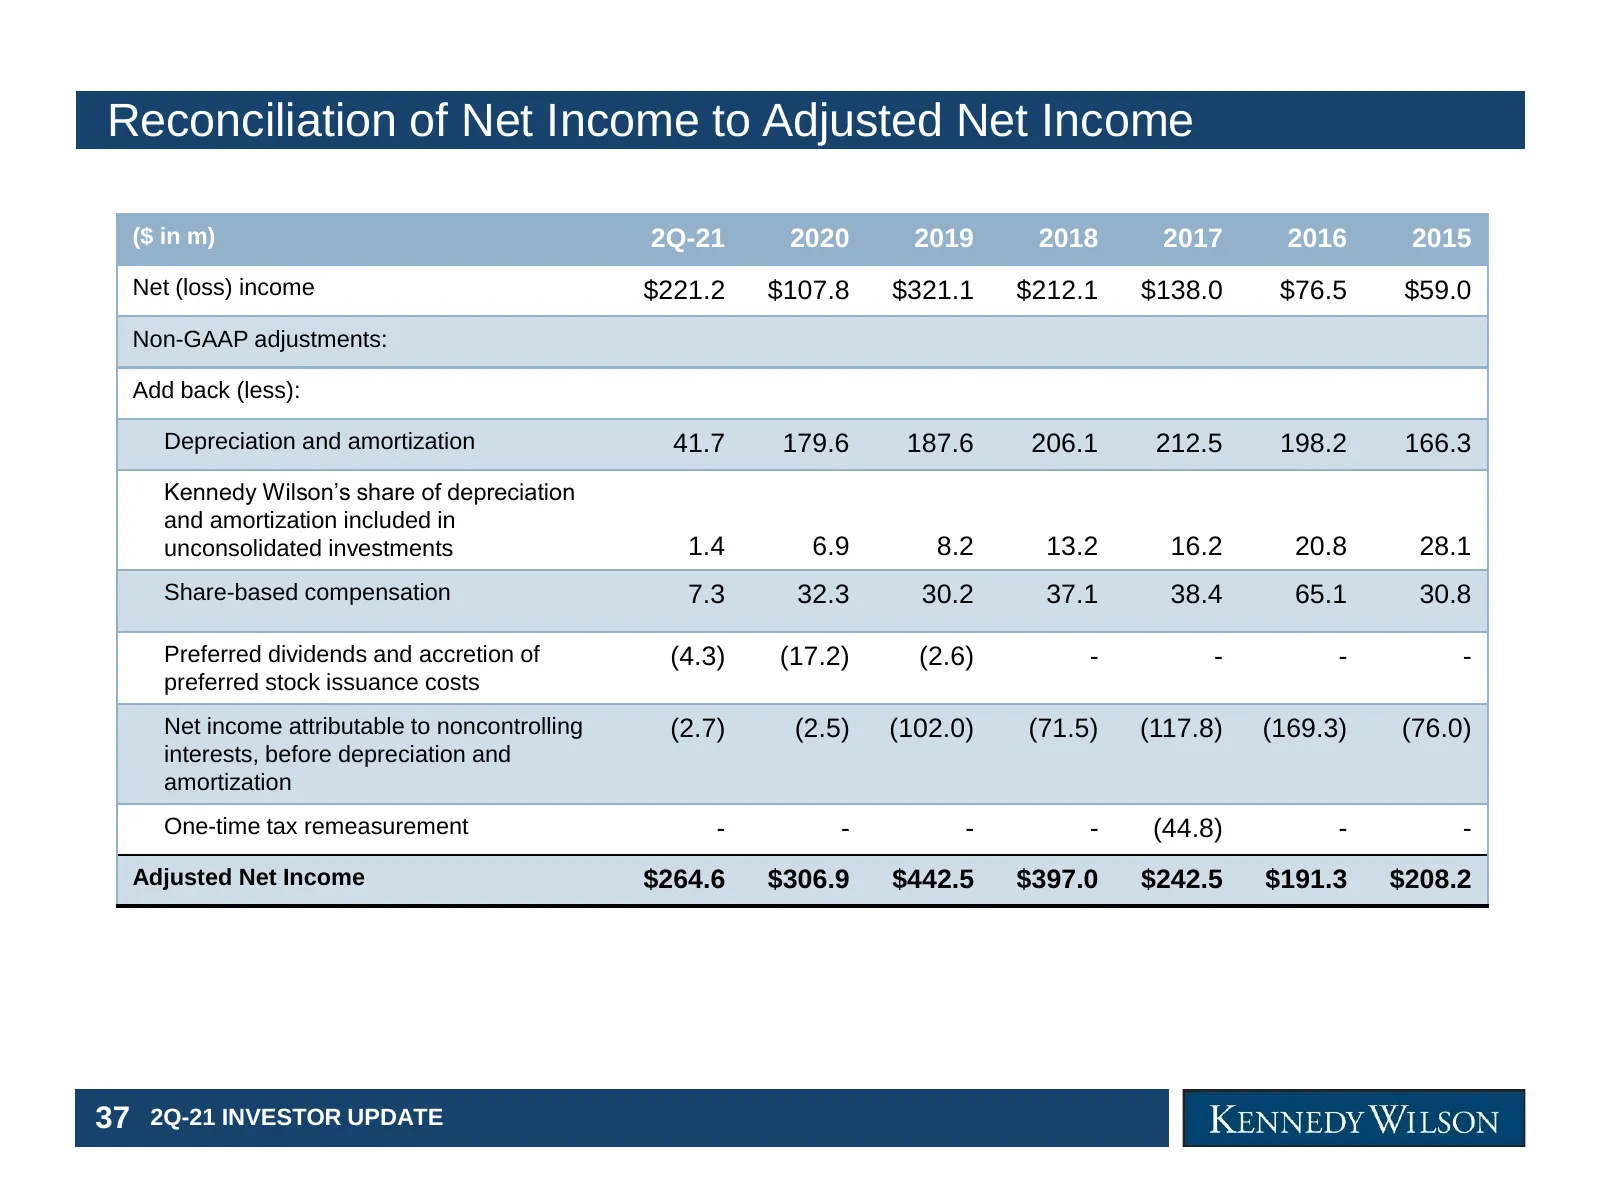
Slide 38: Reconciliation of Net Income to Adjusted Net Income
Reconciliation of Net Income to Adjusted Net Income ($ in m) 2Q-21 2020 2019 2018 2017 2016 2015 Net (loss) income $221.2 $107.8 $321.1 $212.1 $138.0 $76.5 $59.0 Non-GAAP adjustments: Add back (less): Depreciation and amortization 41.7 179.6 187.6 206.1 212.5 198.2 166.3 Kennedy Wilson’s share of de
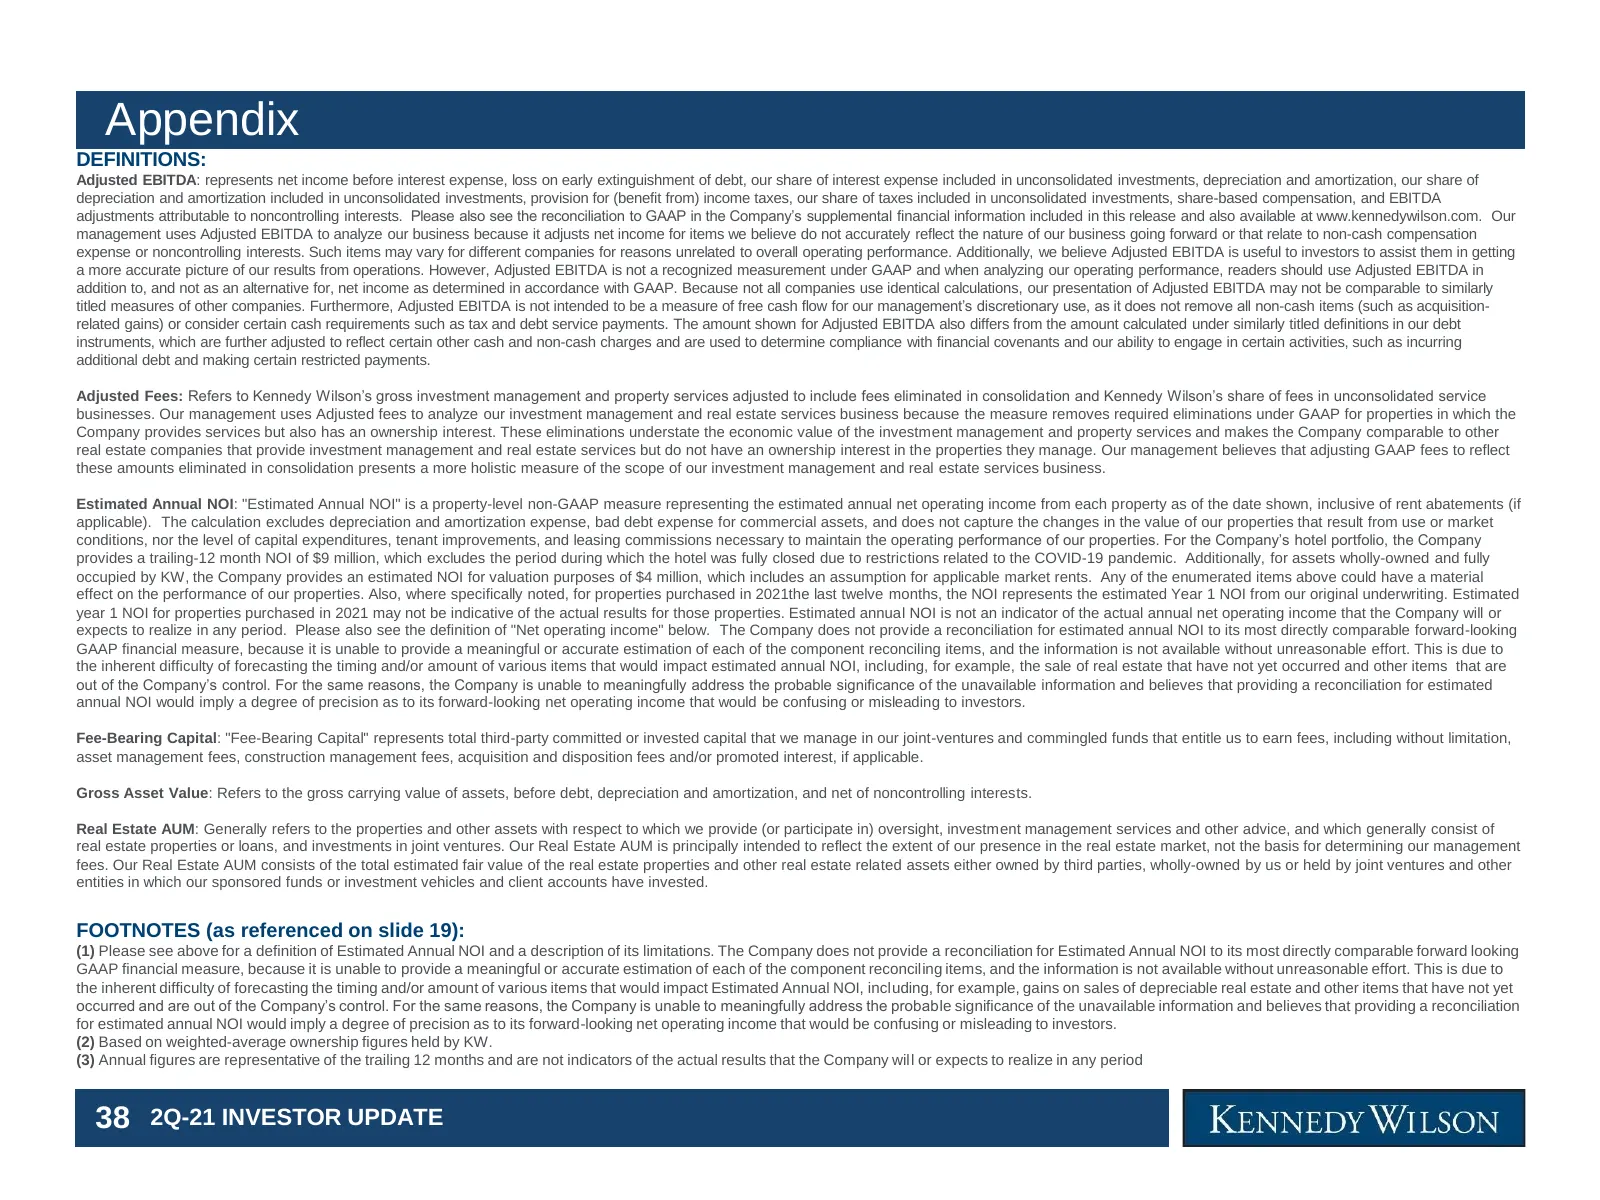
Slide 39: Definitions
Appendix DEFINITIONS: Adjusted EBITDA: represents net income before interest expense, loss on early extinguishment of debt, our share of interest expense included in unconsolidated investments, depreciation and amortization, our share of depreciation and amortization included in unconsolidated inves
Source: company website
More decks from Kennedy-Wilson Holdings Inc.
 Q3 2025 Earnings Presentation39 slides · November 2025
 Q2 2025 Earnings Presentation35 slides · August 2025
 Q1 2025 Earnings Presentation34 slides · May 8, 2025
 Q4 2024 Earnings Presentation33 slides · Feb 27, 2025
 Q3 2024 Earnings Presentation36 slides · Nov 7, 2024
 Investor Presentation (October 2024)27 slides · October 2024