LegacyTexas Financial Group Inc
LegacyTexas Financial — Q4 2017 Earnings Presentation
24 slides from LegacyTexas Financial's earnings presentation, Jan 23, 2018
Slide 1: Fourth Quarter and Full Year 2017 Investor Presentation
January 24, 2018 EXHIBIT 99.3 Fourth Quarter and Full Year 2017 Investor Presentation
Slide 2: Safe harbor statement
2 Safe harbor statement When used in filings by LegacyTexas Financial Group, Inc. (the "Company”) with the Securities and Exchange Commission (the “SEC”), in the Company's press releases or other public or stockholder communications, and in oral statements made with the approval of an authorized exe
Slide 3: Today's presenters
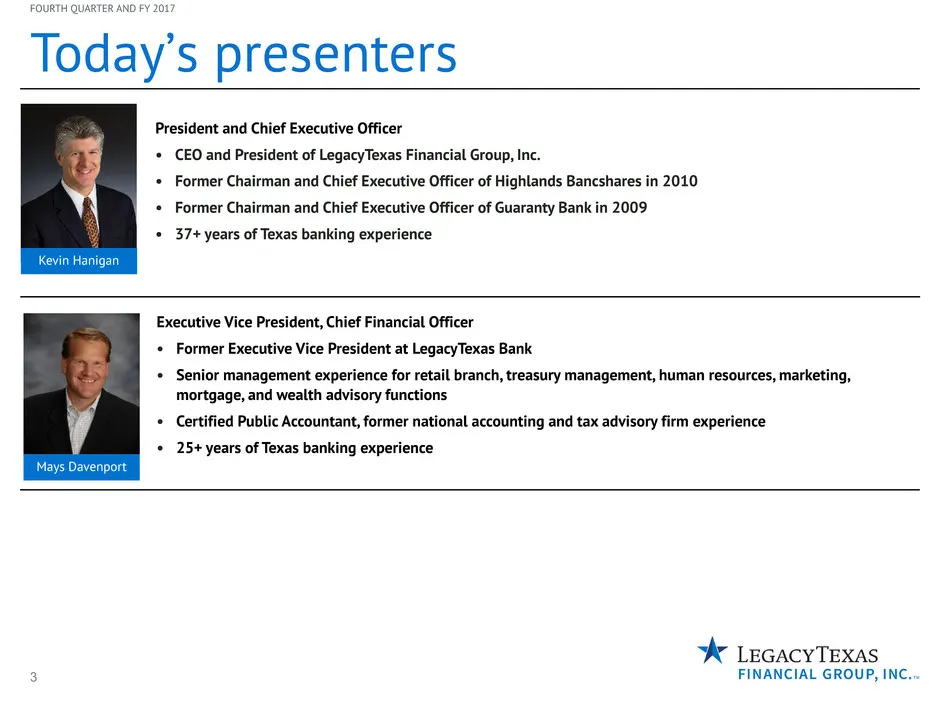
3 Today’s presenters FOURTH QUARTER AND FY 2017 Kevin Hanigan President and Chief Executive Officer • CEO and President of LegacyTexas Financial Group, Inc. • Former Chairman and Chief Executive Officer of Highlands Bancshares in 2010 • Former Chairman and Chief Executive Officer of Guaranty Bank in
Slide 4: Full Year 2017 Results
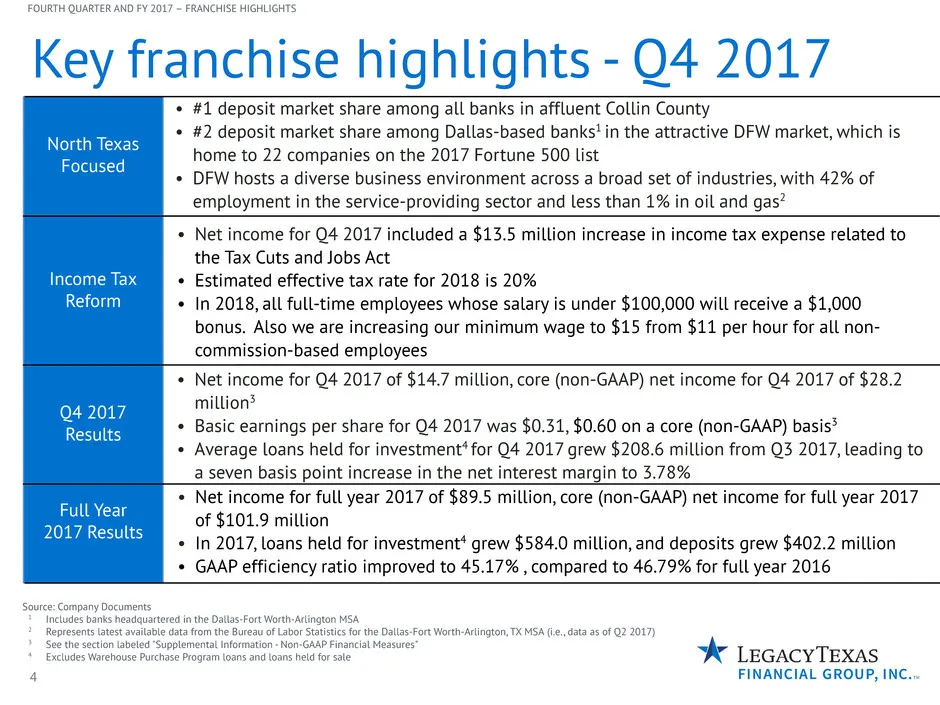
4 • Net income for full year 2017 of $89.5 million, core (non-GAAP) net income for full year 2017 of $101.9 million • In 2017, loans held for investment4 grew $584.0 million, and deposits grew $402.2 million • GAAP efficiency ratio improved to 45.17% , compared to 46.79% for full year 2016 Full Year
Slide 5: Fourth quarter highlights
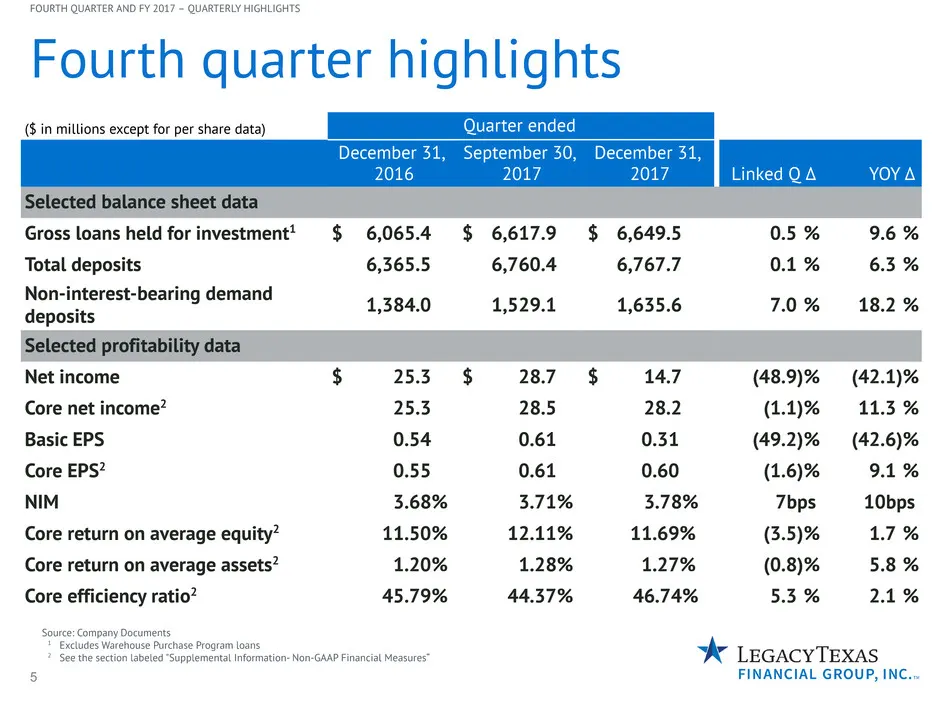
5 Fourth quarter highlights ($ in millions except for per share data) Quarter ended December 31, 2016 September 30, 2017 December 31, 2017 Linked Q ∆ YOY ∆ Selected balance sheet data Gross loans held for investment1 $ 6,065.4 $ 6,617.9 $ 6,649.5 0.5 % 9.6 % Total deposits 6,365.5 6,760.4 6,767.7 0.
Slide 6: Full year 2017 highlights
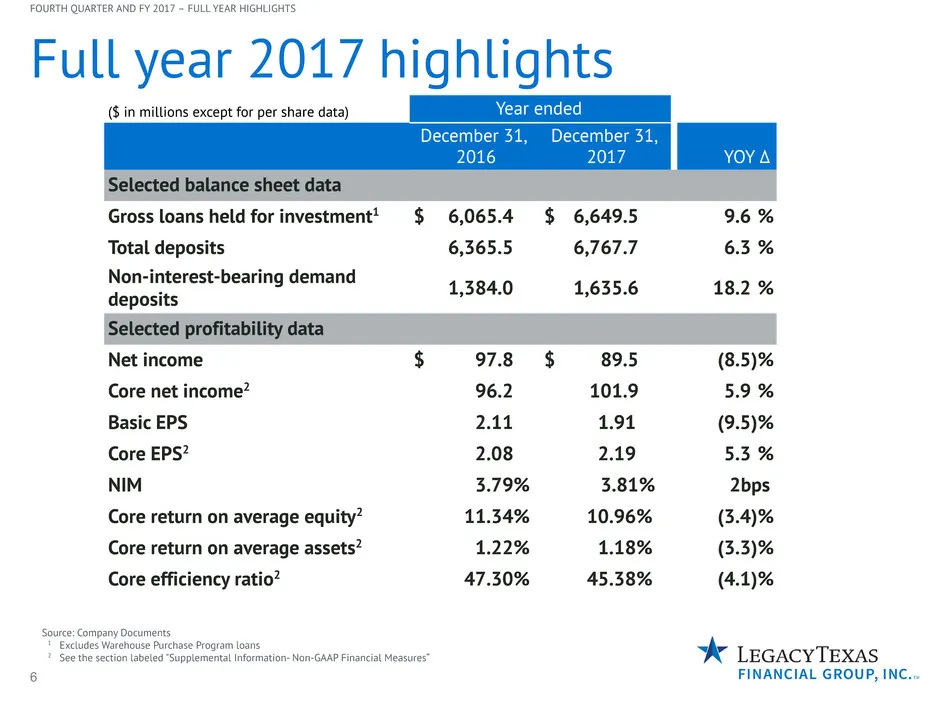
6 Full year 2017 highlights ($ in millions except for per share data) Year ended December 31, 2016 December 31, 2017 YOY ∆ Selected balance sheet data Gross loans held for investment1 $ 6,065.4 $ 6,649.5 9.6 % Total deposits 6,365.5 6,767.7 6.3 % Non-interest-bearing demand deposits 1,384.0 1,635.6
Slide 7: Commercially focused loan portfolio
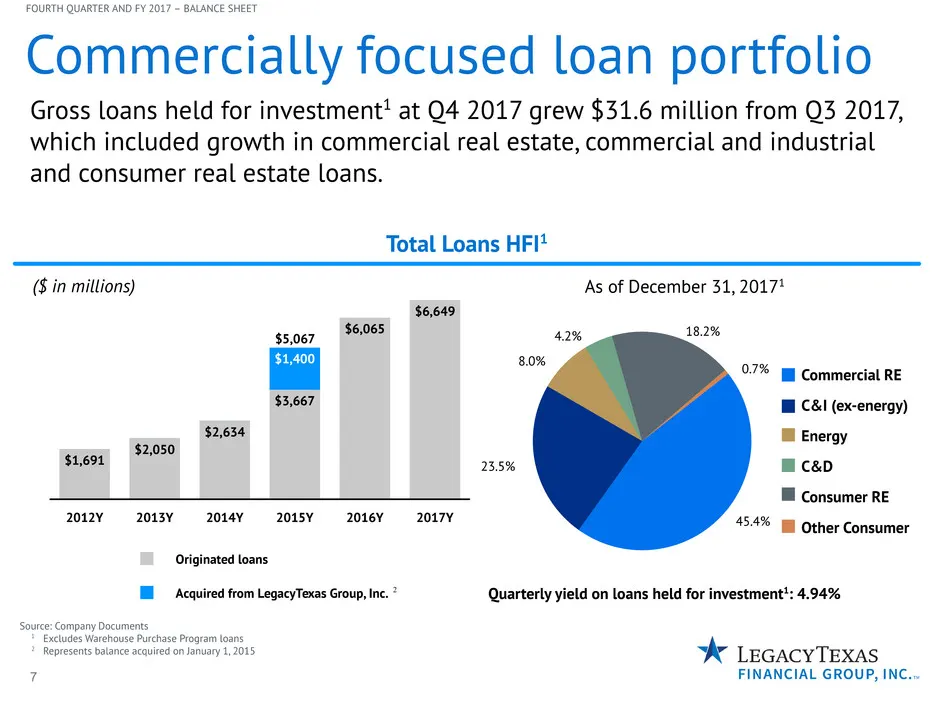
7 Originated loans Acquired from LegacyTexas Group, Inc. 2012Y 2013Y 2014Y 2015Y 2016Y 2017Y $1,691 $2,050 $2,634 $3,667 $6,065 $6,649 $1,400 Gross loans held for investment1 at Q4 2017 grew $31.6 million from Q3 2017, which included growth in commercial real estate, commercial and industrial and co
Slide 8: Energy lending: geographic concentration of reserves
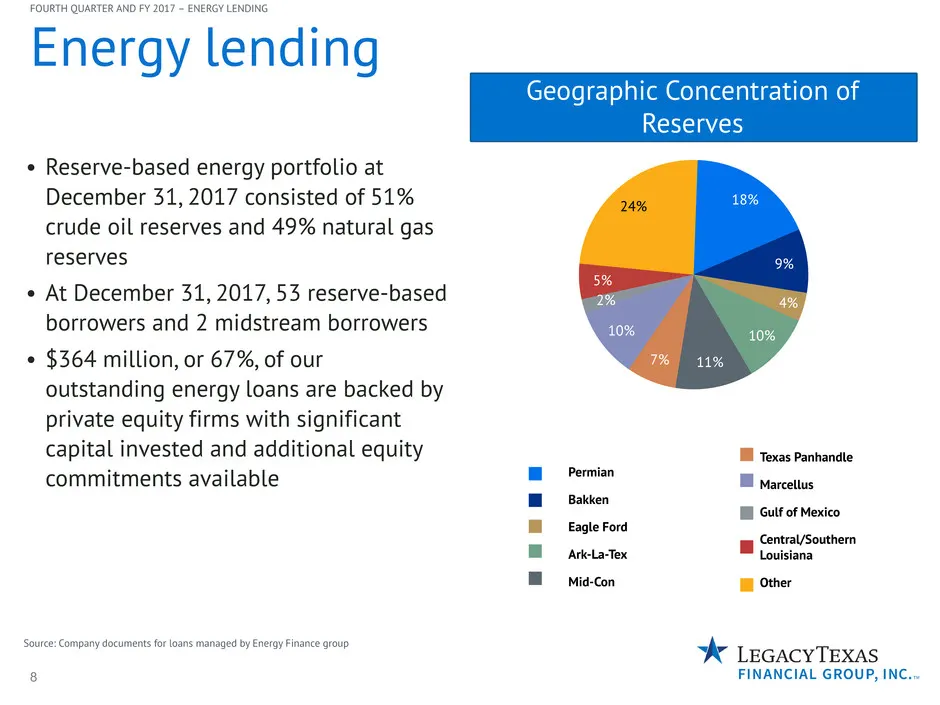
8 • Reserve-based energy portfolio at December 31, 2017 consisted of 51% crude oil reserves and 49% natural gas reserves • At December 31, 2017, 53 reserve-based borrowers and 2 midstream borrowers • $364 million, or 67%, of our outstanding energy loans are backed by private equity firms with signif
Slide 9: Energy lending
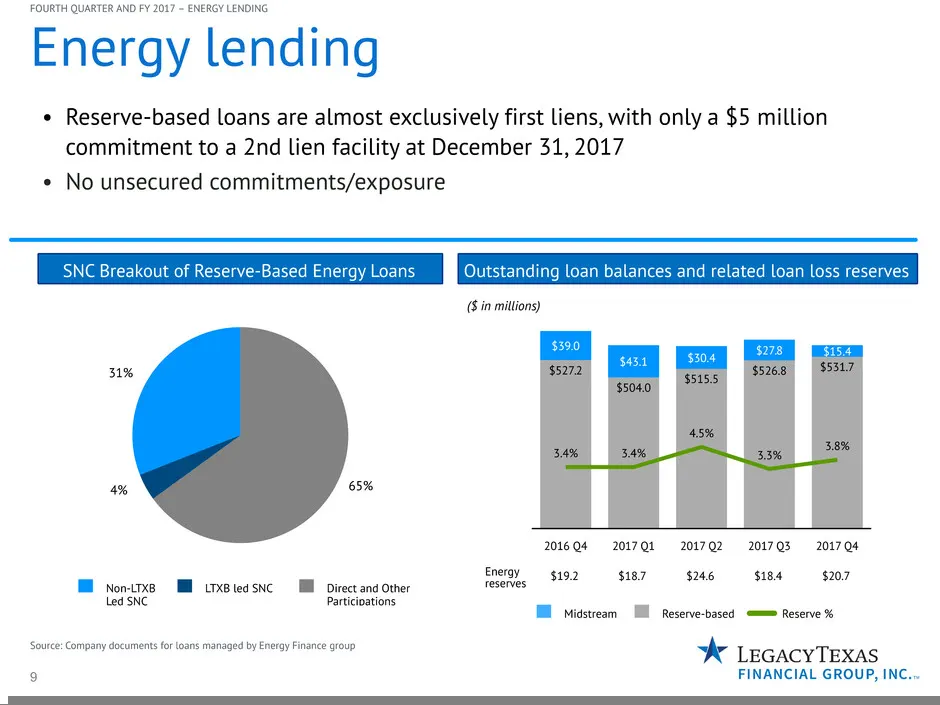
9 65%4% 31% Source: Company documents for loans managed by Energy Finance group • Reserve-based loans are almost exclusively first liens, with only a $5 million commitment to a 2nd lien facility at December 31, 2017 • No unsecured commitments/exposure Energy lending R: 000 G: 048 B: 135 R: 111 G: 16
Slide 10: Commercial Real Estate - Houston
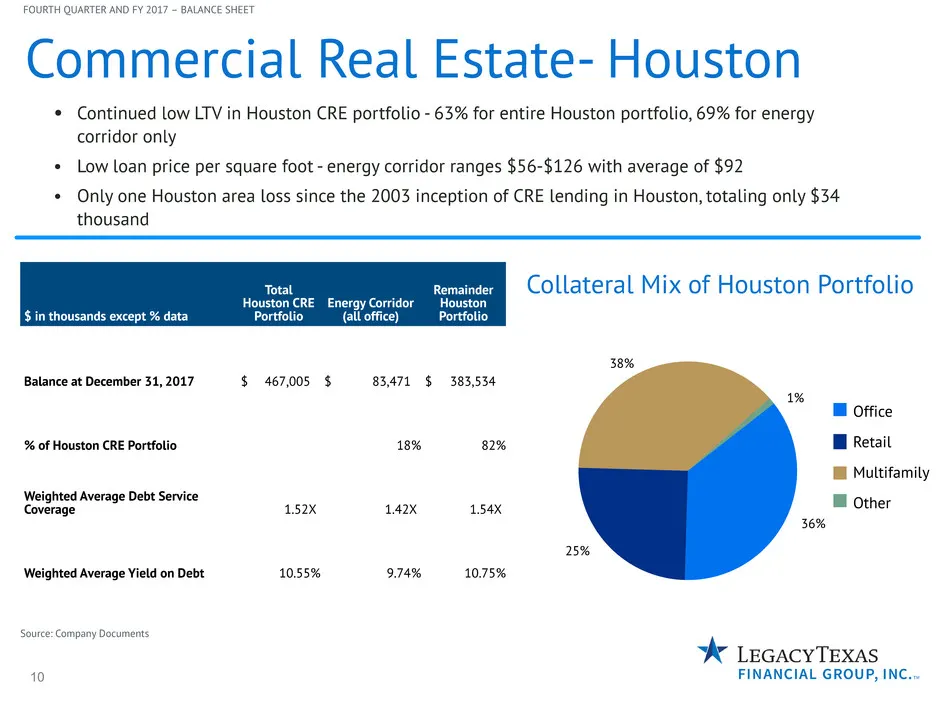
10 Collateral Mix of Houston Portfolio • Continued low LTV in Houston CRE portfolio - 63% for entire Houston portfolio, 69% for energy corridor only • Low loan price per square foot - energy corridor ranges $56-$126 with average of $92 • Only one Houston area loss since the 2003 inception of CRE len
Slide 11: Core funded, low cost deposit base
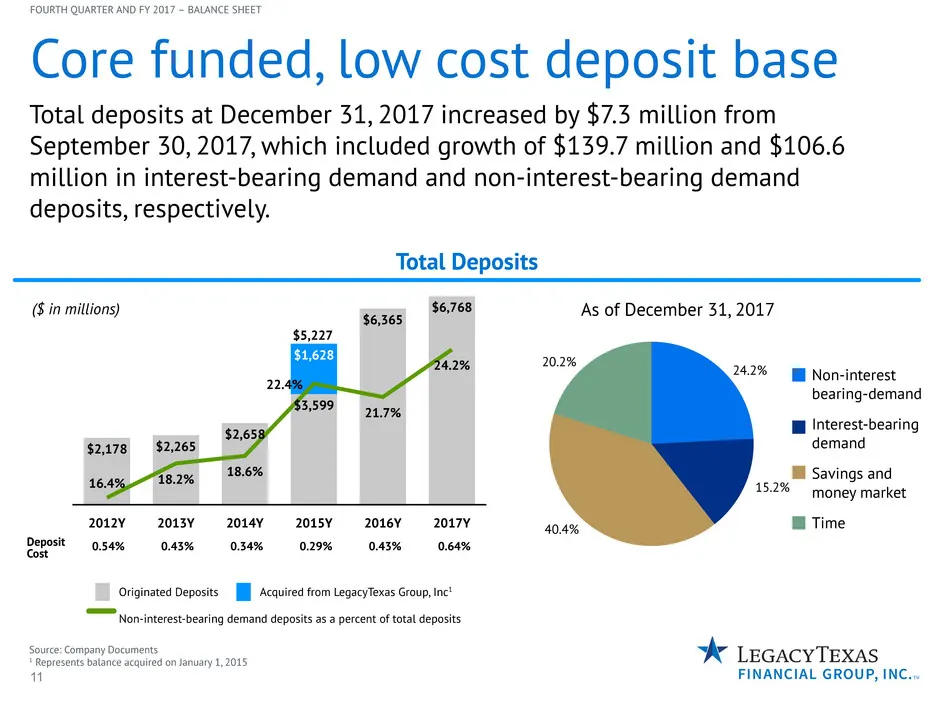
11 Originated Deposits Acquired from LegacyTexas Group, Inc1 Non-interest-bearing demand deposits as a percent of total deposits Total deposits at December 31, 2017 increased by $7.3 million from September 30, 2017, which included growth of $139.7 million and $106.6 million in interest-bearing deman
Slide 12: Solid net interest income growth
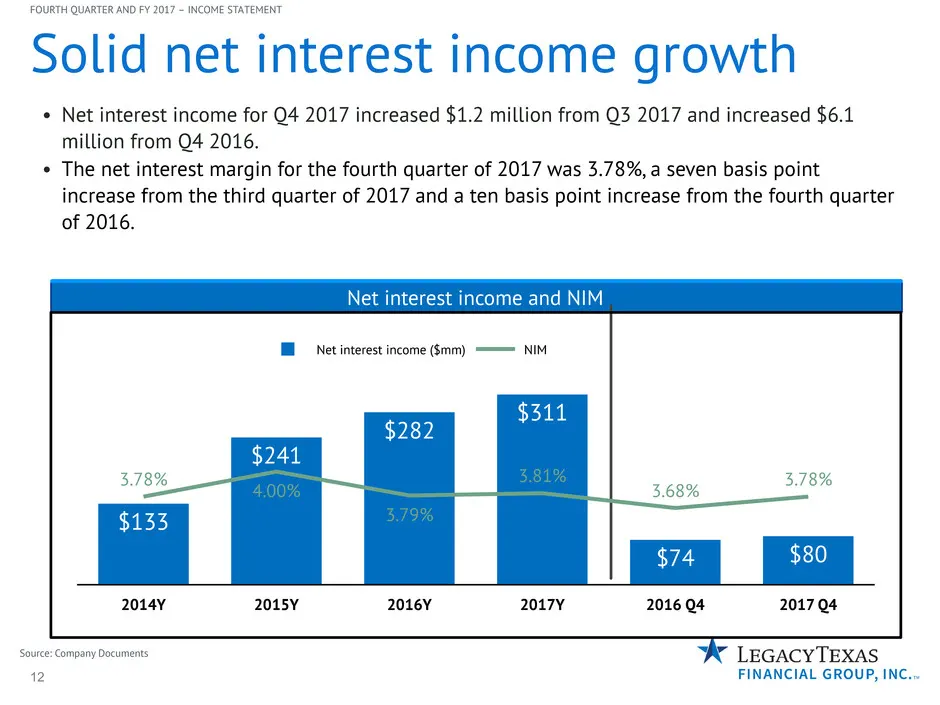
12 Solid net interest income growth • Net interest income for Q4 2017 increased $1.2 million from Q3 2017 and increased $6.1 million from Q4 2016. • The net interest margin for the fourth quarter of 2017 was 3.78%, a seven basis point increase from the third quarter of 2017 and a ten basis point inc
Slide 13: Disciplined expense management
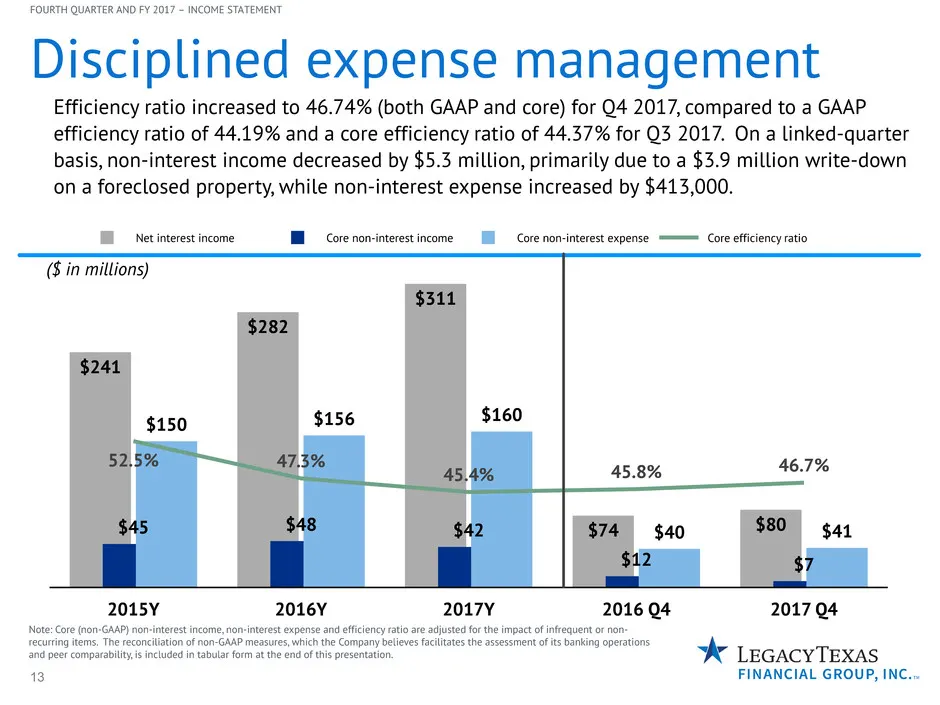
13 Net interest income Core non-interest income Core non-interest expense Core efficiency ratio 2015Y 2016Y 2017Y 2016 Q4 2017 Q4 $241 $282 $311 $74 $80$45 $48 $42 $12 $7 $150 $156 $160 $40 $41 52.5% 47.3% 45.4% 45.8% 46.7% Disciplined expense management FOURTH QUARTER AND FY 2017 – INCOME STATEMENT
Slide 14: Asset quality
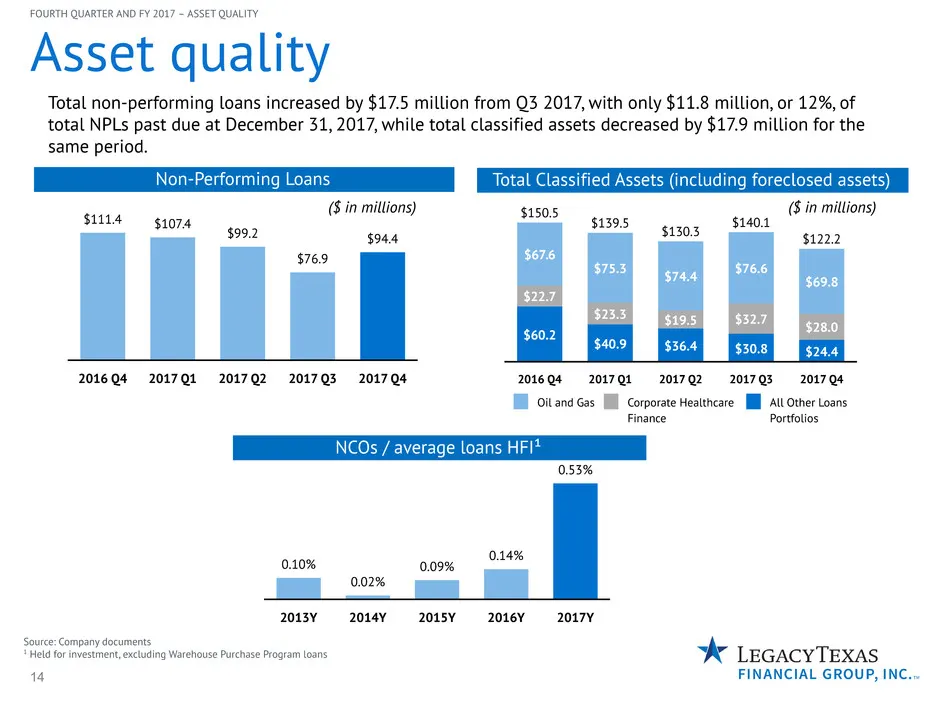
14 2016 Q4 2017 Q1 2017 Q2 2017 Q3 2017 Q4 $60.2 $40.9 $36.4 $30.8 $24.4 $22.7 $23.3 $19.5 $32.7 $28.0 $67.6 $150.5 $75.3 $139.5 $74.4 $130.3 $76.6 $140.1 $69.8 $122.2 Asset quality Source: Company documents 1 Held for investment, excluding Warehouse Purchase Program loans NCOs / average loans HFI¹
Slide 15: Prudent capital management
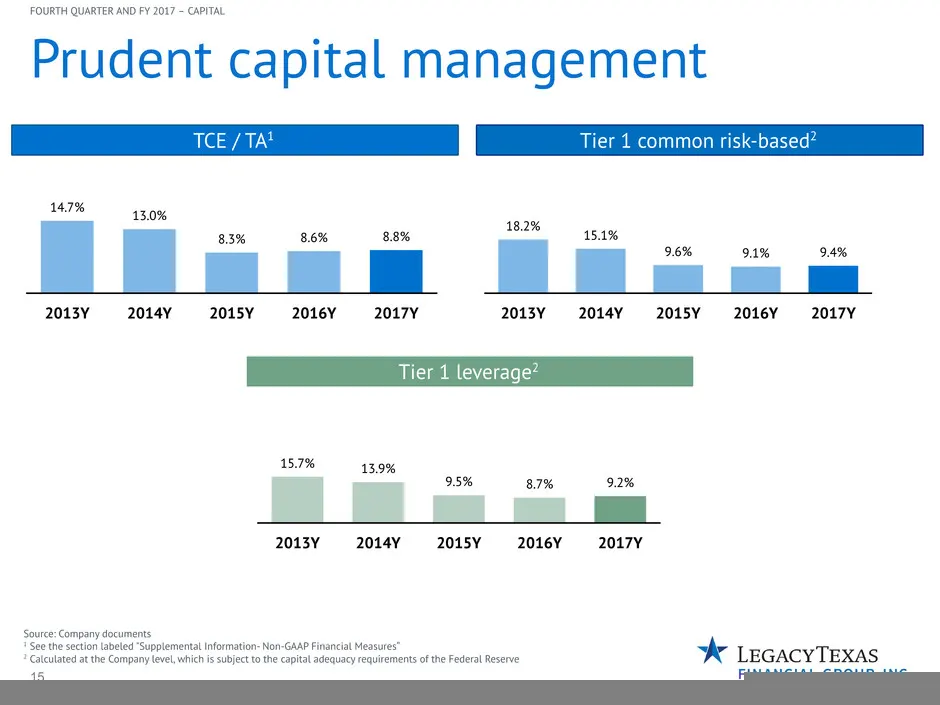
15 Prudent capital management Source: Company documents 1 See the section labeled "Supplemental Information- Non-GAAP Financial Measures“ 2 Calculated at the Company level, which is subject to the capital adequacy requirements of the Federal Reserve TCE / TA1 Tier 1 common risk-based2 Tier 1 leverag
Slide 16: Key investment highlights
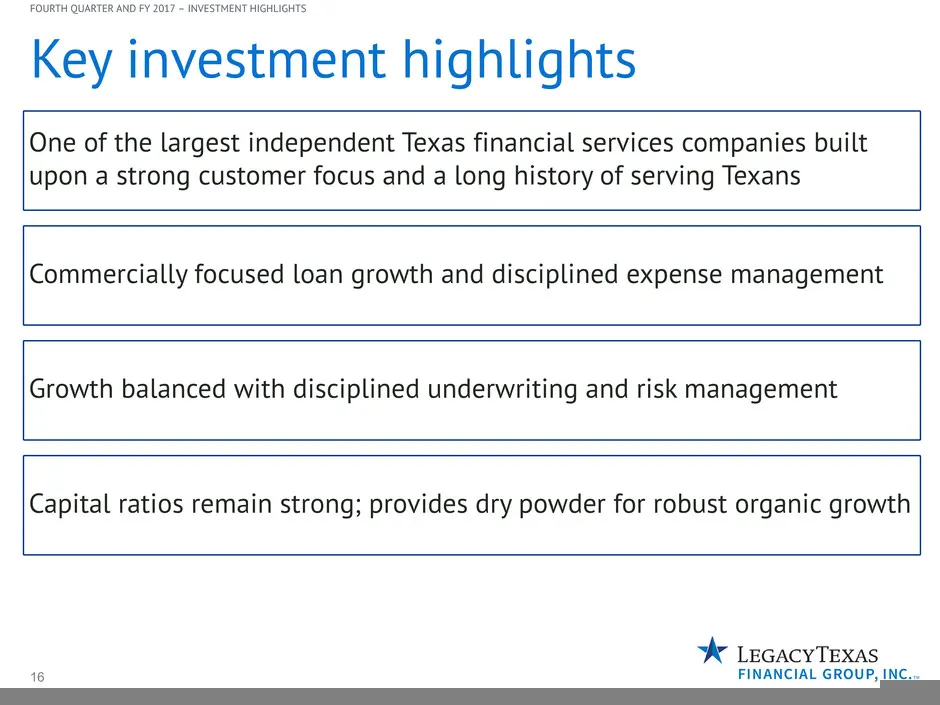
16 Key investment highlights One of the largest independent Texas financial services companies built upon a strong customer focus and a long history of serving Texans Commercially focused loan growth and disciplined expense management Growth balanced with disciplined underwriting and risk management
Slide 17: Looking ahead
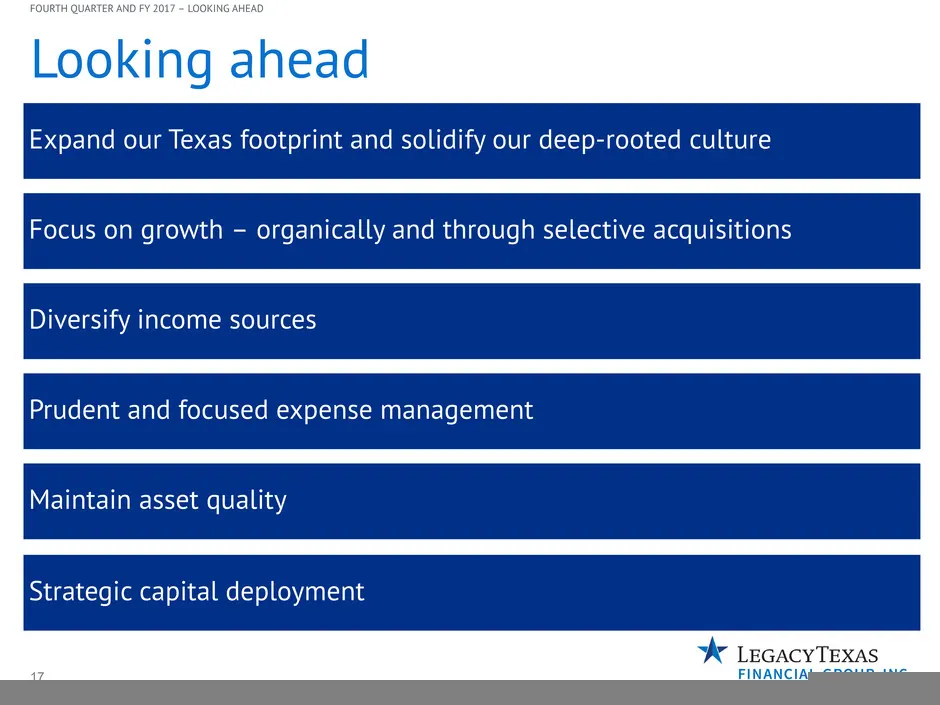
17 Looking ahead Expand our Texas footprint and solidify our deep-rooted culture Focus on growth – organically and through selective acquisitions Diversify income sources Prudent and focused expense management Maintain asset quality Strategic capital deployment FOURTH QUARTER AND FY 2017 – LOOKING A
Slide 18: Manifesto
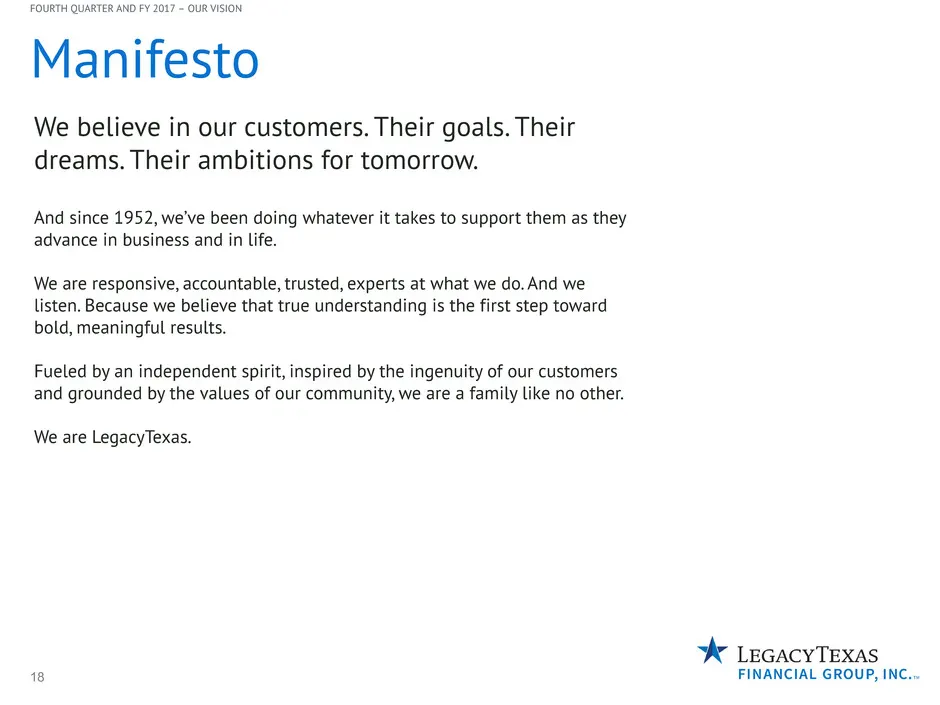
18 Manifesto We believe in our customers. Their goals. Their dreams. Their ambitions for tomorrow. And since 1952, we’ve been doing whatever it takes to support them as they advance in business and in life. We are responsive, accountable, trusted, experts at what we do. And we listen. Because we bel
Slide 19: Appendix
Appendix
Slide 20: Supplemental Information – Non-GAAP Financial Measures
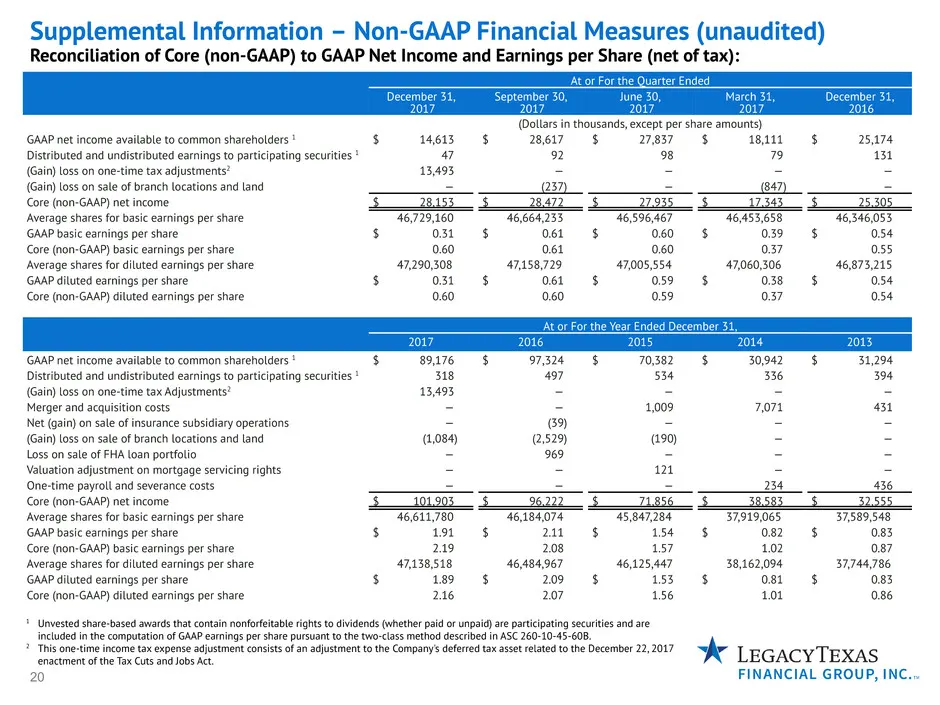
20 Supplemental Information – Non-GAAP Financial Measures (unaudited) Reconciliation of Core (non-GAAP) to GAAP Net Income and Earnings per Share (net of tax): At or For the Quarter Ended December 31, 2017 September 30, 2017 June 30, 2017 March 31, 2017 December 31, 2016 (Dollars in thousands, excep
Slide 21: Supplemental Information – Non-GAAP Financial Measures
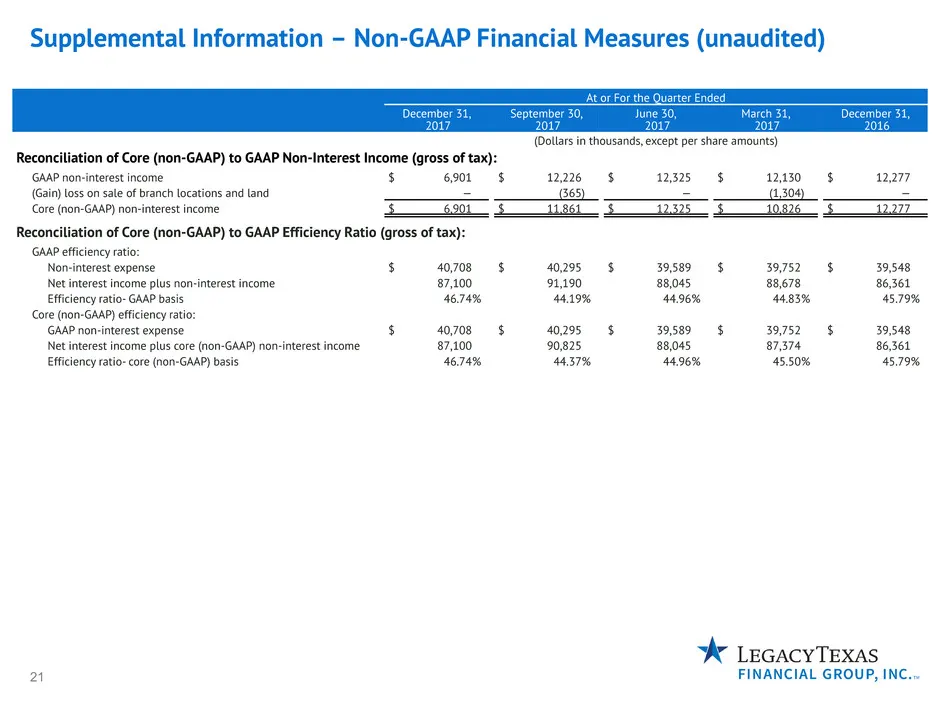
21 Supplemental Information – Non-GAAP Financial Measures (unaudited) At or For the Quarter Ended December 31, 2017 September 30, 2017 June 30, 2017 March 31, 2017 December 31, 2016 (Dollars in thousands, except per share amounts) Reconciliation of Core (non-GAAP) to GAAP Non-Interest Income (gross
Slide 22: Supplemental Information – Non-GAAP Financial Measures
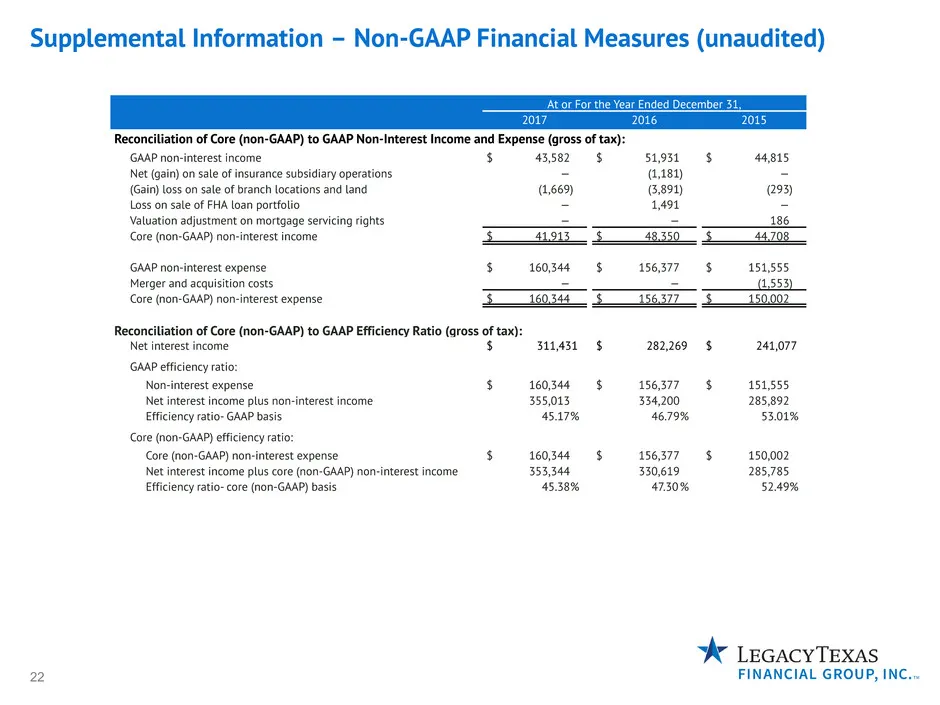
22 Supplemental Information – Non-GAAP Financial Measures (unaudited) At or For the Year Ended December 31, 2017 2016 2015 Reconciliation of Core (non-GAAP) to GAAP Non-Interest Income and Expense (gross of tax): GAAP non-interest income $ 43,582 $ 51,931 $ 44,815 Net (gain) on sale of insurance sub
Slide 23: Supplemental Information – Non-GAAP Financial Measures
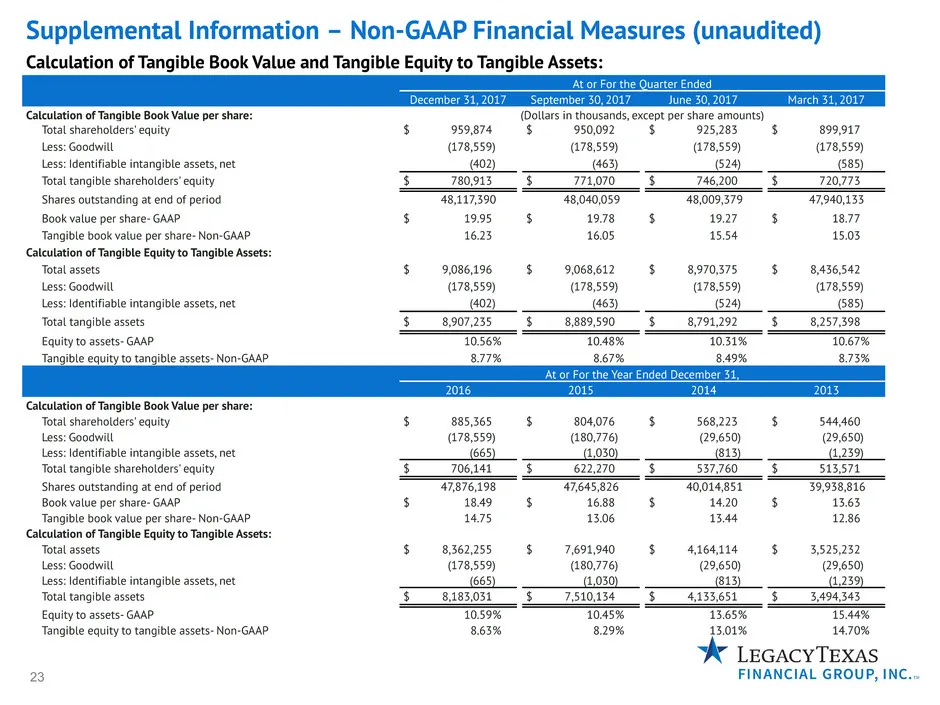
23 Supplemental Information – Non-GAAP Financial Measures (unaudited) Calculation of Tangible Book Value and Tangible Equity to Tangible Assets: At or For the Quarter Ended December 31, 2017 September 30, 2017 June 30, 2017 March 31, 2017 Calculation of Tangible Book Value per share: (Dollars in tho
Slide 24: Supplemental Information – Non-GAAP Financial Measures
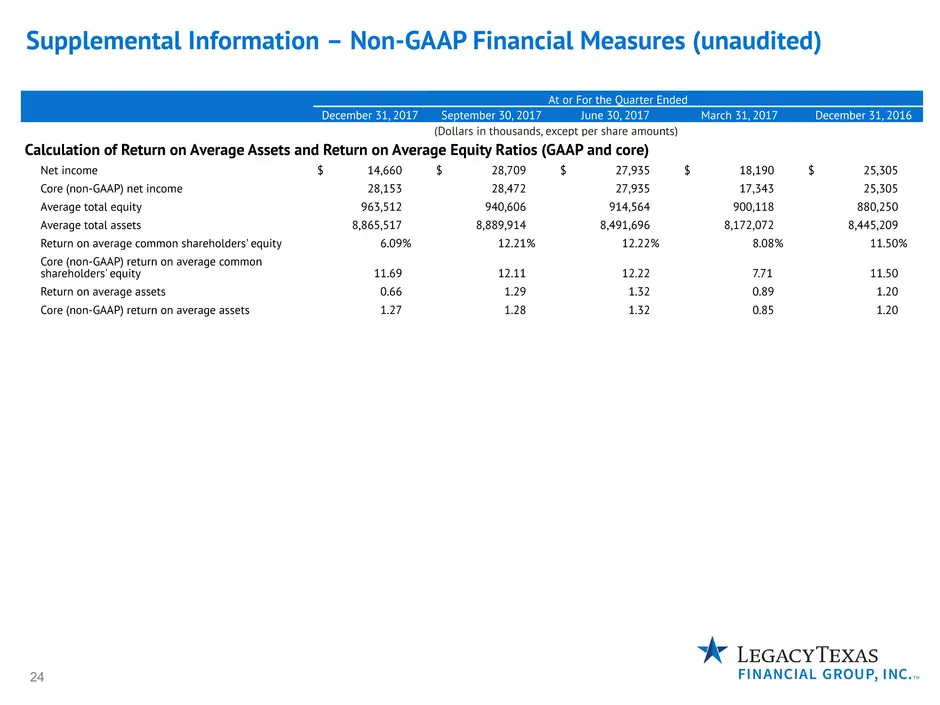
24 Supplemental Information – Non-GAAP Financial Measures (unaudited) At or For the Quarter Ended December 31, 2017 September 30, 2017 June 30, 2017 March 31, 2017 December 31, 2016 (Dollars in thousands, except per share amounts) Calculation of Return on Average Assets and Return on Average Equity
Source: SEC EDGAR · 8-K filed Jan 23, 2018
More decks from LegacyTexas Financial Group Inc
 Merger or Acquisition (June 2019)13 slides · Jun 17, 2019
 Shareholder Meeting (May 2019)14 slides · May 17, 2019
 Q1 2019 Earnings Presentation23 slides · Apr 23, 2019
 Q4 2018 Earnings Presentation25 slides · Jan 22, 2019
 Q3 2018 Earnings Presentation22 slides · Oct 16, 2018
 Q2 2018 Earnings Presentation22 slides · Jul 17, 2018