Newalliance Bancshares — Investor Presentation (September 2006)
8 slides from Newalliance Bancshares's investor presentation, Sep 13, 2006
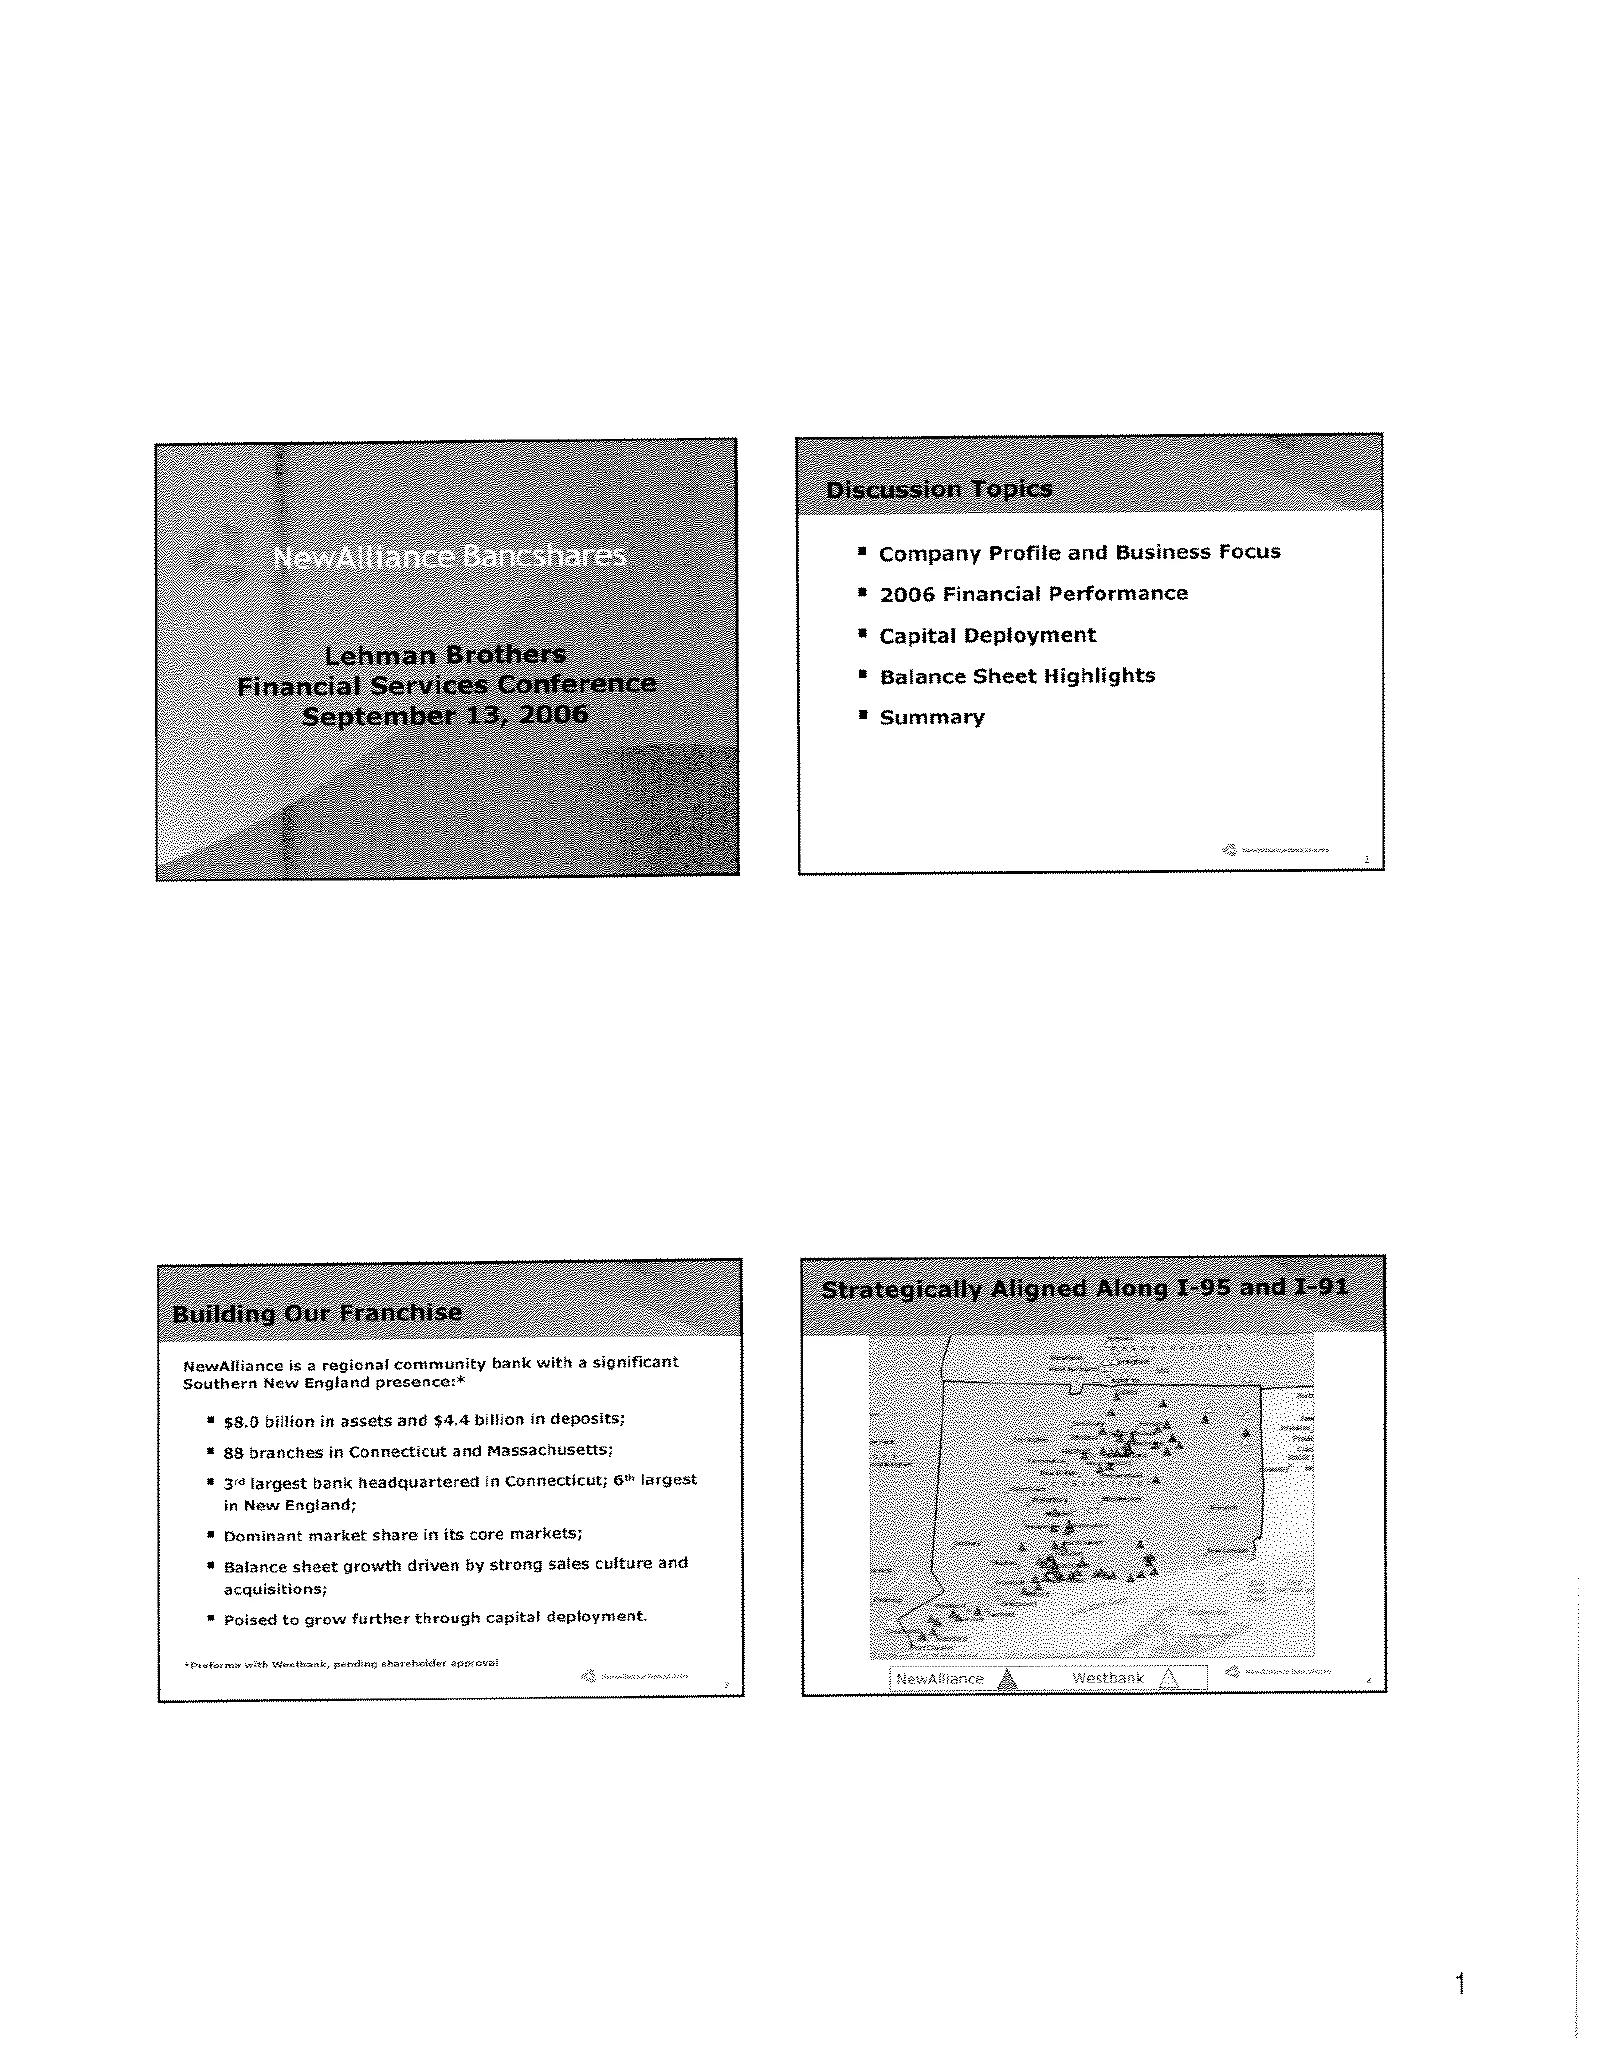
Slide 1: NewAlliance is a regional community bank with a significant Southern New England presence
NewaAlliance is a regional community bank with a significant Southern New England presesce:* $8.0 billion in assets and $4.4 billion in deposits; 88 branches in Connecticut and Massachusetts; * 3° largest bank headquartered in Connecticut; 6” largest in New Engtand; *® Dominant market share is its c
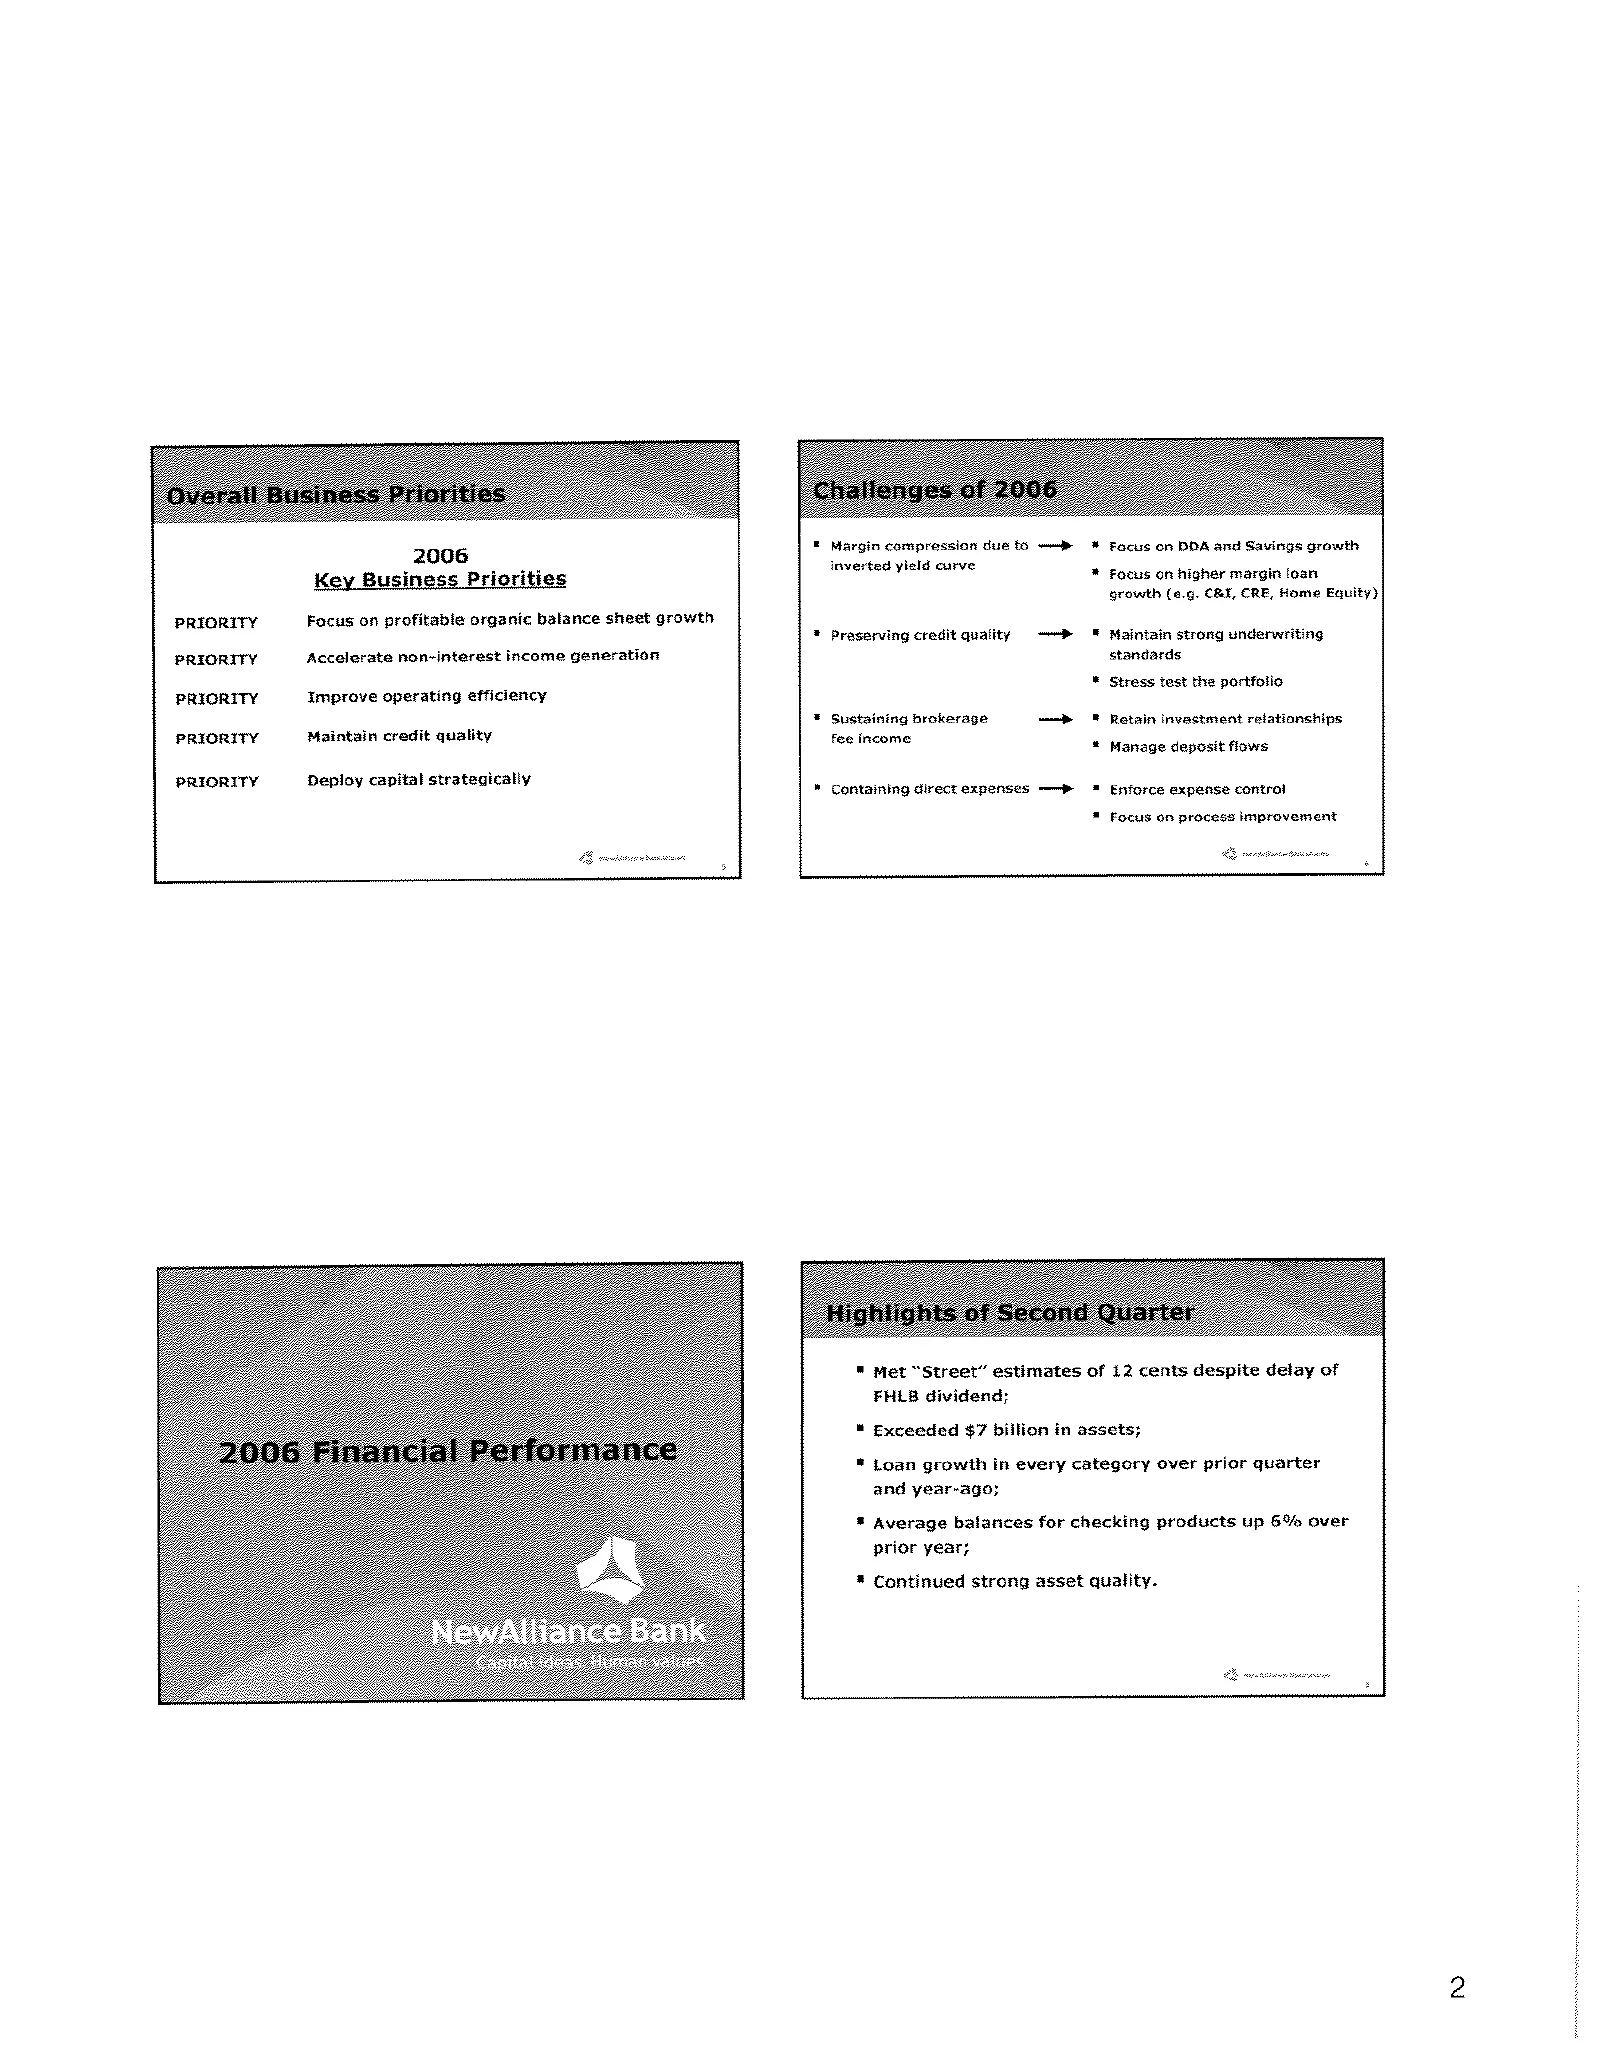
Slide 2: 2006 Key Business Priorities
PRIORITY PRIORITY PRIORITY PRIORITY PRIORITY 2006 Key Business Priorities Facus on profitable organic balance sheet growth Accelerate non-interest income generation Improve operating efficiency Maintain credit quality Deploy capital strategically Margin compression due to <p * inverted yield curve *
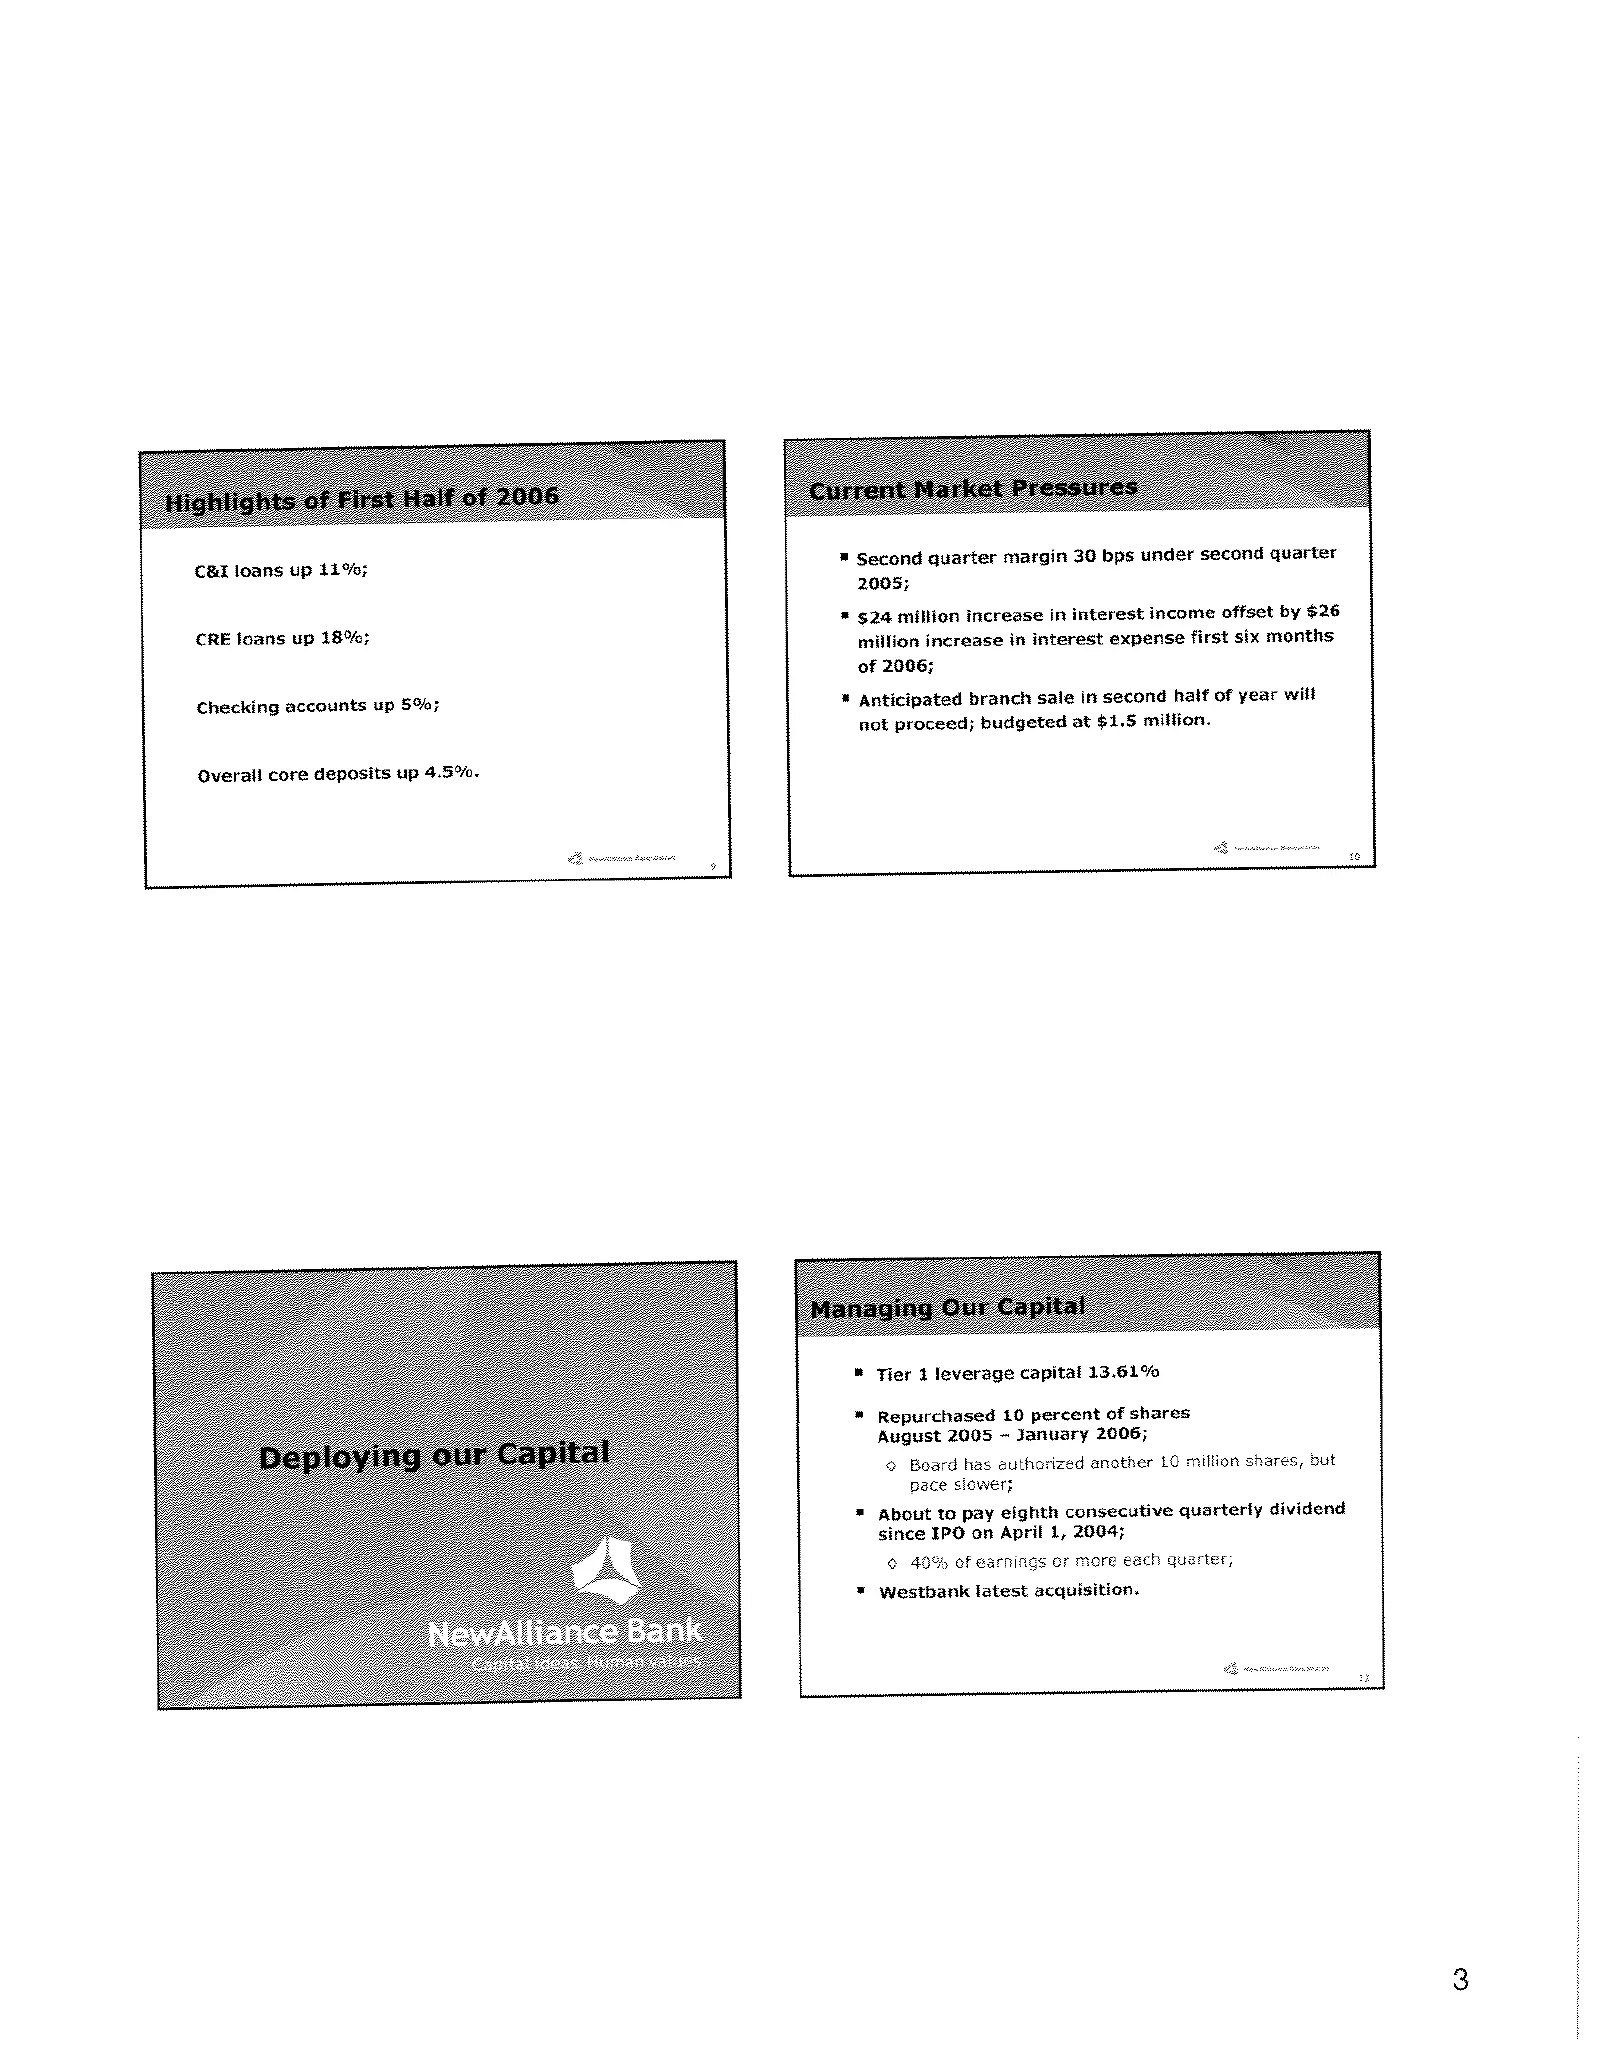
Slide 3: 2006 Financial Performance and Capital Deployment
C&E loans up 11%; CRE foans up 18%; Checking accounts up 5%; Overall core deposits up 4.5%~ * Second quarter margin 30 bps under second quarter 2005; * $24 million increase in interest income offset by $26 million increase in interest expense first six months of 2006; * Anticipated branch sale in se
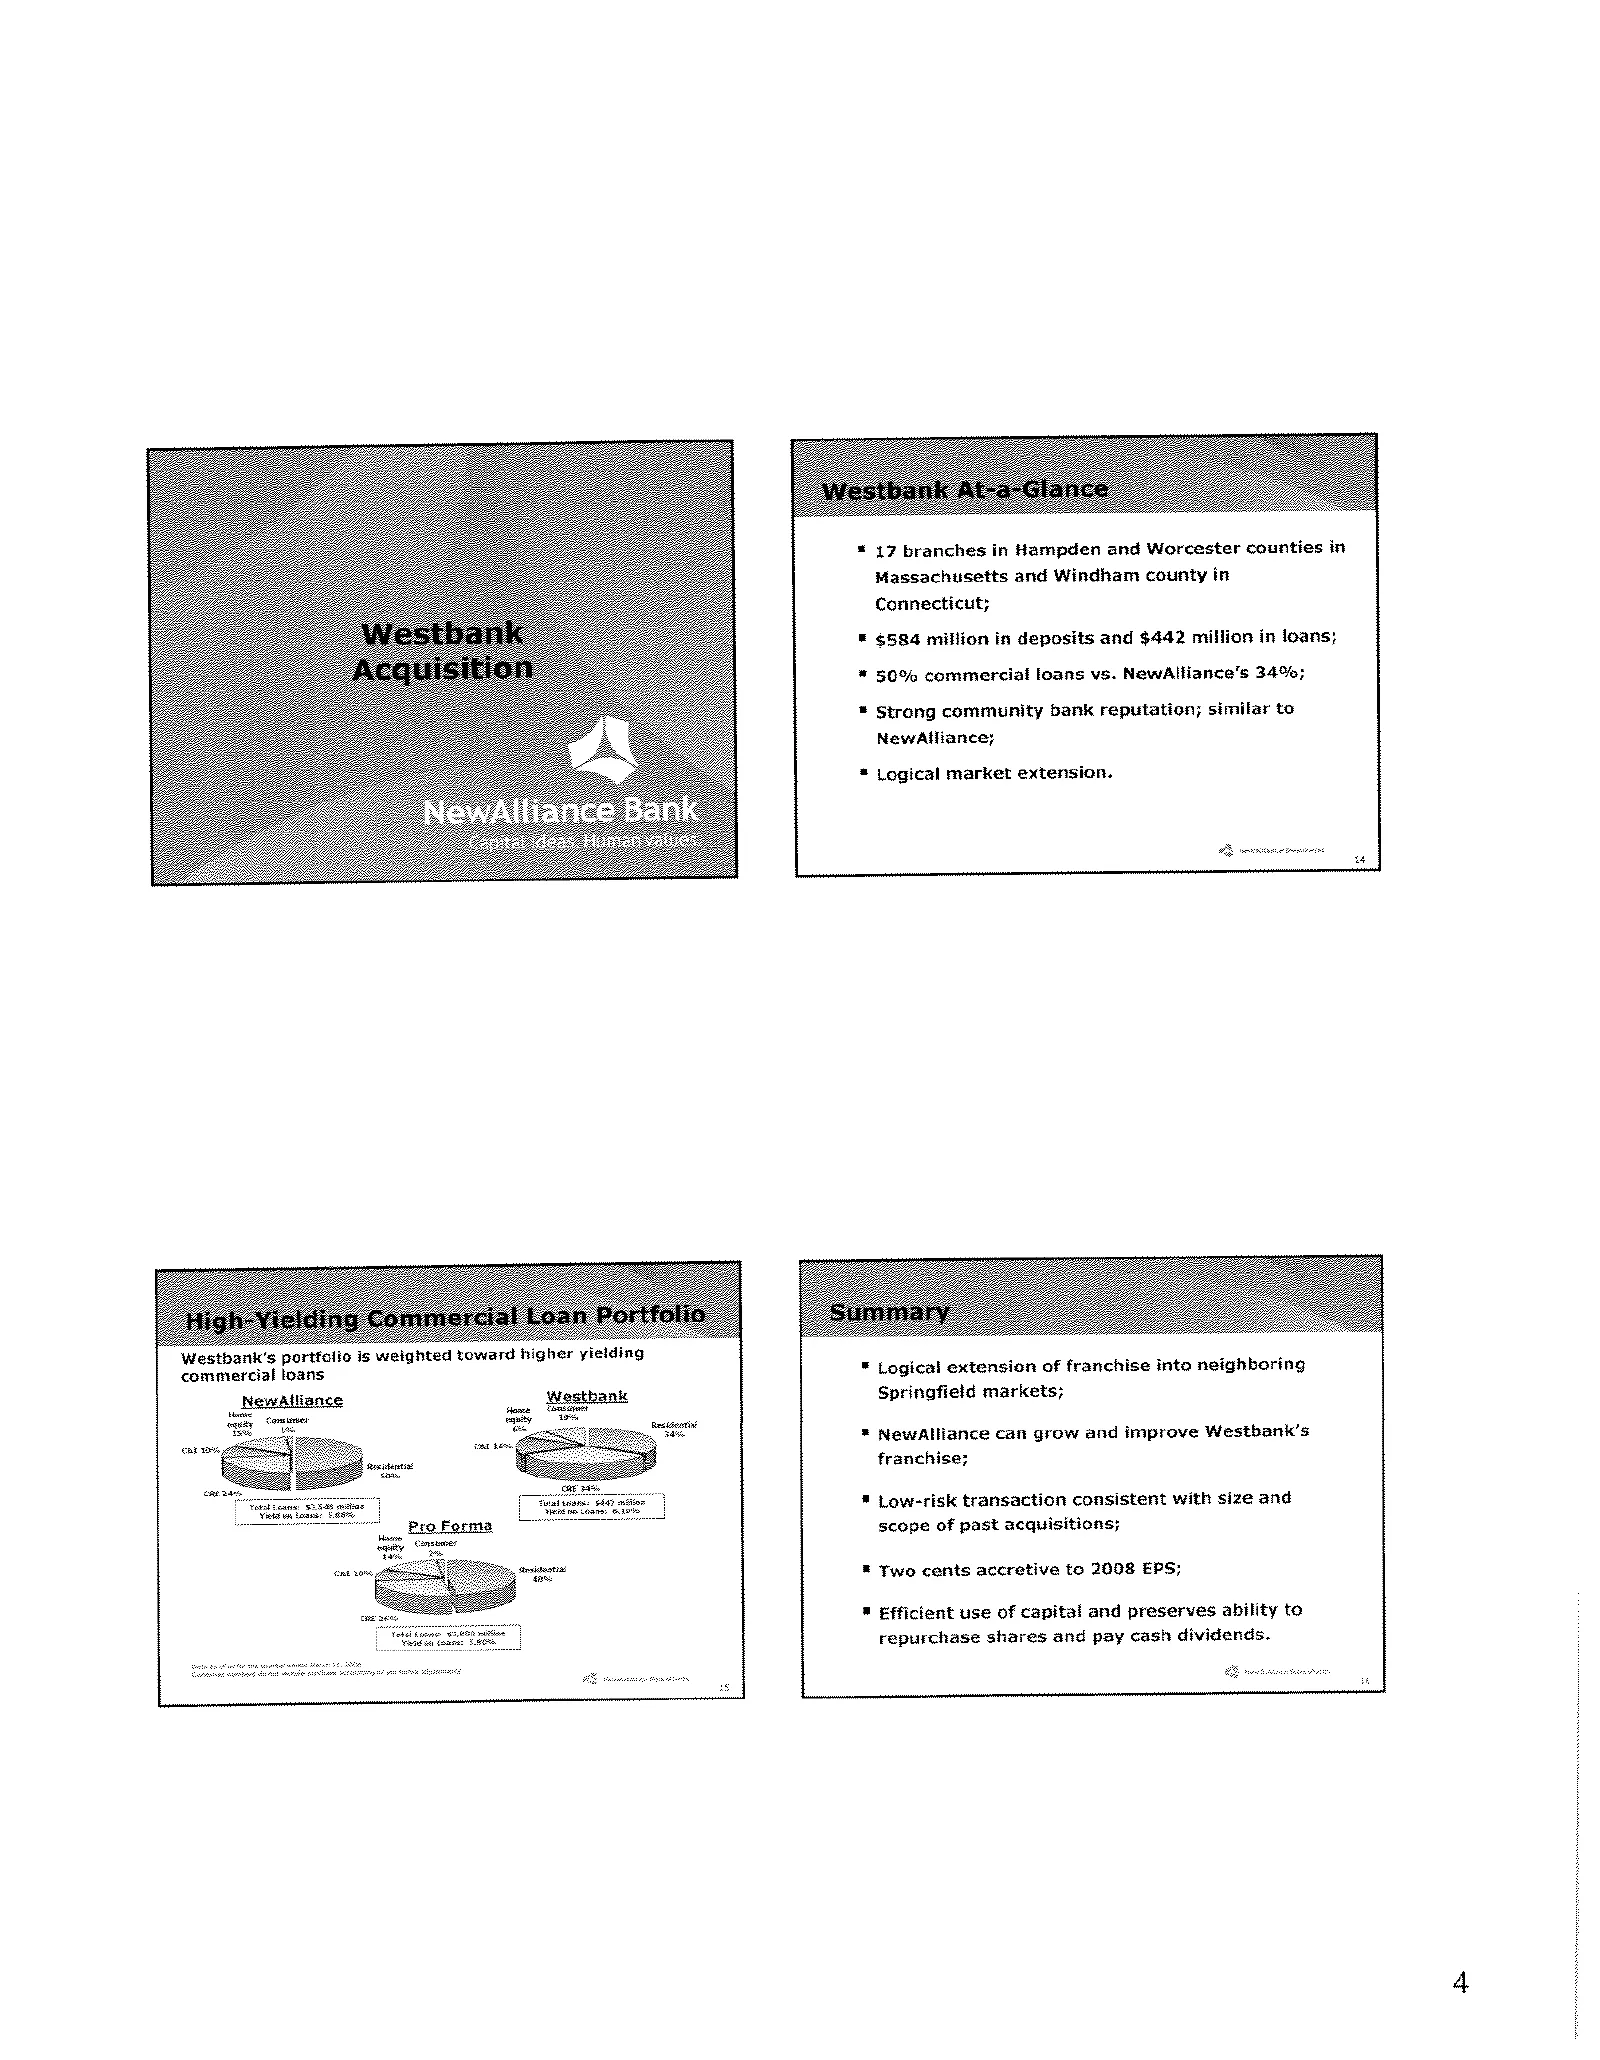
Slide 4: Westbank acquisition
1? branches in Hampden and Worcester counties in Massachusetts and Windham county in Connecticut; $584 million in deposits and $442 million in loans; 50% commercial loans vs. NewAlliance’s 34%; Strong community bank reputation; similar to NewaAlliance; Logical market extension. Westbank’s portfolio
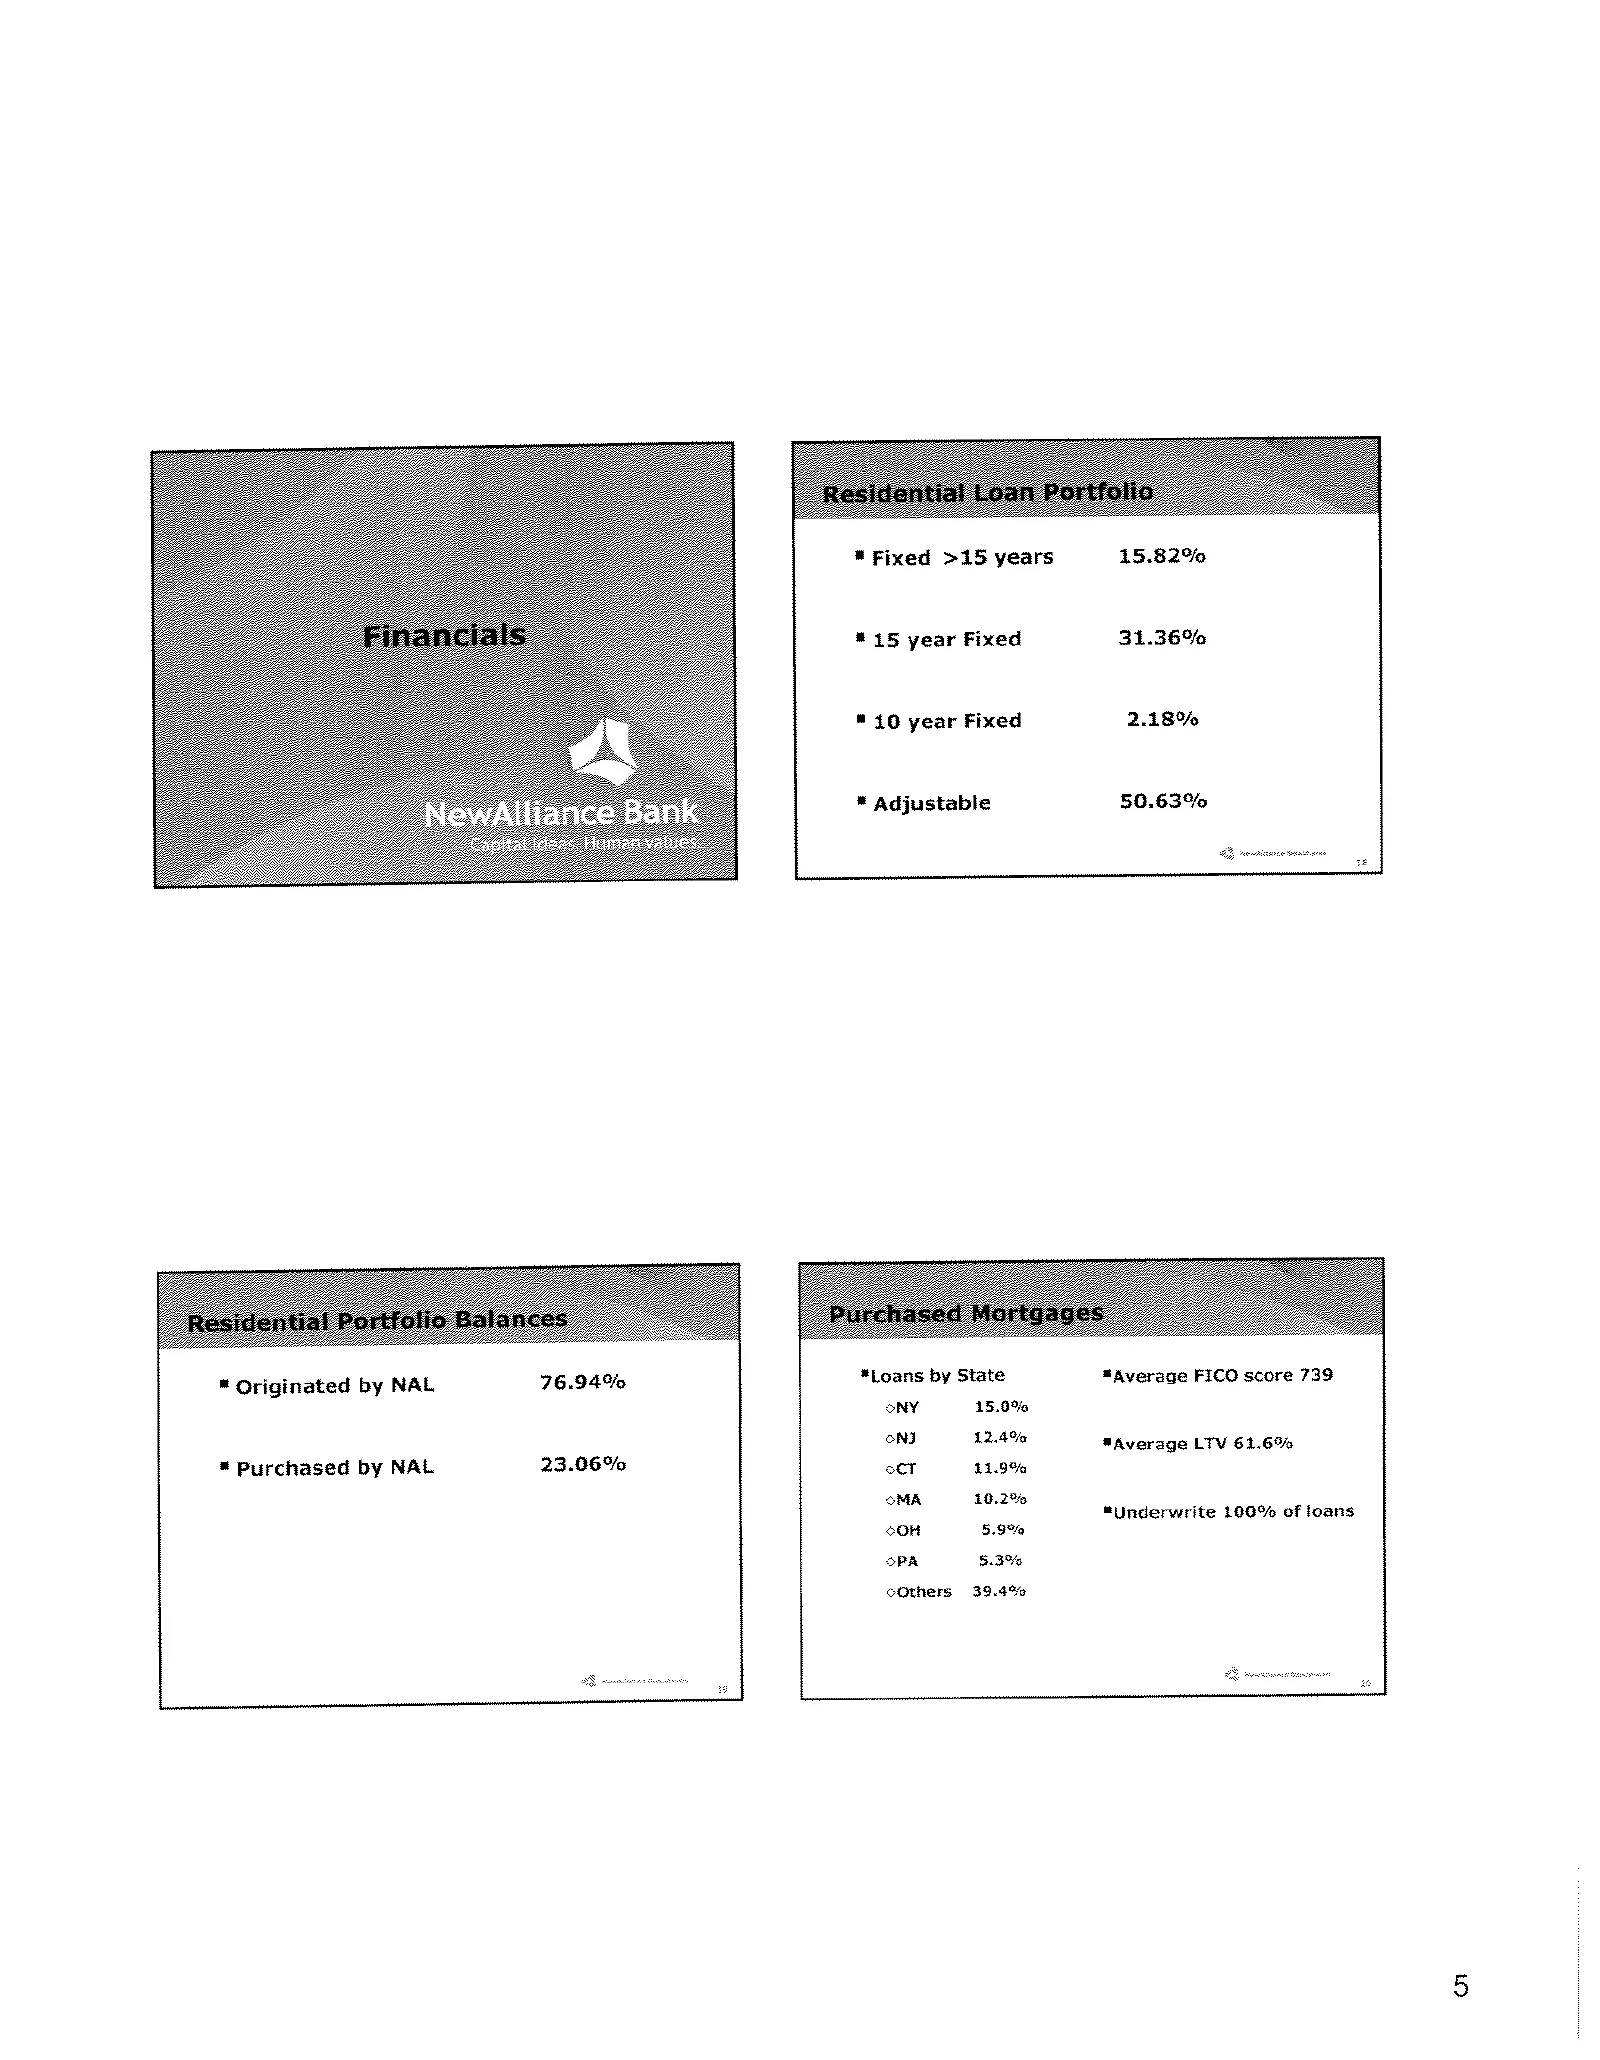
Slide 5: Loan portfolio composition
™ Originated by NAL * Purchased by NAL 76.94% 23.06% & * Fixed >15 years * 15 year Fixed “40 year Fixed * adjustable 15.82% 31.36% 2.18% 50.63% oNY OPA *Loans by State 15.0% 12.4% 19% 10.2% 5.9% 5.3% cOthers 39.4% *Average FICO score 739 *Average LTV 61.6% *Underwrite 106% of loans
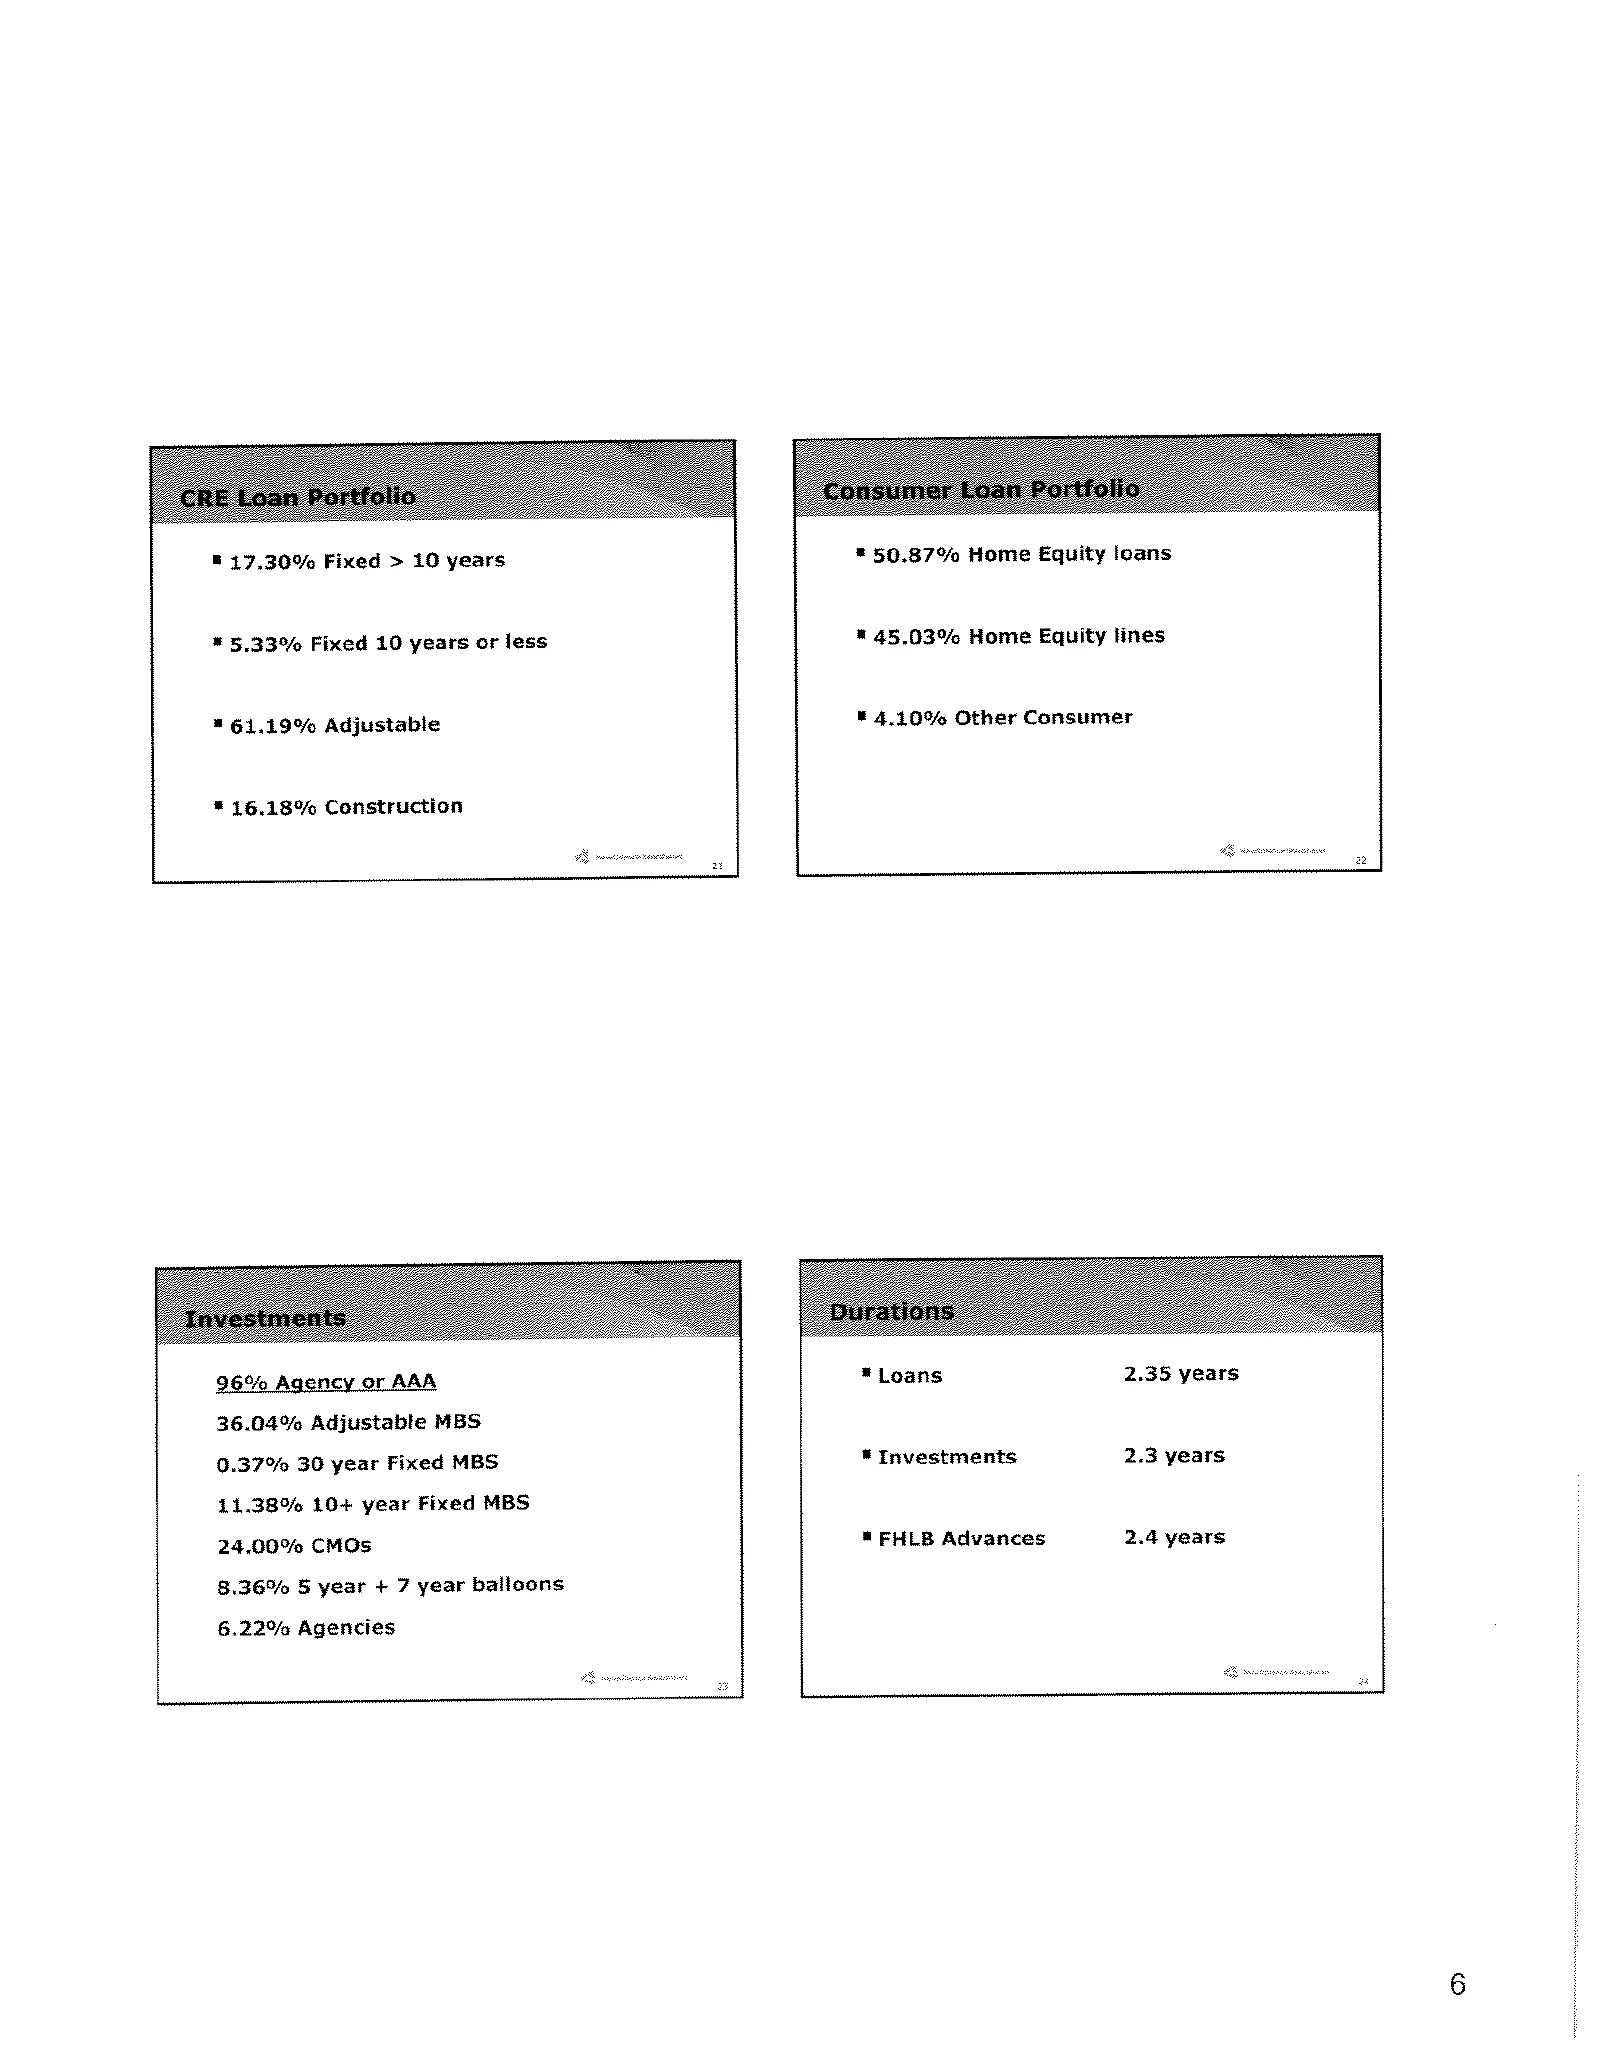
Slide 6: Loan and investment portfolio breakdown
= 17.30% Fixed > 10 years * 5.33% Fixed 10 years or less * 61.19% Adjustable * 16.18% Construction ® 50.87% Home Equity loans * 45.03% Home Equity lines * 4.10% Other Consumer 96% Agency or AAA 36.04% Adjustable MBS 0.37% 30 year Fixed MBS 11.38% 10+ year Fixed MBS 24.00% CMOs 8.36% 5 year + 7 year
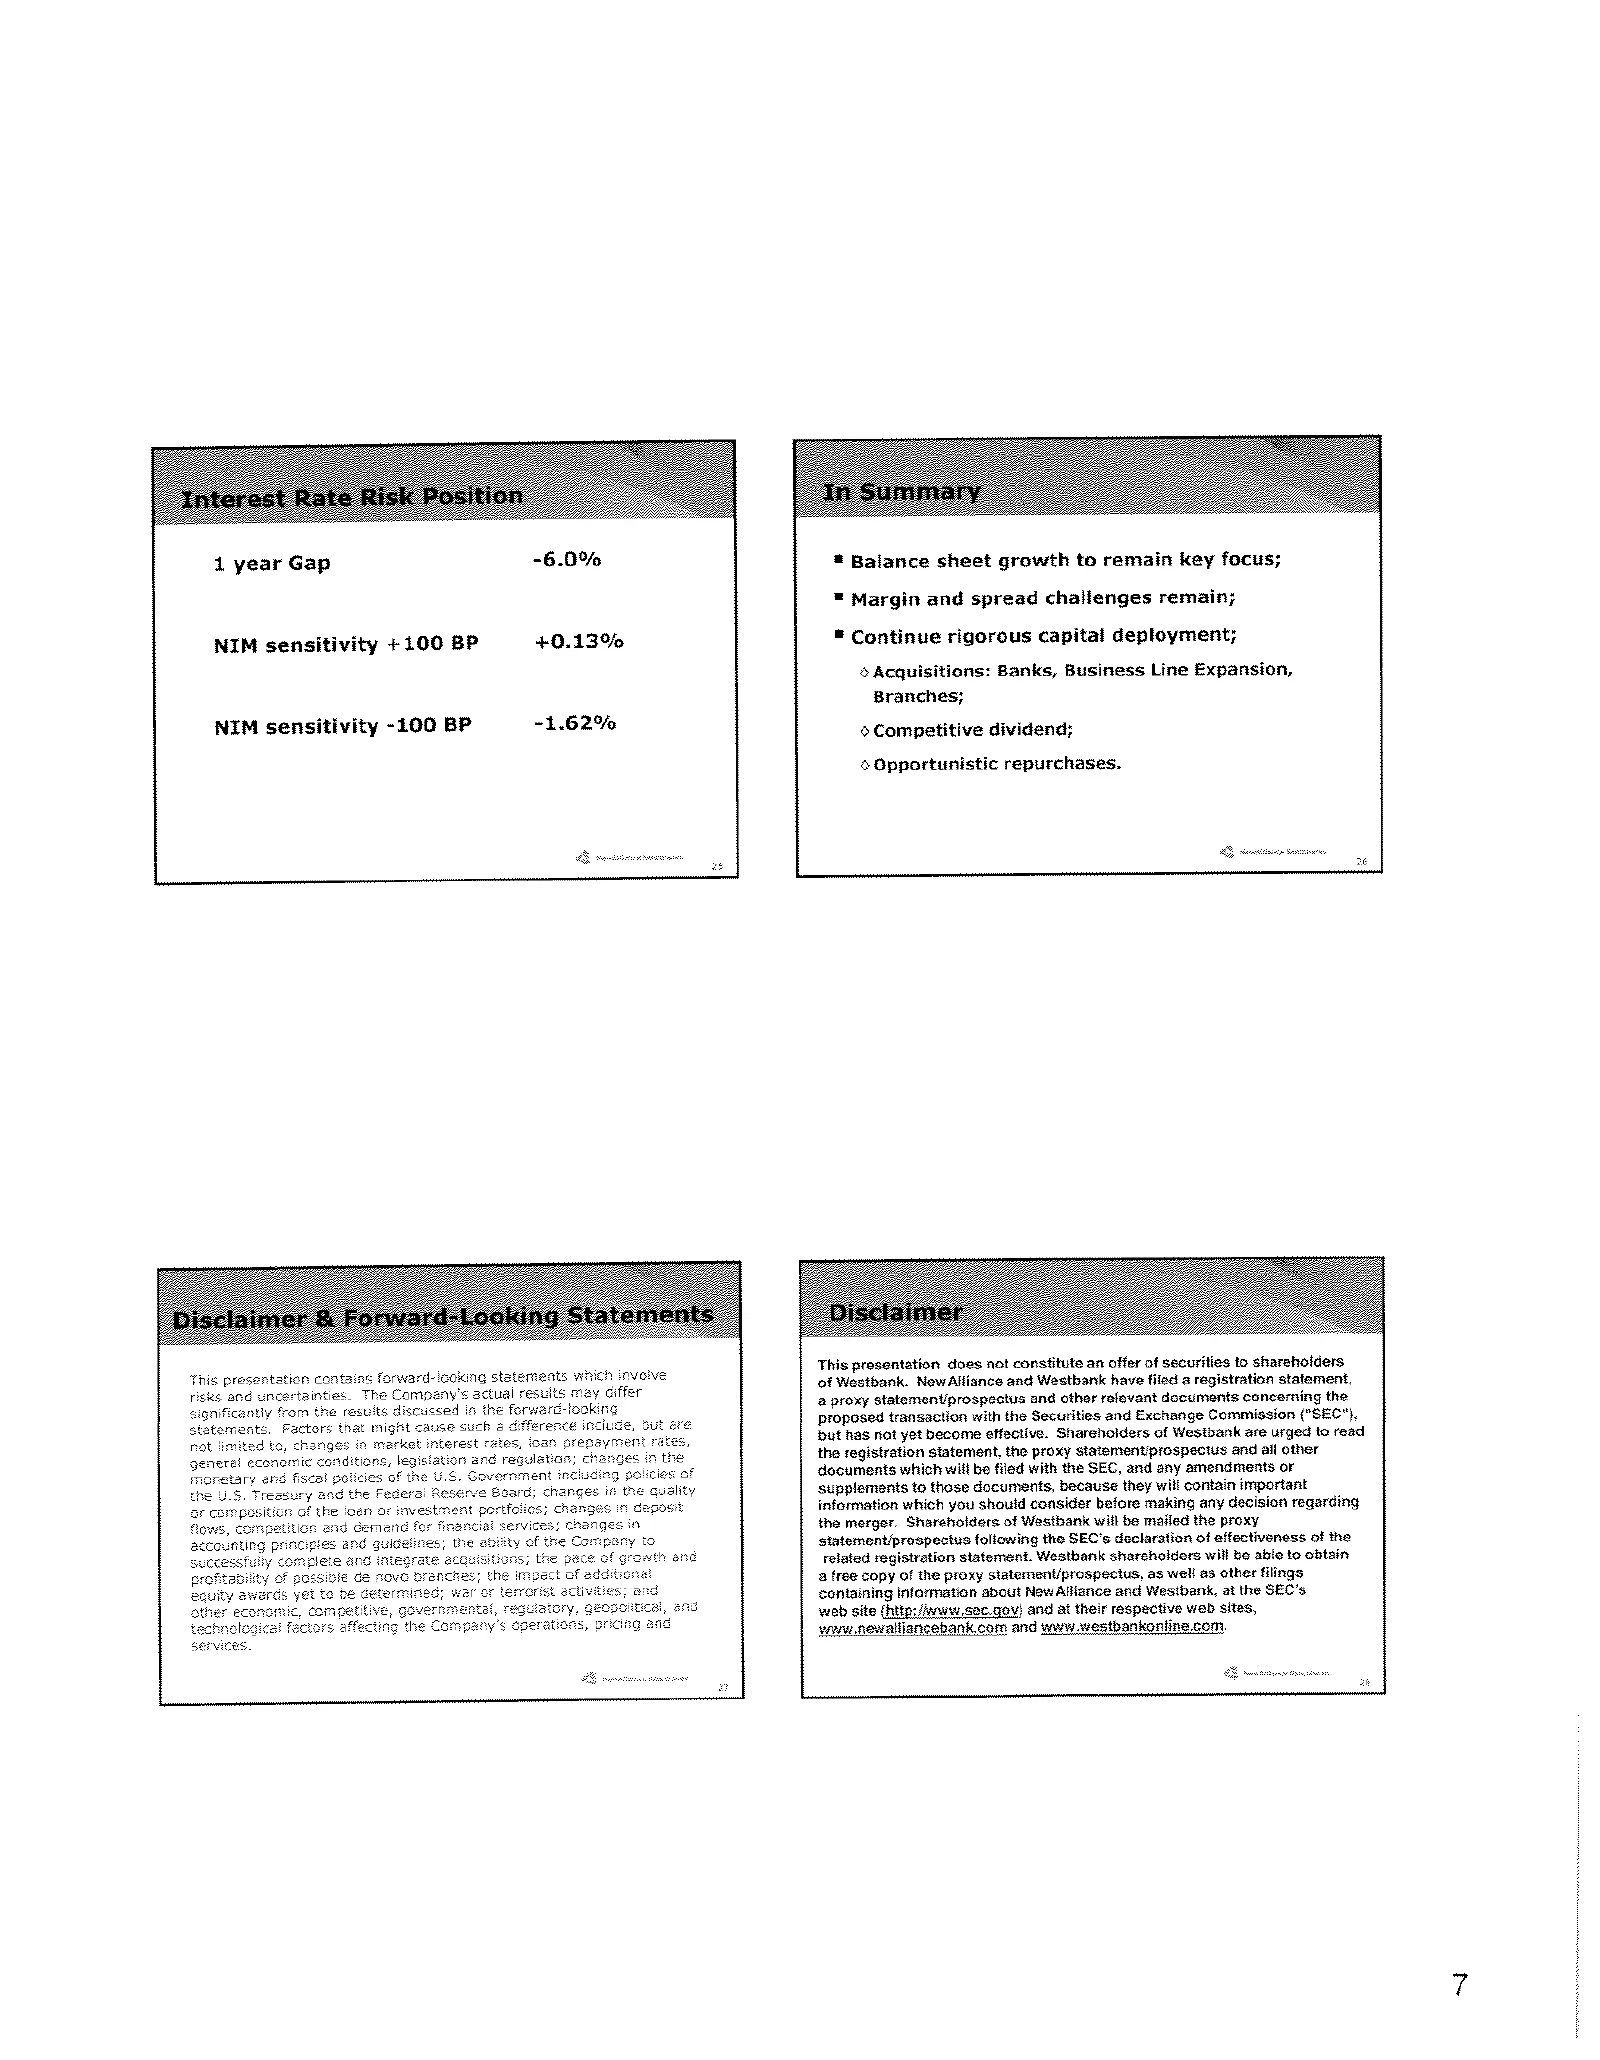
Slide 7: Balance sheet sensitivity and summary
4 year Gap -6.0% NIM sensitivity +100 BP +0.13% NIM sensitivity -100 BP -1.62% ® Balance sheet growth to ramain key focus; = Margin and spread challenges remain; * Continue rigorous capital deployment; Acquisitions: Banks, Business Line Expansion, Branches; o Competitive dividend; ¢ Opportunistic re

Slide 8: :
:
Source: SEC EDGAR · 8-K filed Sep 13, 2006
More decks from Newalliance Bancshares Inc
 Merger or Acquisition (November 2010)45 slides · Nov 18, 2010
 Stifel, Nicolaus & Company, Inc. Bank and Thrift Conference 201037 slides · Nov 3, 2010
 Merger or Acquisition (August 2010)25 slides · Aug 25, 2010
 Merger or Acquisition (August 2010)24 slides · Aug 19, 2010
 Merger or Acquisition (August 2010)23 slides · Aug 19, 2010
 Q2 2010 Earnings Presentation31 slides · Jul 28, 2010