El.En. S.p.A. · MIL:ELN
El.En — El. En Spa Ord New — H1 2026 Earnings Presentation
11 slides from El.En's earnings presentation, Sep 11, 2026

Slide 1: Conference Call H1 2026 Financial Results
COMPANY PRESENTATION Conference Call H1 2026 Financial results Sept. 11th , 2026
Slide 2: Disclaimer
DISCLAIMER 2 Certain statements in this slide show, including those addressing the Company’s beliefs, plans, objectives, estimates or expectations of possible future results or events, are forward-looking statements. Forward-looking statements involve known or unknown risks, including general econom
Slide 3: Highlights – H1 2026
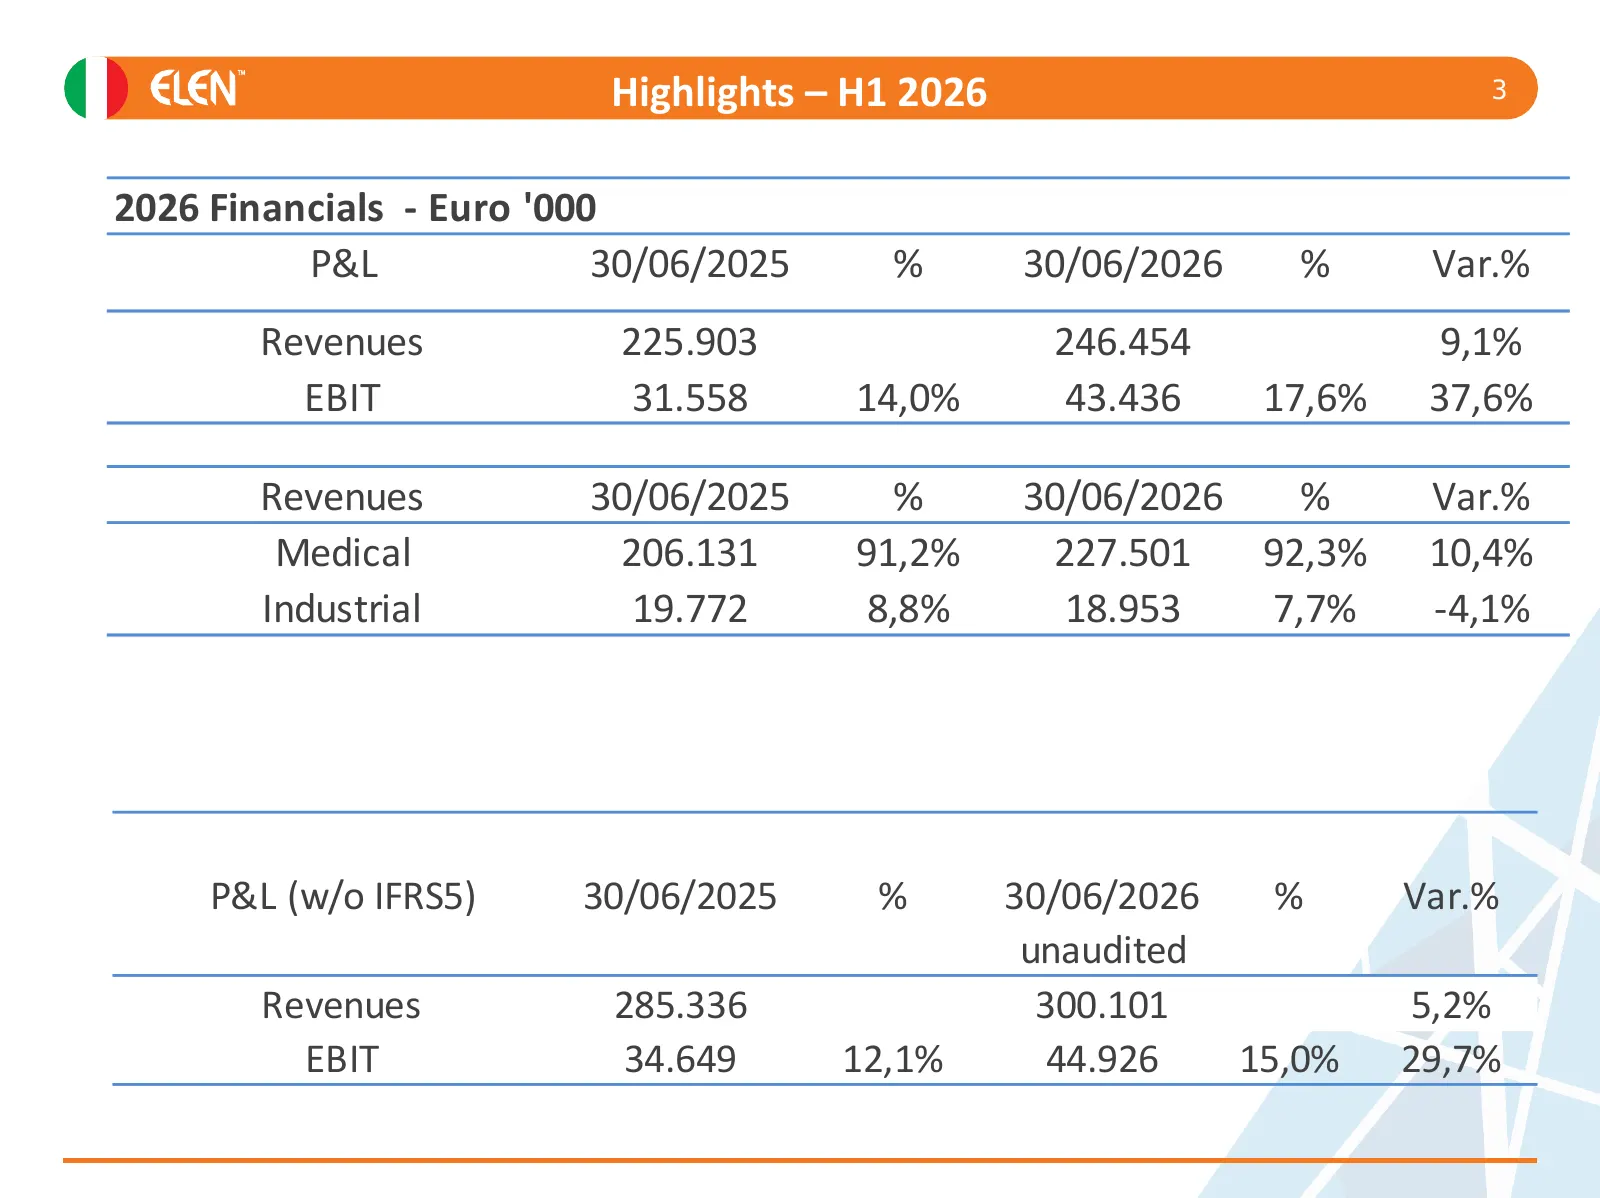
Highlights – H1 2026 3 2026 Financials - Euro '000 P&L 30/06/2025 % 30/06/2026 % Var.% Revenues 225.903 246.454 9,1% EBIT 31.558 14,0% 43.436 17,6% 37,6% Revenues 30/06/2025 % 30/06/2026 % Var.% Medical 206.131 91,2% 227.501 92,3% 10,4% Industrial 19.772 8,8% 18.953 7,7% -4,1% P&L (w/o IFRS5) 30/06/
Slide 4: Income Statement
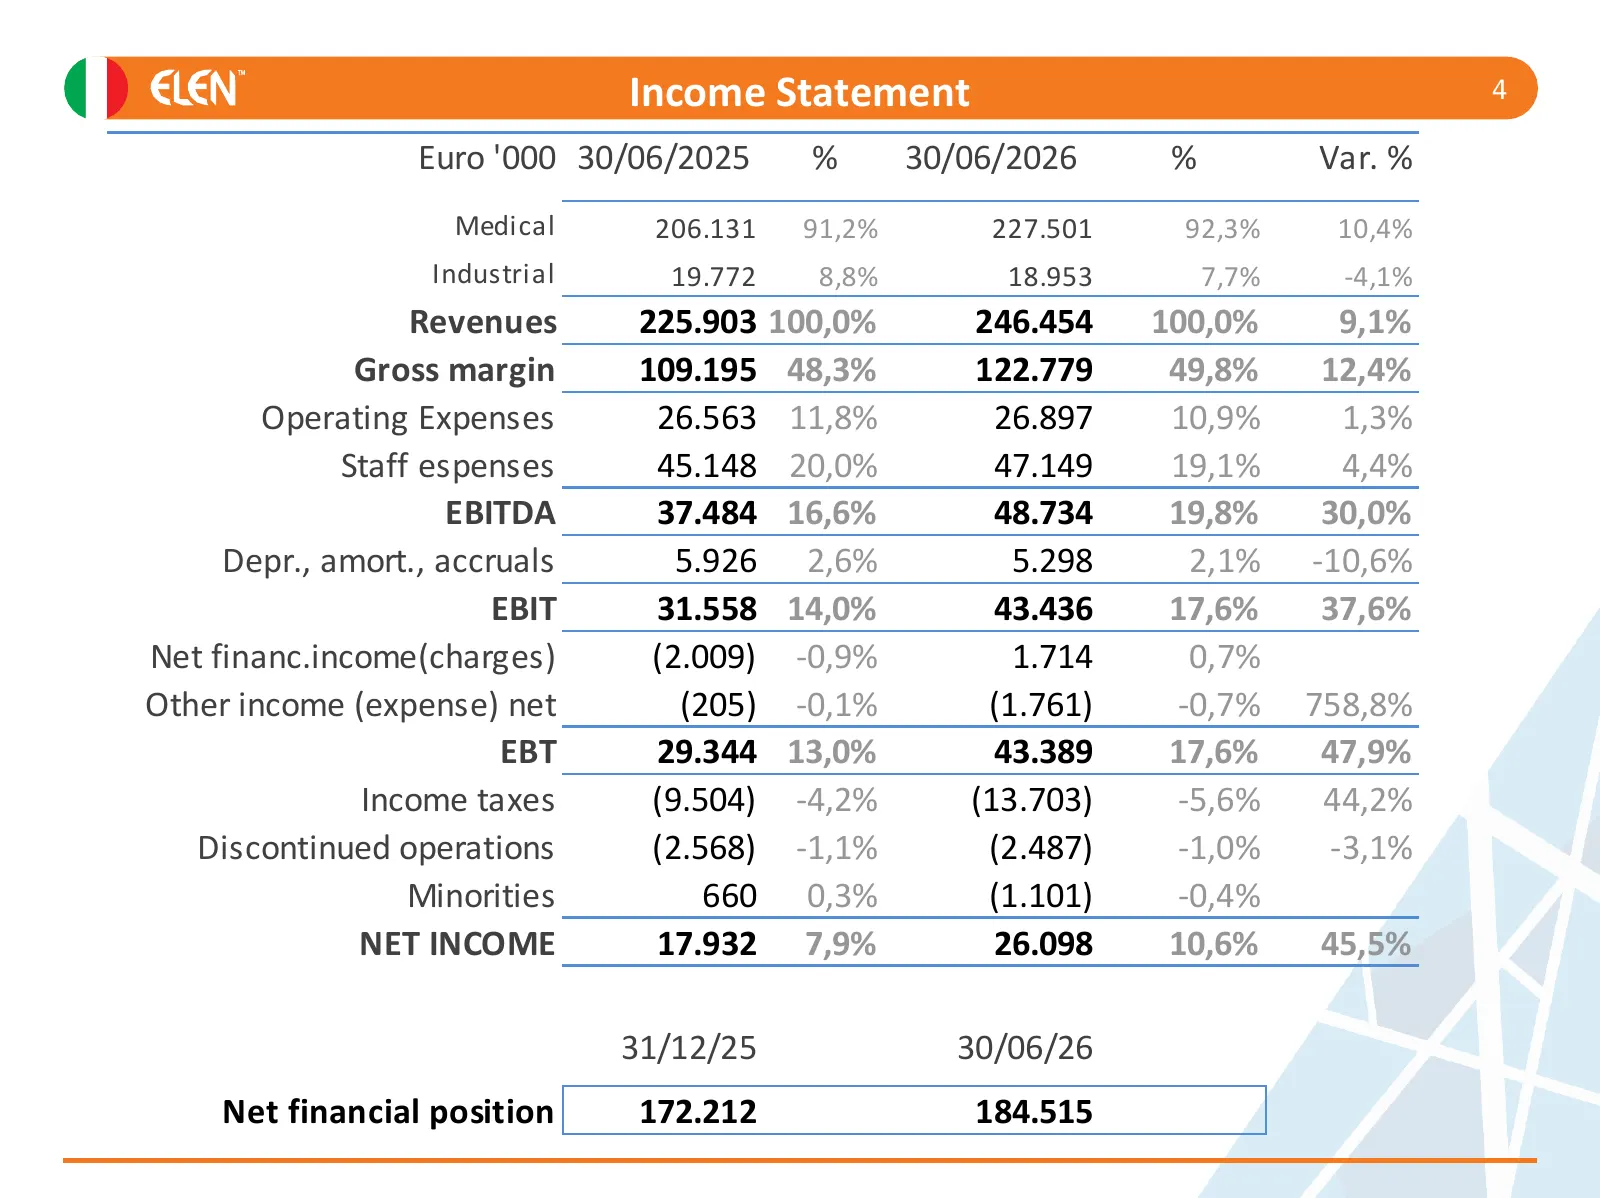
Income Statement 4 Euro '000 30/06/2025 % 30/06/2026 % Var. % Medical 206.131 91,2% 227.501 92,3% 10,4% Industrial 19.772 8,8% 18.953 7,7% -4,1% Revenues 225.903 100,0% 246.454 100,0% 9,1% Gross margin 109.195 48,3% 122.779 49,8% 12,4% Operating Expenses 26.563 11,8% 26.897 10,9% 1,3% Staff espenses
Slide 5: Income Statement w/o IFRS5
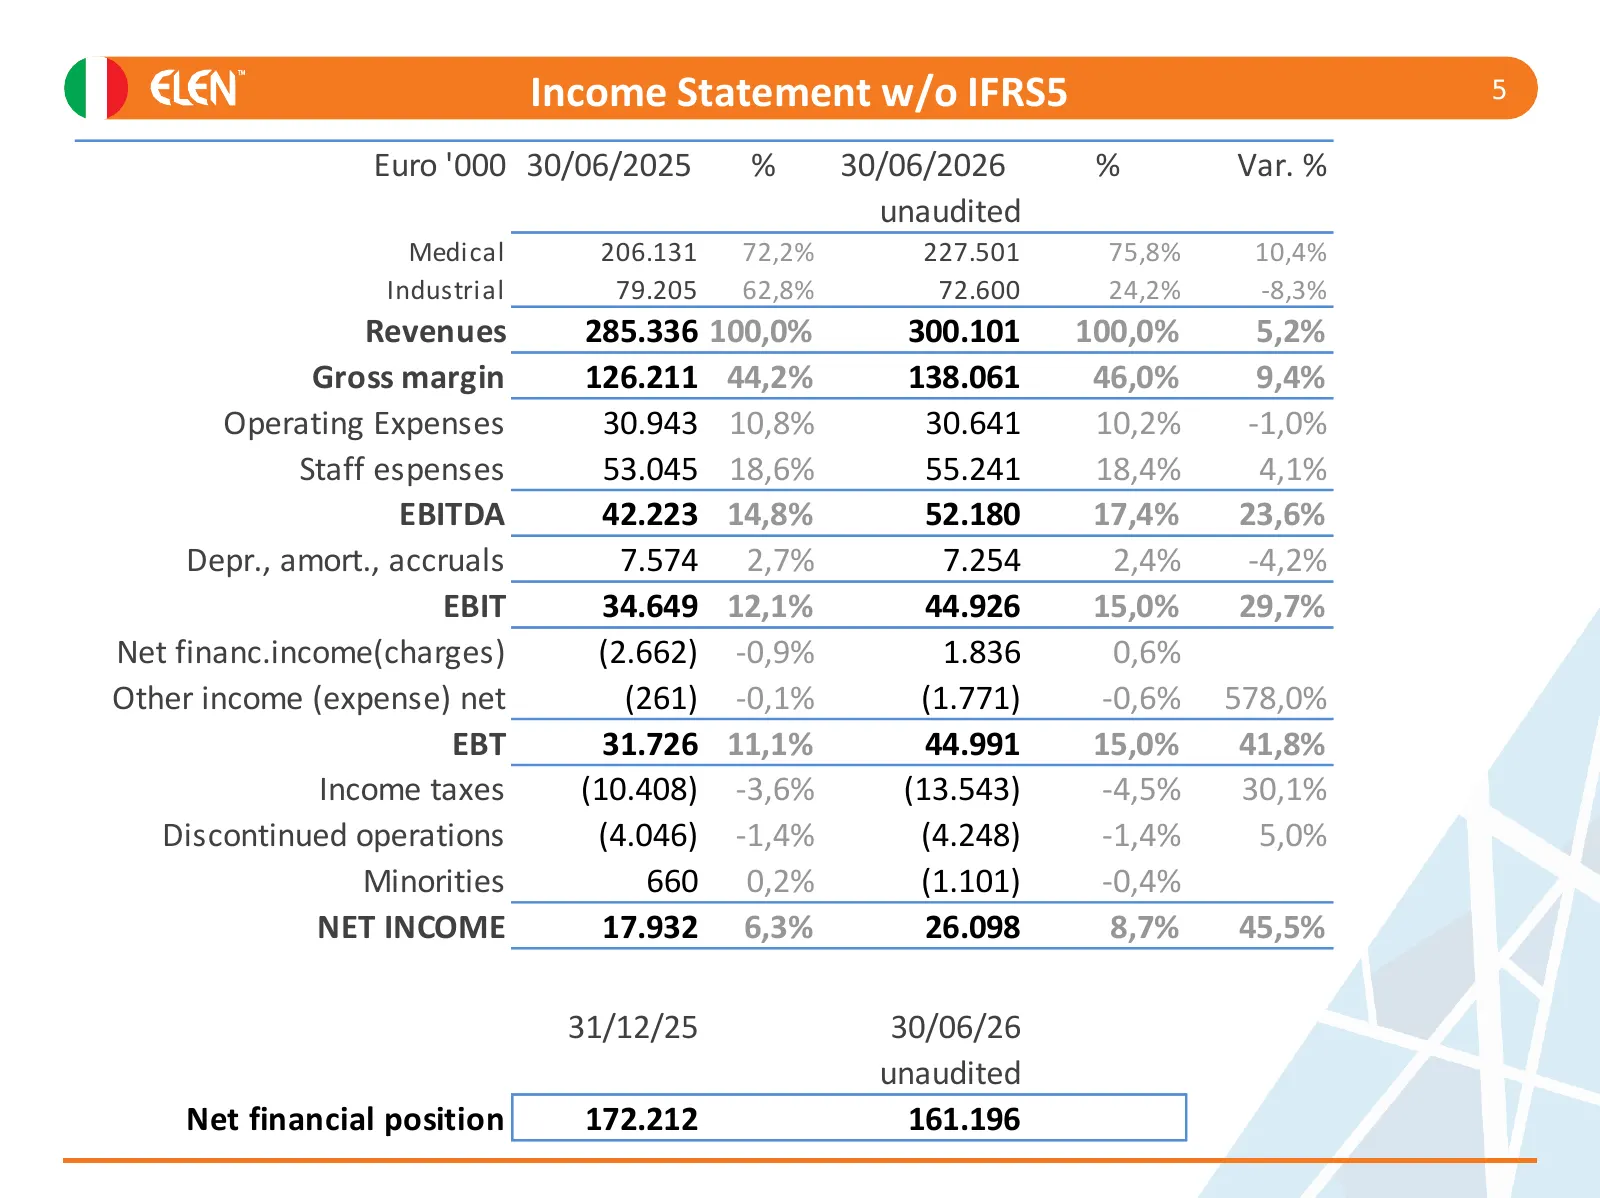
Income Statement w/o IFRS5 5 Euro '000 30/06/2025 % 30/06/2026 % Var. % unaudited Medical 206.131 72,2% 227.501 75,8% 10,4% Industrial 79.205 62,8% 72.600 24,2% -8,3% Revenues 285.336 100,0% 300.101 100,0% 5,2% Gross margin 126.211 44,2% 138.061 46,0% 9,4% Operating Expenses 30.943 10,8% 30.641 10,2
Slide 6: Balance Sheet
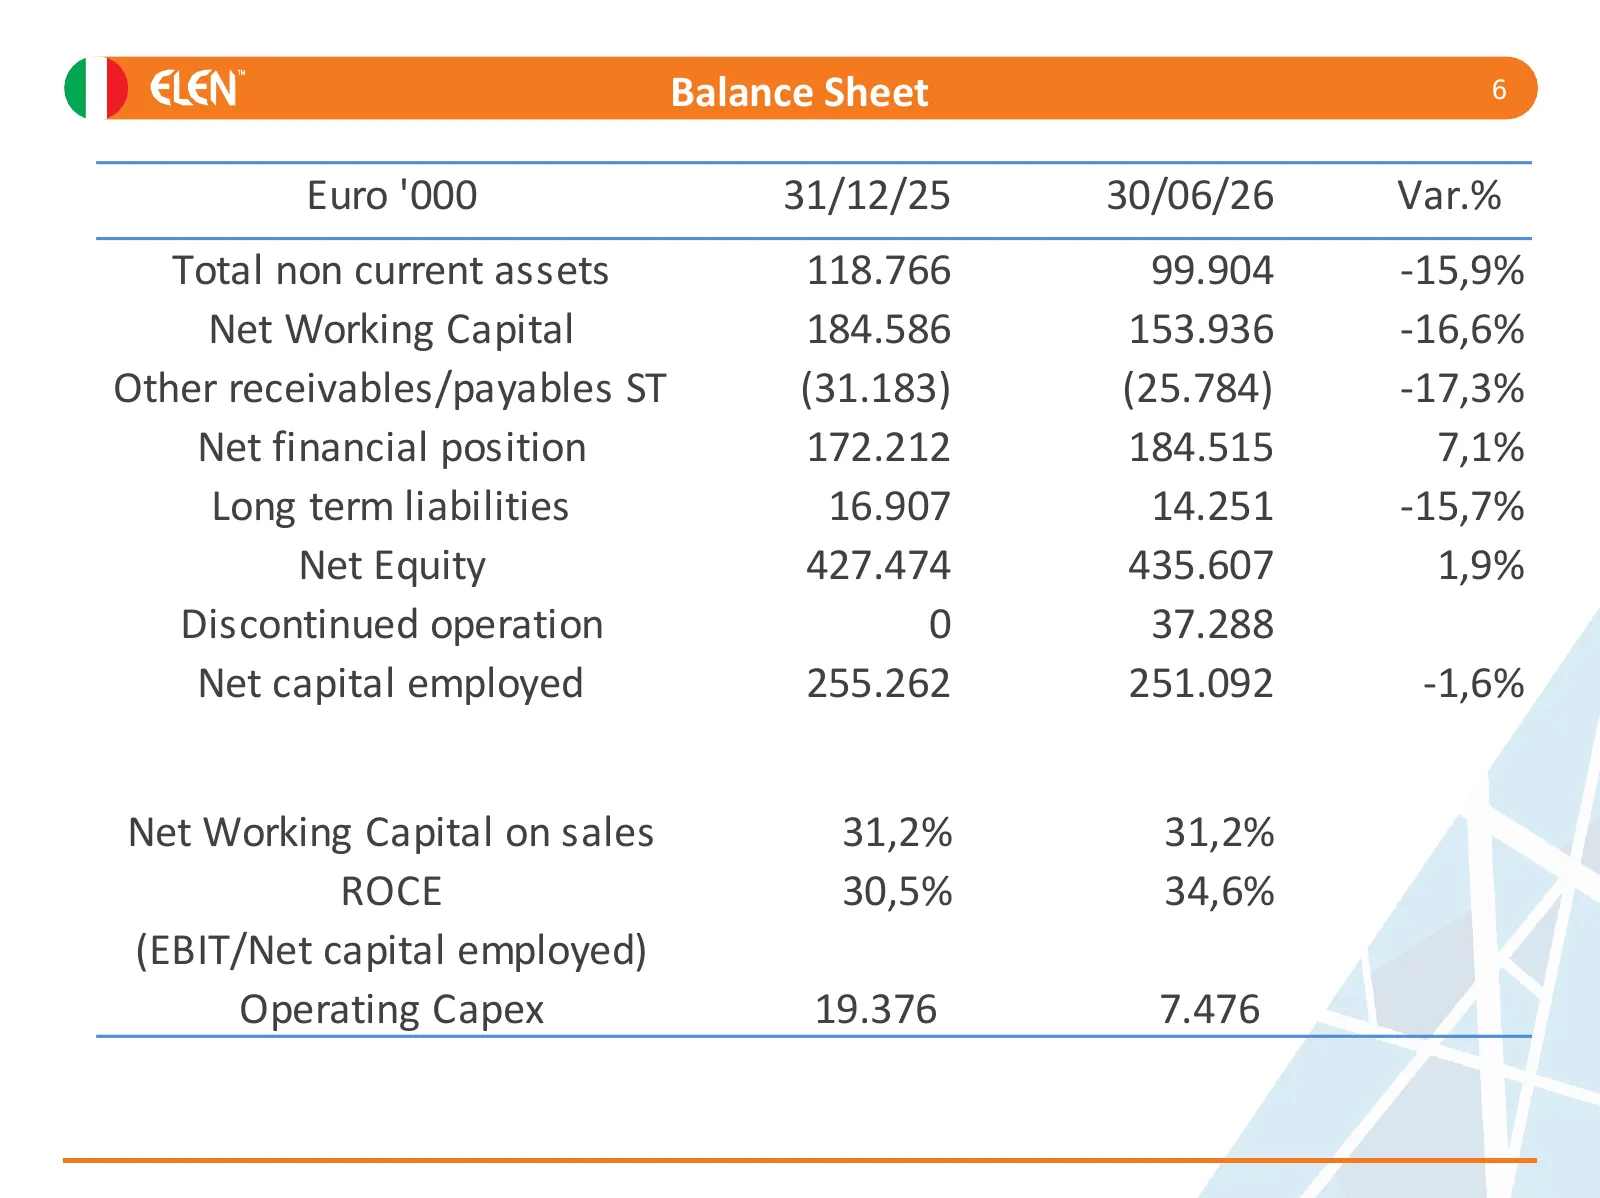
Balance Sheet 6 Euro '000 31/12/25 30/06/26 Var.% Total non current assets 118.766 99.904 -15,9% Net Working Capital 184.586 153.936 -16,6% Other receivables/payables ST (31.183) (25.784) -17,3% Net financial position 172.212 184.515 7,1% Long term liabilities 16.907 14.251 -15,7% Net Equity 427.474
Slide 7: Cash Flow – H1 2026
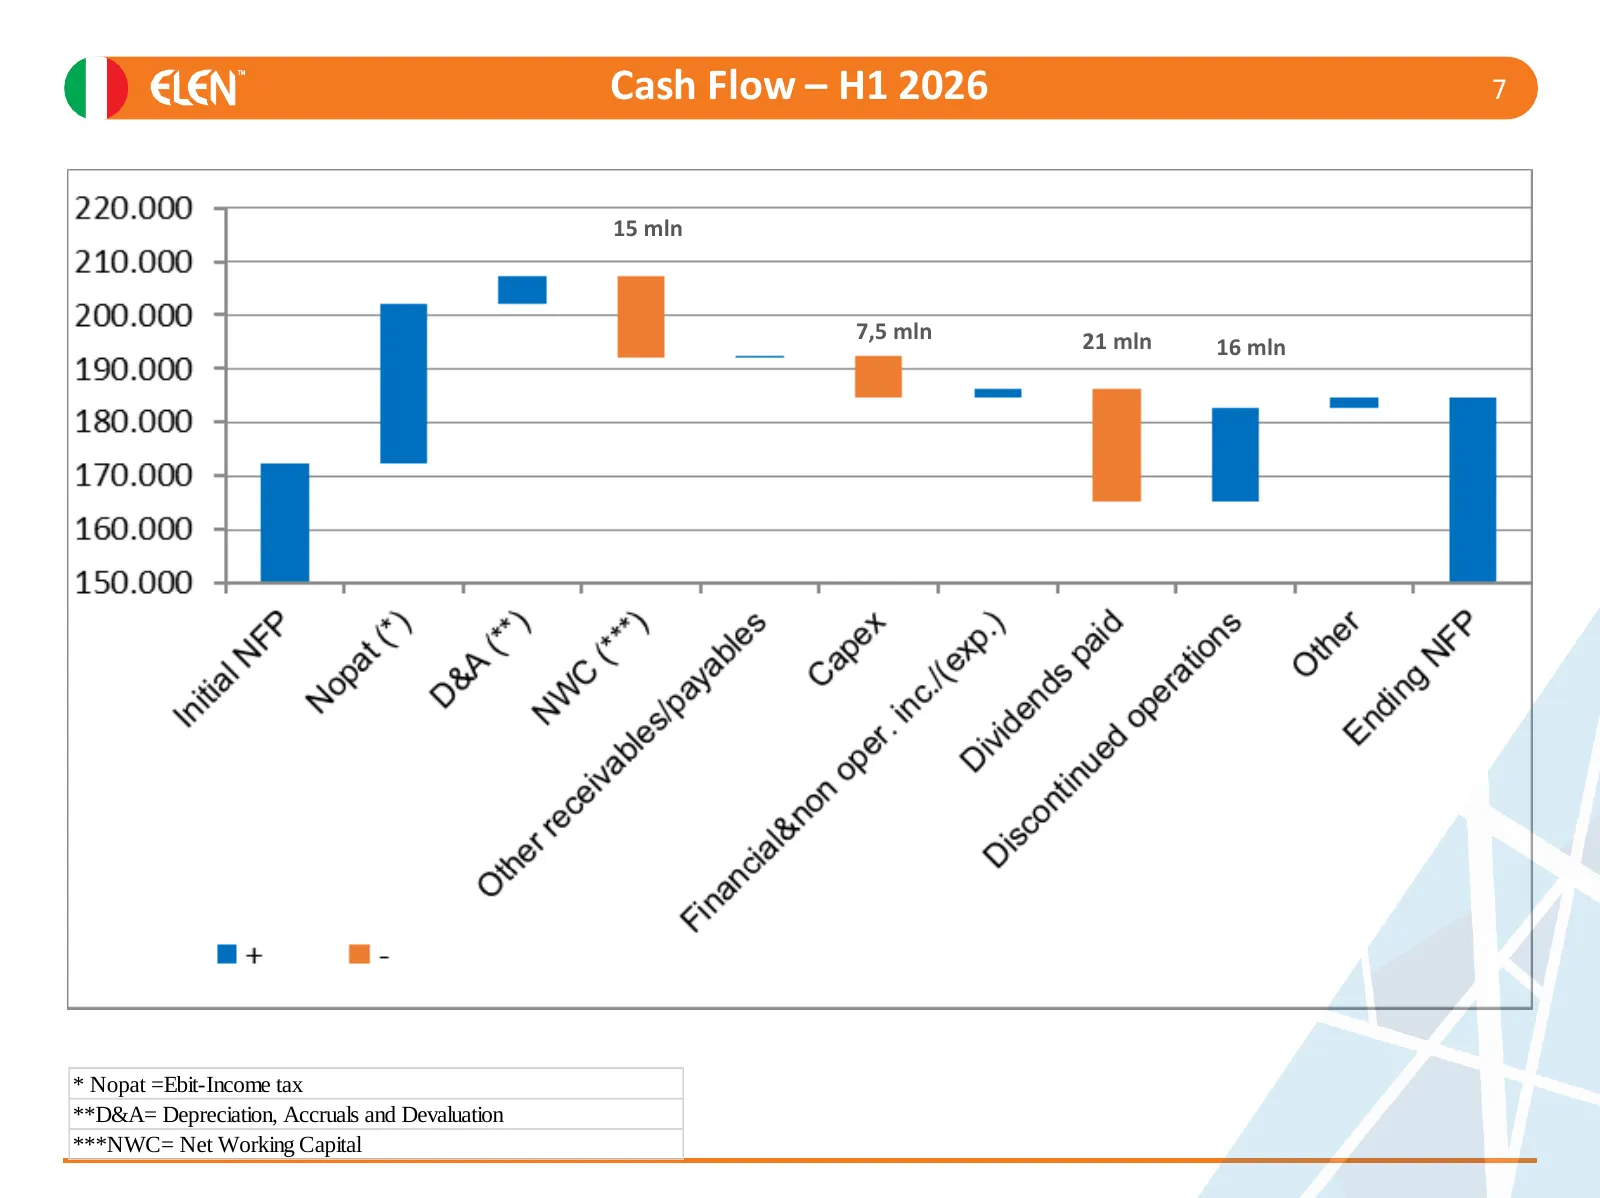
Cash Flow – H1 2026 7 15 mln 7,5 mln 21 mln 16 mln * Nopat =Ebit-Income tax **D&A= Depreciation, Accruals and Devaluation ***NWC= Net Working Capital
Slide 8: Revenue Breakdown by Business
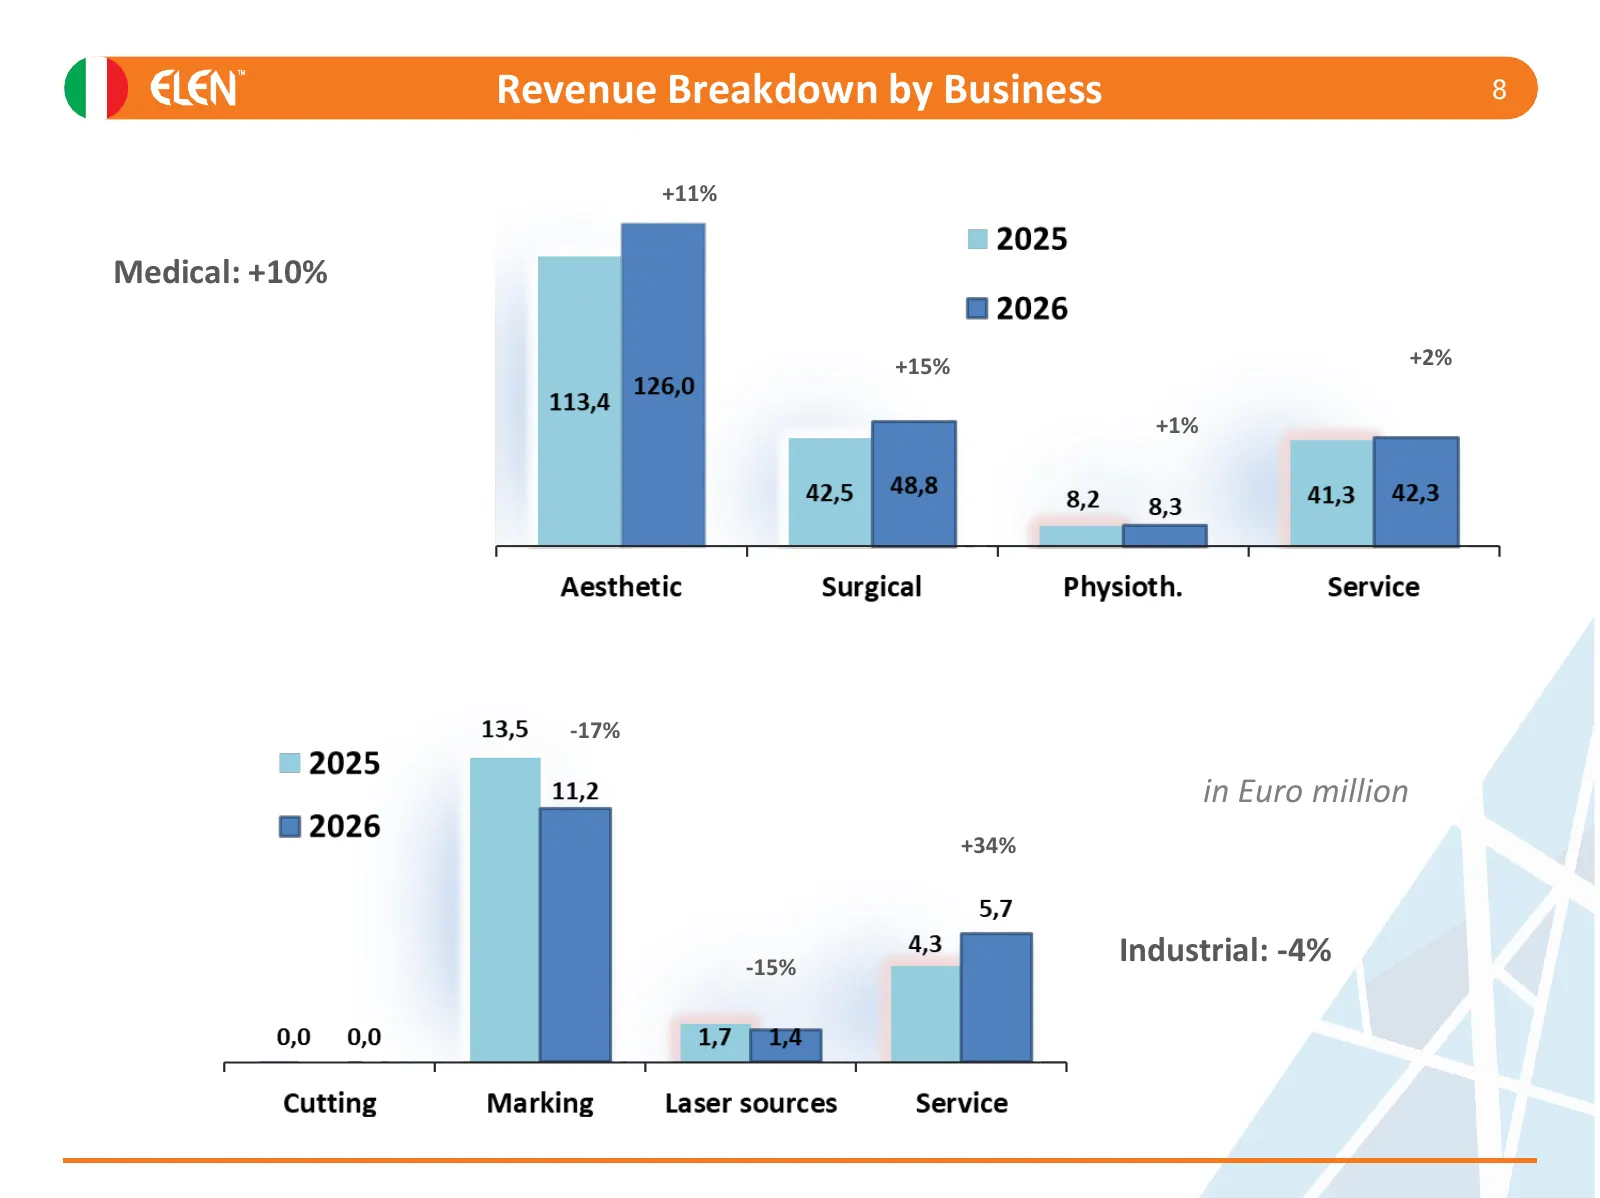
Revenue Breakdown by Business 8 +11% Medical: +10% +15% +2% +1% -17% in Euro million +34% -15% Industrial: -4%
Slide 9: Revenue Breakdown by Area
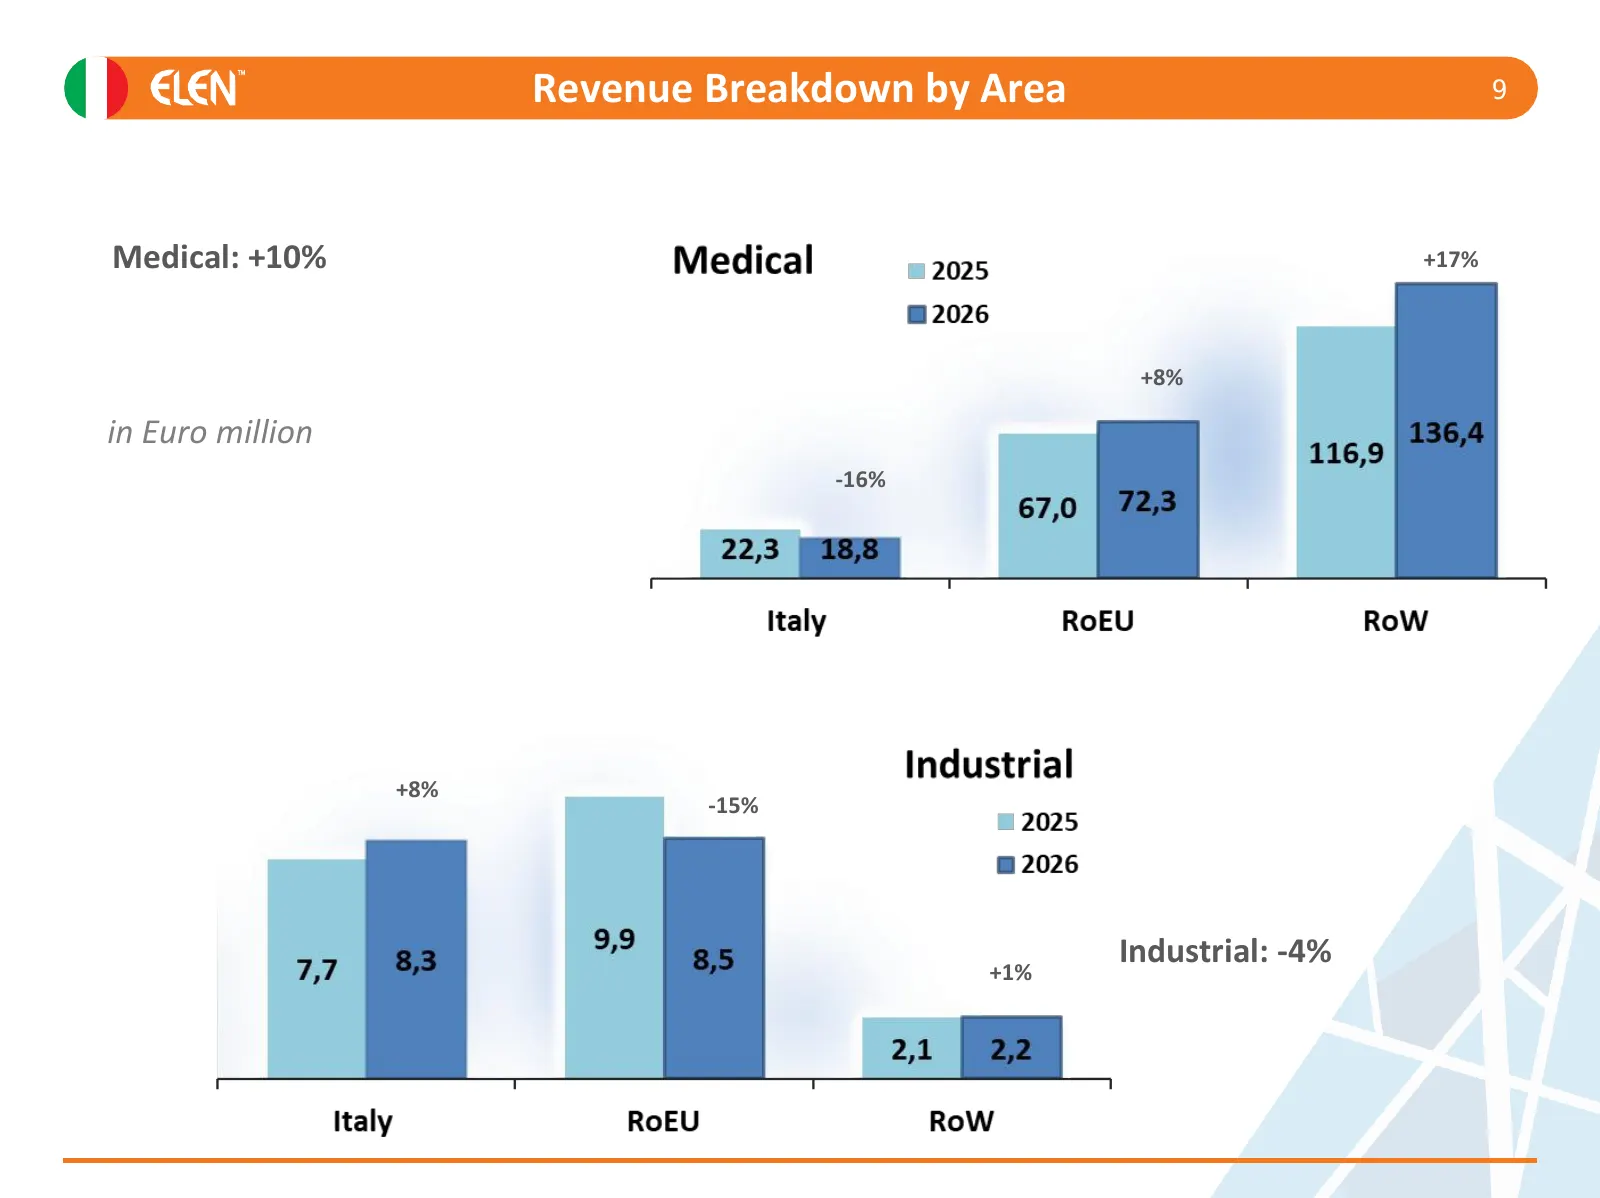
Revenue Breakdown by Area 9 Medical: +10% +17% +8% in Euro million -16% +8% -15% Industrial: -4% +1%
Slide 10: 2026 Guidance
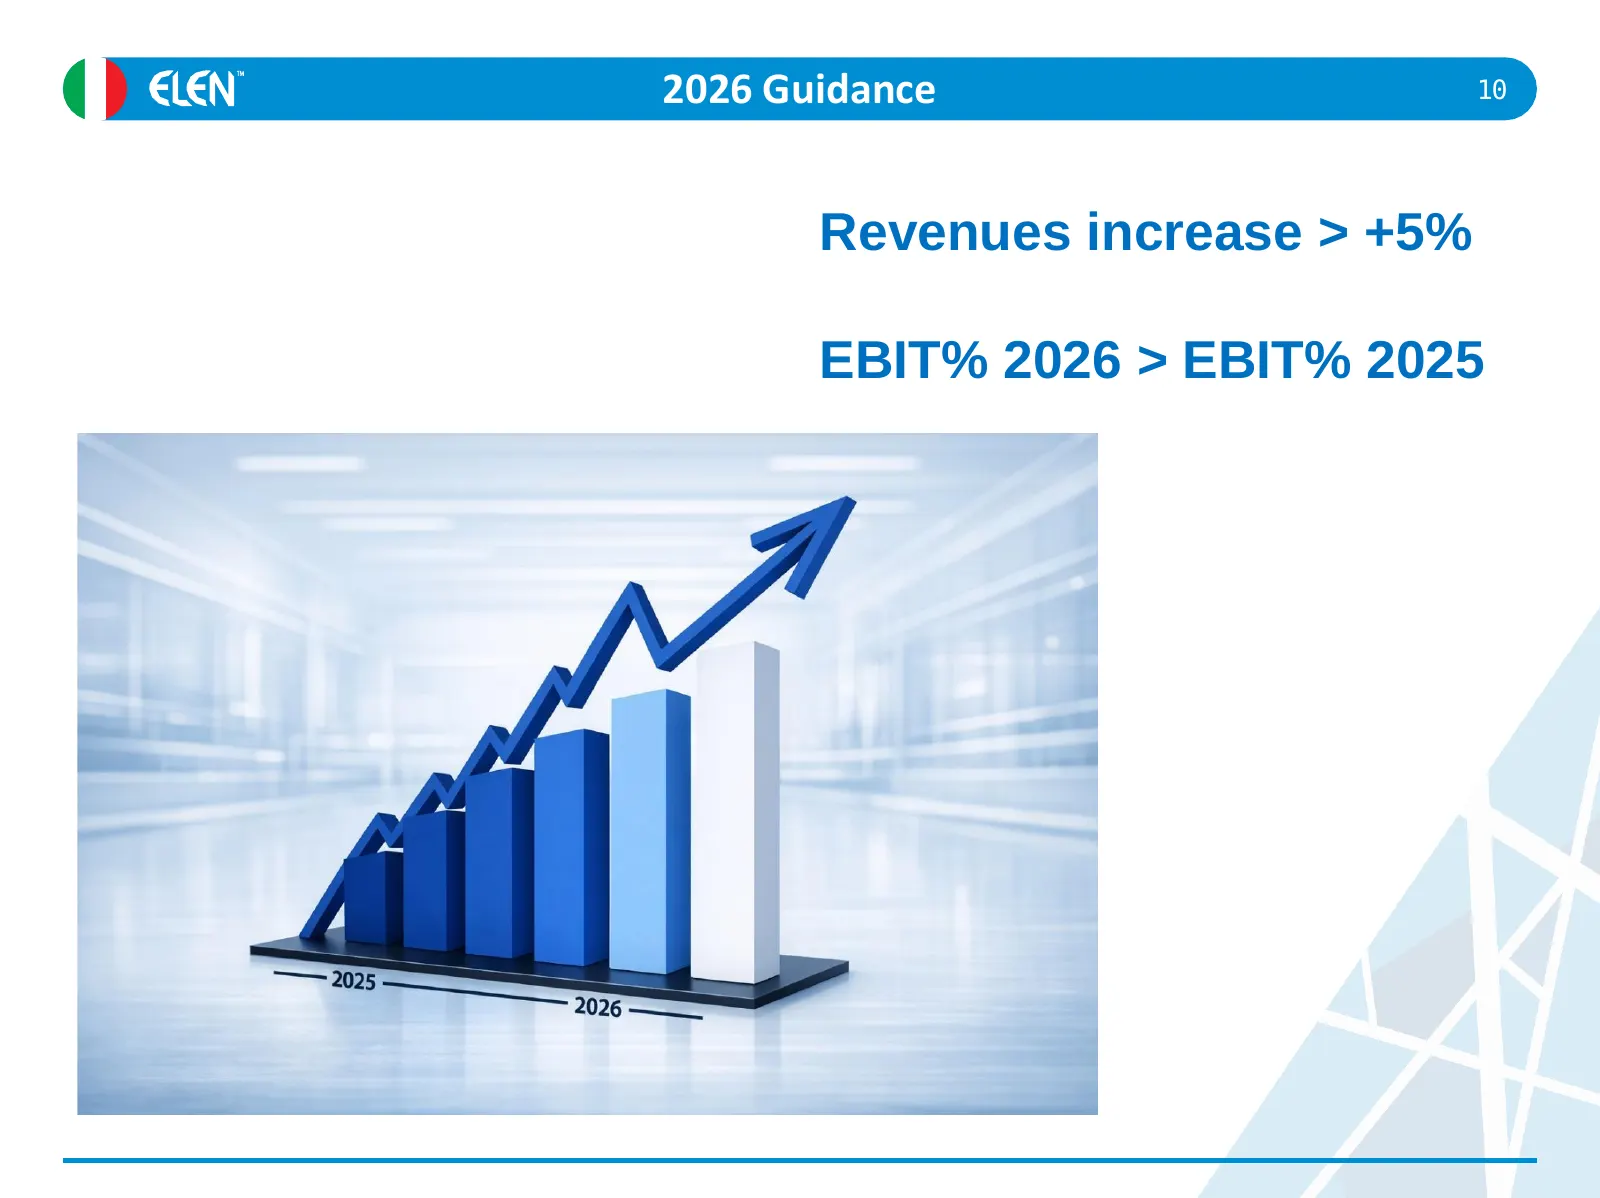
2026 Guidance 10 Revenues increase > +5% EBIT% 2026 > EBIT% 2025
Slide 11: Contacts
CONTACTS El.En. S.P.A. Enrico Romagnoli Investor Relations Manager tel. +39 055-8826807 E-mail: finance@elen.it POLYTEMS HIR Financial Communication, IR and Press Office Bianca Fersini Mastelloni - b.fersini@polytemshir.it Silvia Marongiu - s.marongiu@polytemshir.it Tel. +39 06-69923324
Source: 6ix earnings call
More decks from El.En. S.p.A.
 9M 2026 Earnings Presentation10 slides · Nov 16, 2026
 Intermonte Northern MidCap Event 202640 slides · May 19, 2026
 Q1 2026 Earnings Presentation9 slides · May 18, 2026
 Euronext STAR Conference 202639 slides · Mar 24, 2026
 FY2025 Earnings Presentation10 slides · Mar 16, 2026
 10th Annual Polytems HIR Italian Day in Frankfurt 202638 slides · Jan 22, 2026