Renewable Energy — Investor Day (October 2020)
112 slides from Renewable Energy's investor day presentation, Oct 13, 2020
Slide 1: Right Place, Right Time: Accelerating the Transition to Clean Energy
Right Place, Right Time Accelerating the Transition to Clean Energy 2020 Analyst and Investor Day October 13, 2020 © 2020 Renewable Energy Group, Inc. All Rights Reserved.
Slide 2: Safe Harbor Statement
Safe Harbor Statement This presentation contains certain forward-looking statements within the meaning of the Private Securities Litigation Reform Act of 1995 as amended, including estimates on our future delivery and profit potential, our growth strategy, momentum and plans, including renewable die

Slide 3: Welcome & Introduction
Welcome & Introduction Cynthia J. Warner President & CEO © 2020 Renewable Energy Group, Inc. All Rights Reserved. 3
Slide 4: Analyst and Investor Day 2020
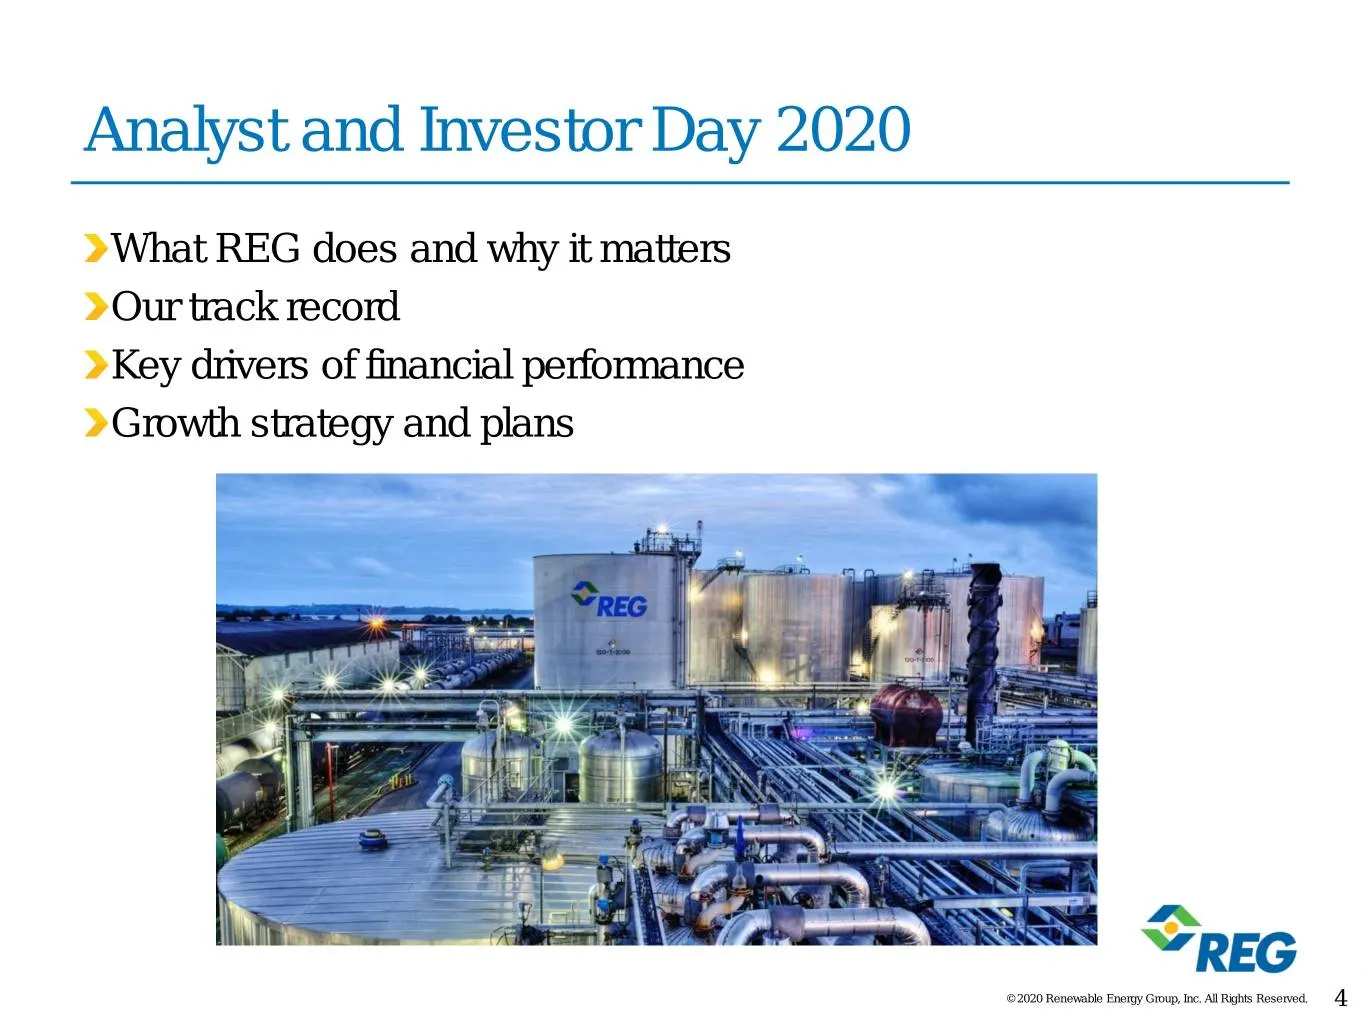
Analyst and Investor Day 2020 What REG does and why it matters Our track record Key drivers of financial performance Growth strategy and plans © 2020 Renewable Energy Group, Inc. All Rights Reserved. 4

Slide 5: © 2020 Renewable Energy Group, Inc. All Rights Reserved. 5
© 2020 Renewable Energy Group, Inc. All Rights Reserved. 5
Slide 6: Energy Transition: An Inflection Point
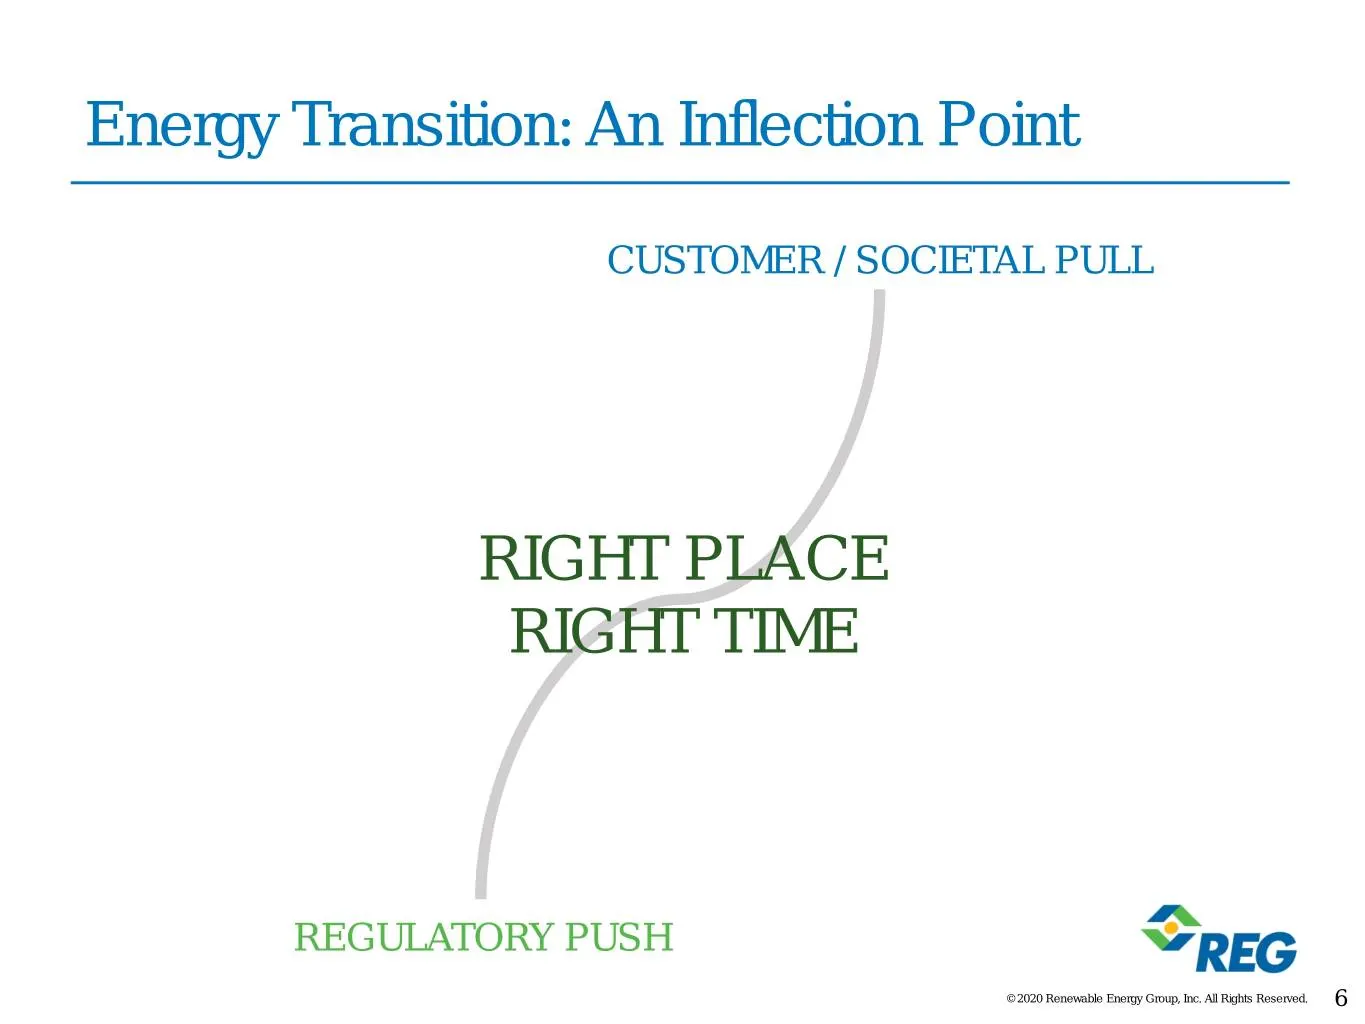
Energy Transition: An Inflection Point CUSTOMER / SOCIETAL PULL RIGHT PLACE RIGHT TIME REGULATORY PUSH © 2020 Renewable Energy Group, Inc. All Rights Reserved. 6
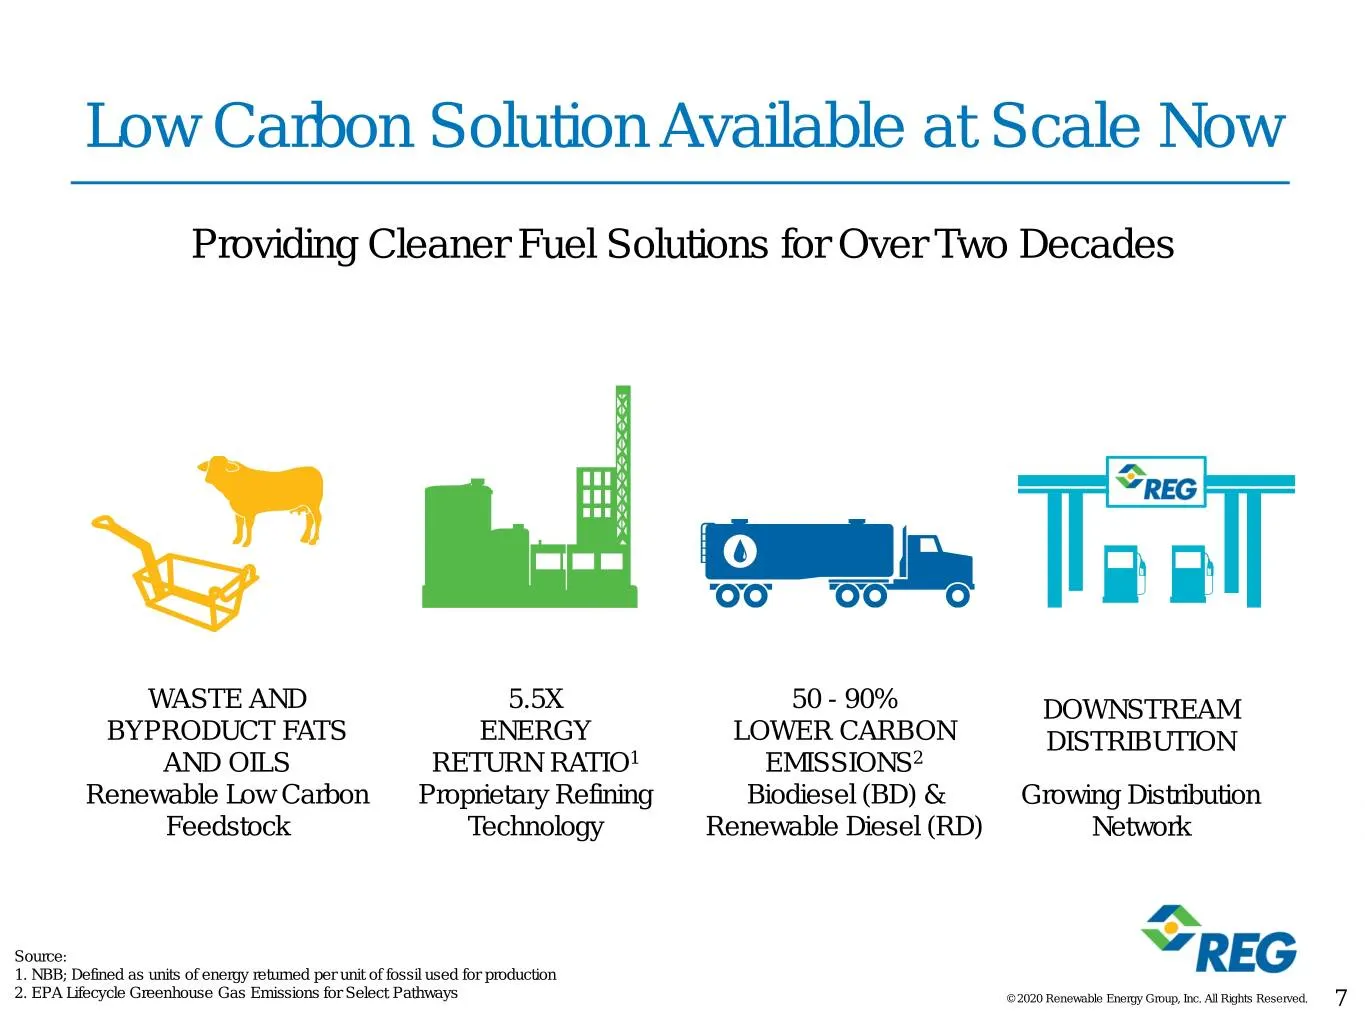
Slide 7: Low Carbon Solution Available at Scale Now
Low Carbon Solution Available at Scale Now Providing Cleaner Fuel Solutions for Over Two Decades WASTE AND 5.5X 50 - 90% DOWNSTREAM BYPRODUCT FATS ENERGY LOWER CARBON DISTRIBUTION AND OILS RETURN RATIO1 EMISSIONS2 Renewable Low Carbon Proprietary Refining Biodiesel (BD) & Growing Distribution Feedst
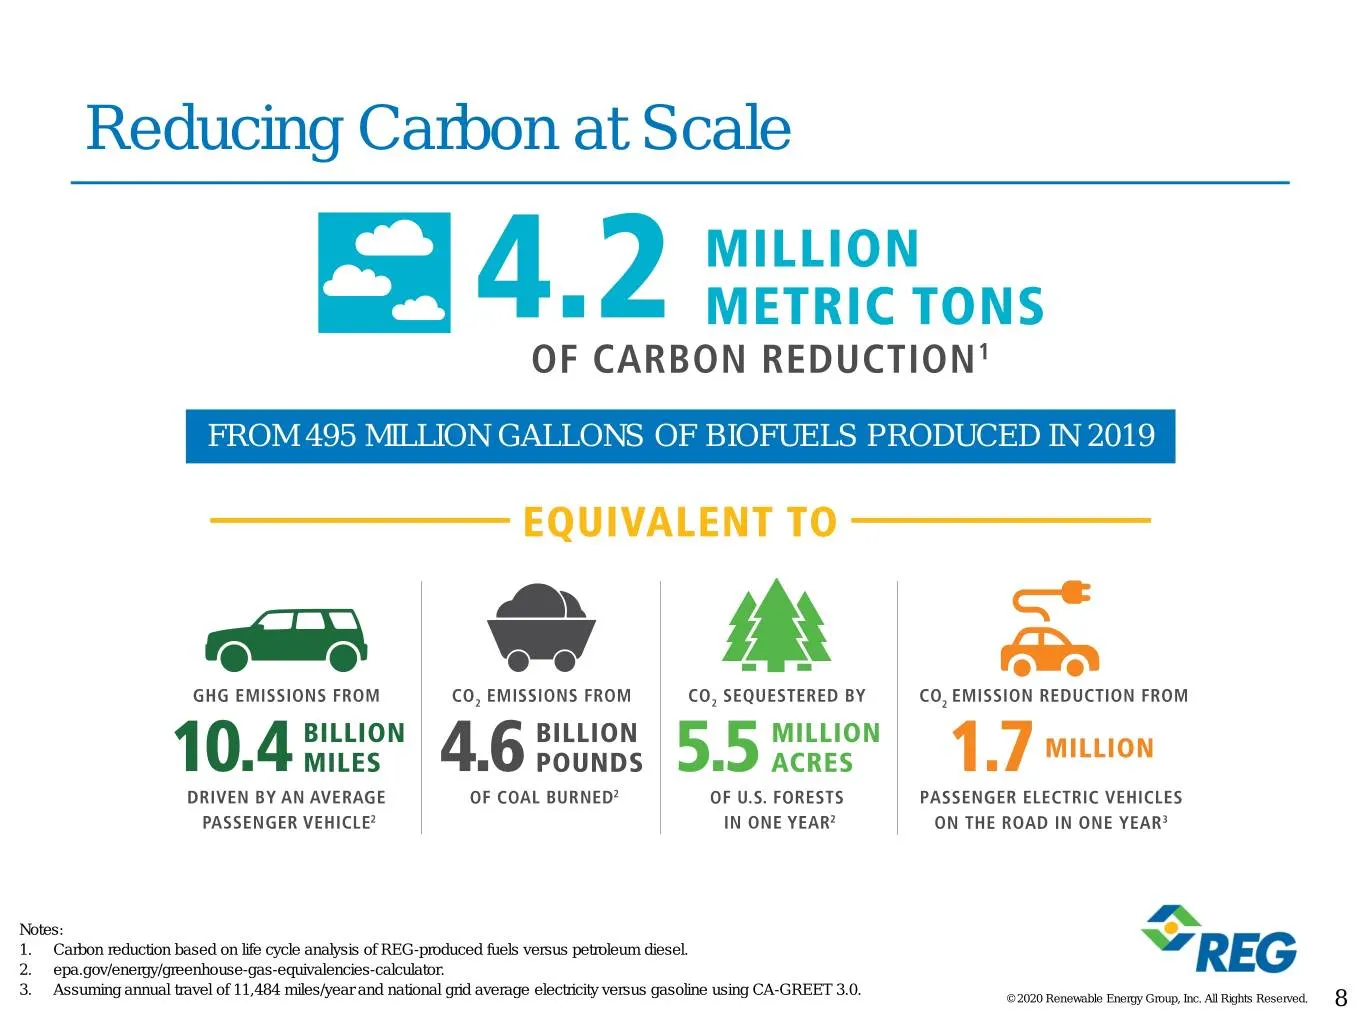
Slide 8: Reducing Carbon at Scale
Reducing Carbon at Scale FROM 495 MILLION GALLONS OF BIOFUELS PRODUCED IN 2019 Notes: 1. Carbon reduction based on life cycle analysis of REG-produced fuels versus petroleum diesel. 2. epa.gov/energy/greenhouse-gas-equivalencies-calculator. 3. Assuming annual travel of 11,484 miles/year and national
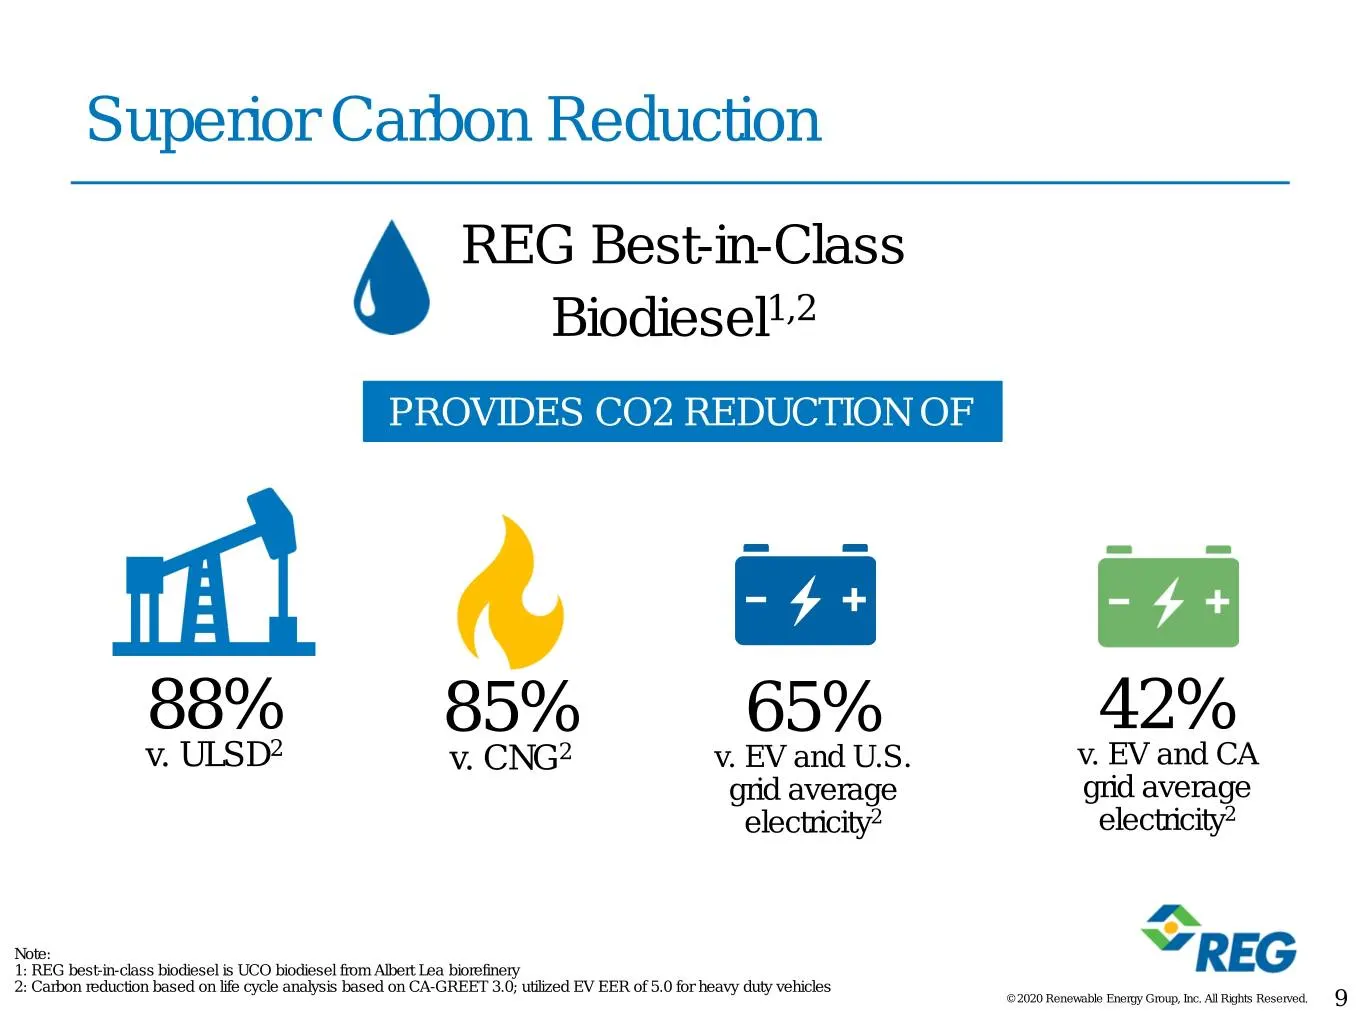
Slide 9: Superior Carbon Reduction
Superior Carbon Reduction REG Best-in-Class Biodiesel1,2 PROVIDES CO2 REDUCTION OF 88% 85% 65% 42% v. ULSD2 v. CNG2 v. EV and U.S. v. EV and CA grid average grid average electricity2 electricity2 Note: 1: REG best-in-class biodiesel is UCO biodiesel from Albert Lea biorefinery 2: Carbon reduction ba
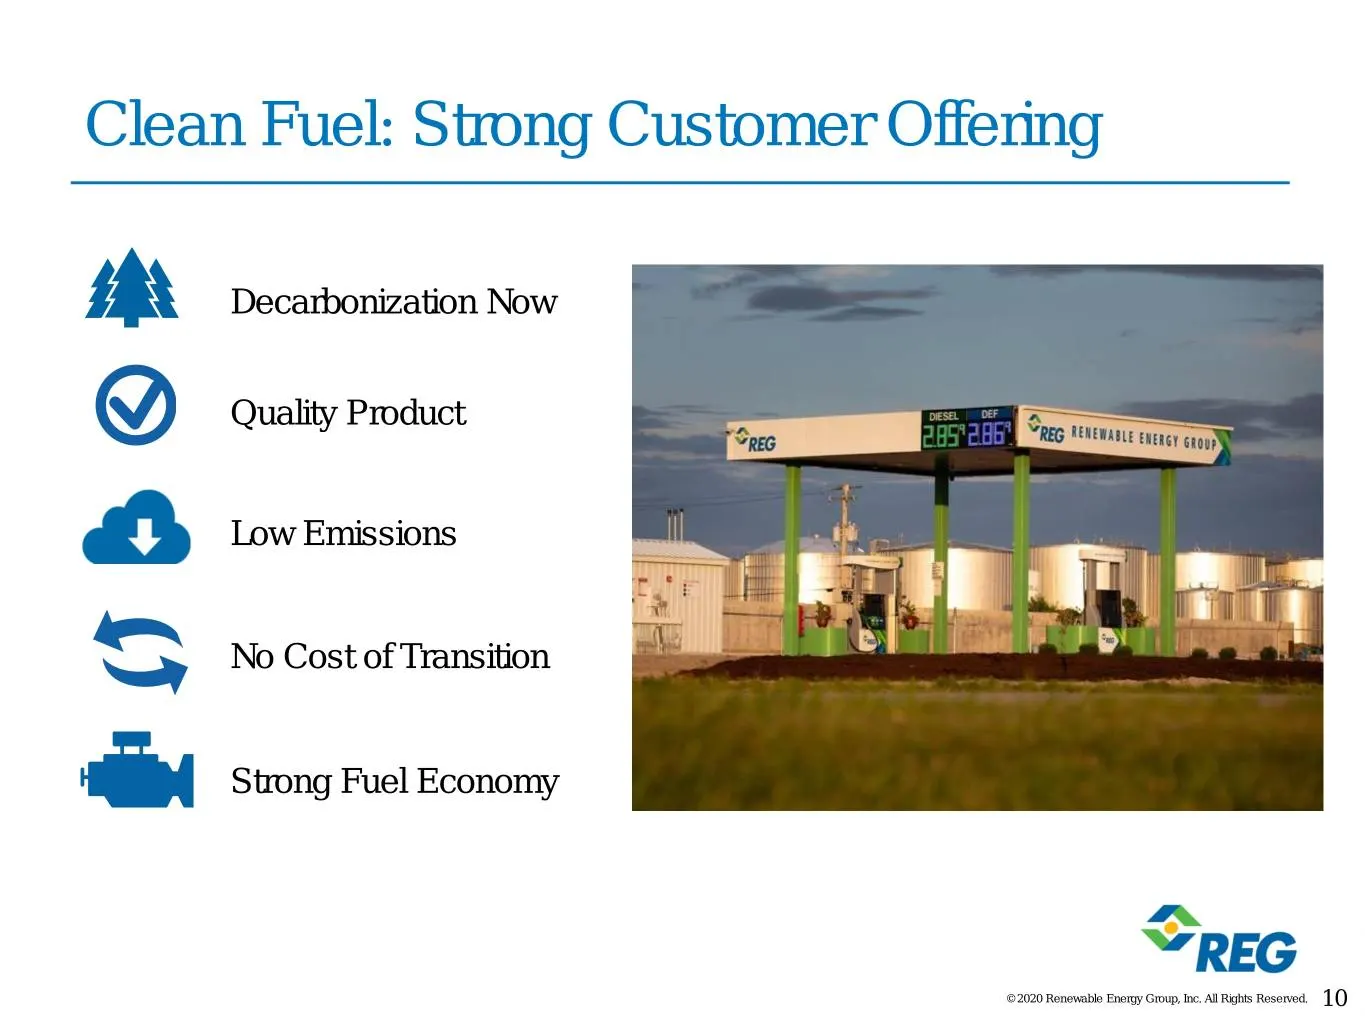
Slide 10: Clean Fuel: Strong Customer Offering
Clean Fuel: Strong Customer Offering Decarbonization Now Quality Product Low Emissions No Cost of Transition Strong Fuel Economy © 2020 Renewable Energy Group, Inc. All Rights Reserved. 10
Slide 11: Top Choice for Decarbonization
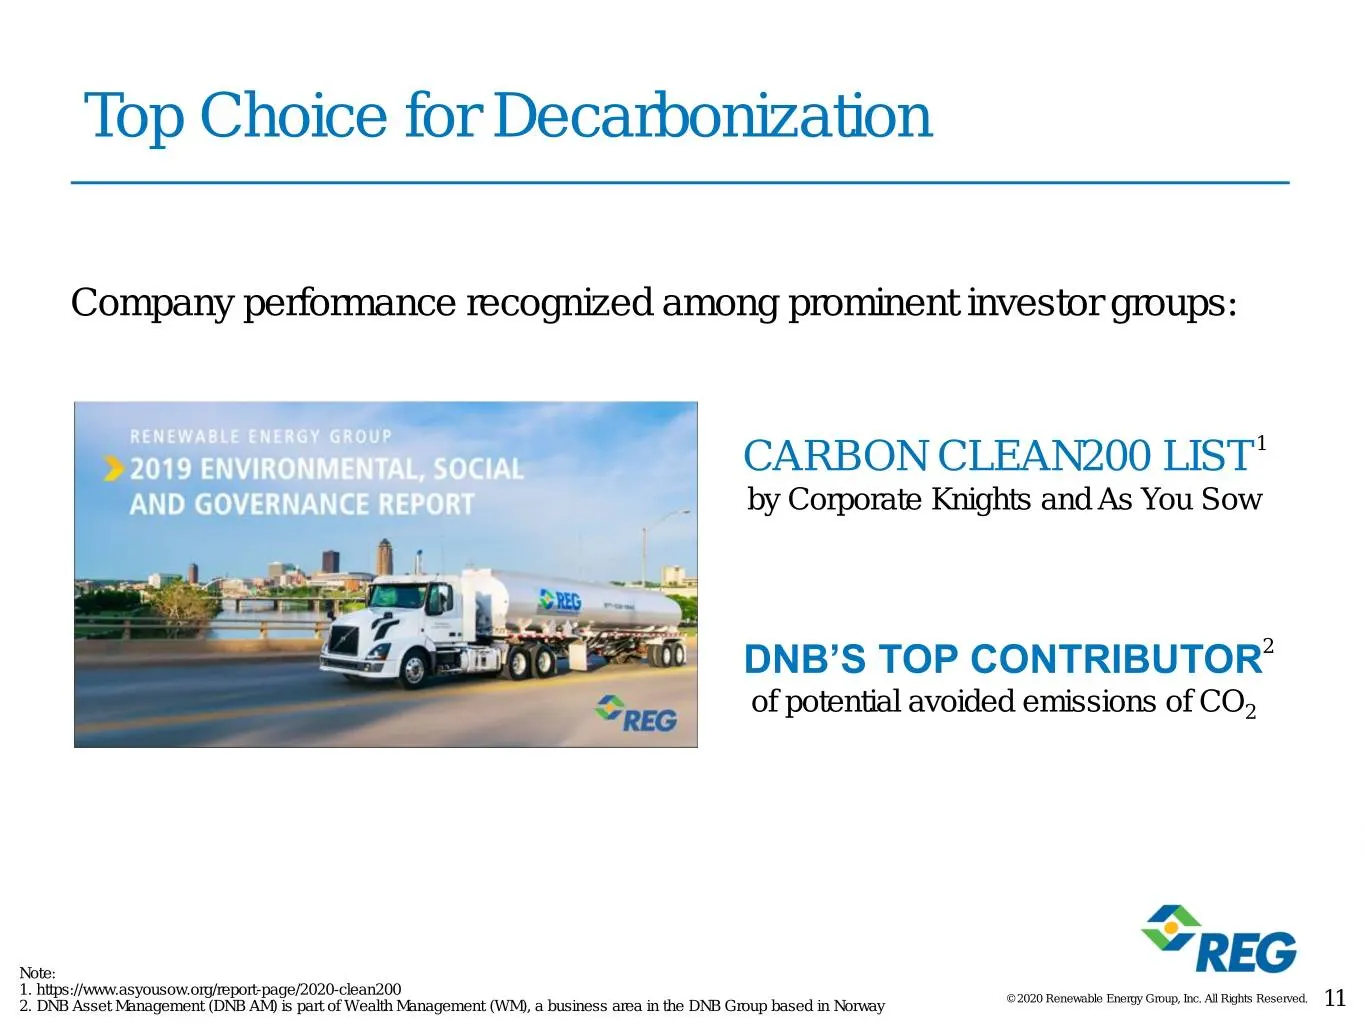
Top Choice for Decarbonization Company performance recognized among prominent investor groups: CARBON CLEAN200 LIST 1 by Corporate Knights and As You Sow DNB’S TOP CONTRIBUTOR2 of potential avoided emissions of CO2 Note: 1. https://www.asyousow.org/report-page/2020-clean200 2. DNB Asset Management (
Slide 12: A Clean Energy Story: Evolution to Inflection
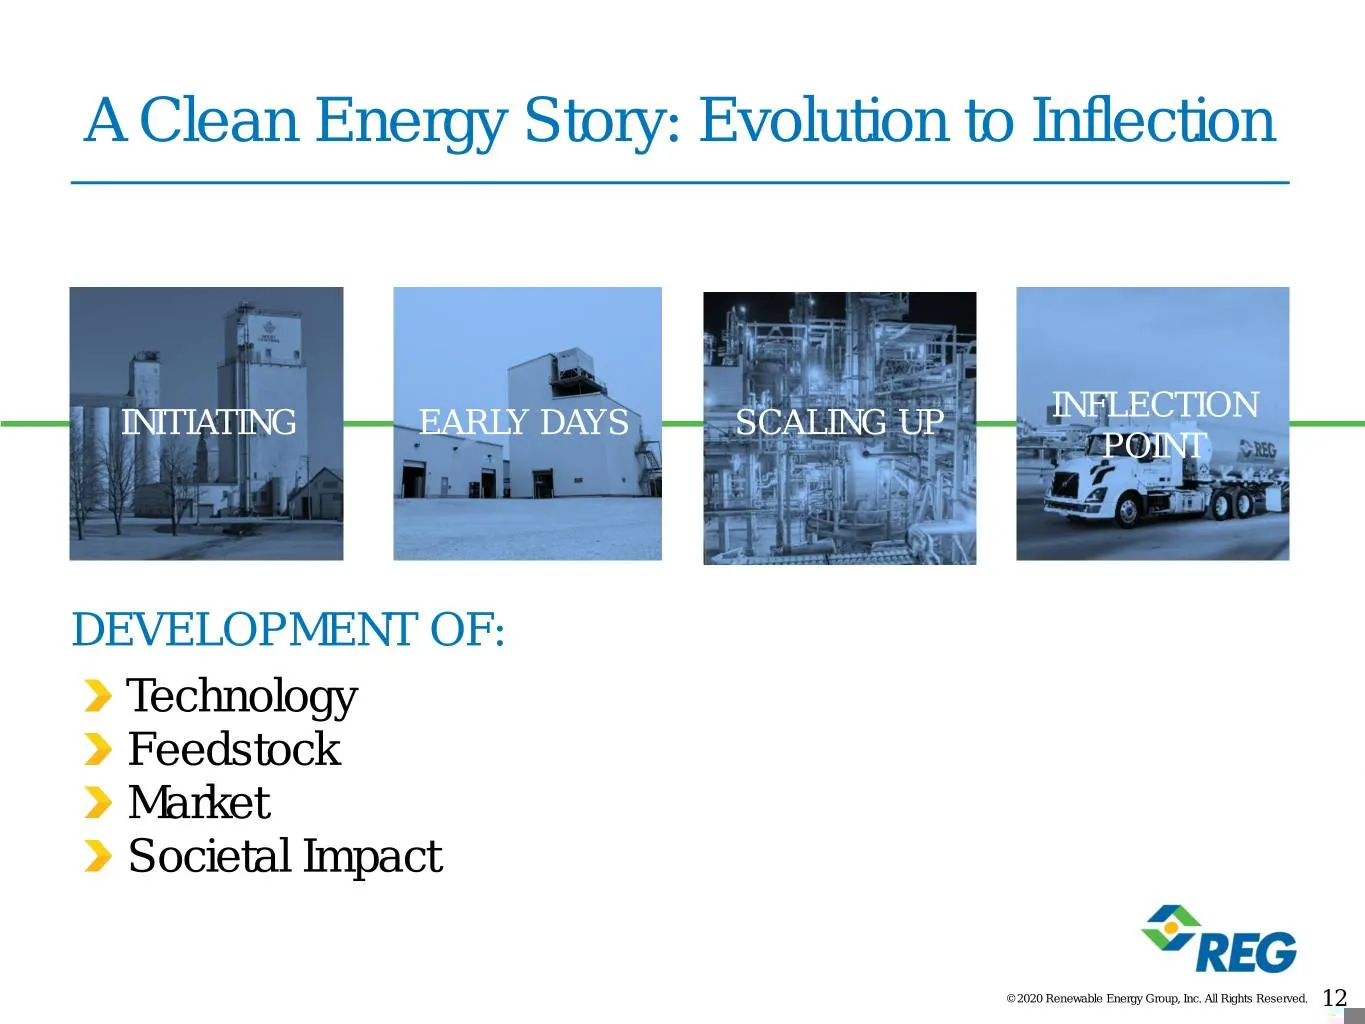
A Clean Energy Story: Evolution to Inflection INFLECTION INITIATING EARLY DAYS SCALING UP POINT DEVELOPMENT OF: Technology Feedstock Market Societal Impact © 2020 Renewable Energy Group, Inc. All Rights Reserved. 12
Slide 13: A Clean Energy Story: Evolution to Inflection
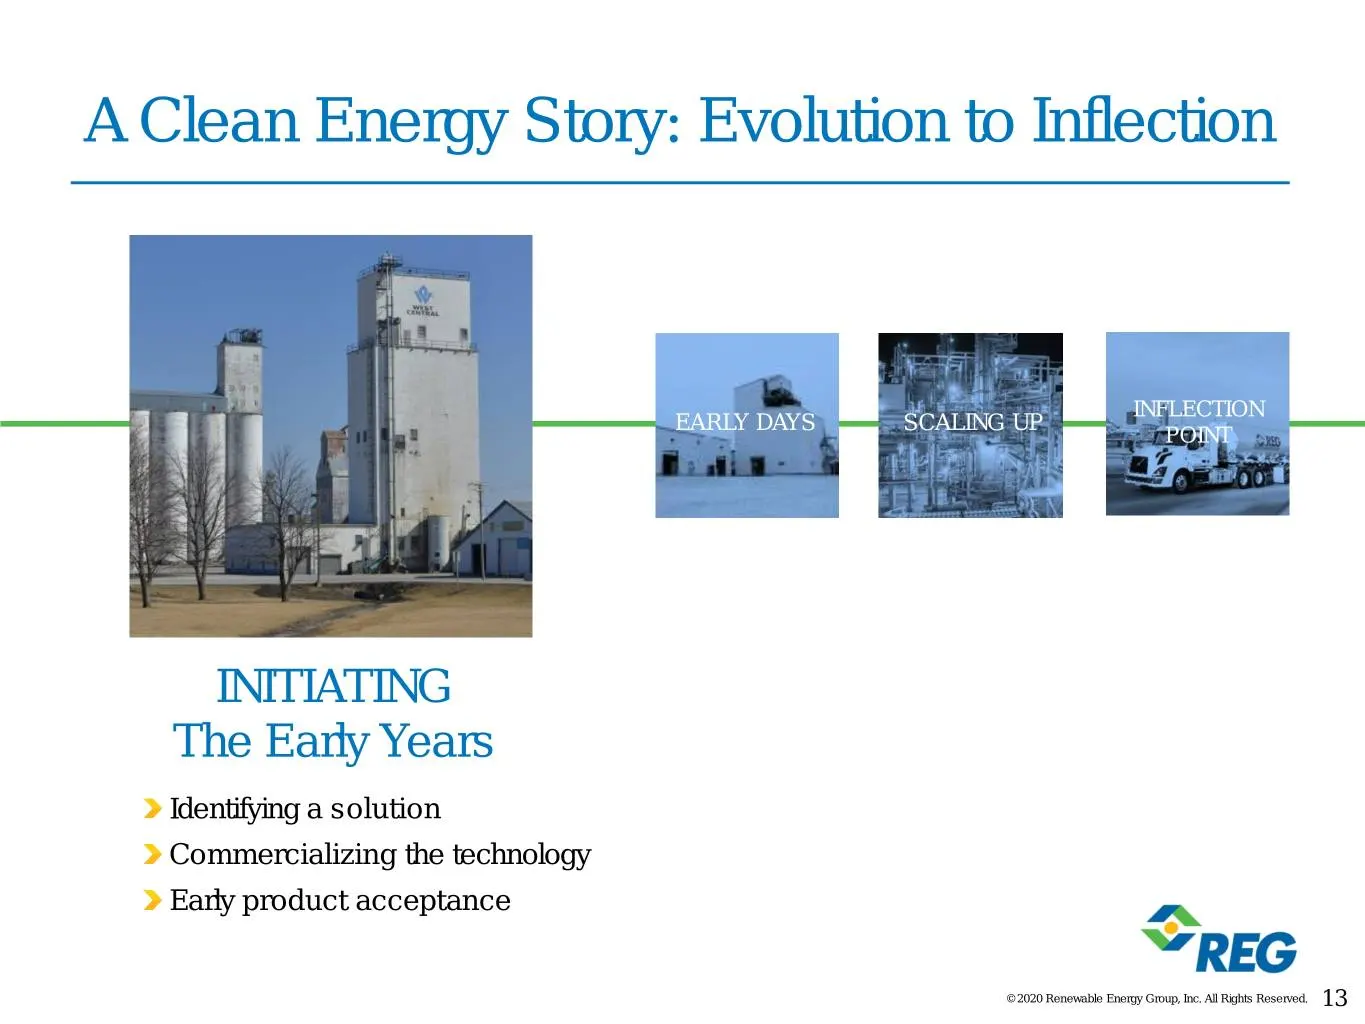
A Clean Energy Story: Evolution to Inflection INFLECTION EARLY DAYS SCALING UP POINT INITIATING The Early Years Identifying a solution Commercializing the technology Early product acceptance © 2020 Renewable Energy Group, Inc. All Rights Reserved. 13
Slide 14: A Clean Energy Story: Evolution to Inflection
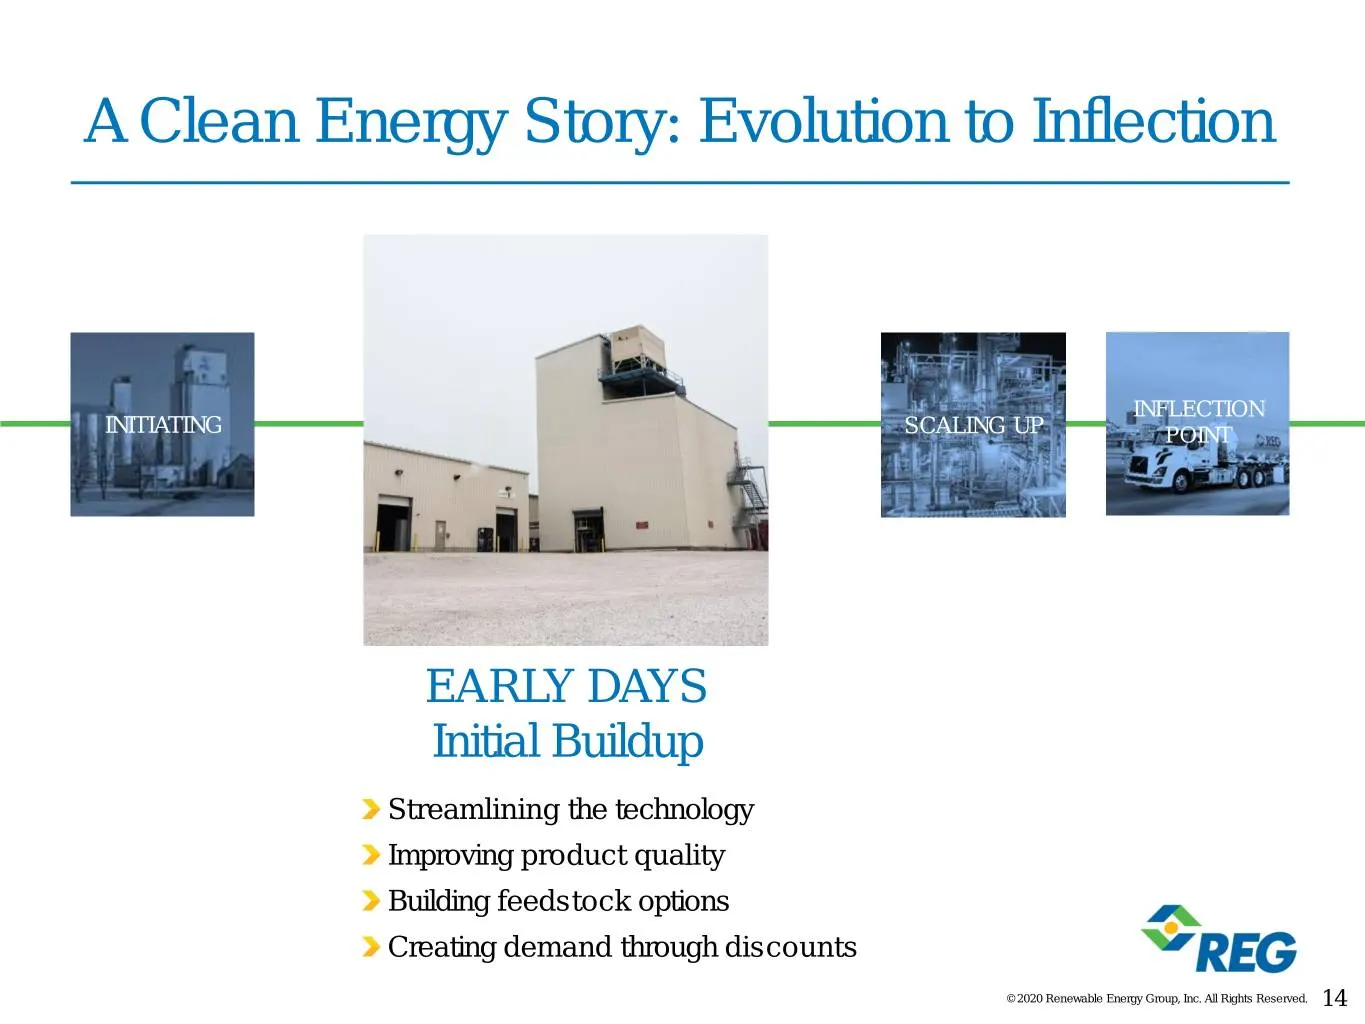
A Clean Energy Story: Evolution to Inflection INFLECTION INITIATING SCALING UP POINT EARLY DAYS Initial Buildup Streamlining the technology Improving product quality Building feedstock options Creating demand through discounts © 2020 Renewable Energy Group, Inc. All Rights Reserved. 14
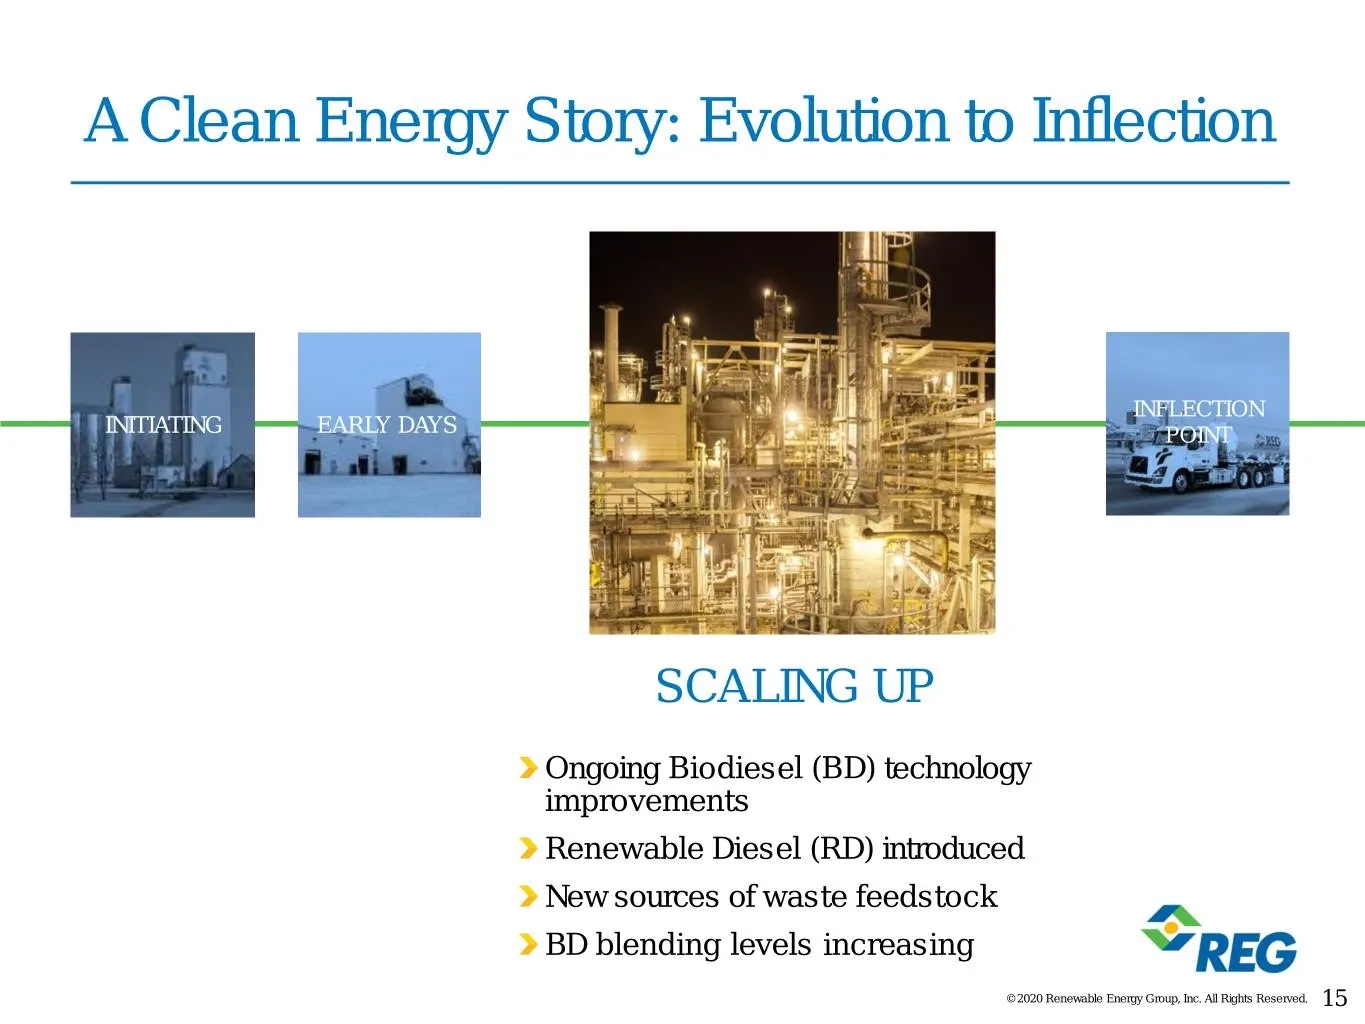
Slide 15: A Clean Energy Story: Evolution to Inflection
A Clean Energy Story: Evolution to Inflection INFLECTION INITIATING EARLY DAYS POINT SCALING UP Ongoing Biodiesel (BD) technology improvements Renewable Diesel (RD) introduced New sources of waste feedstock BD blending levels increasing © 2020 Renewable Energy Group, Inc. All Rights Reserved. 15
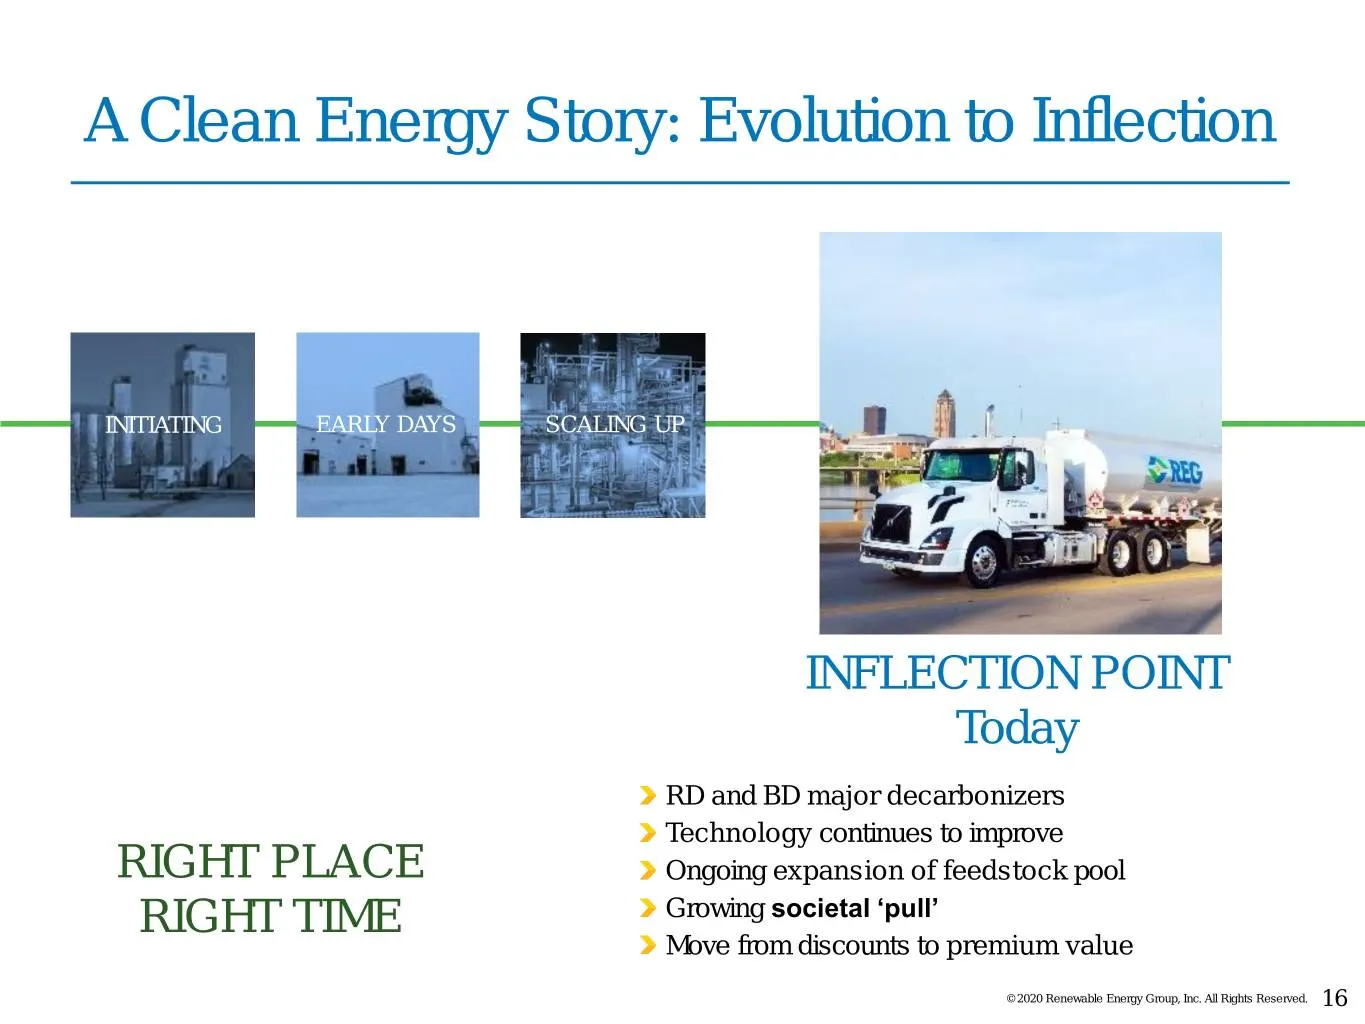
Slide 16: A Clean Energy Story: Evolution to Inflection
A Clean Energy Story: Evolution to Inflection INITIATING EARLY DAYS SCALING UP INFLECTION POINT Today RD and BD major decarbonizers Technology continues to improve RIGHT PLACE Ongoing expansion of feedstock pool RIGHT TIME Growing societal ‘pull’ Move from discounts to premium value © 2020 Renewable
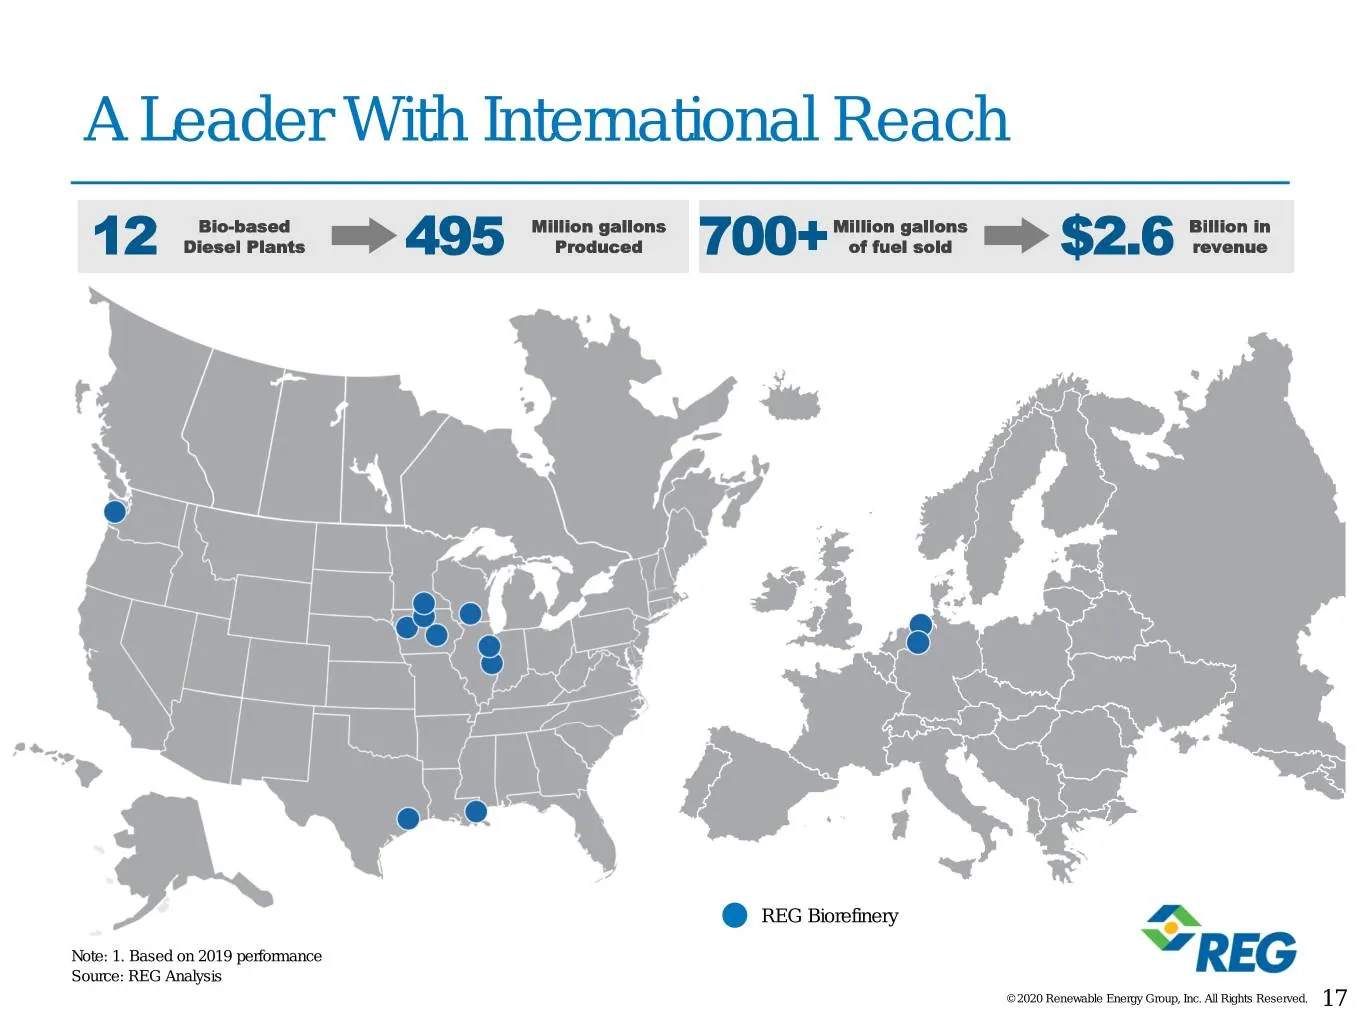
Slide 17: A Leader With International Reach
A Leader With International Reach Bio-based Million gallons Million gallons Billion in 12 Diesel Plants 495 Produced 700+ of fuel sold $2.6 revenue REG Biorefinery Note: 1. Based on 2019 performance Source: REG Analysis © 2020 Renewable Energy Group, Inc. All Rights Reserved. 17
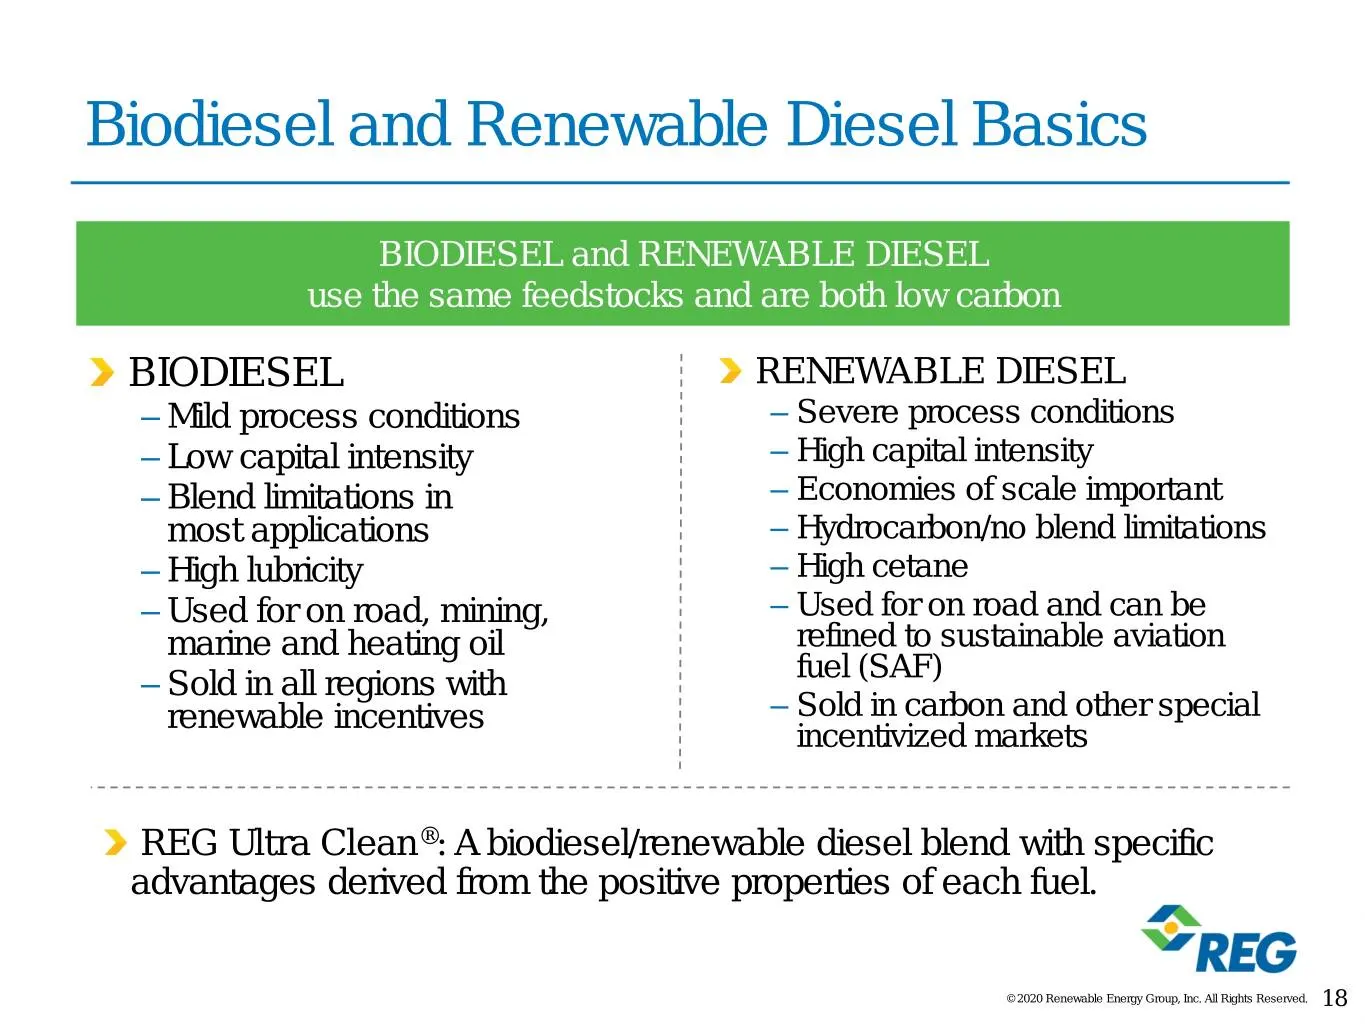
Slide 18: Biodiesel and Renewable Diesel Basics
Biodiesel and Renewable Diesel Basics BIODIESEL and RENEWABLE DIESEL use the same feedstocks and are both low carbon BIODIESEL RENEWABLE DIESEL – Mild process conditions – Severe process conditions – Low capital intensity – High capital intensity – Blend limitations in – Economies of scale important
Slide 19: Strong Sales Growth
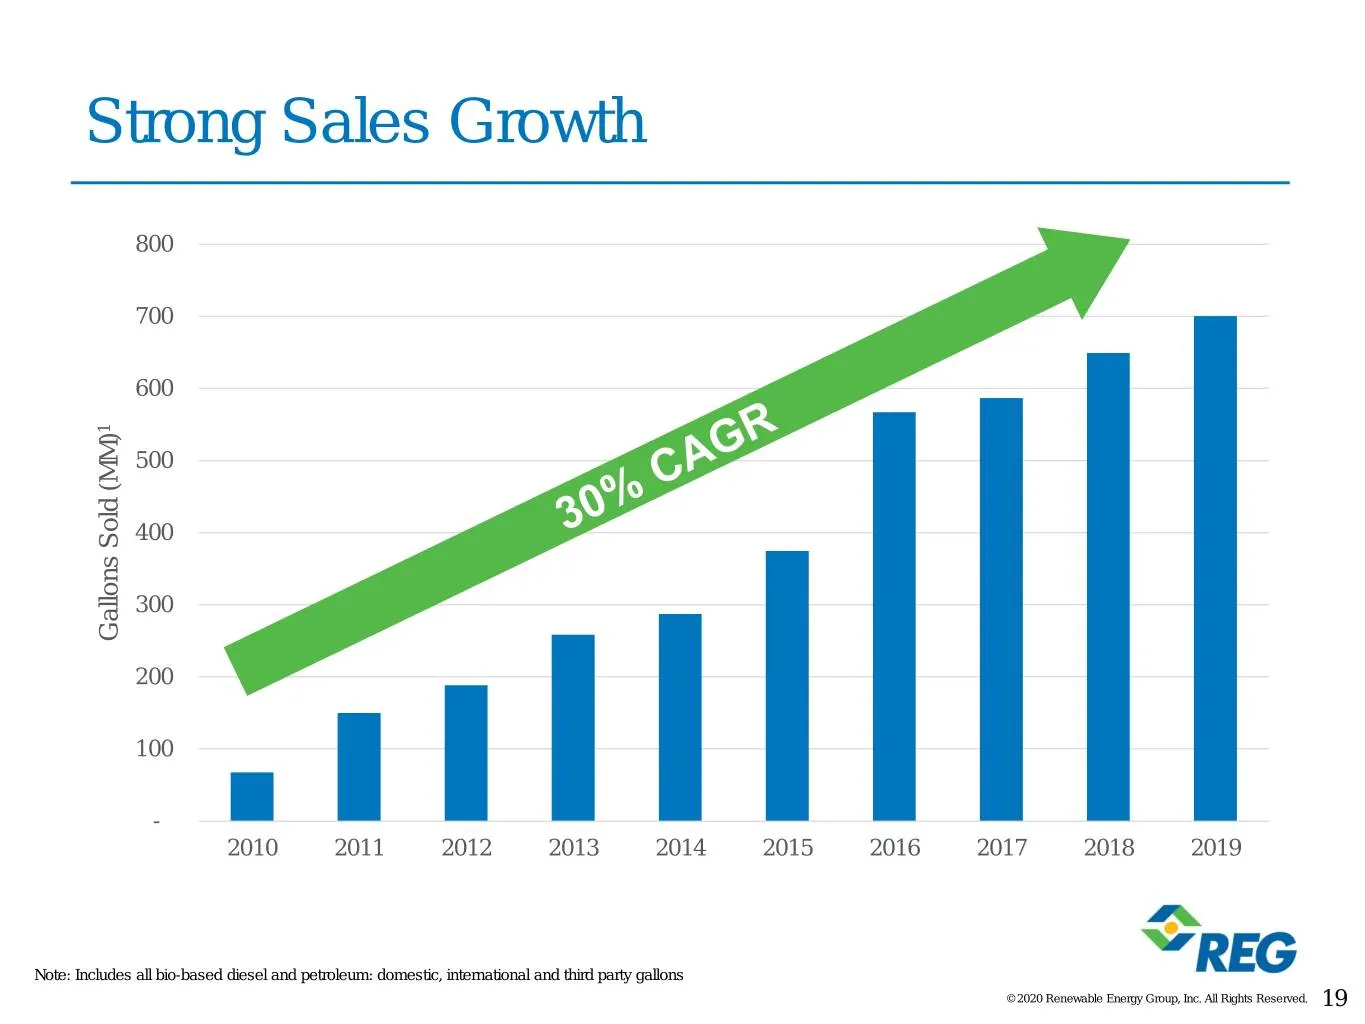
Strong Sales Growth 800 700 600 1 500 400 300 Gallons Sold (MM) Sold Gallons 200 100 - 2010 2011 2012 2013 2014 2015 2016 2017 2018 2019 Note: Includes all bio-based diesel and petroleum: domestic, international and third party gallons © 2020 Renewable Energy Group, Inc. All Rights Reserved. 19

Slide 20: Experienced Management Team
Experienced Management Team CYNTHIA (CJ) BRAD NATALIE GARY CHAD WARNER ALBIN MERRILL HAER STONE President & Vice President, Vice President, Vice President, Chief Financial Chief Executive Manufacturing Business Development Special Projects Officer Officer & Optimization ERIC BOWEN TRISHA CONLEY BOB

Slide 21: © 2020 Renewable Energy Group, Inc. All Rights Reserved. 21
© 2020 Renewable Energy Group, Inc. All Rights Reserved. 21
Slide 22: Defining Our Culture
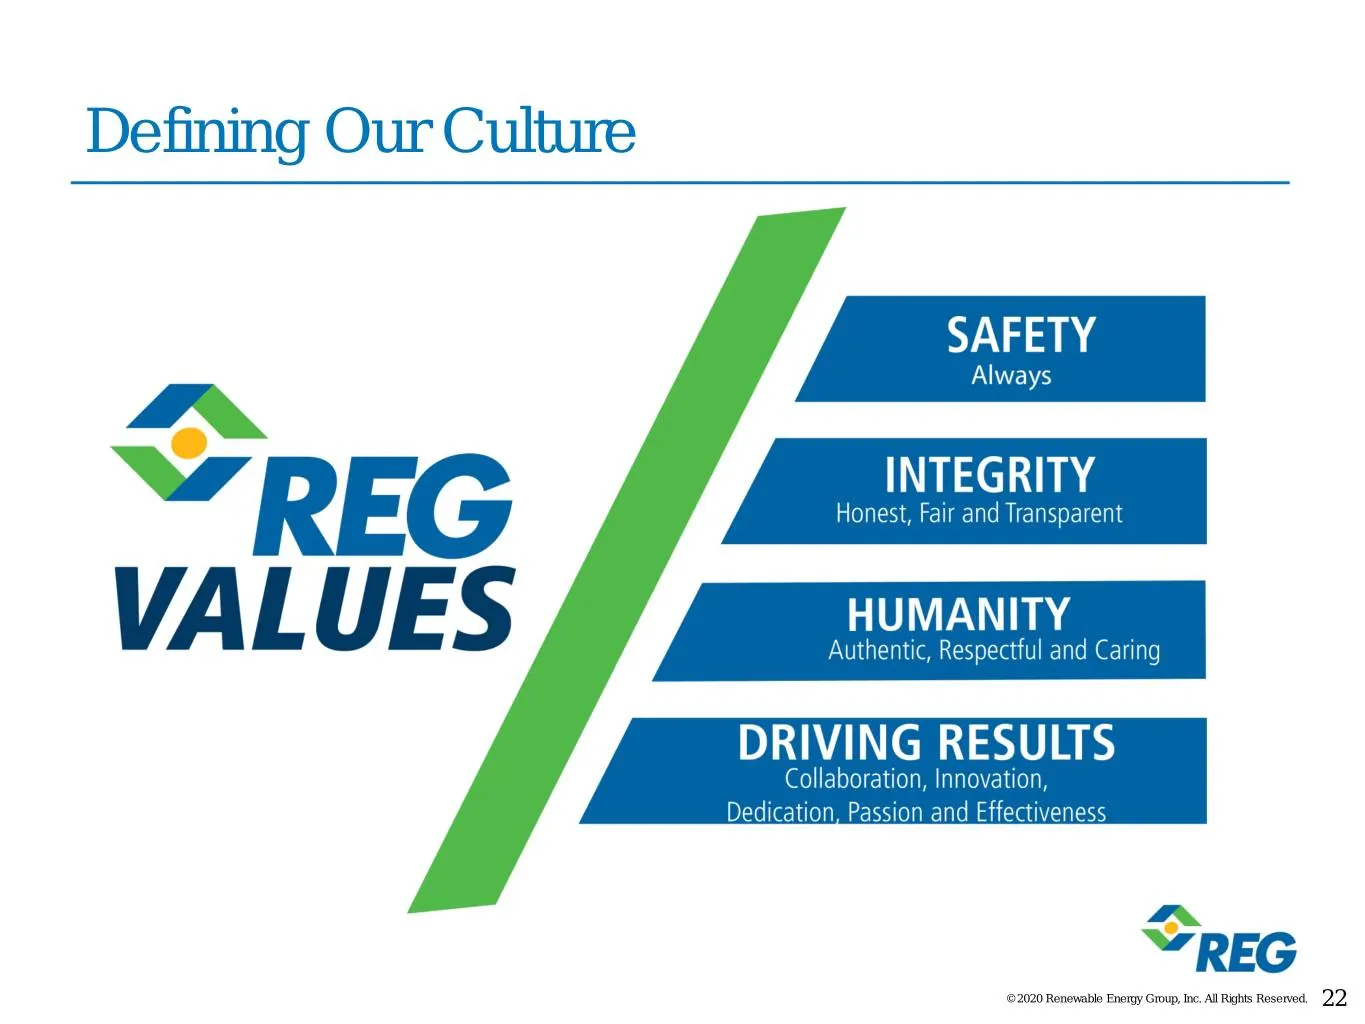
Defining Our Culture © 2020 Renewable Energy Group, Inc. All Rights Reserved. 22
Slide 23: Today's Areas Of Focus
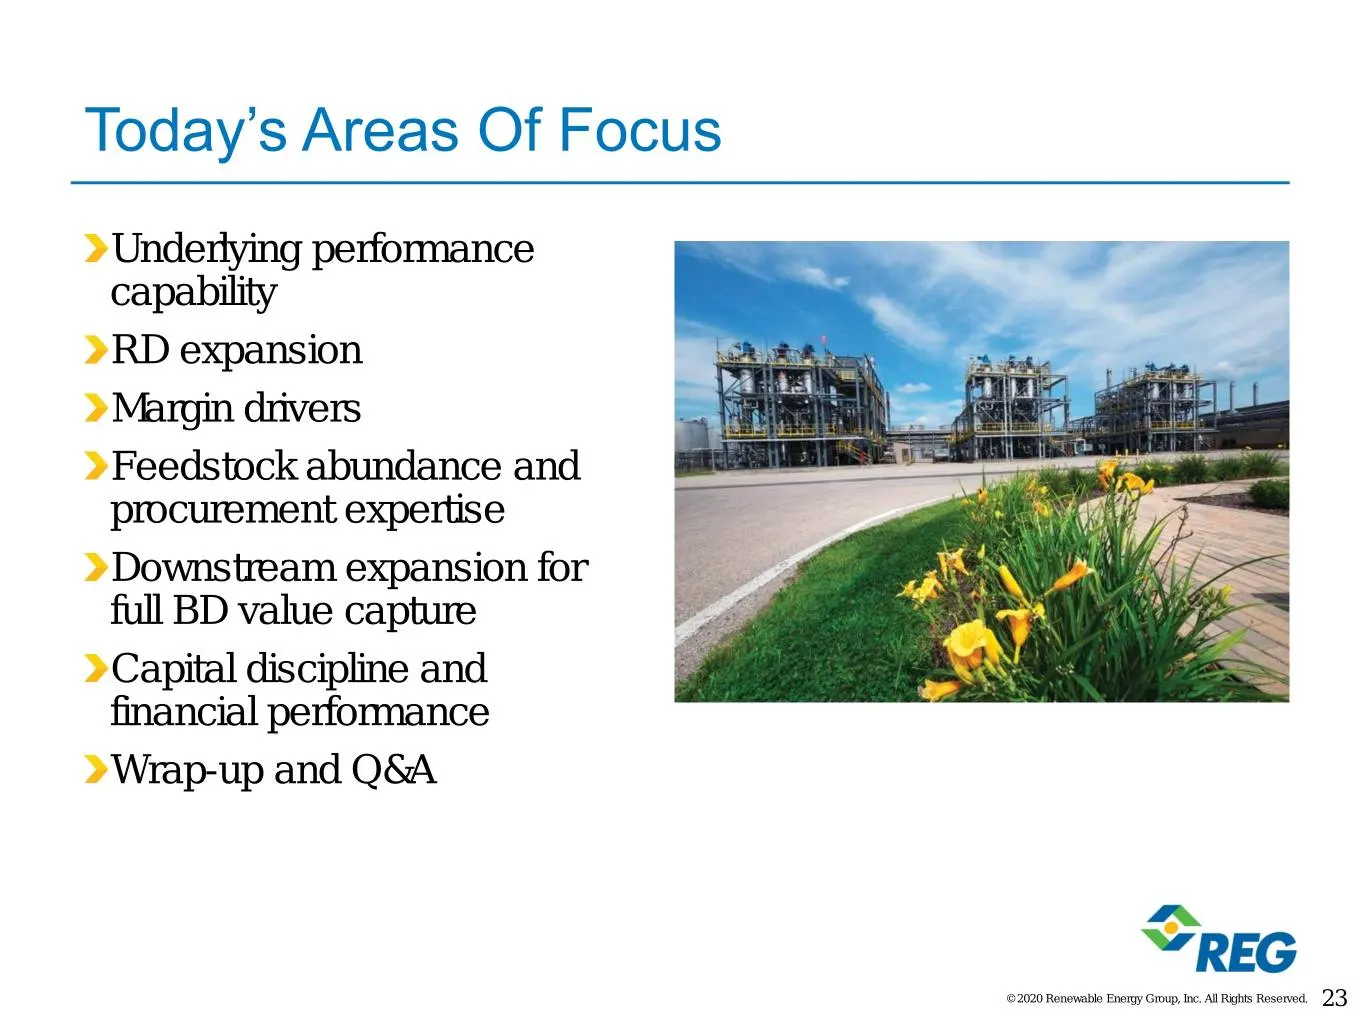
Today’s Areas Of Focus Underlying performance capability RD expansion Margin drivers Feedstock abundance and procurement expertise Downstream expansion for full BD value capture Capital discipline and financial performance Wrap-up and Q&A © 2020 Renewable Energy Group, Inc. All Rights Reserved. 23
Slide 24: Measuring Financial Performance
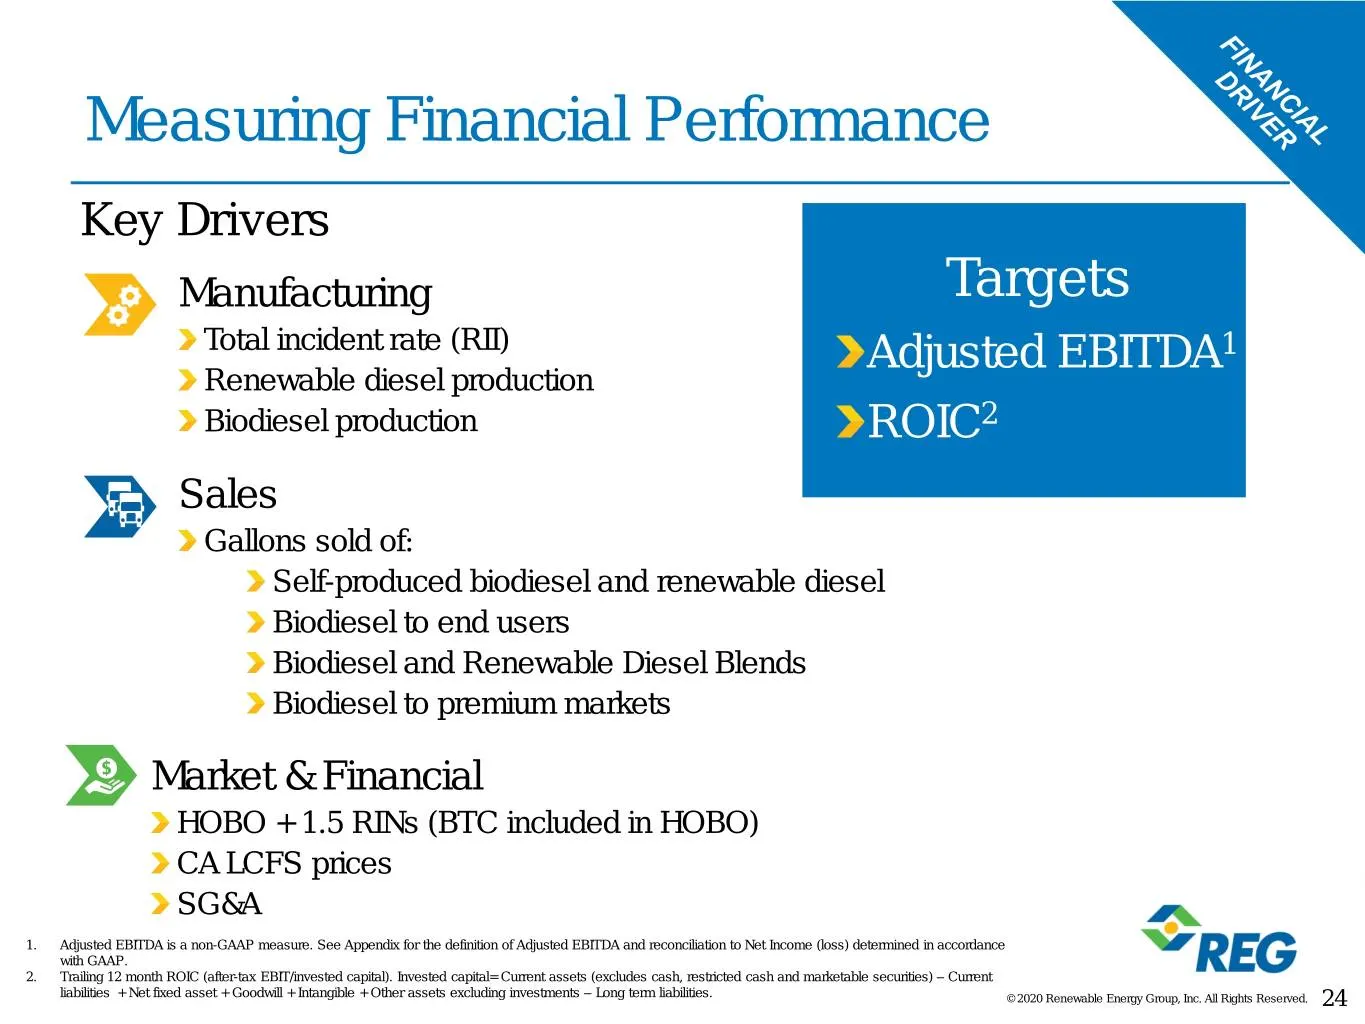
Measuring Financial Performance Key Drivers Manufacturing Targets Total incident rate (RII) Adjusted EBITDA1 Renewable diesel production Biodiesel production ROIC2 Sales Gallons sold of: Self-produced biodiesel and renewable diesel Biodiesel to end users Biodiesel and Renewable Diesel Blends Biodies
Slide 25: Key Elements of Strategy
Key Elements of Strategy Renewable diesel expansion / balancing our product portfolio Downstream integration –Grow margin –Full value for biodiesel –Customer value enhancement Feedstock abundance Capital allocation © 2020 Renewable Energy Group, Inc. All Rights Reserved. 25
Slide 26: Significant Profit Generation Potential
Significant Profit Generation Potential Historic Adjusted EBITDA1 Margin 7 – 16%2 Growth Track Record – 30% Sales CAGR3 – 19% ROIC - Trailing 12 month4 Strategic Growth Momentum – Downstream integration margin enhancement – RD production volume expansion 1. Adjusted EBITDA is a non-GAAP measure. See
Slide 27: Underlying Performance & Growth
Underlying Performance & Growth Brad Albin Vice President, Manufacturing © 2020 Renewable Energy Group, Inc. All Rights Reserved. 27
Slide 28: Competitive Advantage
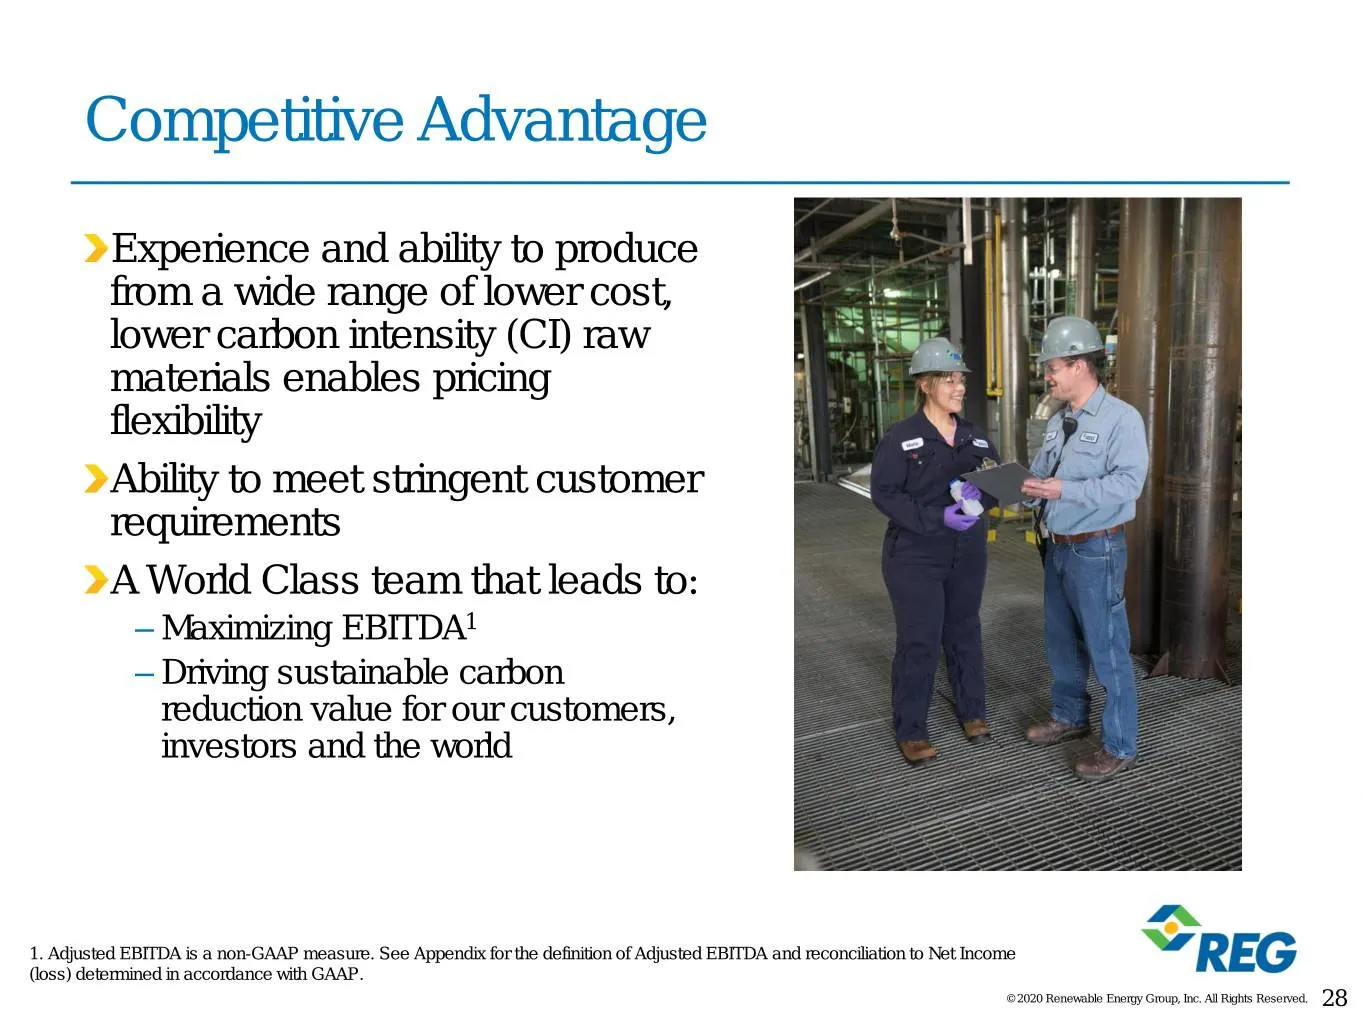
Competitive Advantage Experience and ability to produce from a wide range of lower cost, lower carbon intensity (CI) raw materials enables pricing flexibility Ability to meet stringent customer requirements A World Class team that leads to: – Maximizing EBITDA1 – Driving sustainable carbon reduction
Slide 29: Safety-Always Is A Core Value
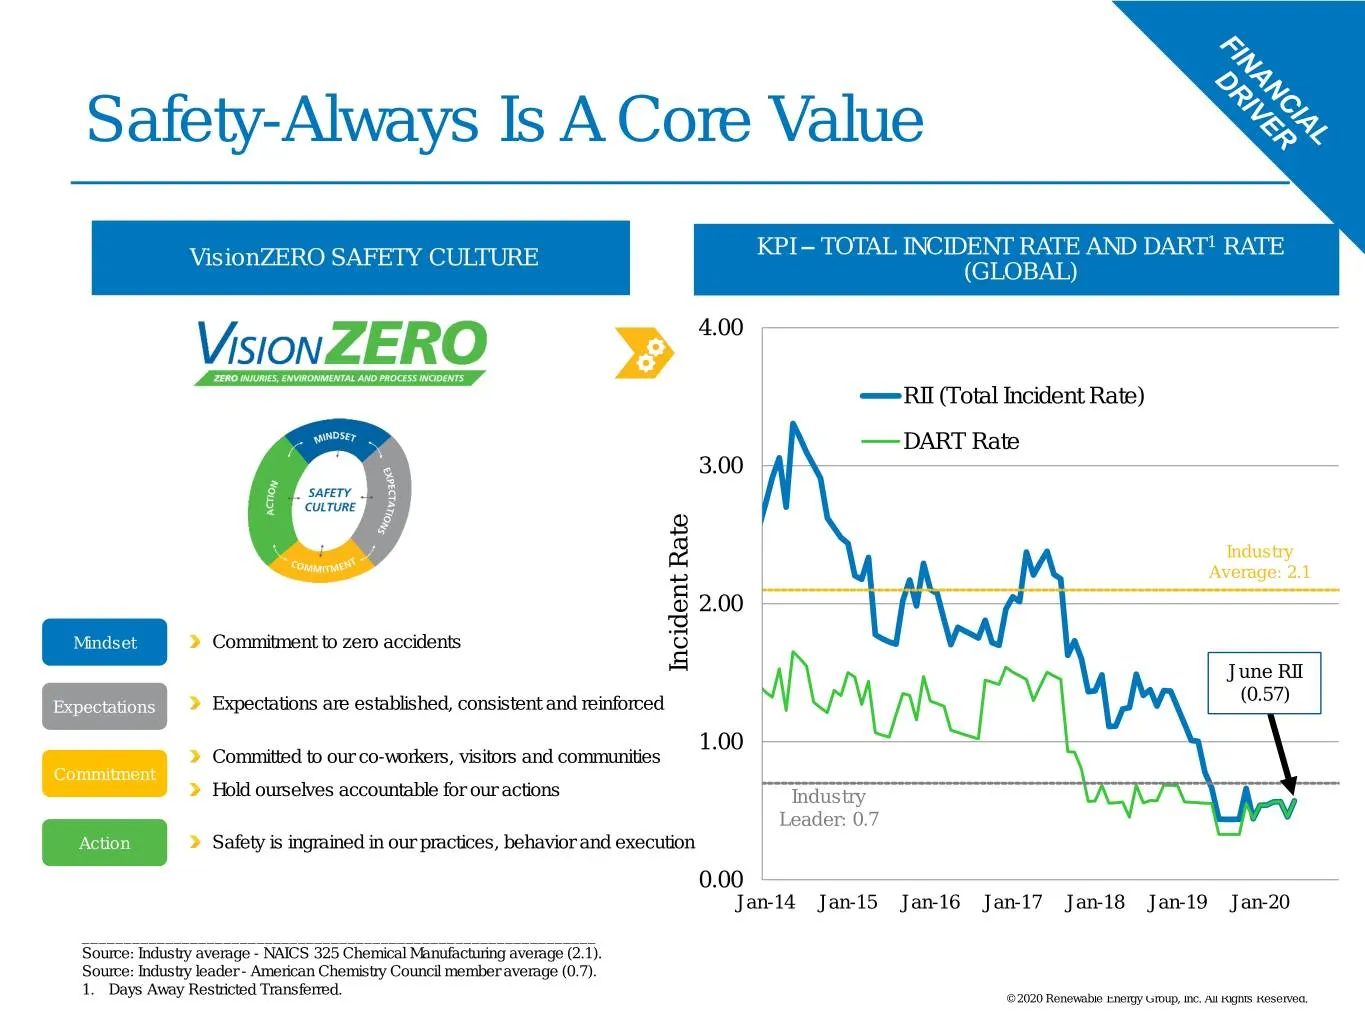
Safety-Always Is A Core Value 1 VisionZERO SAFETY CULTURE KPI – TOTAL INCIDENT RATE AND DART RATE (GLOBAL) 4.00 RII (Total Incident Rate) DART Rate 3.00 Industry Average: 2.1 2.00 Mindset Commitment to zero accidents Incident Rate Incident June RII (0.57) Expectations Expectations are established, c
Slide 30: REG Fuel Products – High Quality And High Impact
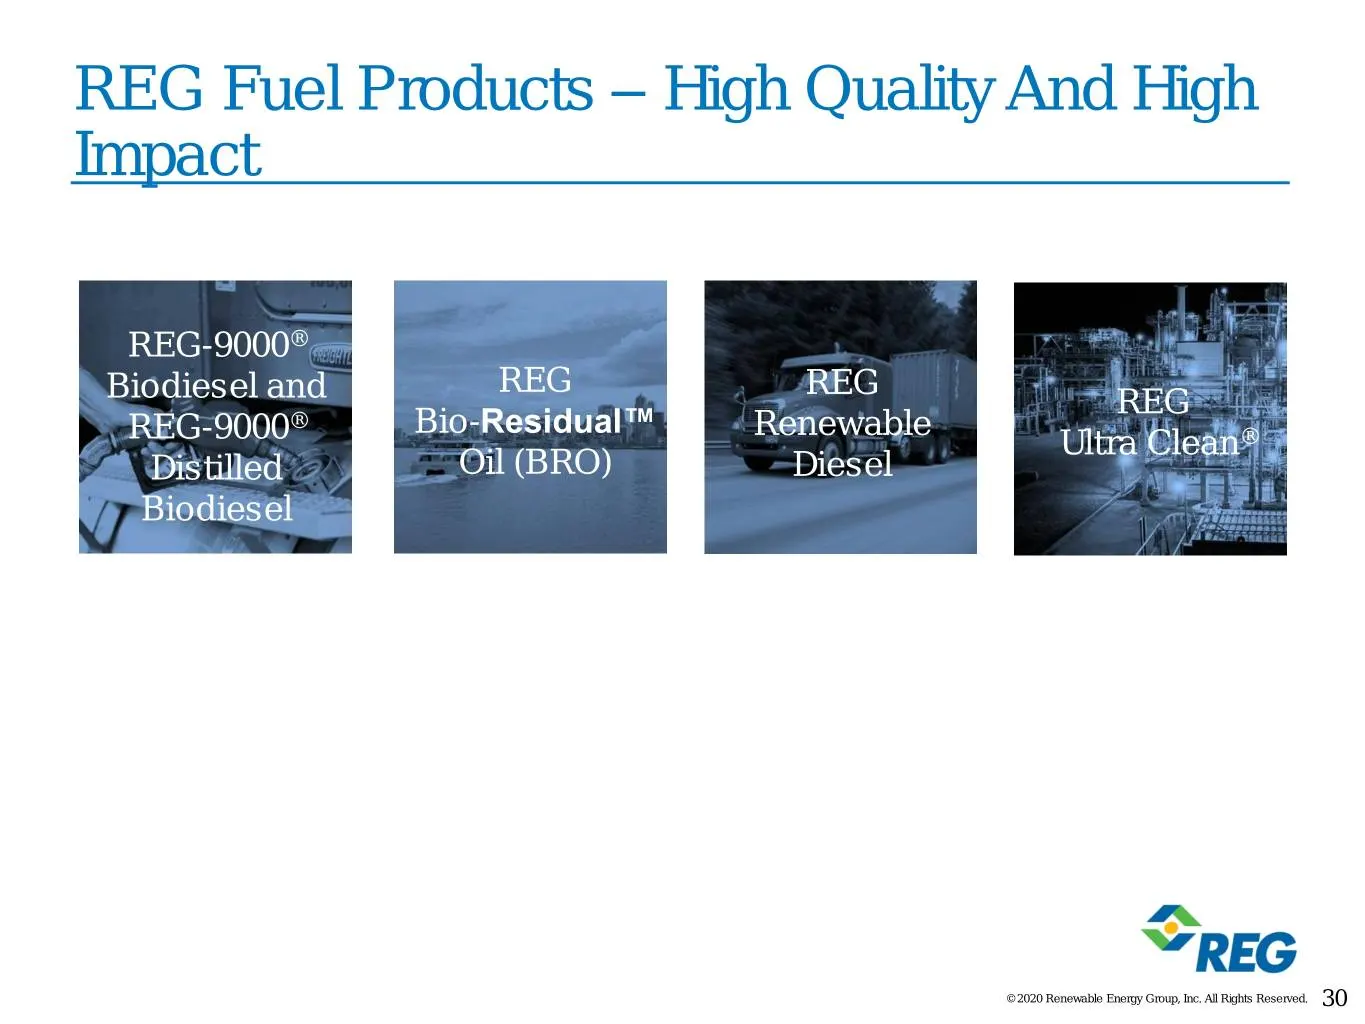
REG Fuel Products – High Quality And High Impact REG-9000® REG REG Biodiesel and REG ® Bio-Residual™ Renewable REG-9000 Ultra Clean® Distilled Oil (BRO) Diesel Biodiesel © 2020 Renewable Energy Group, Inc. All Rights Reserved. 30
Slide 31: REG Fuel Products – High Quality And High Impact
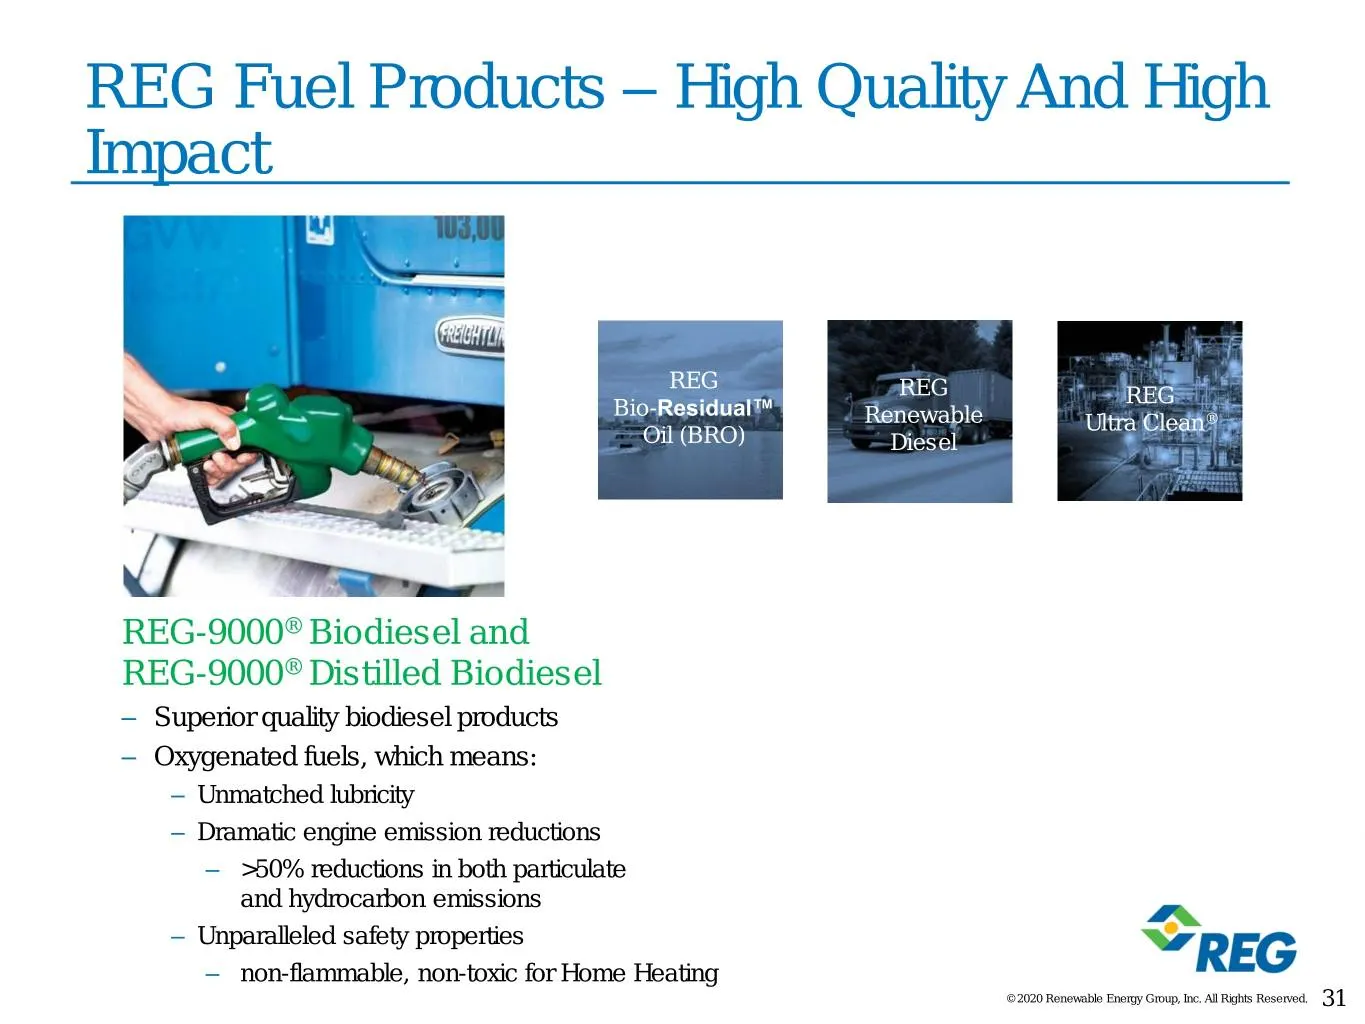
REG Fuel Products – High Quality And High Impact REG REG REG Bio-Residual™ Renewable Ultra Clean® Oil (BRO) Diesel REG-9000® Biodiesel and REG-9000® Distilled Biodiesel – Superior quality biodiesel products – Oxygenated fuels, which means: – Unmatched lubricity – Dramatic engine emission reductions
Slide 32: REG Fuel Products – High Quality And High Impact
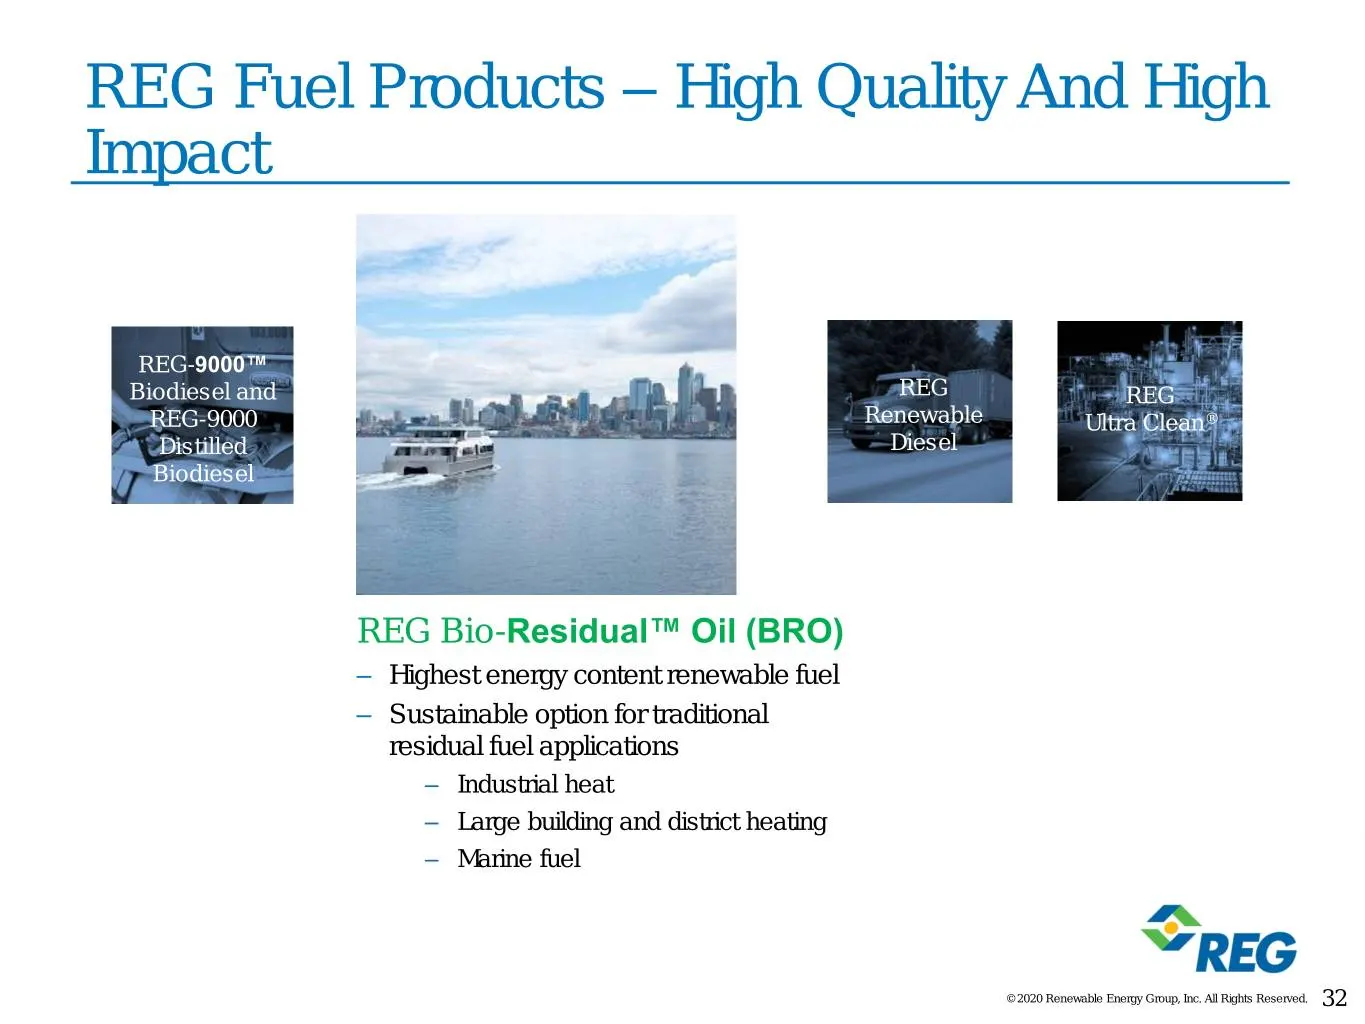
REG Fuel Products – High Quality And High Impact REG-9000™ Biodiesel and REG REG REG-9000 Renewable Ultra Clean® Distilled Diesel Biodiesel REG Bio-Residual™ Oil (BRO) – Highest energy content renewable fuel – Sustainable option for traditional residual fuel applications – Industrial heat – Large bu
Slide 33: REG Fuel Products – High Quality And High Impact
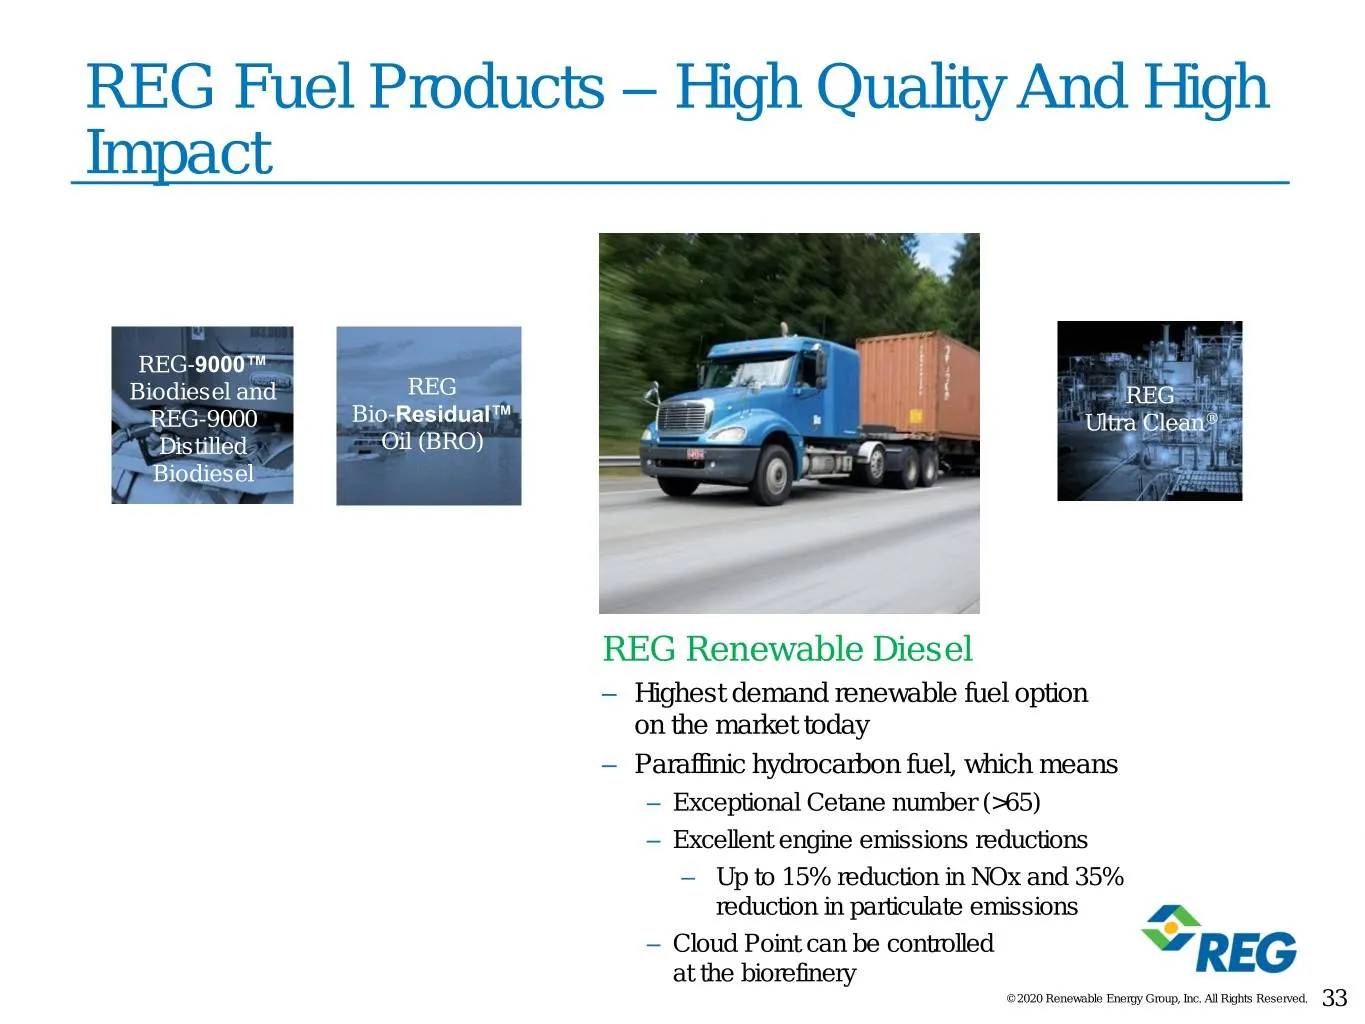
REG Fuel Products – High Quality And High Impact REG-9000™ Biodiesel and REG REG REG-9000 Bio-Residual™ Ultra Clean® Distilled Oil (BRO) Biodiesel REG Renewable Diesel – Highest demand renewable fuel option on the market today – Paraffinic hydrocarbon fuel, which means – Exceptional Cetane number (>
Slide 34: REG Fuel Products – High Quality And High Impact
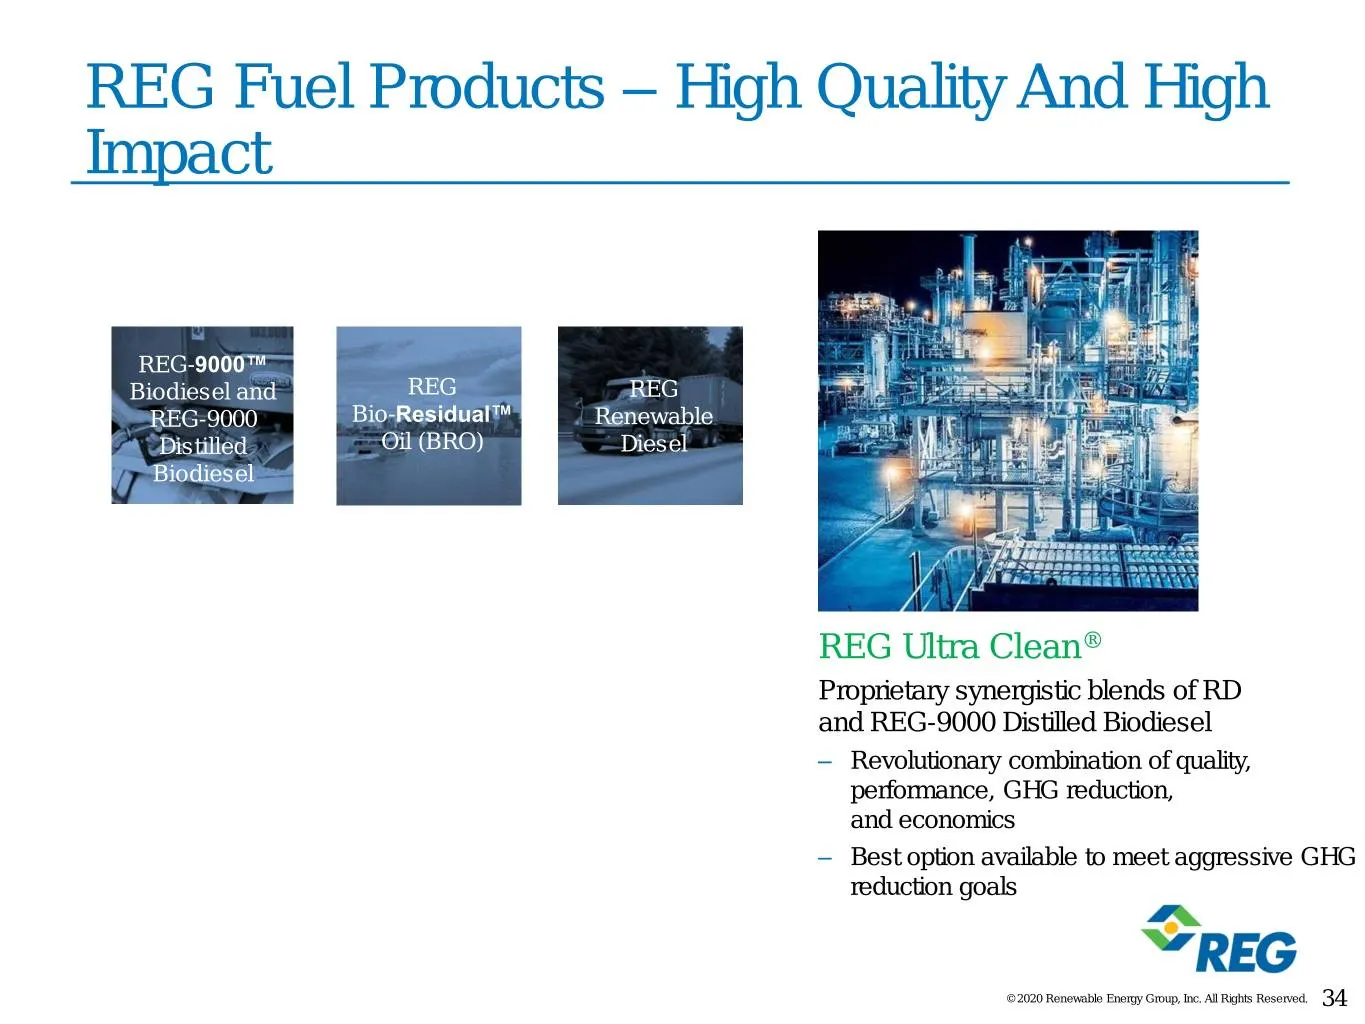
REG Fuel Products – High Quality And High Impact REG-9000™ Biodiesel and REG REG REG-9000 Bio-Residual™ Renewable Distilled Oil (BRO) Diesel Biodiesel REG Ultra Clean® Proprietary synergistic blends of RD and REG-9000 Distilled Biodiesel – Revolutionary combination of quality, performance, GHG reduc
Slide 35: Feedstock Expertise
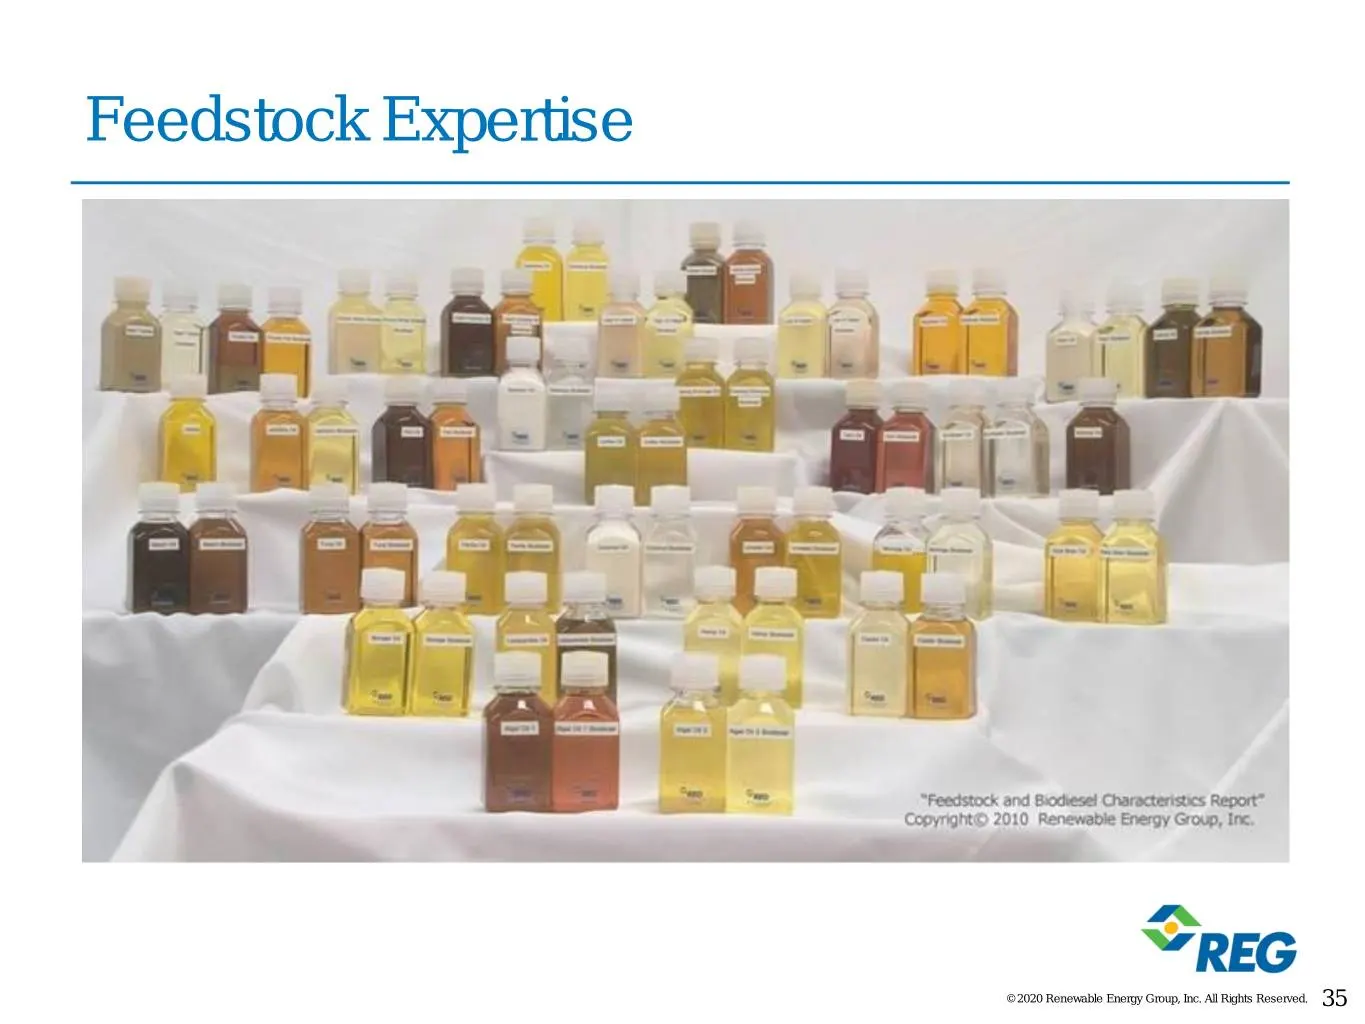
Feedstock Expertise © 2020 Renewable Energy Group, Inc. All Rights Reserved. 35
Slide 36: Our Fleet of Synergistic Biorefineries
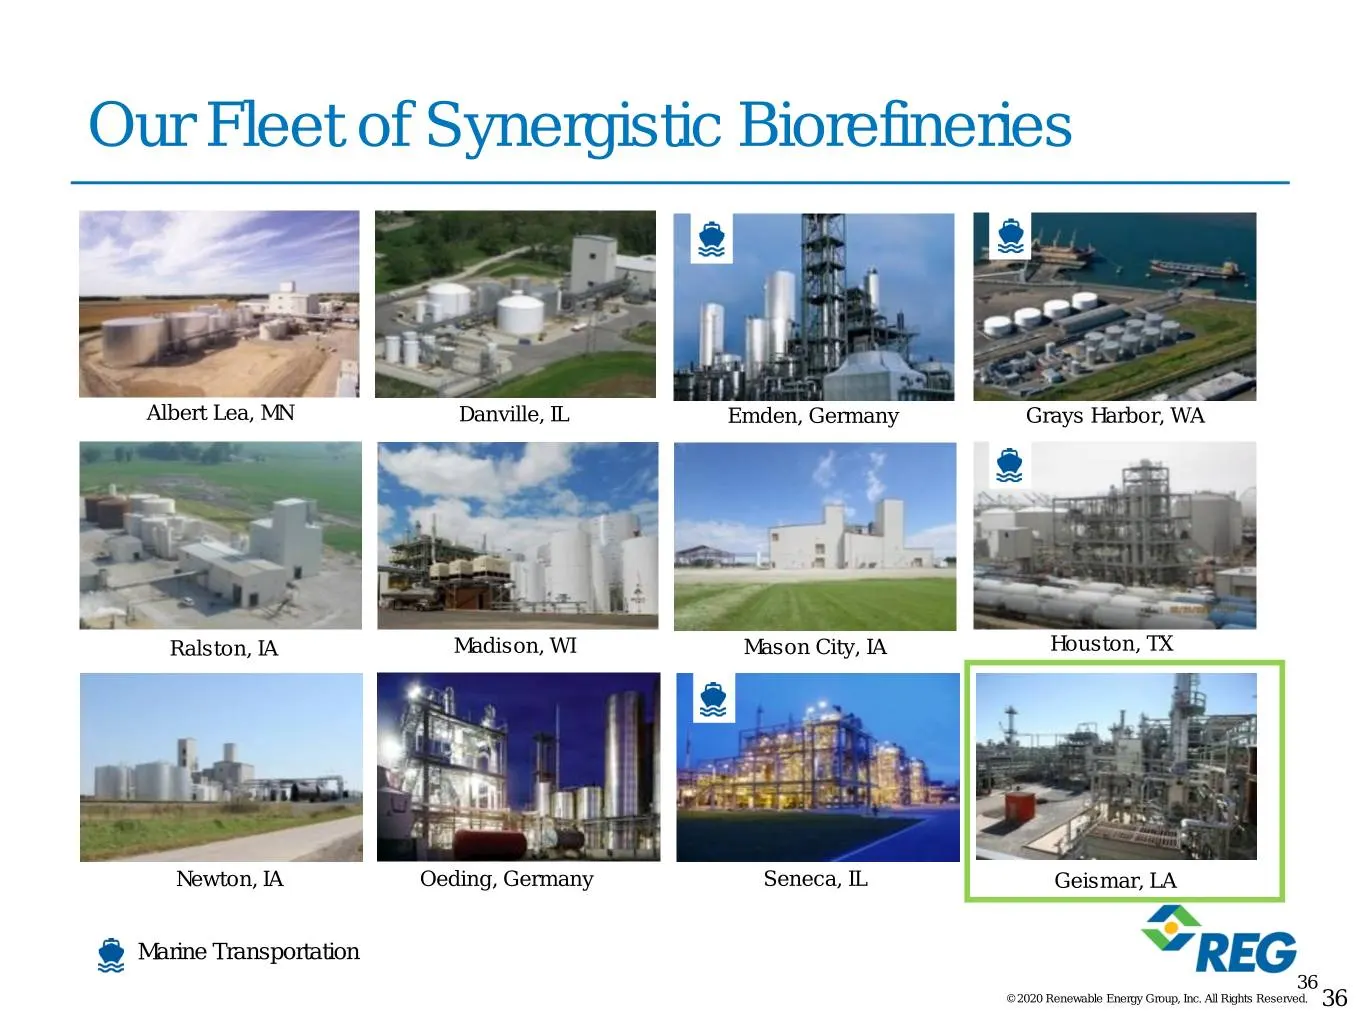
Our Fleet of Synergistic Biorefineries Albert Lea, MN Danville, IL Emden, Germany Grays Harbor, WA Ralston, IA Madison, WI Mason City, IA Houston, TX Newton, IA Oeding, Germany Seneca, IL Geismar, LA Marine Transportation 36 © 2020 Renewable Energy Group, Inc. All Rights Reserved. 36
Slide 37: Fully Integrated Model
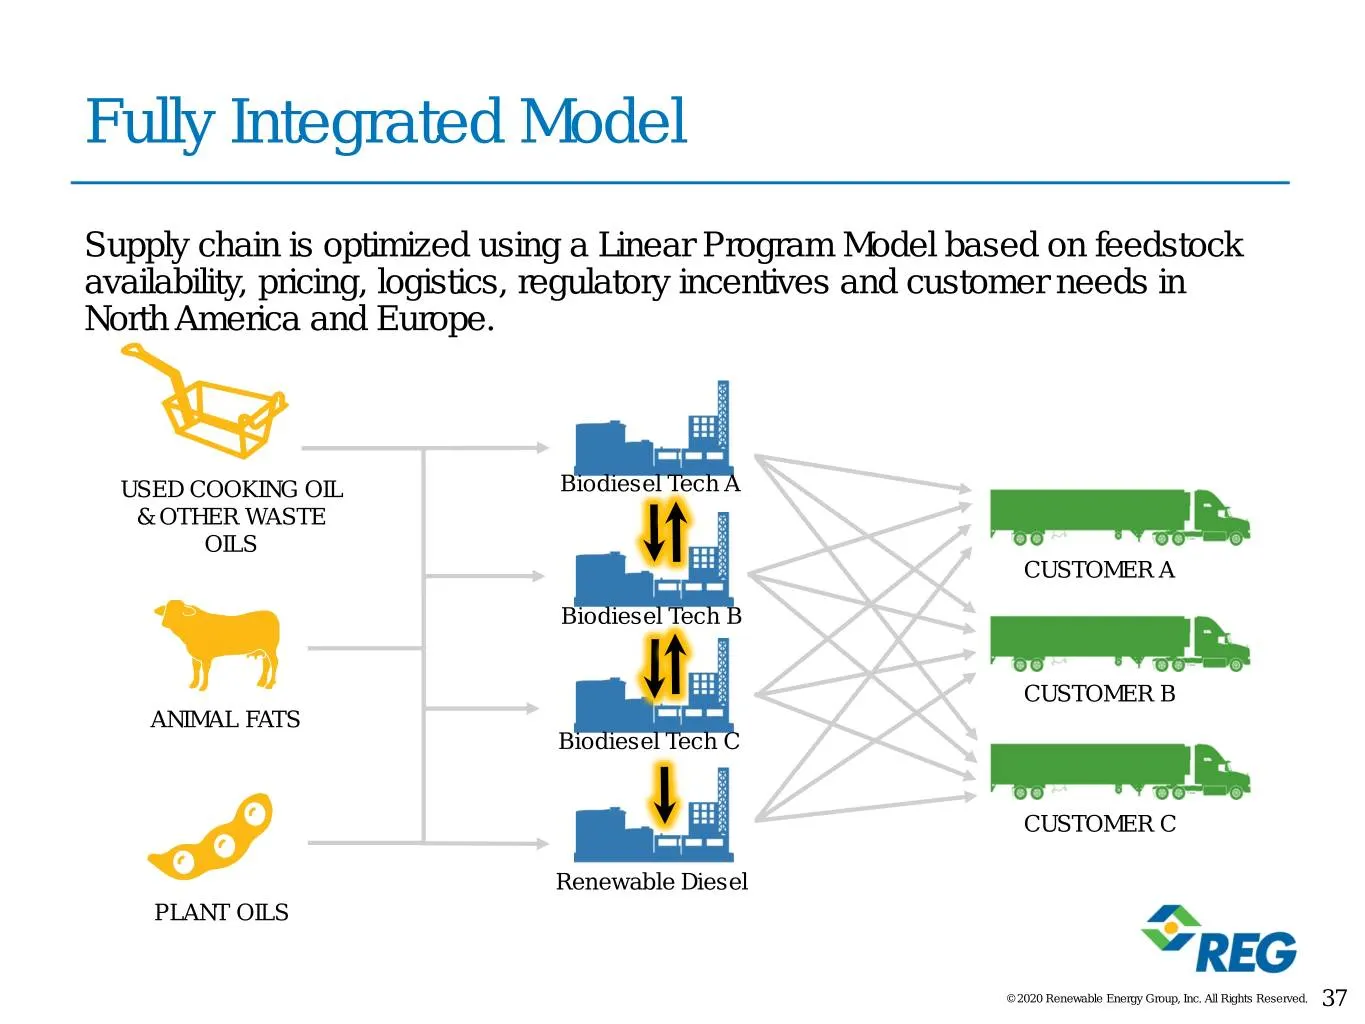
Fully Integrated Model Supply chain is optimized using a Linear Program Model based on feedstock availability, pricing, logistics, regulatory incentives and customer needs in North America and Europe. USED COOKING OIL Biodiesel Tech A & OTHER WASTE OILS CUSTOMER A Biodiesel Tech B CUSTOMER B ANIMAL
Slide 38: Production Volume Growth
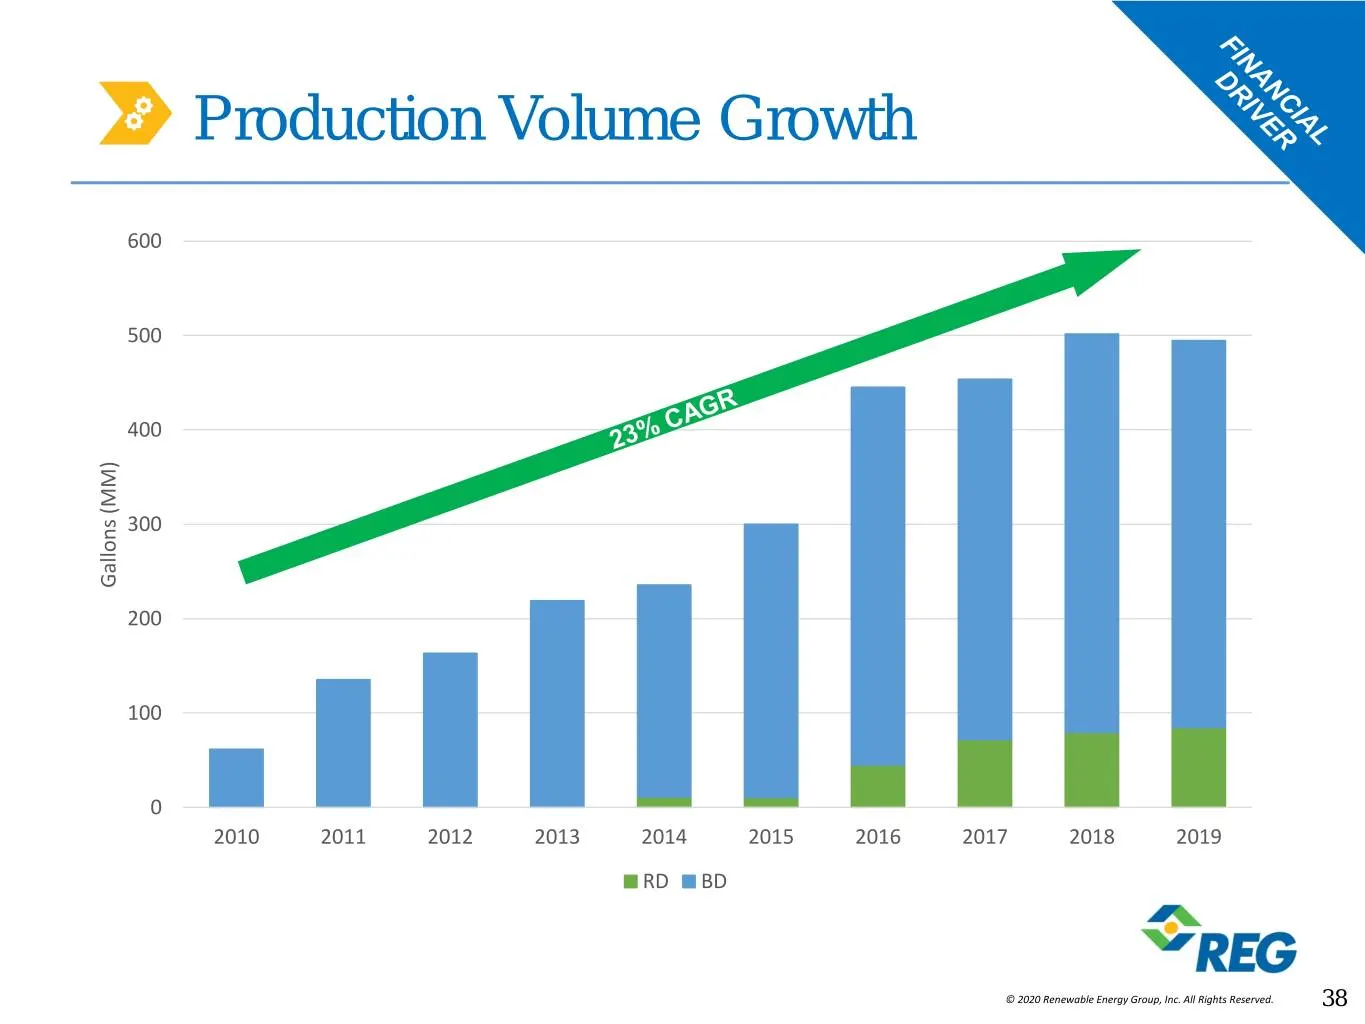
Production Volume Growth 600 500 400 300 Gallons (MM)Gallons 200 100 0 2010 2011 2012 2013 2014 2015 2016 2017 2018 2019 RD BD © 2020 Renewable Energy Group, Inc. All Rights Reserved. 38
Slide 39: REG Organic Growth: Fleet Effective Capacity Improvement
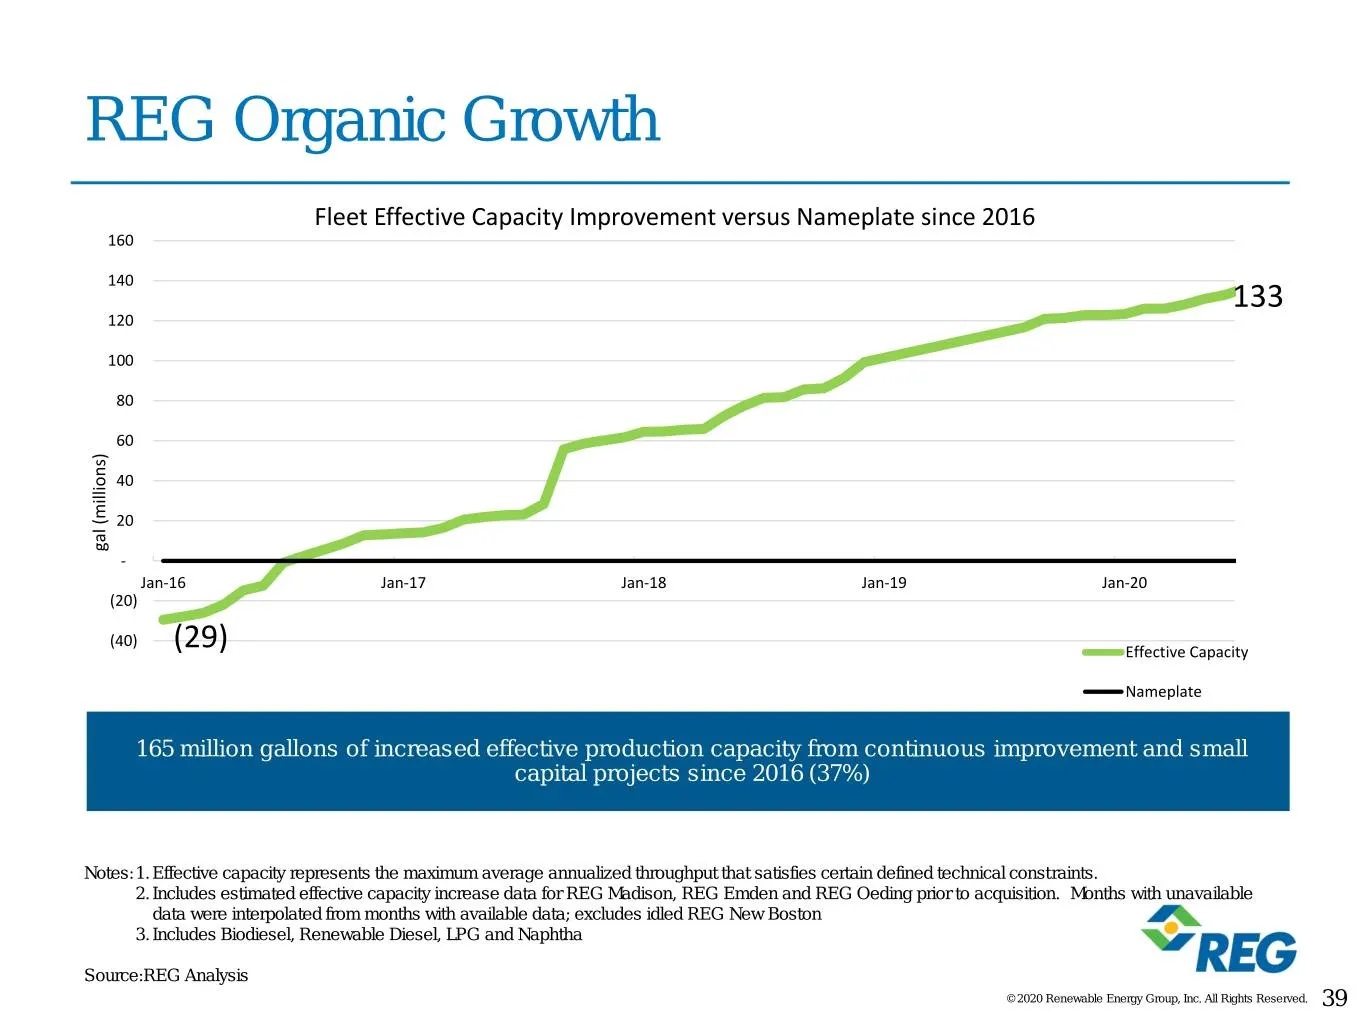
REG Organic Growth Fleet Effective Capacity Improvement versus Nameplate since 2016 160 140 133 120 100 80 60 40 20 gal(millions) - Jan-16 Jan-17 Jan-18 Jan-19 Jan-20 (20) (40) (29) Effective Capacity Nameplate 165 million gallons of increased effective production capacity from continuous improvemen
Slide 40: Sustainability Starts With Us
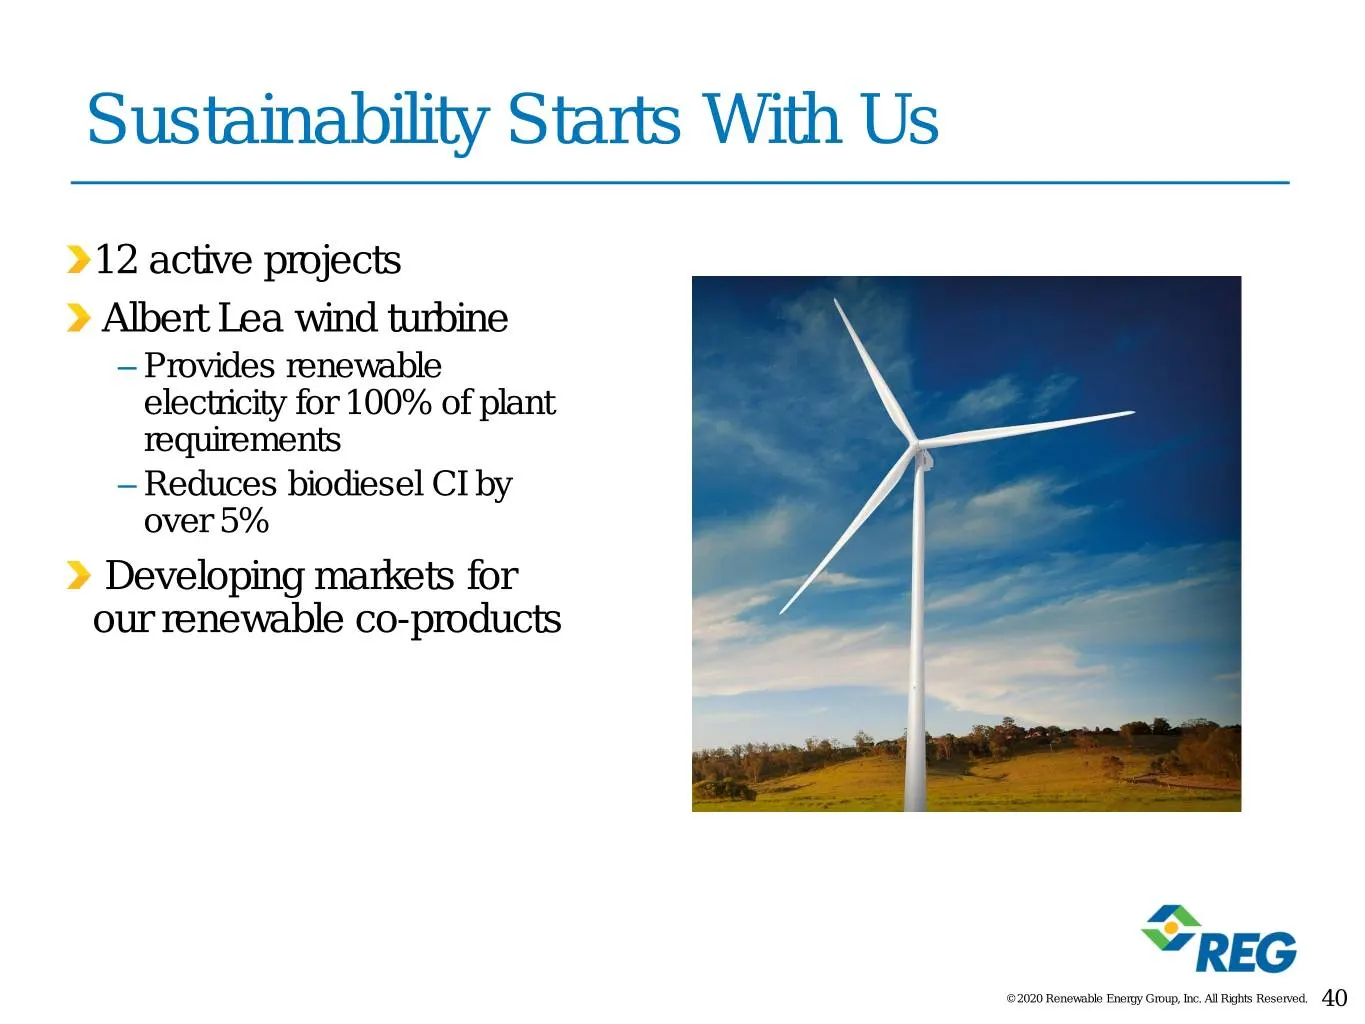
Sustainability Starts With Us 12 active projects Albert Lea wind turbine – Provides renewable electricity for 100% of plant requirements – Reduces biodiesel CI by over 5% Developing markets for our renewable co-products © 2020 Renewable Energy Group, Inc. All Rights Reserved. 40
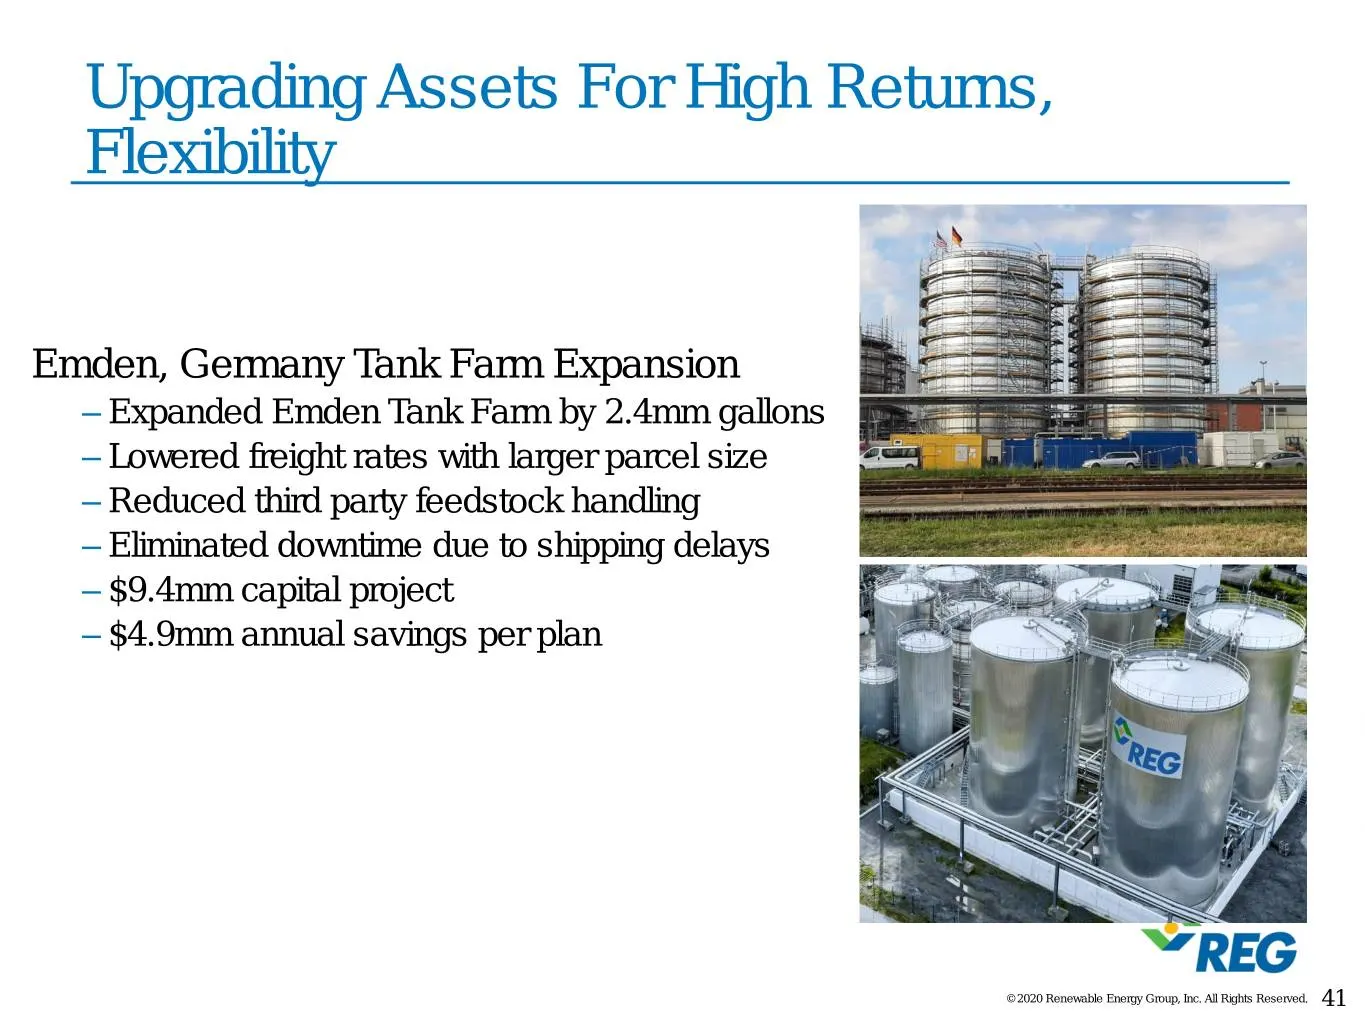
Slide 41: Upgrading Assets For High Returns, Flexibility: Emden
Upgrading Assets For High Returns, Flexibility Emden, Germany Tank Farm Expansion – Expanded Emden Tank Farm by 2.4mm gallons – Lowered freight rates with larger parcel size – Reduced third party feedstock handling – Eliminated downtime due to shipping delays – $9.4mm capital project – $4.9mm annual
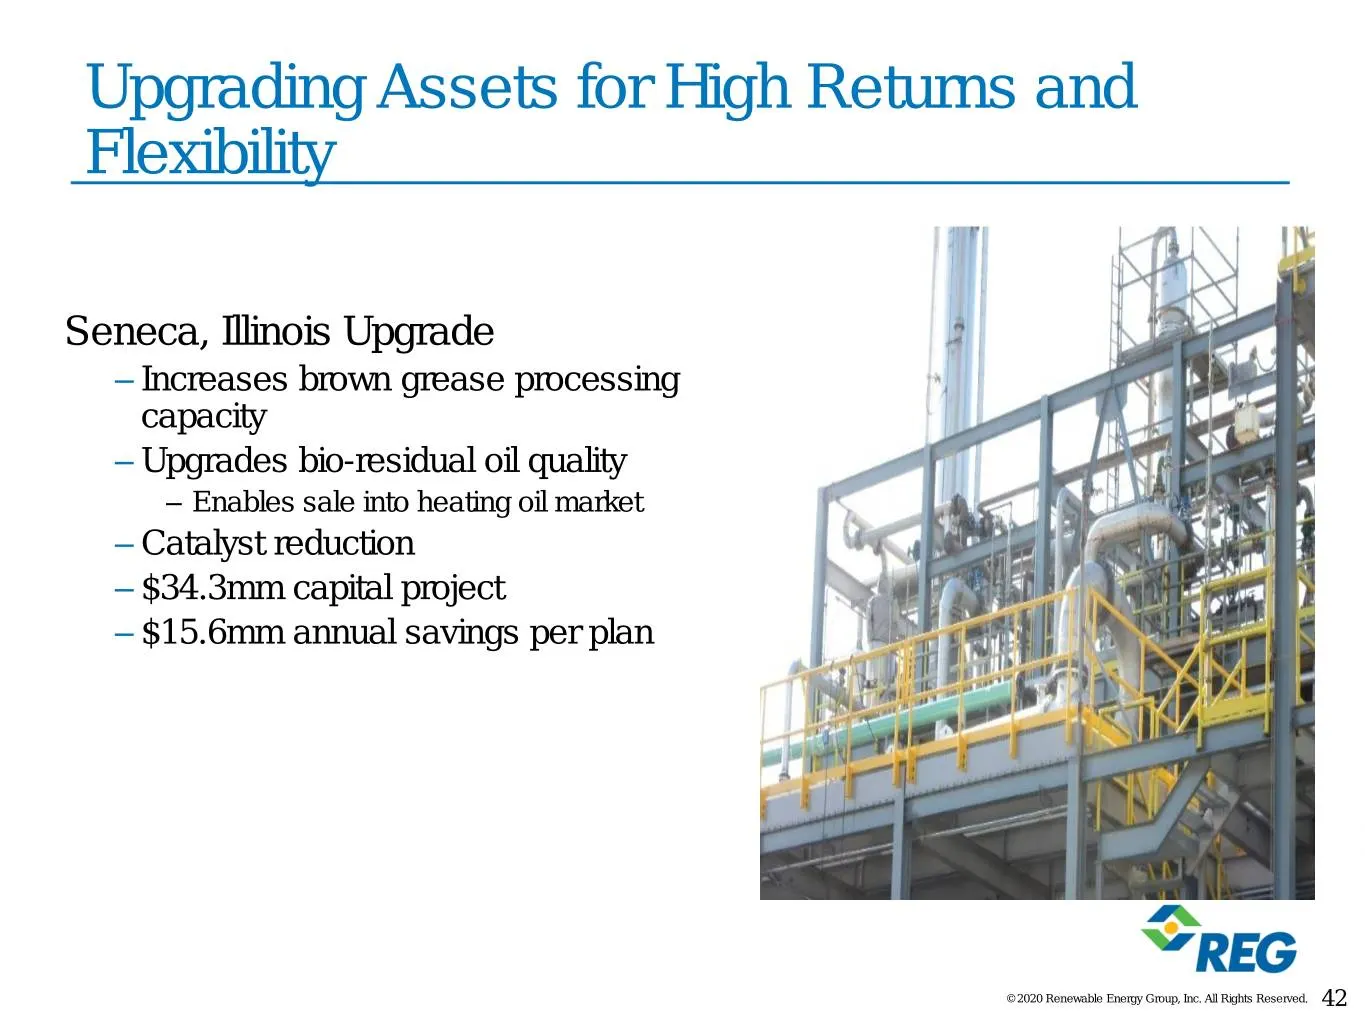
Slide 42: Upgrading Assets for High Returns: Seneca
Upgrading Assets for High Returns and Flexibility Seneca, Illinois Upgrade – Increases brown grease processing capacity – Upgrades bio-residual oil quality – Enables sale into heating oil market – Catalyst reduction – $34.3mm capital project – $15.6mm annual savings per plan © 2020 Renewable Energy
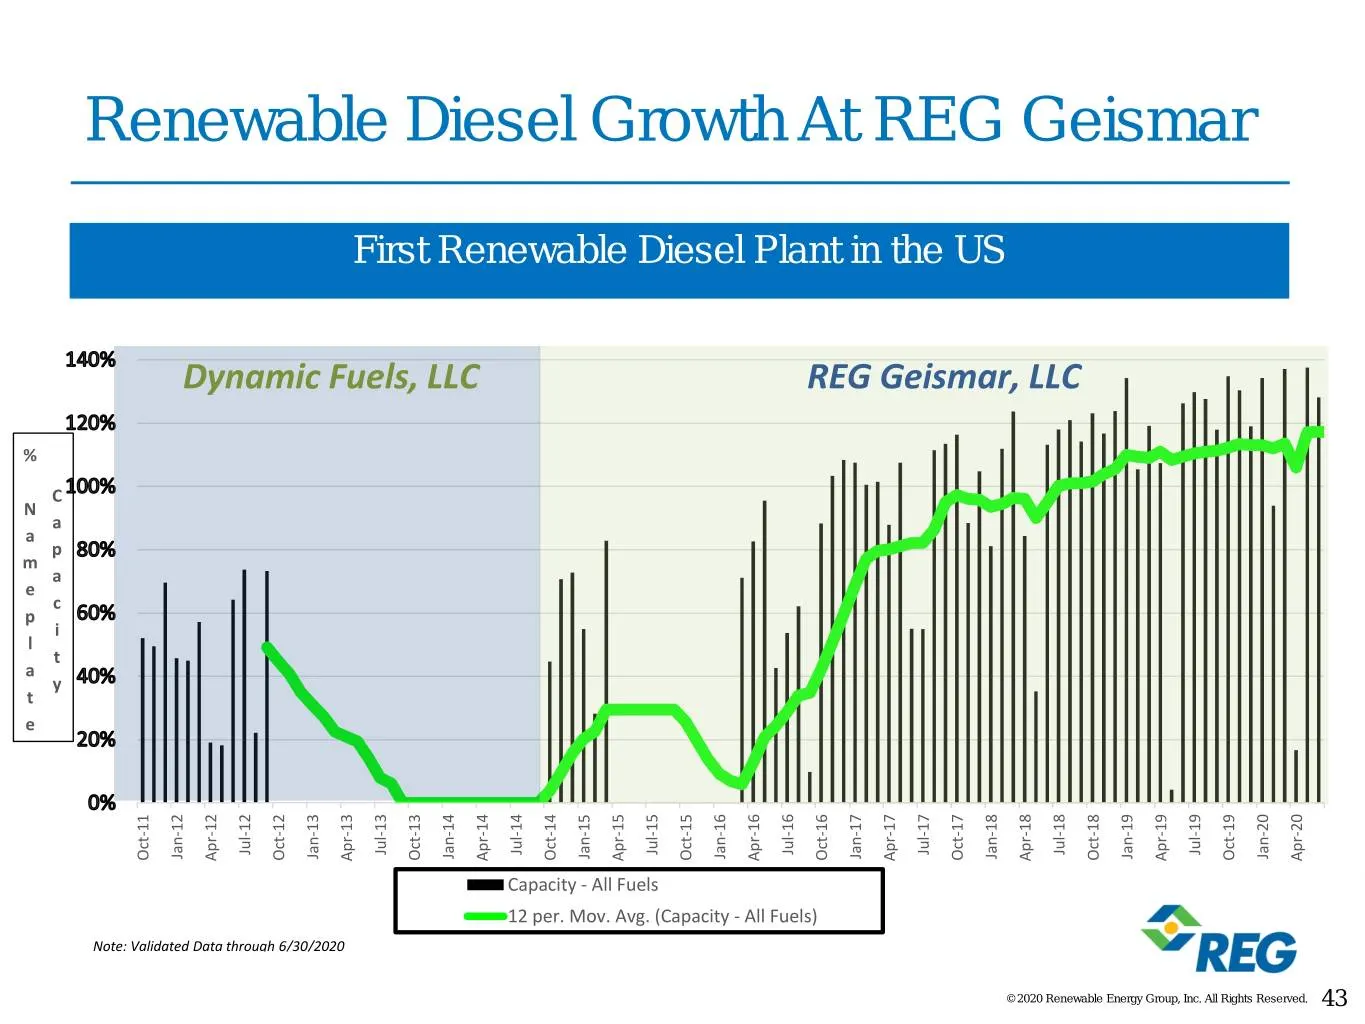
Slide 43: Renewable Diesel Growth At REG Geismar
m % N p e a e a t l p C a a y c t i Renewable Diesel Growth At REGGeismar Note: ValidatedData Oct-11 Jan-12 Dynamic Fuels, Apr-12 through Jul-12 6/30/2020 Oct-12 Jan-13 Apr-13 First Renewable Diesel Plantin the Jul-13 Oct-13 LLC Jan-14 Apr-14 12 per. Mov. Avg. (Capacity - All Fuels) CapacityAll - Fu
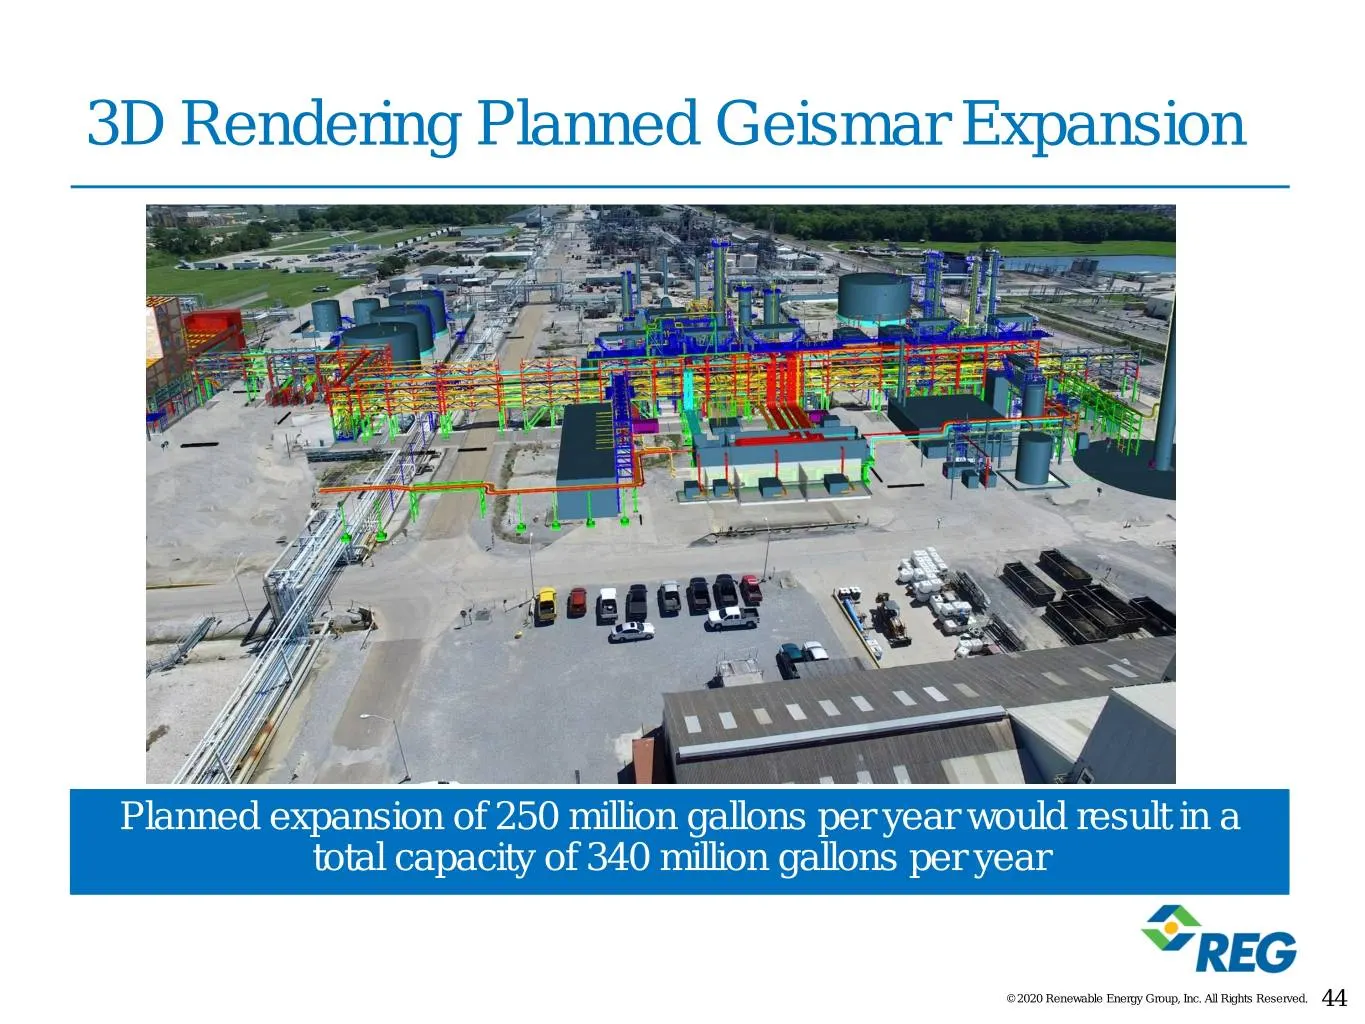
Slide 44: Planned Geismar Expansion
3D Rendering Planned Geismar Expansion Planned expansion of 250 million gallons per year would result in a total capacity of 340 million gallons per year © 2020 Renewable Energy Group, Inc. All Rights Reserved. 44
Slide 45: Geismar Video
Geismar Video © 2020 Renewable Energy Group, Inc. All Rights Reserved.
Slide 46: Business Drivers and Market Fundamentals
Business Drivers and Market Fundamentals Natalie Merrill Vice President, Business Development and Optimization © 2020 Renewable Energy Group, Inc. All Rights Reserved. 46

Slide 47: Demand Drivers
Demand Drivers © 2020 Renewable Energy Group, Inc. All Rights Reserved. 47
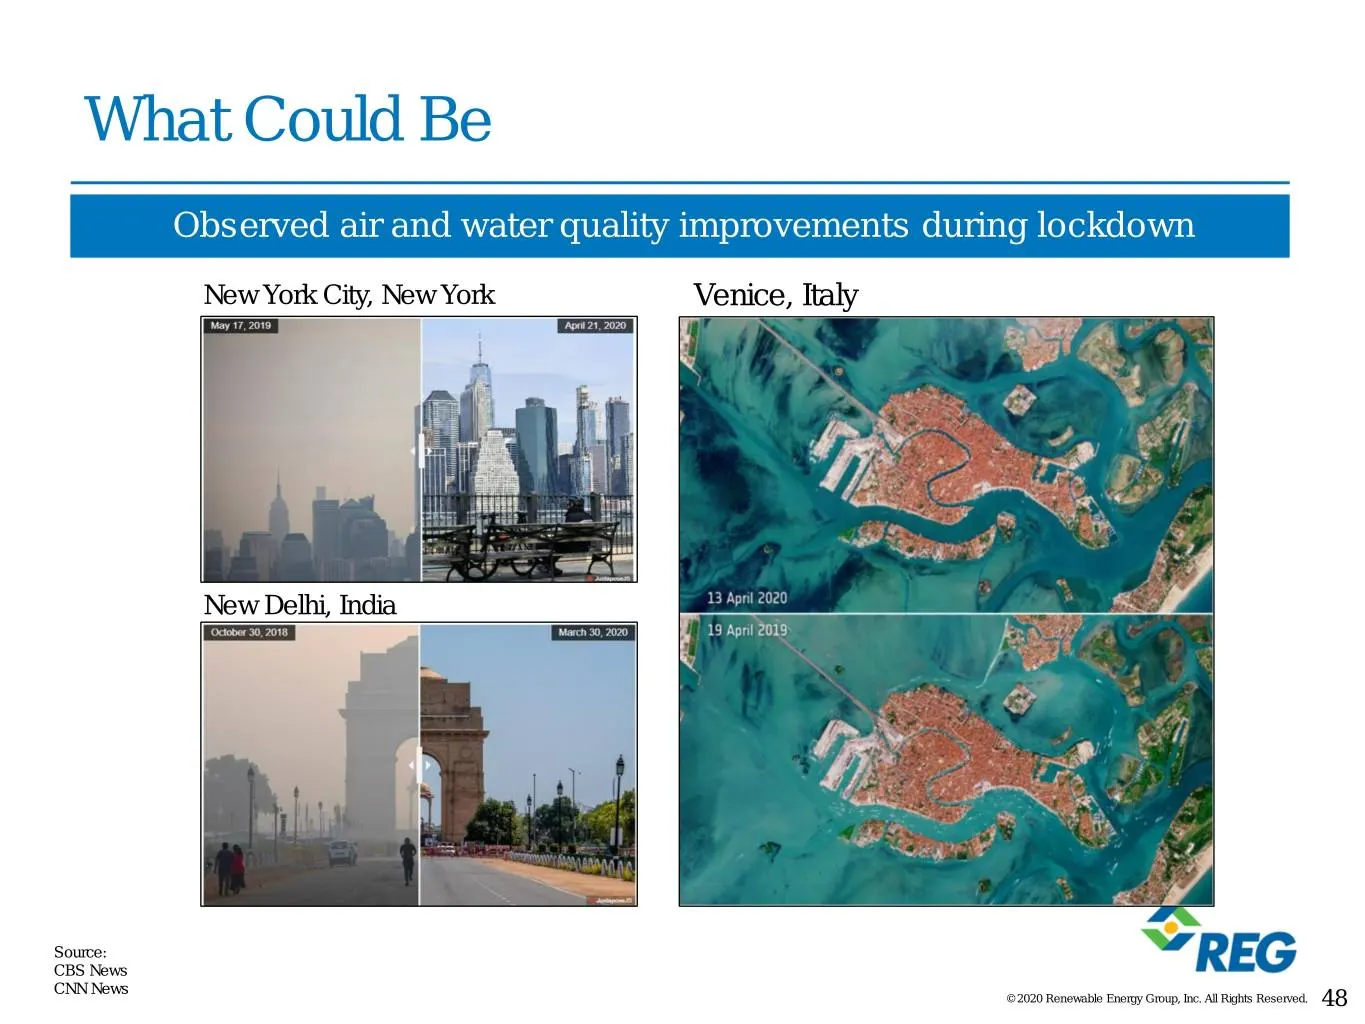
Slide 48: What Could Be Observed During Lockdown
What Could Be Observed air and water quality improvements during lockdown New York City, New York Venice, Italy New Delhi, India Source: CBS News CNN News © 2020 Renewable Energy Group, Inc. All Rights Reserved. 48
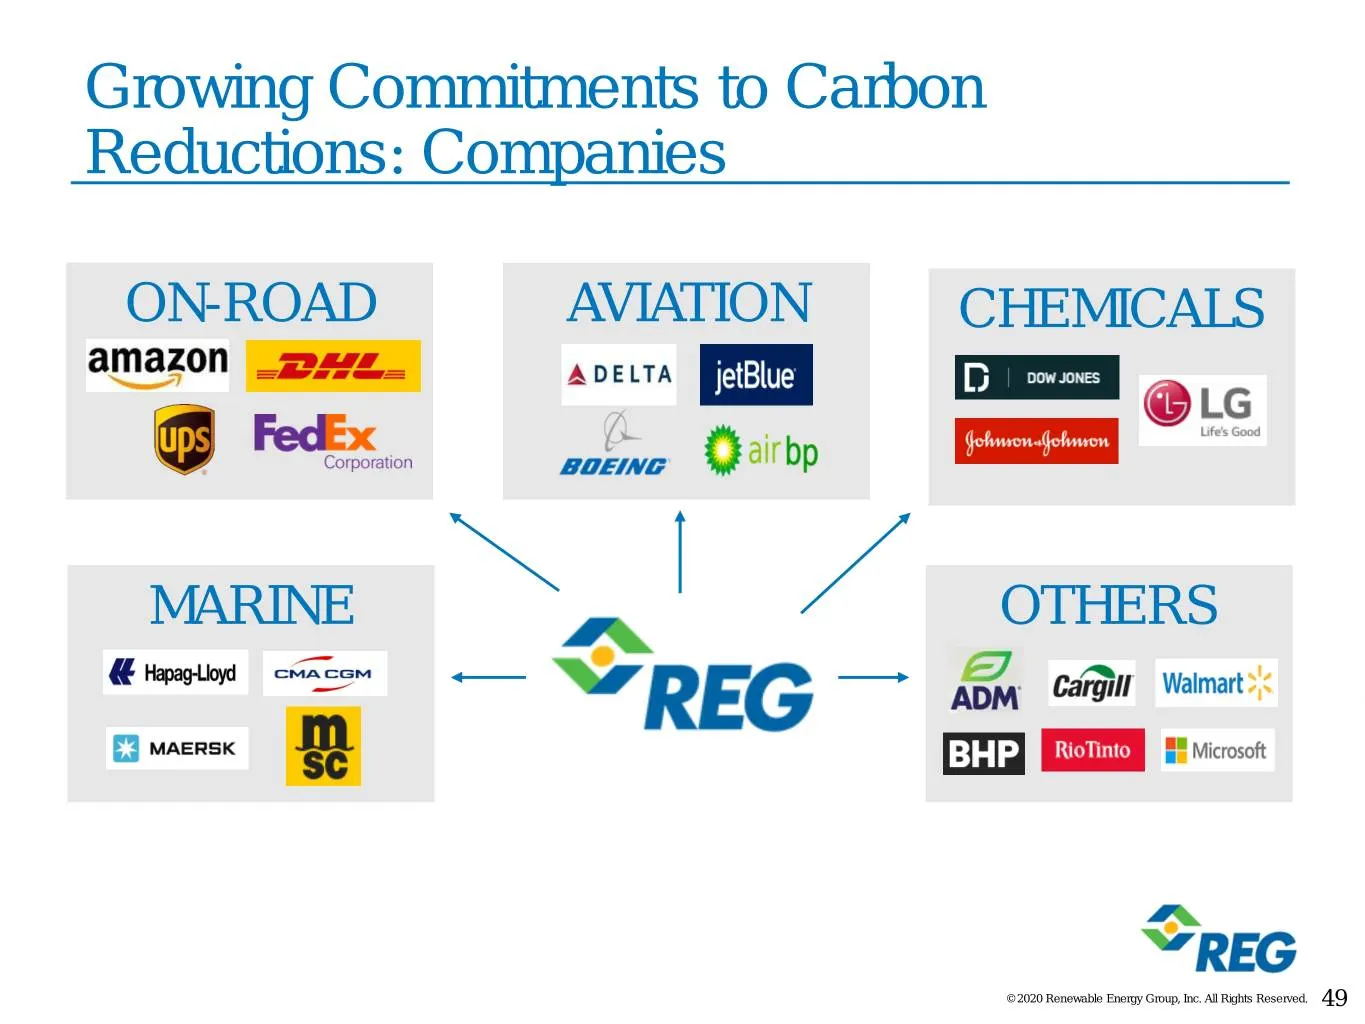
Slide 49: Growing Commitments to Carbon Reductions: Companies
Growing Commitments to Carbon Reductions: Companies ON-ROAD AVIATION CHEMICALS MARINE OTHERS © 2020 Renewable Energy Group, Inc. All Rights Reserved. 49
Slide 50: Growing Commitments to Carbon Reductions: Investors
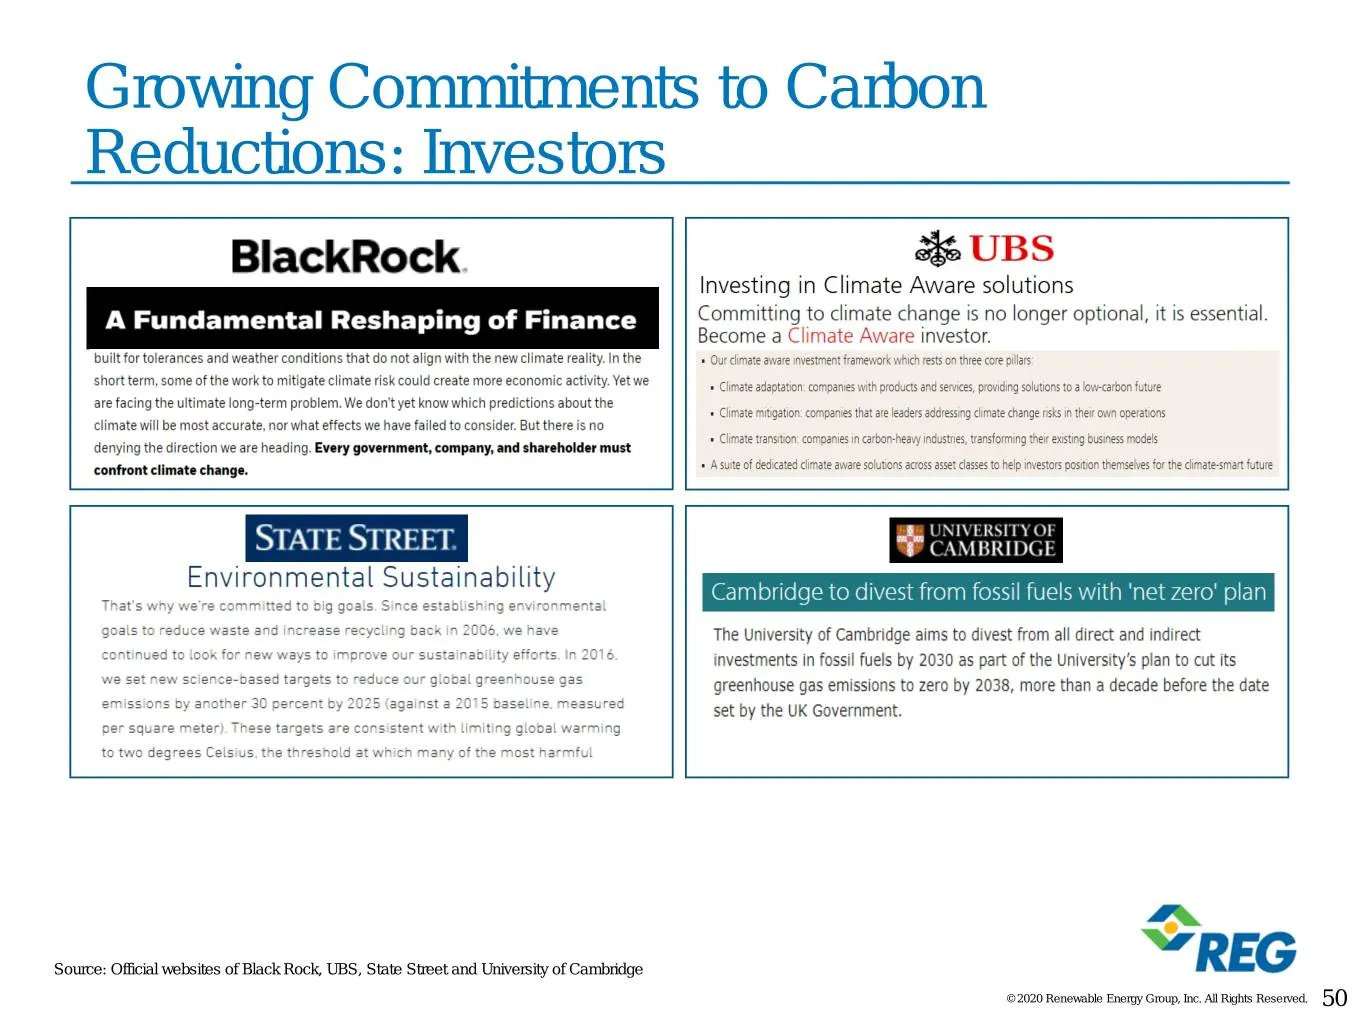
Growing Commitments to Carbon Reductions: Investors Source: Official websites of Black Rock, UBS, State Street and University of Cambridge © 2020 Renewable Energy Group, Inc. All Rights Reserved. 50
Slide 51: Growing Commitments to Carbon Reductions: State and Local Governments
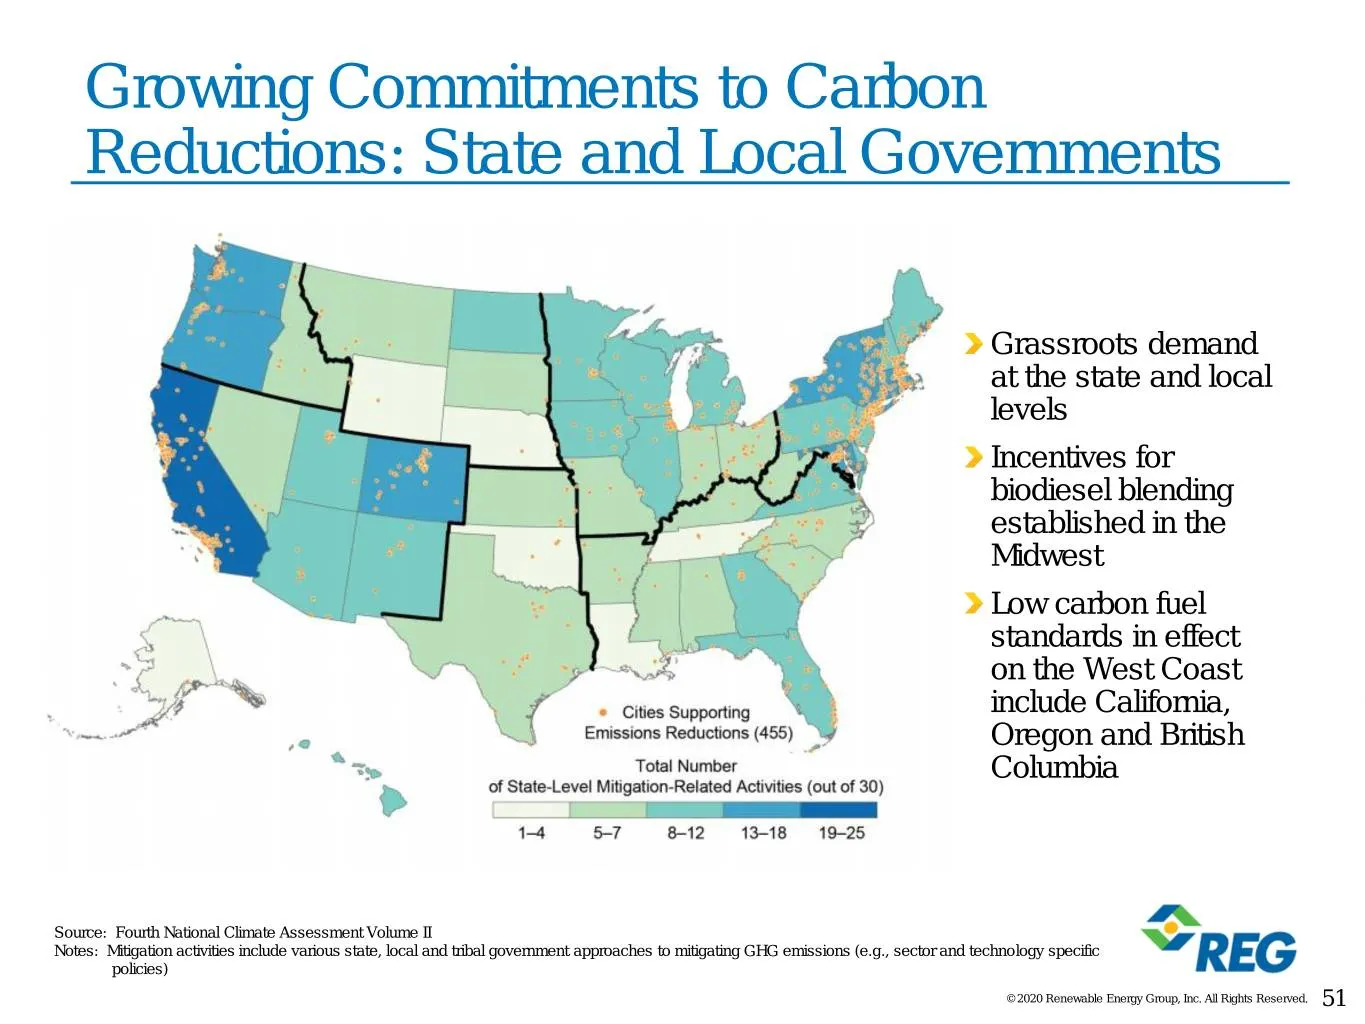
Growing Commitments to Carbon Reductions: State and Local Governments Grassroots demand at the state and local levels Incentives for biodiesel blending established in the Midwest Low carbon fuel standards in effect on the West Coast include California, Oregon and British Columbia Source: Fourth Nati
Slide 52: California Demands Growing Amounts of BBD
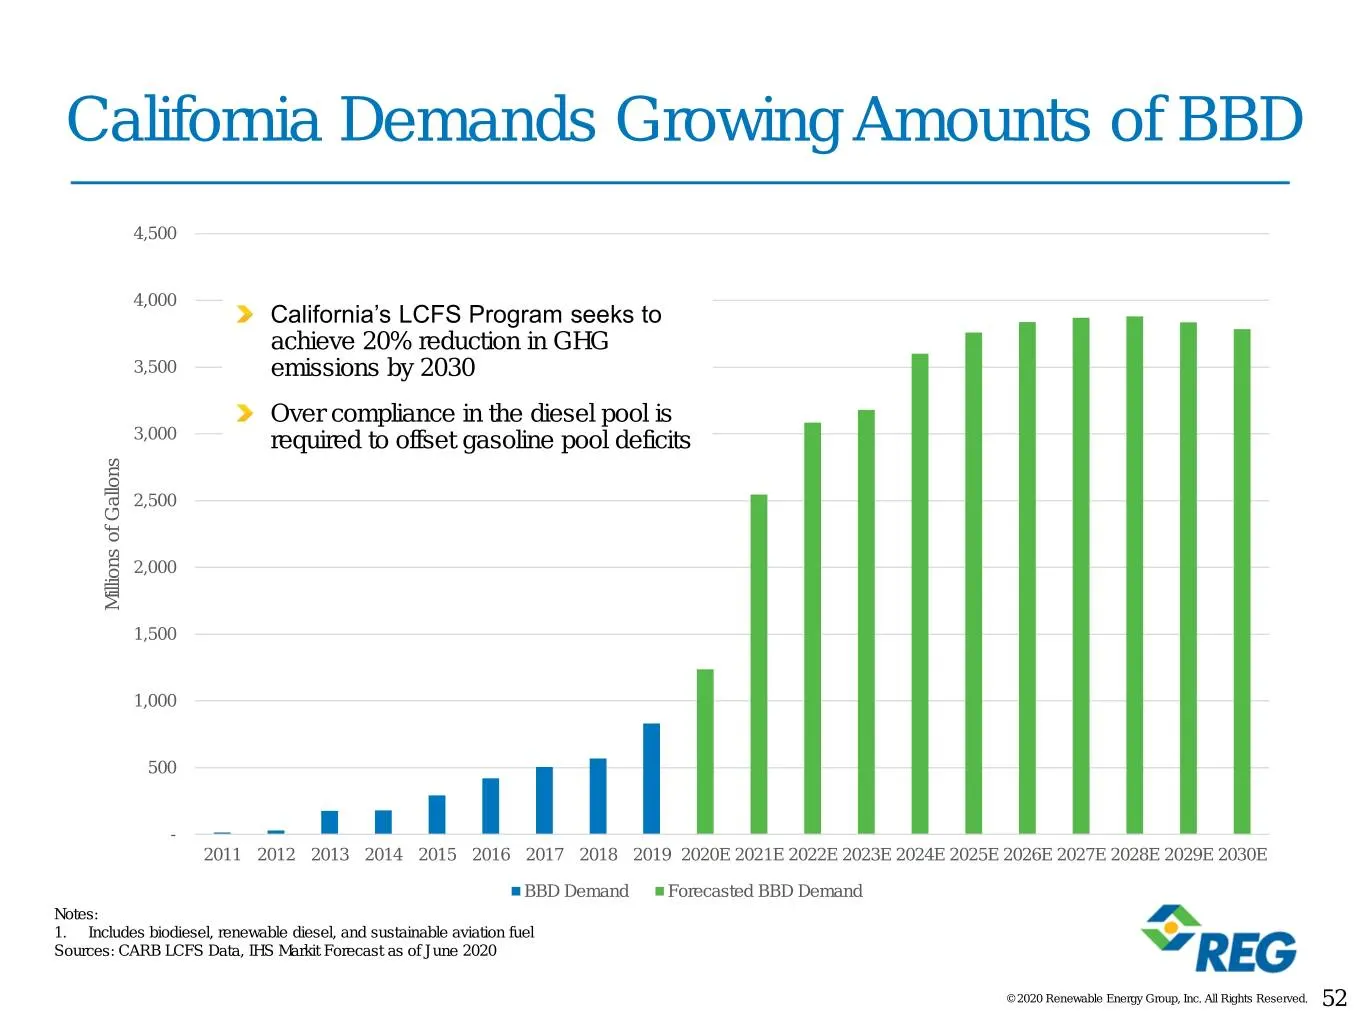
California Demands Growing Amounts of BBD 4,500 4,000 California’s LCFS Program seeks to achieve 20% reduction in GHG 3,500 emissions by 2030 Over compliance in the diesel pool is 3,000 required to offset gasoline pool deficits 2,500 2,000 Millions Millions ofGallons 1,500 1,000 500 - 2011 2012 2013
Slide 53: Growing Commitments to Carbon Reductions: European Countries
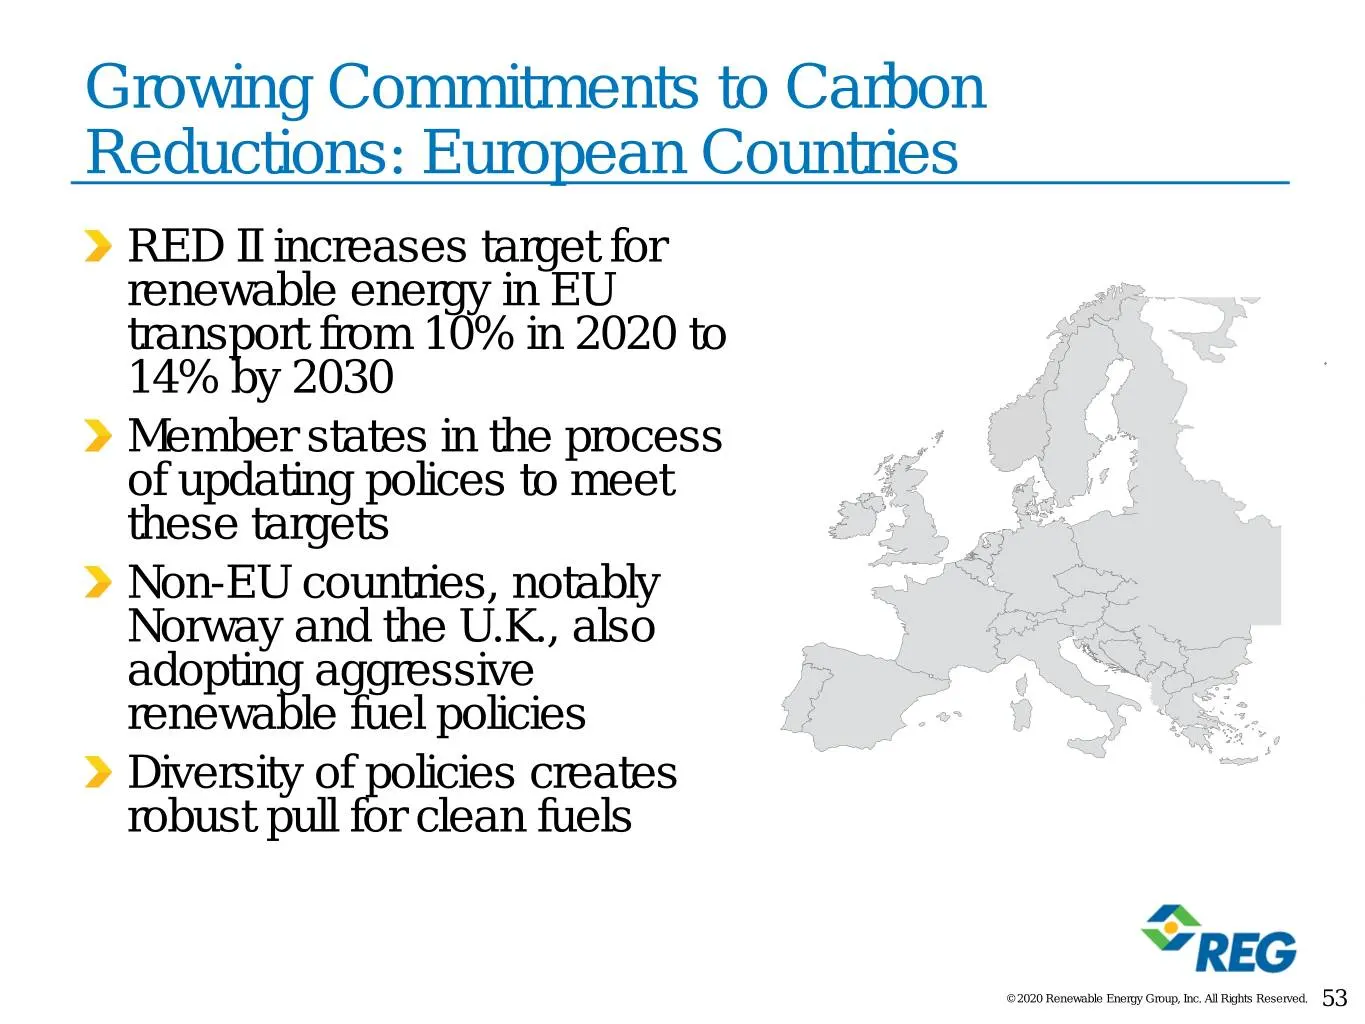
Growing Commitments to Carbon Reductions: European Countries RED II increases target for renewable energy in EU transport from 10% in 2020 to 14% by 2030 Member states in the process of updating polices to meet these targets Non-EU countries, notably Norway and the U.K., also adopting aggressive ren
Slide 54: North America and Europe Demand for Bio-Based Diesel
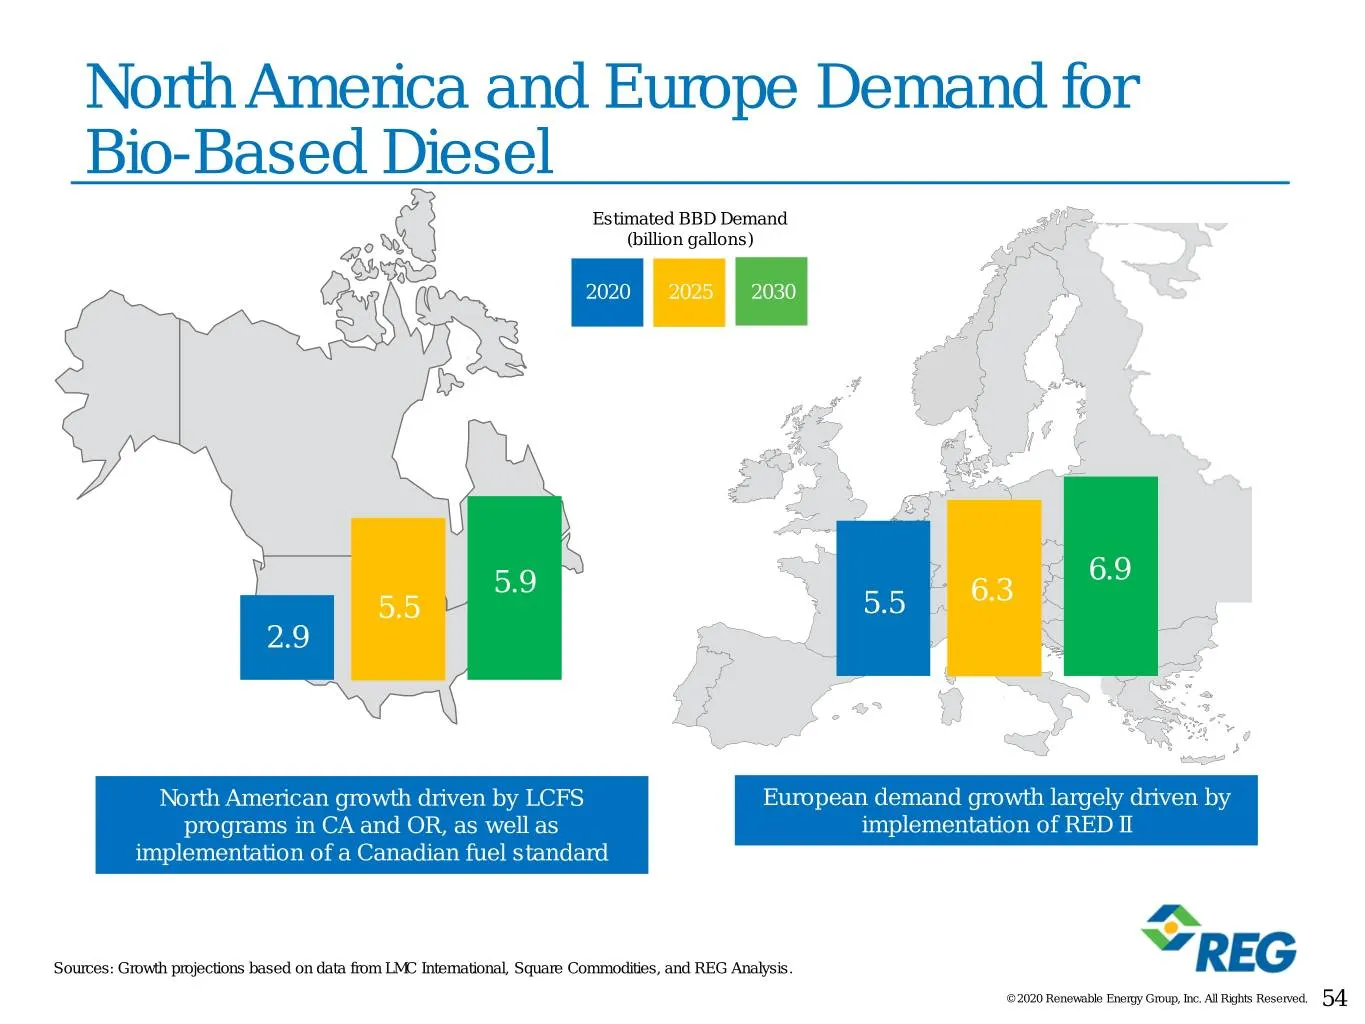
North America and Europe Demand for Bio-Based Diesel Estimated BBD Demand (billion gallons) 2020 2025 2030 6.9 5.9 6.3 5.5 5.5 2.9 North American growth driven by LCFS European demand growth largely driven by programs in CA and OR, as well as implementation of RED II implementation of a Canadian fue

Slide 55: Supply Picture
Supply Picture © 2020 Renewable Energy Group, Inc. All Rights Reserved. 55
Slide 56: Renewable Diesel Project Announcements
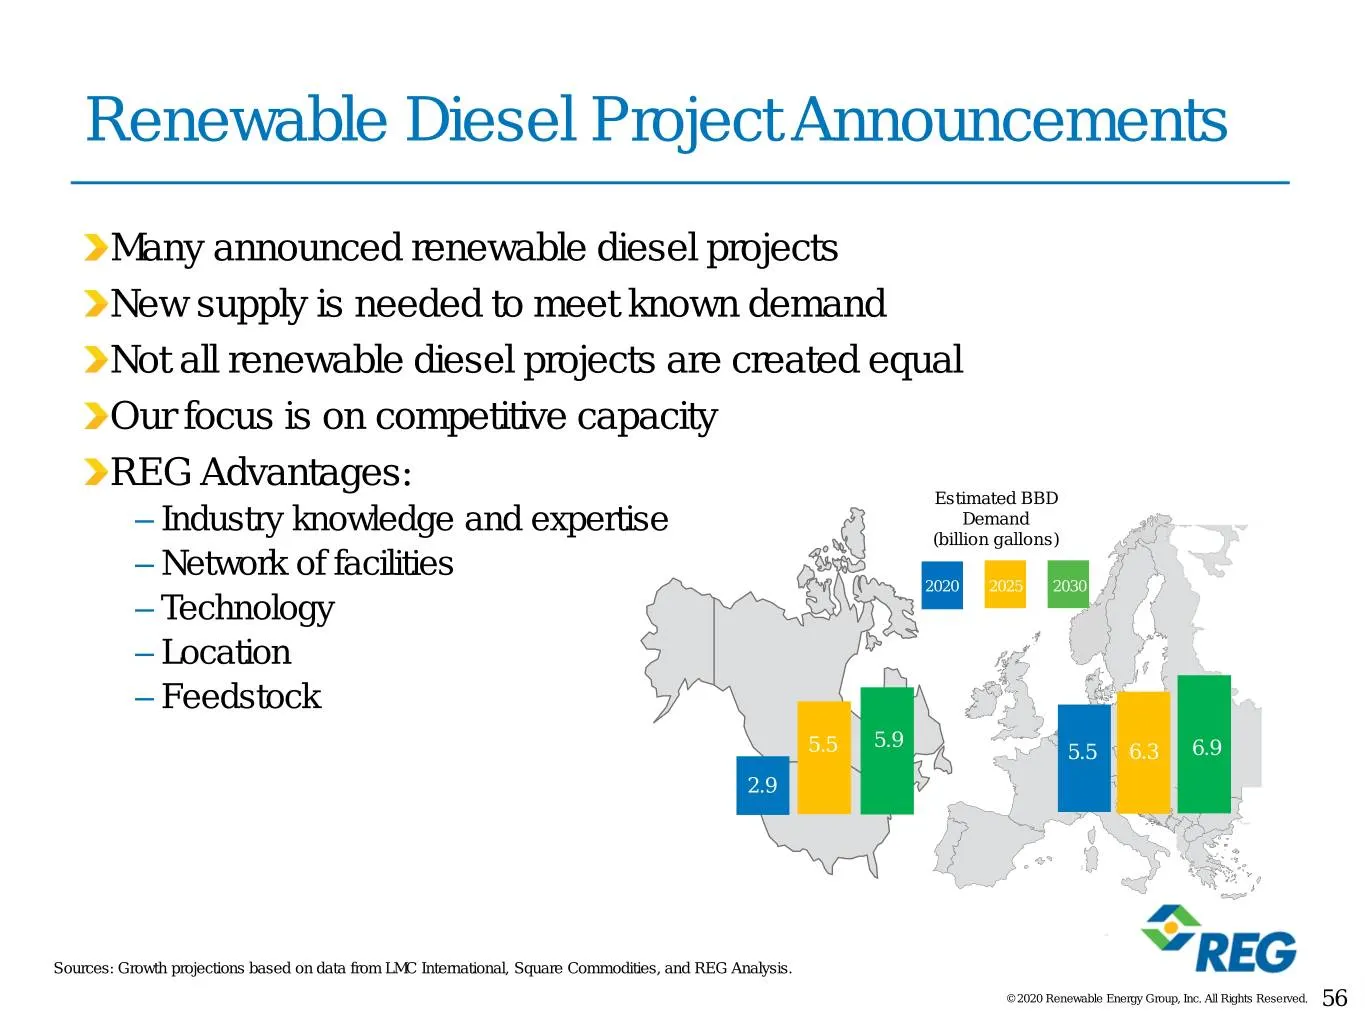
Renewable Diesel Project Announcements Many announced renewable diesel projects New supply is needed to meet known demand Not all renewable diesel projects are created equal Our focus is on competitive capacity REG Advantages: Estimated BBD – Industry knowledge and expertise Demand (billion gallons)
Slide 57: Margin Drivers
Margin Drivers © 2020 Renewable Energy Group, Inc. All Rights Reserved. 57
Slide 58: Biodiesel Margin Value Capture in Markets
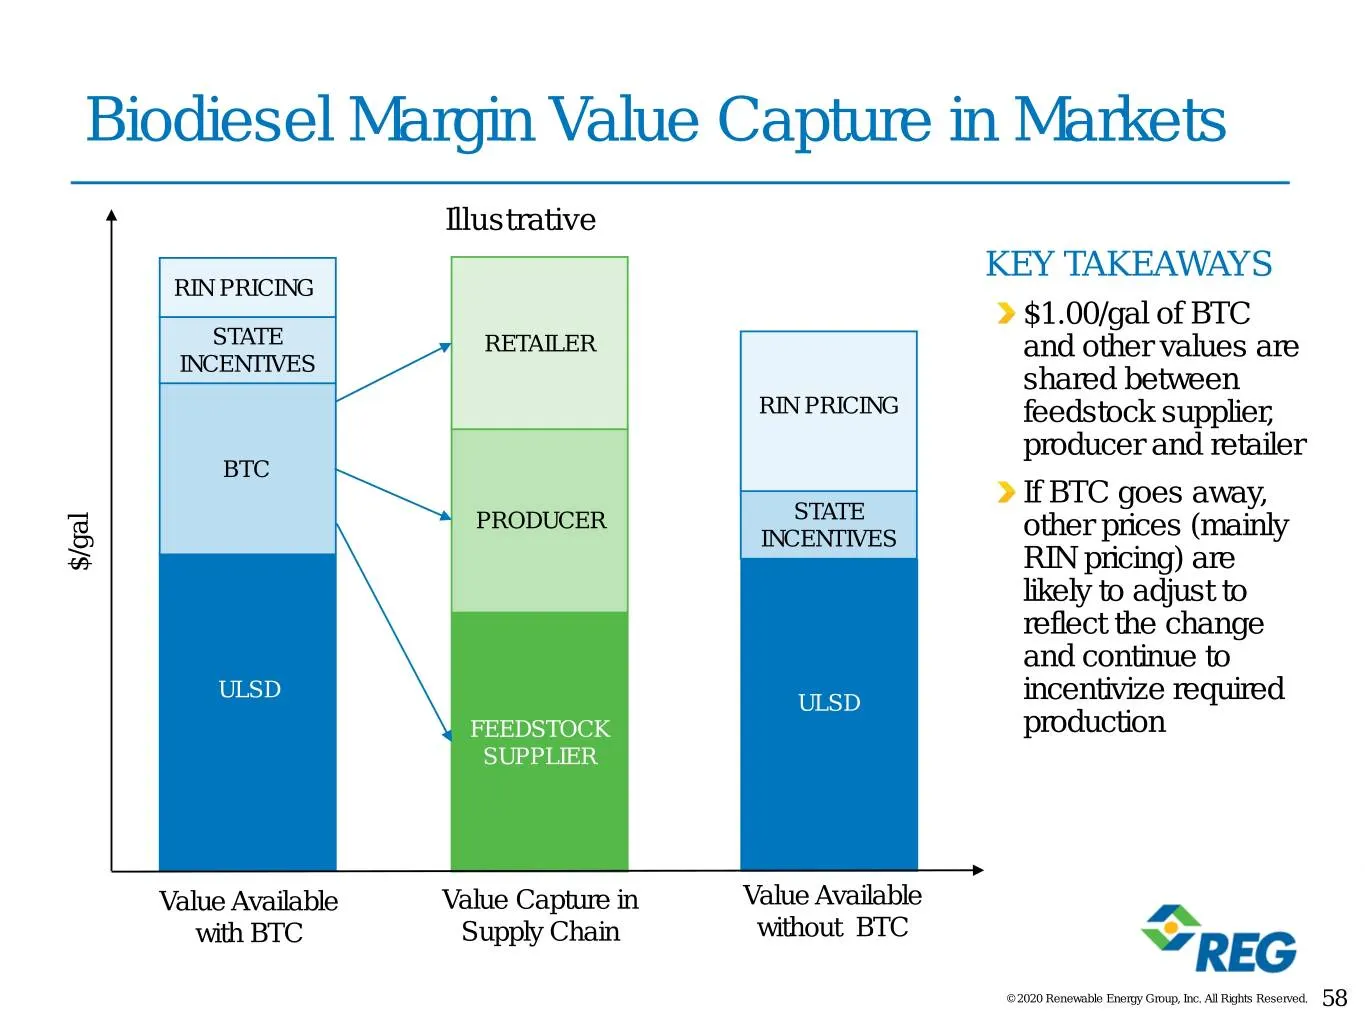
Biodiesel Margin Value Capture in Markets Illustrative KEY TAKEAWAYS RIN PRICING $1.00/gal of BTC STATE RETAILER and other values are INCENTIVES shared between RIN PRICING feedstock supplier, producer and retailer BTC If BTC goes away, PRODUCER STATE INCENTIVES other prices (mainly $/gal RIN pricing
Slide 59: Multiple Incentives and Value of Incentives
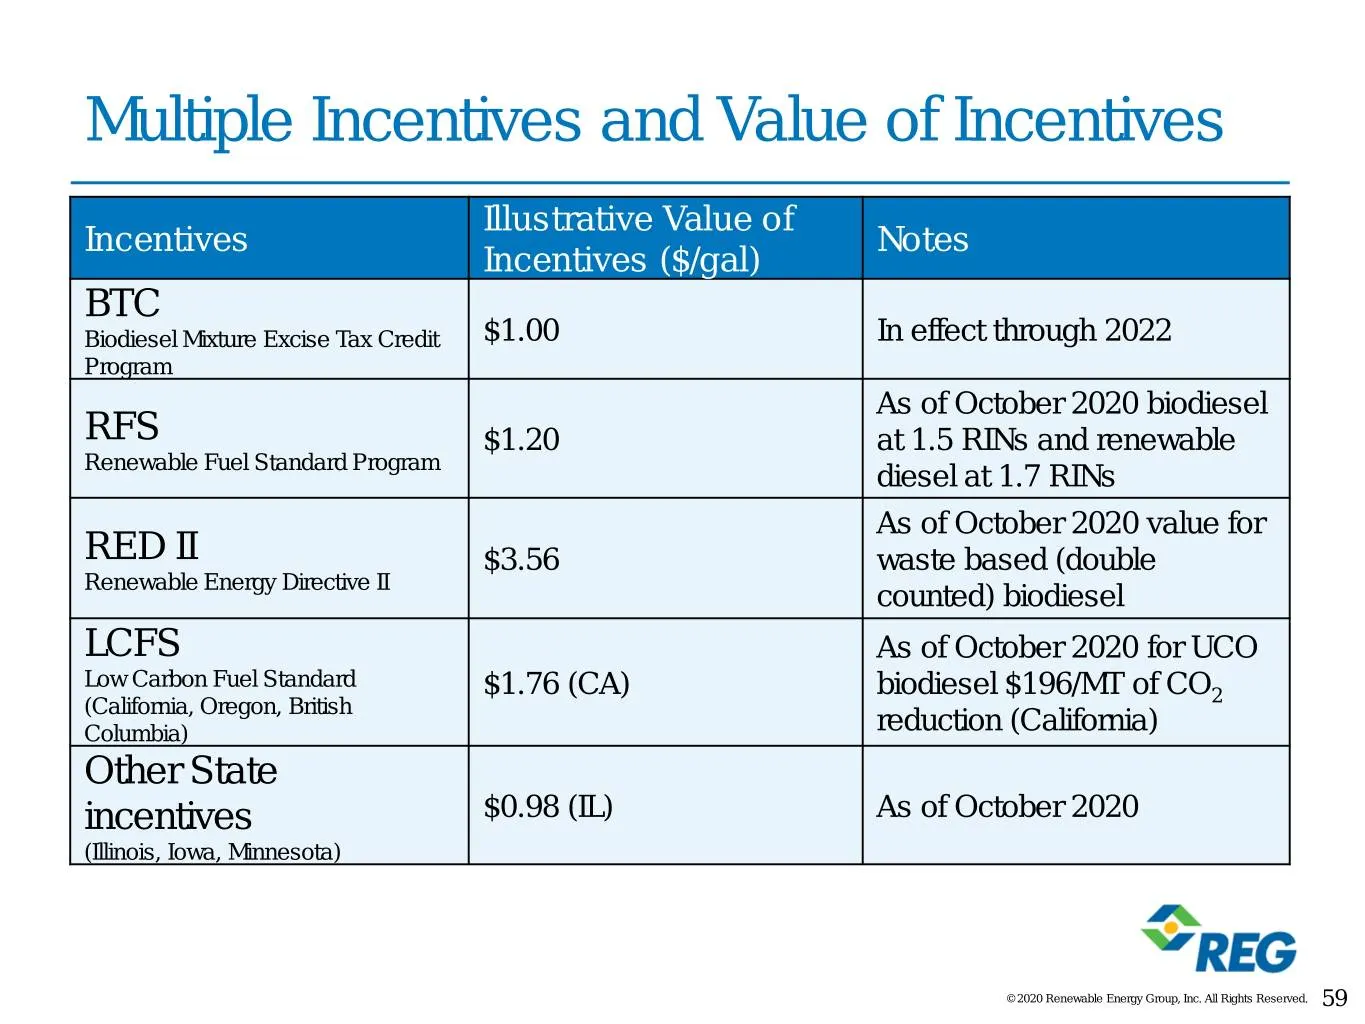
Multiple Incentives and Value of Incentives Illustrative Value of Incentives Notes Incentives ($/gal) BTC Biodiesel Mixture Excise Tax Credit $1.00 In effect through 2022 Program As of October 2020 biodiesel RFS $1.20 at 1.5 RINs and renewable Renewable Fuel Standard Program diesel at 1.7 RINs As of
Slide 60: Margin Drivers: HOBO & HOBO + 1.5*RINs Spread
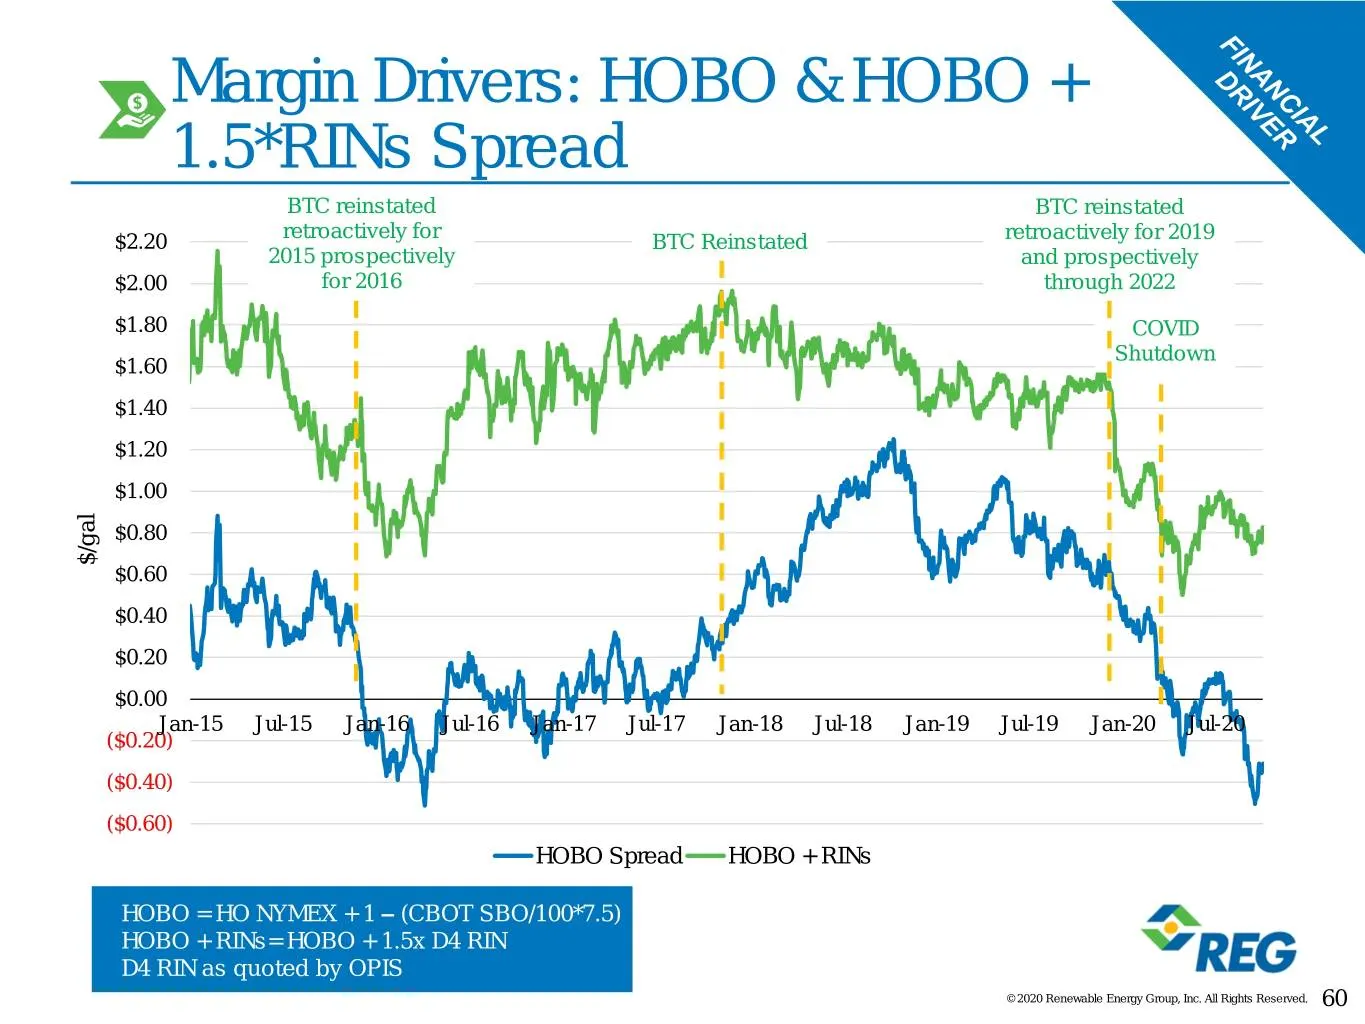
Margin Drivers: HOBO & HOBO + 1.5*RINs Spread BTC reinstated BTC reinstated retroactively for $2.20 BTC Reinstated retroactively for 2019 2015 prospectively and prospectively $2.00 for 2016 through 2022 $1.80 COVID Shutdown $1.60 $1.40 $1.20 $1.00 $0.80 $/gal $0.60 $0.40 $0.20 $0.00 Jan-15 Jul-15 Ja
Slide 61: Feedstock Procurement and Optimization
Feedstock Procurement and Optimization © 2020 Renewable Energy Group, Inc. All Rights Reserved. 61
Slide 62: BBD Feedstock Development – Early Days
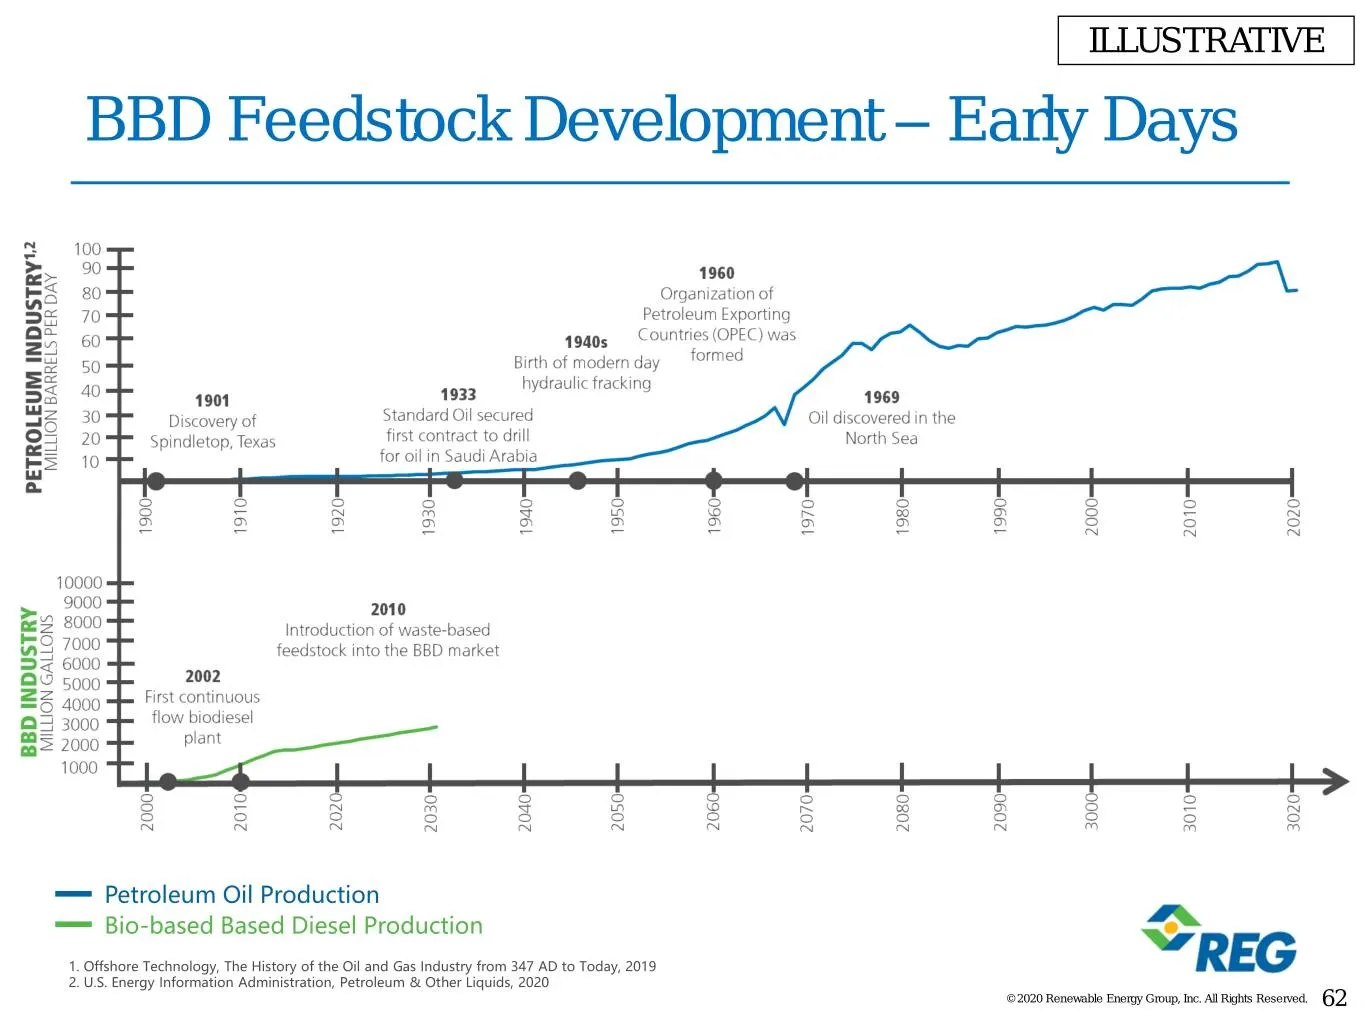
ILLUSTRATIVE BBD Feedstock Development – Early Days Petroleum Oil Production Bio-based Based Diesel Production 1. Offshore Technology, The History of the Oil and Gas Industry from 347 AD to Today, 2019 2. U.S. Energy Information Administration, Petroleum & Other Liquids, 2020 © 2020 Renewable Energy
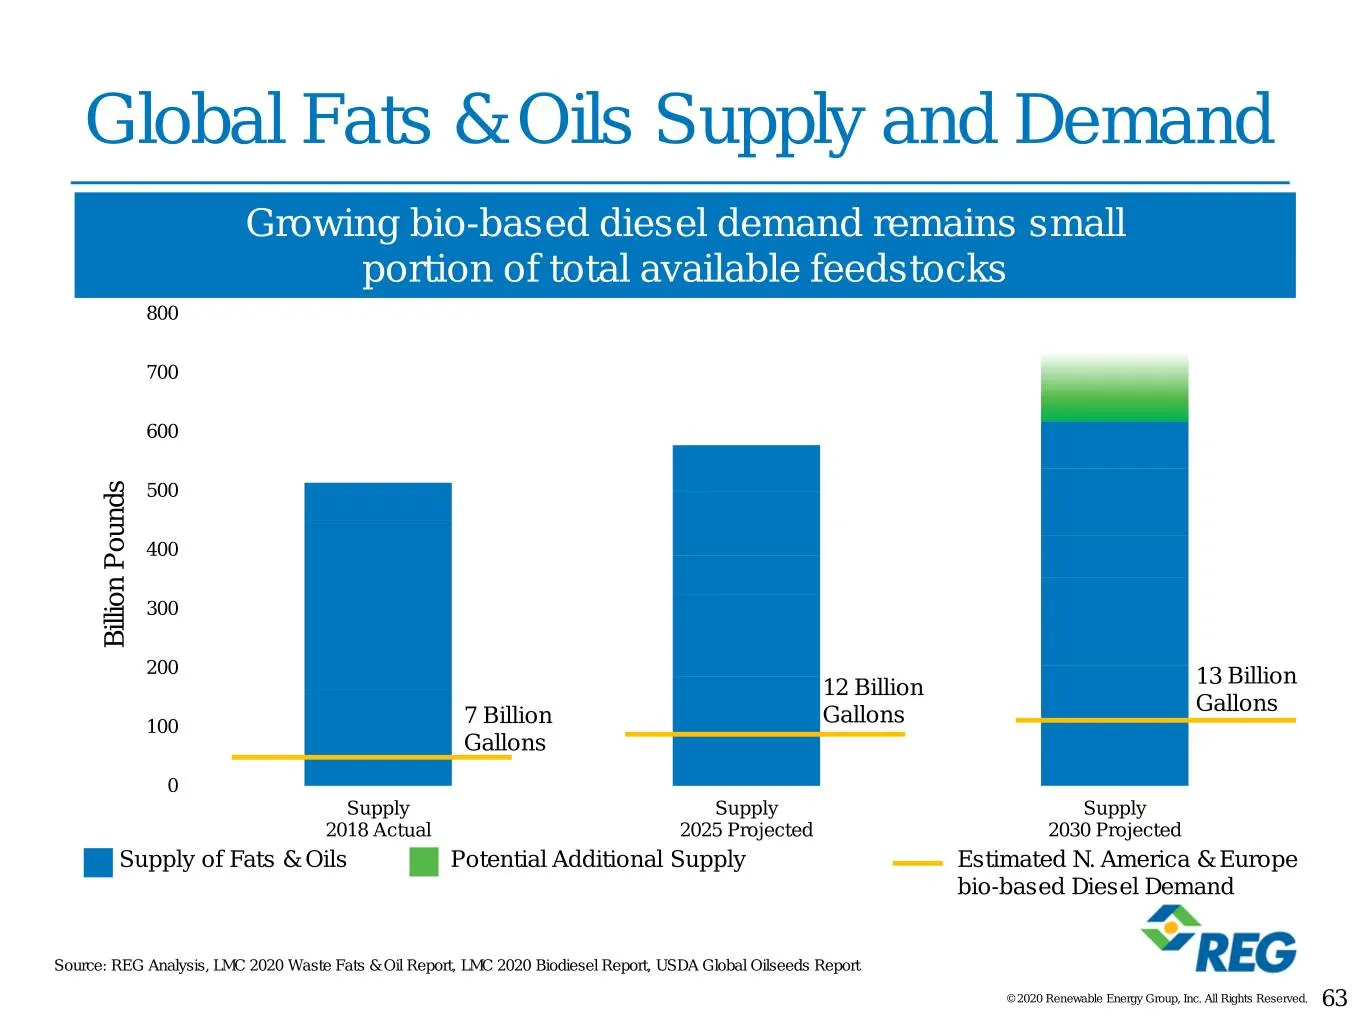
Slide 63: Global Fats & Oils Supply and Demand
Global Fats & Oils Supply and Demand Growing bio-based diesel demand remains small portion of total available feedstocks 800 700 600 500 400 300 Billion Pounds Billion 200 13 Billion 12 Billion Gallons Gallons 100 7 Billion Gallons 0 Supply Supply Supply 2018 Actual 2025 Projected 2030 Projected Sup
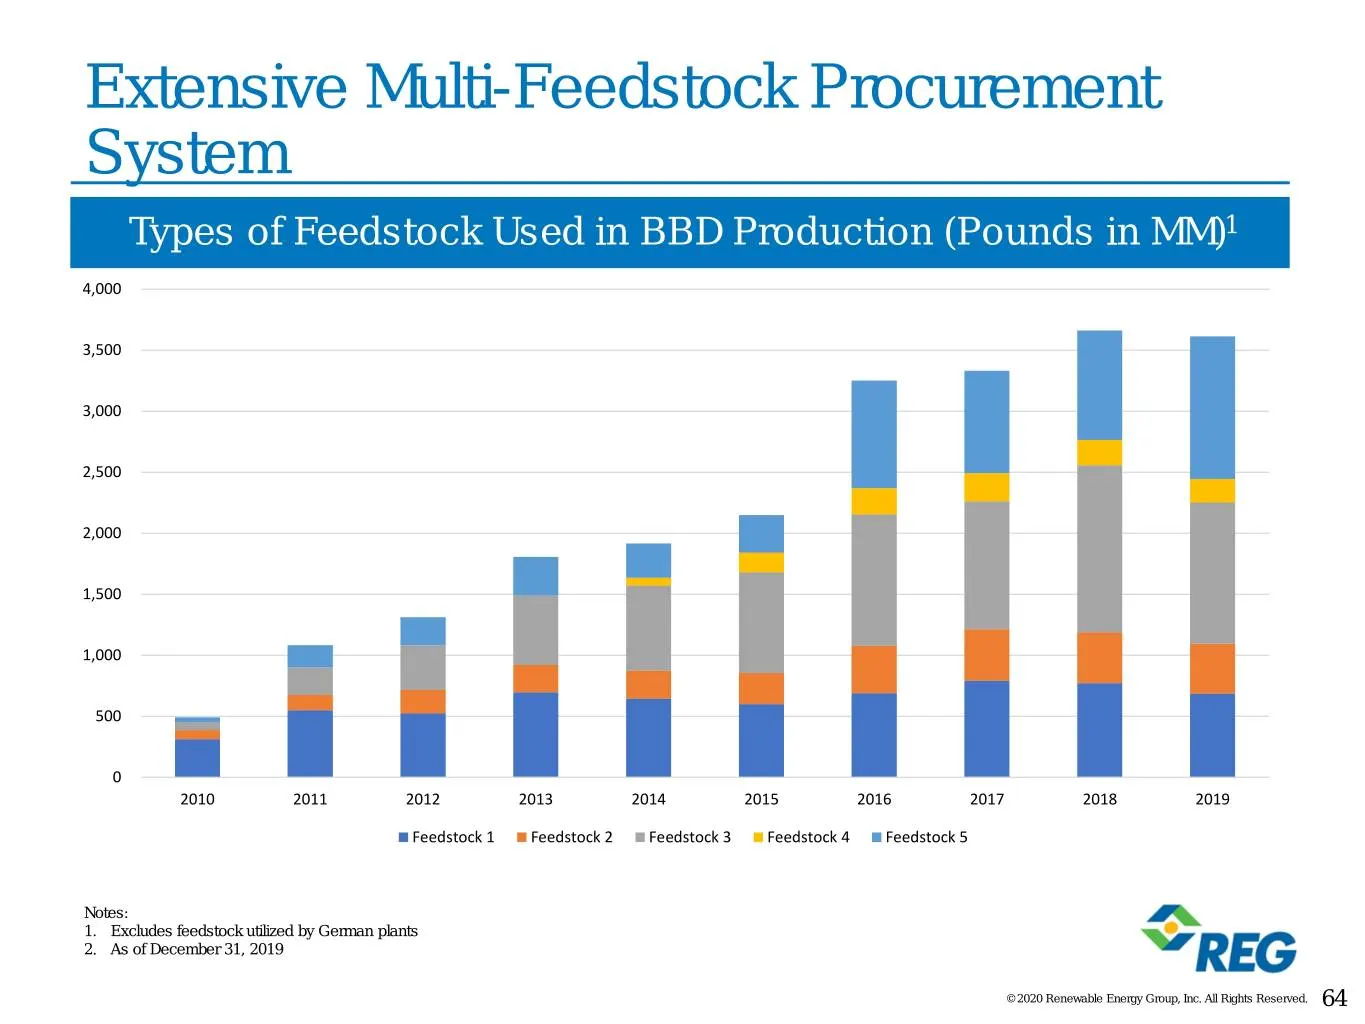
Slide 64: Extensive Multi-Feedstock Procurement System
Extensive Multi-Feedstock Procurement System Types of Feedstock Used in BBD Production (Pounds in MM)1 4,000 3,500 3,000 2,500 2,000 1,500 1,000 500 0 2010 2011 2012 2013 2014 2015 2016 2017 2018 2019 Feedstock 1 Feedstock 2 Feedstock 3 Feedstock 4 Feedstock 5 Notes: 1. Excludes feedstock utilized b
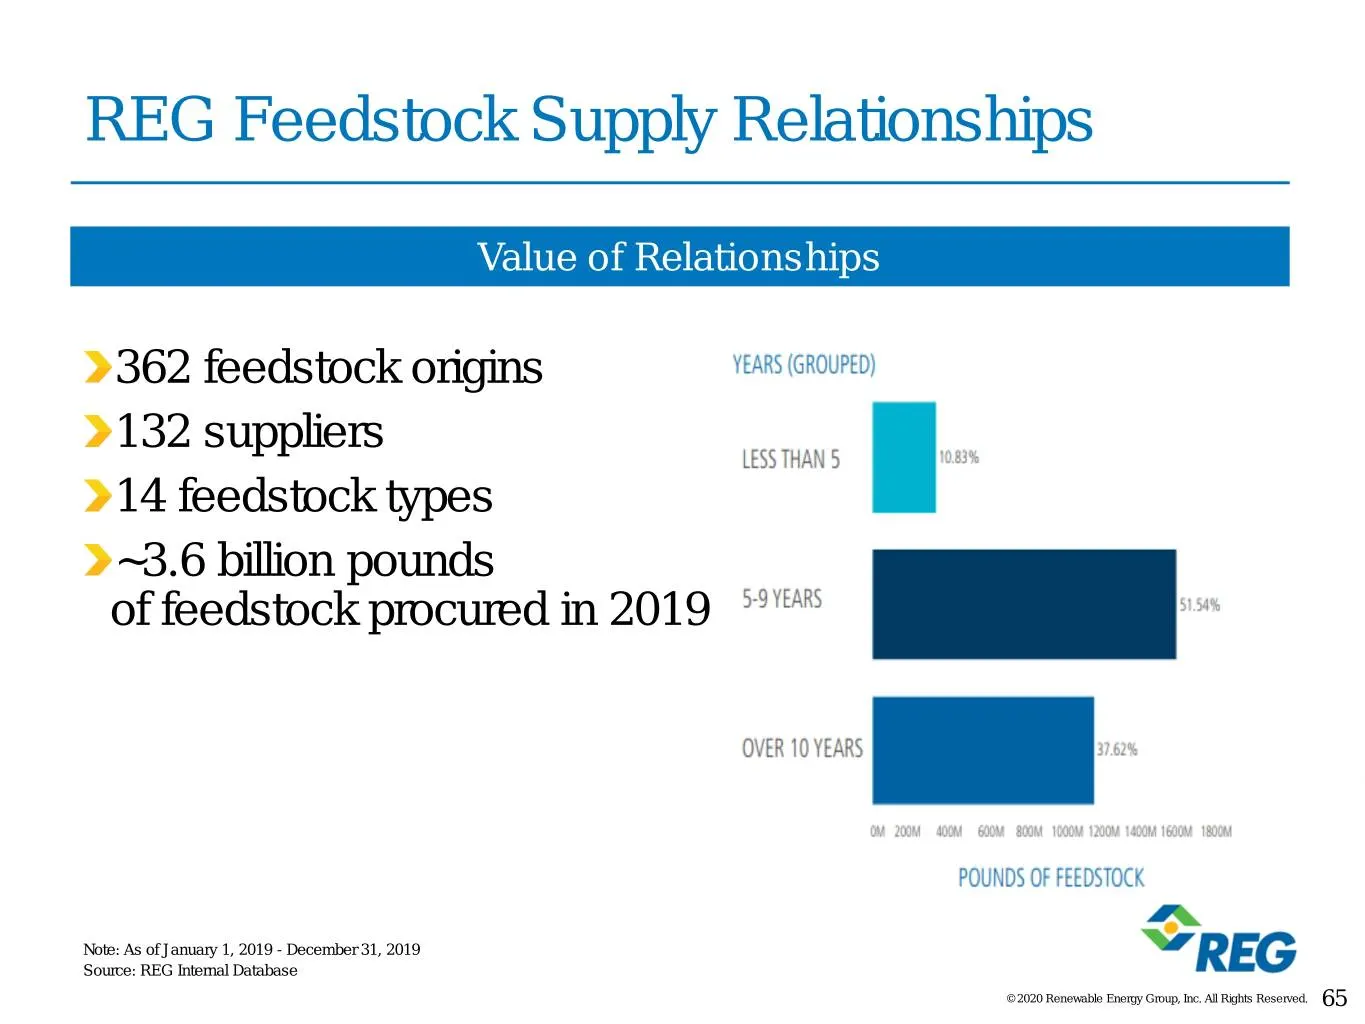
Slide 65: REG Feedstock Supply Relationships
REG Feedstock Supply Relationships Value of Relationships 362 feedstock origins 132 suppliers 14 feedstock types ~3.6 billion pounds of feedstock procured in 2019 Note: As of January 1, 2019 - December 31, 2019 Source: REG Internal Database © 2020 Renewable Energy Group, Inc. All Rights Reserved. 65
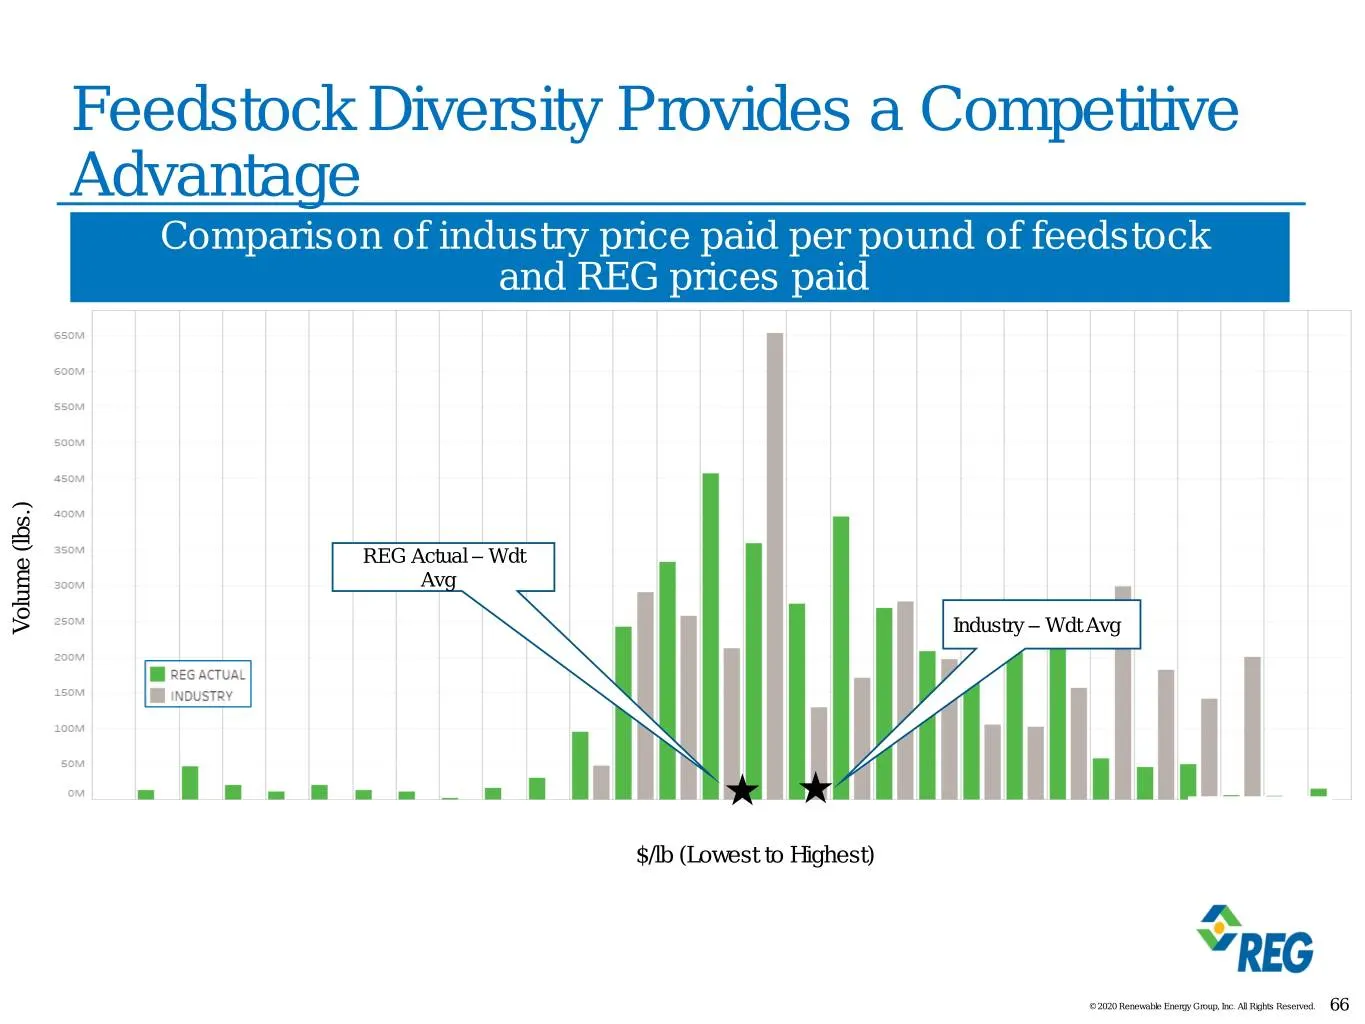
Slide 66: Feedstock Diversity Provides a Competitive Advantage
Feedstock Diversity Provides a Competitive Advantage Comparison of industry price paid per pound of feedstock and REG prices paid REG Actual – Wdt Avgd Volume (lbs.) Volume Industry – Wdt Avgd $/lb (Lowest to Highest) © 2020 Renewable Energy Group, Inc. All Rights Reserved. 66
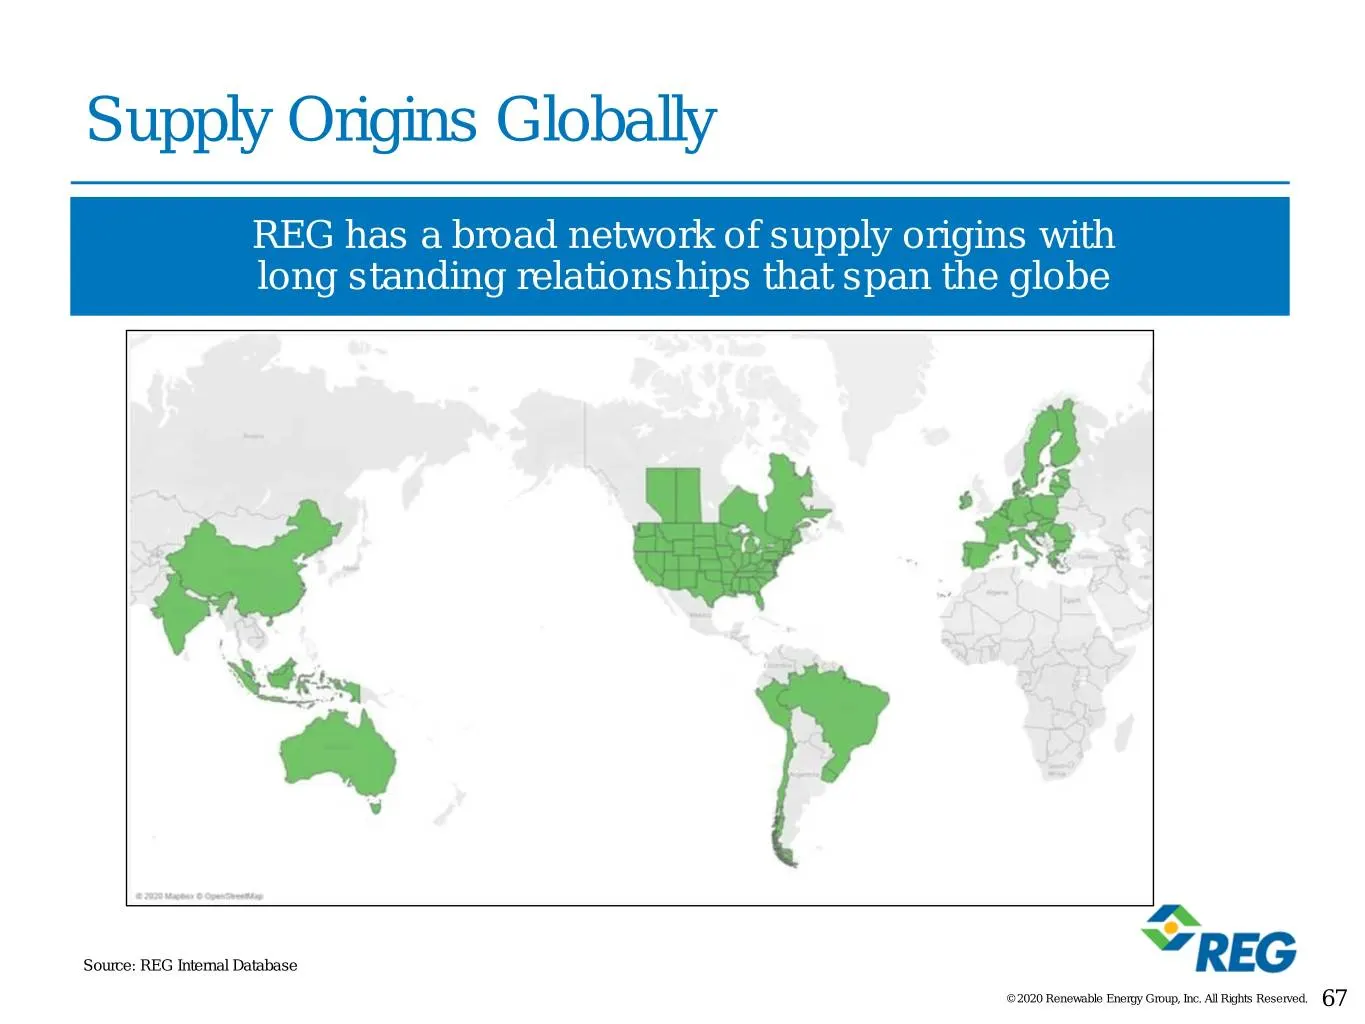
Slide 67: Supply Origins Globally
Supply Origins Globally REG has a broad network of supply origins with long standing relationships that span the globe Source: REG Internal Database © 2020 Renewable Energy Group, Inc. All Rights Reserved. 67
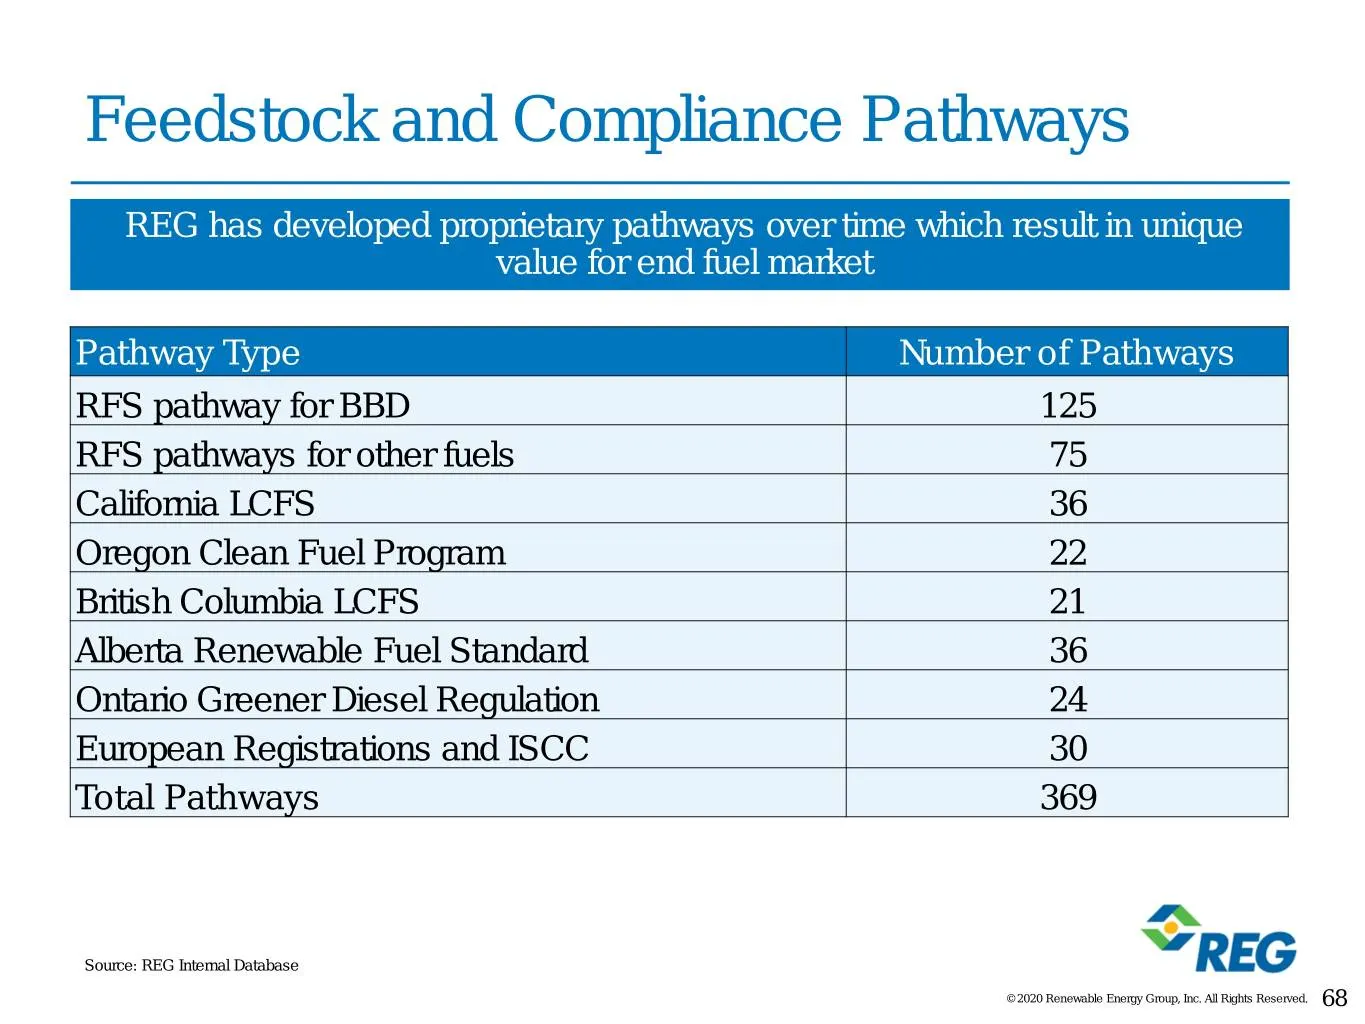
Slide 68: Feedstock and Compliance Pathways
Feedstock and Compliance Pathways REG has developed proprietary pathways over time which result in unique value for end fuel market Pathway Type Number of Pathways RFS pathway for BBD 125 RFS pathways for other fuels 75 California LCFS 36 Oregon Clean Fuel Program 22 British Columbia LCFS 21 Alberta
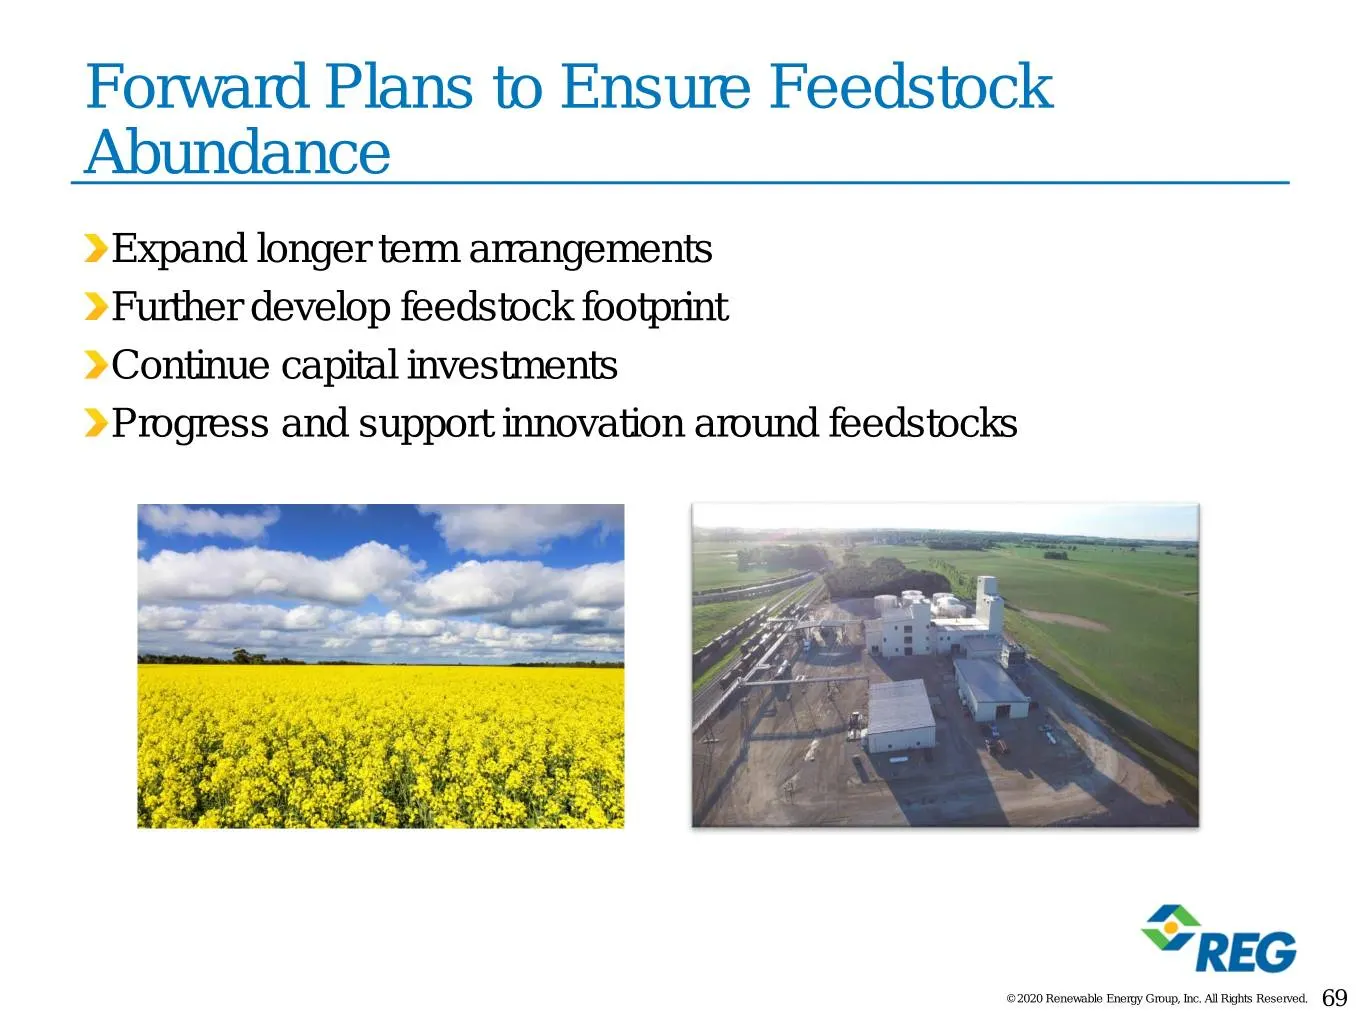
Slide 69: Forward Plans to Ensure Feedstock Abundance
Forward Plans to Ensure Feedstock Abundance Expand longer term arrangements Further develop feedstock footprint Continue capital investments Progress and support innovation around feedstocks © 2020 Renewable Energy Group, Inc. All Rights Reserved. 69
Slide 70: REG Downstream: Driving Sustainable Demand and Margin Expansion
REG Downstream: Driving Sustainable Demand and Margin Expansion Gary Haer Vice President, Special Projects © 2020 Renewable Energy Group, Inc. All Rights Reserved. 70
Slide 71: Sales of Self-Produced Gallons
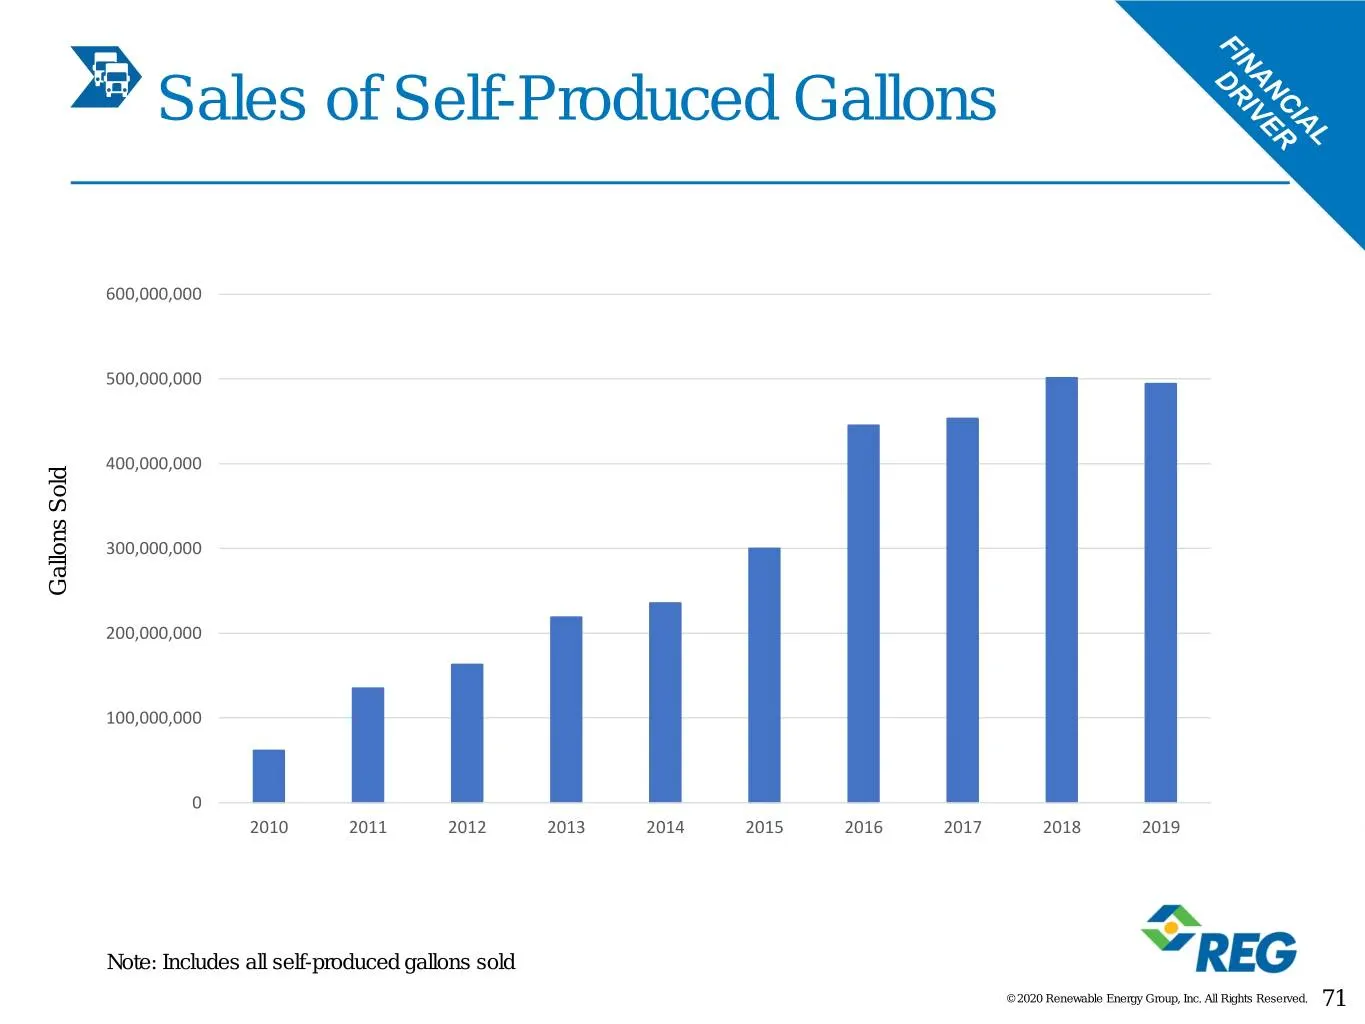
Sales of Self-Produced Gallons 600,000,000 500,000,000 400,000,000 300,000,000 Gallons Sold Gallons 200,000,000 100,000,000 0 2010 2011 2012 2013 2014 2015 2016 2017 2018 2019 Note: Includes all self-produced gallons sold © 2020 Renewable Energy Group, Inc. All Rights Reserved. 71
Slide 72: Serving a Diverse and Global Customer Base
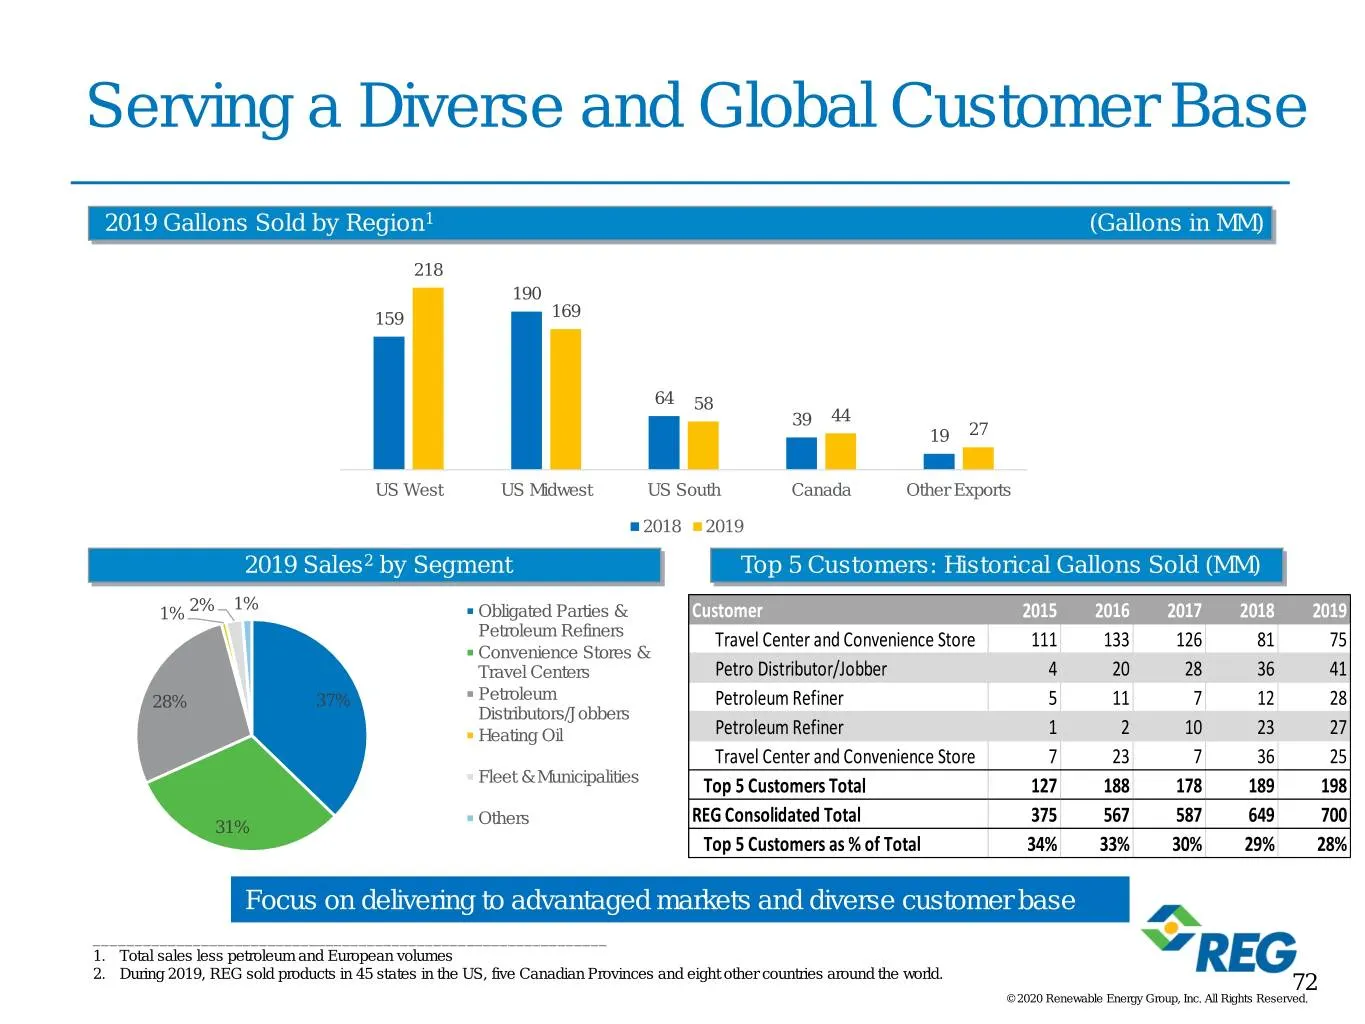
Serving a Diverse and Global Customer Base 2019 Gallons Sold by Region1 (Gallons in MM) 218 190 159 169 64 58 39 44 19 27 US West US Midwest US South Canada Other Exports 2018 2019 2019 Sales2 by Segment Top 5 Customers: Historical Gallons Sold (MM) 1% 1% 2% Obligated Parties & Customer 2015 2016 20
Slide 73: Pursuit Of Downstream Margin Capture
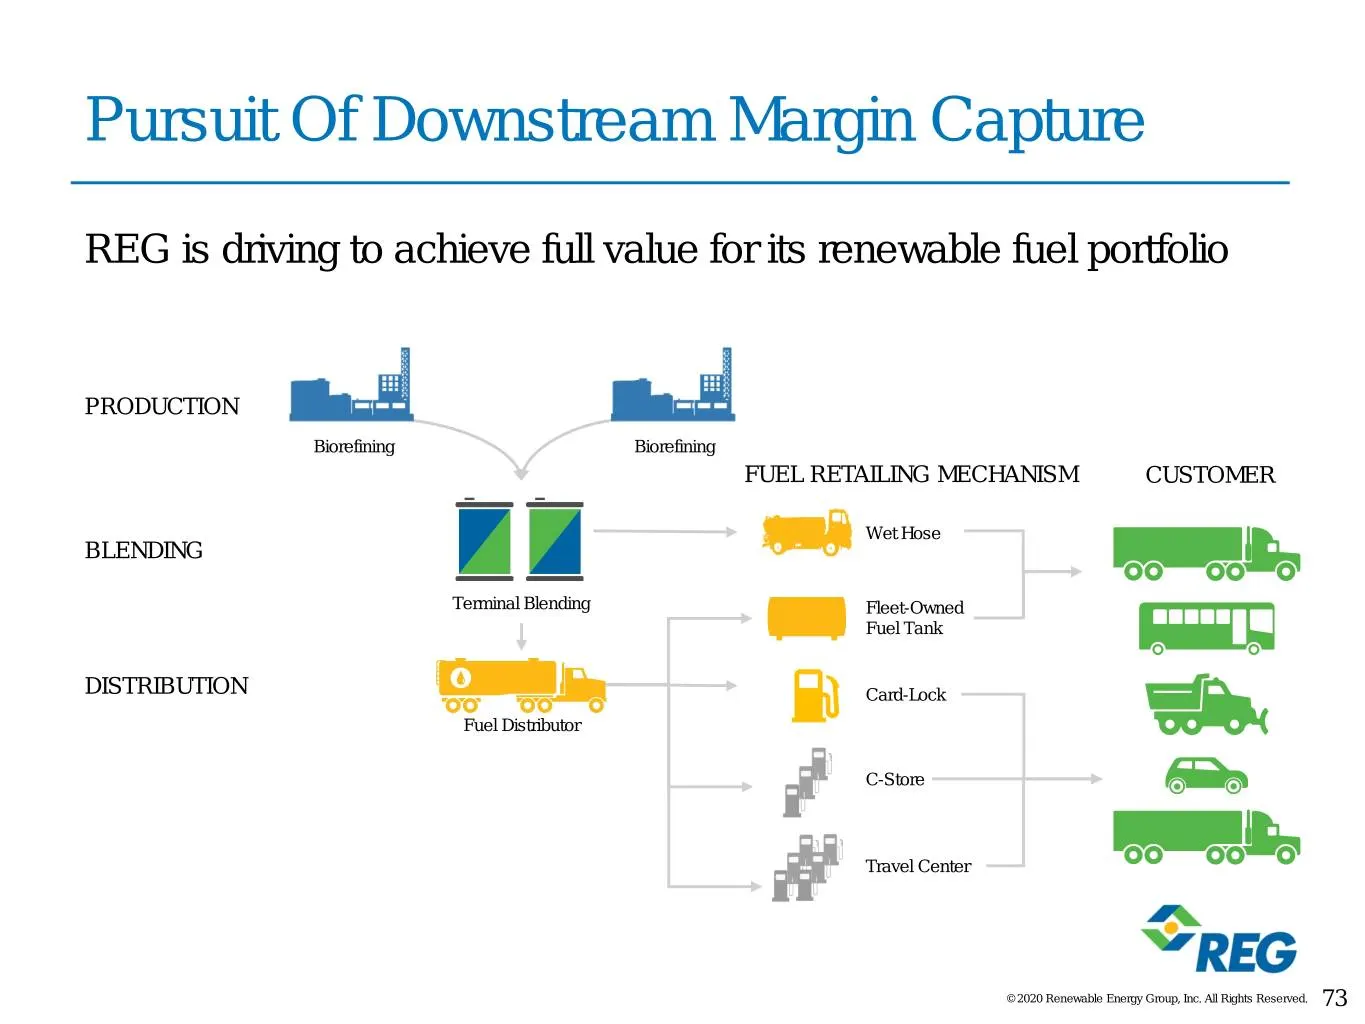
Pursuit Of Downstream Margin Capture REG is driving to achieve full value for its renewable fuel portfolio PRODUCTION Biorefining Biorefining FUEL RETAILING MECHANISM CUSTOMER Wet Hose BLENDING Terminal Blending Fleet-Owned Fuel Tank DISTRIBUTION Card-Lock Fuel Distributor C-Store Travel Center © 20
Slide 74: Pursuit Of Downstream Margin Capture
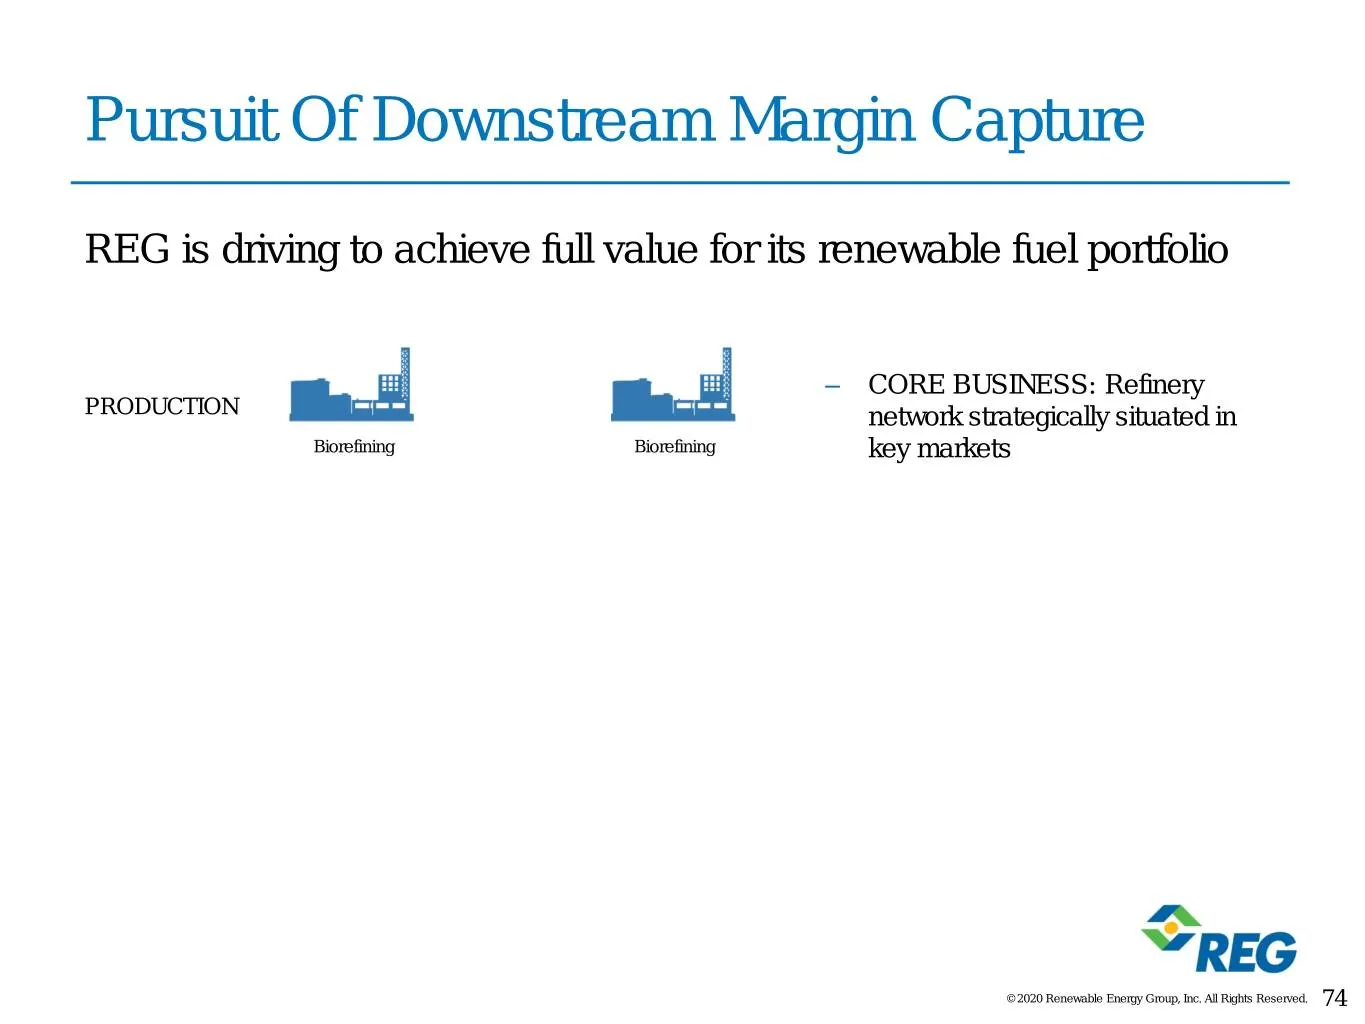
Pursuit Of Downstream Margin Capture REG is driving to achieve full value for its renewable fuel portfolio – CORE BUSINESS: Refinery PRODUCTION network strategically situated in Biorefining Biorefining key markets © 2020 Renewable Energy Group, Inc. All Rights Reserved. 74
Slide 75: Pursuit Of Downstream Margin Capture
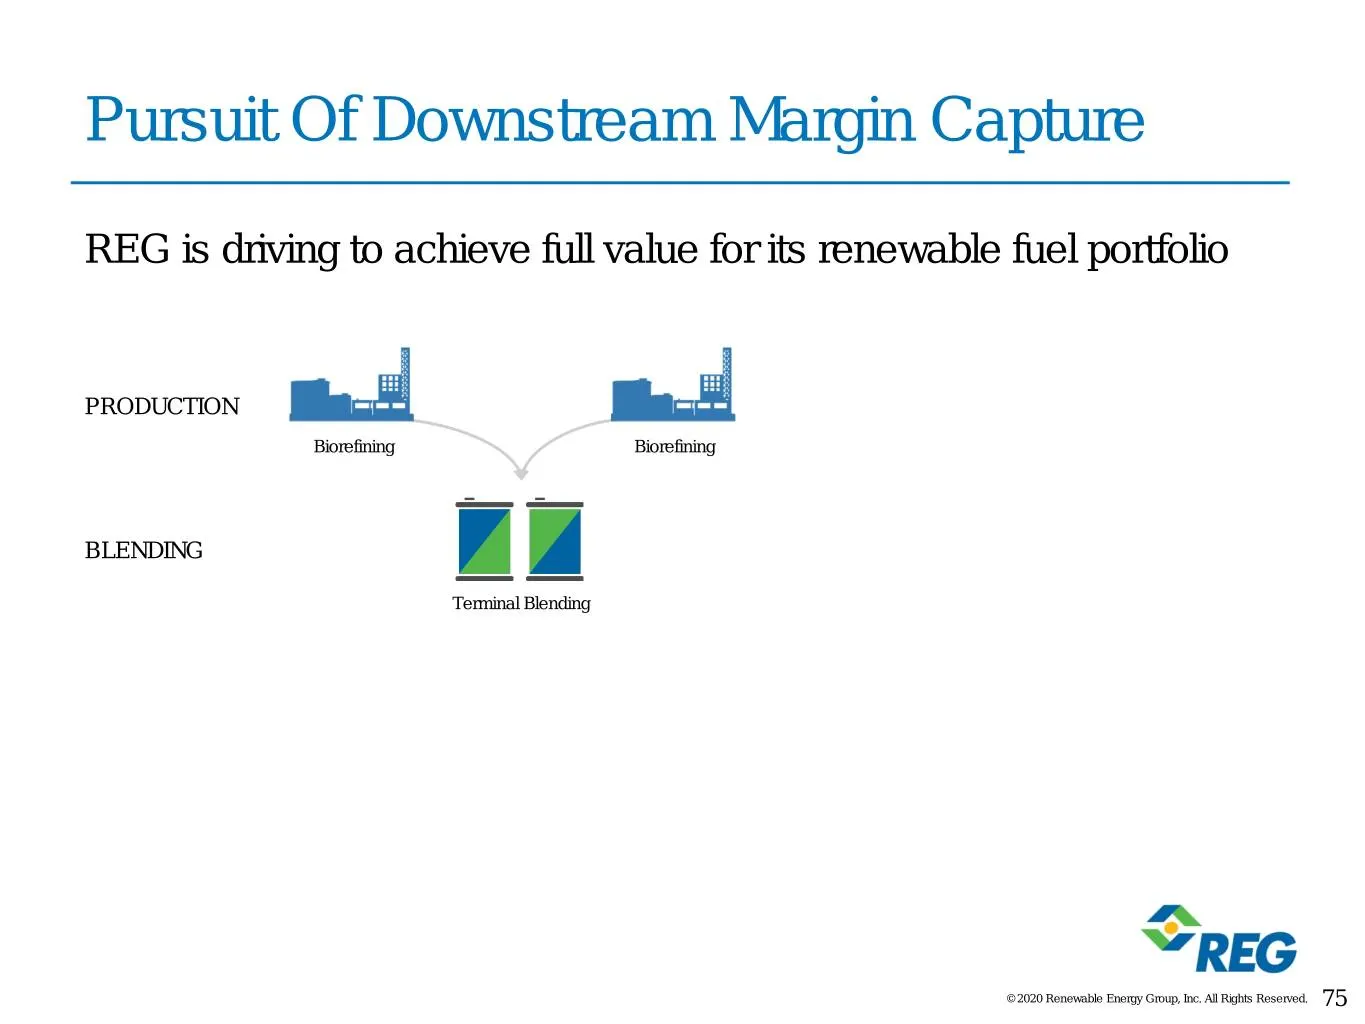
Pursuit Of Downstream Margin Capture REG is driving to achieve full value for its renewable fuel portfolio PRODUCTION Biorefining Biorefining BLENDING Terminal Blending © 2020 Renewable Energy Group, Inc. All Rights Reserved. 75
Slide 76: Pursuit Of Downstream Margin Capture
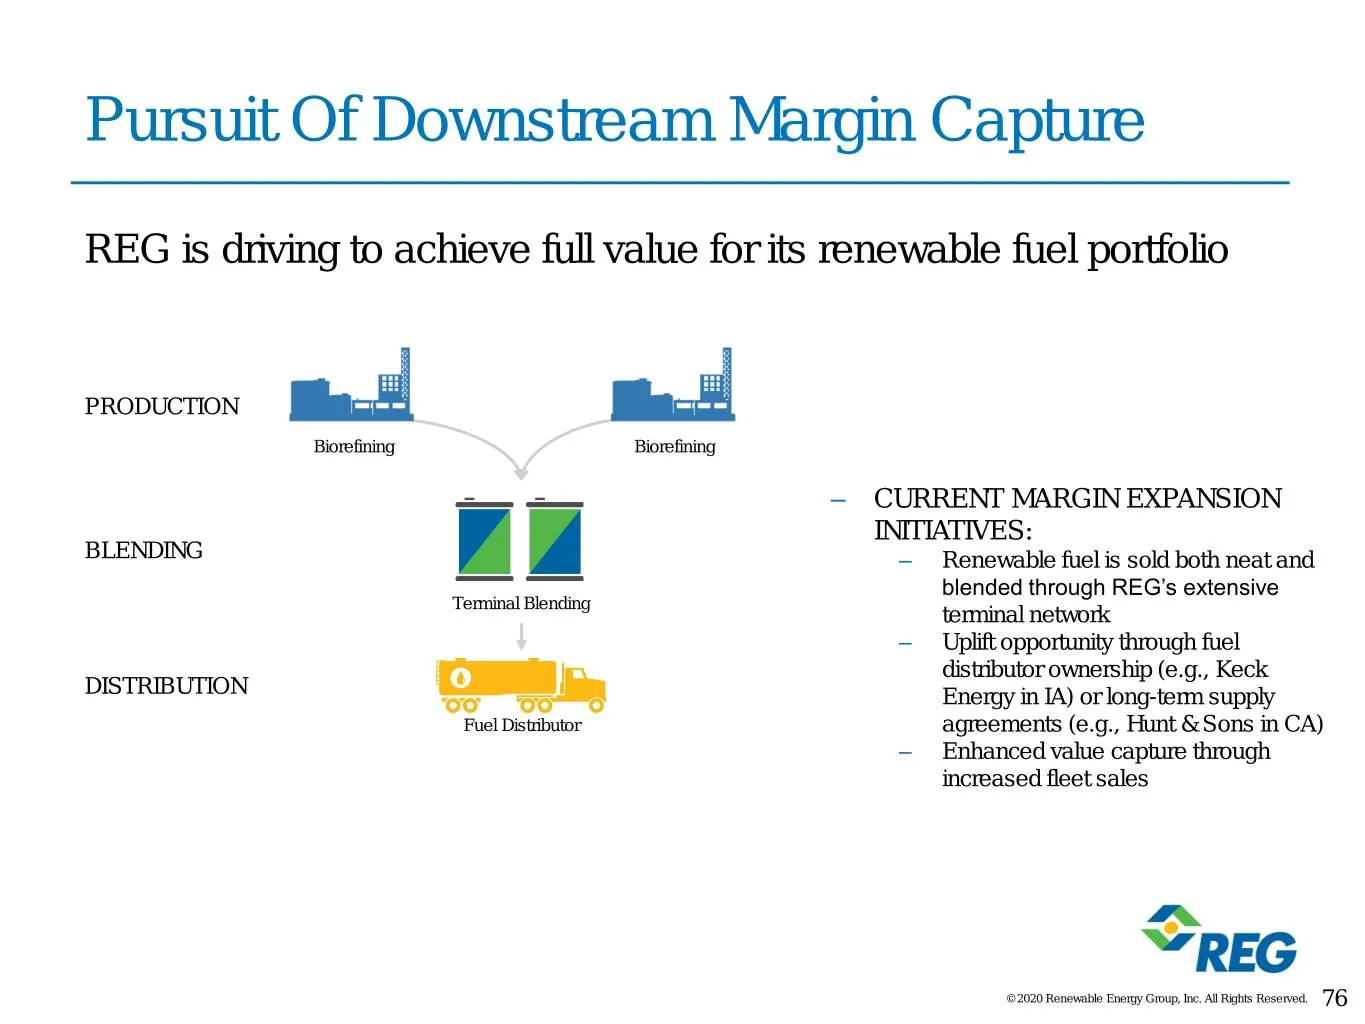
Pursuit Of Downstream Margin Capture REG is driving to achieve full value for its renewable fuel portfolio PRODUCTION Biorefining Biorefining – CURRENT MARGIN EXPANSION INITIATIVES: BLENDING – Renewable fuel is sold both neat and blended through REG’s extensive Terminal Blending terminal network – U
Slide 77: Pursuit Of Downstream Margin Capture
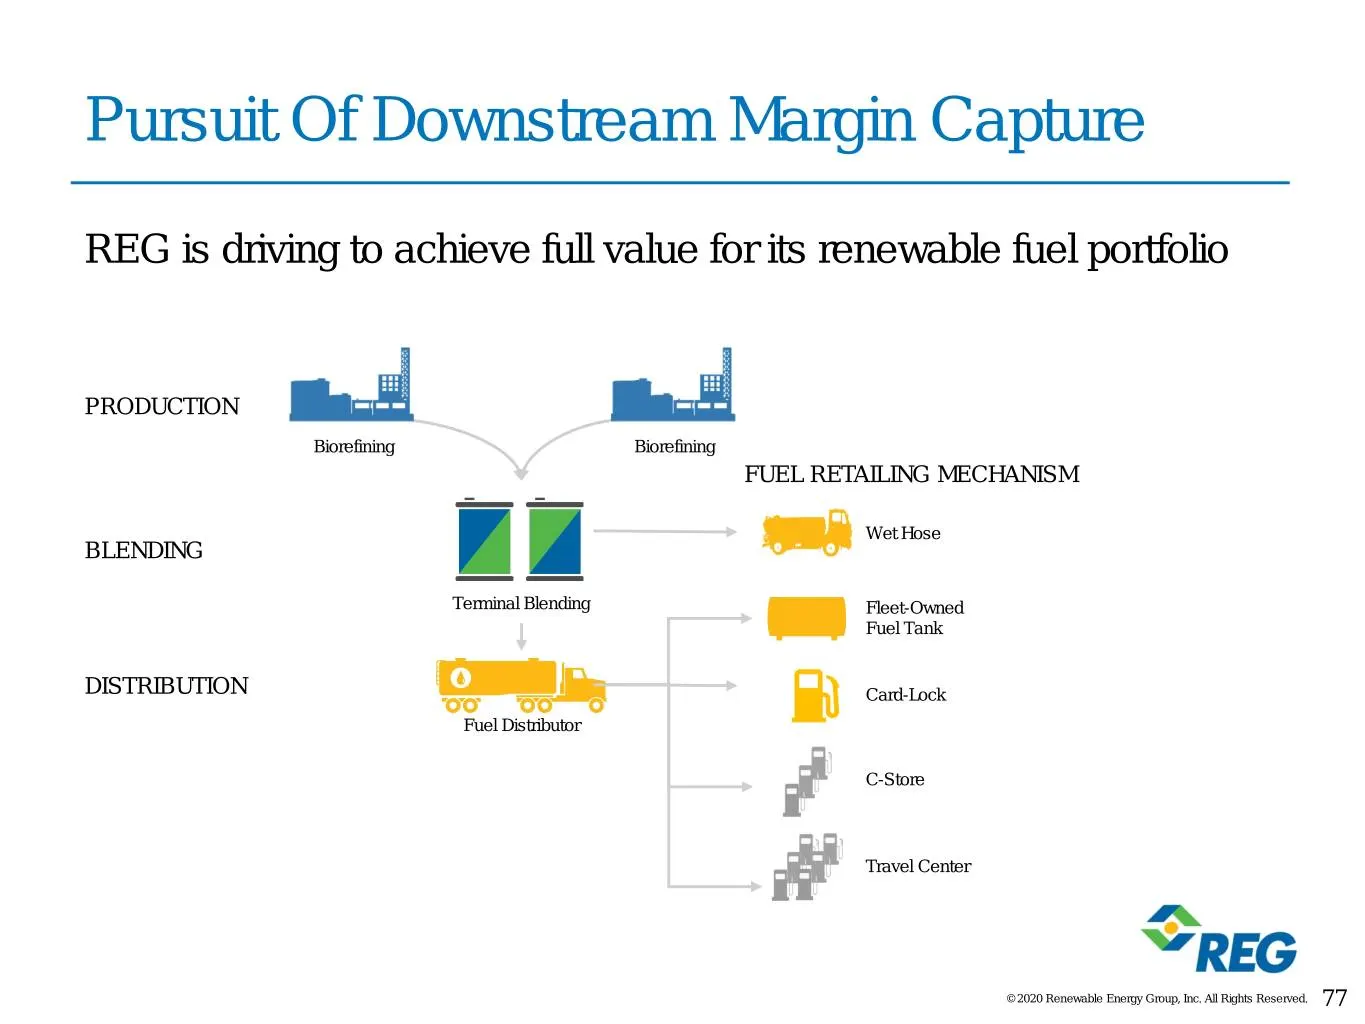
Pursuit Of Downstream Margin Capture REG is driving to achieve full value for its renewable fuel portfolio PRODUCTION Biorefining Biorefining FUEL RETAILING MECHANISM Wet Hose BLENDING Terminal Blending Fleet-Owned Fuel Tank DISTRIBUTION Card-Lock Fuel Distributor C-Store Travel Center © 2020 Renewa
Slide 78: Pursuit Of Downstream Margin Capture
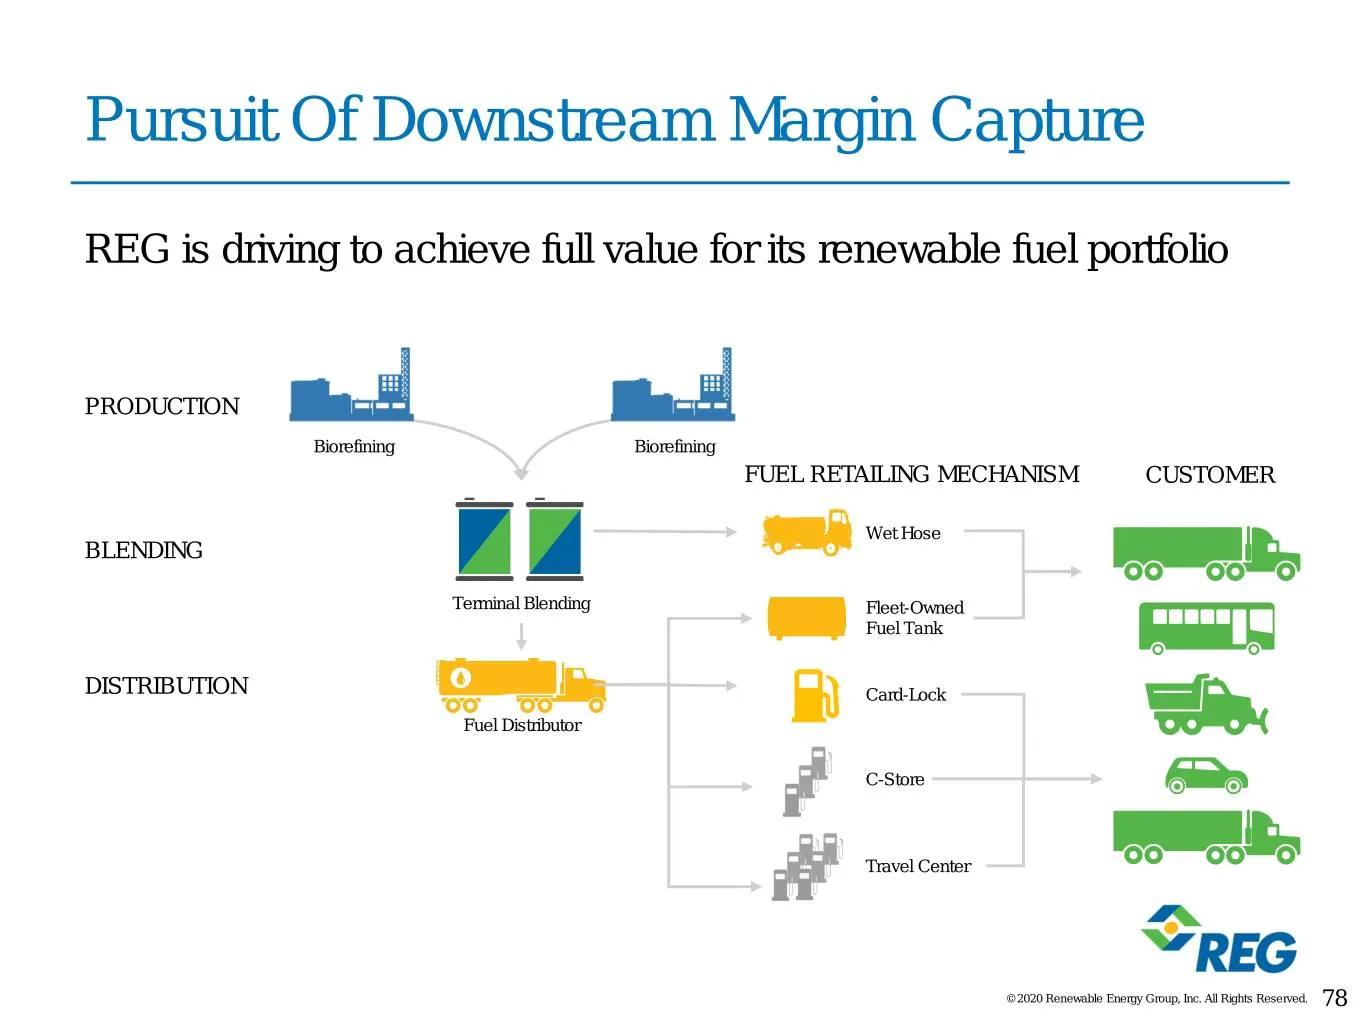
Pursuit Of Downstream Margin Capture REG is driving to achieve full value for its renewable fuel portfolio PRODUCTION Biorefining Biorefining FUEL RETAILING MECHANISM CUSTOMER Wet Hose BLENDING Terminal Blending Fleet-Owned Fuel Tank DISTRIBUTION Card-Lock Fuel Distributor C-Store Travel Center © 20
Slide 79: Maximizing Downstream Margin Capture
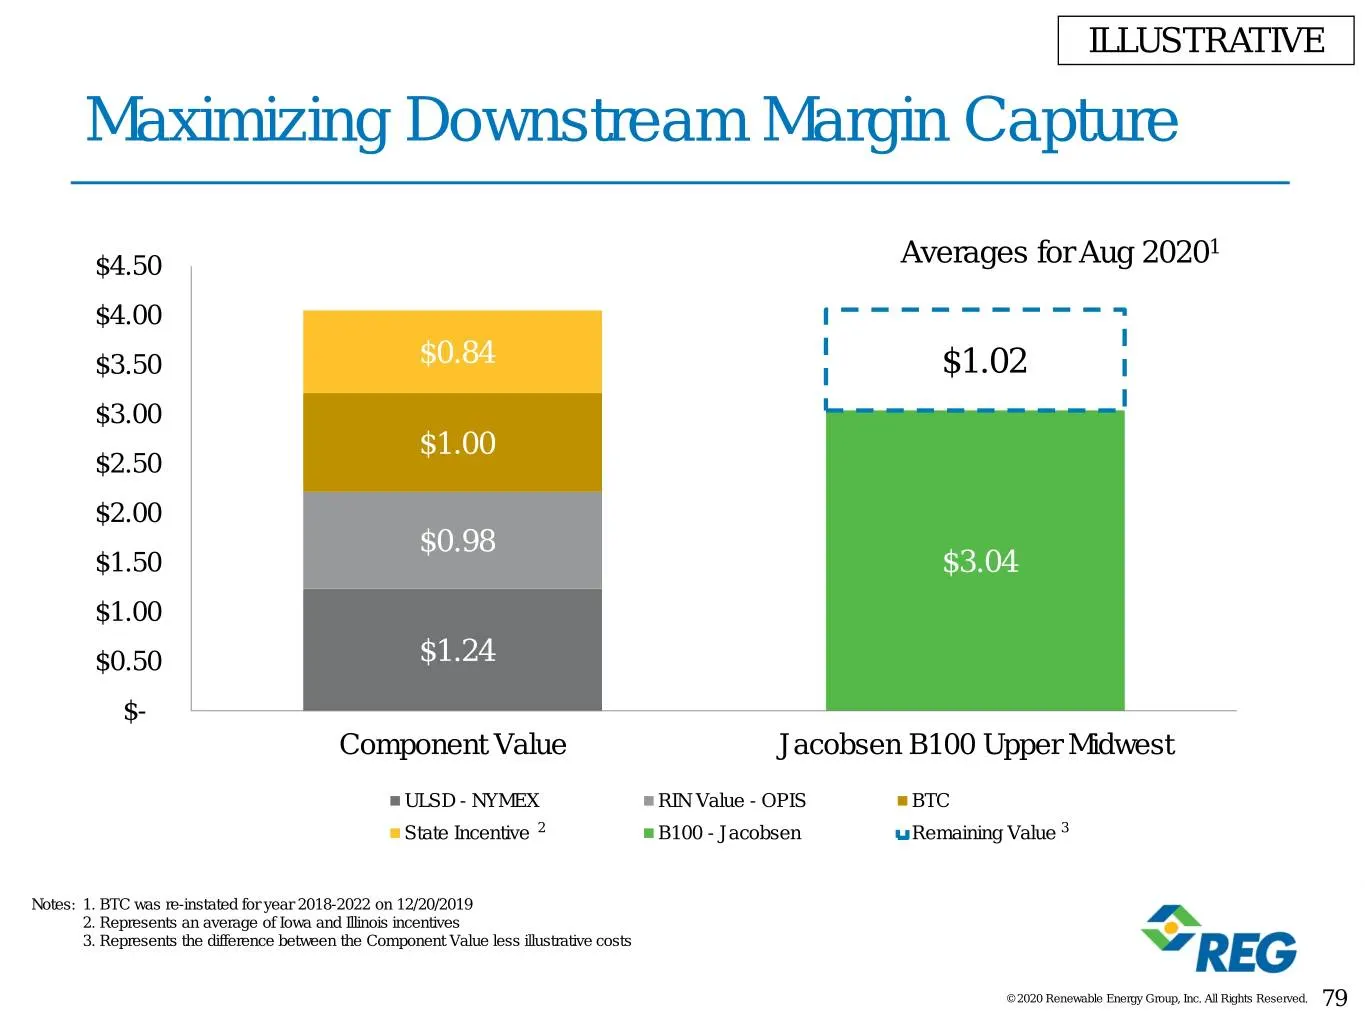
ILLUSTRATIVE Maximizing Downstream Margin Capture 1 $4.50 Averages for Aug 2020 $4.00 $3.50 $0.84 $1.02 $3.00 $1.00 $2.50 $2.00 $0.98 $1.50 $3.04 $1.00 $0.50 $1.24 $- Component Value Jacobsen B100 Upper Midwest ULSD - NYMEX RIN Value - OPIS BTC State Incentive 2 B100 - Jacobsen Remaining Value 3 Not
Slide 80: REG Distribution Business
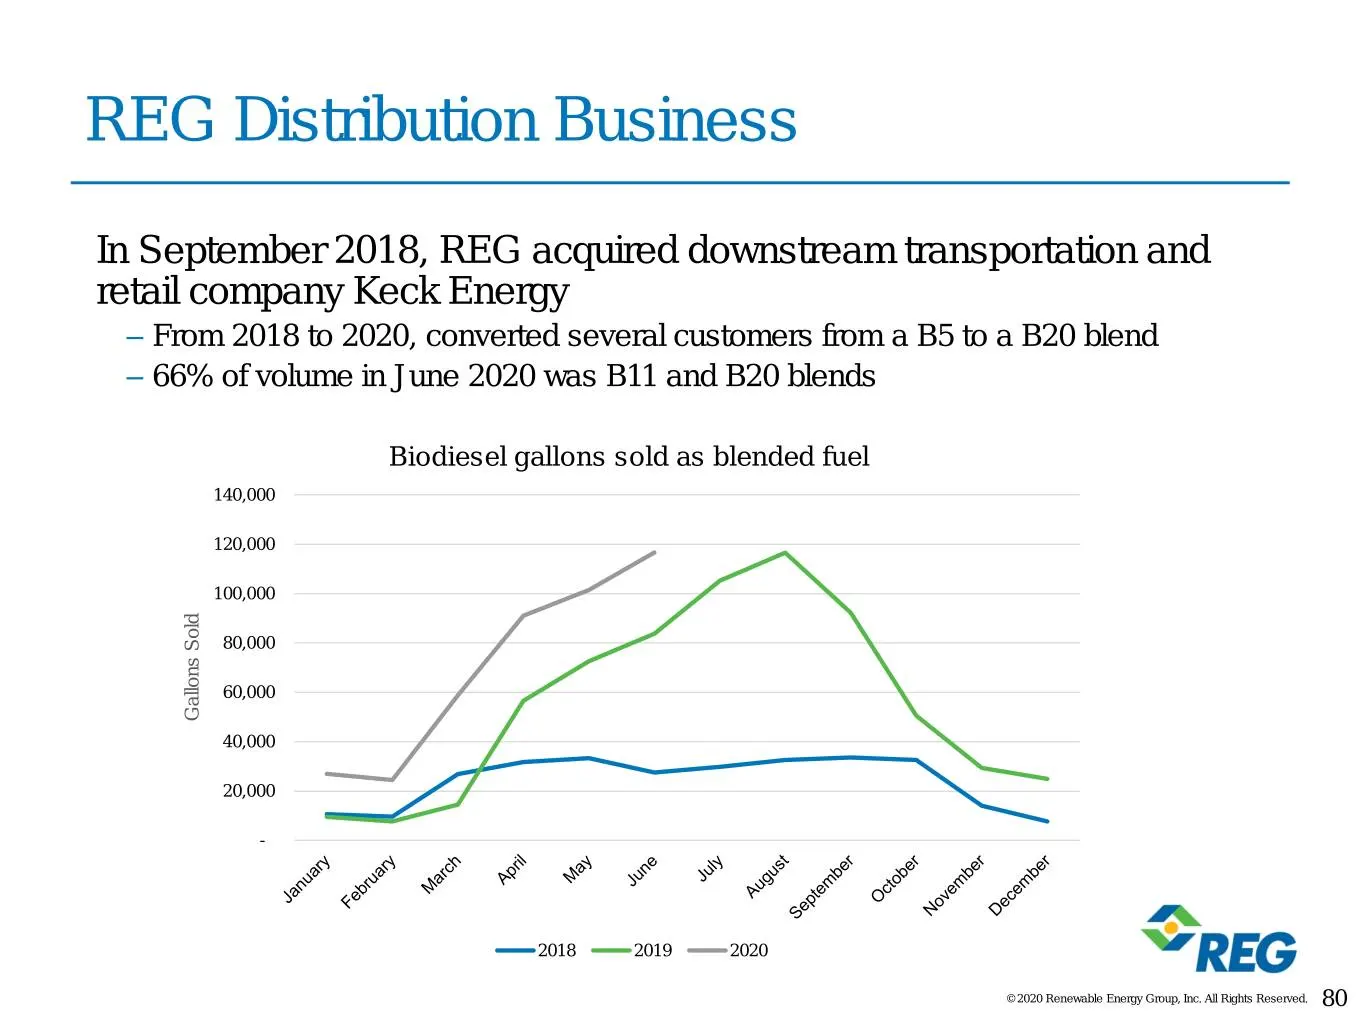
REG Distribution Business In September 2018, REG acquired downstream transportation and retail company Keck Energy – From 2018 to 2020, converted several customers from a B5 to a B20 blend – 66% of volume in June 2020 was B11 and B20 blends Biodiesel gallons sold as blended fuel 140,000 120,000 100,
Slide 81: Robust Terminal Network
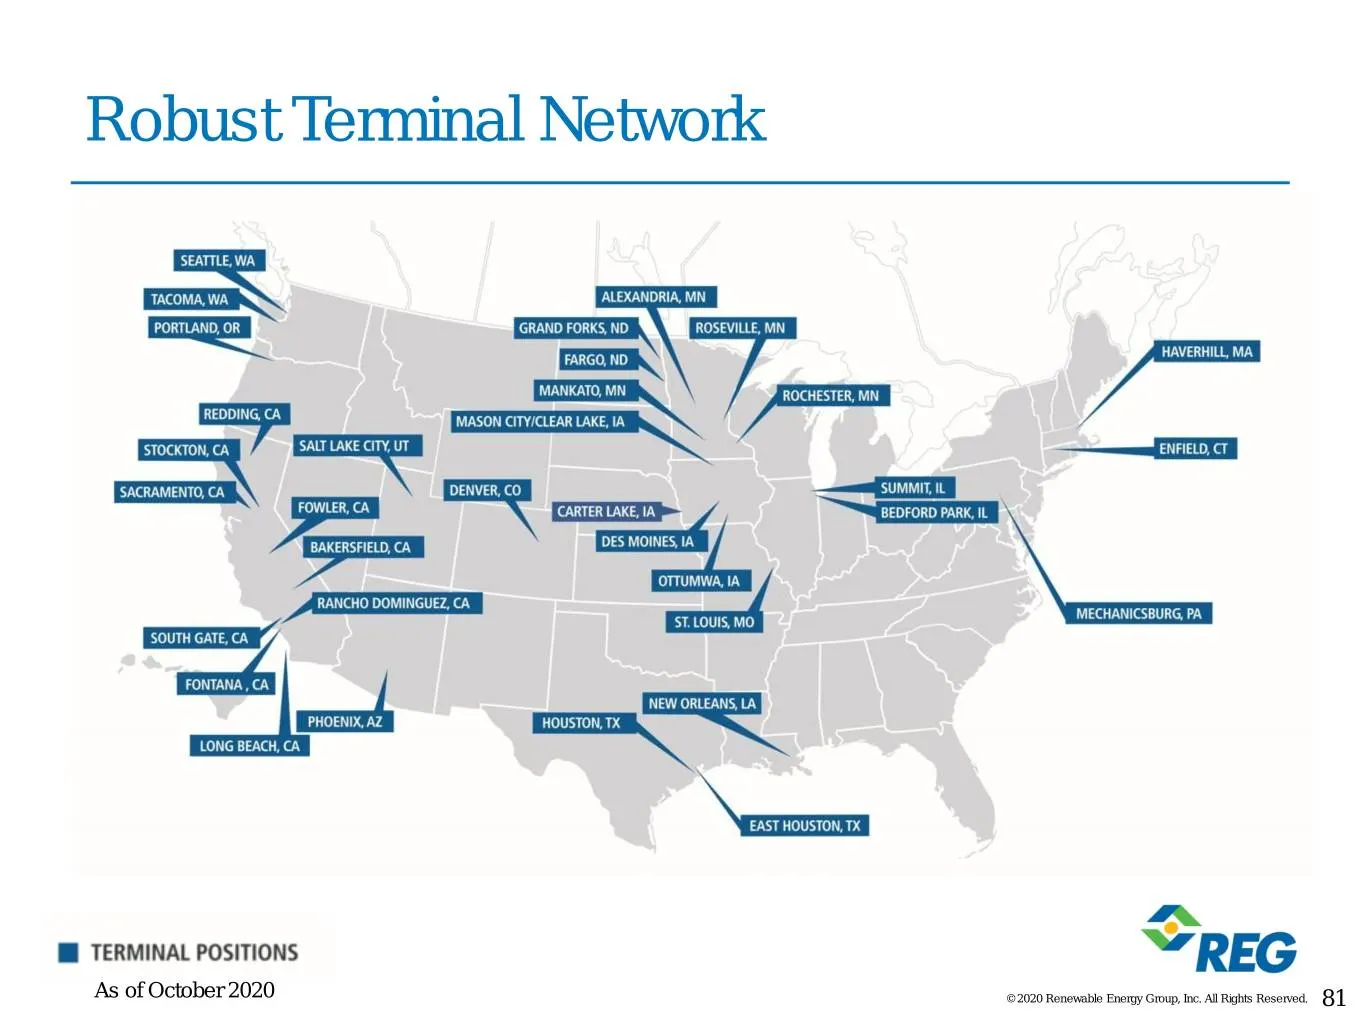
Robust Terminal Network As of October 2020 © 2020 Renewable Energy Group, Inc. All Rights Reserved. 81
Slide 82: End Users Represent A Growing Customer Segment
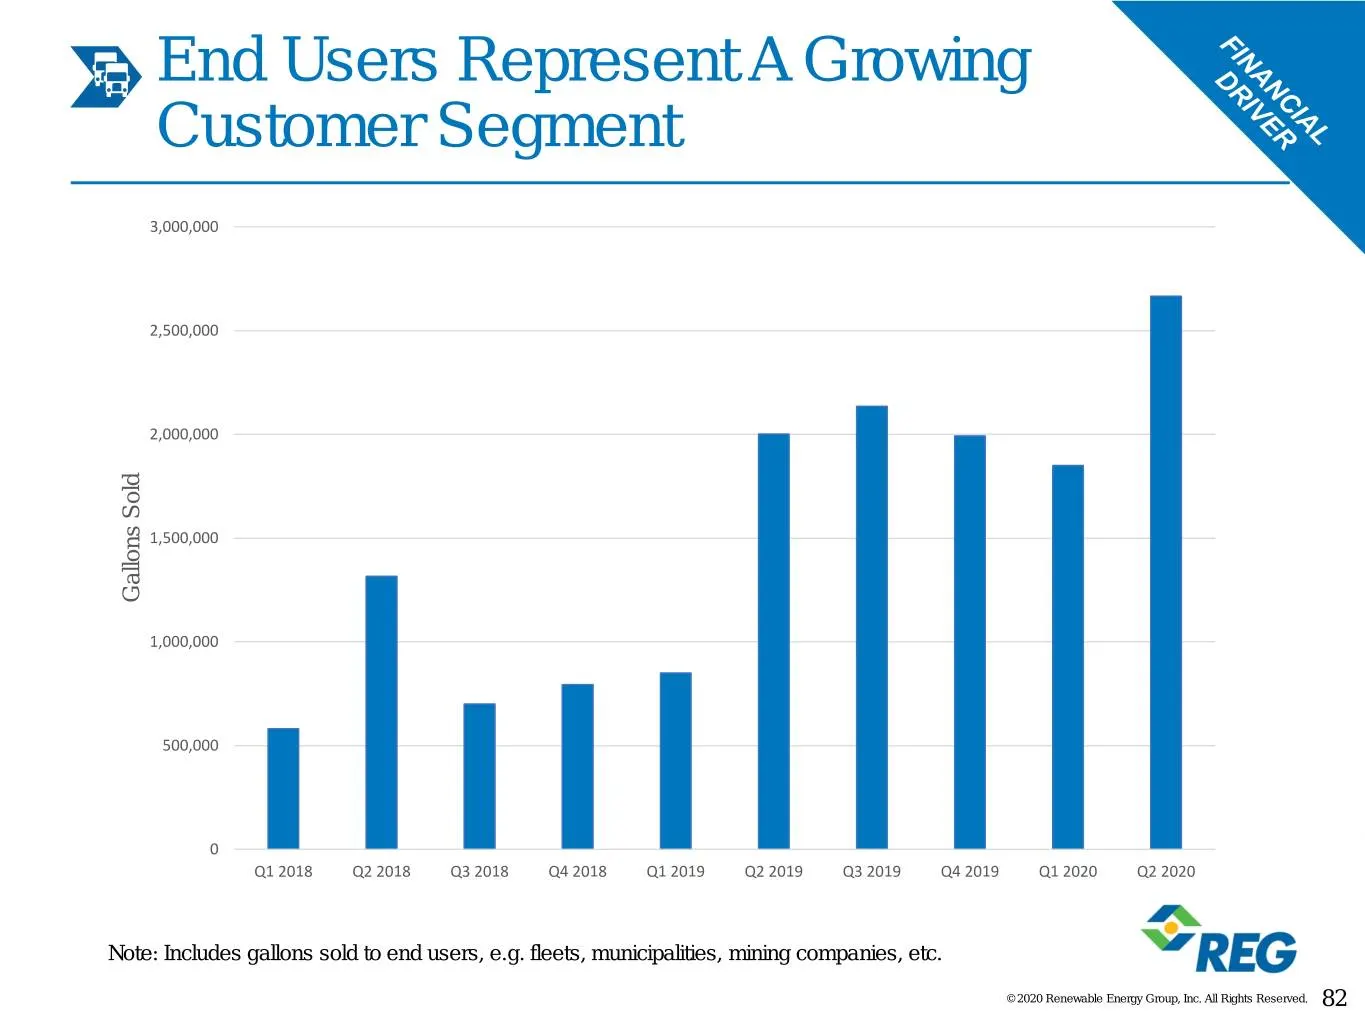
End Users Represent A Growing Customer Segment 3,000,000 2,500,000 2,000,000 1,500,000 Gallons SoldGallons 1,000,000 500,000 0 Q1 2018 Q2 2018 Q3 2018 Q4 2018 Q1 2019 Q2 2019 Q3 2019 Q4 2019 Q1 2020 Q2 2020 Note: Includes gallons sold to end users, e.g. fleets, municipalities, mining companies, etc.
Slide 83: Fleet Customers Represent A Growing Category of End Users
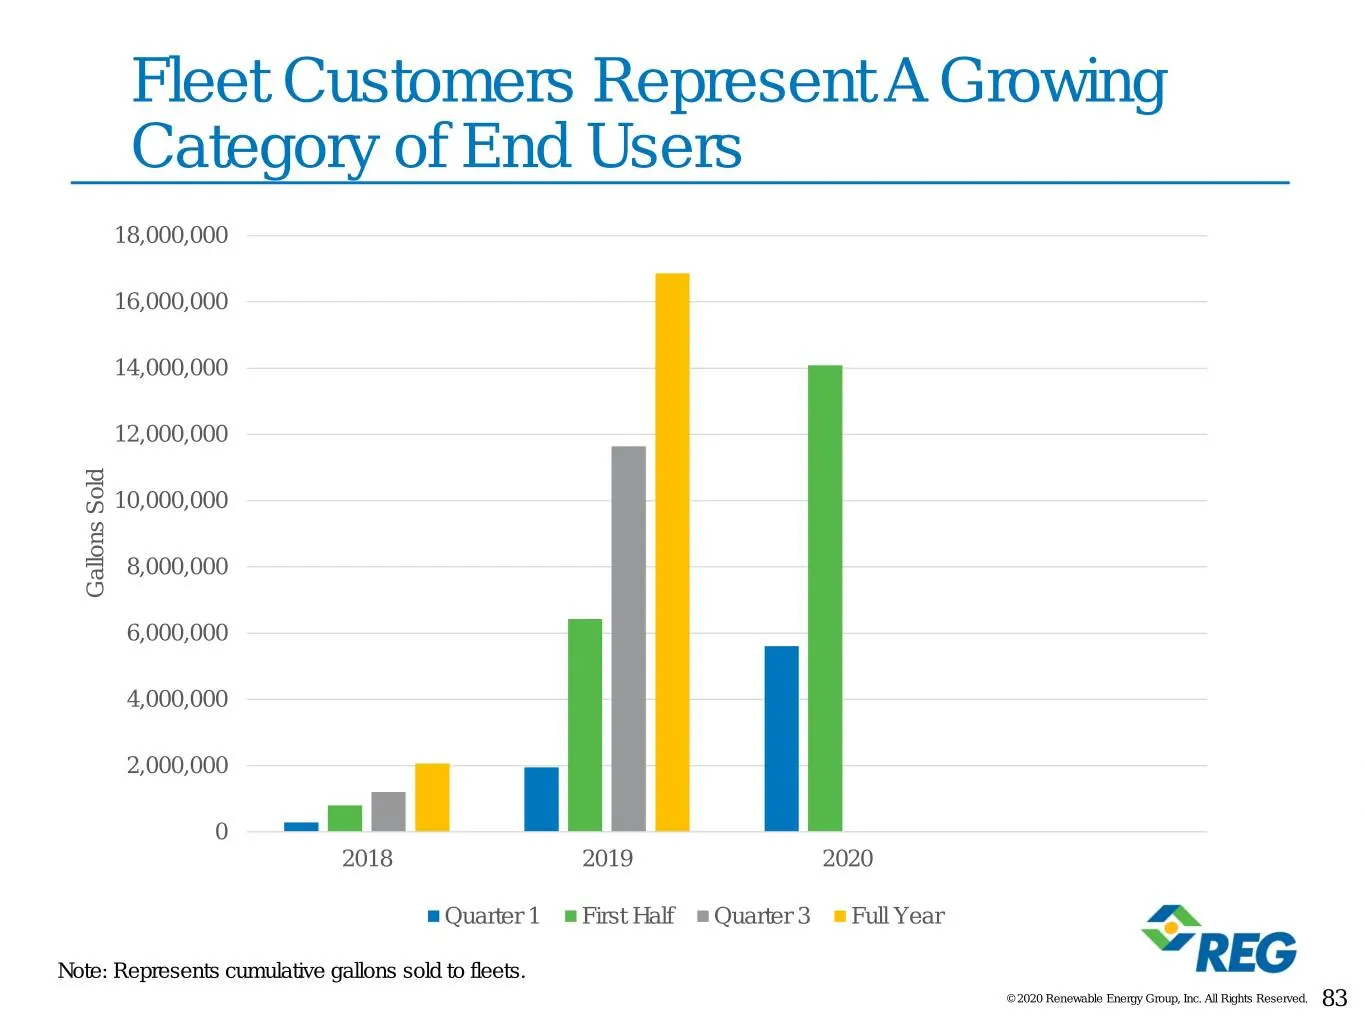
Fleet Customers Represent A Growing Category of End Users 18,000,000 16,000,000 14,000,000 12,000,000 10,000,000 8,000,000 Gallons SoldGallons 6,000,000 4,000,000 2,000,000 0 2018 2019 2020 Quarter 1 First Half Quarter 3 Full Year Note: Represents cumulative gallons sold to fleets. © 2020 Renewable
Slide 84: REG Owned Cardlock Locations Opened
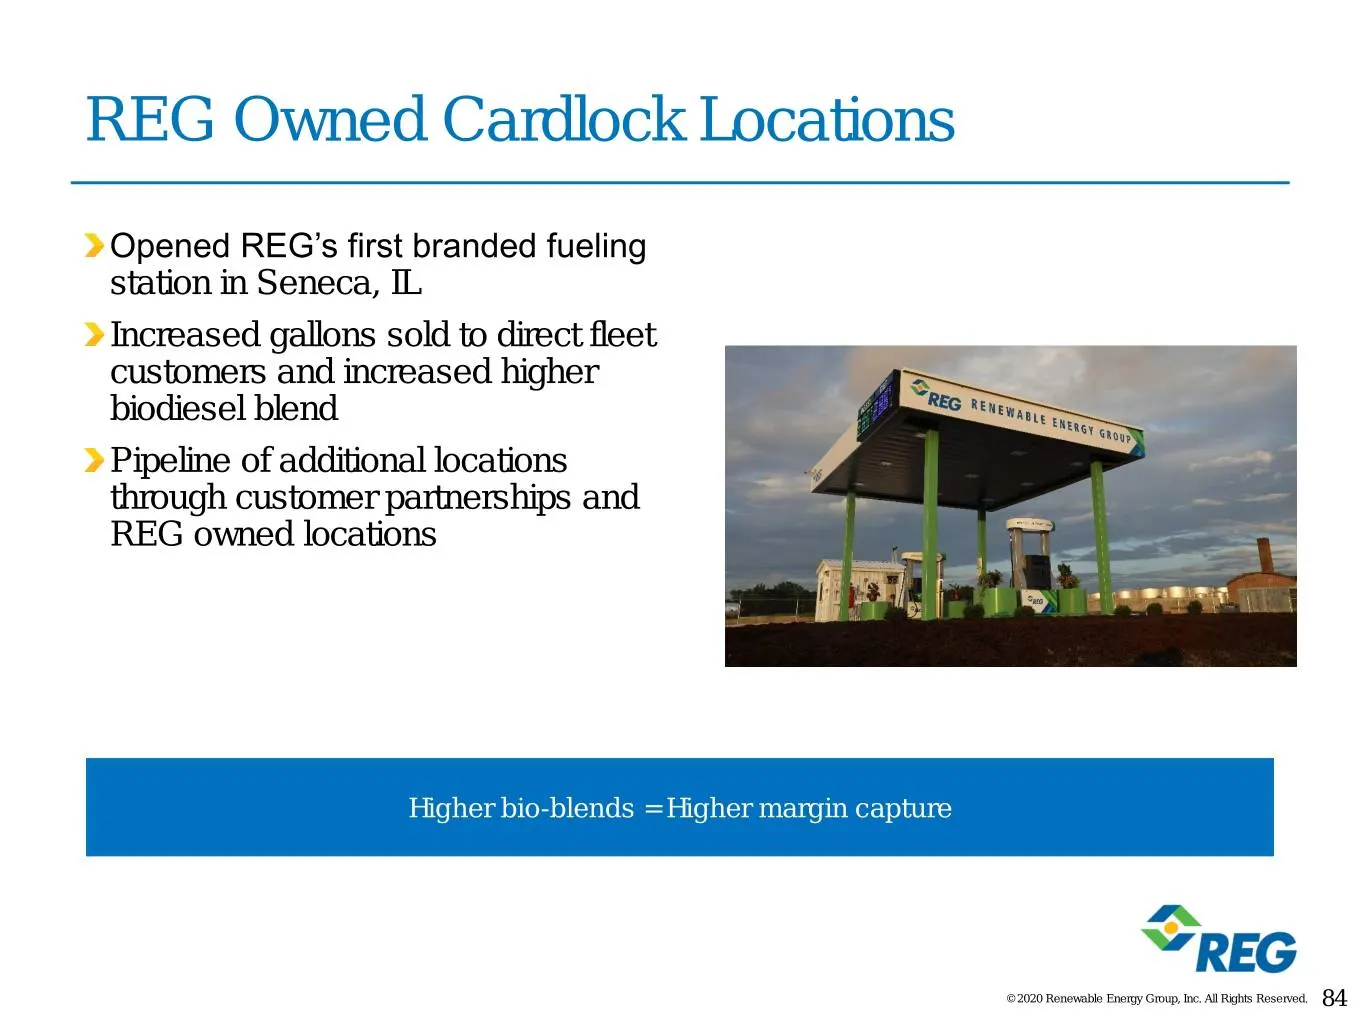
REG Owned Cardlock Locations Opened REG’s first branded fueling station in Seneca, IL Increased gallons sold to direct fleet customers and increased higher biodiesel blend Pipeline of additional locations through customer partnerships and REG owned locations Higher bio-blends = Higher margin capture
Slide 85: Pilot Programs Demonstrate Year-round B100 Use
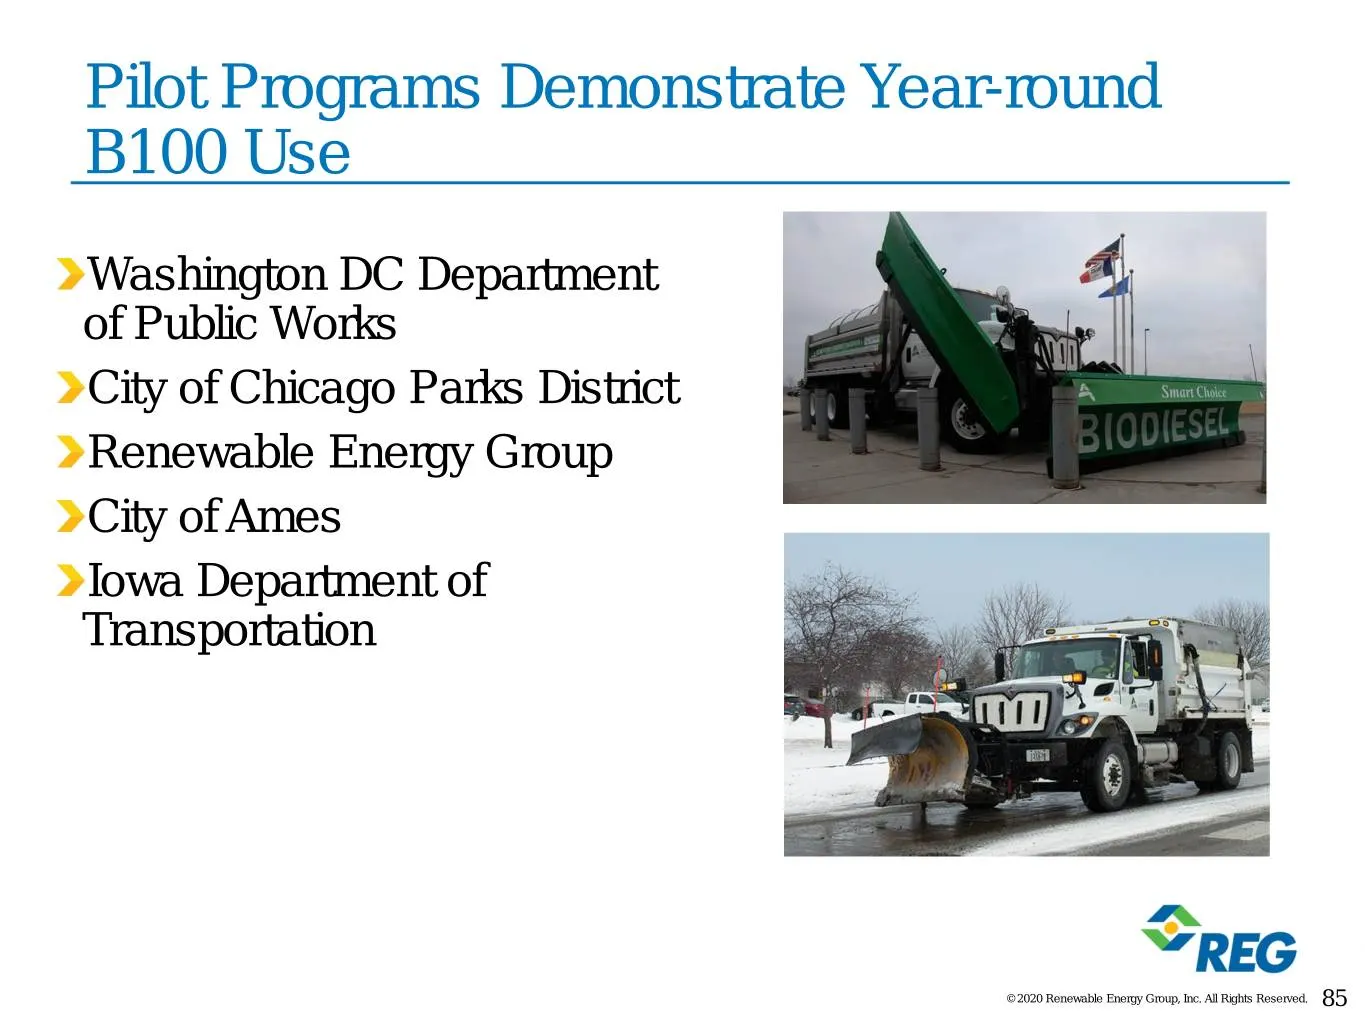
Pilot Programs Demonstrate Year-round B100 Use Washington DC Department of Public Works City of Chicago Parks District Renewable Energy Group City of Ames Iowa Department of Transportation © 2020 Renewable Energy Group, Inc. All Rights Reserved. 85
Slide 86: Customer Enthusiasm for Blends of Biodiesel and Renewable Diesel
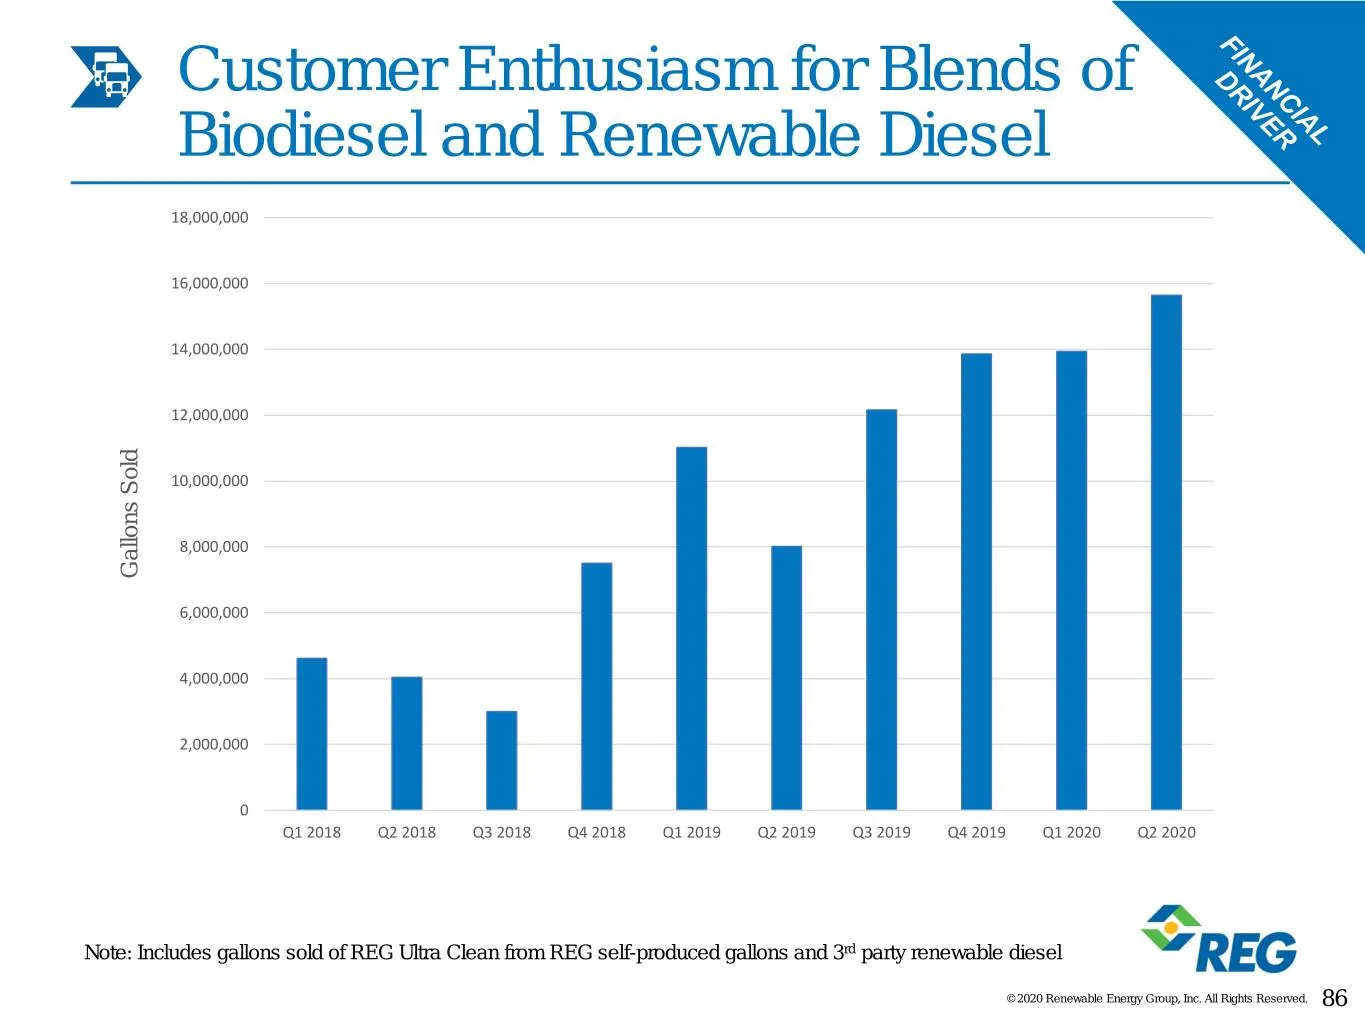
Customer Enthusiasm for Blends of Biodiesel and Renewable Diesel 18,000,000 16,000,000 14,000,000 12,000,000 10,000,000 8,000,000 Gallons SoldGallons 6,000,000 4,000,000 2,000,000 0 Q1 2018 Q2 2018 Q3 2018 Q4 2018 Q1 2019 Q2 2019 Q3 2019 Q4 2019 Q1 2020 Q2 2020 Note: Includes gallons sold of REG Ult
Slide 87: REG Branding Agreement With Hunt & Sons
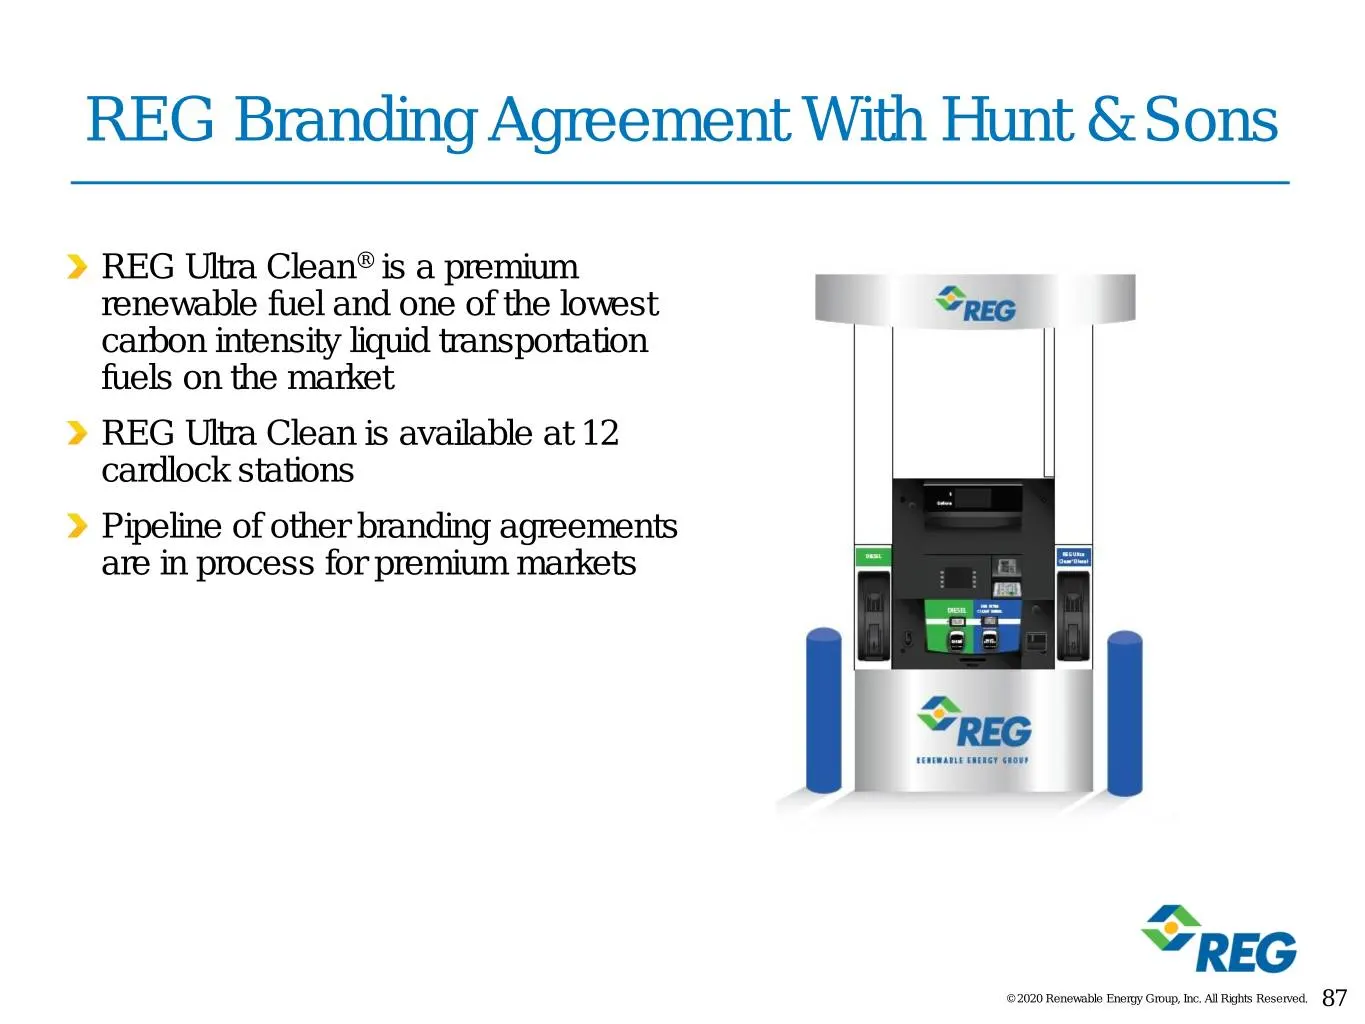
REG Branding Agreement With Hunt & Sons REG Ultra Clean® is a premium renewable fuel and one of the lowest carbon intensity liquid transportation fuels on the market REG Ultra Clean is available at 12 cardlock stations Pipeline of other branding agreements are in process for premium markets © 2020 R
Slide 88: Sales Optimization To Incentivized Markets Internationally
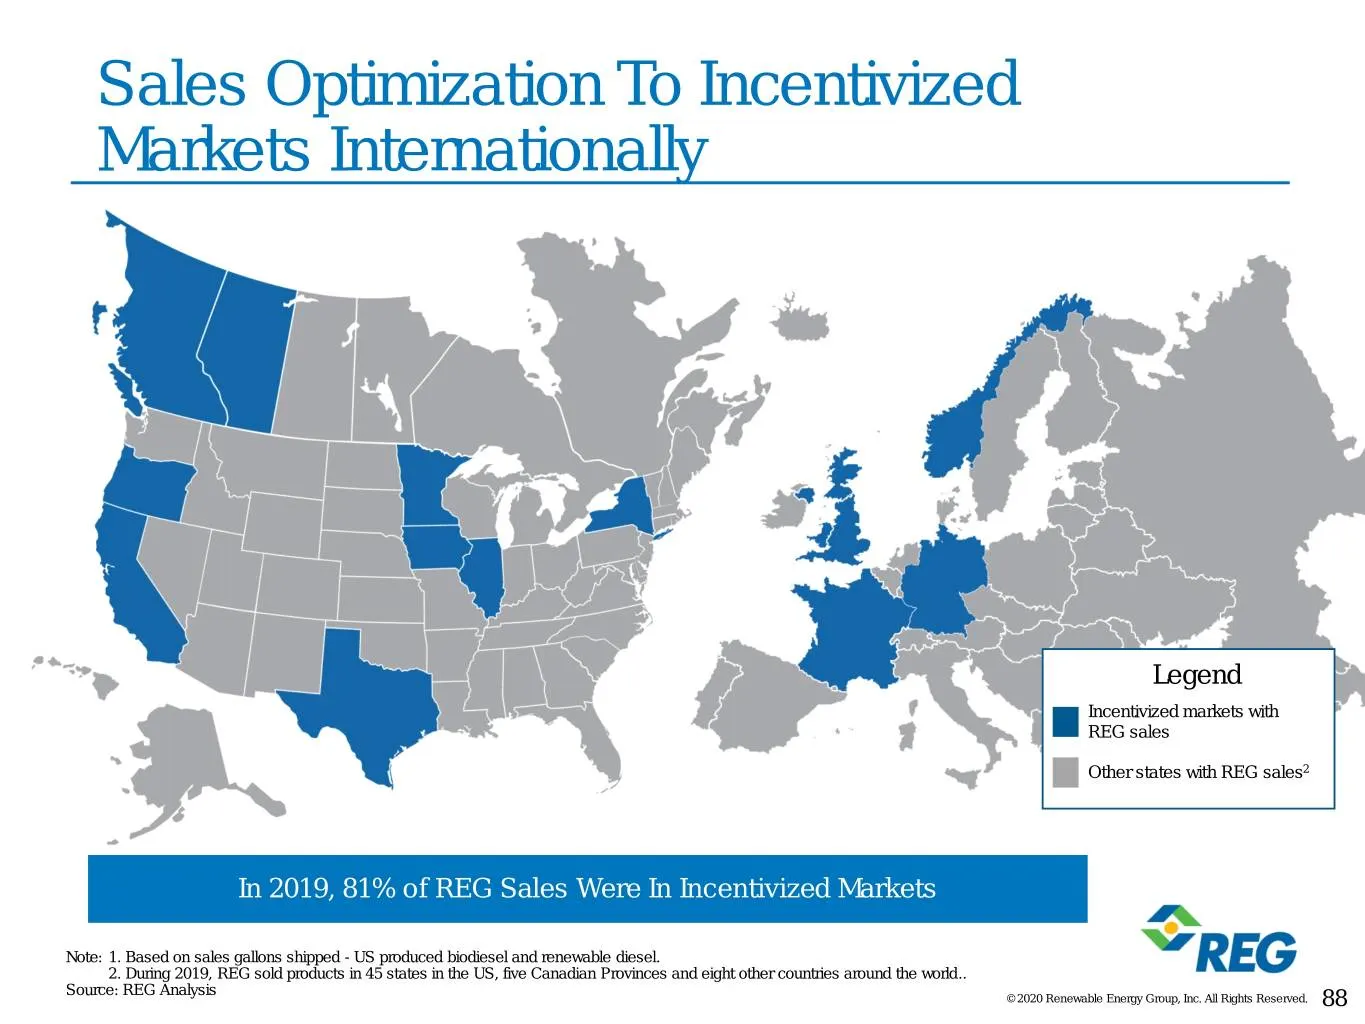
Sales Optimization To Incentivized Markets Internationally Legend Incentivized markets with REG sales Other states with REG sales2 In 2019, 81% of REG Sales Were In Incentivized Markets Note: 1. Based on sales gallons shipped - US produced biodiesel and renewable diesel. 2. During 2019, REG sold pro
Slide 89: Sales Optimization To Premium Markets
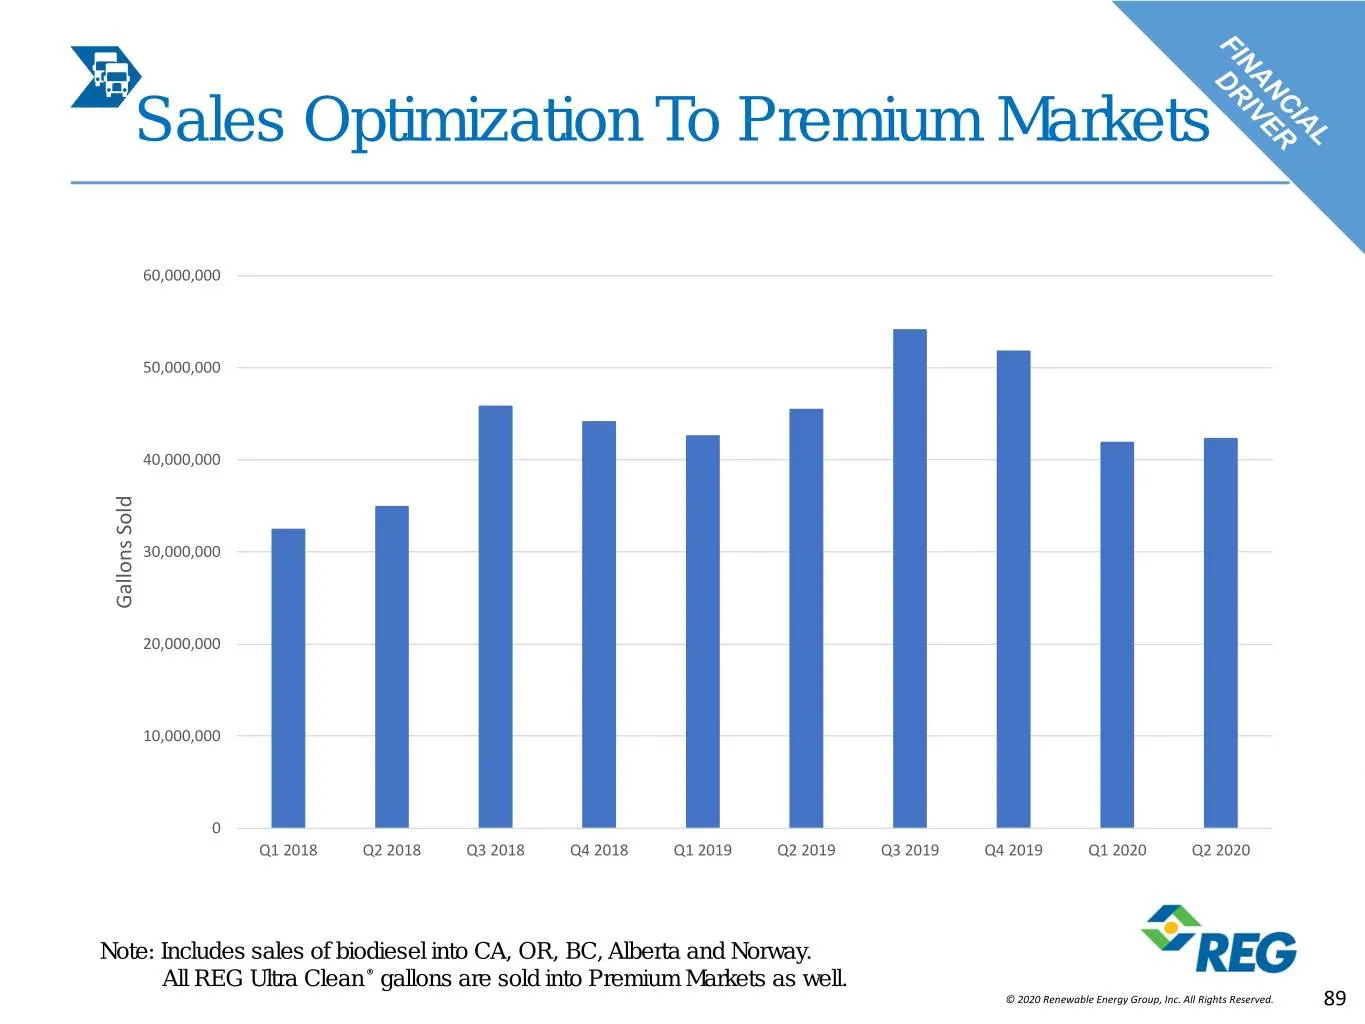
Sales Optimization To Premium Markets 60,000,000 50,000,000 40,000,000 30,000,000 Gallons SoldGallons 20,000,000 10,000,000 0 Q1 2018 Q2 2018 Q3 2018 Q4 2018 Q1 2019 Q2 2019 Q3 2019 Q4 2019 Q1 2020 Q2 2020 Note: Includes sales of biodiesel into CA, OR, BC, Alberta and Norway. All REG Ultra Clean ® g
Slide 90: Downstream Video
Downstream Video © 2020 Renewable Energy Group, Inc. All Rights Reserved.
Slide 91: Downstream Summary
Downstream Summary REG is driving sustainable demand and margin expansion by moving downstream Sales of Self-Produced Gallons End Users Represent A Growing Customer Segment Sales Optimization To Premium Markets Internationally © 2020 Renewable Energy Group, Inc. All Rights Reserved. 91
Slide 92: Intermission
Intermission © 2020 Renewable Energy Group, Inc. All Rights Reserved.

Slide 93: Financial Discipline, Strong Delivery and Earnings Predictability
Financial Discipline, Strong Delivery and Earnings Predictability Chad Stone Chief Financial Officer © 2020 Renewable Energy Group, Inc. All Rights Reserved. 93
Slide 94: Historical Annual Financial Performance
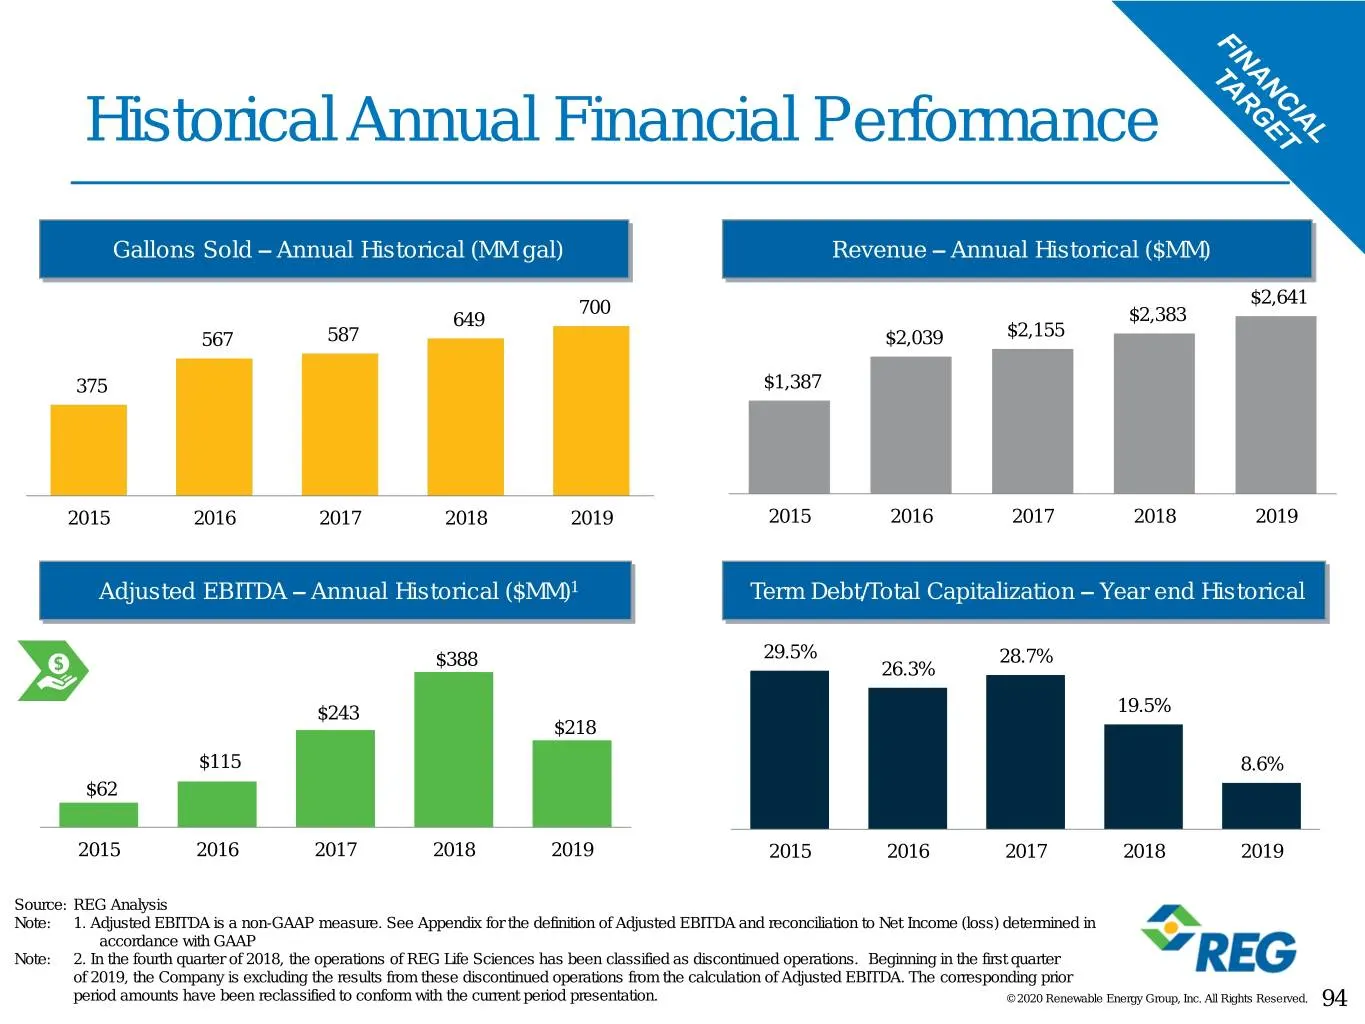
Historical Annual Financial Performance Gallons Sold – Annual Historical (MM gal) Revenue – Annual Historical ($MM) $2,641 700 649 $2,383 $2,155 567 587 $2,039 375 $1,387 2015 2016 2017 2018 2019 2015 2016 2017 2018 2019 Adjusted EBITDA – Annual Historical ($MM)1 Term Debt/Total Capitalization – Yea
Slide 95: Balanced Approach to Capital Allocation
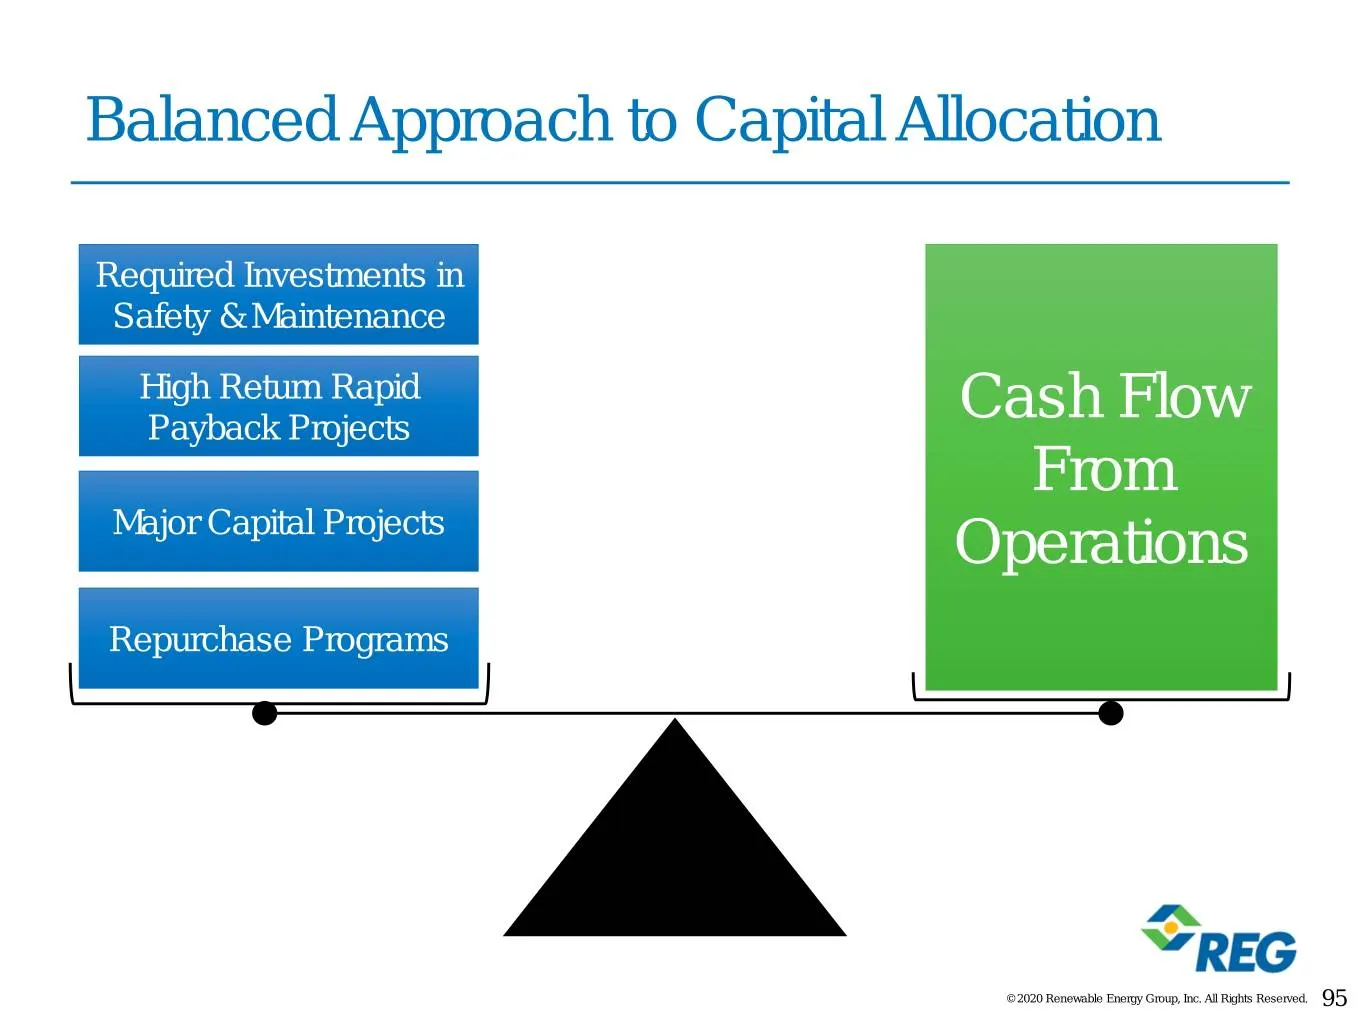
Balanced Approach to Capital Allocation Required Investments in Safety & Maintenance High Return Rapid Payback Projects Cash Flow From Major Capital Projects Operations Repurchase Programs © 2020 Renewable Energy Group, Inc. All Rights Reserved. 95
Slide 96: Investing For Growth
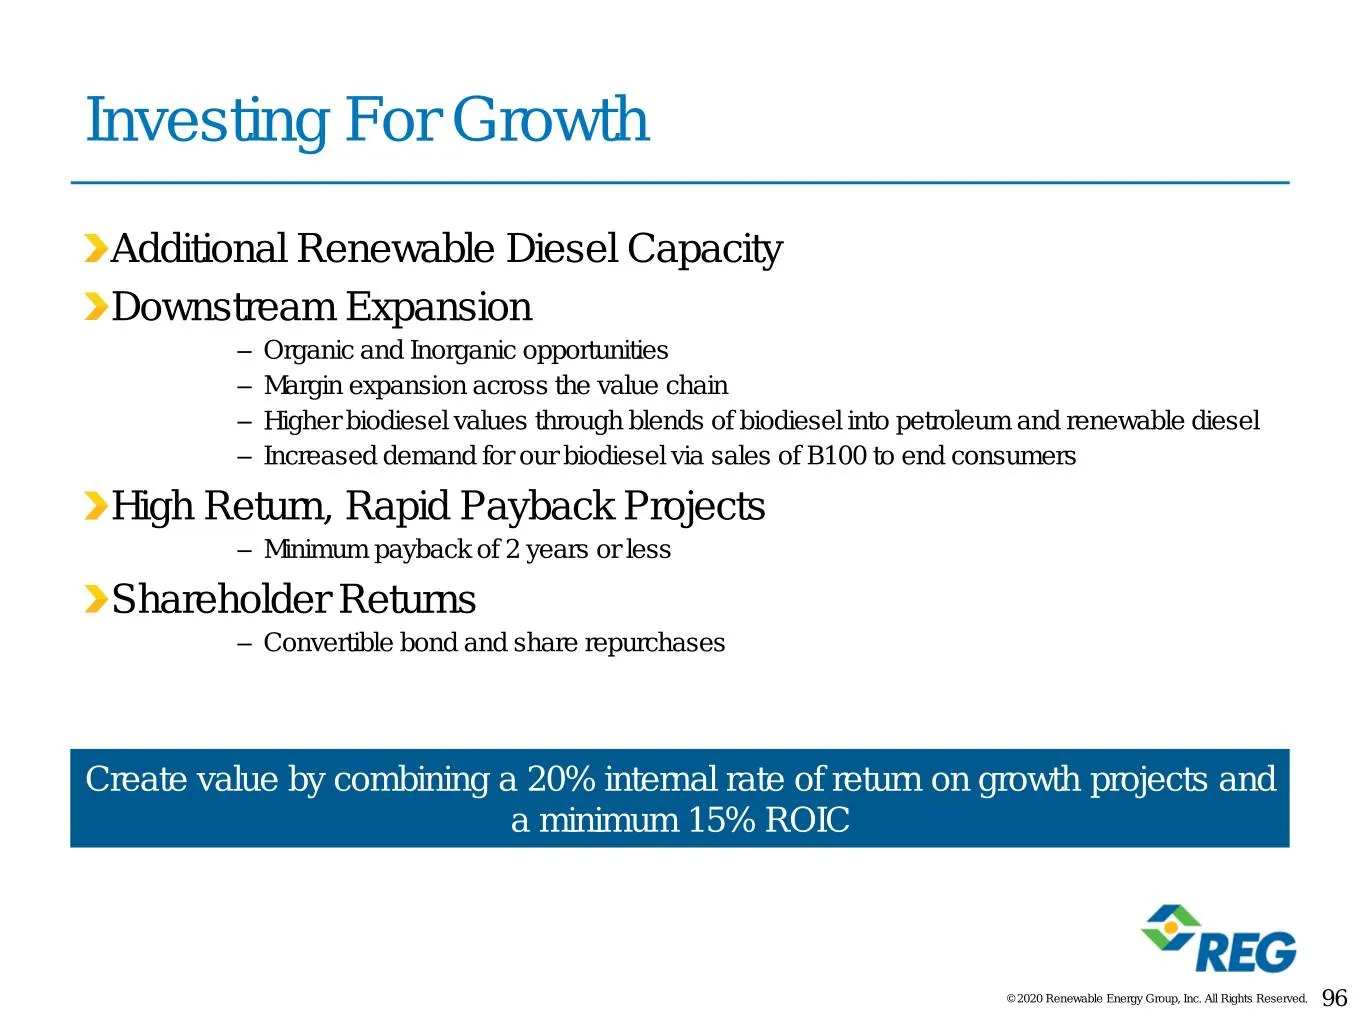
Investing For Growth Additional Renewable Diesel Capacity Downstream Expansion – Organic and Inorganic opportunities – Margin expansion across the value chain – Higher biodiesel values through blends of biodiesel into petroleum and renewable diesel – Increased demand for our biodiesel via sales of B
Slide 97: 2015-2020 Repurchase Programs
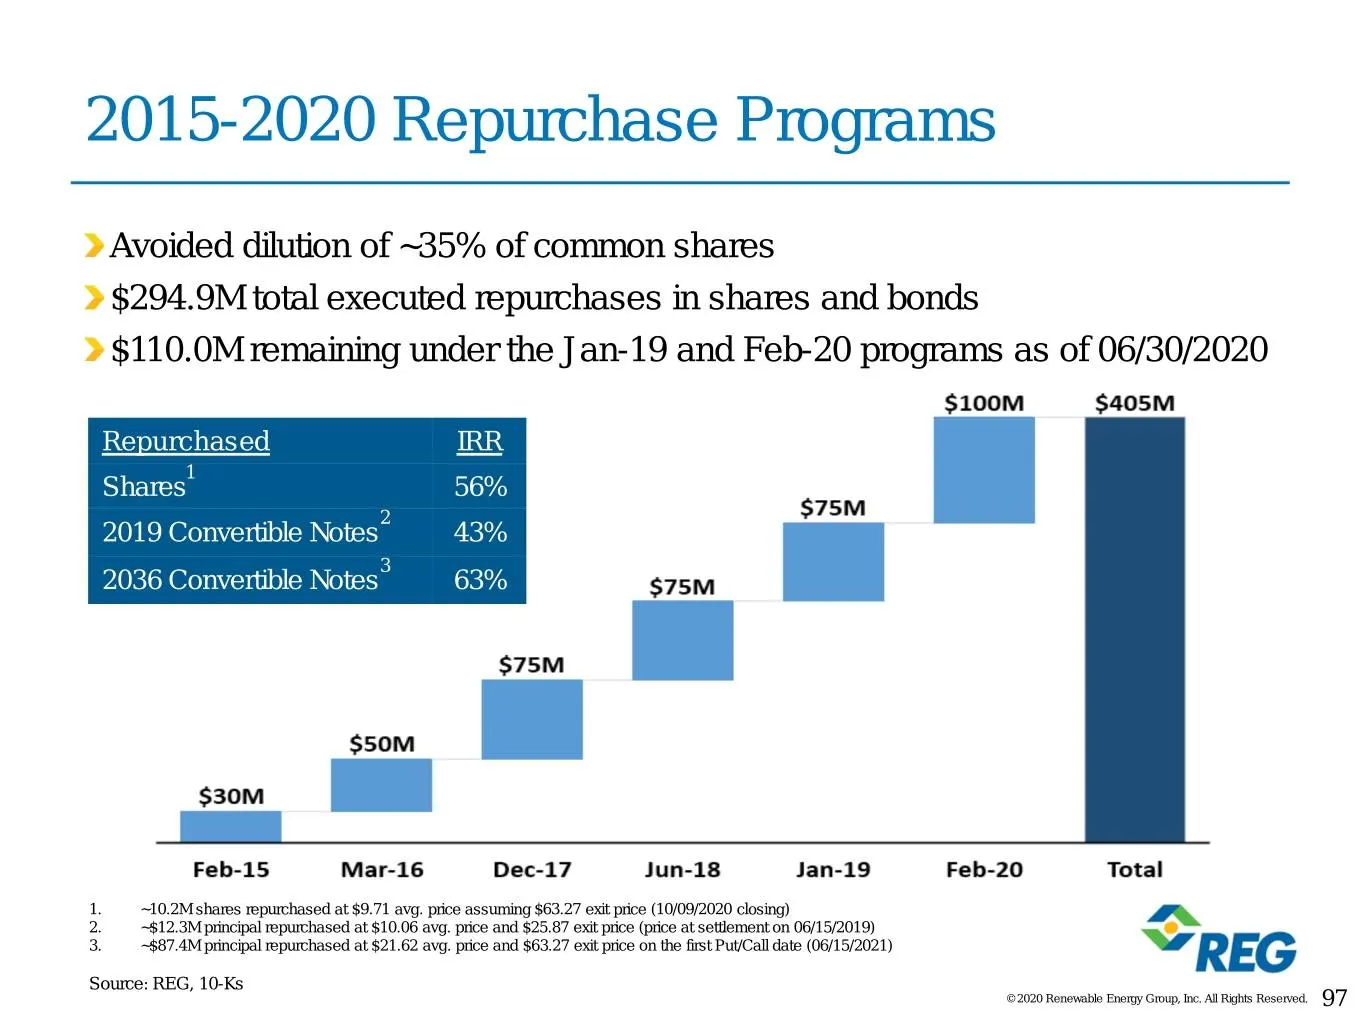
2015-2020 Repurchase Programs Avoided dilution of ~35% of common shares $294.9M total executed repurchases in shares and bonds $110.0M remaining under the Jan-19 and Feb-20 programs as of 06/30/2020 Repurchased IRR 1 Shares 56% 2 2019 Convertible Notes 43% 3 2036 Convertible Notes 63% 1. ~10.2M shar
Slide 98: Biodiesel and Renewable Diesel Resiliency
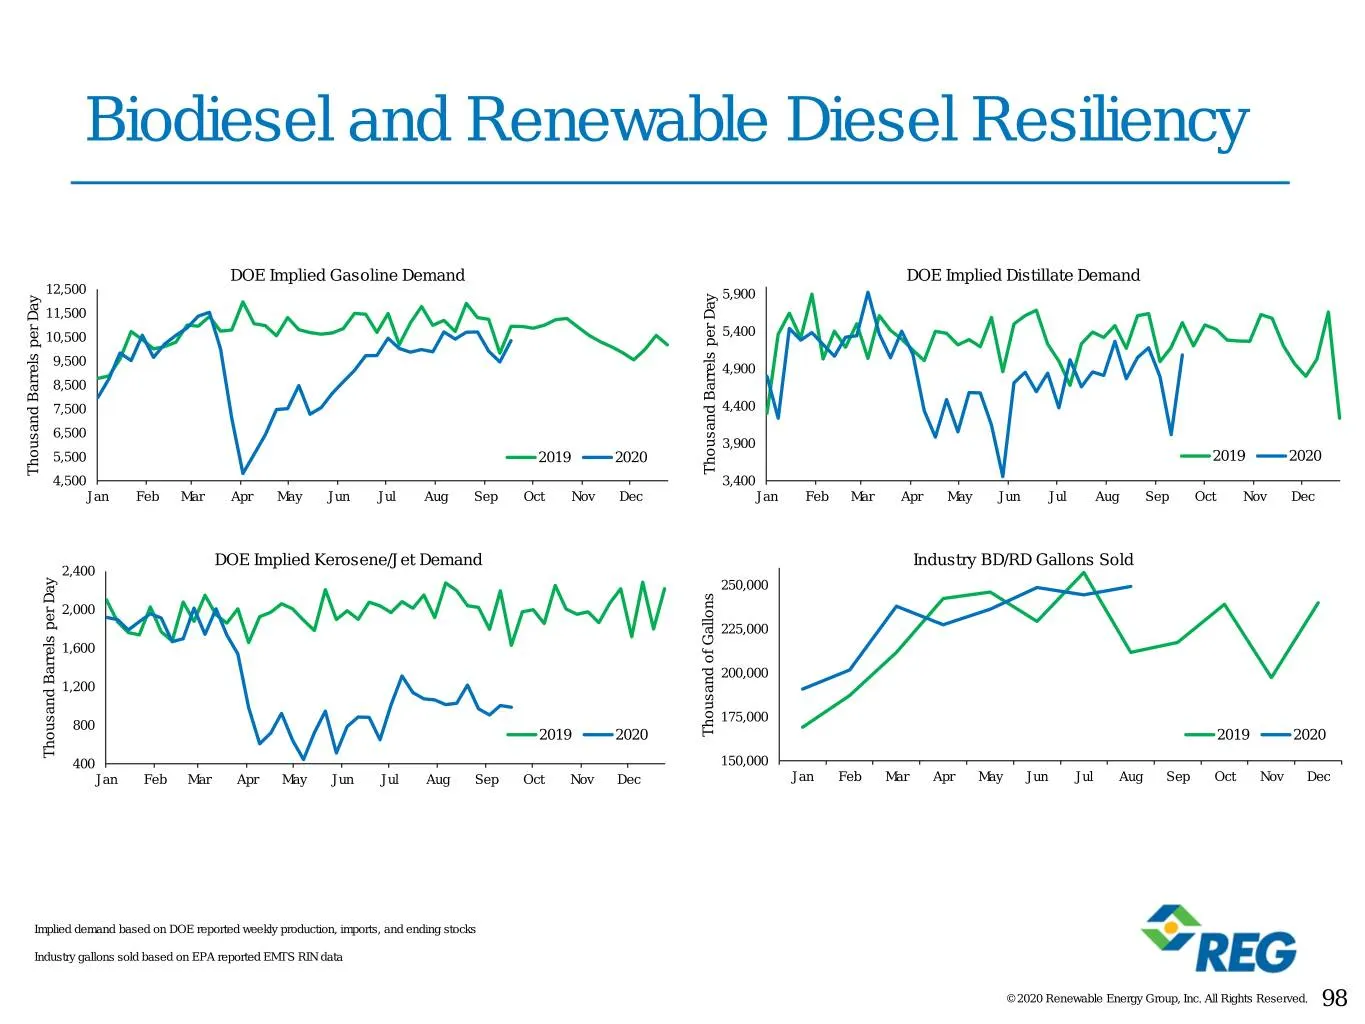
Biodiesel and Renewable Diesel Resiliency DOE Implied Gasoline Demand DOE Implied Distillate Demand 12,500 5,900 11,500 10,500 5,400 9,500 4,900 8,500 7,500 4,400 6,500 3,900 5,500 2019 2020 2019 2020 Thousand Barrels ThousandBarrels Day per Thousand Barrels ThousandBarrels Day per 4,500 3,400 Jan F
Slide 99: REG Performance – Q2 2020 And First Half 2020
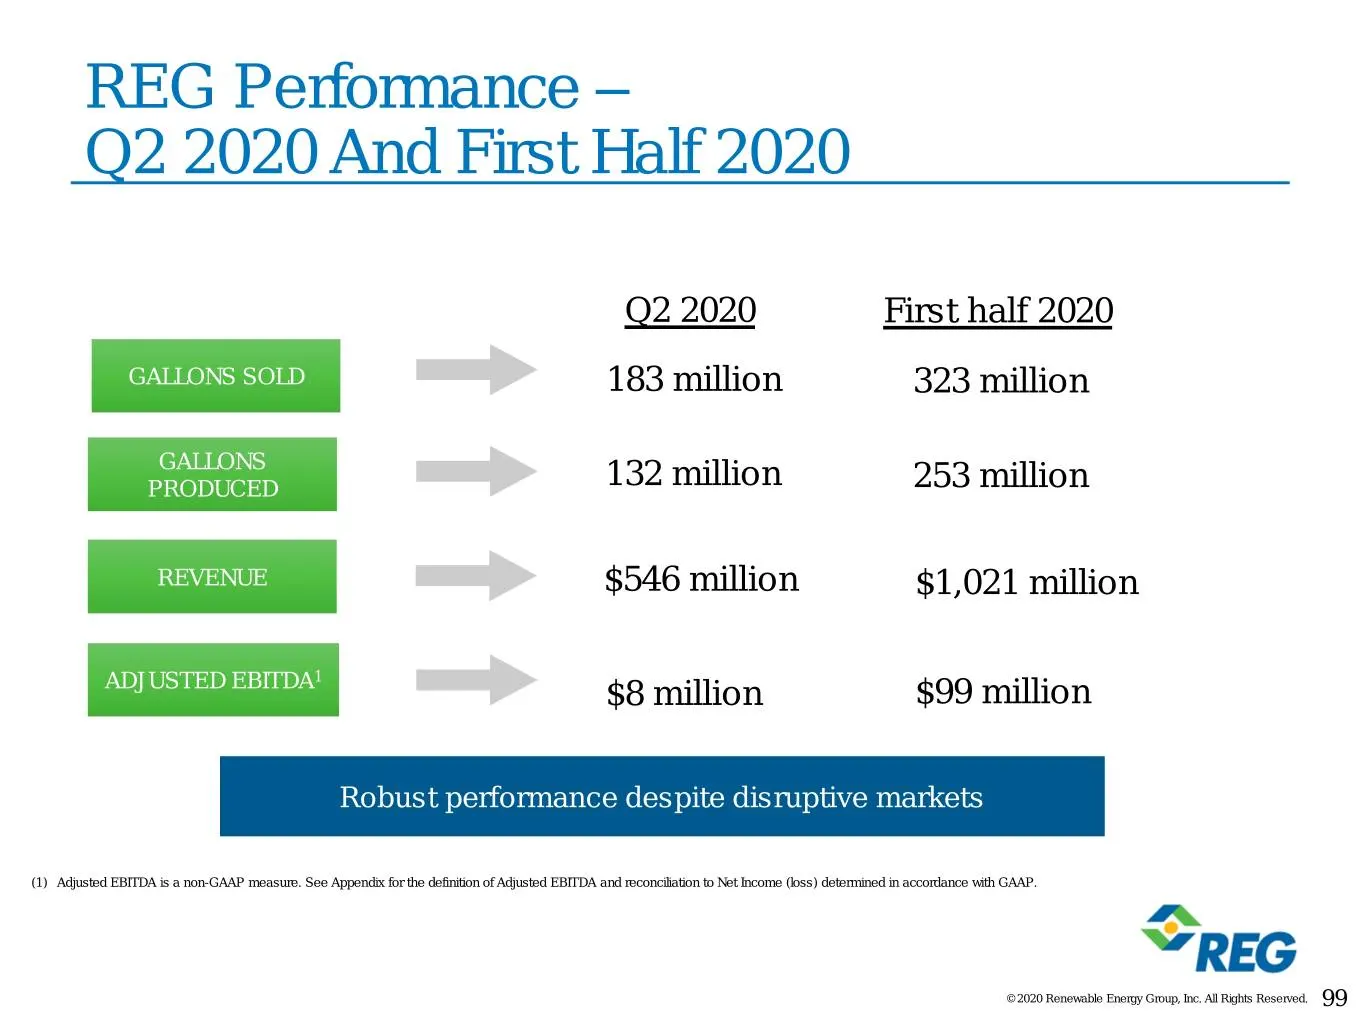
REG Performance – Q2 2020 And First Half 2020 Q2 2020 First half 2020 GALLONS SOLD 183 million 323 million GALLONS PRODUCED 132 million 253 million REVENUE $546 million $1,021 million 1 ADJUSTED EBITDA $8 million $99 million Robust performance despite disruptive markets (1) Adjusted EBITDA is a non-
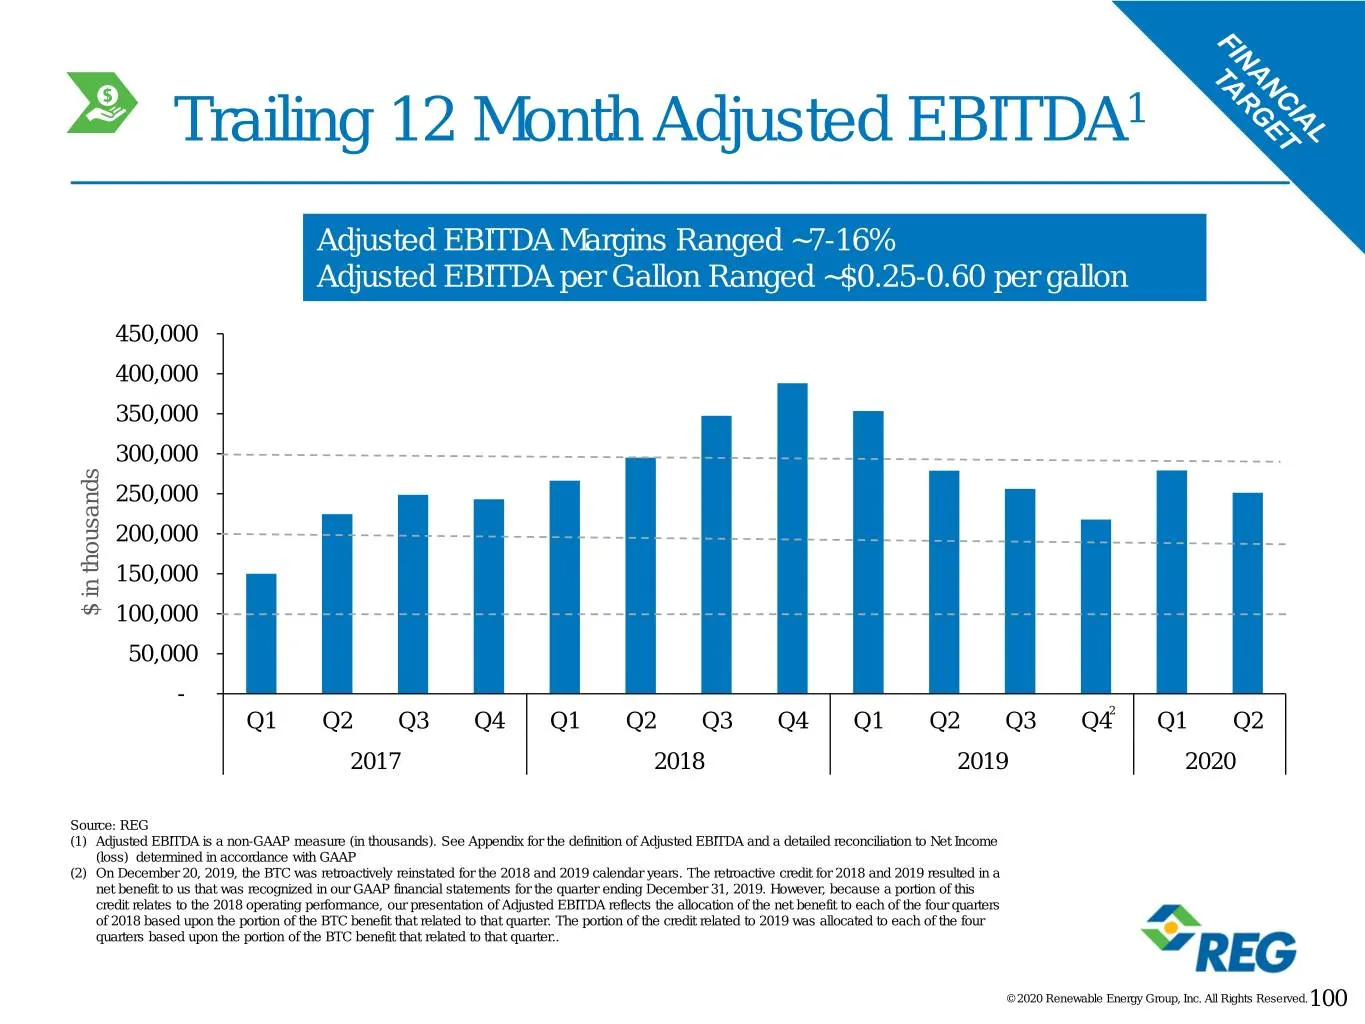
Slide 100: Trailing Month Adjusted EBITDA
Trailing 12 Month Adjusted EBITDA1 Adjusted EBITDA Margins Ranged ~7-16% Adjusted EBITDA per Gallon Ranged ~$0.25-0.60 per gallon 450,000 400,000 350,000 300,000 250,000 200,000 150,000 $ in in thousands$ 100,000 50,000 - Q1 Q2 Q3 Q4 Q1 Q2 Q3 Q4 Q1 Q2 Q3 Q42 Q1 Q2 2017 2018 2019 2020 Source: REG (1)
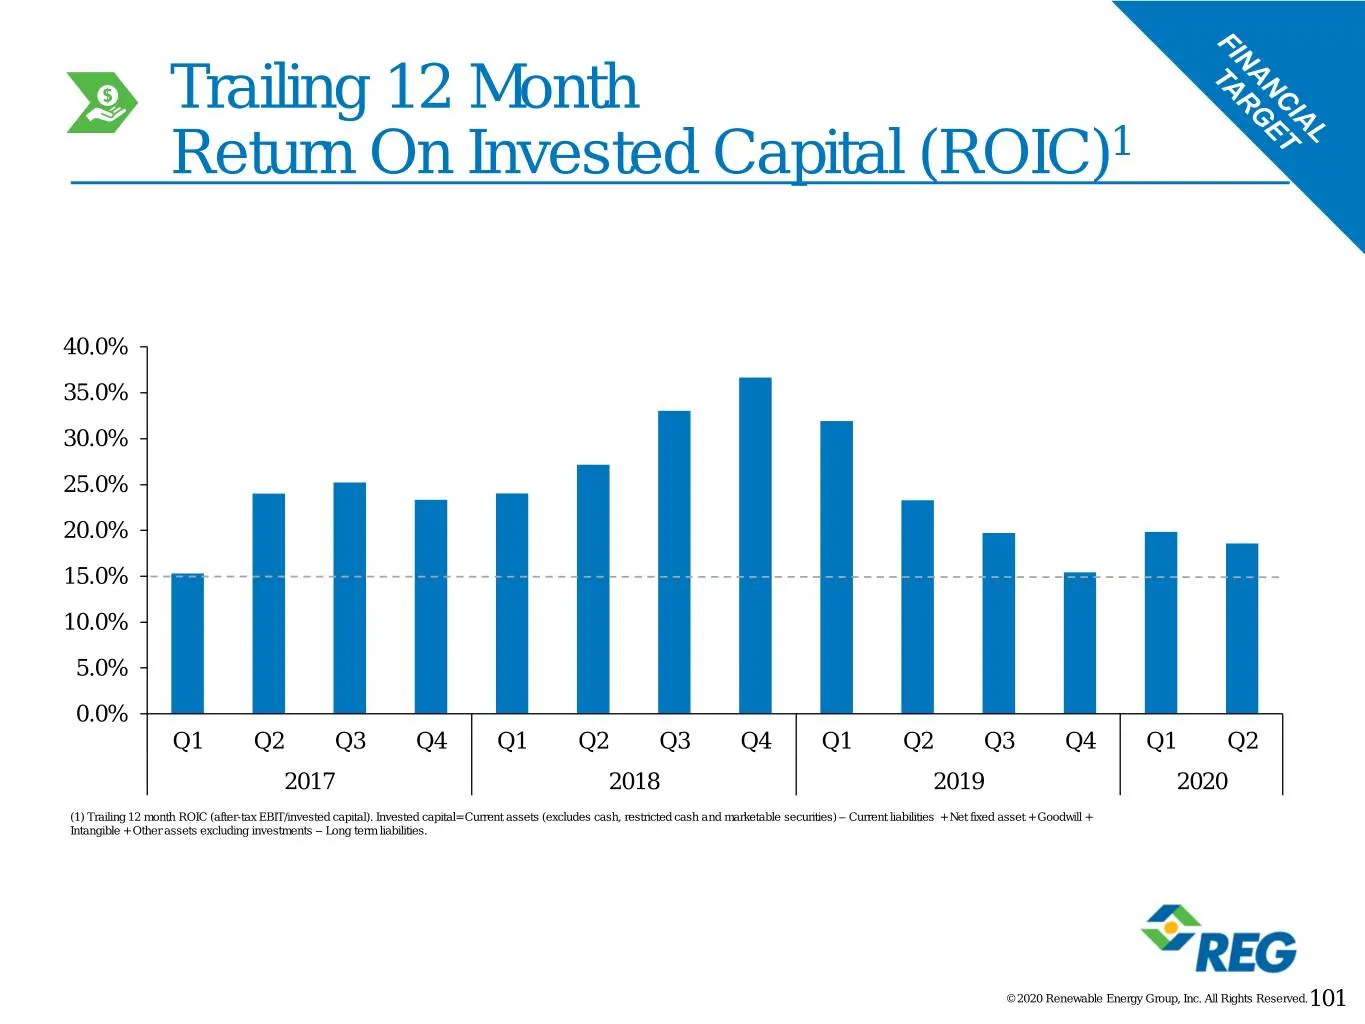
Slide 101: Trailing Month Return On Invested Capital (ROIC)
Trailing 12 Month Return On Invested Capital (ROIC)1 40.0% 35.0% 30.0% 25.0% 20.0% 15.0% 10.0% 5.0% 0.0% Q1 Q2 Q3 Q4 Q1 Q2 Q3 Q4 Q1 Q2 Q3 Q4 Q1 Q2 2017 2018 2019 2020 (1) Trailing 12 month ROIC (after-tax EBIT/invested capital). Invested capital= Current assets (excludes cash, restricted cash and ma
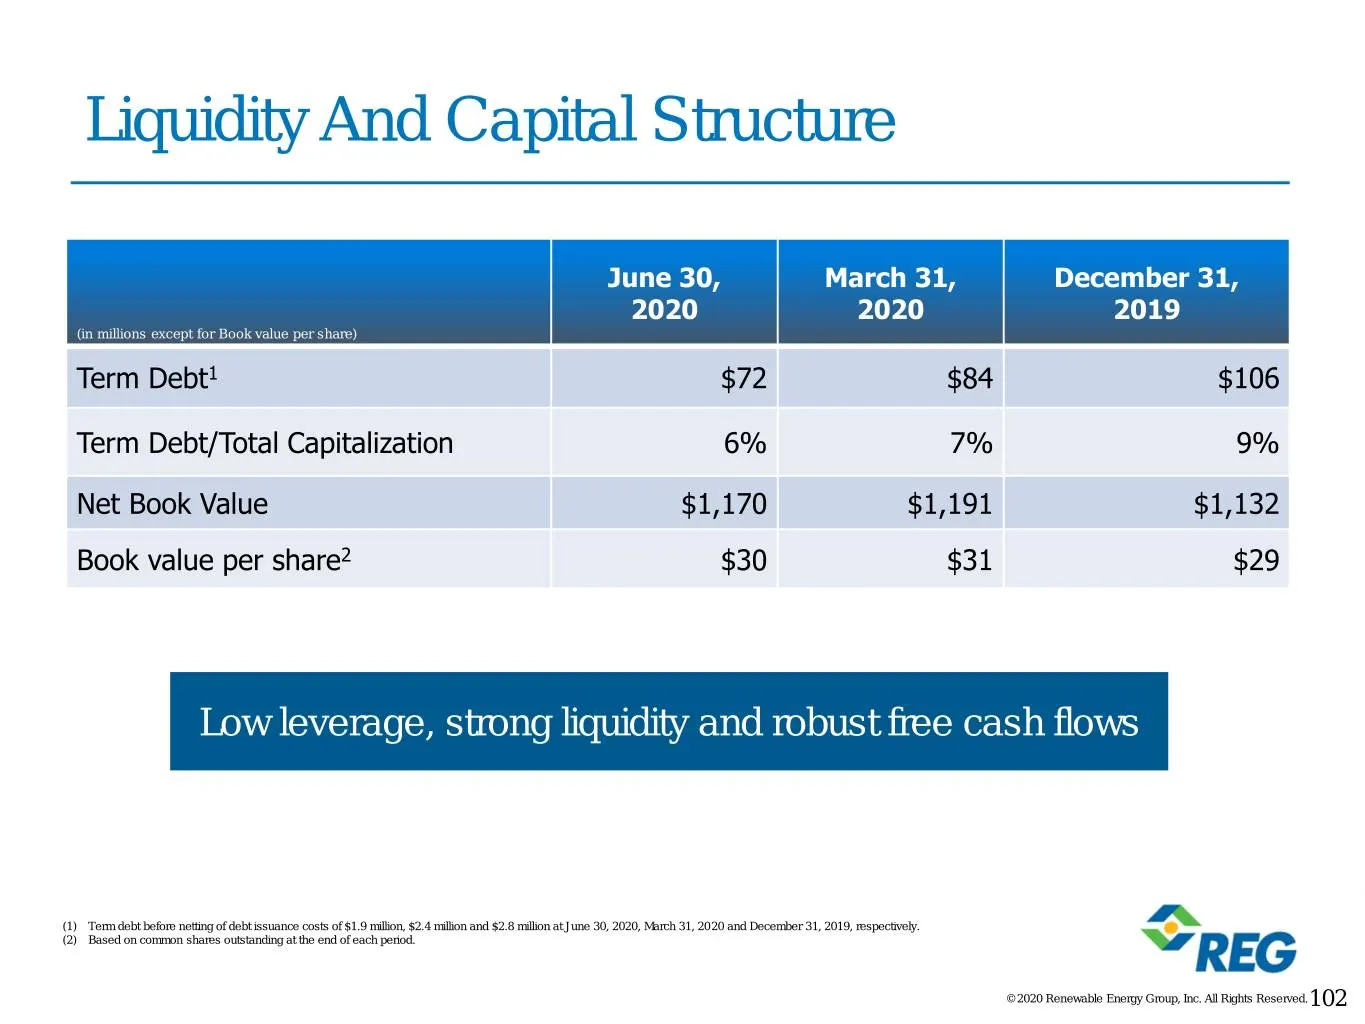
Slide 102: Liquidity And Capital Structure
Liquidity And Capital Structure June 30, March 31, December 31, 2020 2020 2019 (in millions except for Book value per share) Term Debt1 $72 $84 $106 Term Debt/Total Capitalization 6% 7% 9% Net Book Value $1,170 $1,191 $1,132 Book value per share2 $30 $31 $29 Low leverage, strong liquidity and robust
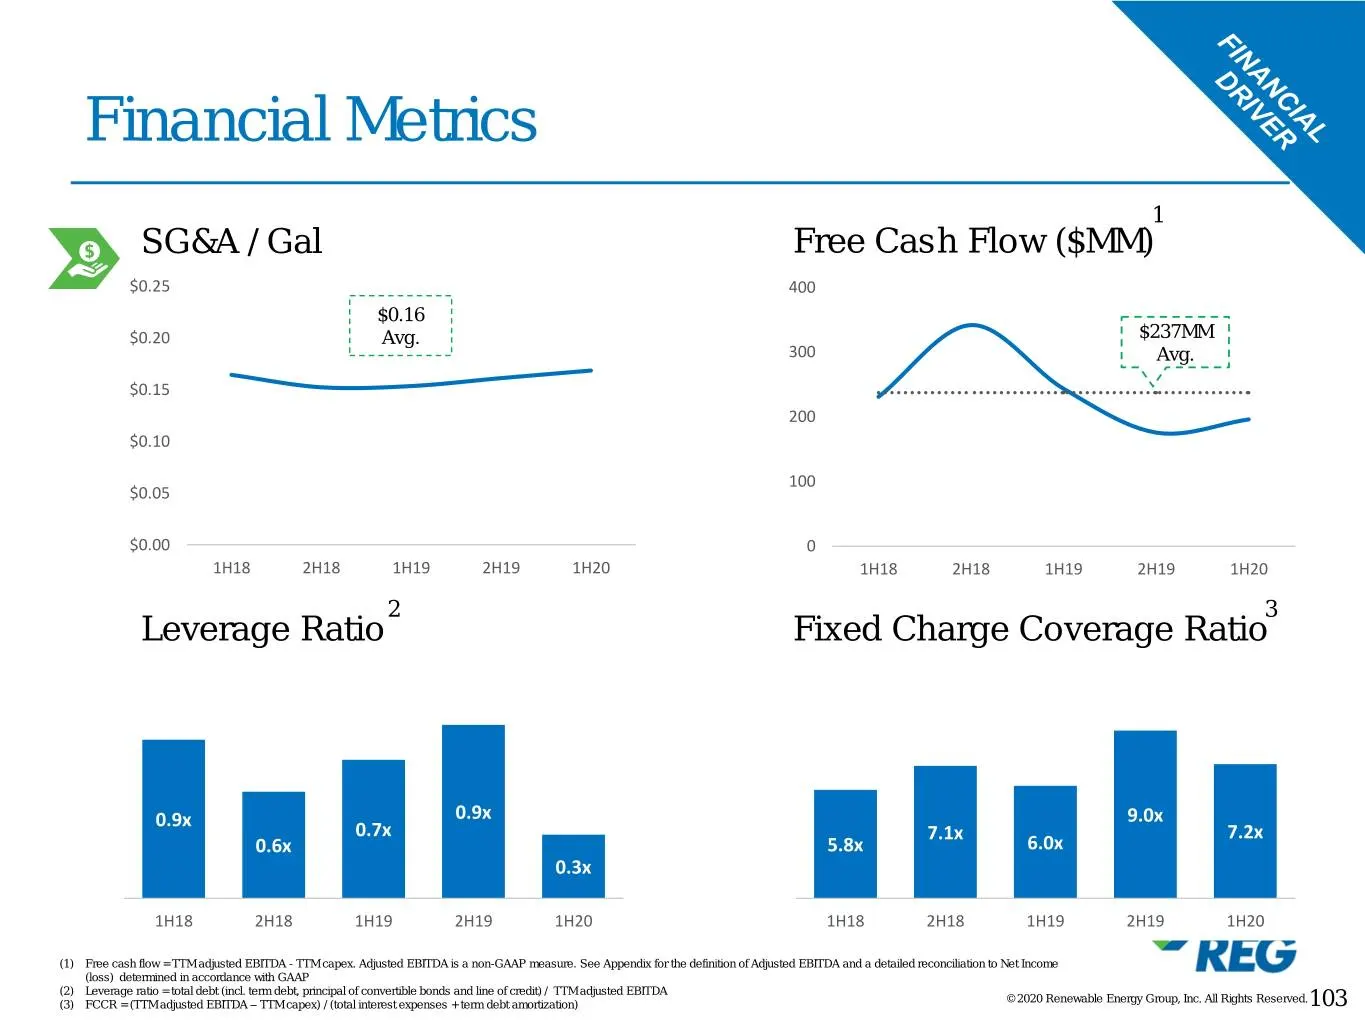
Slide 103: Financial Metrics
Financial Metrics 1 SG&A / Gal Free Cash Flow ($MM) $0.25 400 $0.16 $0.20 Avg. $237MM 300 Avg. $0.15 200 $0.10 100 $0.05 $0.00 0 1H18 2H18 1H19 2H19 1H20 1H18 2H18 1H19 2H19 1H20 2 3 Leverage Ratio Fixed Charge Coverage Ratio 0.9x 0.9x 9.0x 0.7x 7.1x 7.2x 0.6x 5.8x 6.0x 0.3x 1H18 2H18 1H19 2H19 1H20
Slide 104: Key Market Drivers
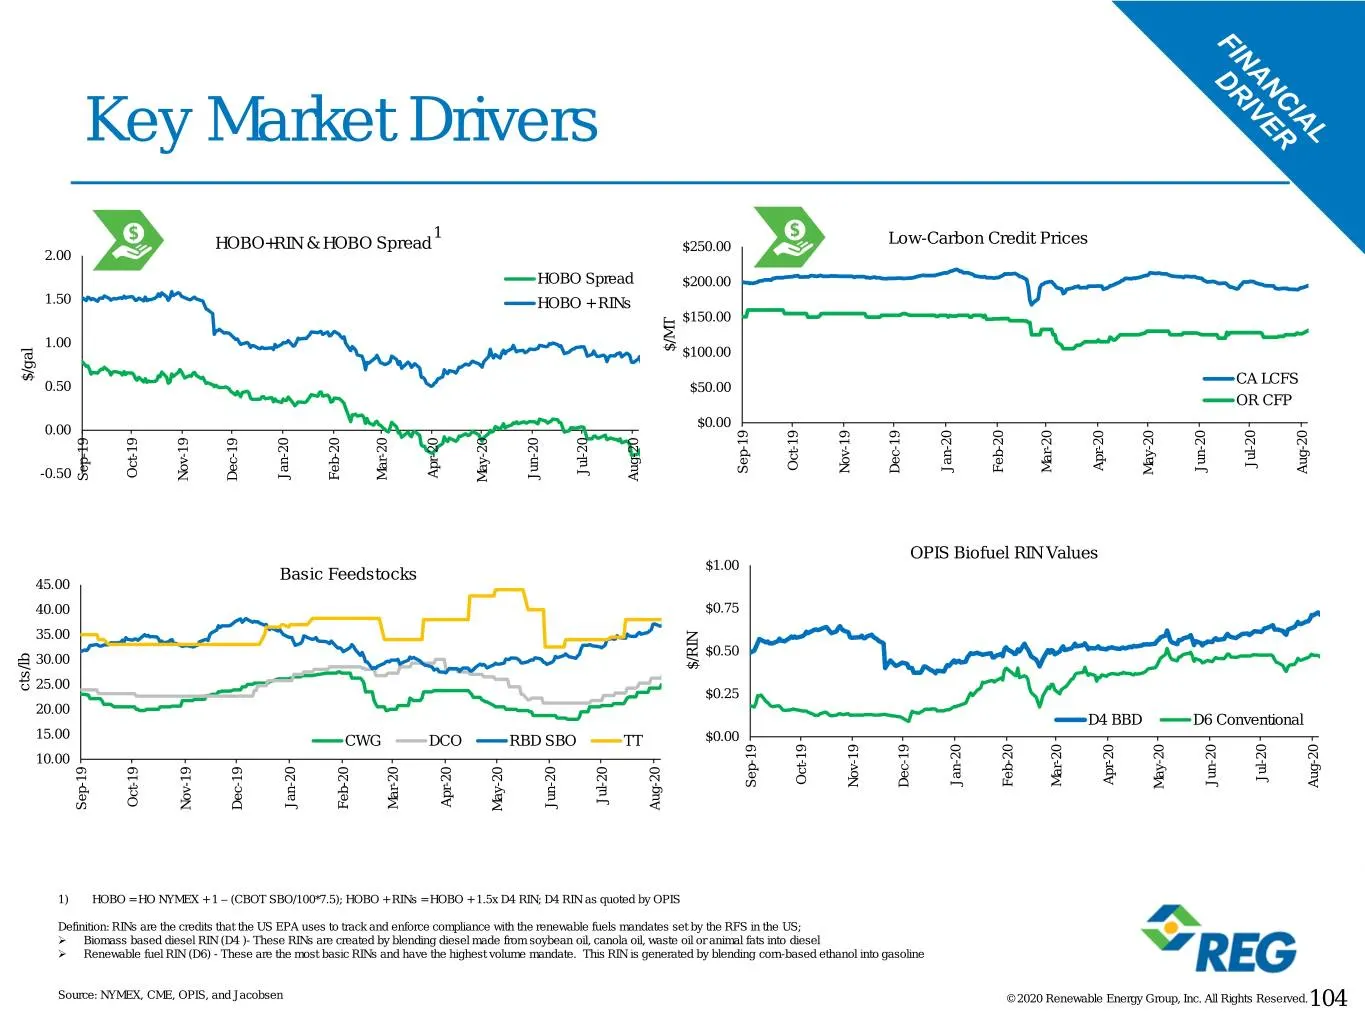
Key Market Drivers 1 Low-Carbon Credit Prices HOBO+RIN & HOBO Spread $250.00 2.00 HOBO Spread $200.00 1.50 HOBO + RINs $150.00 1.00 $/MT $100.00 $/gal CA LCFS 0.50 $50.00 OR CFP $0.00 0.00 Jul-20 Oct-19 Apr-20 Jan-20 Jun-20 Mar-20 Feb-20 Nov-19 Dec-19 Sep-19 Aug-20 Jul-20 May-20 Oct-19 Apr-20 Jan-20
Slide 105: REG YTD Stock Price Performance
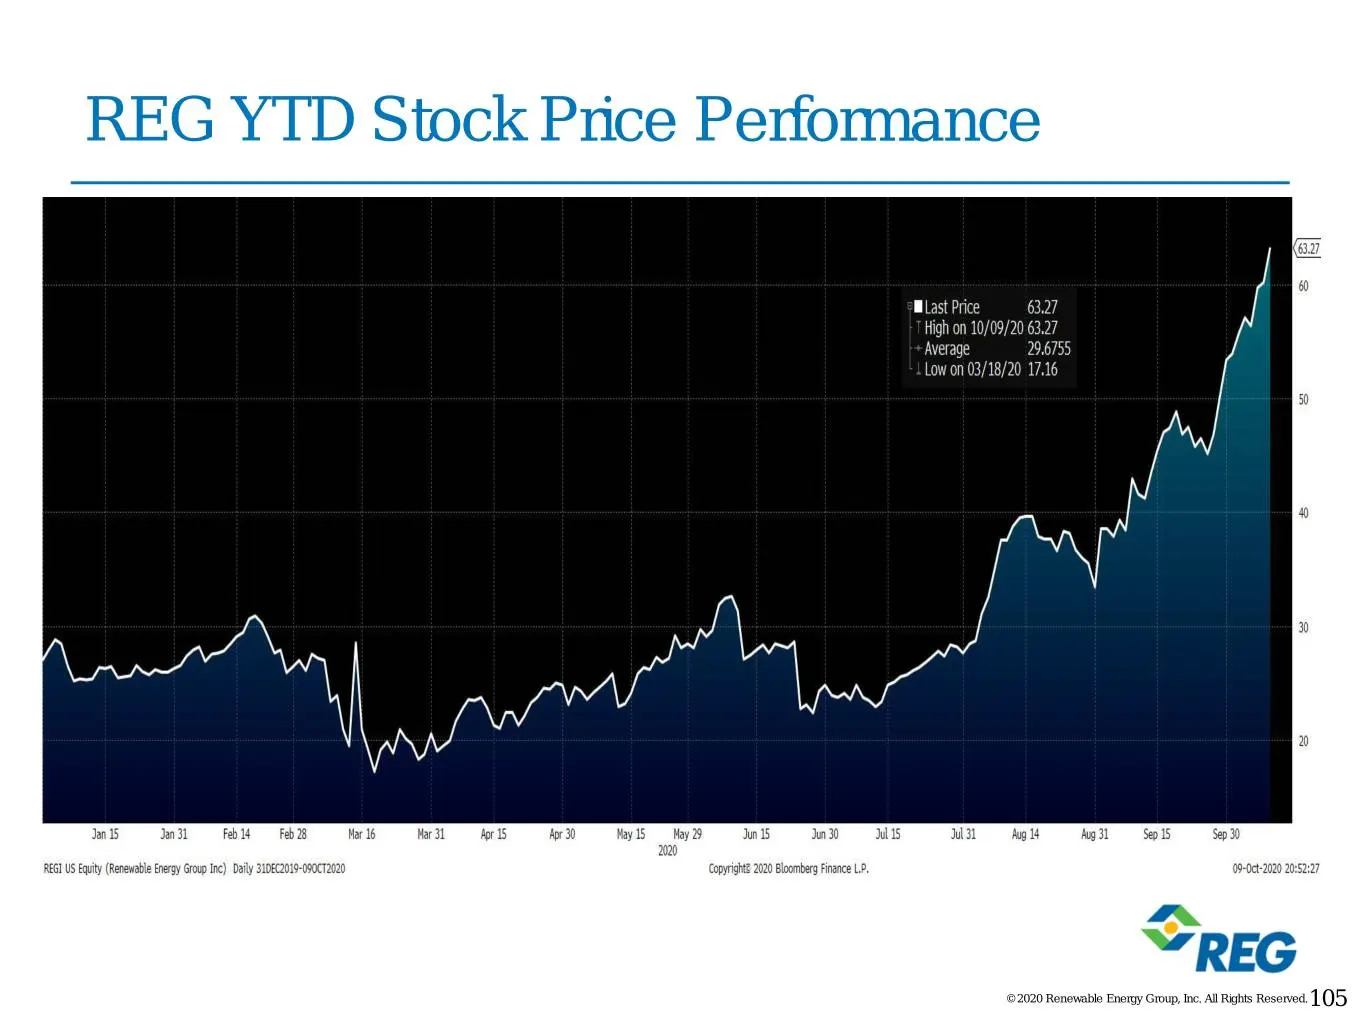
REG YTD Stock Price Performance © 2020 Renewable Energy Group, Inc. All Rights Reserved.105
Slide 106: REG: Right Place, Right Time to Accelerate Meeting Our Purpose
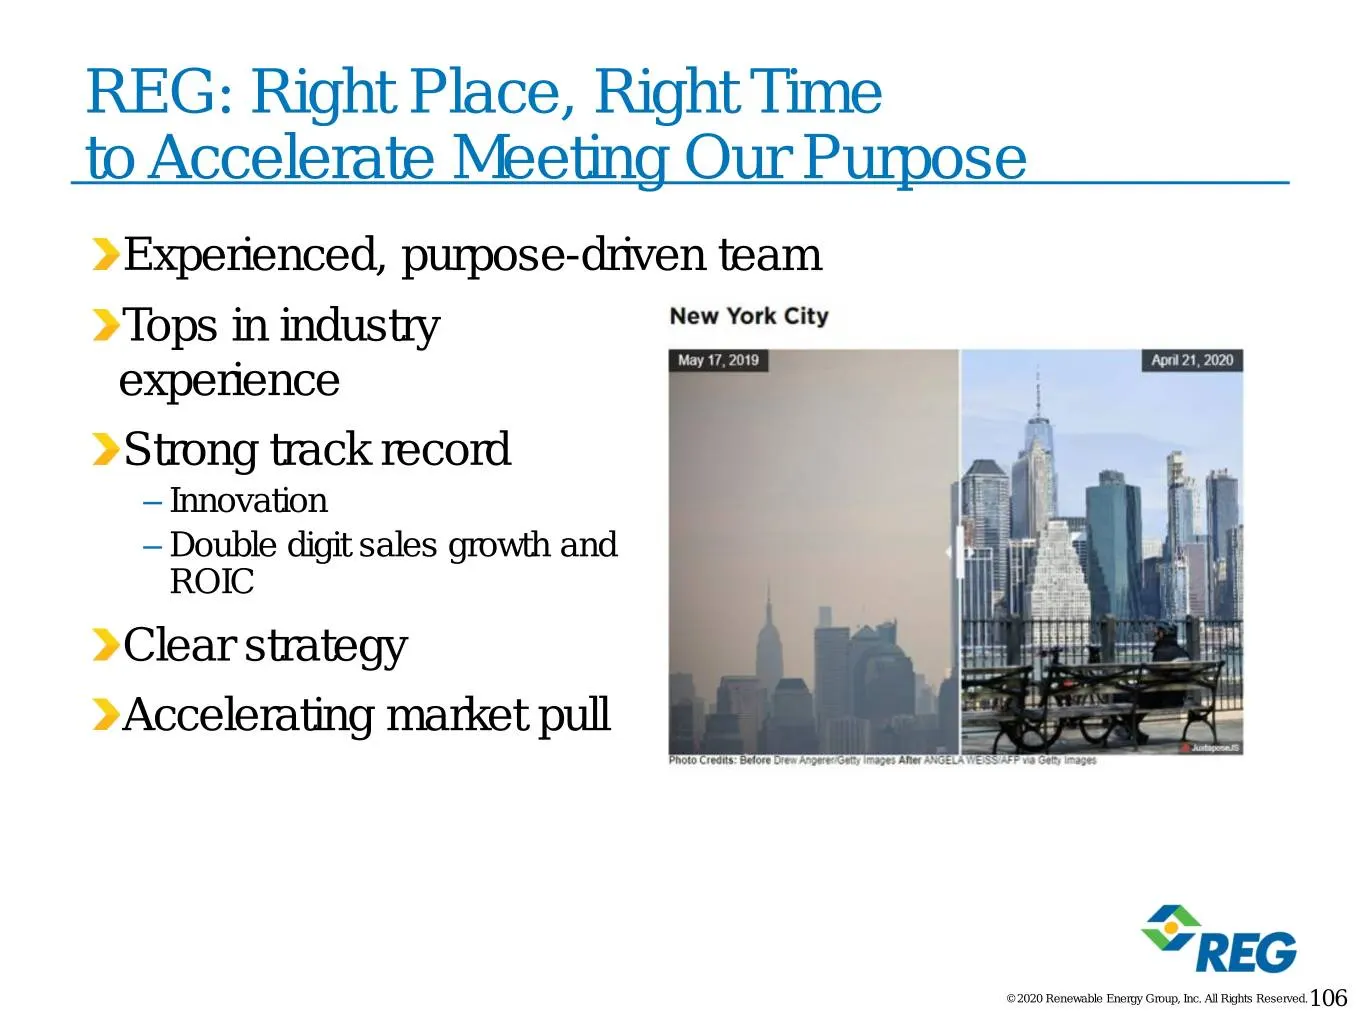
REG: Right Place, Right Time to Accelerate Meeting Our Purpose Experienced, purpose-driven team Tops in industry experience Strong track record – Innovation – Double digit sales growth and ROIC Clear strategy Accelerating market pull © 2020 Renewable Energy Group, Inc. All Rights Reserved.106

Slide 107: Question and Answer Session
Question and Answer Session CYNTHIA (CJ) BRAD NATALIE GARY CHAD WARNER ALBIN MERRILL HAER STONE President & Vice President, Vice President, Vice President, Chief Financial Chief Executive Manufacturing Business Development Special Projects Officer Officer & Optimization ERIC BOWEN TRISHA CONLEY BOB

Slide 108: Appendix
Appendix © 2020 Renewable Energy Group, Inc. All Rights Reserved.108
Slide 109: Adjusted EBITDA Definition
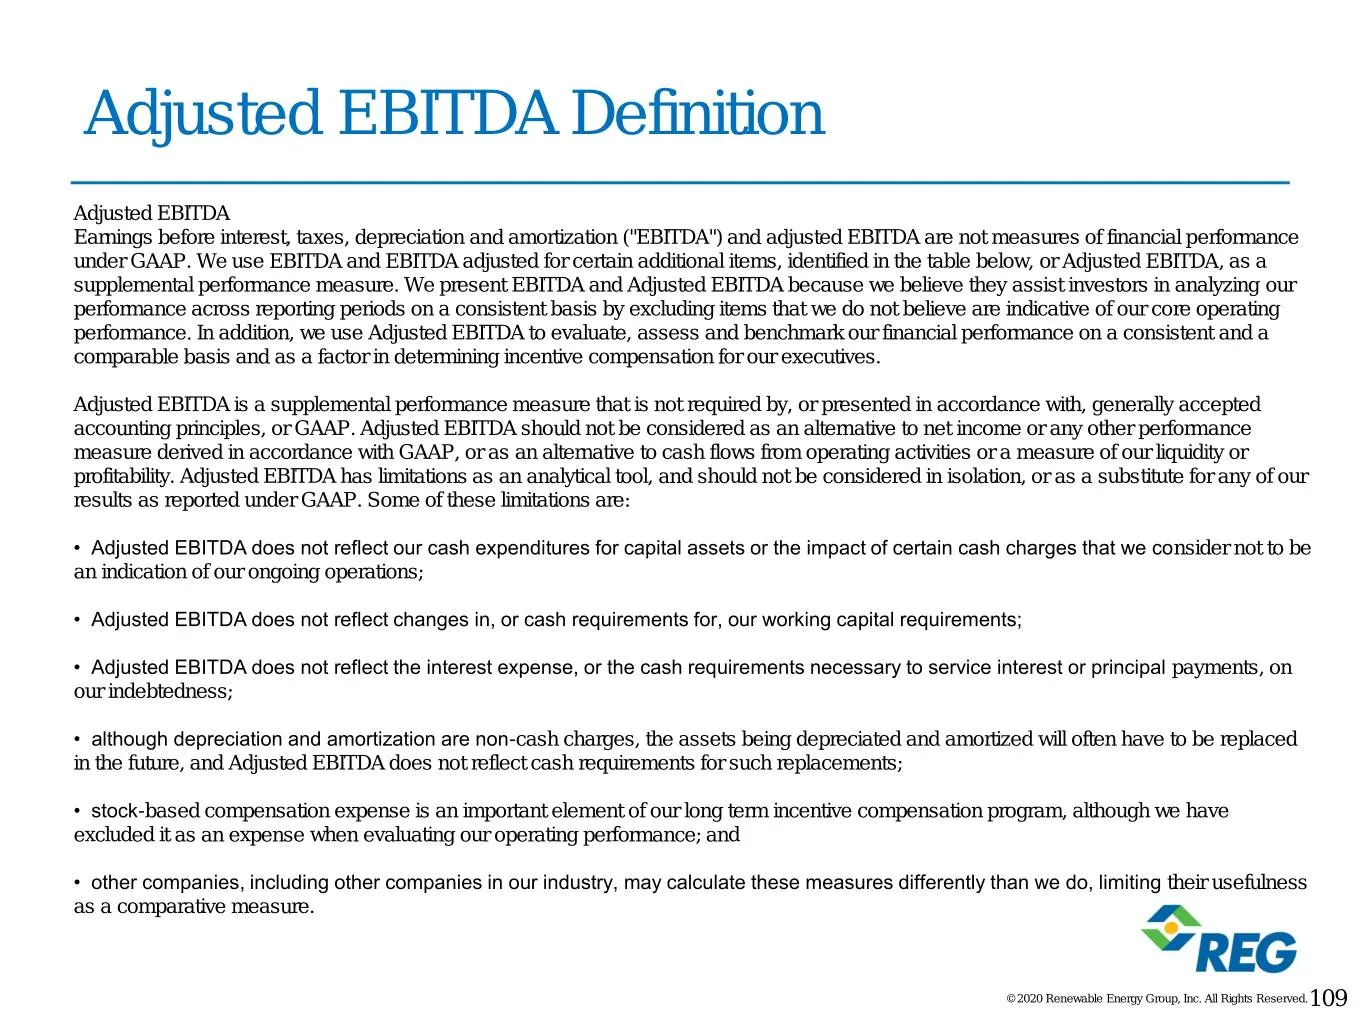
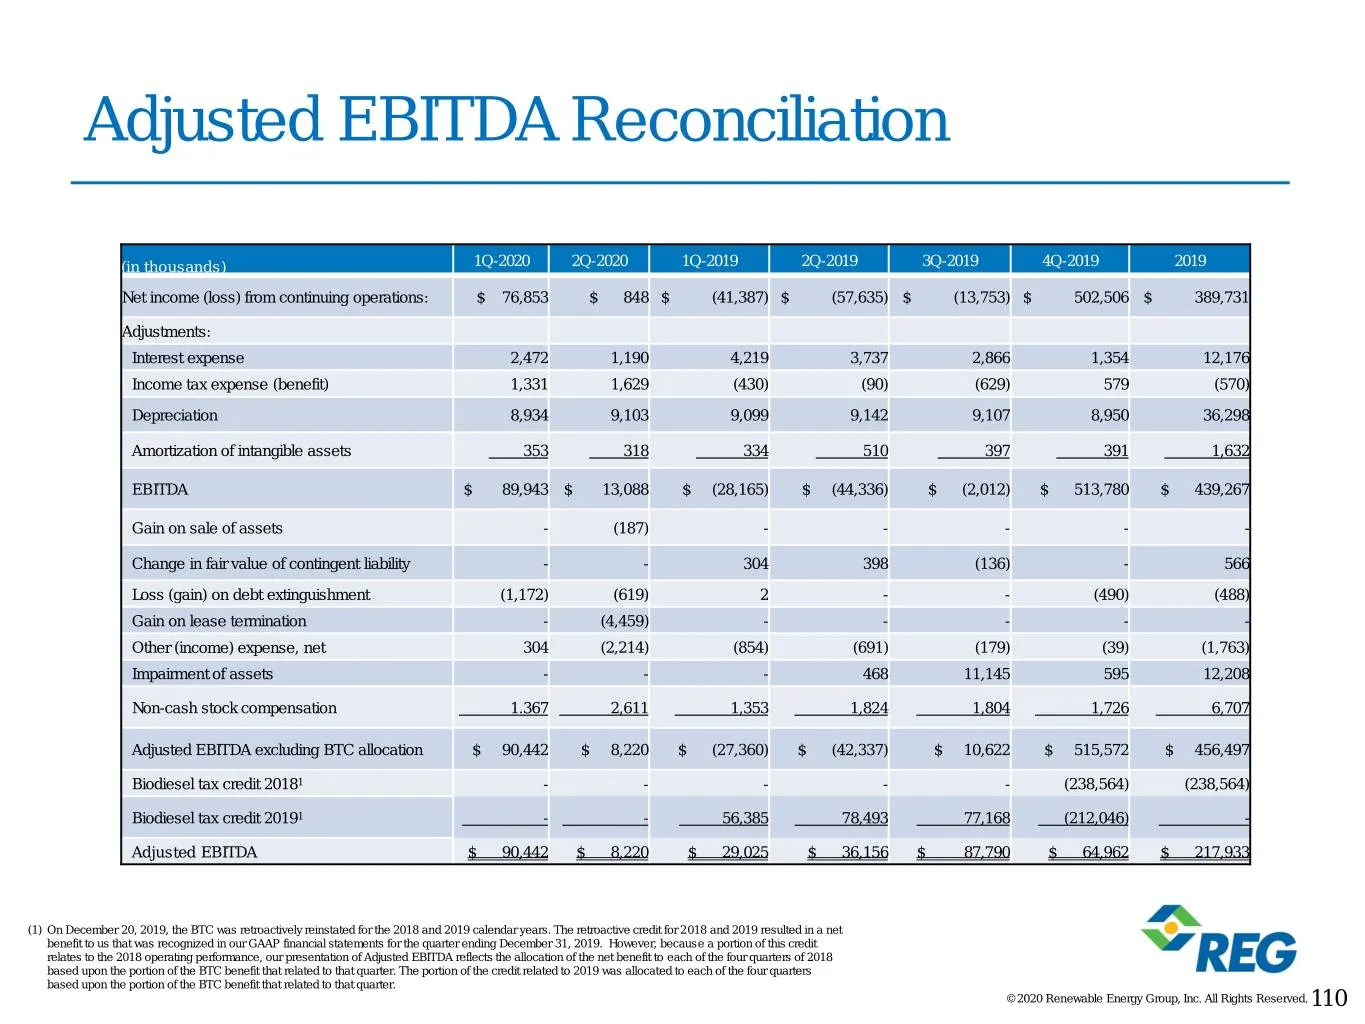
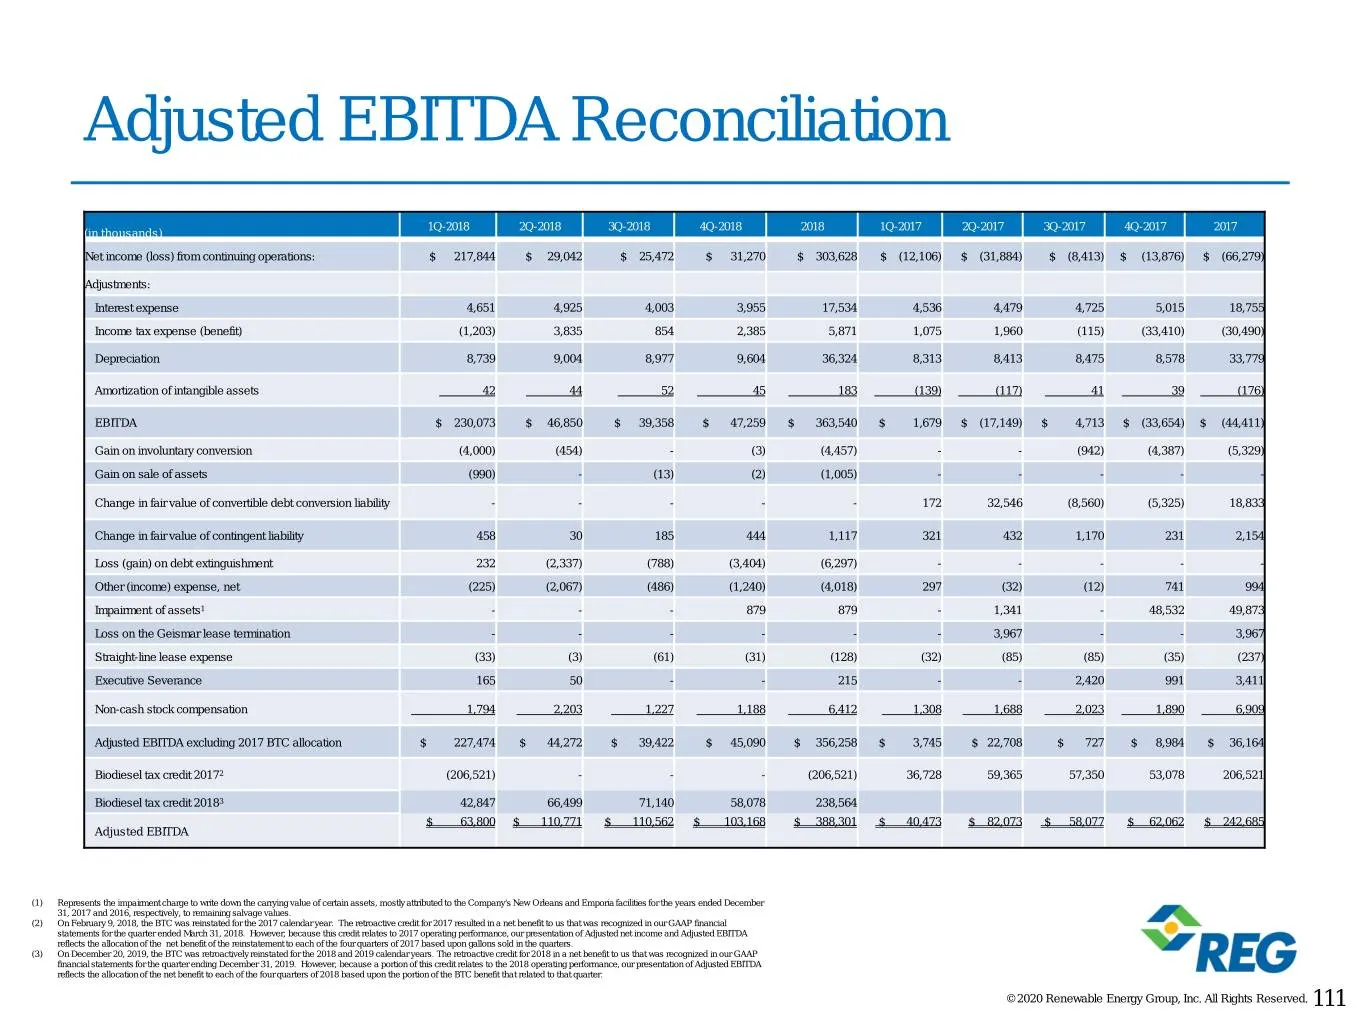
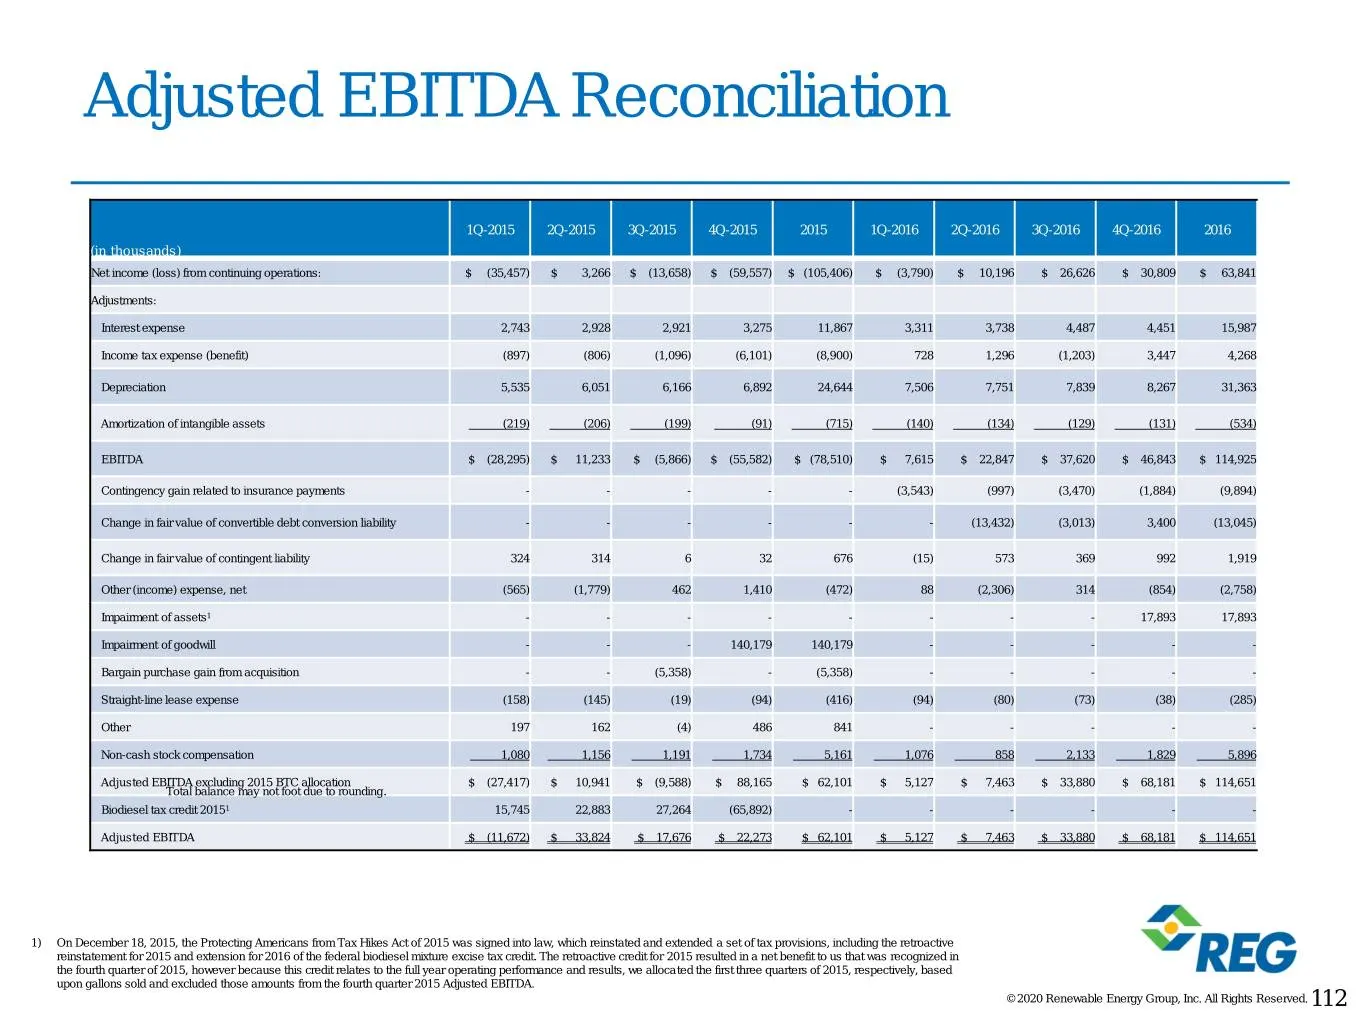
Adjusted EBITDA Definition Adjusted EBITDA Earnings before interest, taxes, depreciation and amortization ("EBITDA") and adjusted EBITDA are not measures of financial performance under GAAP. We use EBITDA and EBITDA adjusted for certain additional items, identified in the table below, or Adjusted EB
Slide 110: Adjusted EBITDA Reconciliation
Adjusted EBITDA Reconciliation (in thousands) 1Q-2020 2Q-2020 1Q-2019 2Q-2019 3Q-2019 4Q-2019 2019 Net income (loss) from continuing operations: $ 76,853 $ 848 $ (41,387) $ (57,635) $ (13,753) $ 502,506 $ 389,731 Adjustments: Interest expense 2,472 1,190 4,219 3,737 2,866 1,354 12,176 Income tax exp
Slide 111: Adjusted EBITDA Reconciliation
Adjusted EBITDA Reconciliation 1Q-2018 2Q-2018 3Q-2018 4Q-2018 2018 1Q-2017 2Q-2017 3Q-2017 4Q-2017 2017 (in thousands) Net income (loss) from continuing operations: $ 217,844 $ 29,042 $ 25,472 $ 31,270 $ 303,628 $ (12,106) $ (31,884) $ (8,413) $ (13,876) $ (66,279) Adjustments: Interest expense 4,6
Slide 112: Adjusted EBITDA Reconciliation
Adjusted EBITDA Reconciliation 1Q-2015 2Q-2015 3Q-2015 4Q-2015 2015 1Q-2016 2Q-2016 3Q-2016 4Q-2016 2016 (in thousands) Net income (loss) from continuing operations: $ (35,457) $ 3,266 $ (13,658) $ (59,557) $ (105,406) $ (3,790) $ 10,196 $ 26,626 $ 30,809 $ 63,841 Adjustments: Interest expense 2,743
Source: SEC EDGAR · 8-K filed Oct 13, 2020