Wheaton Precious Metals Corp · TSX:WPM
Wheaton Precious Metals — Shareholder Meeting (April 2019)
6 slides from Wheaton Precious Metals's shareholder meeting presentation, Apr 5, 2019
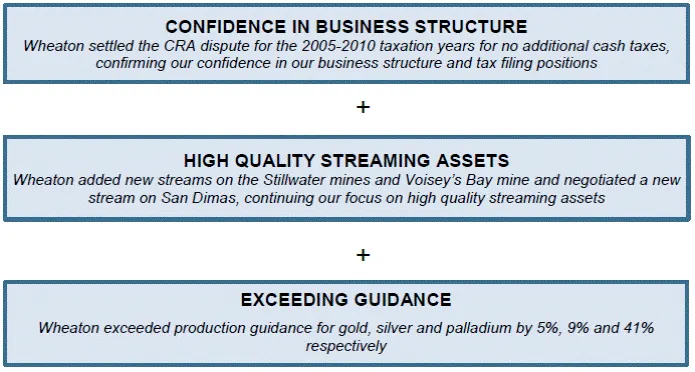
Slide 1: Key Executive Compensation Results (3)
Key Executive Compensation Results (3) Overall executive total compensation increased for 2018 when compared to 2017, reflecting the strong corporate performance for 2018. Key executive compensation results were:
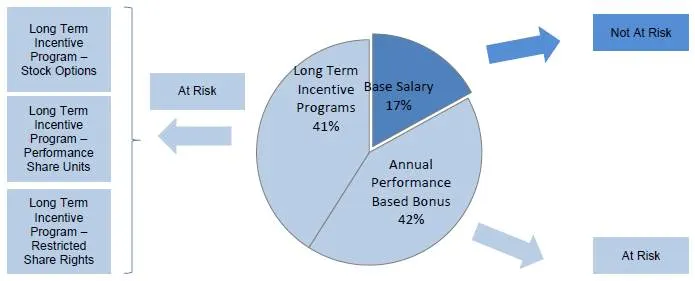
Slide 2: Overview of How Compensation Program Fits with Wheaton Compensation Goals
Overview of How Compensation Program Fits with Wheaton Compensation Goals 1. Attract, Retain and Motivate Key Talent The compensation package meets the goal of attracting, retaining and motivating key talent in a highly competitive mining environment through the following elements:
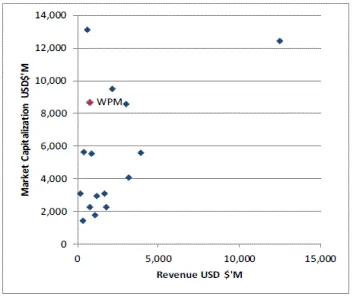
Slide 3: Revenue USD $M
15,000 a Revenue USD $°M.
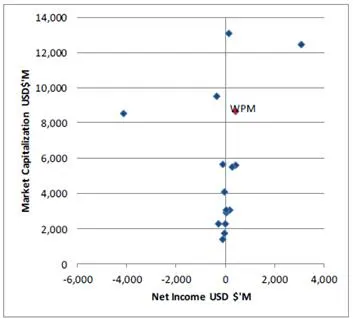
Slide 4: Benchmarking
Benchmarking In arriving at a targeted total compensation package for 2018, the Human Resources Committee generally recommended to the Board that the executive officers receive (i) base salaries that are typically targeted at the 50 th percentile, or average, of the 2017 Comparator Group, and (ii) l
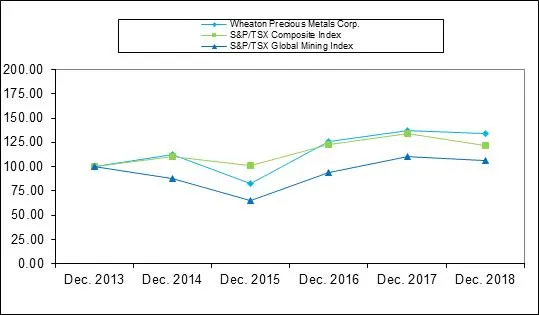
Slide 5: Five-year total shareholder return performance graph
Dec. 2013 Dec. 2014 Dec. 2015 Dec. 2016 Dec. 2017 Dec. 2018 Wheaton Precious Metals Corp. 100.00 112.02 82.59 125.82 137.04 134.04 S&P/TSX Composite Index 100.00 110.55 101.36 122.73 133.89 121.99 S&P/TSX Global Mining Index 100.00 87.84 64.8 93.60 109.91 106.35 The performance graph illustrates tha
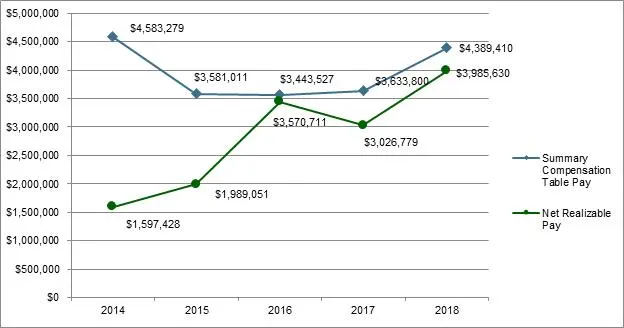
Slide 6: Net realizable pay for the years 2014 through 2018 was significantly less
Net realizable pay for the years 2014 through 2018 was significantly less for most periods than the reported total compensation for the Chief Executive Officer as set out in the Summary Compensation Table as illustrated above. Summary Compensation Table The following table provides information for t
Source: SEC EDGAR · 6-K filed Apr 5, 2019
More decks from Wheaton Precious Metals Corp
 Investor Presentation (November 2026)65 slides · November 2026
 Investor Presentation (September 2026)66 slides · September 2026
 Q2 2026 Earnings Presentation65 slides · Aug 7, 2026
 Q1 2026 Earnings Presentation25 slides · May 8, 2026
 Q4 2025 Earnings Presentation26 slides · Mar 13, 2026
 Investor Presentation (January 2026)67 slides · January 2026