Sanchez Energy — Investor Presentation (February 2018)
36 slides from Sanchez Energy's investor presentation, Feb 1, 2018
Slide 1: Corporate Presentation
Results Driven. Manufacturing Focused. Corporate Presentation February 2018 January 23, 2017 www.sanchezenergycorp.com
Slide 2: Legal Disclaimers
Legal Disclaimers Forward Looking Statements This presentation contains, and our officers and representatives may from time to time make, “forward-looking statements” within the meaning of the safe harbor provisions of the Private Securities Litigation Reform Act of 1995. All statements, other than
Slide 3: Sanchez Energy Premier Eagle Ford Shale Operator
Sanchez Energy Premier Eagle Ford Shale Operator Premier Low Cost Operator in the Eagle Ford Shale Leader In Multi-Zone Eagle Ford Development Contiguous Acreage Position With 15+ Year Drilling Inventory Capital Efficiency Through “Manufacturing” Process Sustainable Business Model Through
Slide 4: Sanchez Energy Overview
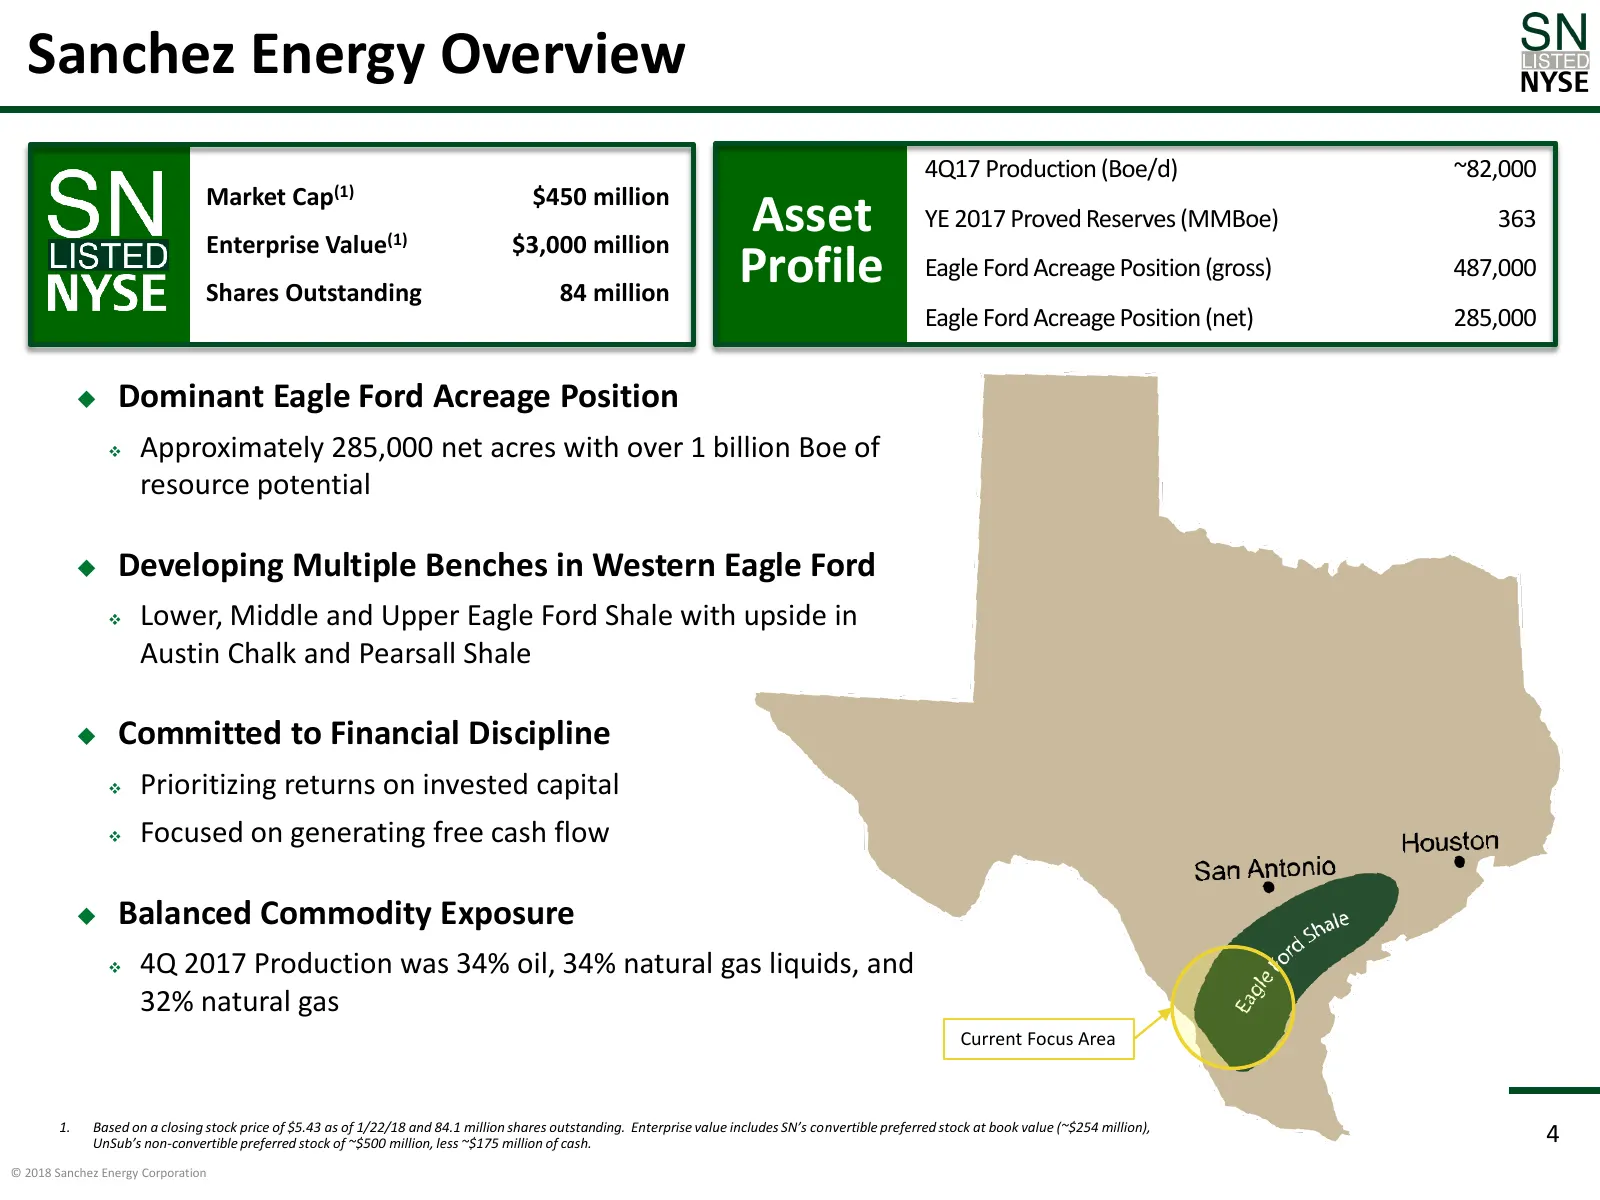
Sanchez Energy Overview 4Q17 Production (Boe/d) ~82,000 Market Cap(1) $450 million Enterprise Value(1) $3,000 million Asset YE 2017 Proved Reserves (MMBoe) 363 Shares Outstanding 84 million Profile Eagle Ford Acreage Position (gross) 487,000 Eagle Ford Acreage Position (net) 285,000 Dominant Eagle
Slide 5: Sanchez Energy's Three-Year Plan
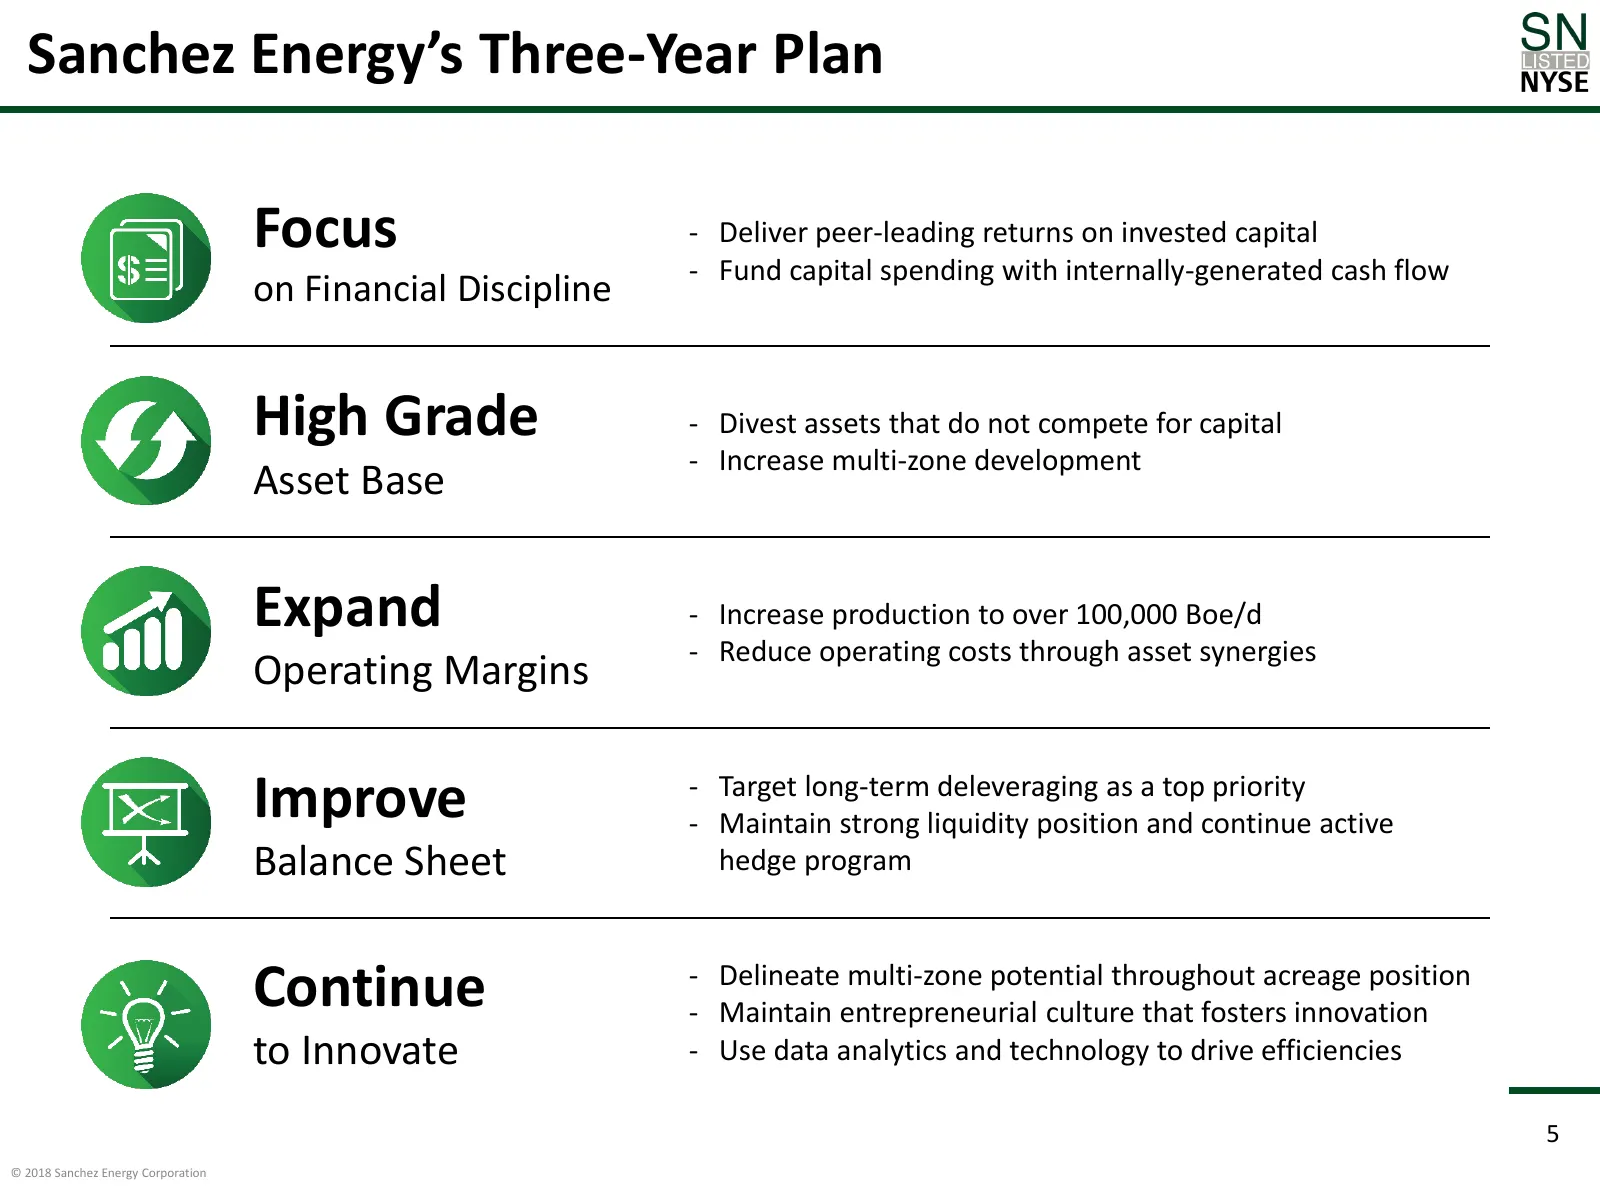
Sanchez Energy’s Three-Year Plan Focus - Deliver peer-leading returns on invested capital - Fund capital spending with internally-generated cash flow on Financial Discipline High Grade - Divest assets that do not compete for capital - Increase multi-zone development Asset Base Expand - Increase prod
Slide 6: Efficient Production Growth
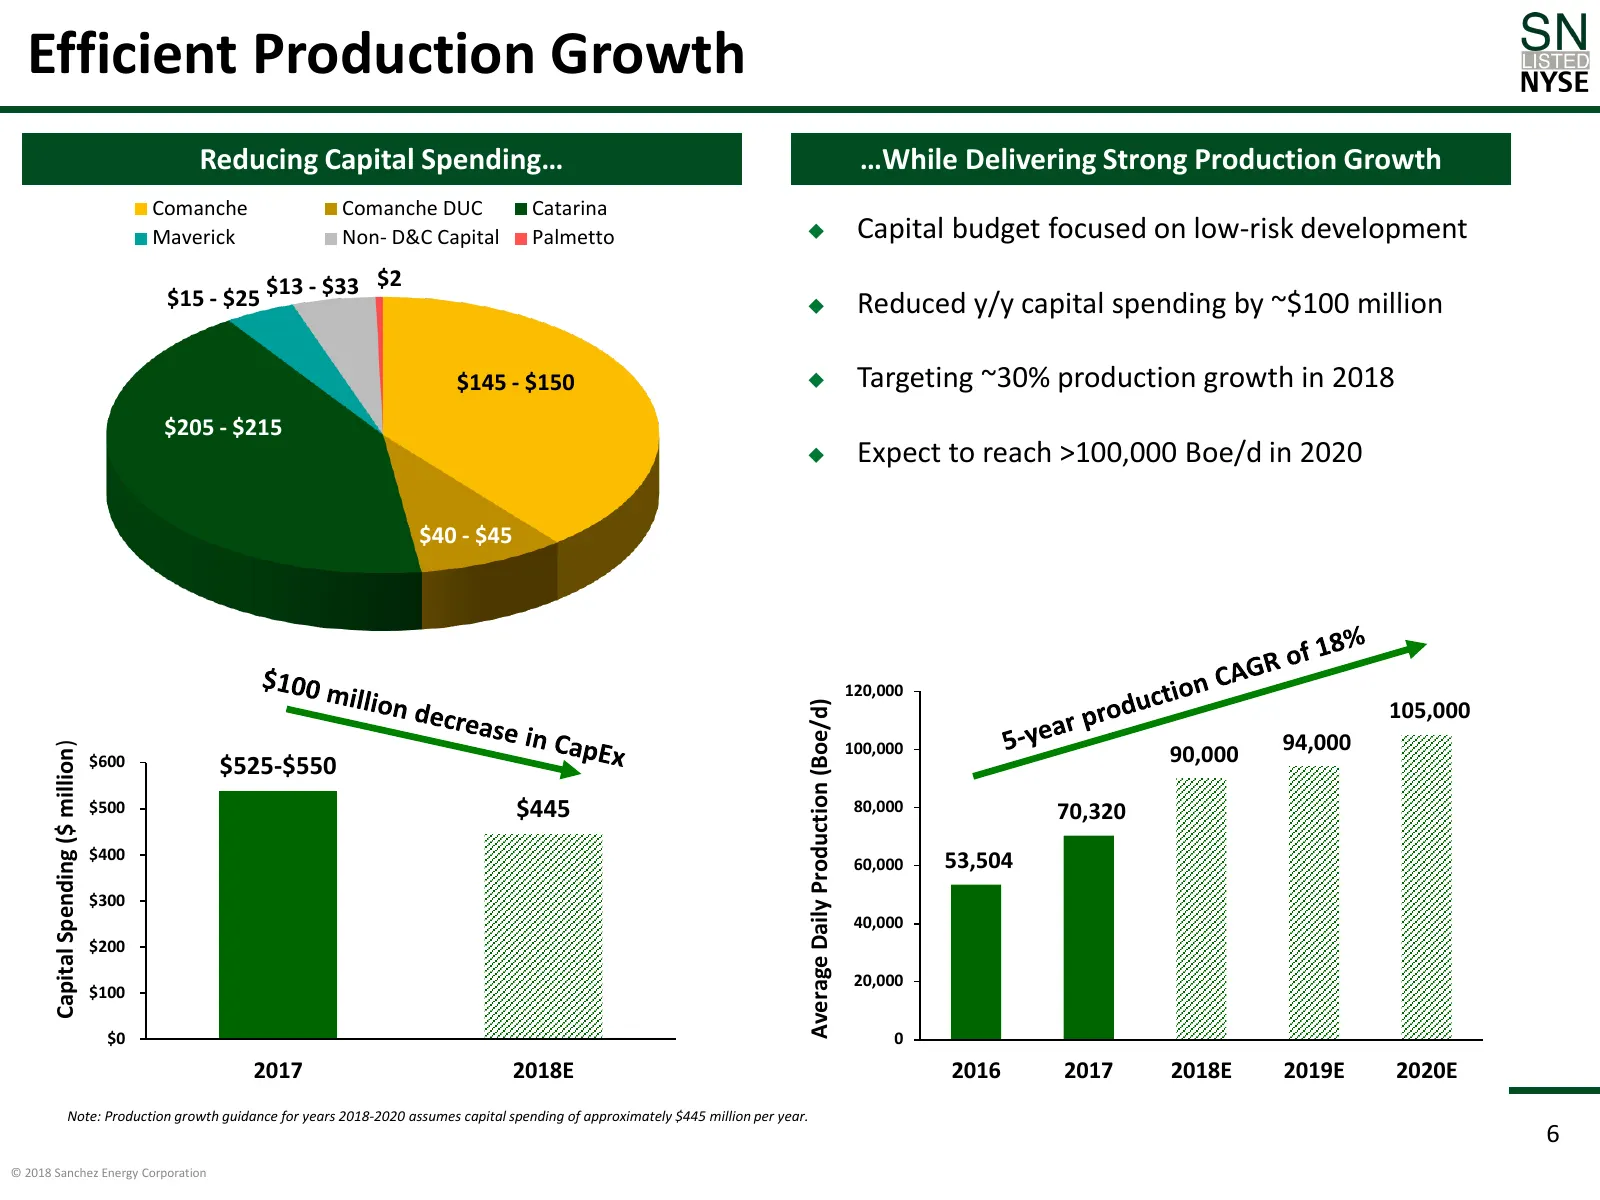
Efficient Production Growth Reducing Capital Spending… …While Delivering Strong Production Growth Comanche Comanche DUC Catarina Maverick Non- D&C Capital Palmetto Capital budget focused on low-risk development $2 $15 - $25 $13 - $33 Reduced y/y capital spending by ~$100 million $145 - $150 Ta
Slide 7: Western Eagle Ford Focus
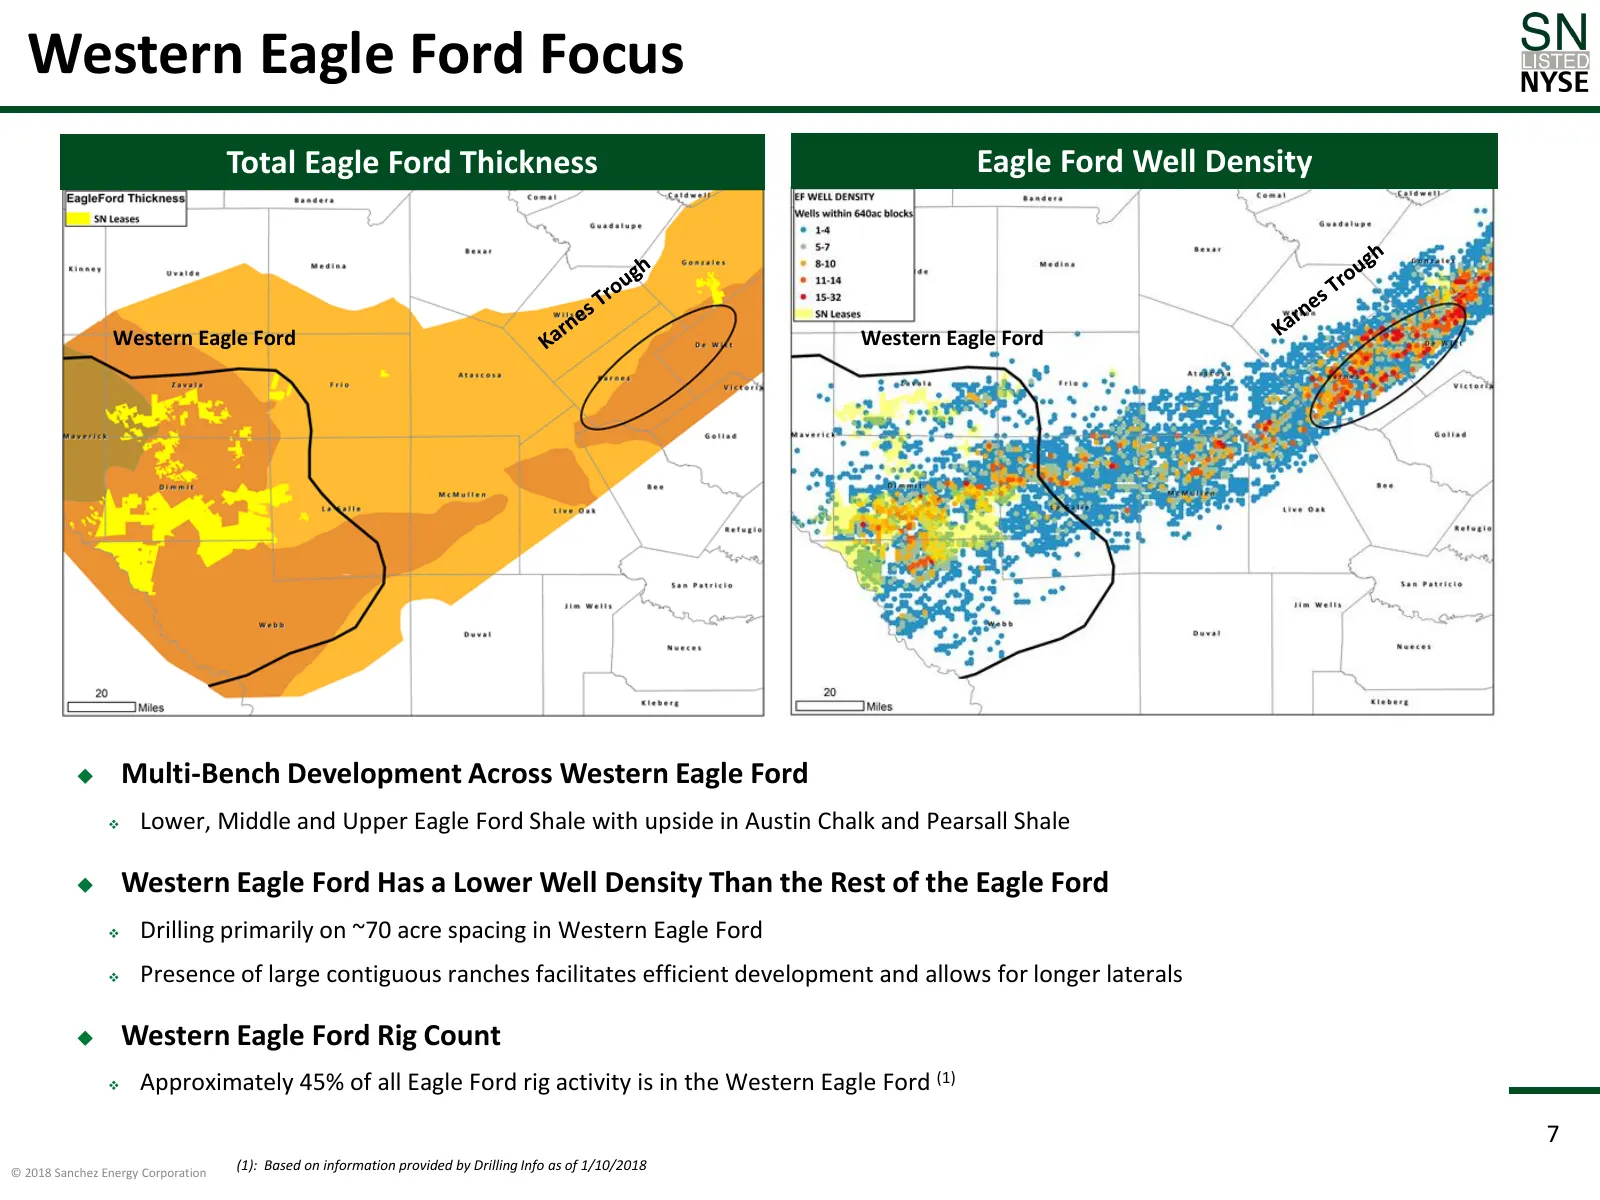
Western Eagle Ford Focus Total Eagle Ford Thickness Eagle Ford Well Density Western Eagle Ford Western Eagle Ford Multi-Bench Development Across Western Eagle Ford ❖ Lower, Middle and Upper Eagle Ford Shale with upside in Austin Chalk and Pearsall Shale Western Eagle Ford Has a Lower Well Densit
Slide 8: High Quality, Concentrated Acreage Position
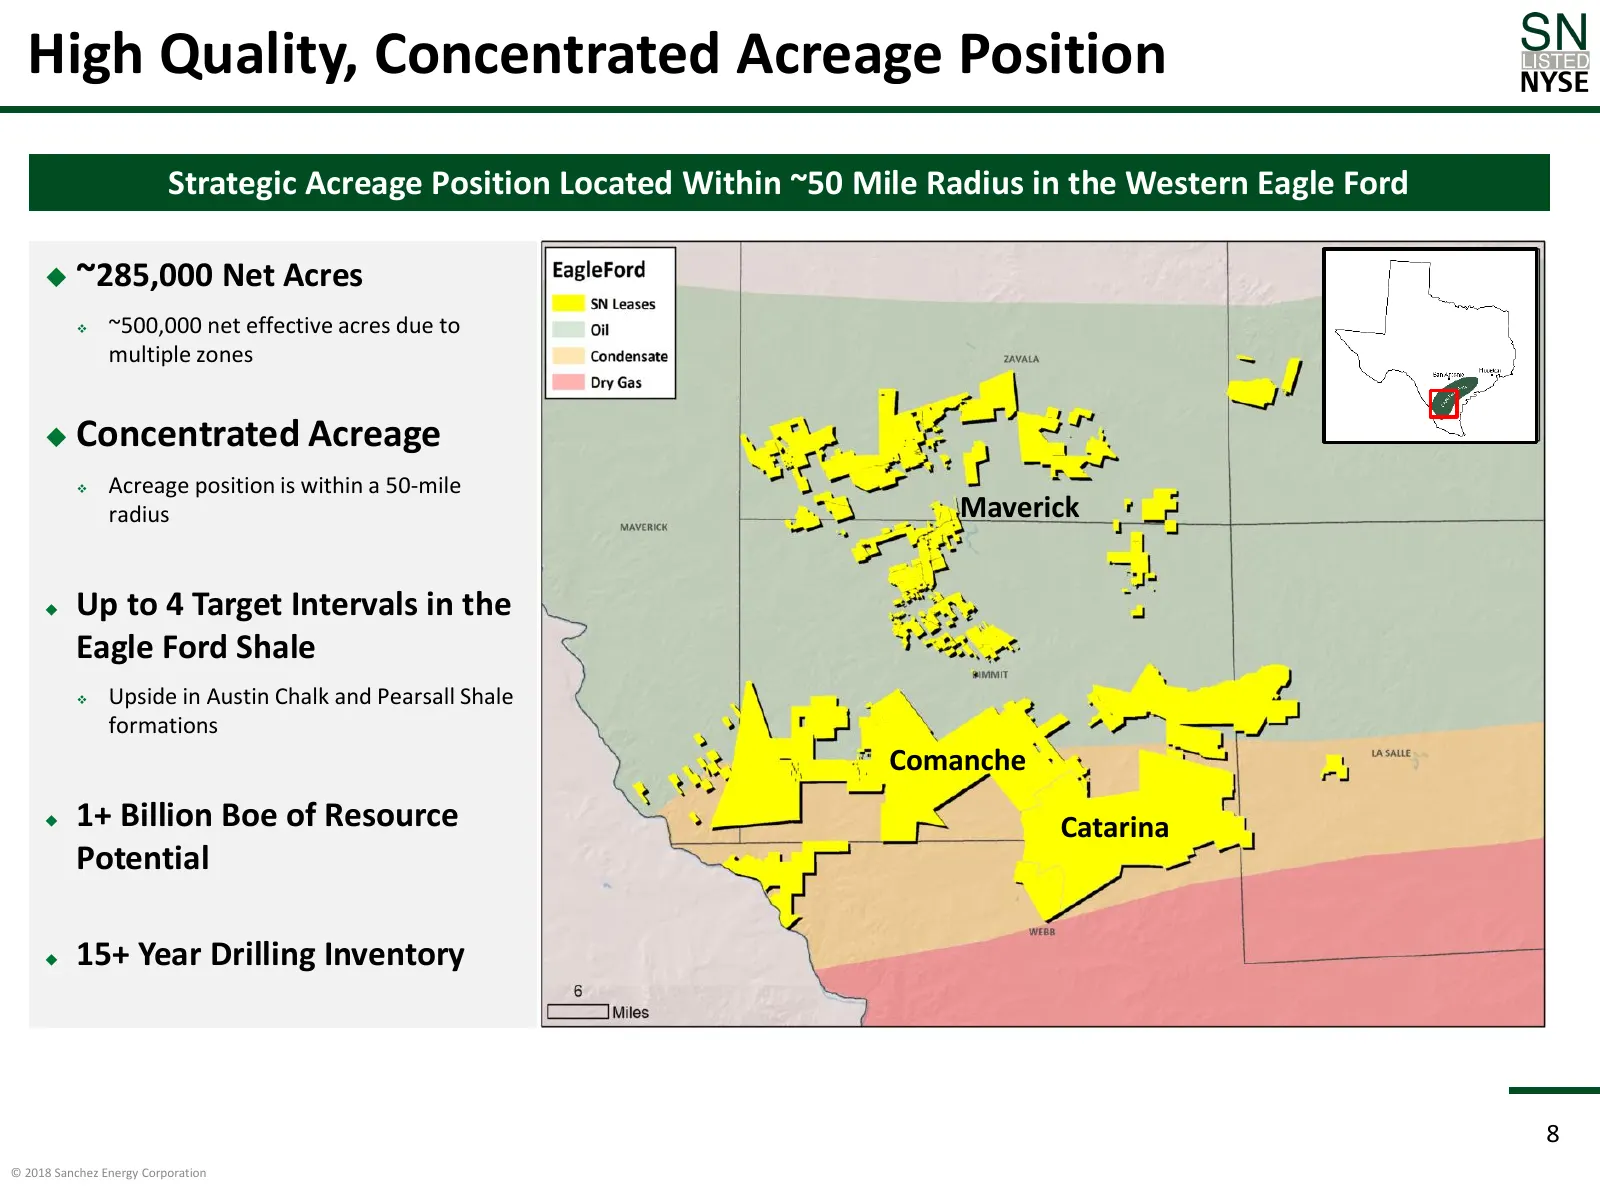
High Quality, Concentrated Acreage Position Strategic Acreage Position Located Within ~50 Mile Radius in the Western Eagle Ford ~285,000 Net Acres ❖ ~500,000 net effective acres due to multiple zones Concentrated Acreage ❖ Acreage position is within a 50-mile radius Maverick Up to 4 Target Int
Slide 9: High Return, Repeatable Drilling Inventory
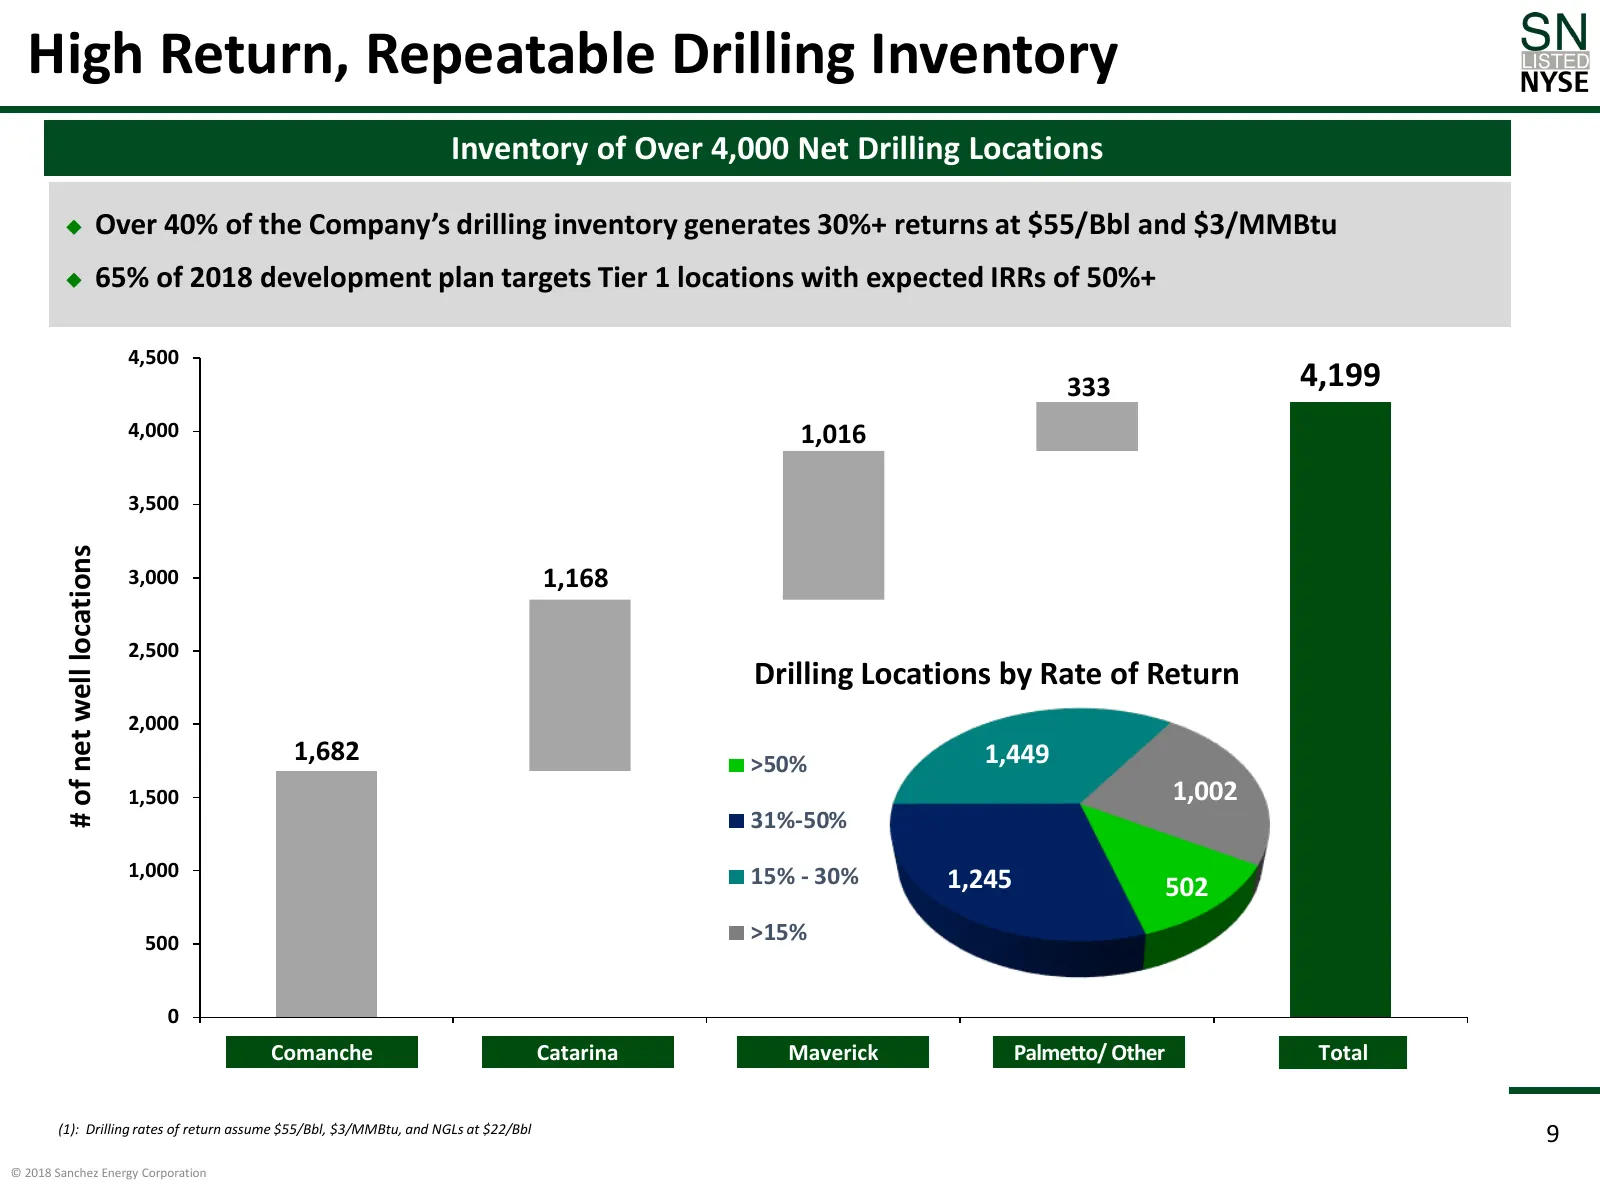
High Return, Repeatable Drilling Inventory Inventory of Over 4,000 Net Drilling Locations Over 40% of the Company’s drilling inventory generates 30%+ returns at $55/Bbl and $3/MMBtu 65% of 2018 development plan targets Tier 1 locations with expected IRRs of 50%+ 4,500 333 4,199 4,000 1,016 3,500
Slide 10: Western Eagle Ford Multi-Bench Development
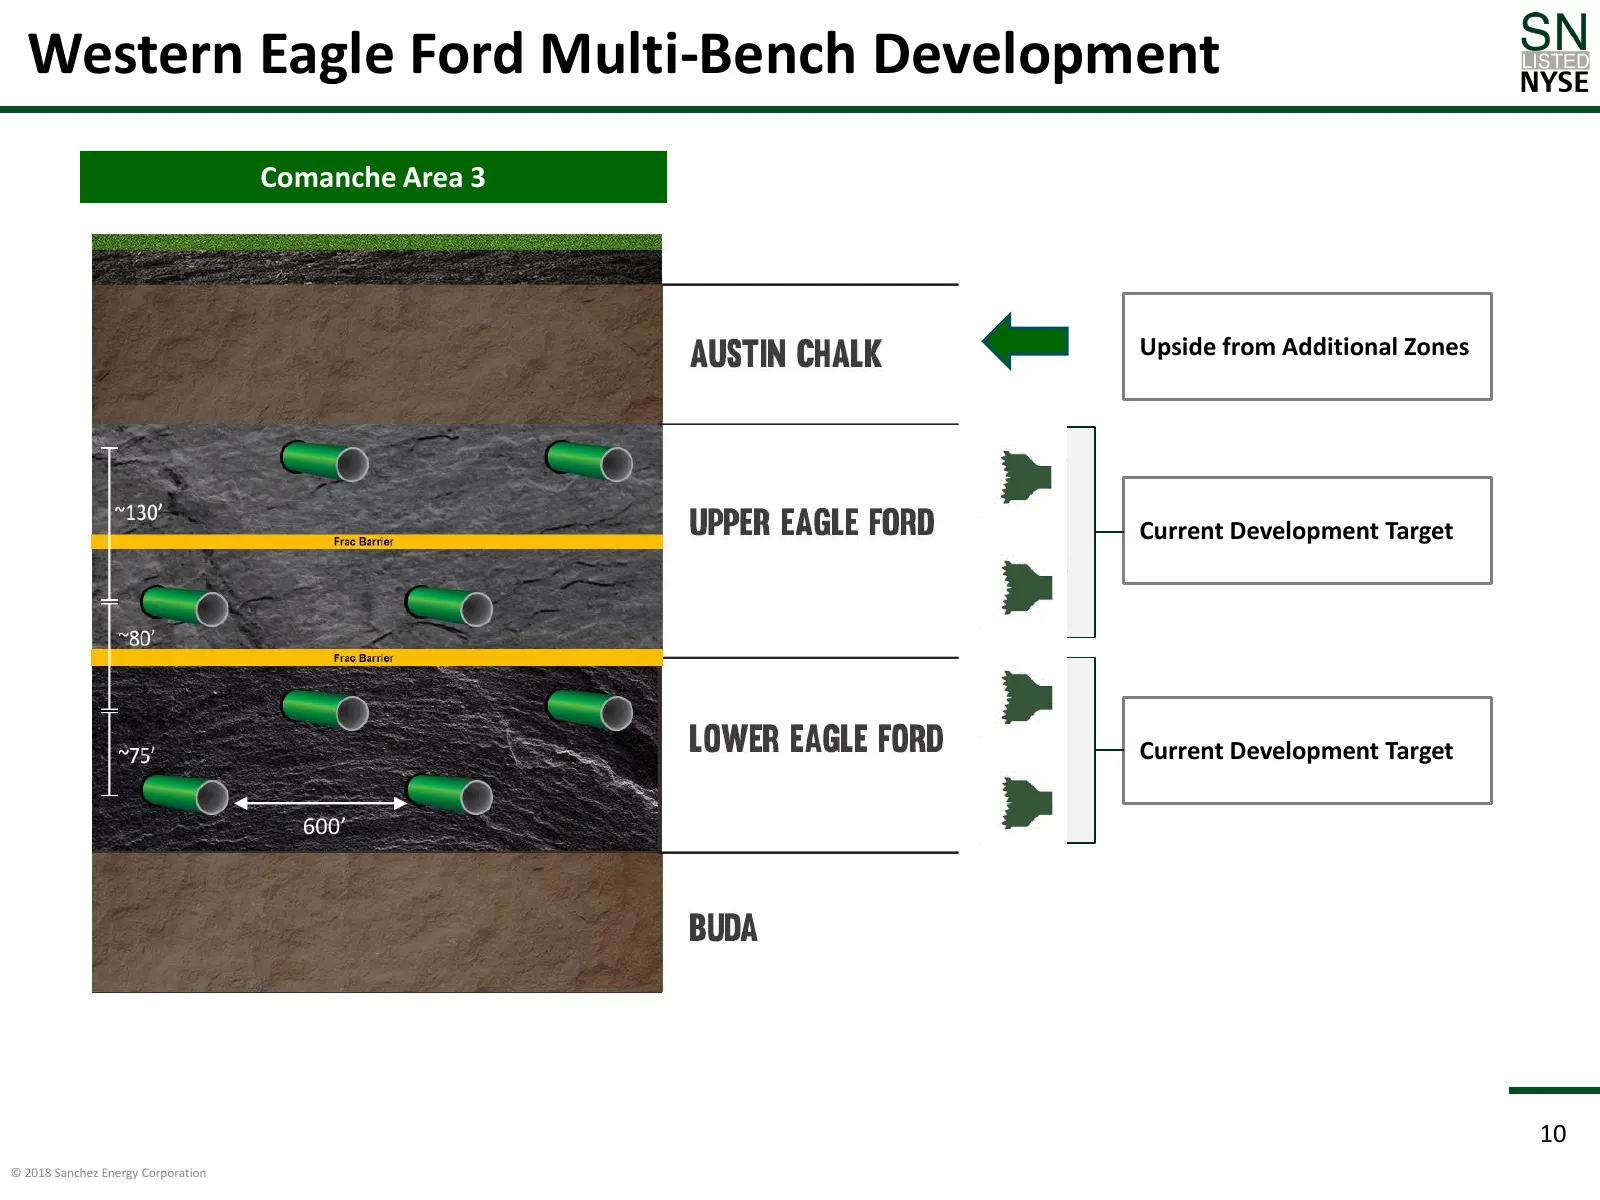
Western Eagle Ford Multi-Bench Development Comanche Area 3 Upside from Additional Zones Current Development Target Current Development Target 600’ 10 © 2018 Sanchez Energy Corporation
Slide 11: Positive Impact of Longer Laterals
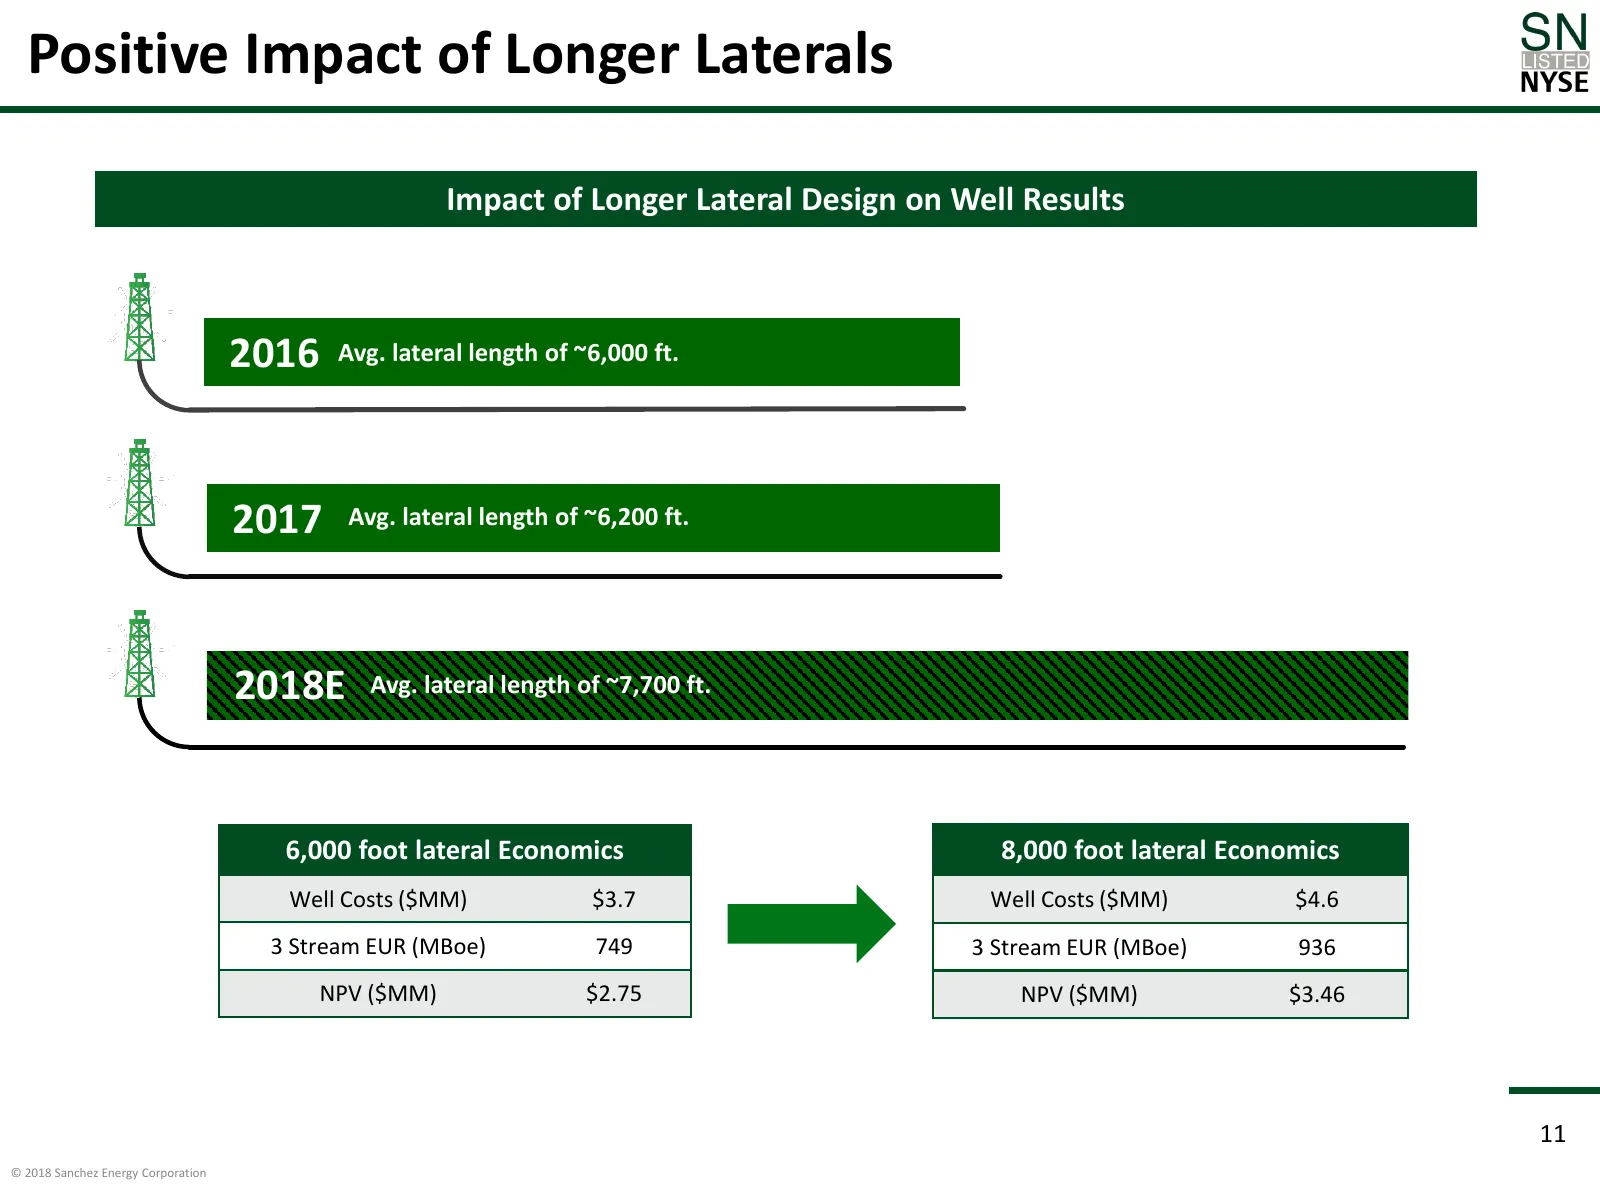
Positive Impact of Longer Laterals Impact of Longer Lateral Design on Well Results 2016 Avg. lateral length of ~6,000 ft. 2017 Avg. lateral length of ~6,200 ft. 2018E 2018E Avg. lateral length of ~7,700 ft. 6,000 foot lateral Economics 8,000 foot lateral Economics Well Costs ($MM) $3.7 Well Costs ($
Slide 12: Cost Structure Compared to Eagle Ford Peers
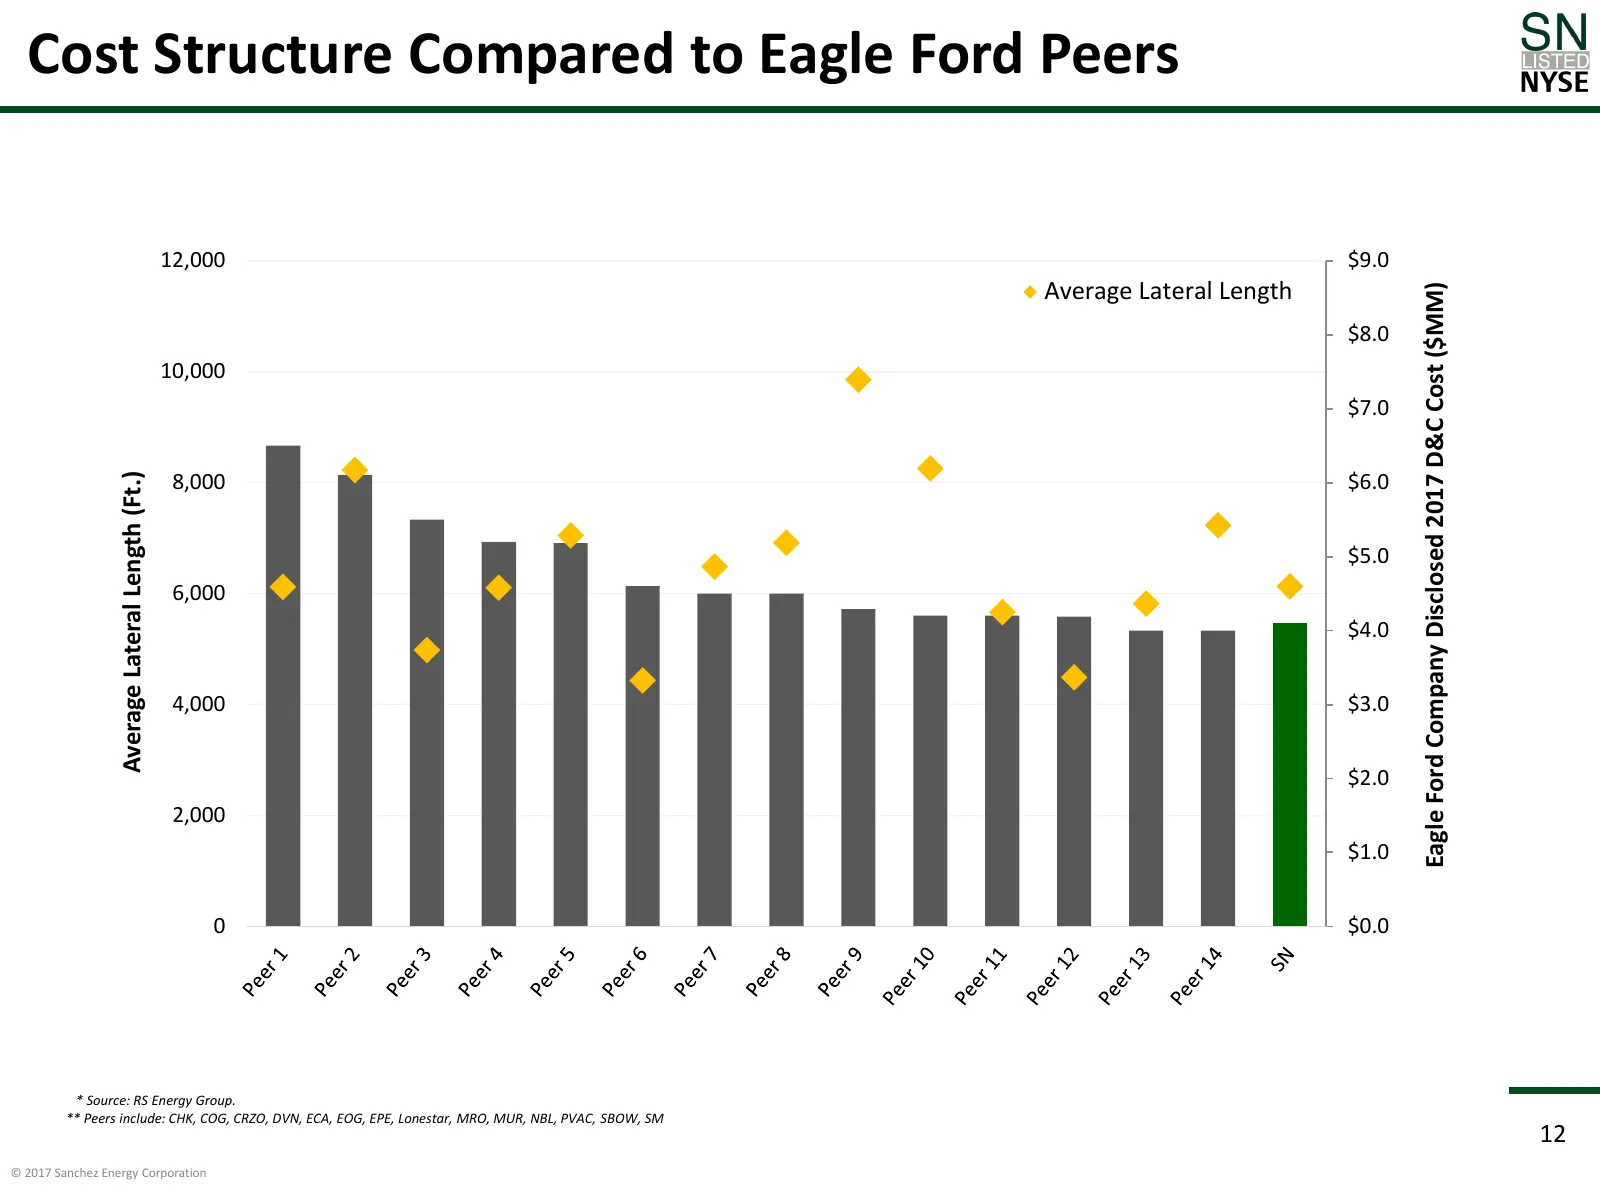
Cost Structure Compared to Eagle Ford Peers 12,000 $9.0 Average Lateral Length Eagle Ford Company Disclosed 2017 D&C Cost ($MM) $8.0 10,000 $7.0 Average Lateral Length (Ft.) 8,000 $6.0 $5.0 6,000 $4.0 4,000 $3.0 $2.0 2,000 $1.0 0 $0.0 * Source: RS Energy Group. ** Peers include: CHK, COG, CRZO, DVN,
Slide 13: Comanche Well Results to Date
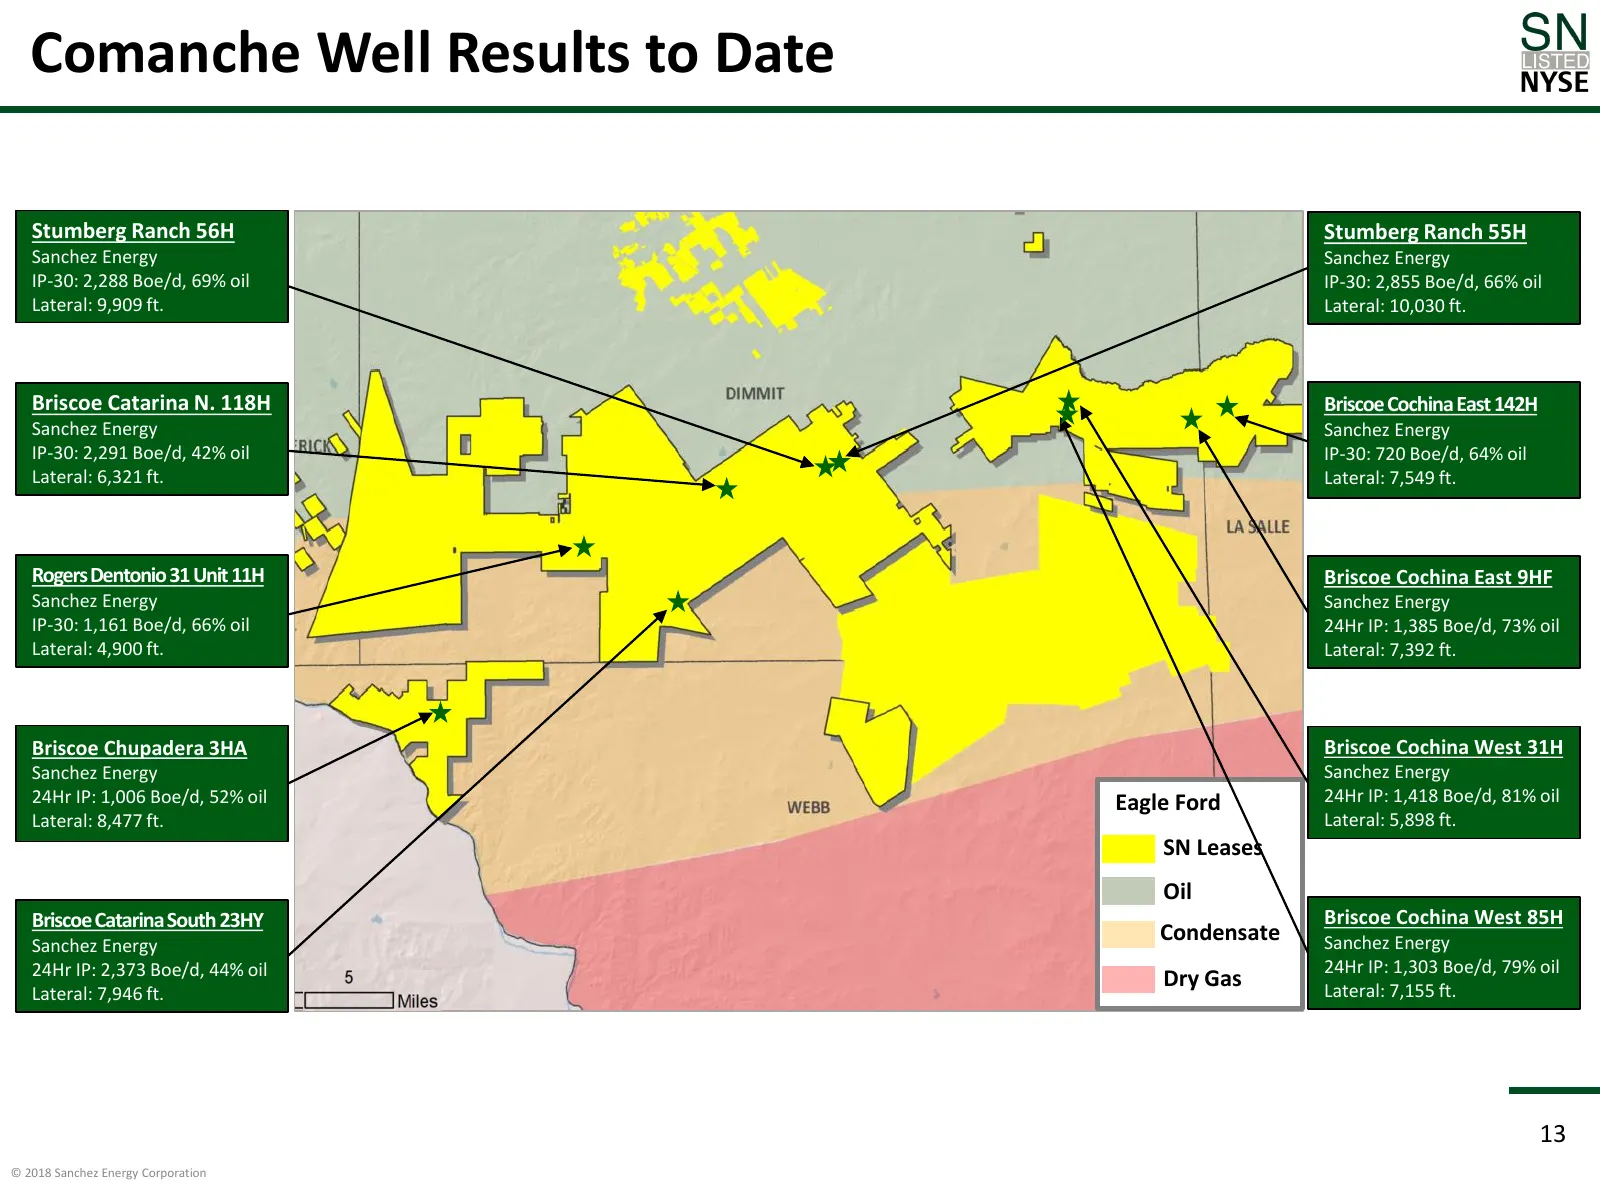
Comanche Well Results to Date Stumberg Ranch 56H Stumberg Ranch 55H Sanchez Energy Sanchez Energy IP-30: 2,288 Boe/d, 69% oil IP-30: 2,855 Boe/d, 66% oil Lateral: 9,909 ft. Lateral: 10,030 ft. Briscoe Catarina N. 118H Briscoe Cochina East 142H Sanchez Energy Sanchez Energy IP-30: 2,291 Boe/d, 42% oi
Slide 14: Comanche: Area 3 Overview
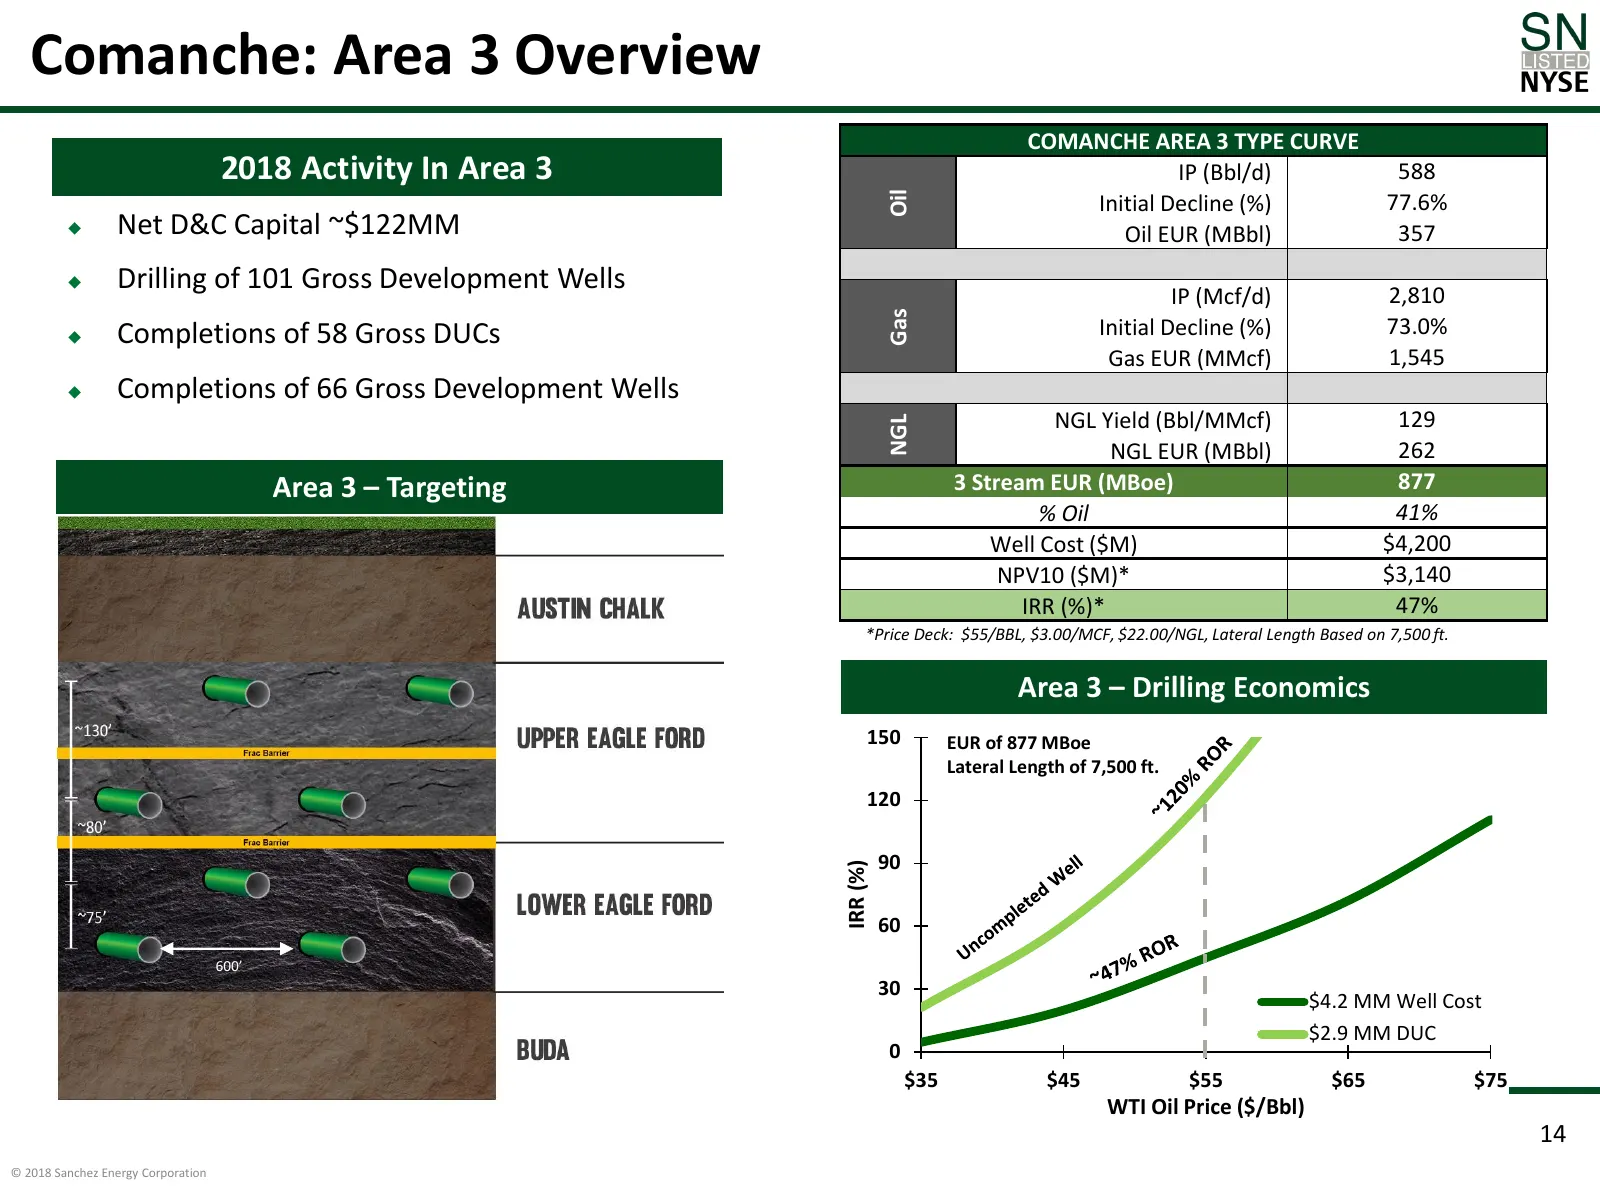
Comanche: Area 3 Overview COMANCHE AREA 3 TYPE CURVE 2018 Activity In Area 3 IP (Bbl/d) 588 Oil Initial Decline (%) 77.6% Net D&C Capital ~$122MM Oil EUR (MBbl) 357 Drilling of 101 Gross Development Wells IP (Mcf/d) 2,810 Gas Completions of 58 Gross DUCs Initial Decline (%) 73.0% Gas EUR (MMcf
Slide 15: Comanche: Area 5 Overview
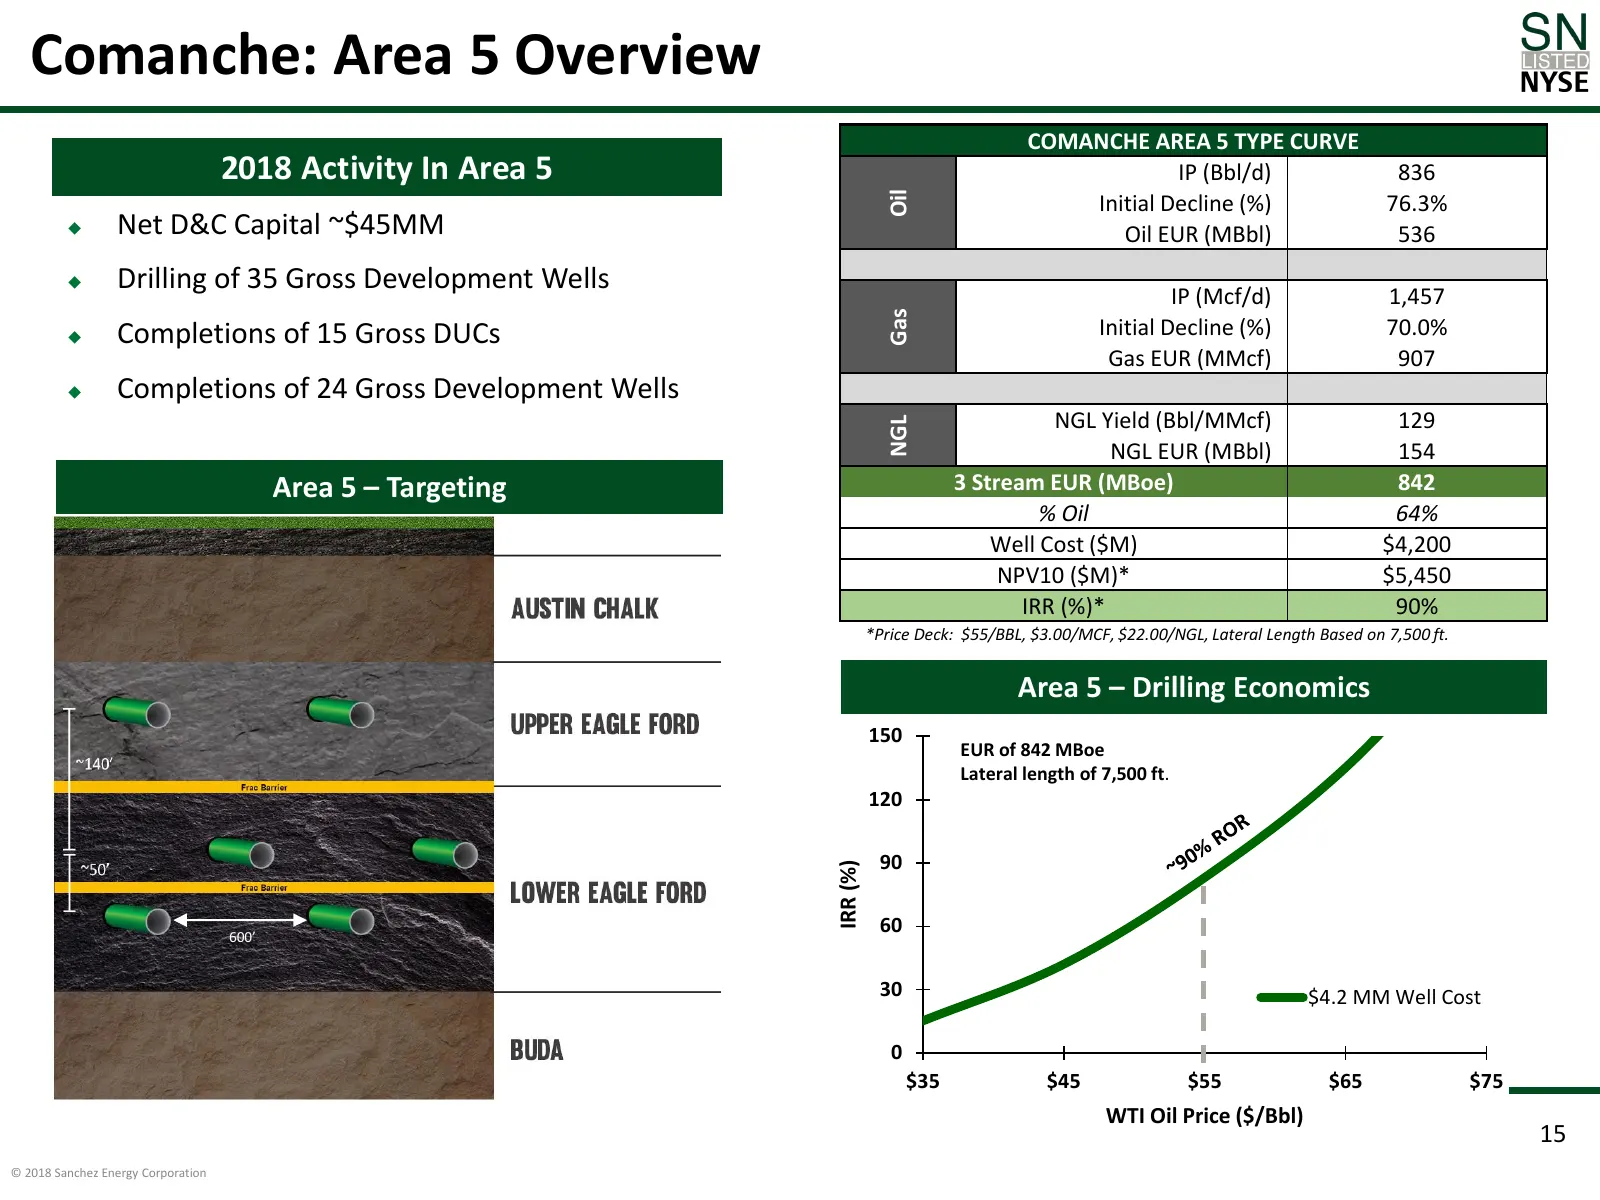
Comanche: Area 5 Overview COMANCHE AREA 5 TYPE CURVE 2018 Activity In Area 5 IP (Bbl/d) 836 Oil Initial Decline (%) 76.3% Net D&C Capital ~$45MM Oil EUR (MBbl) 536 Drilling of 35 Gross Development Wells IP (Mcf/d) 1,457 Gas Completions of 15 Gross DUCs Initial Decline (%) 70.0% Gas EUR (MMcf)
Slide 16: South Central Catarina Development
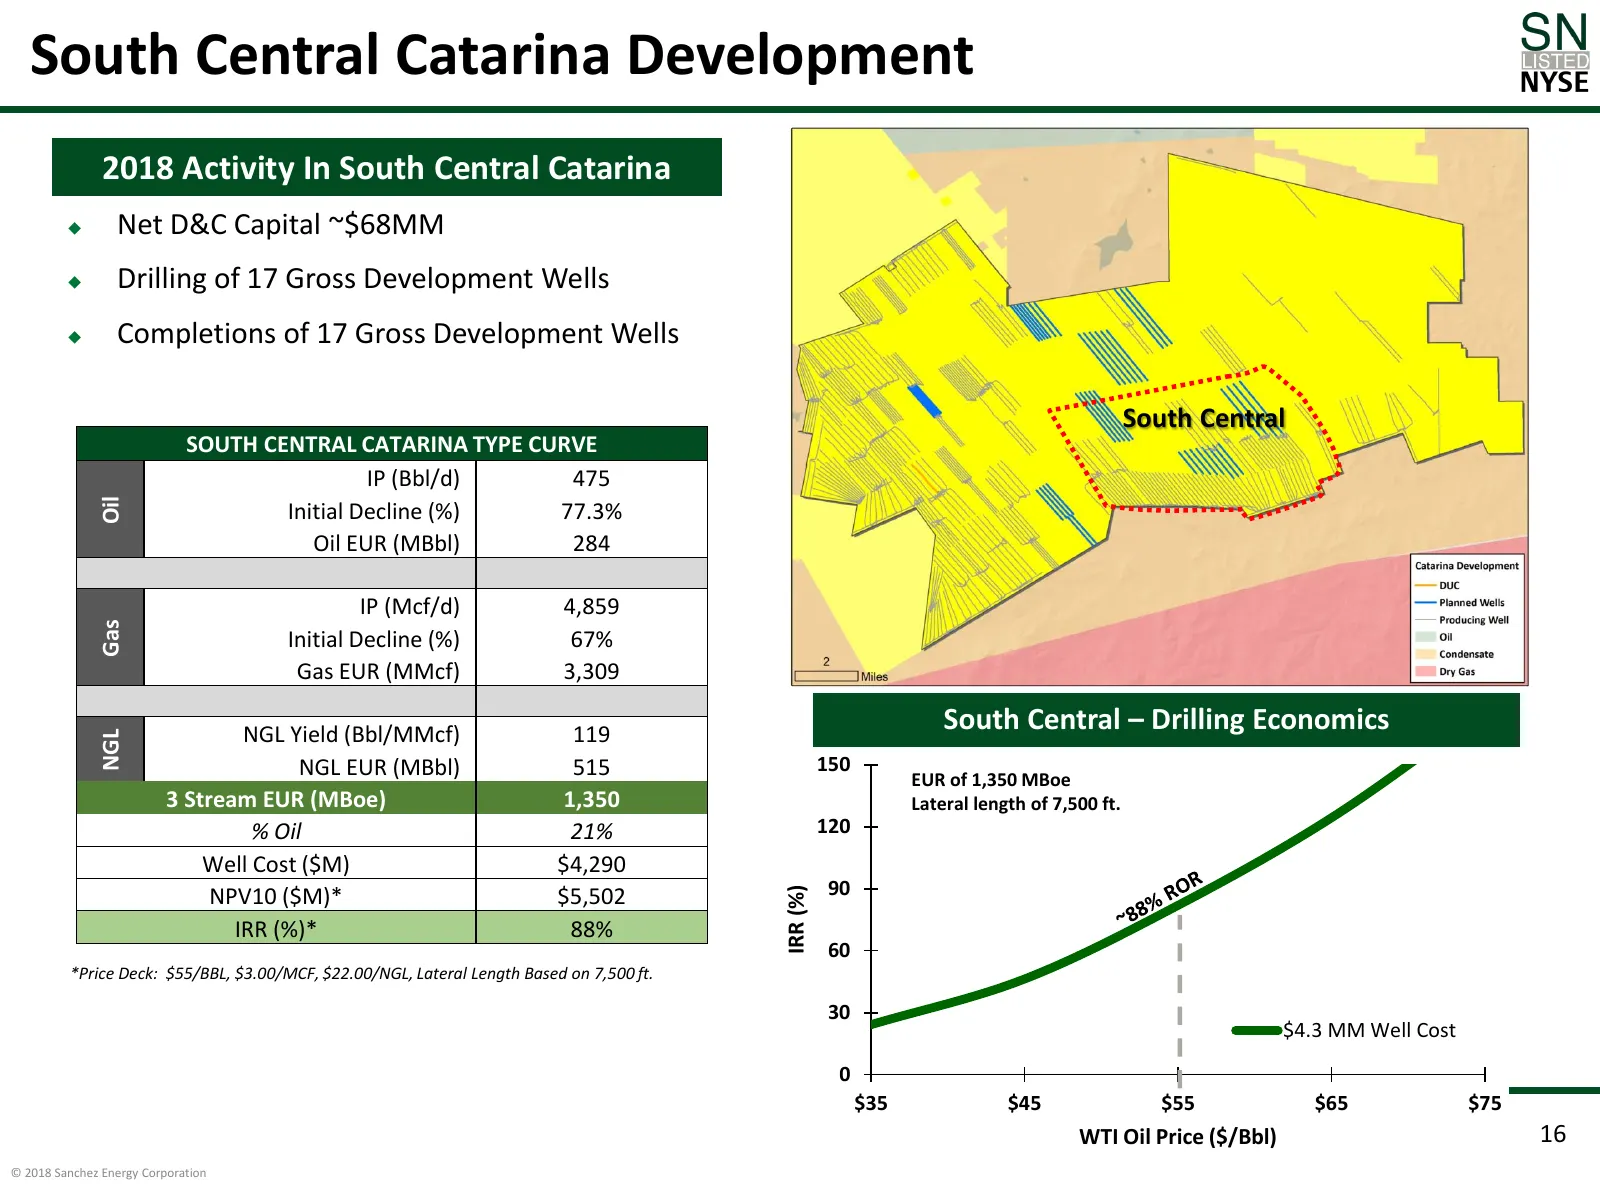
South Central Catarina Development 2018 Activity In South Central Catarina Net D&C Capital ~$68MM Drilling of 17 Gross Development Wells Completions of 17 Gross Development Wells South Central SOUTH CENTRAL CATARINA TYPE CURVE IP (Bbl/d) 475 Oil Initial Decline (%) 77.3% Oil EUR (MBbl) 284 IP
Slide 17: Catarina North Central Development
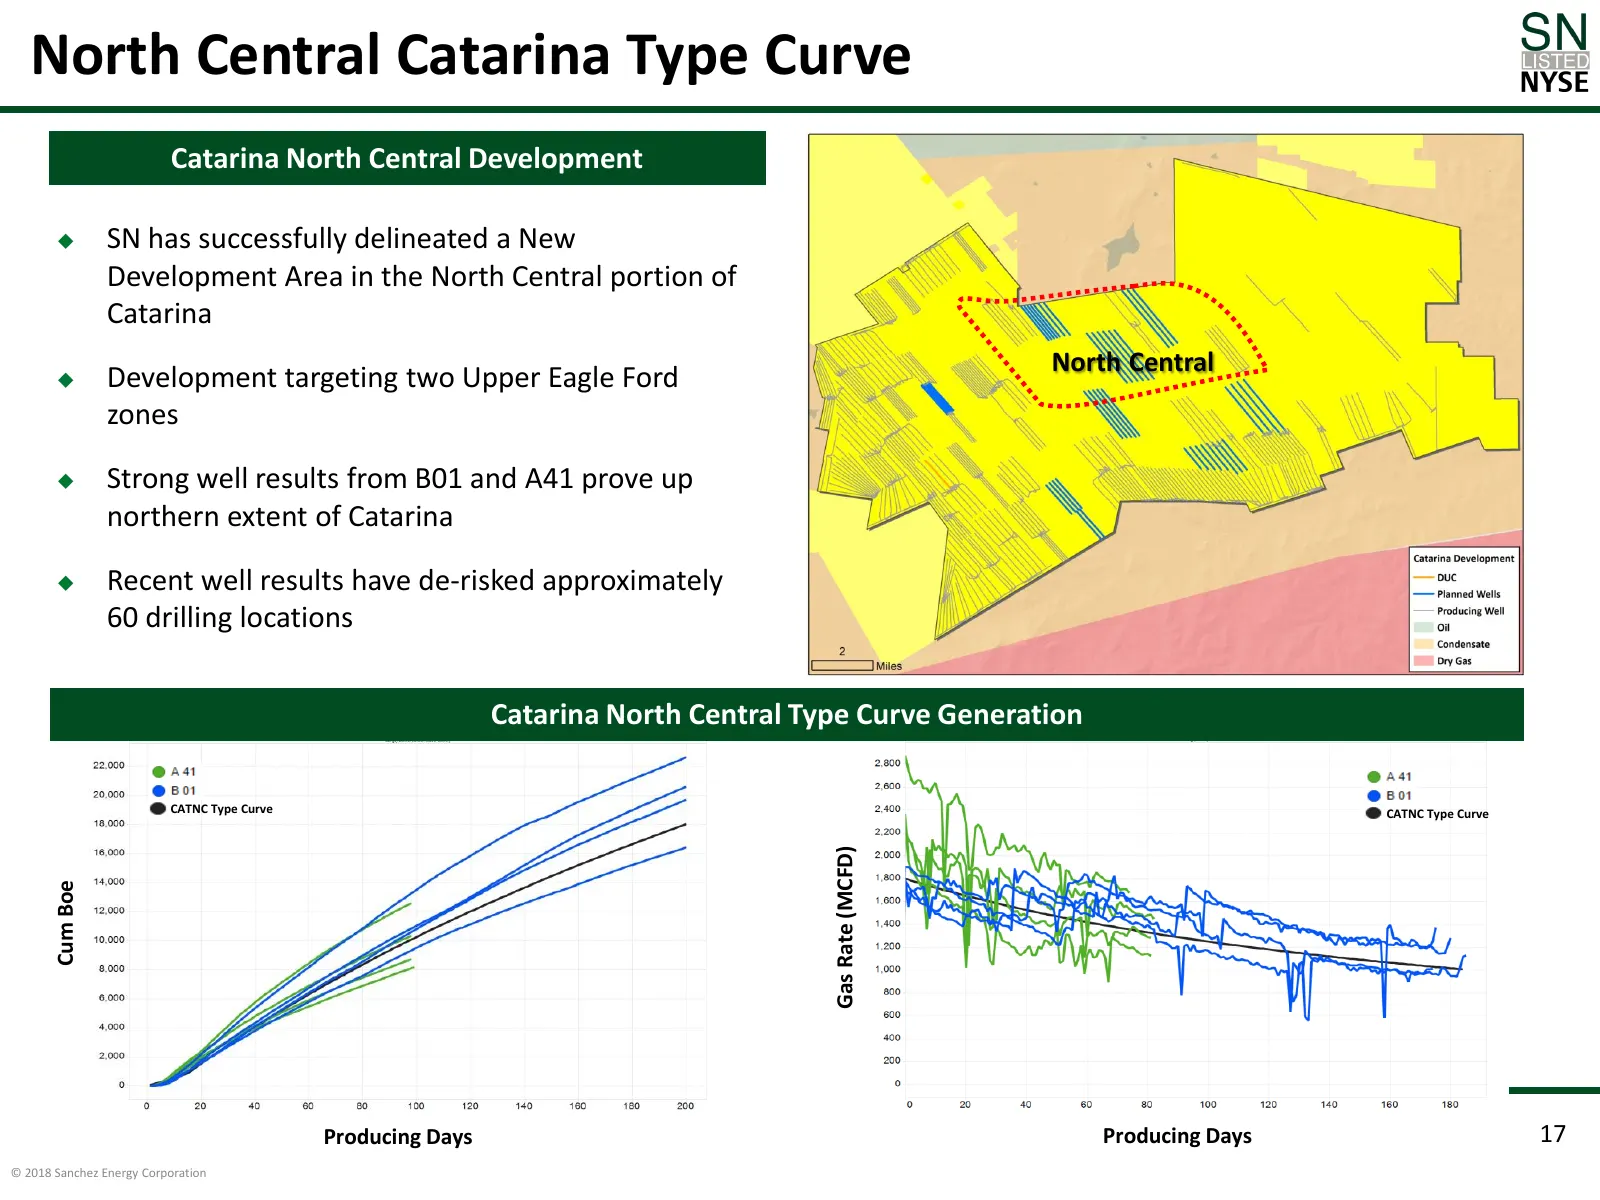
North Central Catarina Type Curve Catarina North Central Development SN has successfully delineated a New Development Area in the North Central portion of Catarina North Central Development targeting two Upper Eagle Ford zones Strong well results from B01 and A41 prove up northern extent of Ca
Slide 18: North Central Catarina Development
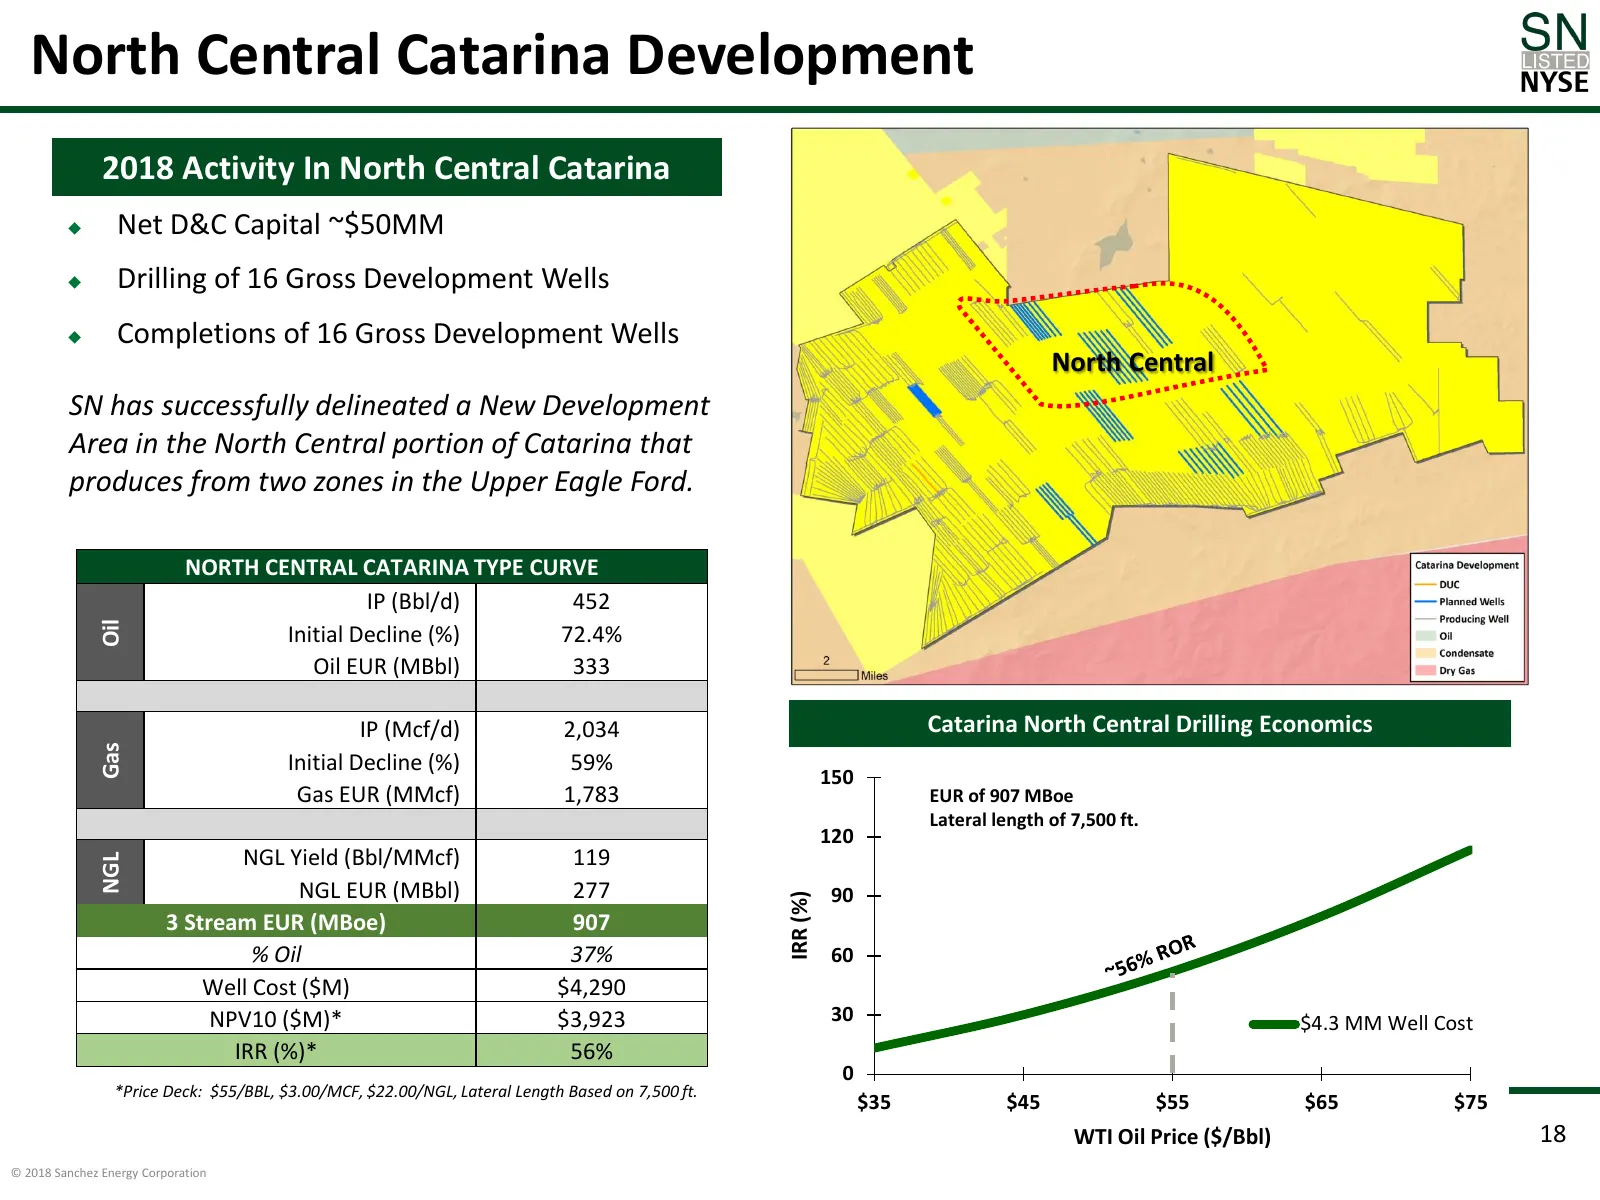
North Central Catarina Development 2018 Activity In North Central Catarina Net D&C Capital ~$50MM Drilling of 16 Gross Development Wells Completions of 16 Gross Development Wells North Central SN has successfully delineated a New Development Area in the North Central portion of Catarina that p
Slide 19: Eagle Ford Shale: Ideal Market Access and Product Mix
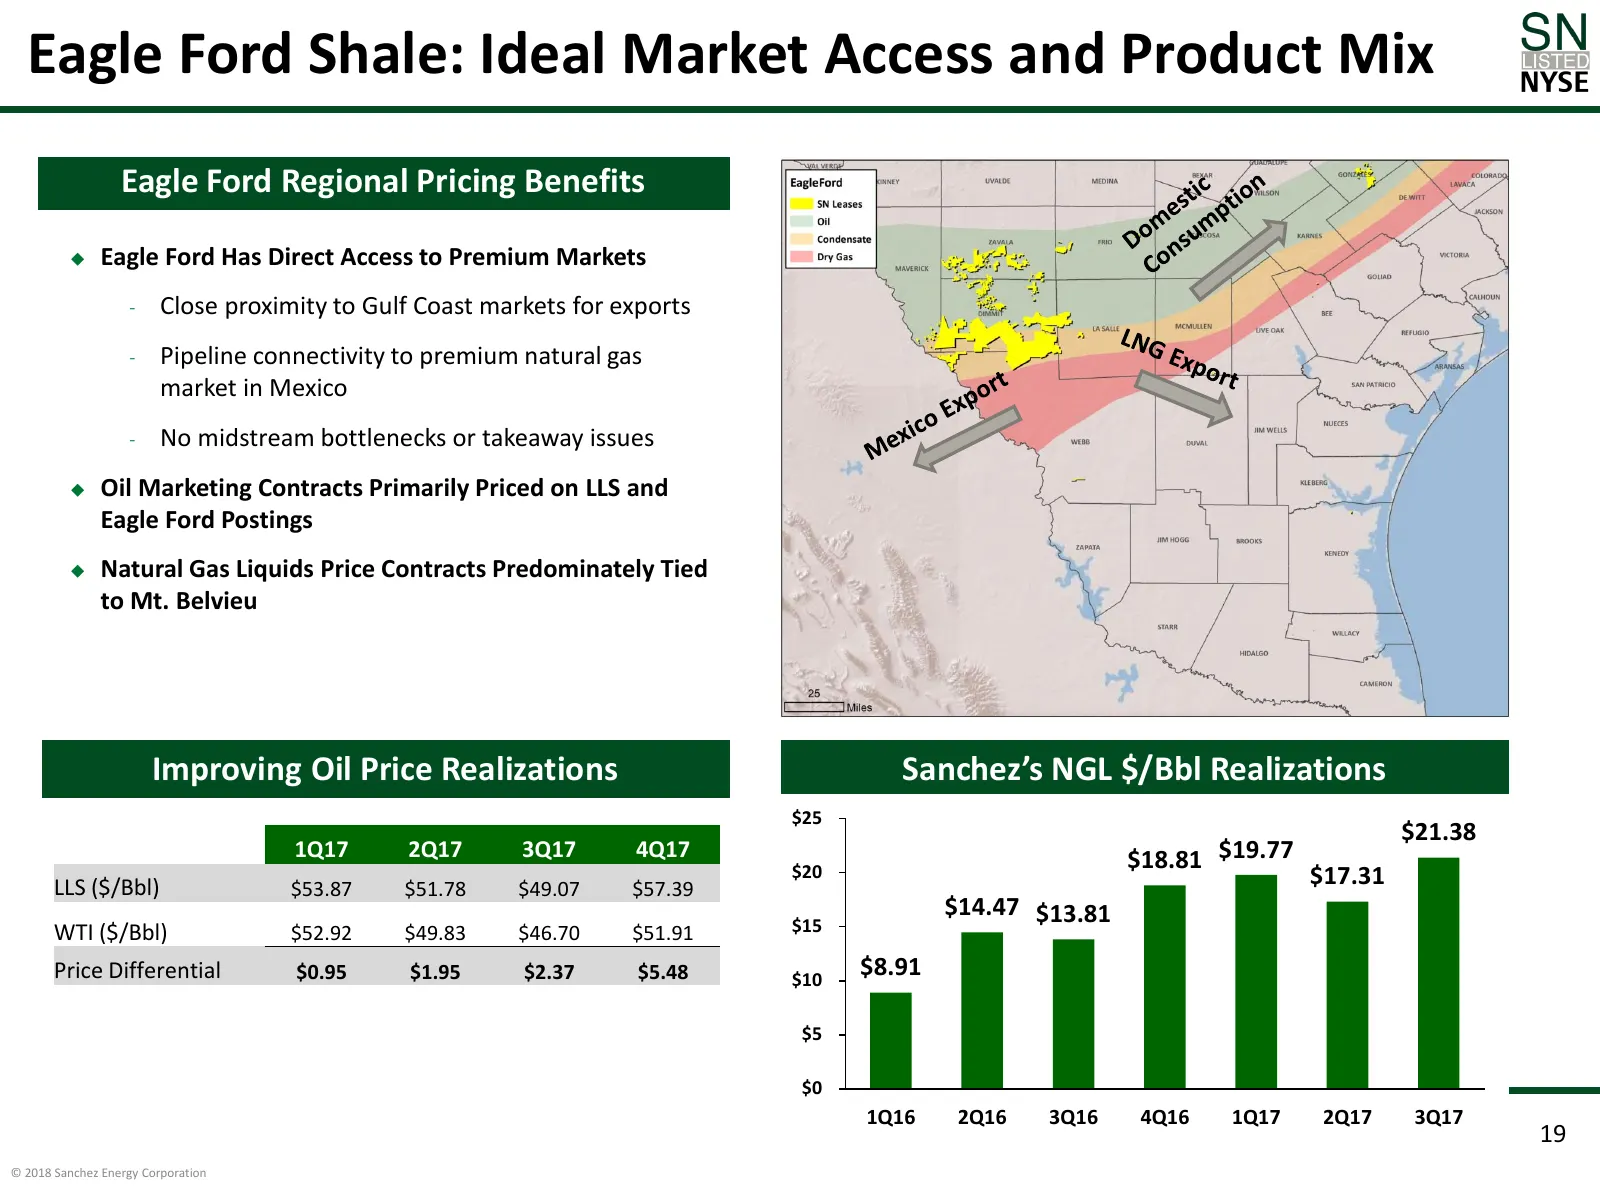
Eagle Ford Shale: Ideal Market Access and Product Mix Eagle Ford Regional Pricing Benefits Eagle Ford Has Direct Access to Premium Markets - Close proximity to Gulf Coast markets for exports - Pipeline connectivity to premium natural gas market in Mexico - No midstream bottlenecks or takeaway issu
Slide 20: Extensive Field Infrastructure
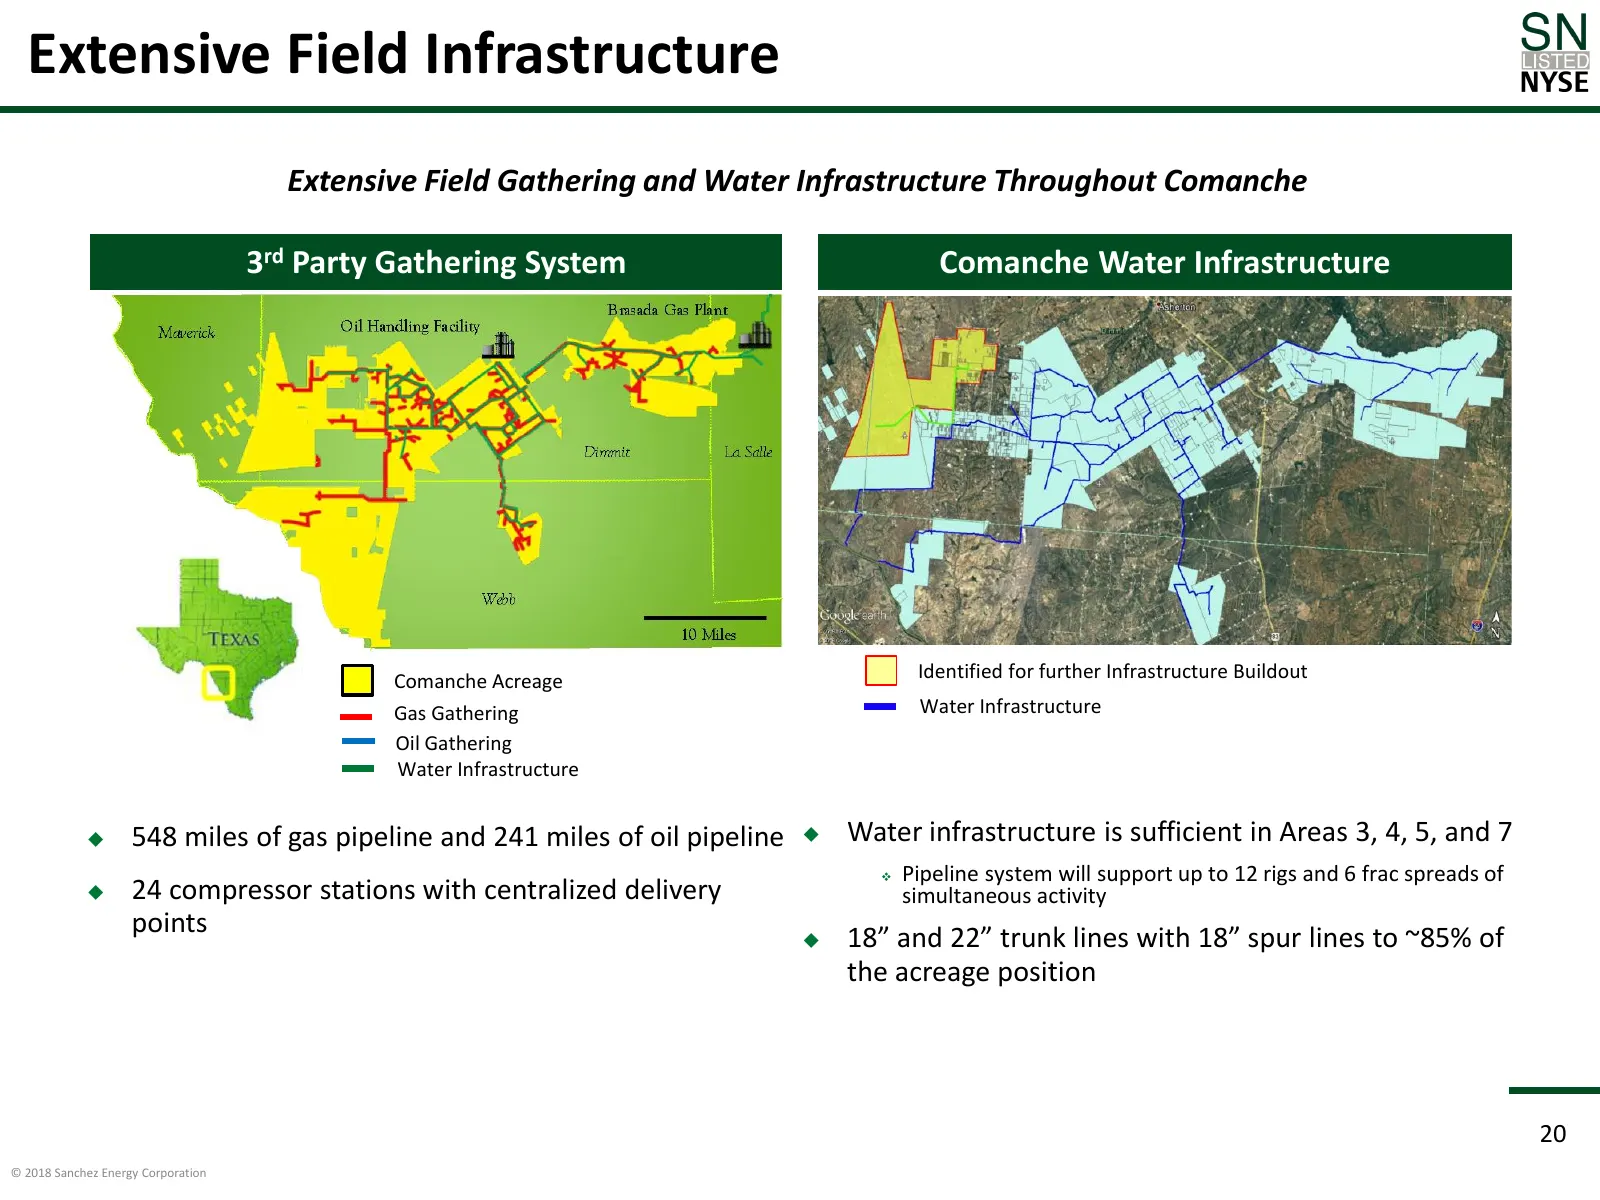
Extensive Field Infrastructure Extensive Field Gathering and Water Infrastructure Throughout Comanche 3rd Party Gathering System Comanche Water Infrastructure Comanche Acreage Identified for further Infrastructure Buildout Gas Gathering Water Infrastructure Oil Gathering Water Infrastructure 548 m
Slide 21: Relationship with Sanchez Midstream Partners LP ("SNMP")
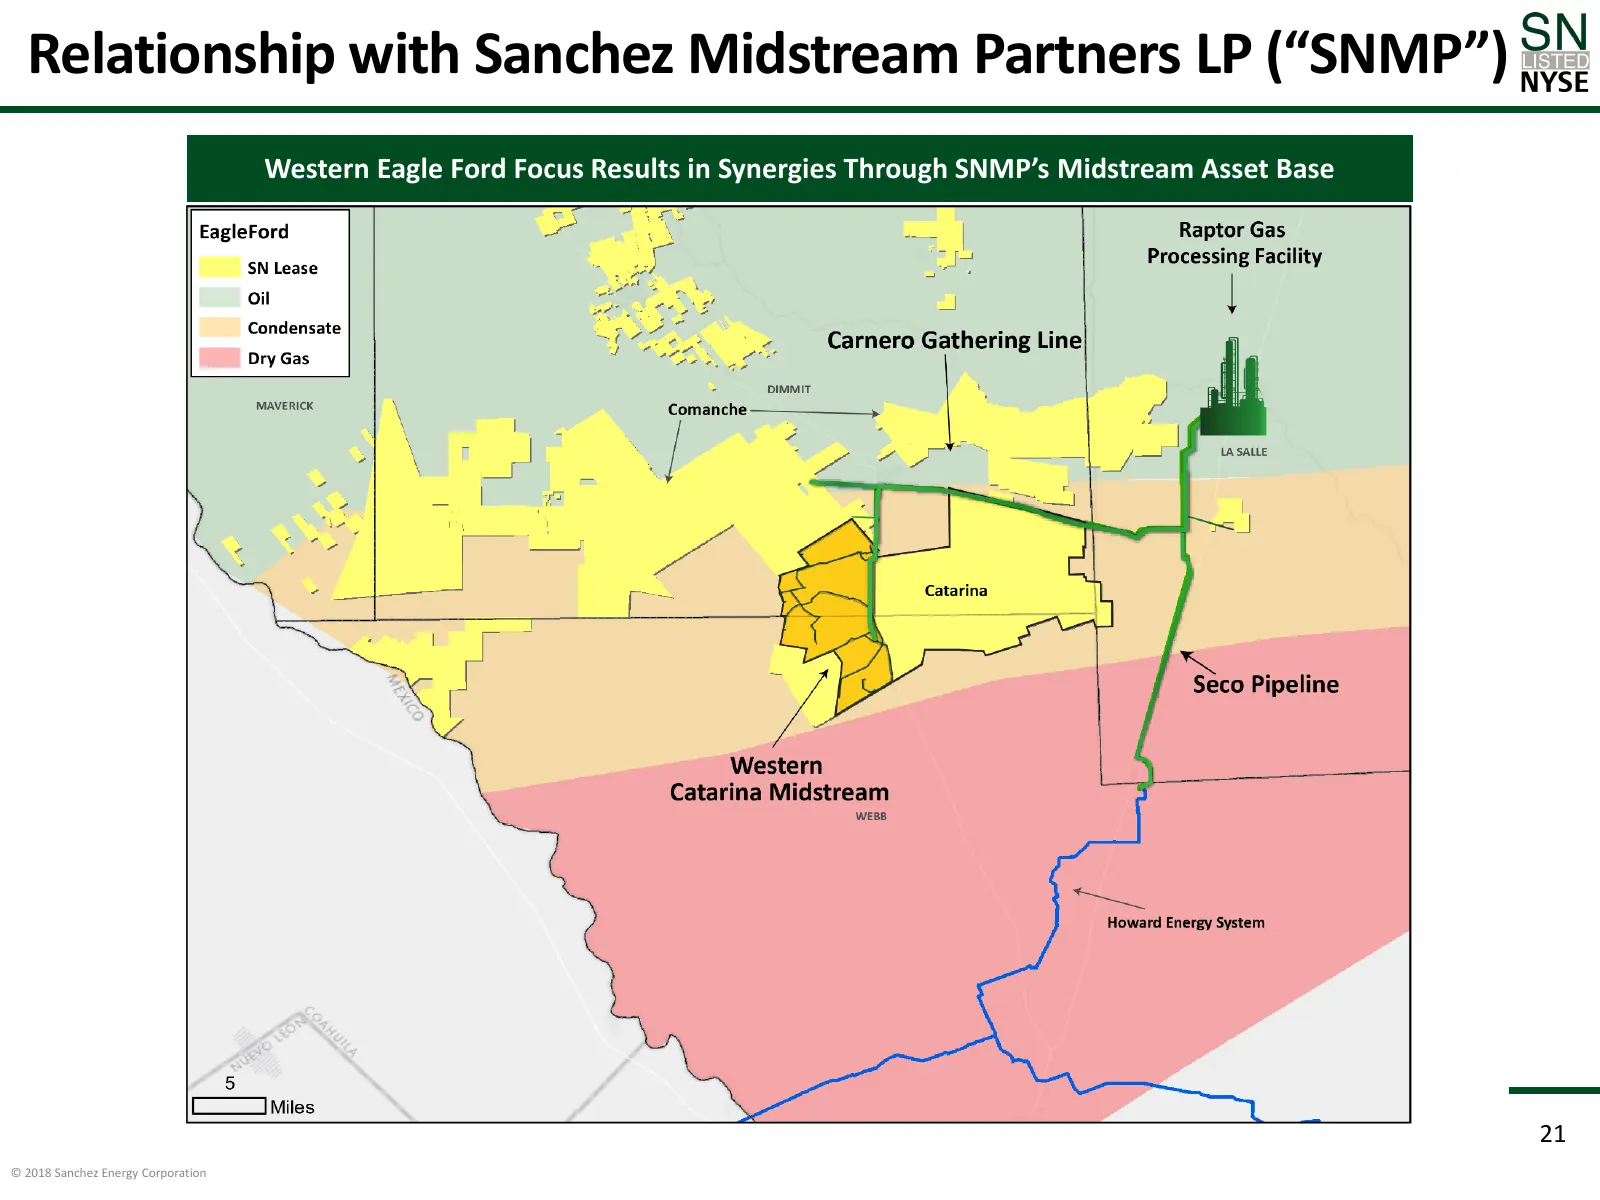
Relationship with Sanchez Midstream Partners LP (“SNMP”) Western Eagle Ford Focus Results in Synergies Through SNMP’s Midstream Asset Base 21 © 2018 Sanchez Energy Corporation
Slide 22: Financial Highlights
Financial Highlights 22 © 2018 Sanchez Energy Corporation
Slide 23: Financial Overview
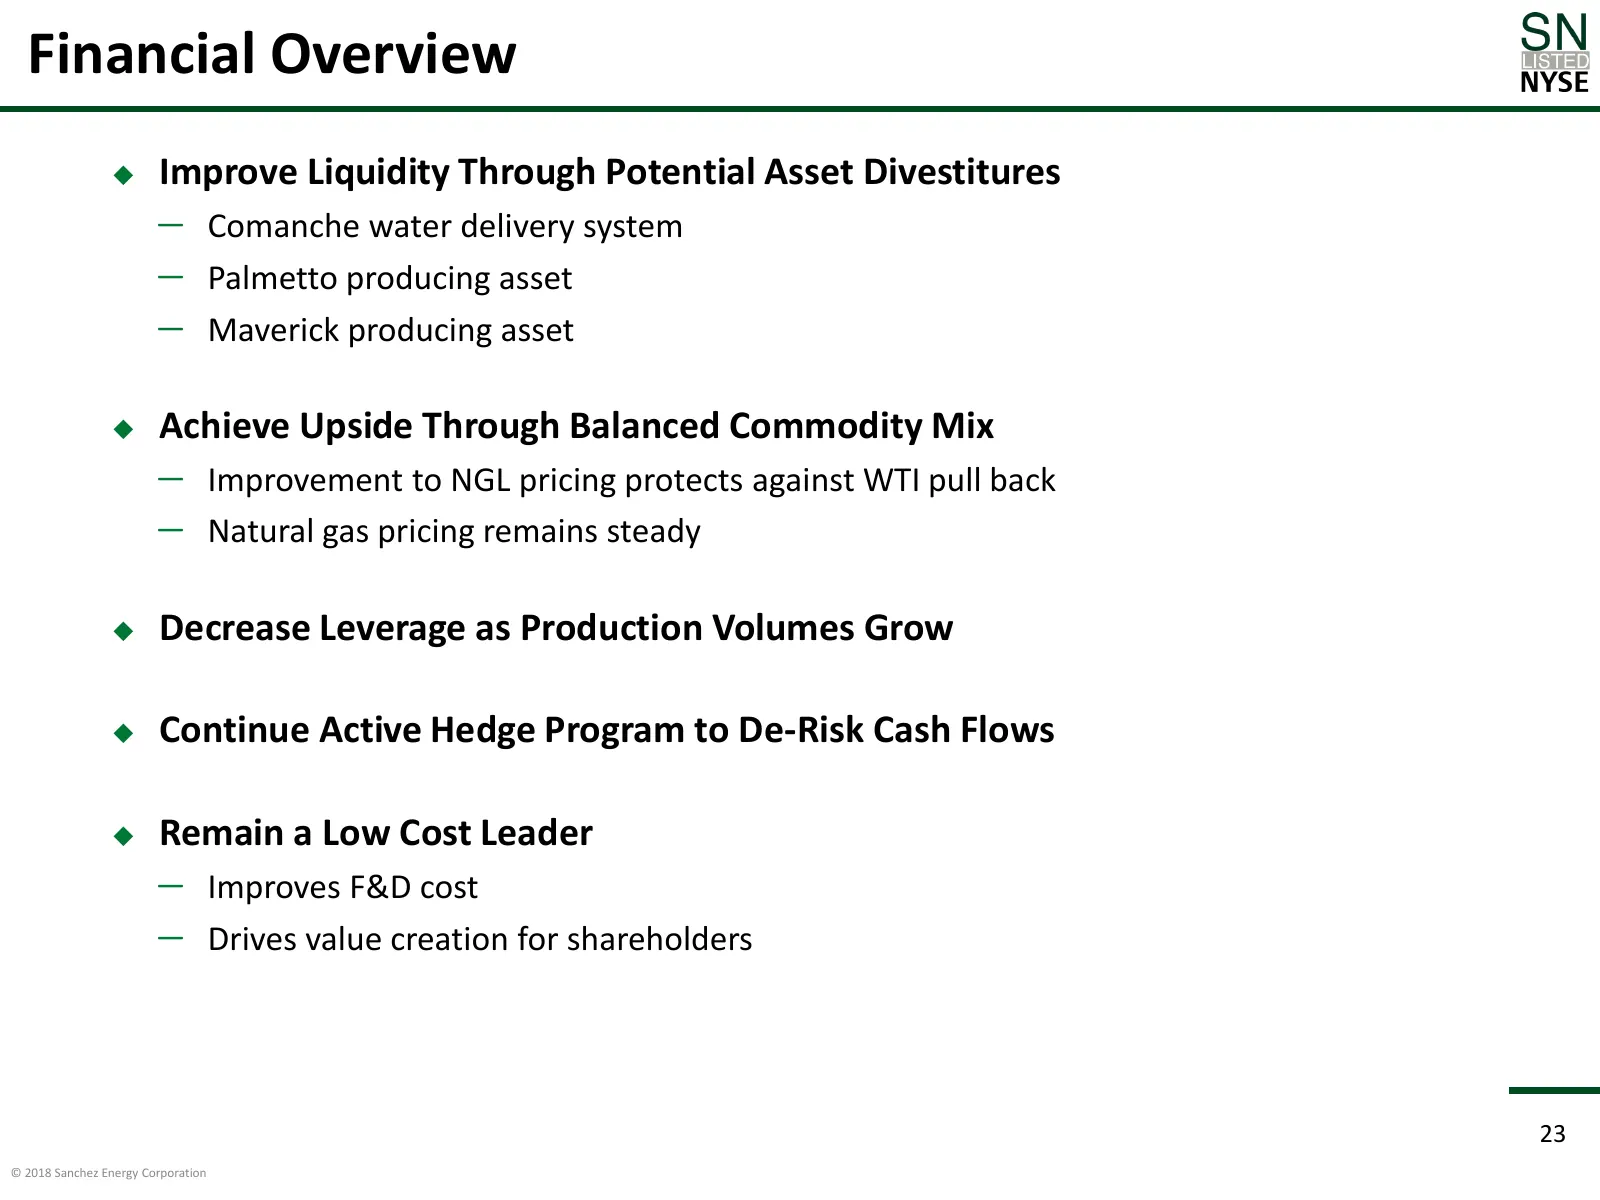
Financial Overview Improve Liquidity Through Potential Asset Divestitures ─ Comanche water delivery system ─ Palmetto producing asset ─ Maverick producing asset Achieve Upside Through Balanced Commodity Mix ─ Improvement to NGL pricing protects against WTI pull back ─ Natural gas pricing remains
Slide 24: Active Hedging Program Helps Mitigate Price Volatility
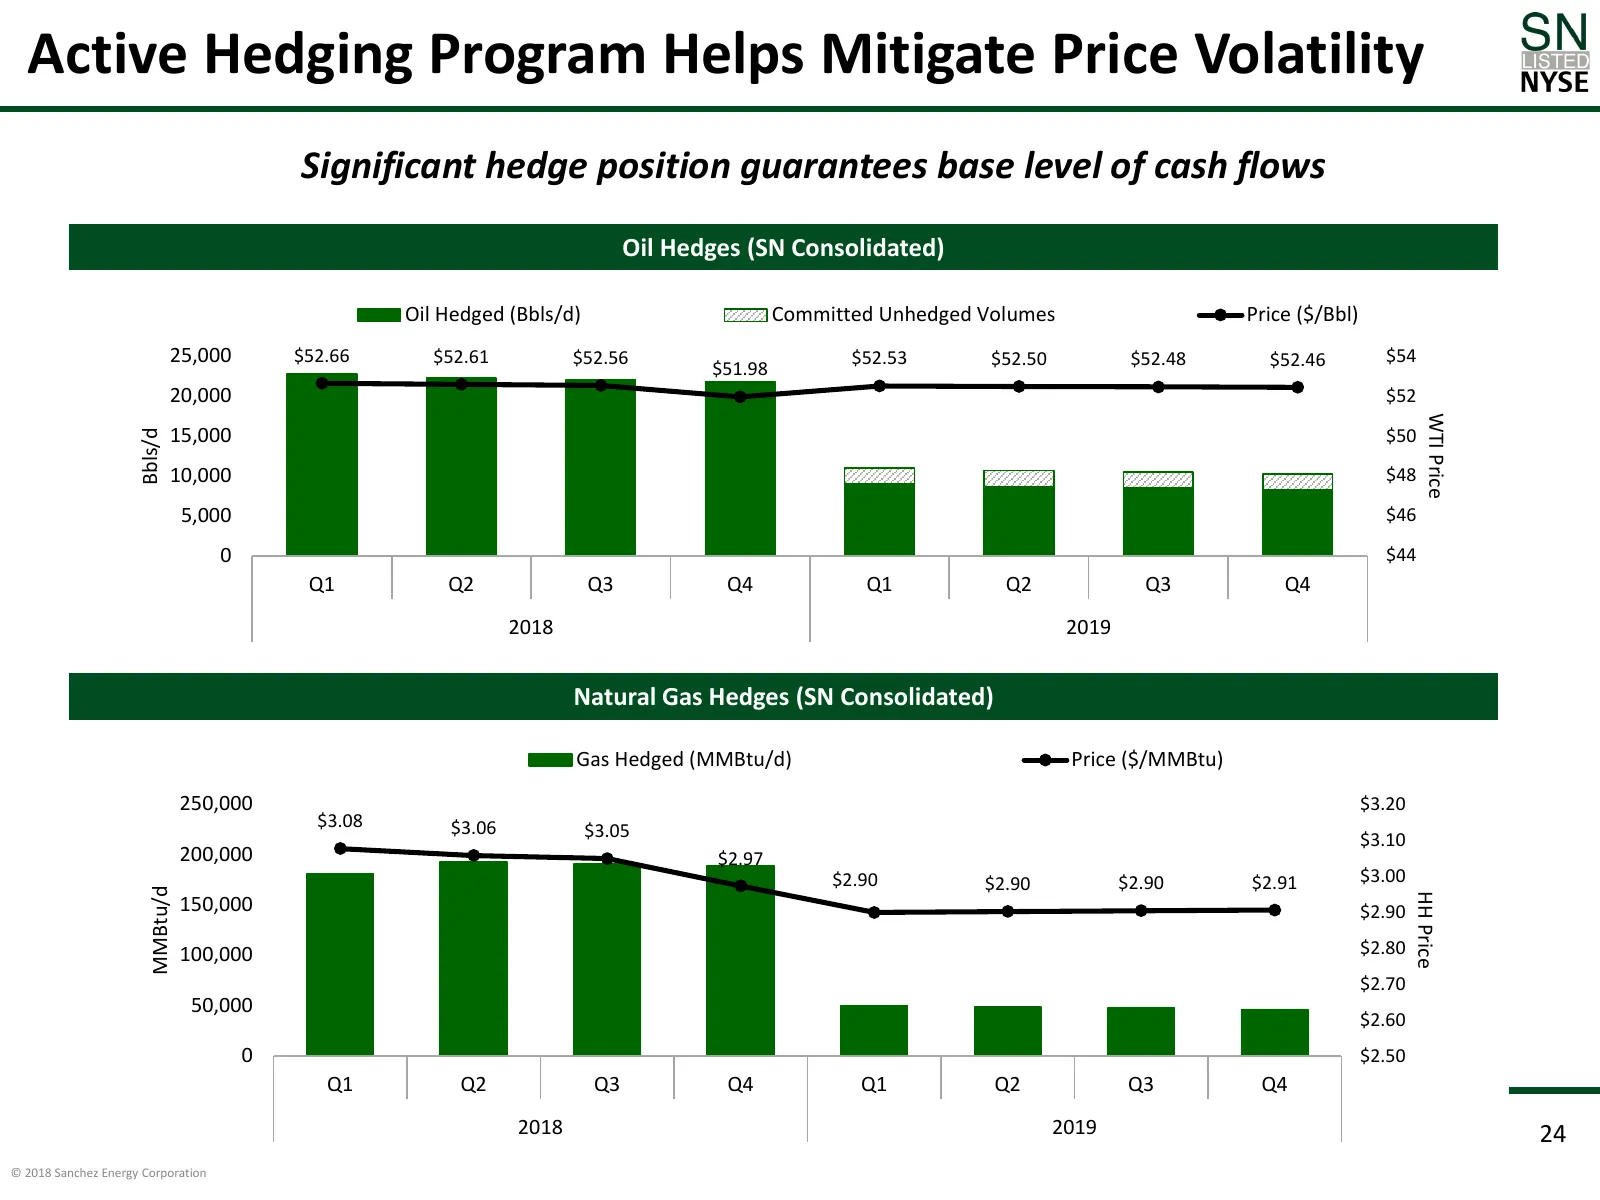
Active Hedging Program Helps Mitigate Price Volatility Significant hedge position guarantees base level of cash flows Oil Hedges (SN Consolidated) Oil Hedged (Bbls/d) Committed Unhedged Volumes Price ($/Bbl) 25,000 $52.66 $52.61 $52.56 $52.53 $52.50 $52.48 $52.46 $54 $51.98 20,000 $52 WTI Price 15,0
Slide 25: Improving Balance Sheet
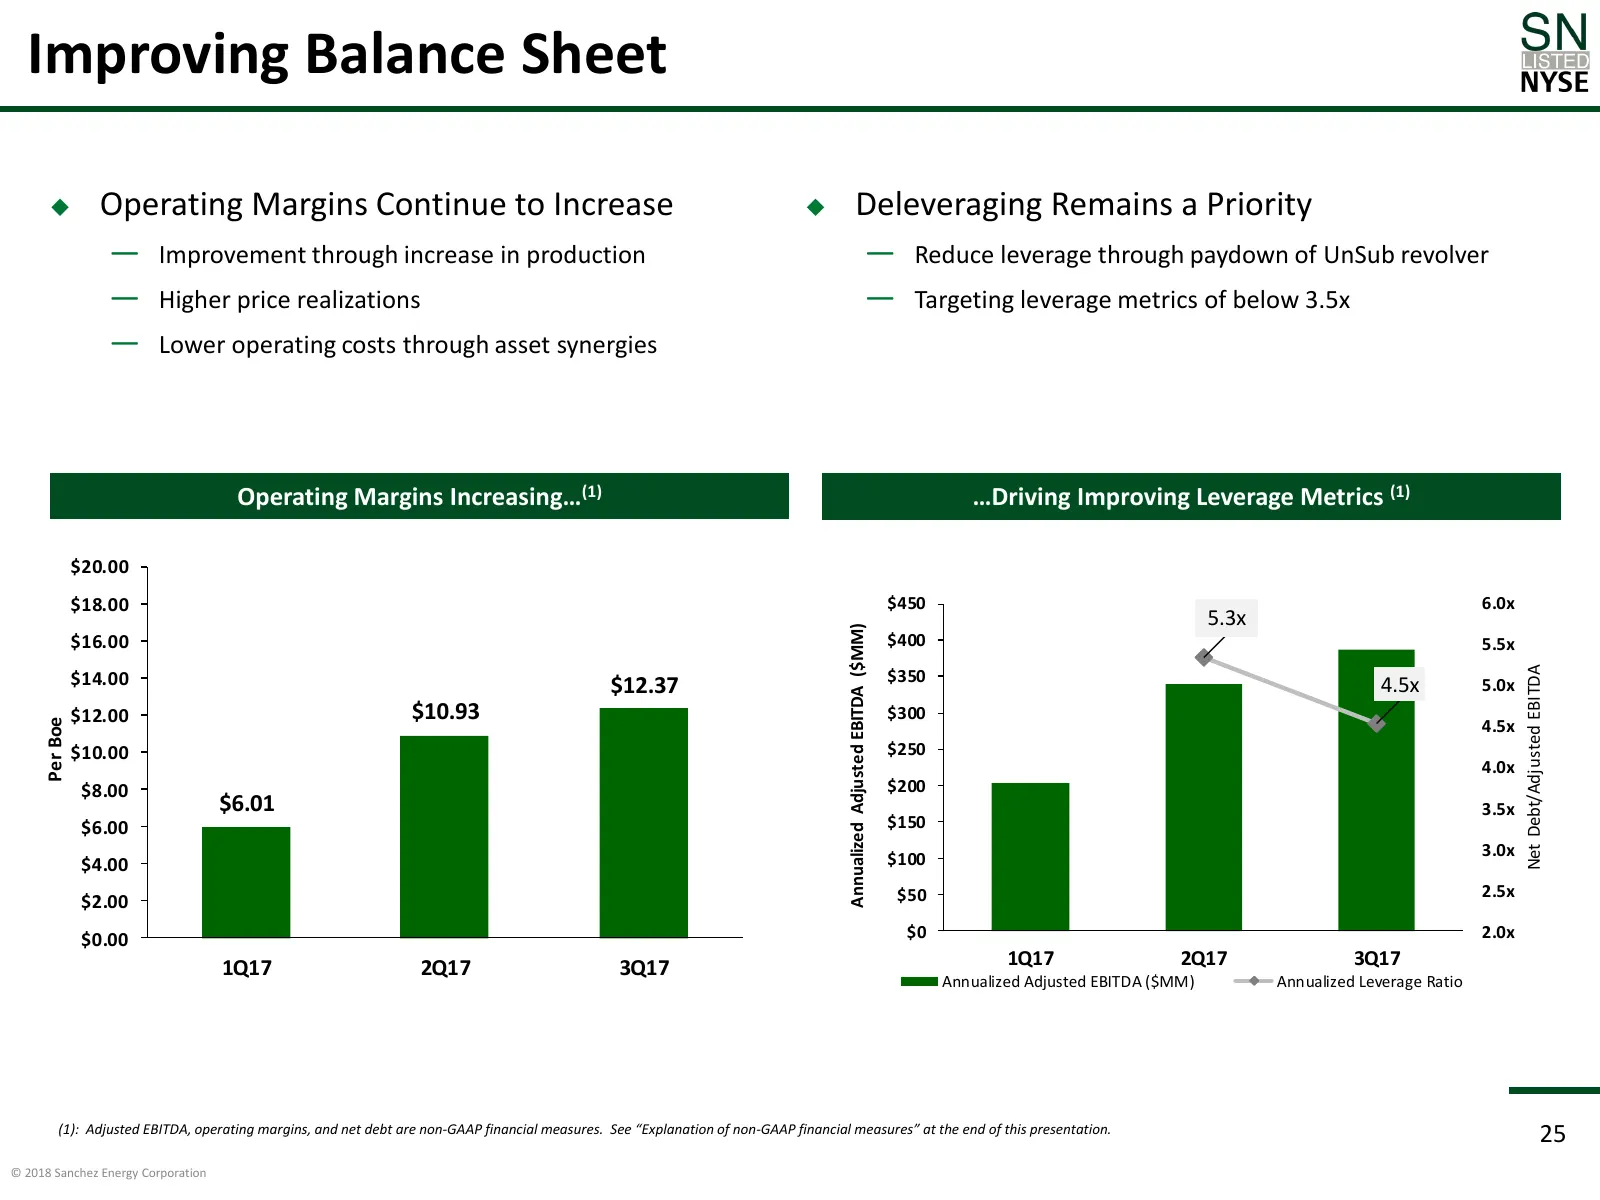
Improving Balance Sheet Operating Margins Continue to Increase Deleveraging Remains a Priority — Improvement through increase in production — Reduce leverage through paydown of UnSub revolver — Higher price realizations — Targeting leverage metrics of below 3.5x — Lower operating costs through a
Slide 26: Sanchez Energy: Investment Highlights
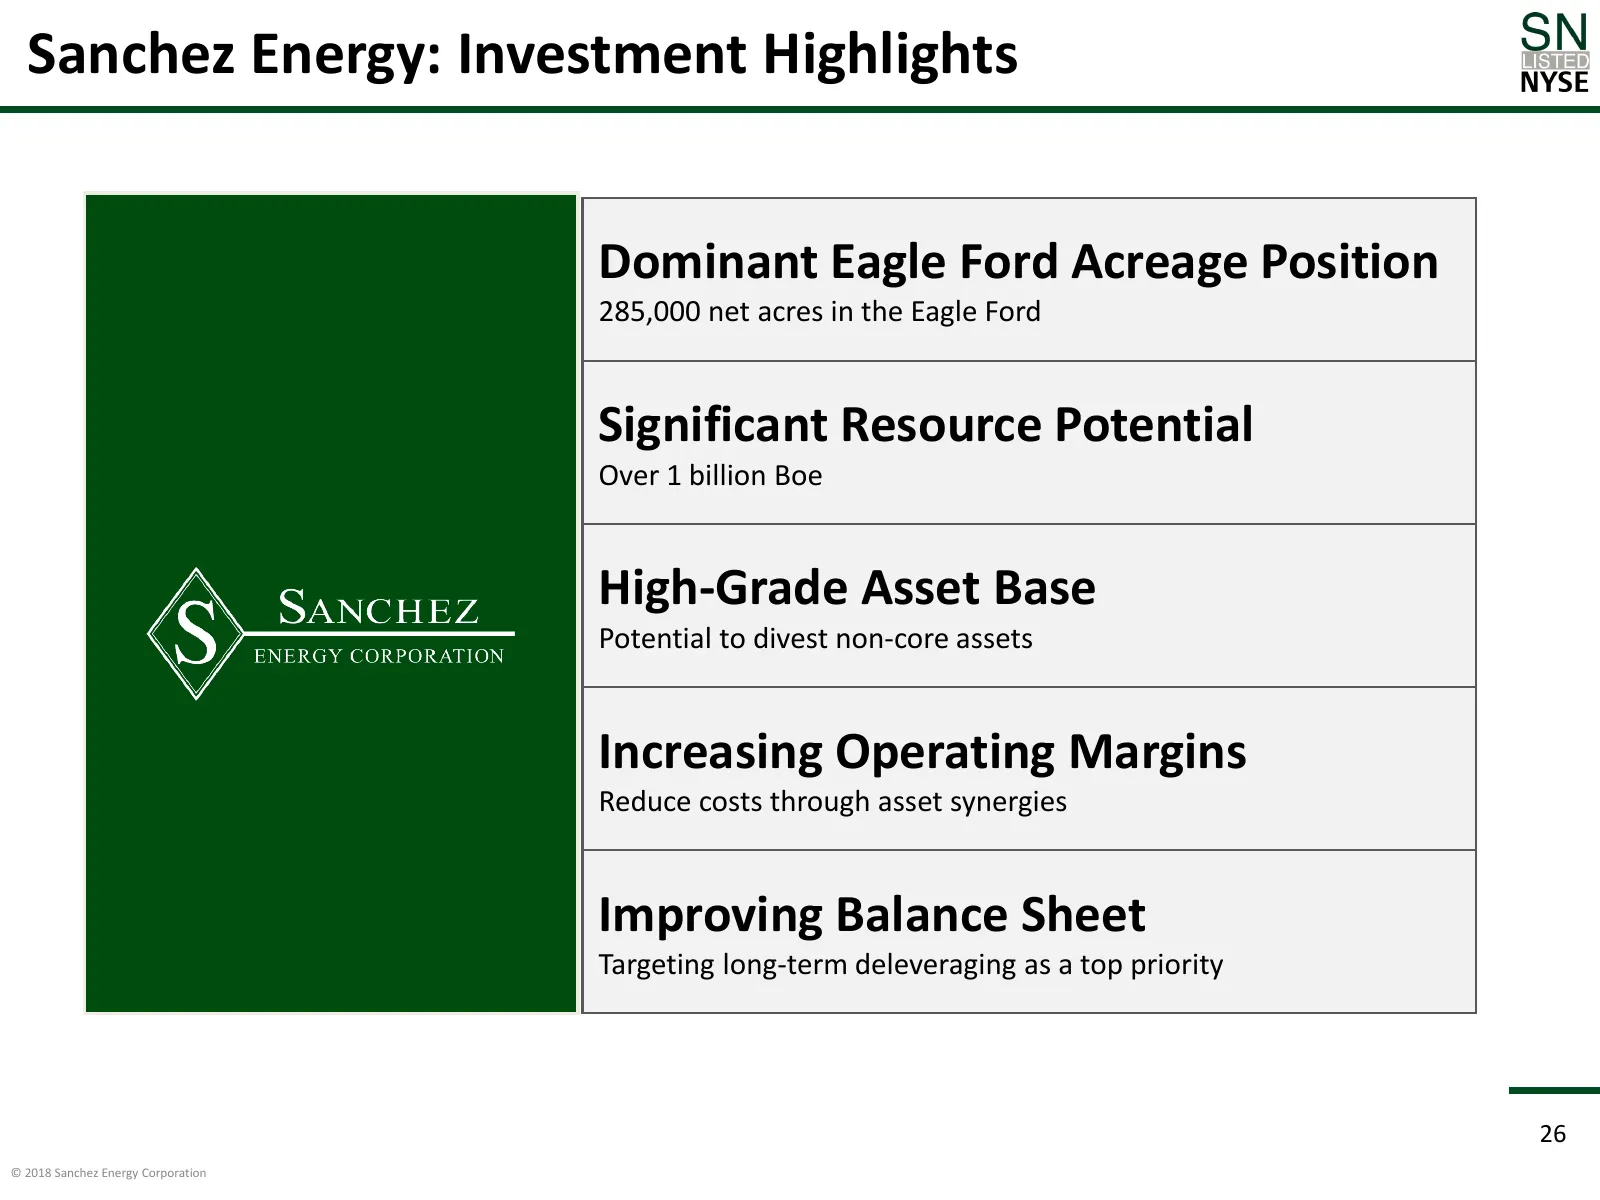
Sanchez Energy: Investment Highlights Dominant Eagle Ford Acreage Position 285,000 net acres in the Eagle Ford Significant Resource Potential Over 1 billion Boe High-Grade Asset Base Potential to divest non-core assets Increasing Operating Margins Reduce costs through asset synergies Improving Balan
Slide 27: Appendix
Appendix 27 © 2018 Sanchez Energy Corporation
Slide 28: 2018 Production and Cost Guidance
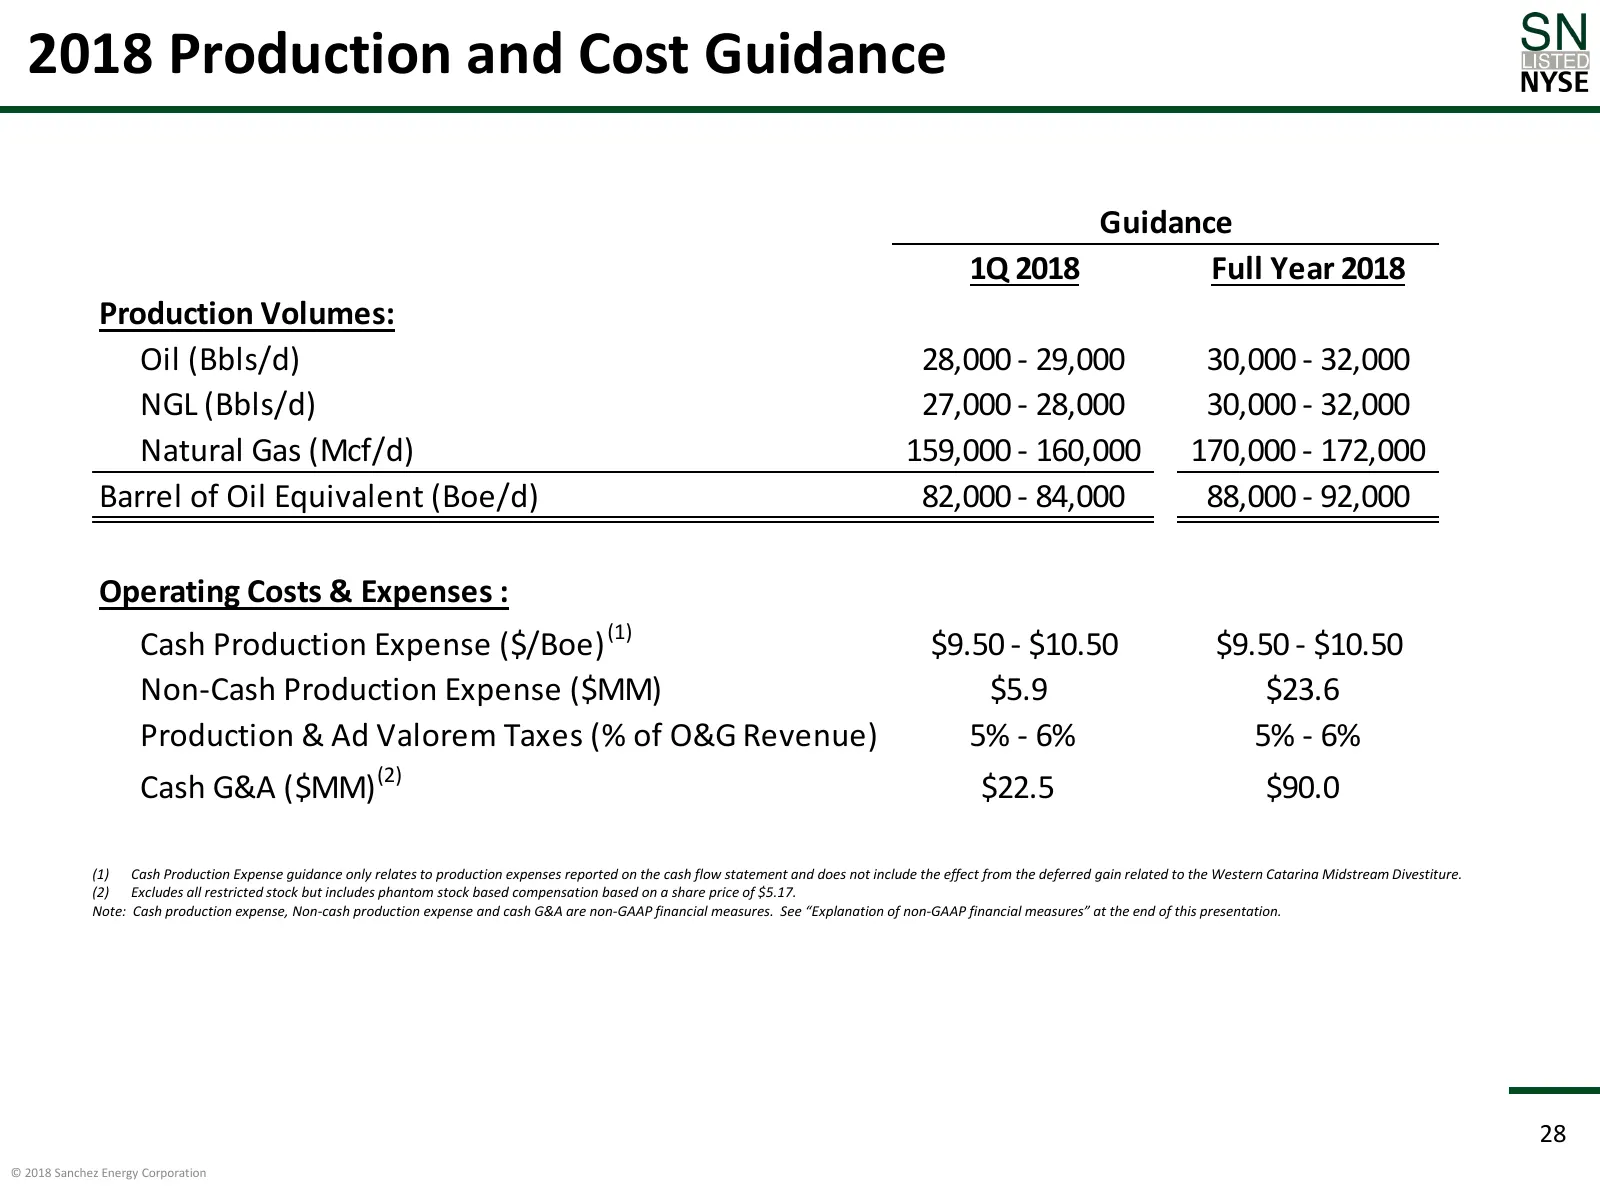
2018 Production and Cost Guidance Guidance 1Q 2018 Full Year 2018 Production Volumes: Oil (Bbls/d) 28,000 - 29,000 30,000 - 32,000 NGL (Bbls/d) 27,000 - 28,000 30,000 - 32,000 Natural Gas (Mcf/d) 159,000 - 160,000 170,000 - 172,000 Barrel of Oil Equivalent (Boe/d) 82,000 - 84,000 88,000 - 92,000 Ope
Slide 29: 2018 Capital Guidance
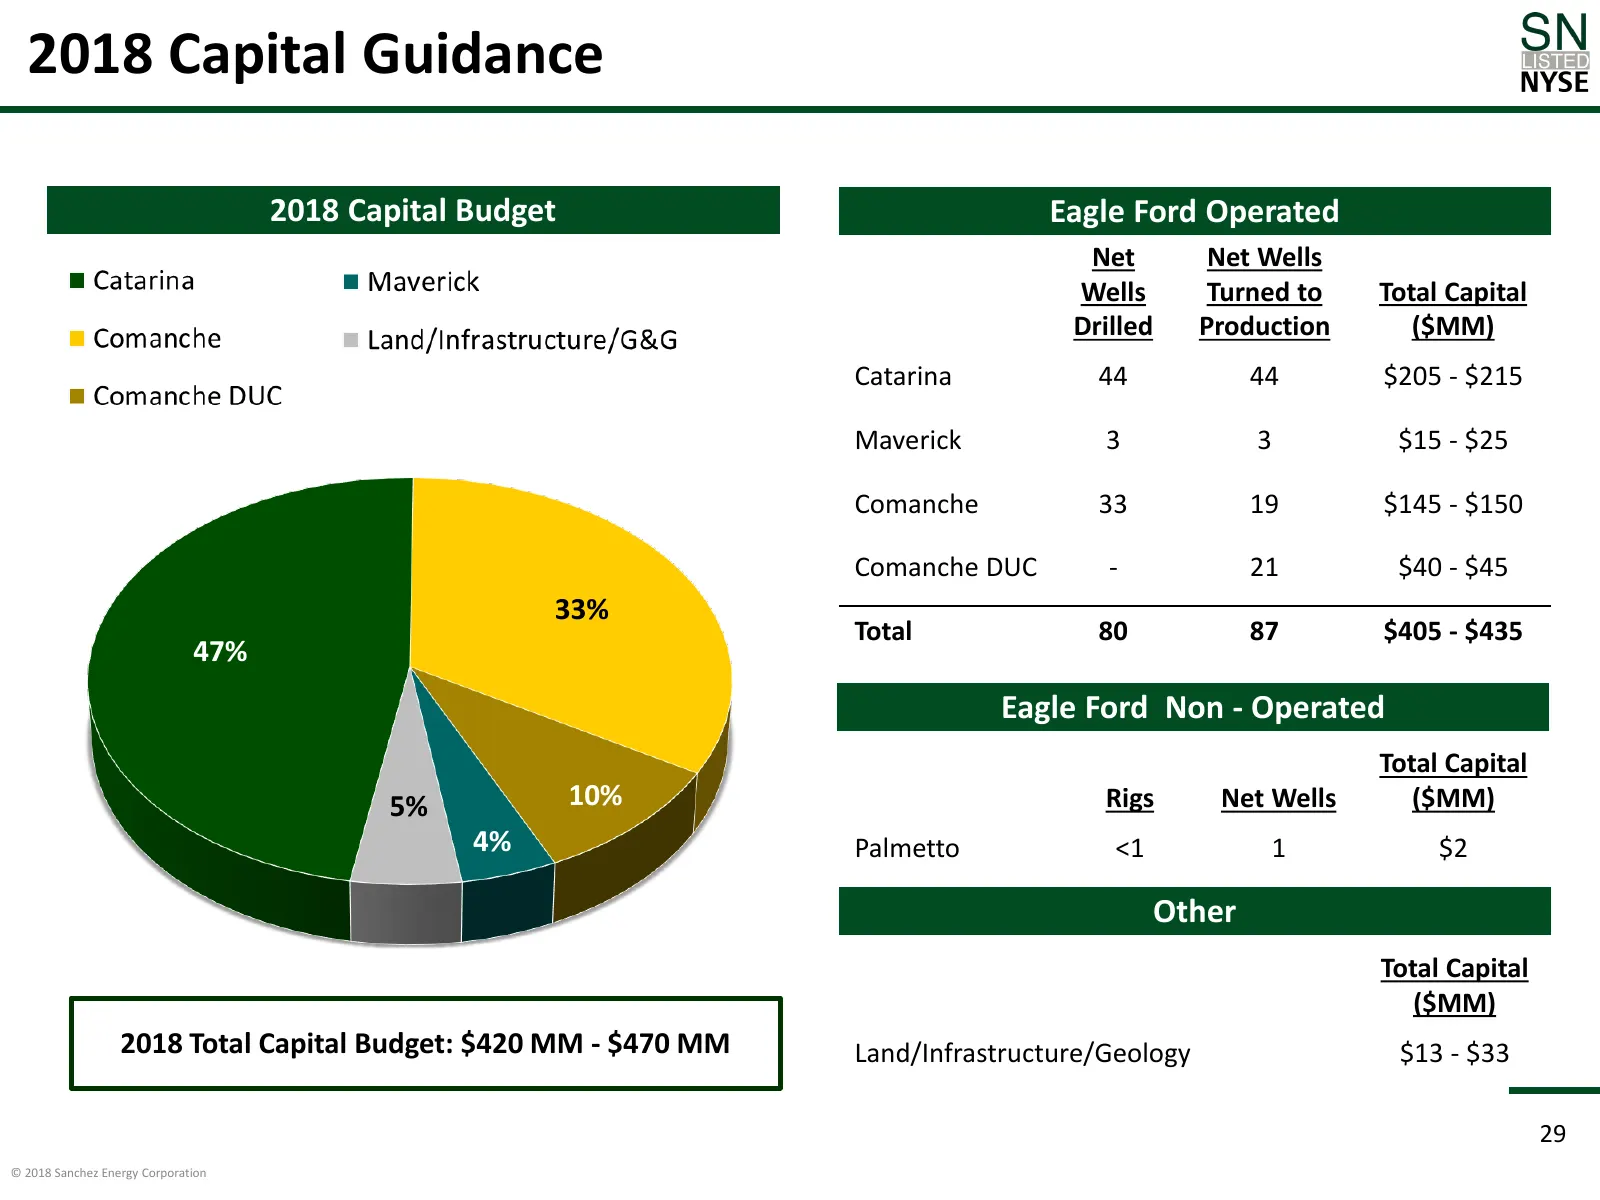
2018 Capital Guidance 2018 Capital Budget Eagle Ford Operated Net Net Wells Wells Turned to Total Capital Drilled Production ($MM) Catarina 44 44 $205 - $215 Maverick 3 3 $15 - $25 Comanche 33 19 $145 - $150 Comanche DUC - 21 $40 - $45 33% Total 80 87 $405 - $435 47% Eagle Ford Non - Operated Total
Slide 30: Strategic JV Facilitated Comanche Acquisition
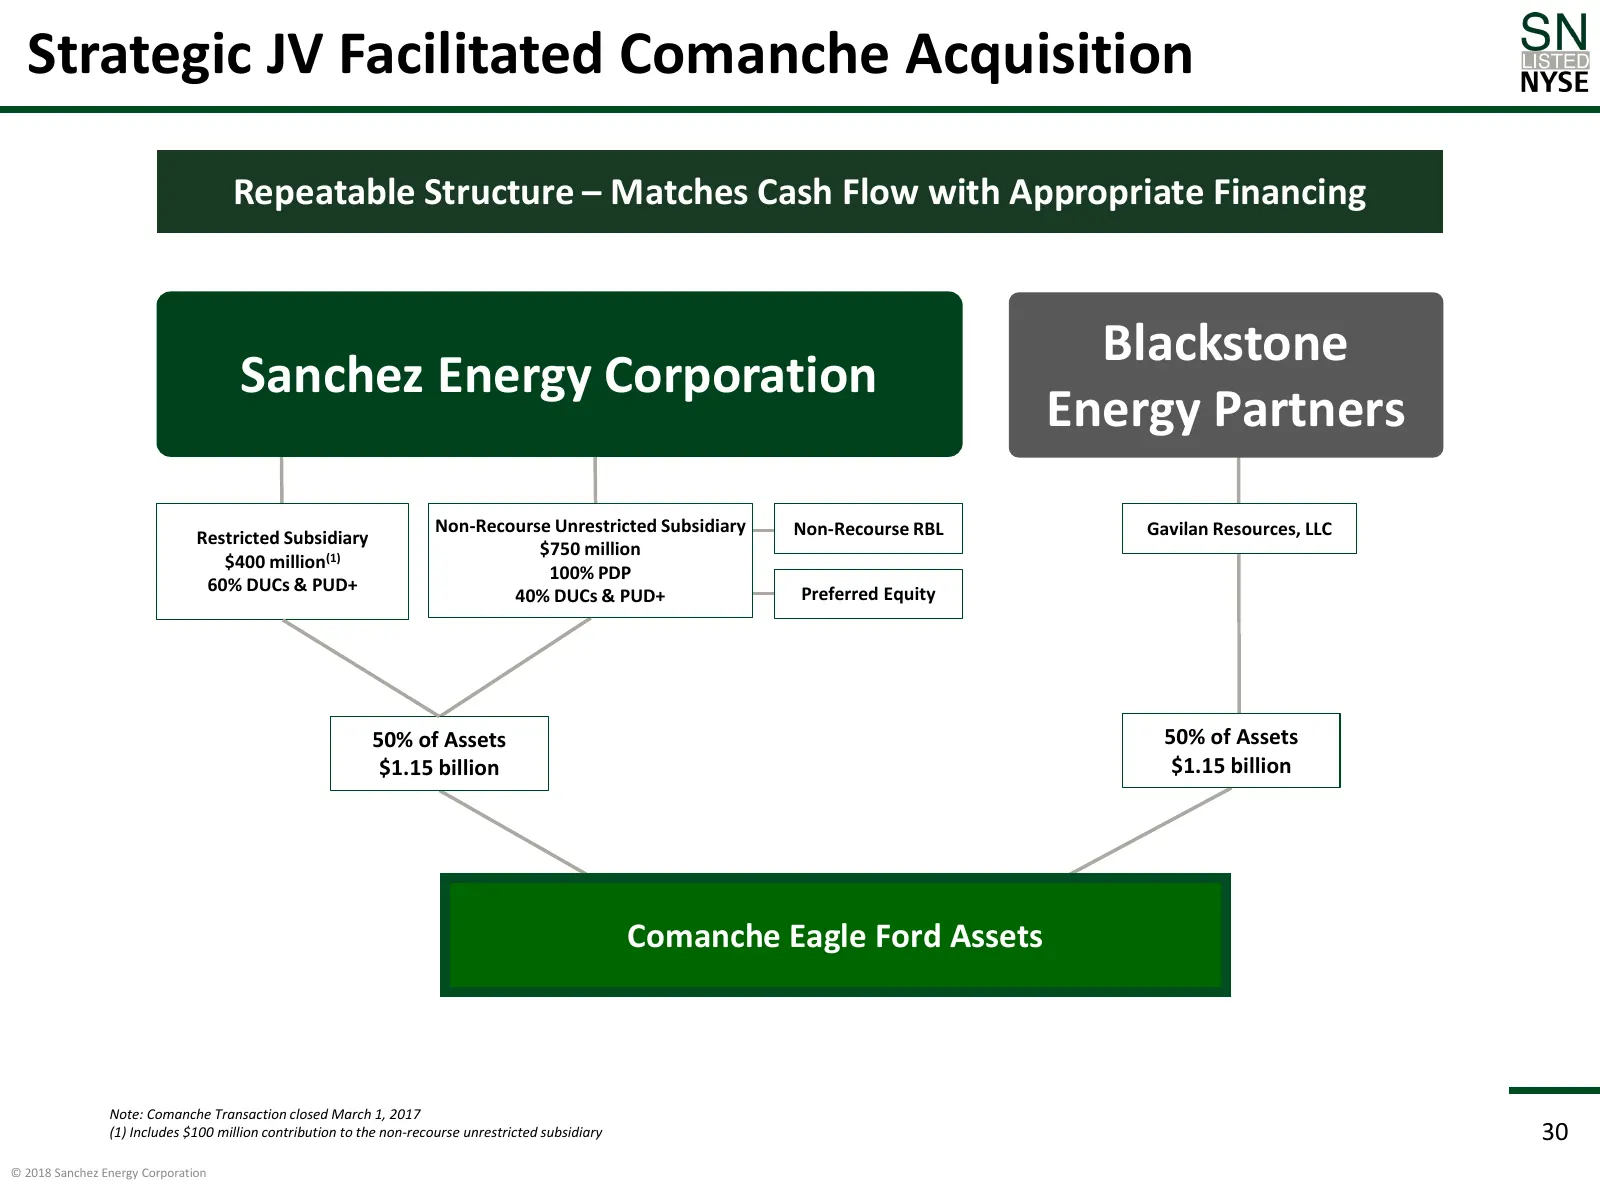
Strategic JV Facilitated Comanche Acquisition Repeatable Structure – Matches Cash Flow with Appropriate Financing Blackstone Sanchez Energy Corporation Energy Partners Non-Recourse Unrestricted Subsidiary Non-Recourse RBL Gavilan Resources, LLC Restricted Subsidiary $750 million $400 million(1) 100%
Slide 31: Detailed SN Restricted Subsidiary Hedge Position
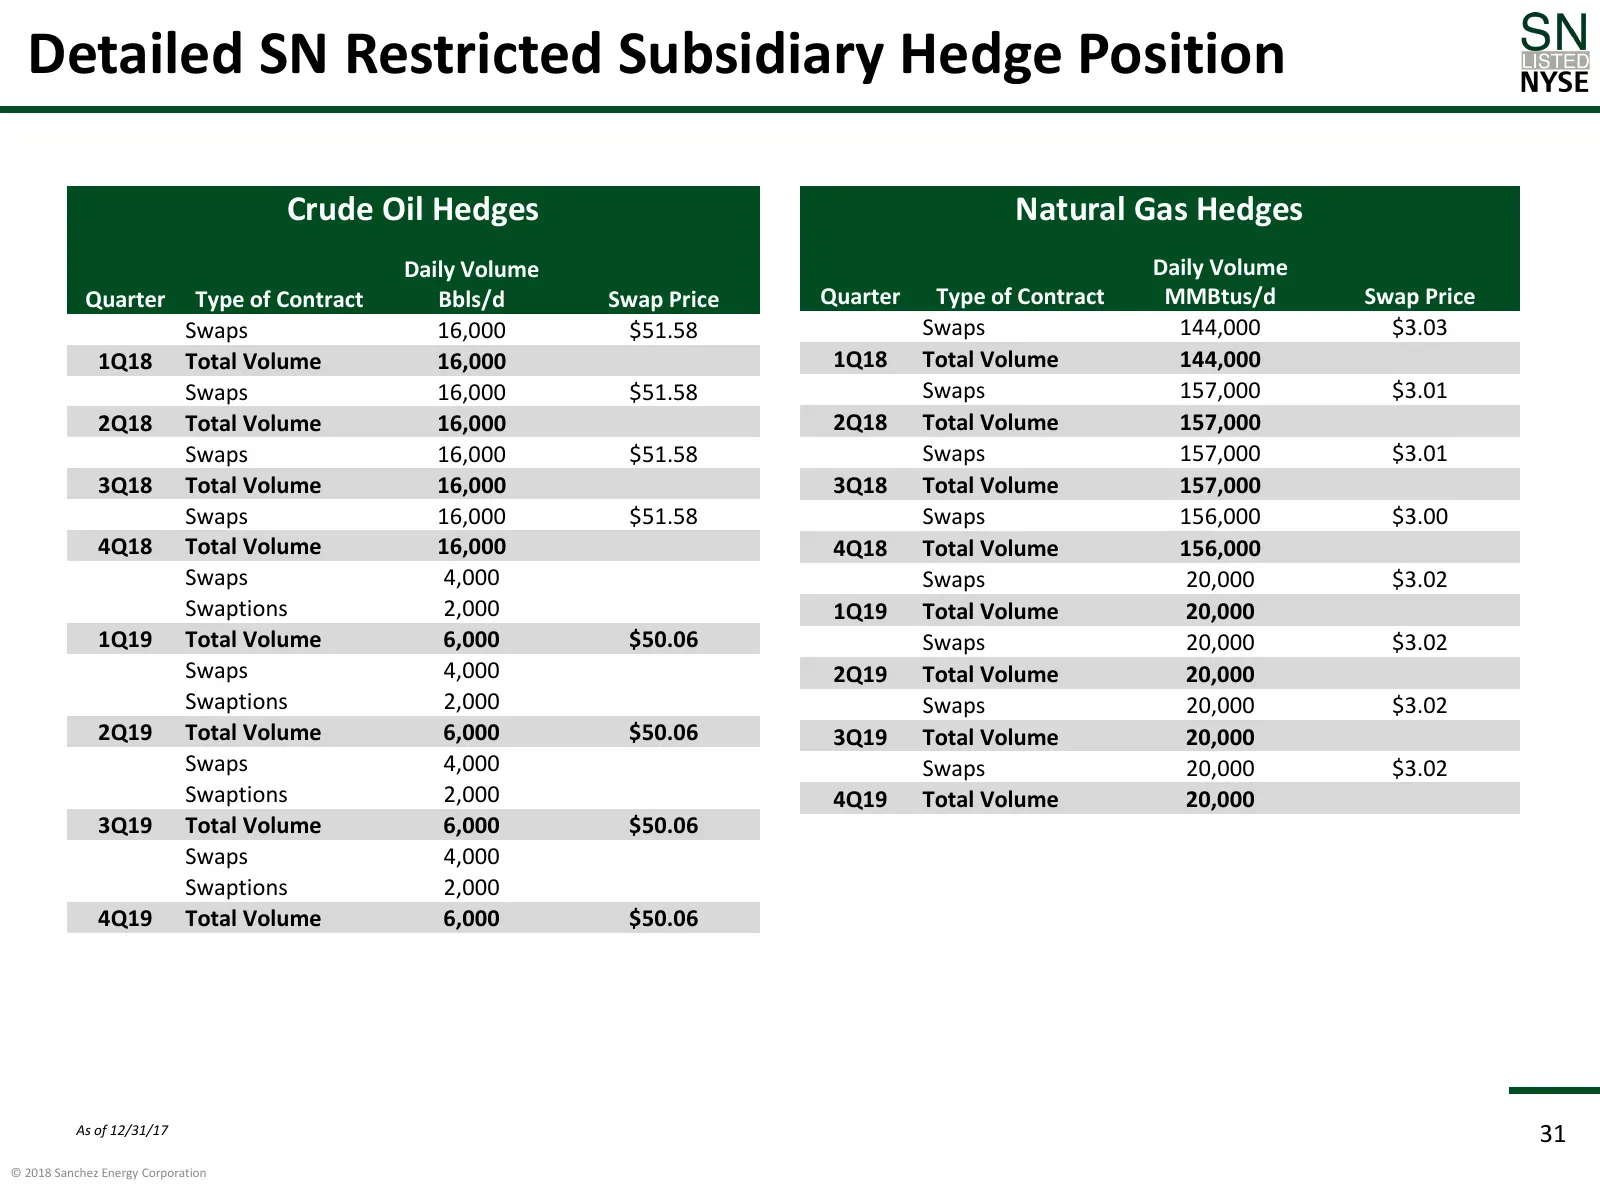
Detailed SN Restricted Subsidiary Hedge Position Crude Oil Hedges Natural Gas Hedges Daily Volume Daily Volume Quarter Type of Contract Bbls/d Swap Price Quarter Type of Contract MMBtus/d Swap Price Swaps 16,000 $51.58 Swaps 144,000 $3.03 1Q18 Total Volume 16,000 1Q18 Total Volume 144,000 Swaps 16,0
Slide 32: Detailed UnSub Hedge Position
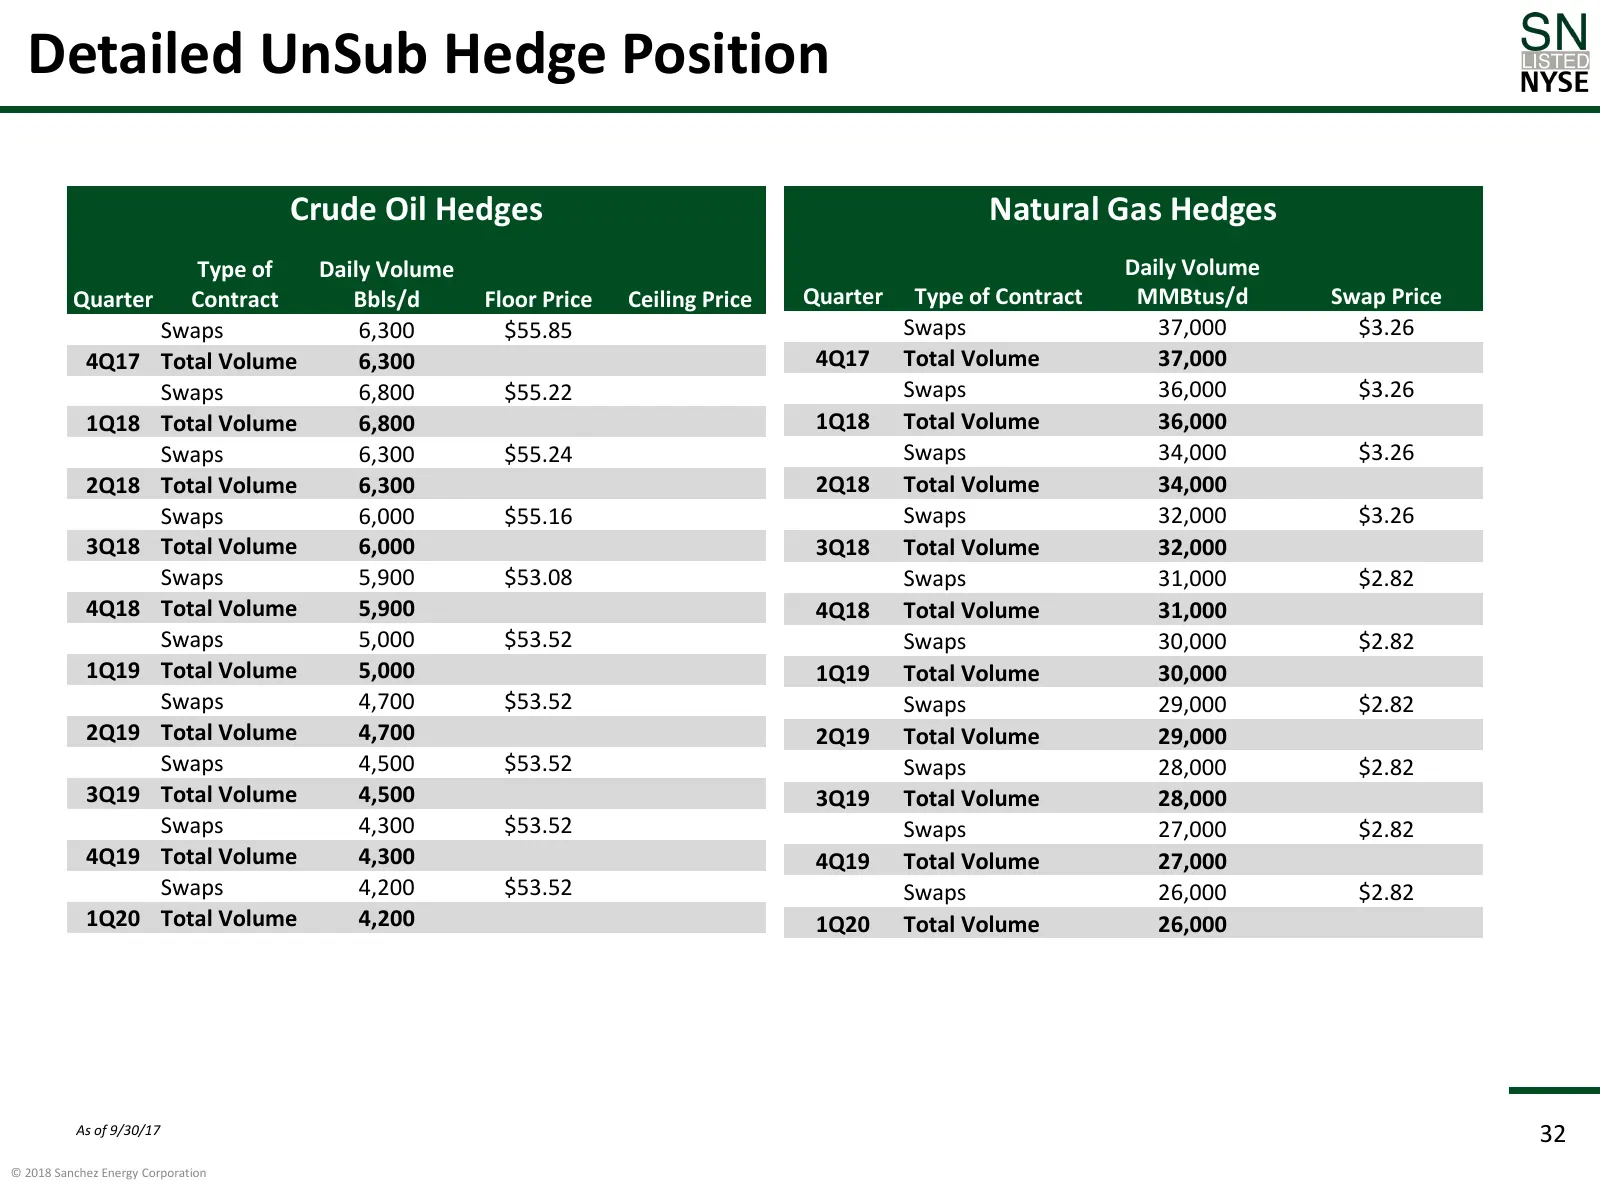
Detailed UnSub Hedge Position Crude Oil Hedges Natural Gas Hedges Type of Daily Volume Daily Volume Quarter Contract Bbls/d Floor Price Ceiling Price Quarter Type of Contract MMBtus/d Swap Price Swaps 6,300 $55.85 Swaps 37,000 $3.26 4Q17 Total Volume 6,300 4Q17 Total Volume 37,000 Swaps 6,800 $55.22
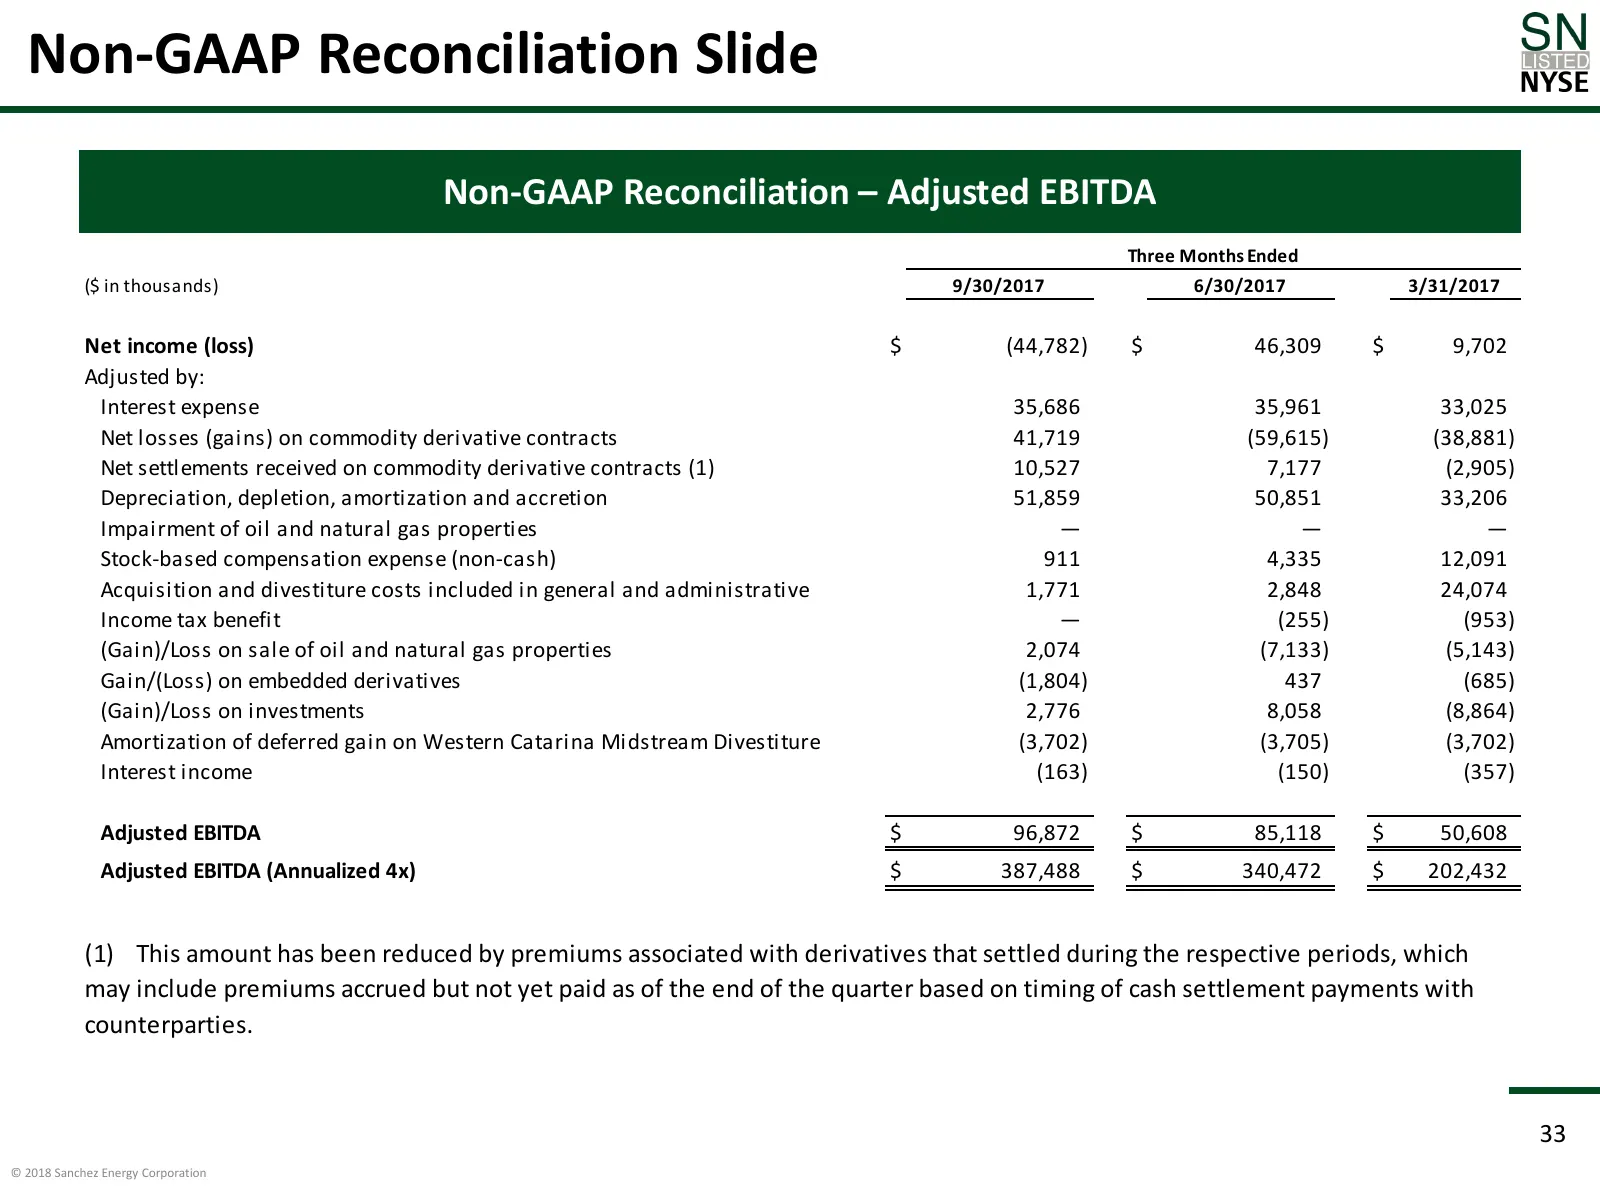
Slide 33: Non-GAAP Reconciliation – Adjusted EBITDA
Non-GAAP Reconciliation Slide Non-GAAP Reconciliation – Adjusted EBITDA Three Months Ended ($ in thousands) 9/30/2017 6/30/2017 3/31/2017 Net income (loss) $ (44,782) $ 46,309 $ 9,702 Adjusted by: Interest expense 35,686 35,961 33,025 Net losses (gains) on commodity derivative contracts 41,719 (59,6
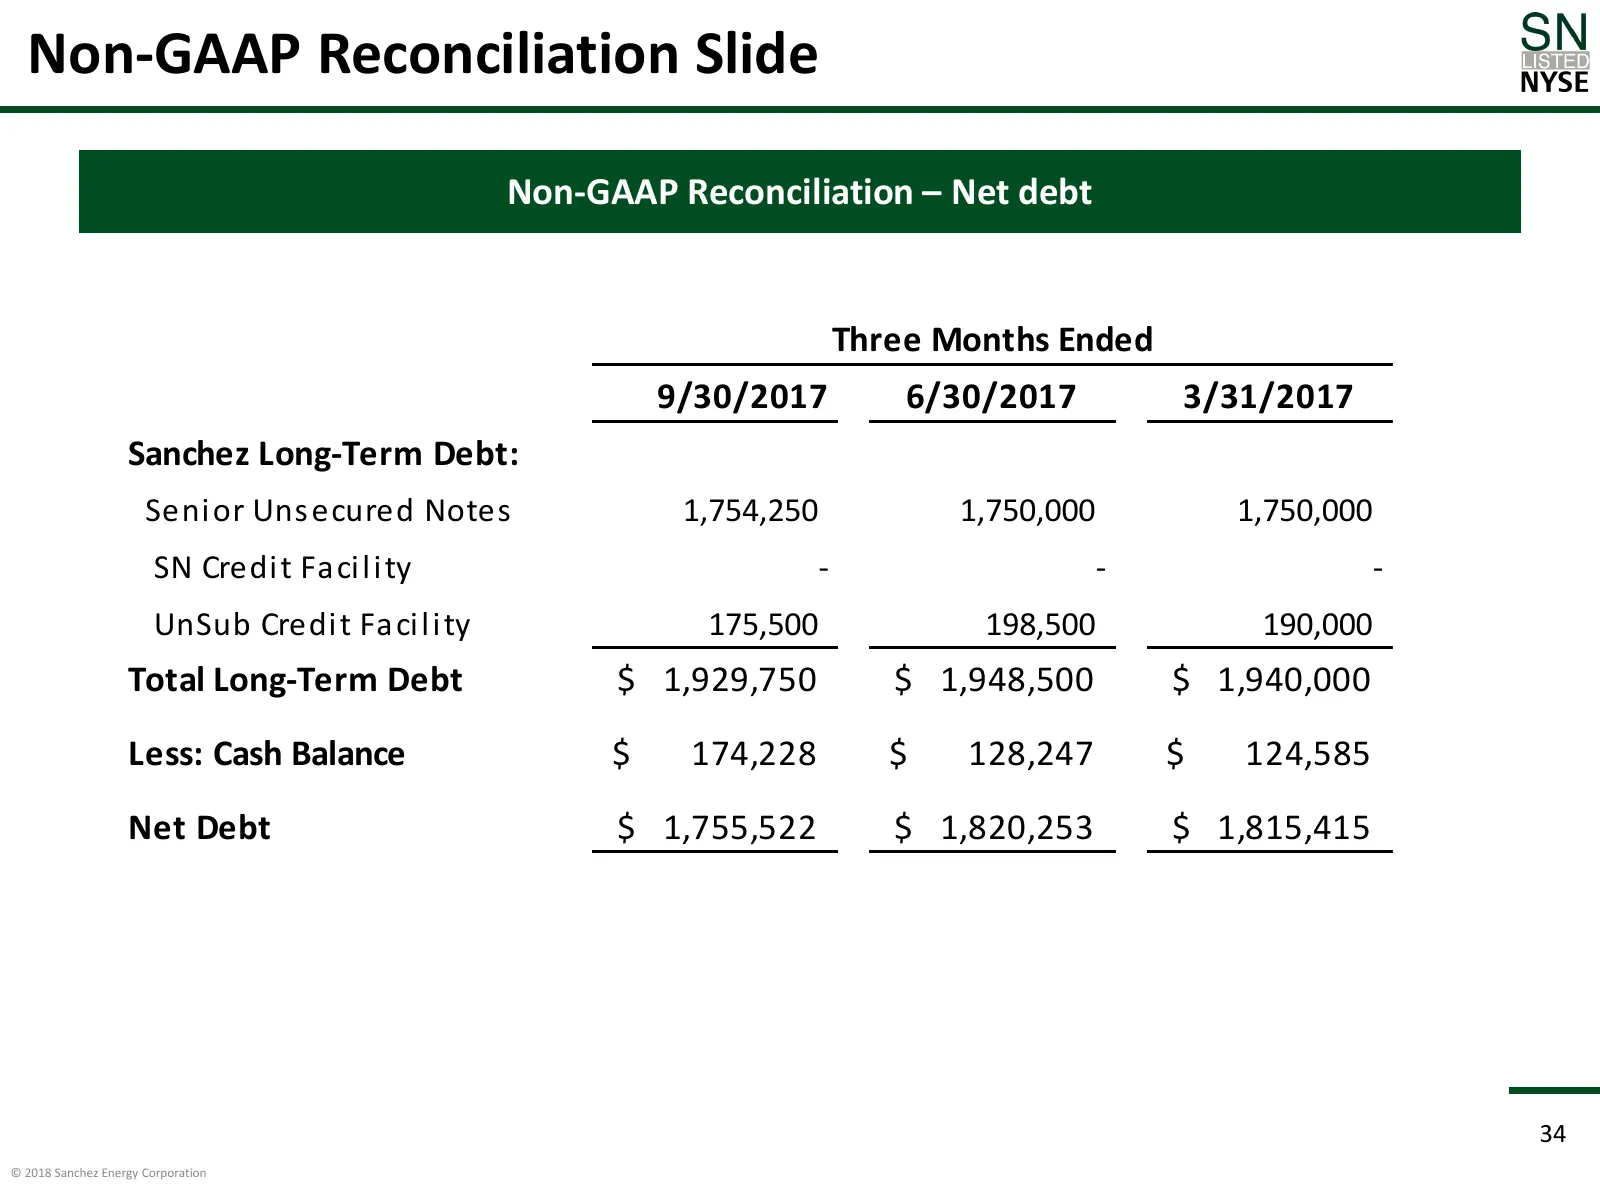
Slide 34: Non-GAAP Reconciliation – Net debt
Non-GAAP Reconciliation Slide Non-GAAP Reconciliation – Net debt Three Months Ended 9/30/2017 6/30/2017 3/31/2017 Sanchez Long-Term Debt: Seni or Uns ecured Notes 1,754,250 1,750,000 1,750,000 SN Credi t Fa ci l i ty - - - UnSub Credi t Fa ci l i ty 175,500 198,500 190,000 Total Long-Term Debt $ 1,9
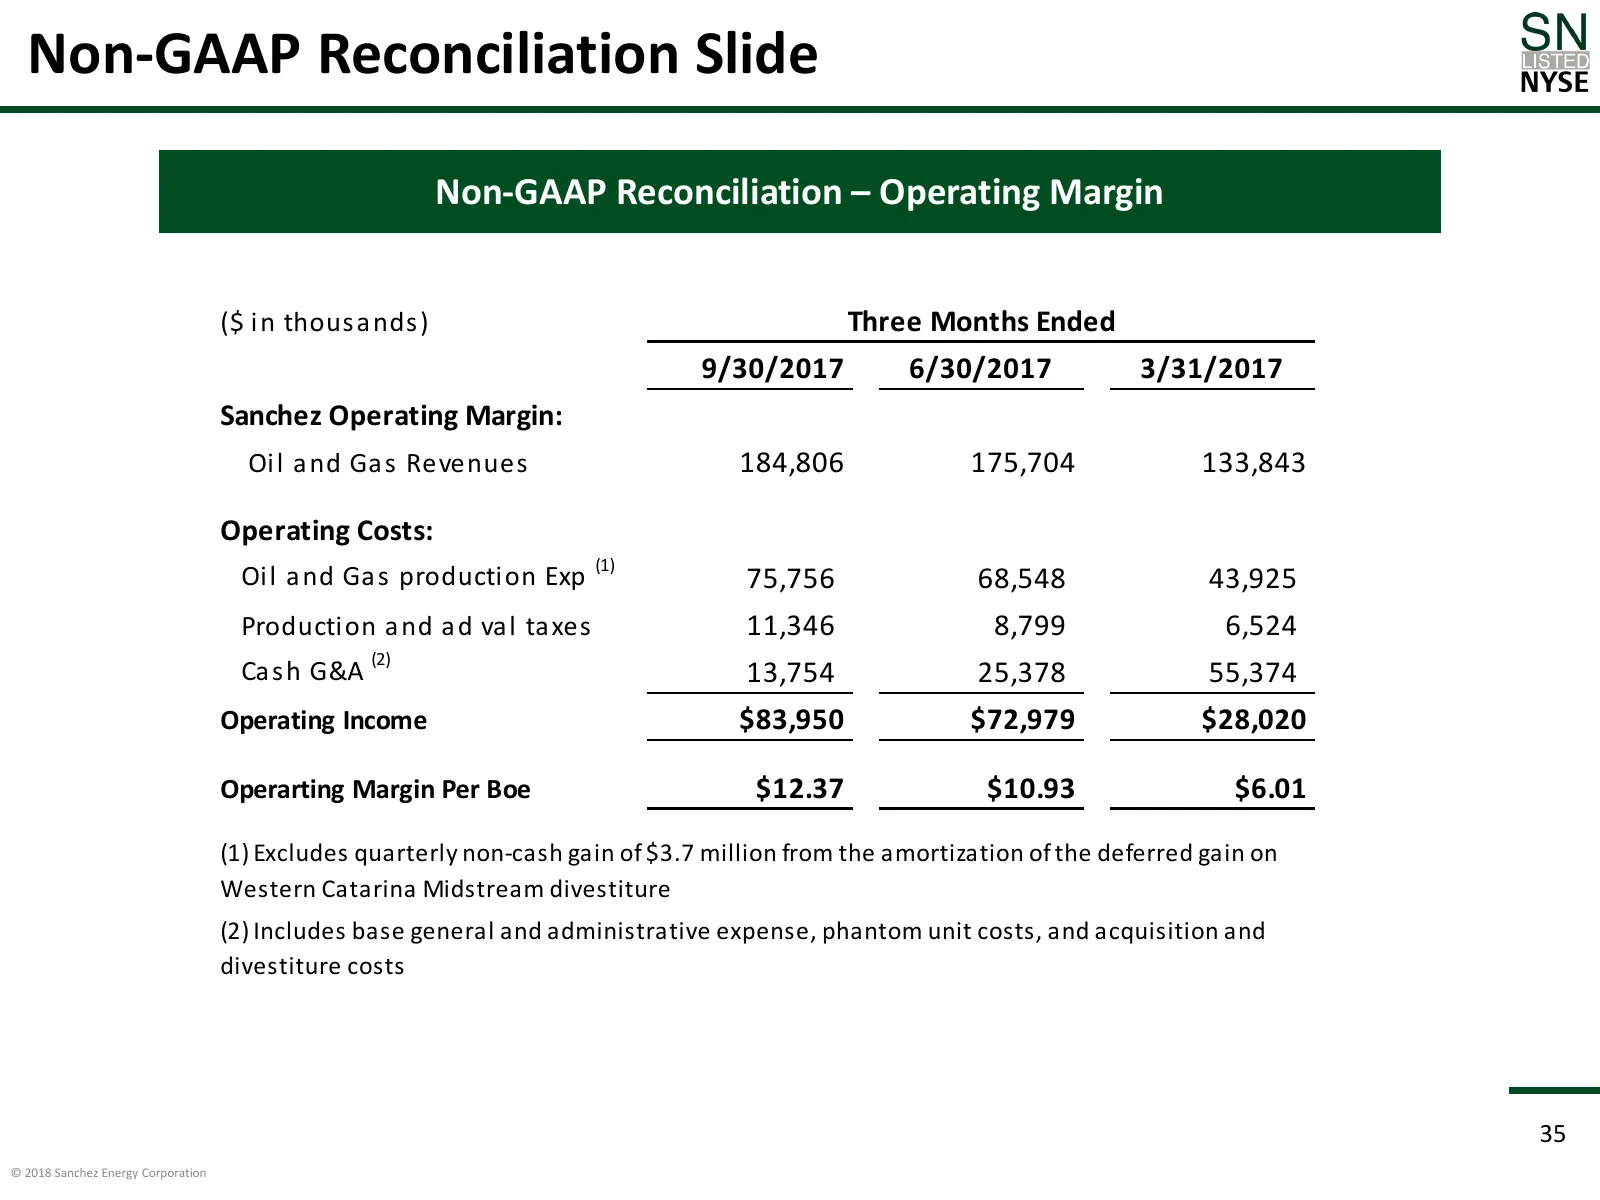
Slide 35: Non-GAAP Reconciliation – Operating Margin
Non-GAAP Reconciliation Slide Non-GAAP Reconciliation – Operating Margin ($ i n thous a nds ) Three Months Ended 9/30/2017 6/30/2017 3/31/2017 Sanchez Operating Margin: Oi l a nd Ga s Revenues 184,806 175,704 133,843 Operating Costs: (1) Oi l a nd Ga s production Exp 75,756 68,548 43,925 Production
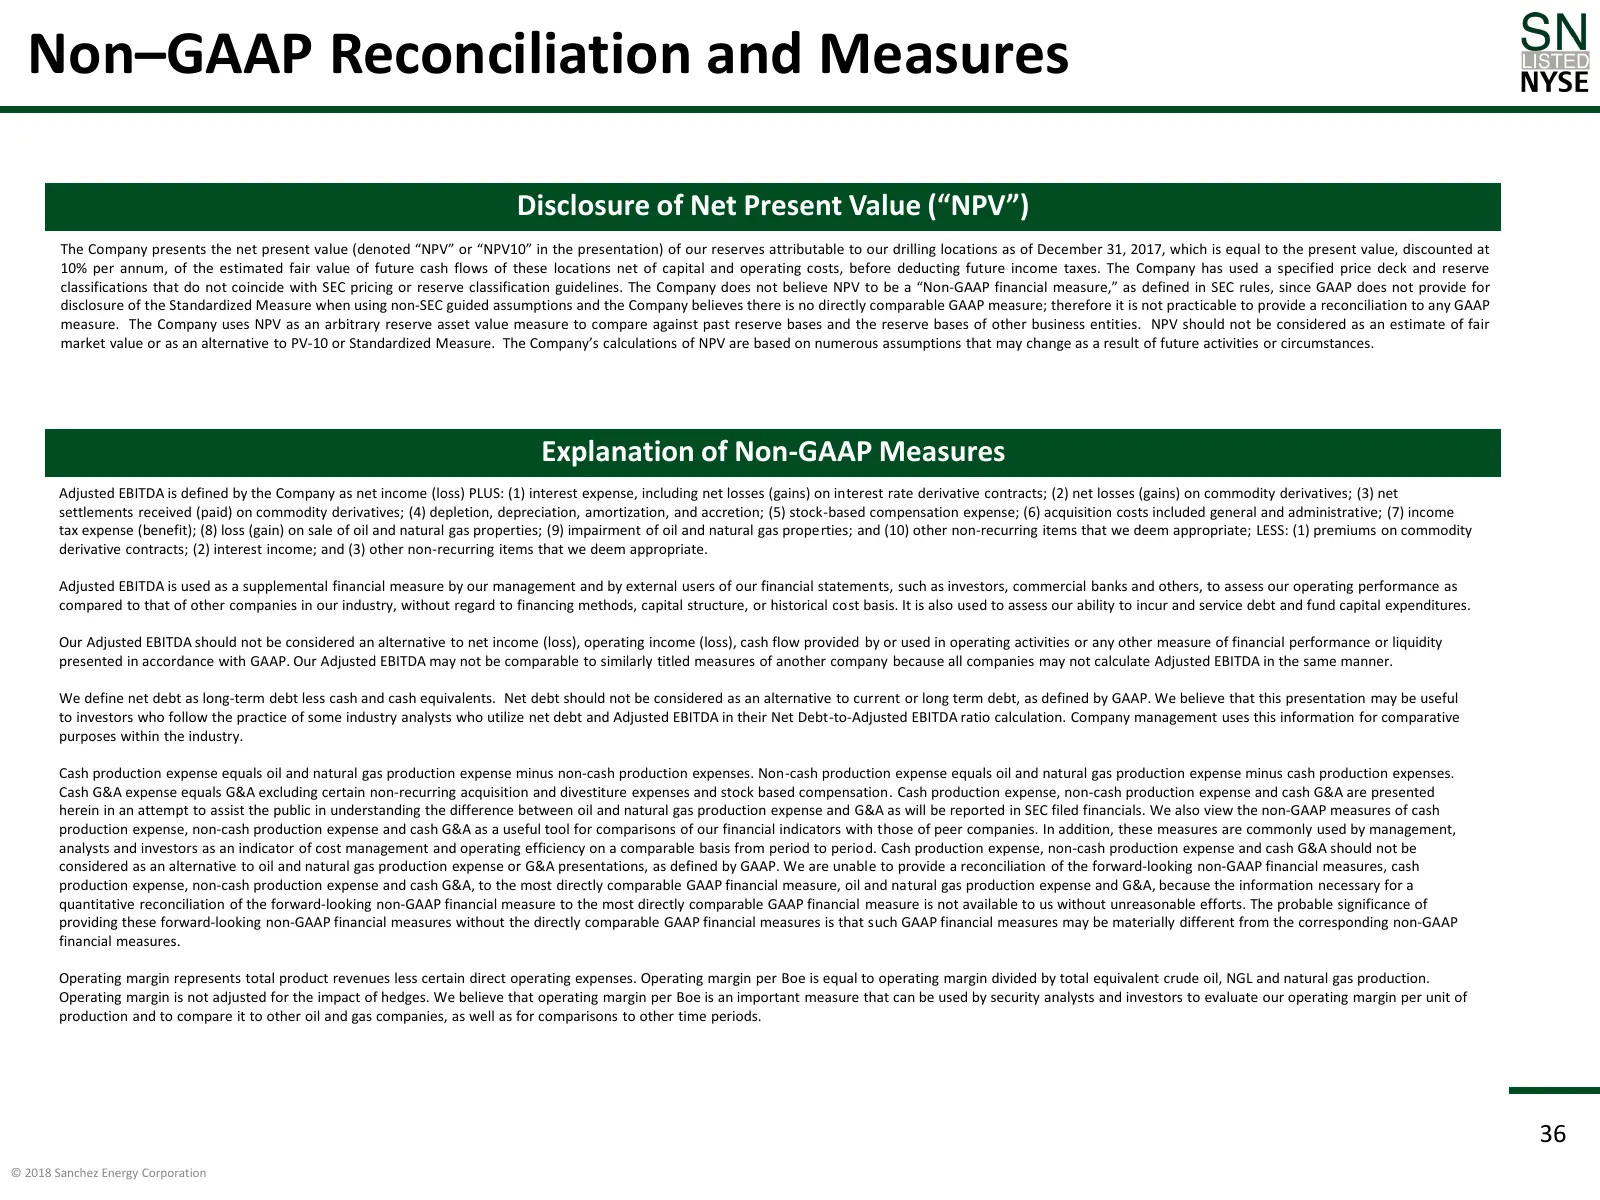
Slide 36: Non–GAAP Reconciliation and Measures
Non–GAAP Reconciliation and Measures Disclosure of Net Present Value (“NPV”) The Company presents the net present value (denoted “NPV” or “NPV10” in the presentation) of our reserves attributable to our drilling locations as of December 31, 2017, which is equal to the present value, discounted at 10
Source: SEC EDGAR · 8-K filed Feb 1, 2018
More decks from Sanchez Energy Corporation
 Corporate Update (April 2020)49 slides · Apr 7, 2020
 Corporate Update (March 2020)47 slides · Mar 11, 2020
 Presentation (August 2019)7 slides · Aug 12, 2019
 Presentation (August 2019)64 slides · Aug 12, 2019
 Debt Investor Presentation (August 2019)5 slides · Aug 12, 2019
 Investor Presentation (March 2017)46 slides · Mar 27, 2017