South Jersey Industries — Q1 2020 Earnings Presentation
27 slides from South Jersey Industries's earnings presentation, May 6, 2020

Slide 1: First Quarter 2020 Earnings Presentation
First Quarter 2020 Earnings Presentation May 7, 2020
Slide 2: Forward-Looking Statements and Use of Non-GAAP Measures
Forward-Looking Statements and Use of Non-GAAP Measures Certain statements contained in this presentation may qualify as “forward-looking statements” within the meaning of Section 27A of the Securities Act of 1933 and Section 21E of the Securities Exchange Act of 1934. All statements other than stat

Slide 3: COVID-19 Business Update
COVID-19 Business Update 3
Slide 4: COVID-19 Business Update: Operations Continue to Function Effectively
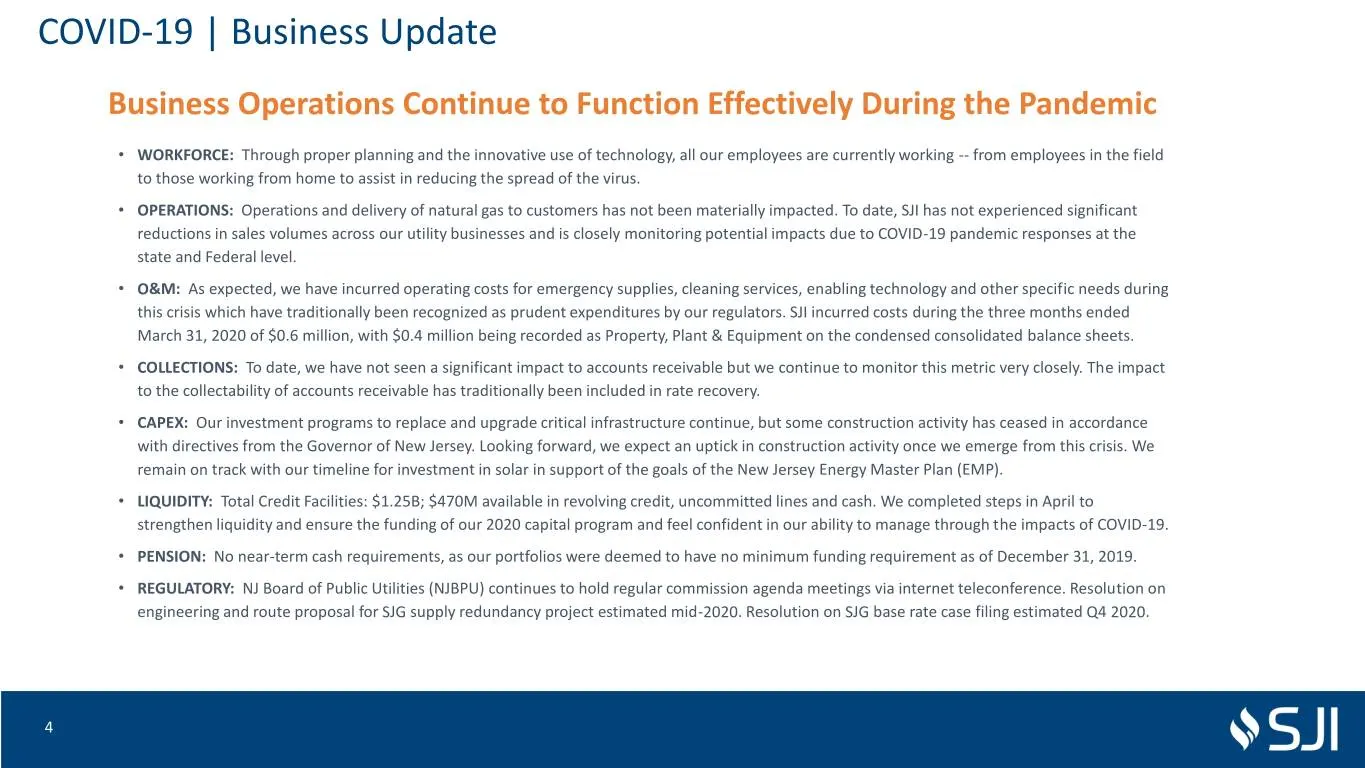
COVID-19 | Business Update Business Operations Continue to Function Effectively During the Pandemic • WORKFORCE: Through proper planning and the innovative use of technology, all our employees are currently working -- from employees in the field to those working from home to assist in reducing the s
Slide 5: First Quarter 2020 Financial Results
First Quarter 2020 Financial Results 5
Slide 6: First Quarter 2020 Financial Results Highlights
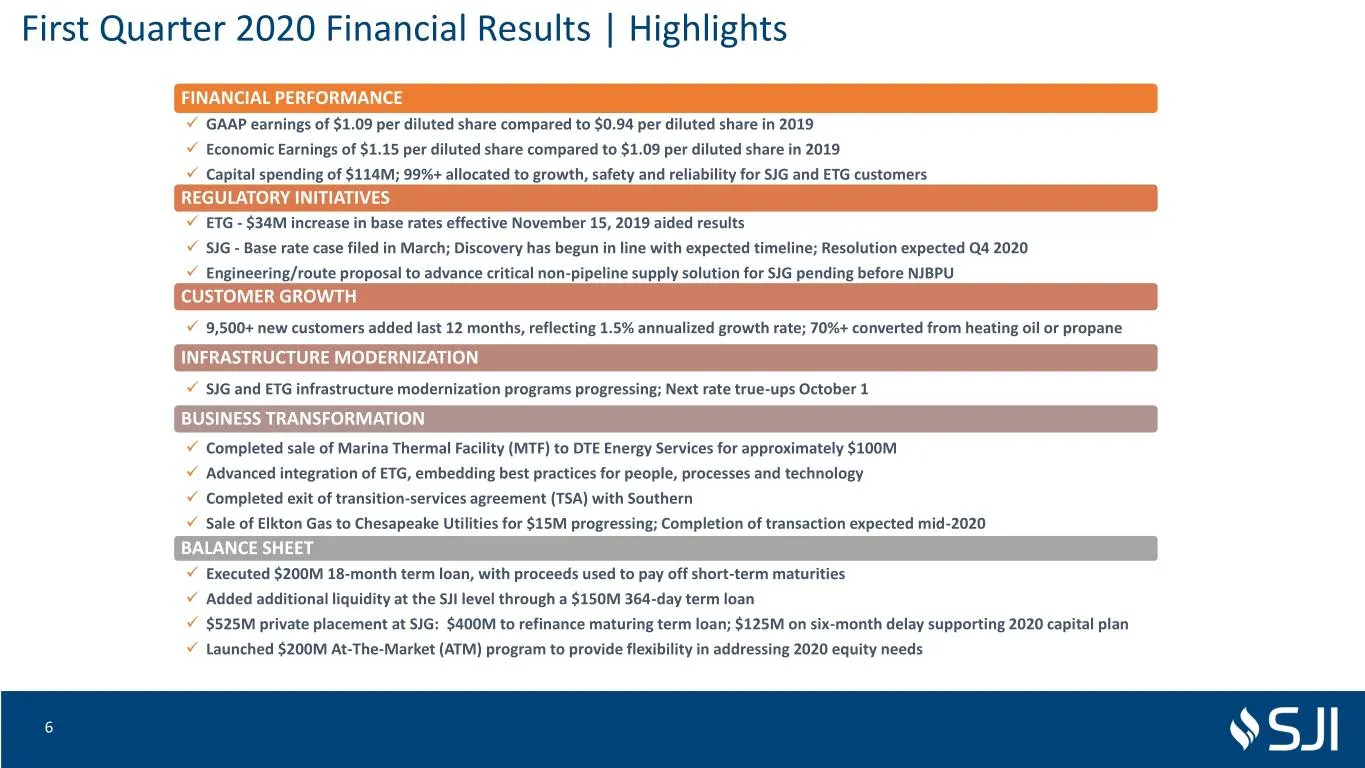
First Quarter 2020 Financial Results | Highlights FINANCIAL PERFORMANCE ✓ GAAP earnings of $1.09 per diluted share compared to $0.94 per diluted share in 2019 ✓ Economic Earnings of $1.15 per diluted share compared to $1.09 per diluted share in 2019 ✓ Capital spending of $114M; 99%+ allocated to gro
Slide 7: Consolidated 1Q 2020
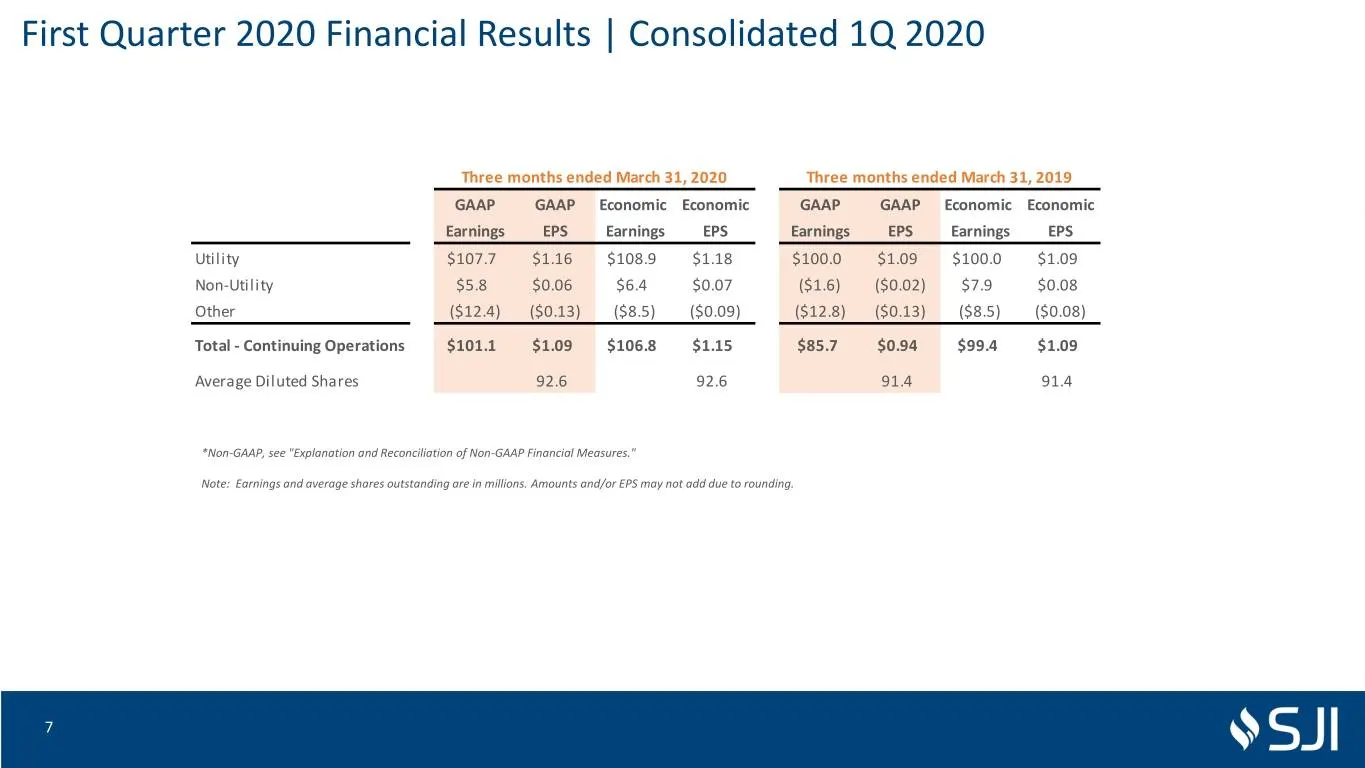
First Quarter 2020 Financial Results | Consolidated 1Q 2020 Three months ended March 31, 2020 Three months ended March 31, 2019 GAAP GAAP Economic Economic GAAP GAAP Economic Economic Earnings EPS Earnings EPS Earnings EPS Earnings EPS Utility $107.7 $1.16 $108.9 $1.18 $100.0 $1.09 $100.0 $1.09 Non-
Slide 8: Economic Earnings Bridge – Q1'19 to Q1'20
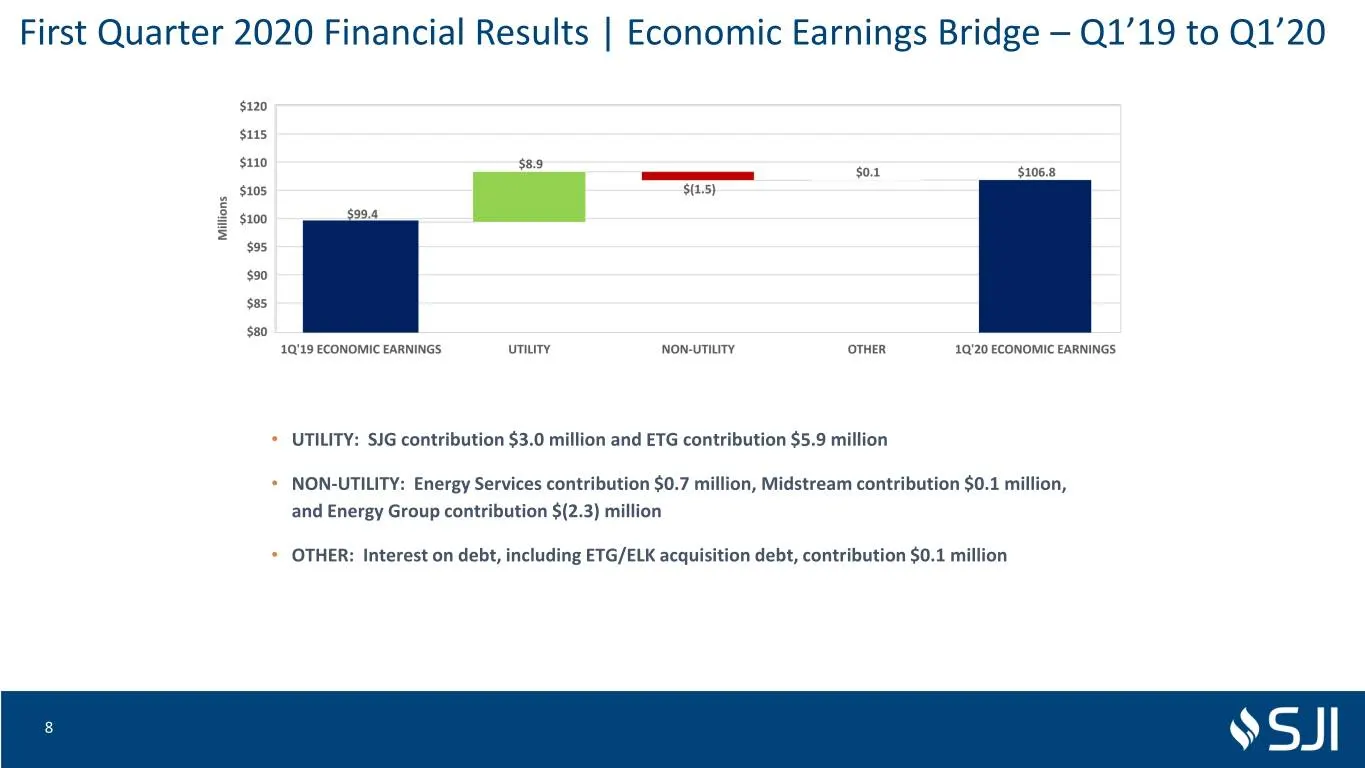
First Quarter 2020 Financial Results | Economic Earnings Bridge – Q1’19 to Q1’20 • UTILITY: SJG contribution $3.0 million and ETG contribution $5.9 million • NON-UTILITY: Energy Services contribution $0.7 million, Midstream contribution $0.1 million, and Energy Group contribution $(2.3) million • OT
Slide 9: Capital Expenditures
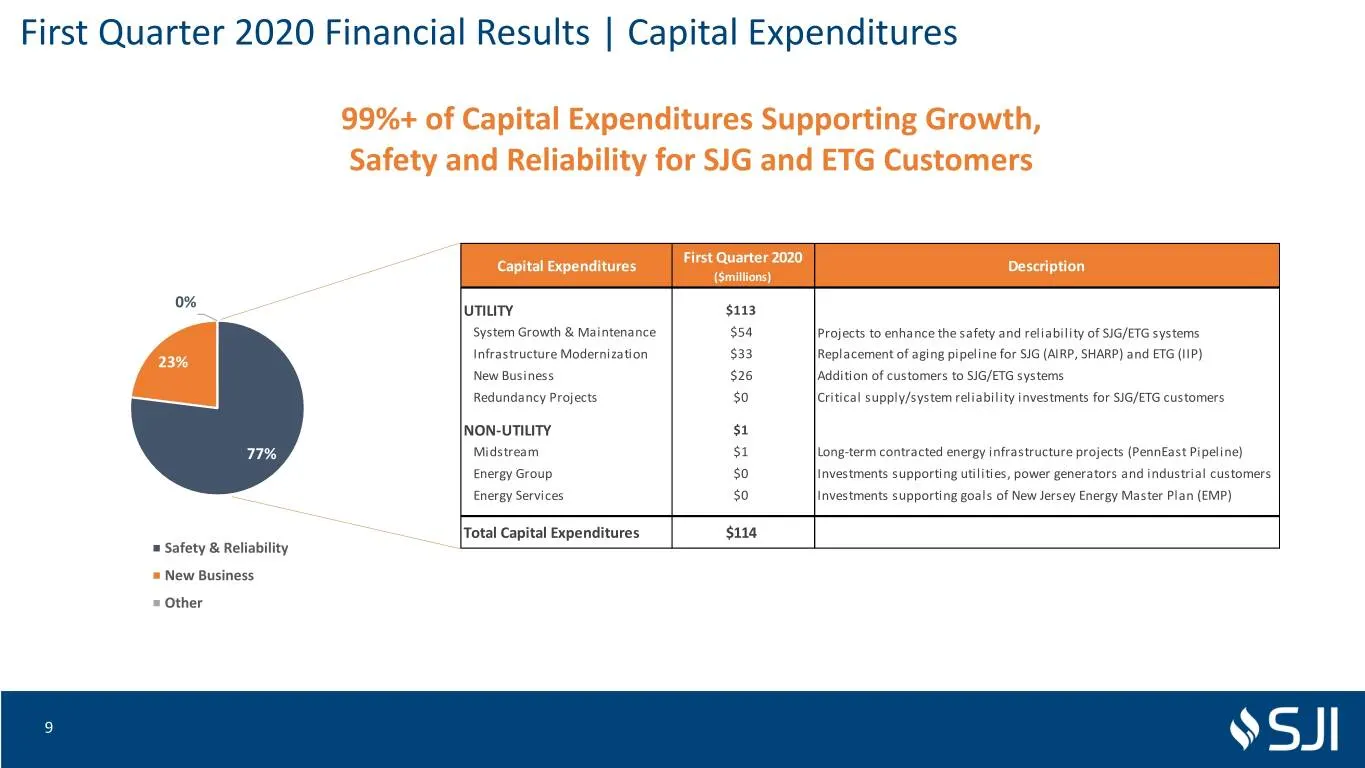
First Quarter 2020 Financial Results | Capital Expenditures 99%+ of Capital Expenditures Supporting Growth, Safety and Reliability for SJG and ETG Customers First Quarter 2020 Capital Expenditures Description ($millions) 0% UTILITY $113 System Growth & Maintenance $54 Projects to enhance the safety
Slide 10: Financing and Capitalization
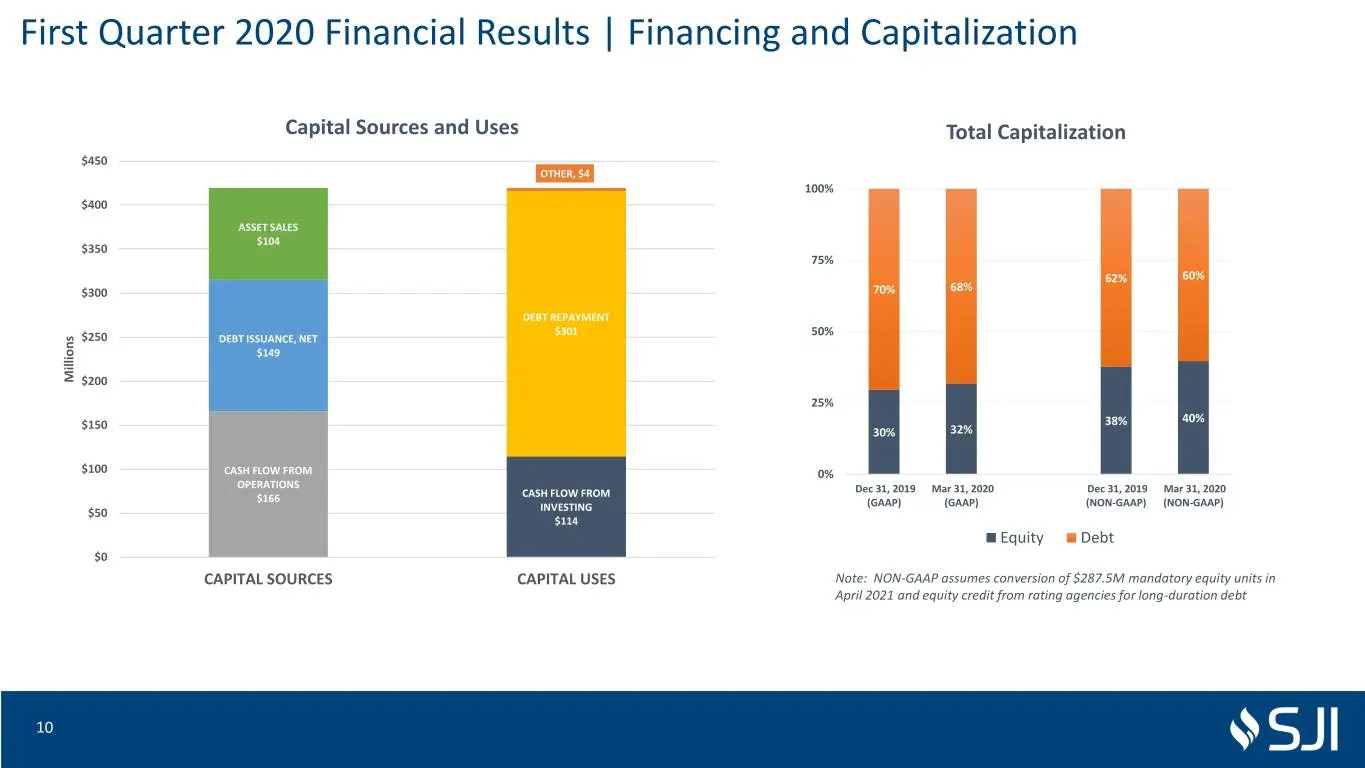
First Quarter 2020 Financial Results | Financing and Capitalization Capital Sources and Uses Total Capitalization $450 OTHER, $4 100% $400 ASSET SALES $104 $350 75% 62% 60% $300 70% 68% DEBT REPAYMENT $301 50% $250 DEBT ISSUANCE, NET $149 Millions $200 25% 40% $150 38% 30% 32% $100 CASH FLOW FROM 0%
Slide 11: Liquidity Profile
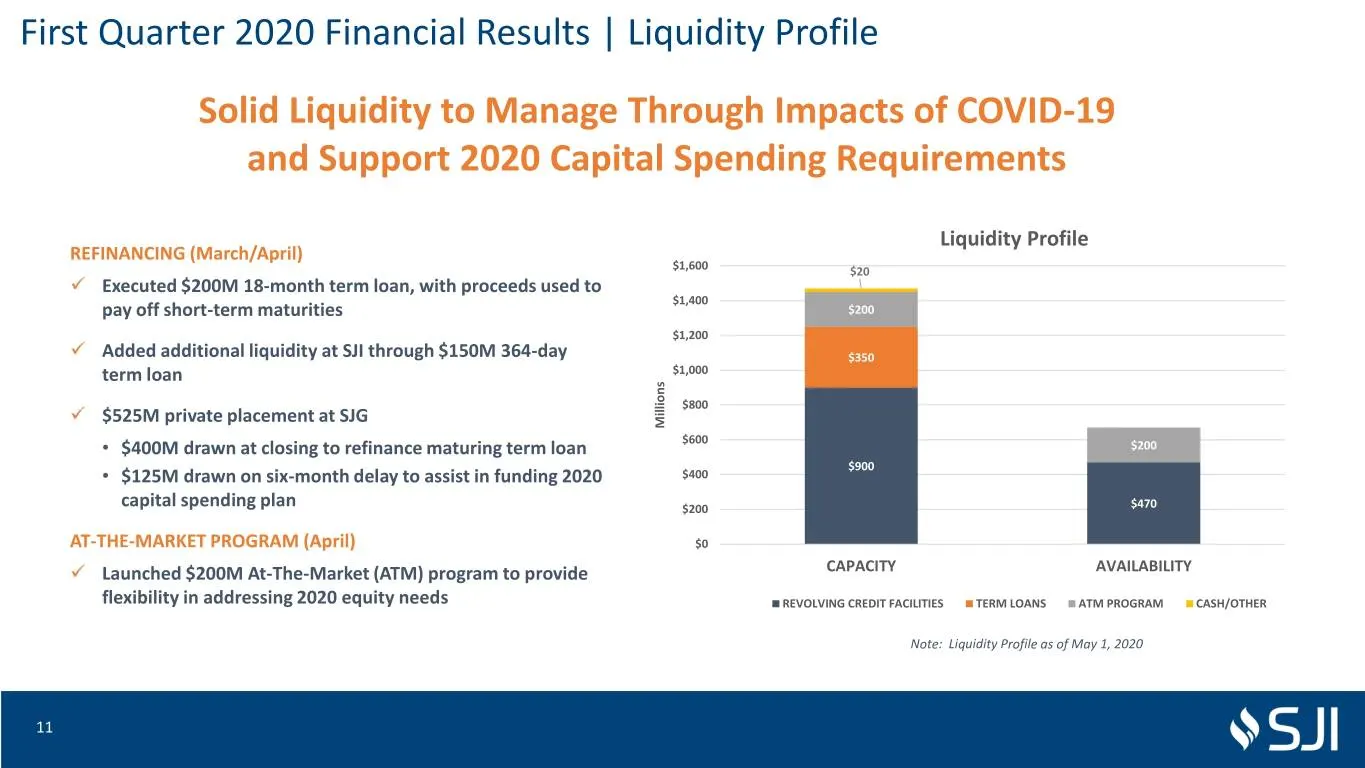
First Quarter 2020 Financial Results | Liquidity Profile Solid Liquidity to Manage Through Impacts of COVID-19 and Support 2020 Capital Spending Requirements Liquidity Profile REFINANCING (March/April) $1,600 $20 ✓ Executed $200M 18-month term loan, with proceeds used to $1,400 pay off short-term ma
Slide 12: 2020 Financial Outlook
2020 Financial Outlook 12
Slide 13: 2020 Financial Outlook Priorities
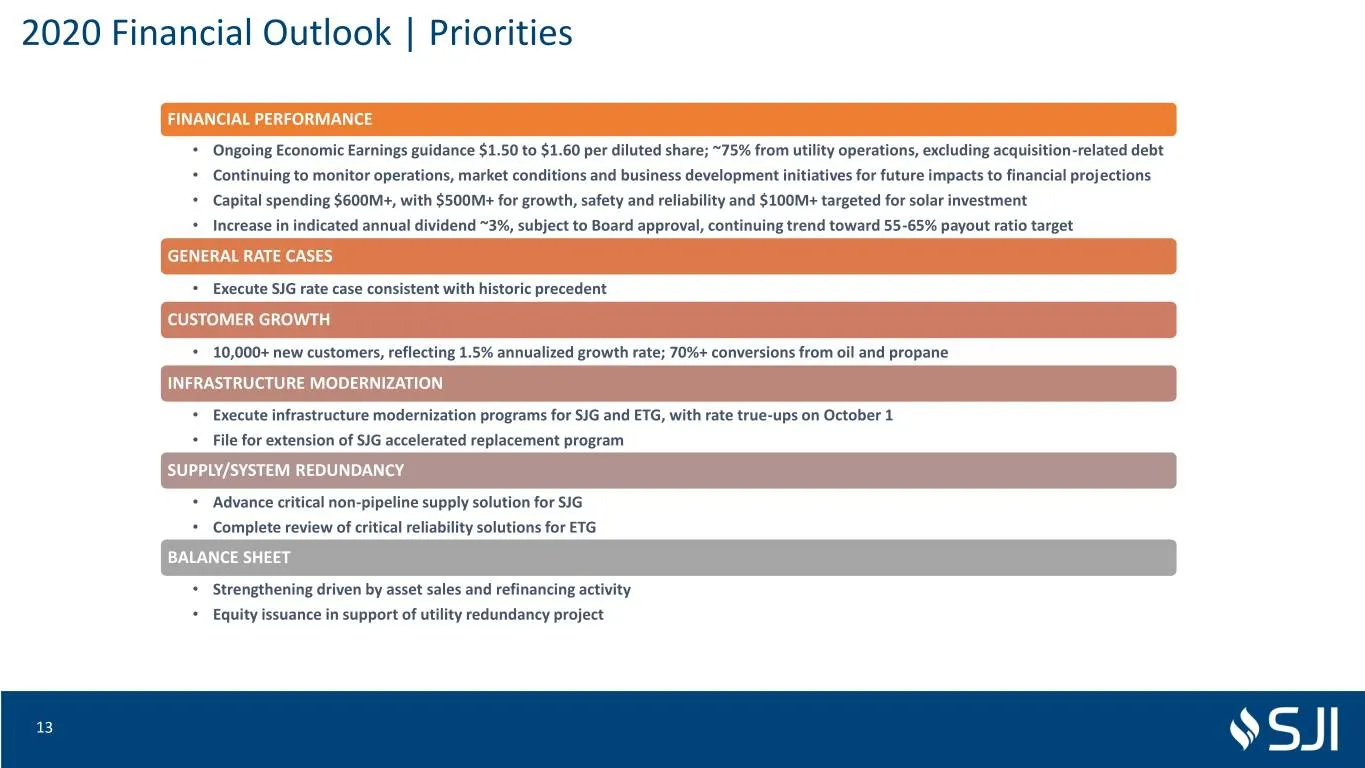
2020 Financial Outlook | Priorities FINANCIAL PERFORMANCE • Ongoing Economic Earnings guidance $1.50 to $1.60 per diluted share; ~75% from utility operations, excluding acquisition-related debt • Continuing to monitor operations, market conditions and business development initiatives for future impa
Slide 14: Regulatory Initiatives
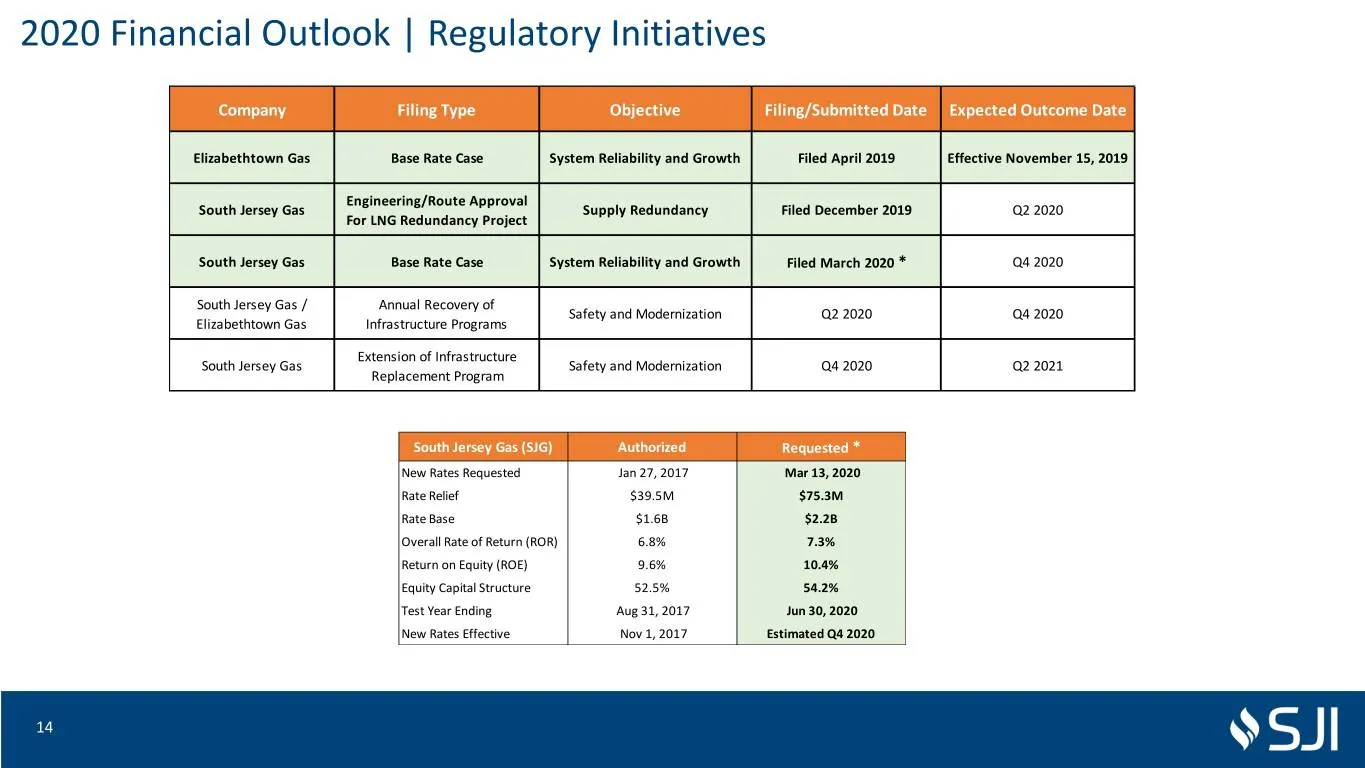
2020 Financial Outlook | Regulatory Initiatives Company Filing Type Objective Filing/Submitted Date Expected Outcome Date Elizabethtown Gas Base Rate Case System Reliability and Growth Filed April 2019 Effective November 15, 2019 Engineering/Route Approval South Jersey Gas Supply Redundancy Filed De
Slide 15: Ongoing Economic Earnings: $1.50-$1.60 Per Diluted Share
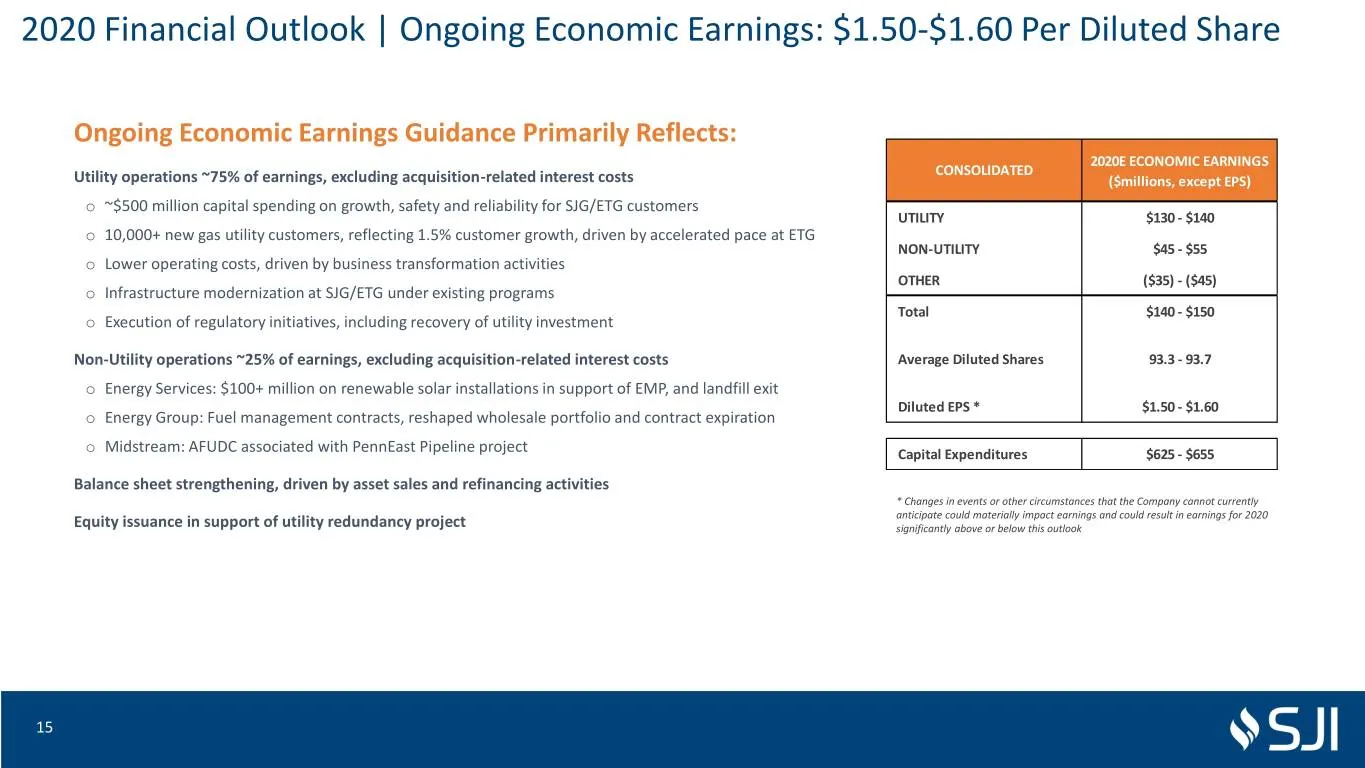
2020 Financial Outlook | Ongoing Economic Earnings: $1.50-$1.60 Per Diluted Share Ongoing Economic Earnings Guidance Primarily Reflects: 2020E ECONOMIC EARNINGS CONSOLIDATED Utility operations ~75% of earnings, excluding acquisition-related interest costs ($millions, except EPS) o ~$500 million capi
Slide 16: Economic Earnings Bridge - 2019 to 2020 Midpoints
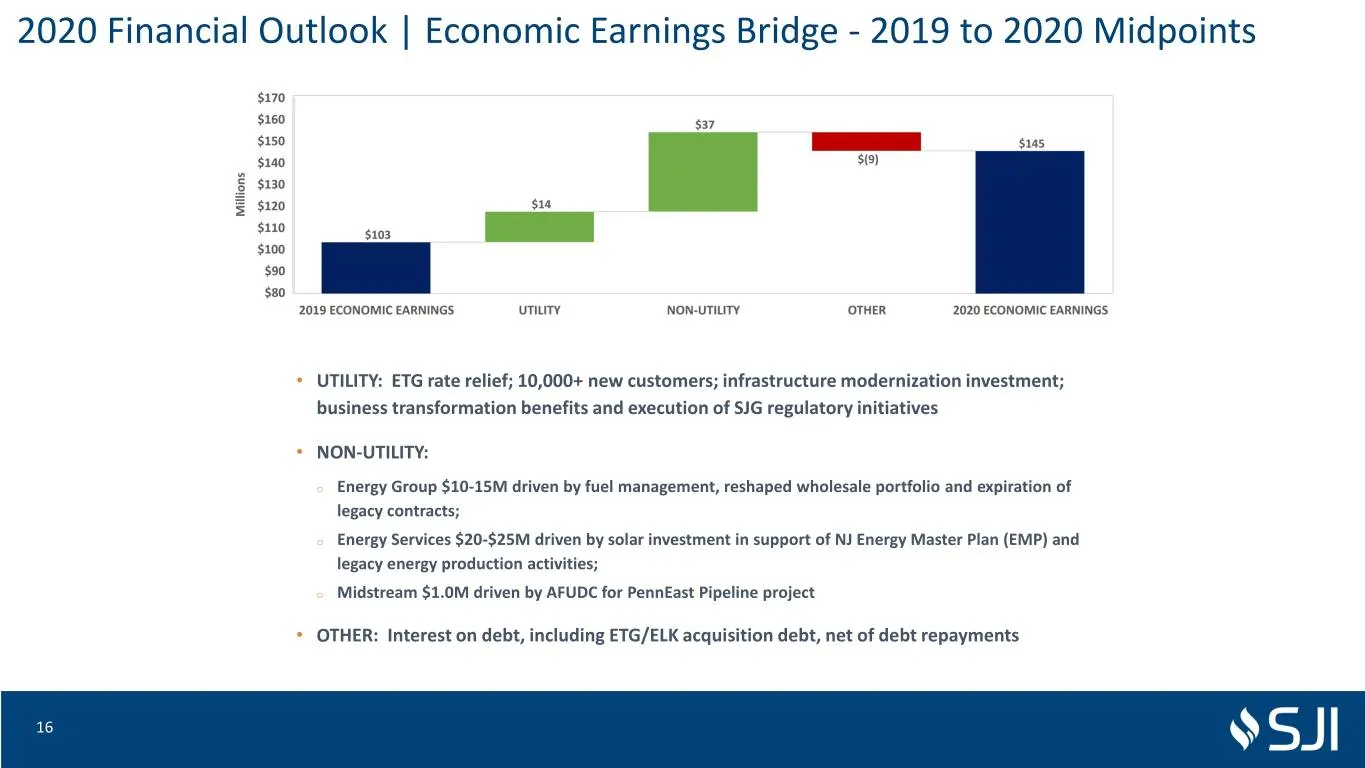
2020 Financial Outlook | Economic Earnings Bridge - 2019 to 2020 Midpoints • UTILITY: ETG rate relief; 10,000+ new customers; infrastructure modernization investment; business transformation benefits and execution of SJG regulatory initiatives • NON-UTILITY: o Energy Group $10-15M driven by fuel man
Slide 17: Capital Expenditures
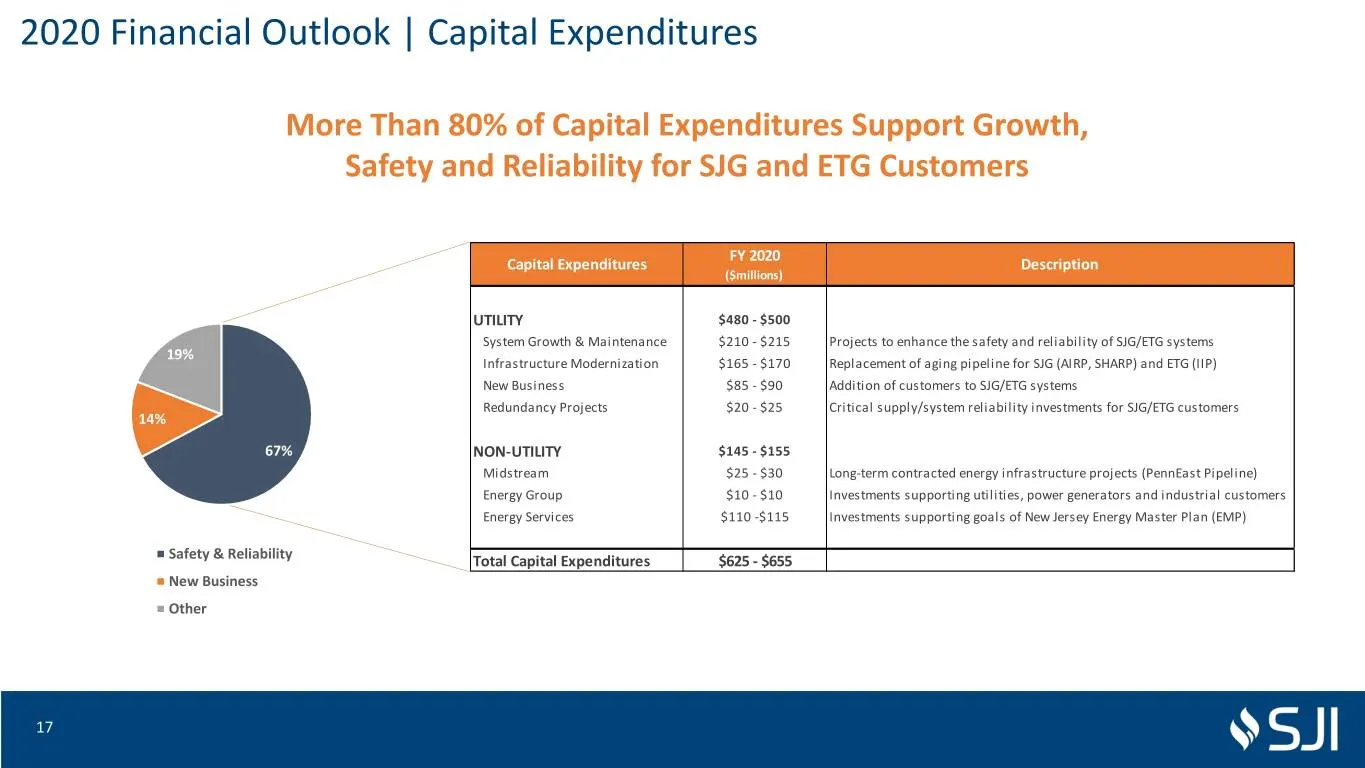
2020 Financial Outlook | Capital Expenditures More Than 80% of Capital Expenditures Support Growth, Safety and Reliability for SJG and ETG Customers FY 2020 Capital Expenditures Description ($millions) UTILITY $480 - $500 System Growth & Maintenance $210 - $215 Projects to enhance the safety and rel
Slide 18: Capital Sources & Uses
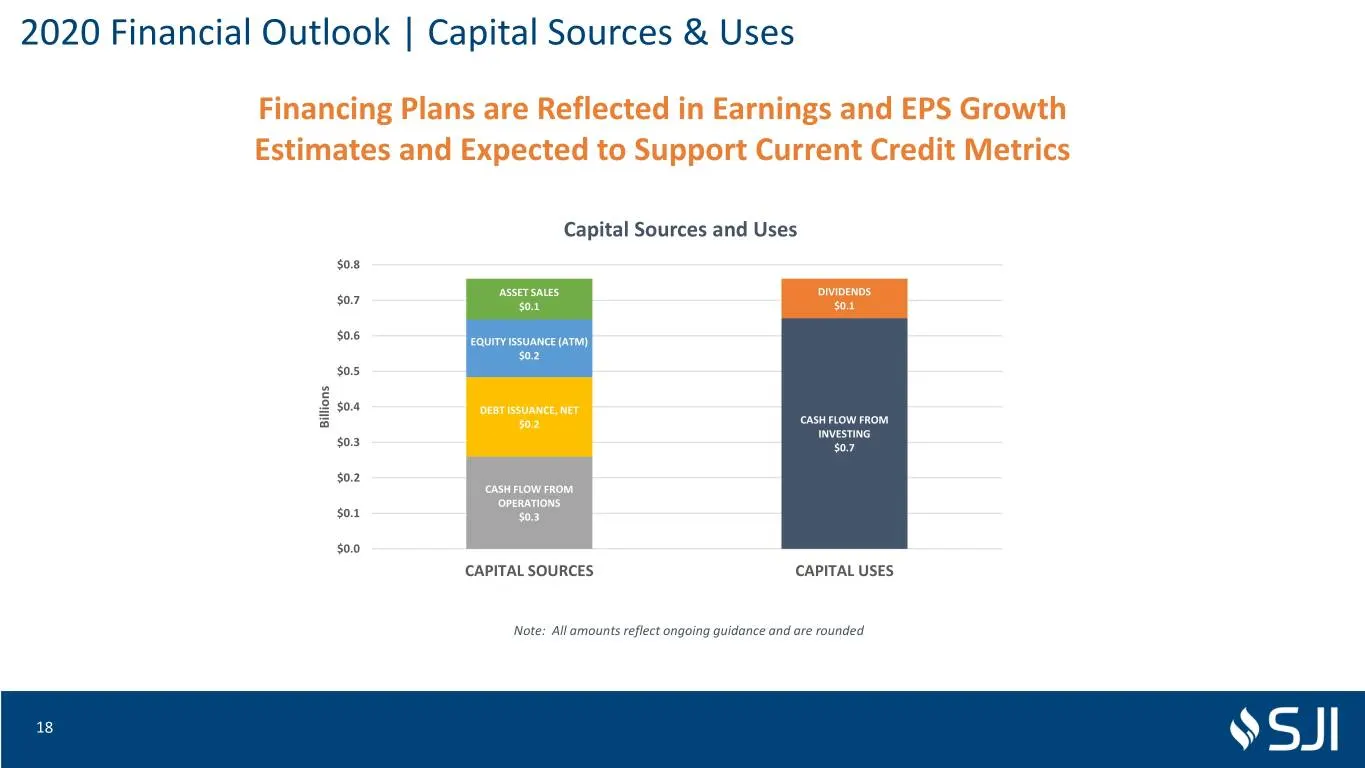
2020 Financial Outlook | Capital Sources & Uses Financing Plans are Reflected in Earnings and EPS Growth Estimates and Expected to Support Current Credit Metrics Capital Sources and Uses $0.8 ASSET SALES DIVIDENDS $0.7 $0.1 $0.1 $0.6 EQUITY ISSUANCE (ATM) $0.2 $0.5 $0.4 DEBT ISSUANCE, NET CASH FLOW
Slide 19: Appendix
Appendix 19
Slide 20: Segment Information
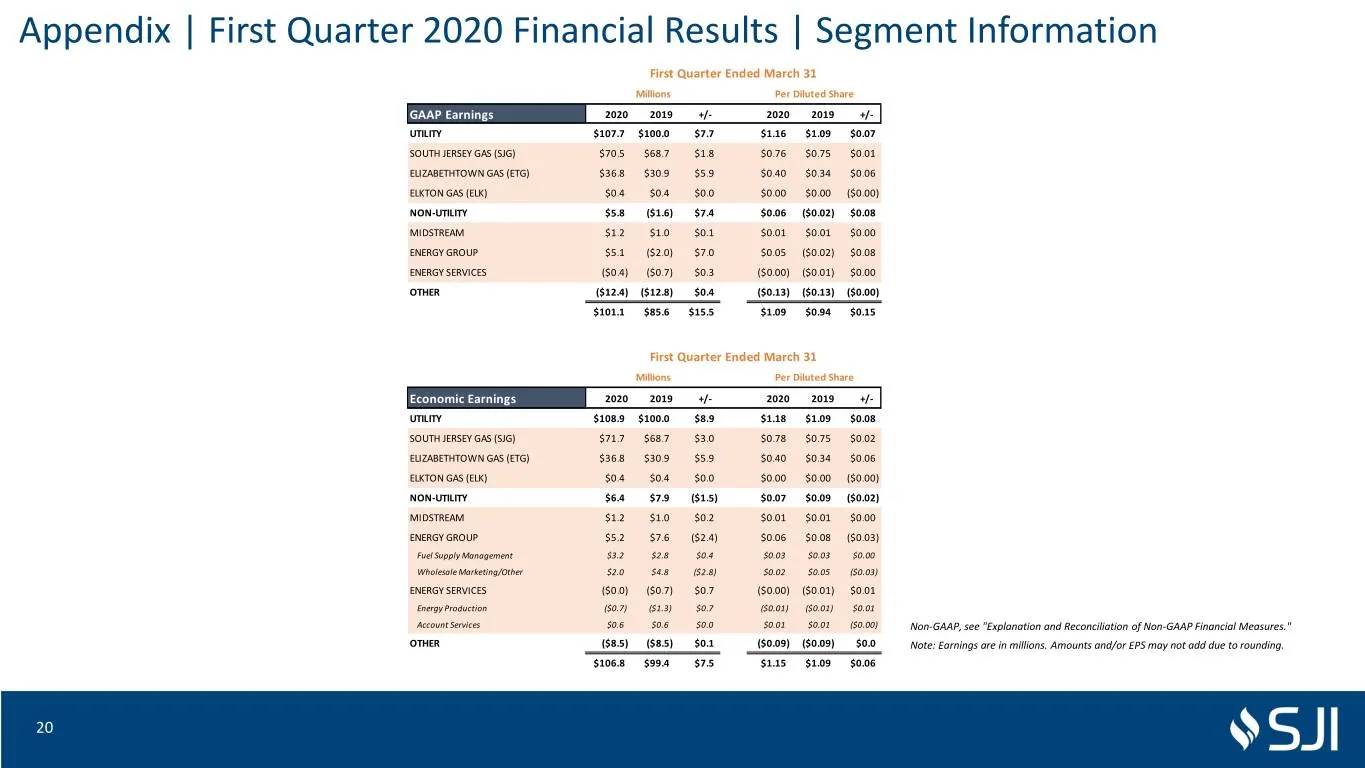
Appendix | First Quarter 2020 Financial Results | Segment Information First Quarter Ended March 31 Millions Per Diluted Share GAAP Earnings 2020 2019 +/- 2020 2019 +/- UTILITY $107.7 $100.0 $7.7 $1.16 $1.09 $0.07 SOUTH JERSEY GAS (SJG) $70.5 $68.7 $1.8 $0.76 $0.75 $0.01 ELIZABETHTOWN GAS (ETG) $36.8
Slide 21: Utility Economic Earnings Bridge – Q1'19 to Q1'20
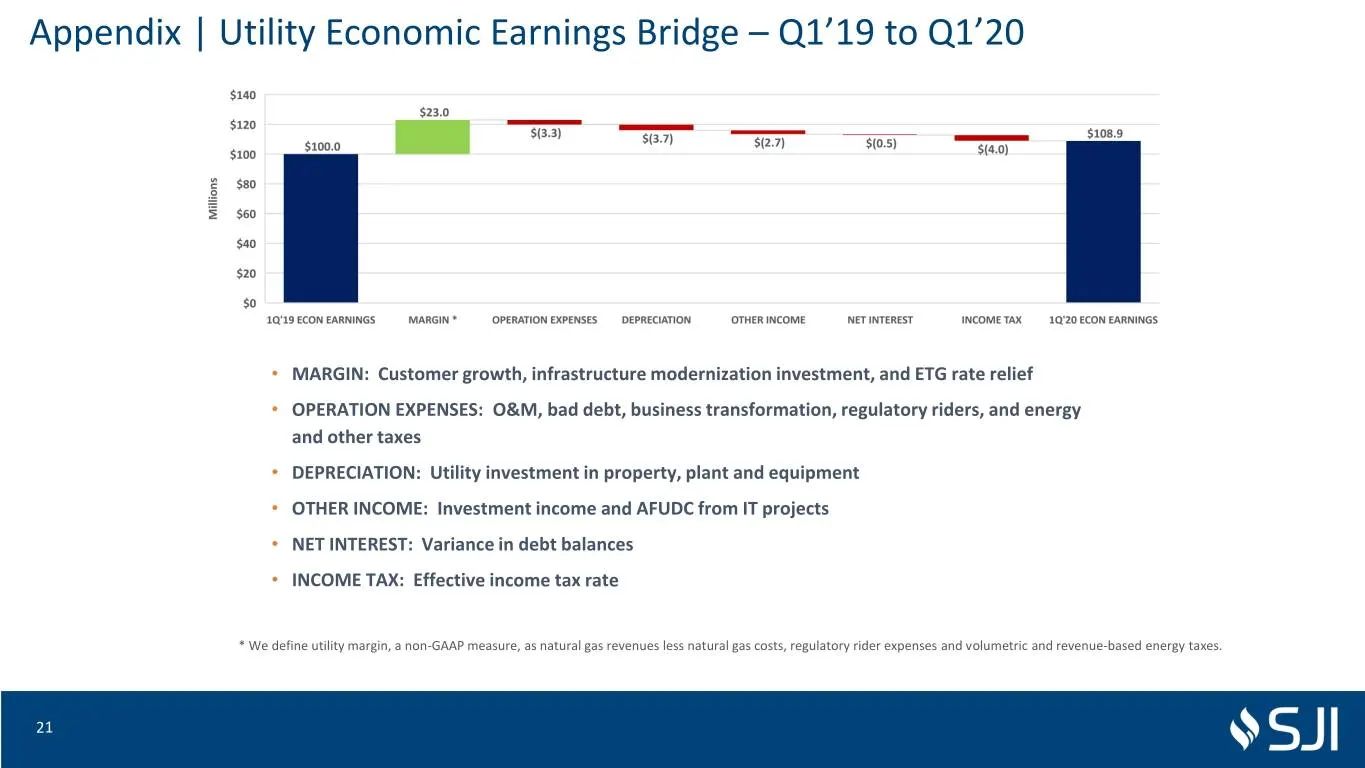
Appendix | Utility Economic Earnings Bridge – Q1’19 to Q1’20 • MARGIN: Customer growth, infrastructure modernization investment, and ETG rate relief • OPERATION EXPENSES: O&M, bad debt, business transformation, regulatory riders, and energy and other taxes • DEPRECIATION: Utility investment in prope
Slide 22: Non-Utility Economic Earnings Bridge – Q1'19 to Q1'20
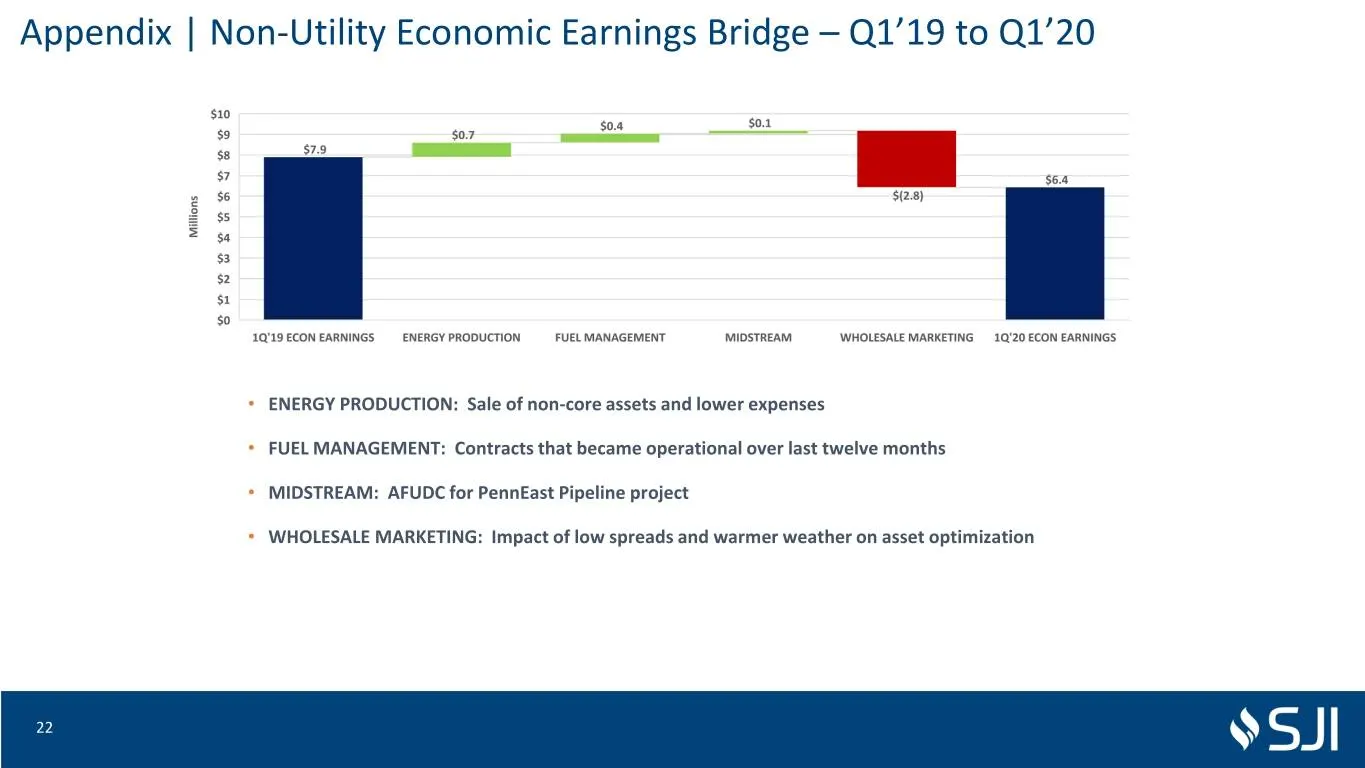
Appendix | Non-Utility Economic Earnings Bridge – Q1’19 to Q1’20 • ENERGY PRODUCTION: Sale of non-core assets and lower expenses • FUEL MANAGEMENT: Contracts that became operational over last twelve months • MIDSTREAM: AFUDC for PennEast Pipeline project • WHOLESALE MARKETING: Impact of low spreads
Slide 23: New Jersey Energy Master Plan (EMP)
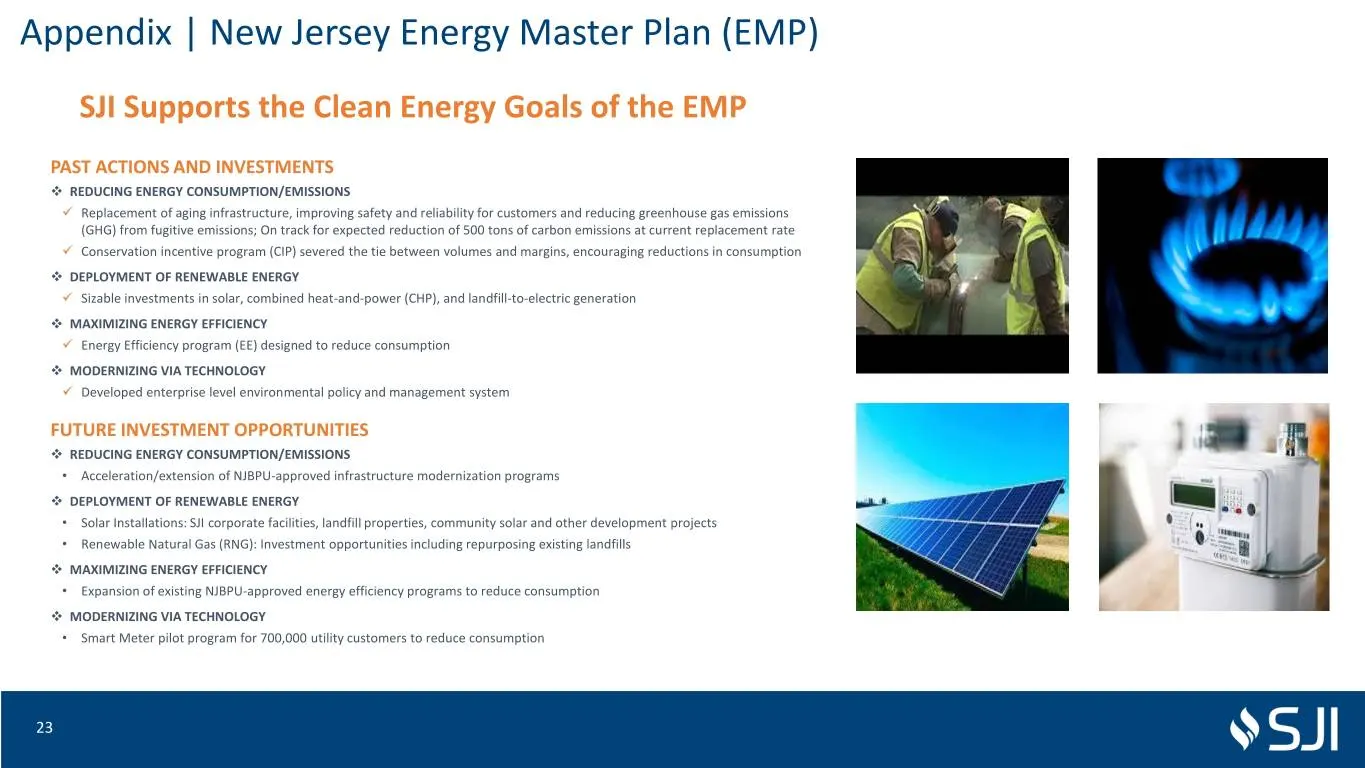
Appendix | New Jersey Energy Master Plan (EMP) SJI Supports the Clean Energy Goals of the EMP PAST ACTIONS AND INVESTMENTS ❖ REDUCING ENERGY CONSUMPTION/EMISSIONS ✓ Replacement of aging infrastructure, improving safety and reliability for customers and reducing greenhouse gas emissions (GHG) from fu
Slide 24: PennEast Pipeline
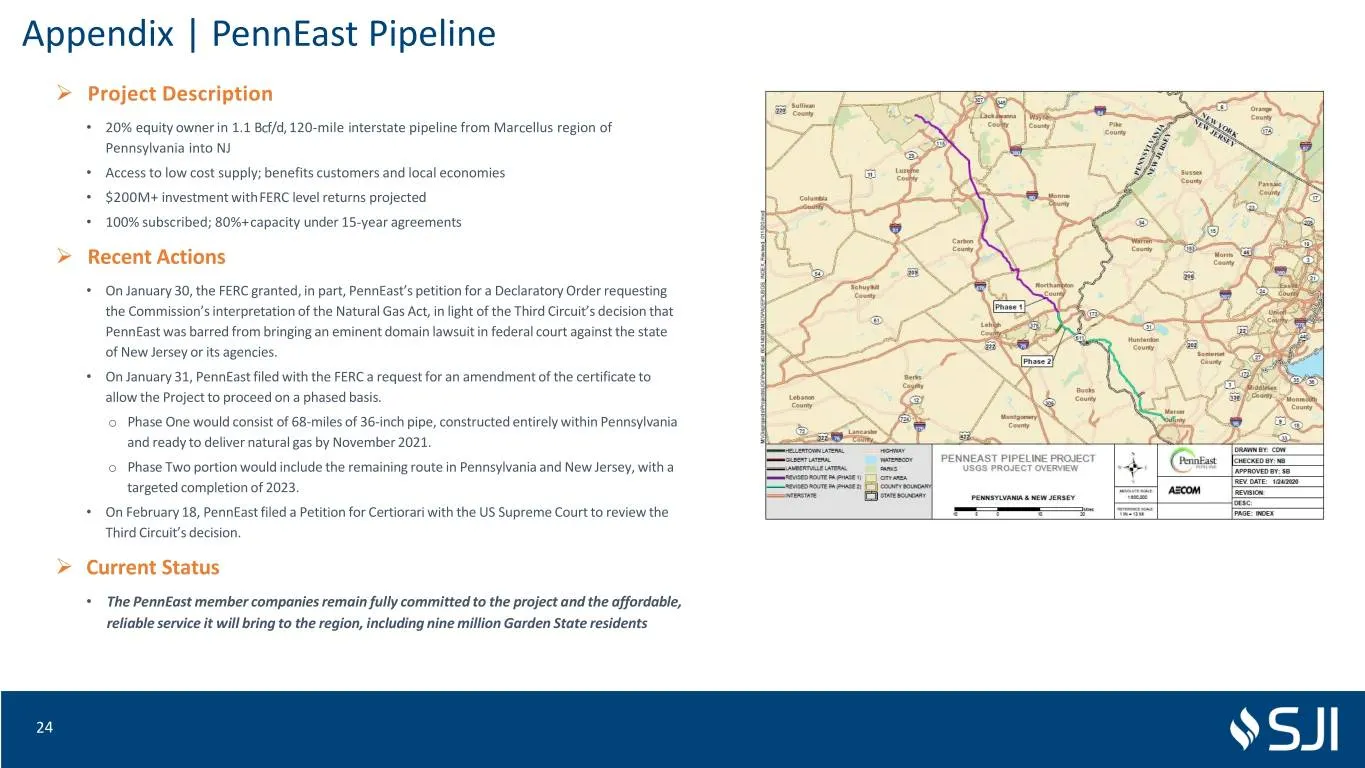
Appendix | PennEast Pipeline ➢ Project Description • 20% equity owner in 1.1 Bcf/d, 120-mile interstate pipeline from Marcellus region of Pennsylvania into NJ • Access to low cost supply; benefits customers and local economies • $200M+ investment withFERC level returns projected • 100% subscribed; 8
Slide 25: Fuel Supply Management Contracts
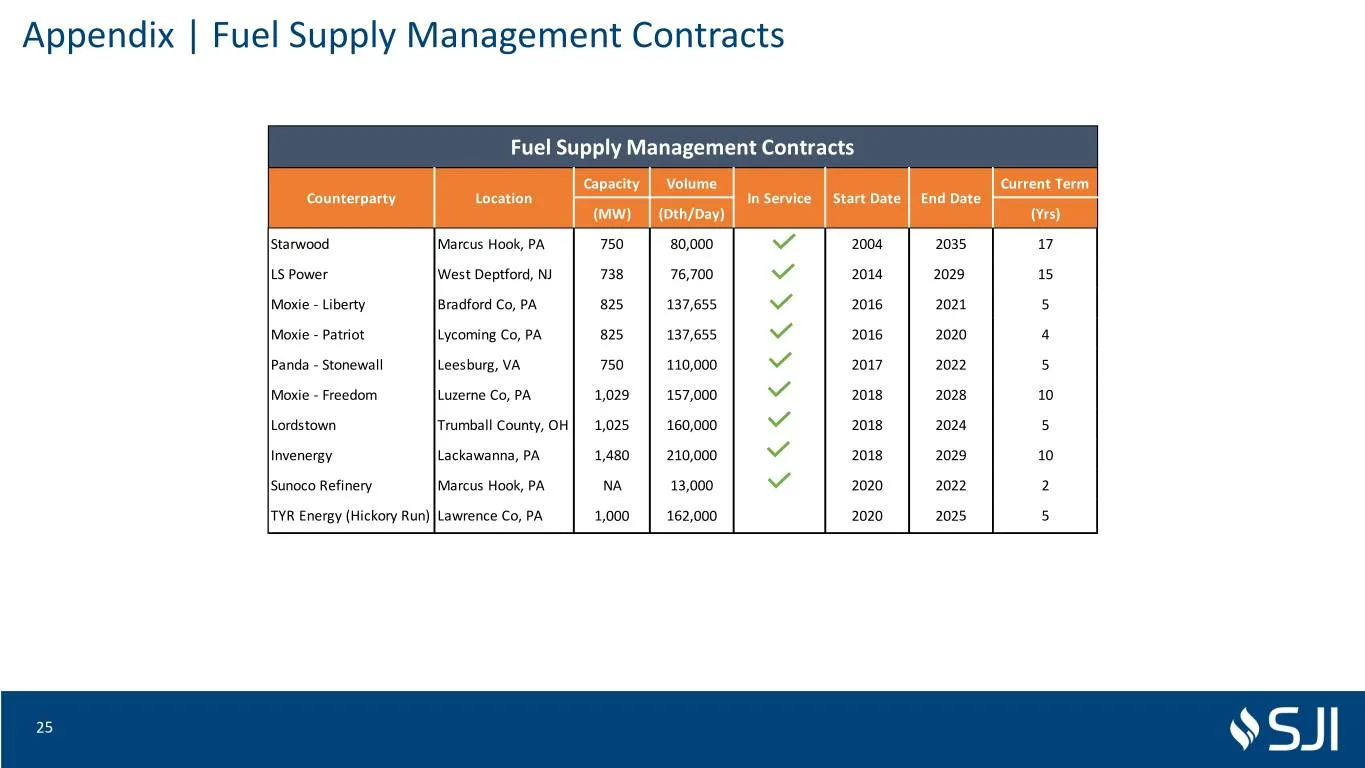
Appendix | Fuel Supply Management Contracts Fuel Supply Management Contracts Capacity Volume Current Term Counterparty Location In Service Start Date End Date (MW) (Dth/Day) (Yrs) Starwood Marcus Hook, PA 750 80,000 2004 2035 17 LS Power West Deptford, NJ 738 76,700 2014 2029 15 Moxie - Liberty Brad
Slide 26: Non-GAAP Financial Measures
Non-GAAP Financial Measures Management uses the non-GAAP financial measures of Economic Earnings and Economic Earnings per share when evaluating its results of operations. These non-GAAP financial measures should not be considered as an alternative to GAAP measures, such as net income, operating inc

Slide 27
Source: SEC EDGAR · 8-K filed May 6, 2020
More decks from South Jersey Industries Inc
 FY2021 Earnings Presentation29 slides · Feb 24, 2022
 Q3 2021 Earnings Presentation31 slides · Nov 3, 2021
 Q2 2021 Earnings Presentation31 slides · Aug 4, 2021
 Investor Day (May 2021)88 slides · May 6, 2021
 FY2020 Earnings Presentation31 slides · Feb 24, 2021
 Q3 2020 Earnings Presentation37 slides · Nov 4, 2020