Umpqua — DA Davidson Financial Institutions Conference 2017
16 slides from Umpqua's conference presentation, May 9, 2017

Slide 1: Umpqua Holdings Corporation – DA Davidson Financial Institutions Conference
UMPQUA HOLDINGS CORPORATION DA Davidson Financial Institutions Conference May 10, 2017
Slide 2: Forward-looking Statements
Forward-looking Statements 2 This presentation includes forward-looking statements within the meaning of the “Safe-Harbor” provisions of the Private Securities Litigation Reform Act of 1995, which management believes are a benefit to shareholders. These statements are necessarily subject to risk and
Slide 3: The World's Greatest Bank
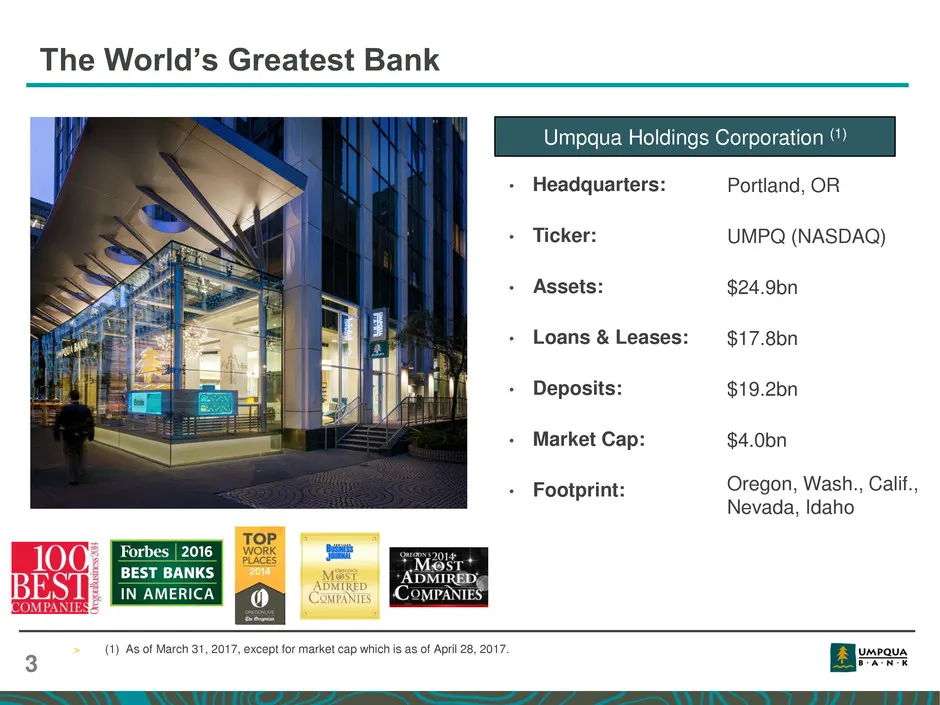
The World’s Greatest Bank 3 • Headquarters: • Ticker: • Assets: • Loans & Leases: • Deposits: • Market Cap: • Footprint: Umpqua Holdings Corporation (1) > (1) As of March 31, 2017, except for market cap which is as of April 28, 2017. Portland, OR UMPQ (NASDAQ) $24.9bn $17.8bn $19.2bn $4.0bn Oregon,
Slide 4: Well-positioned In Key Growth Markets on West Coast
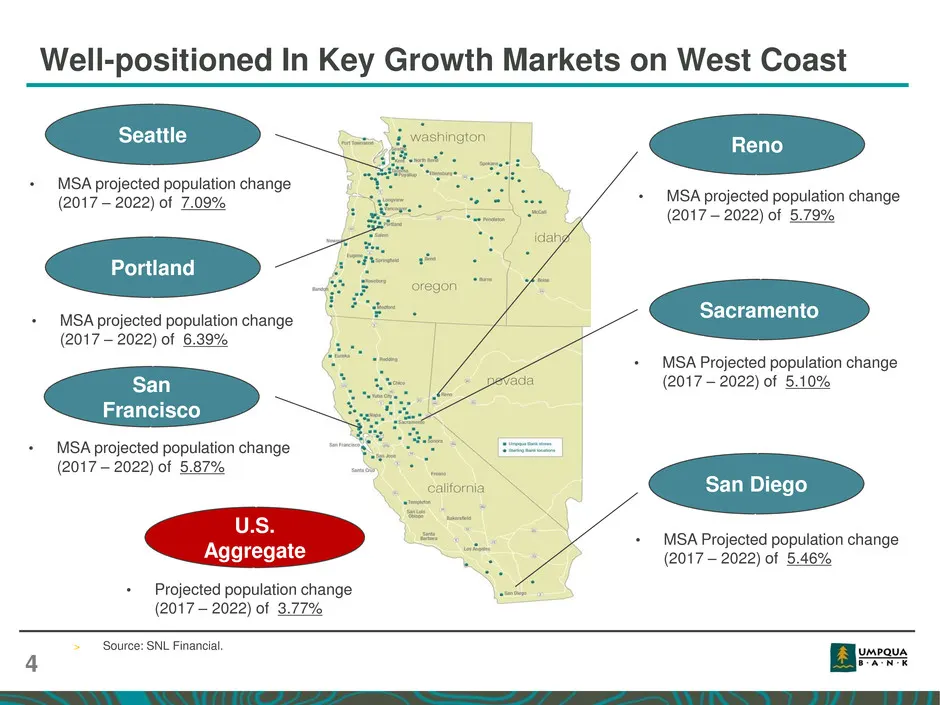
Well-positioned In Key Growth Markets on West Coast 4 > Source: SNL Financial. • MSA projected population change (2017 – 2022) of 7.09% Portland Sacramento • MSA projected population change (2017 – 2022) of 5.87% Reno Seattle San Francisco San Diego • MSA projected population change (2017 – 2022) of
Slide 5: Umpqua's Mission
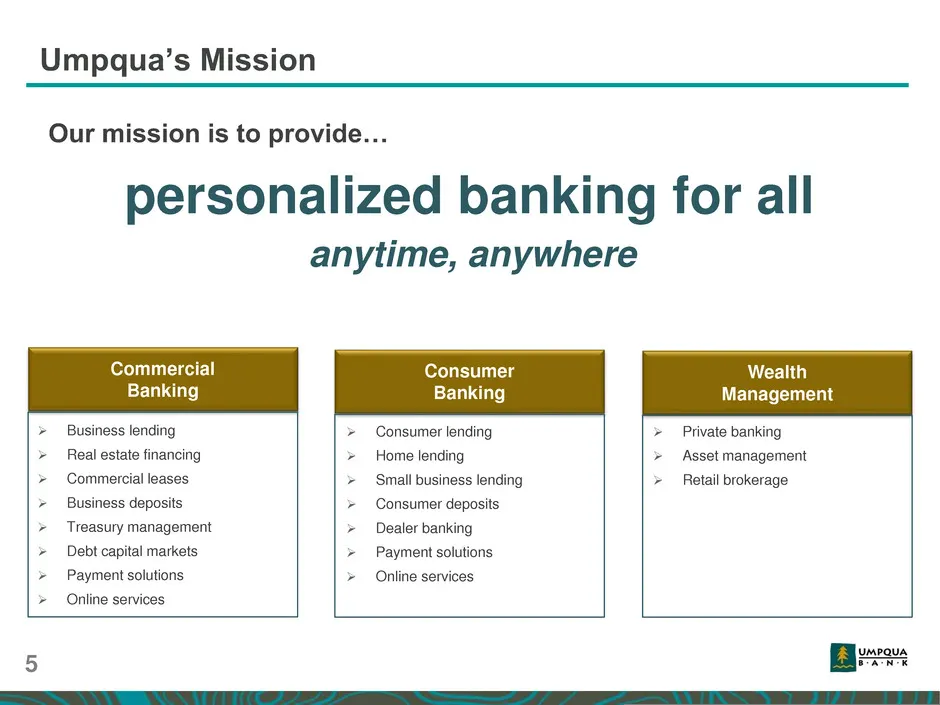
Umpqua’s Mission 5 Our mission is to provide… personalized banking for all anytime, anywhere Commercial Banking Consumer Banking Wealth Management Business lending Real estate financing Commercial leases Business deposits Treasury management Debt capital markets Payment solutions Onl
Slide 6: 2017 Key Priorities
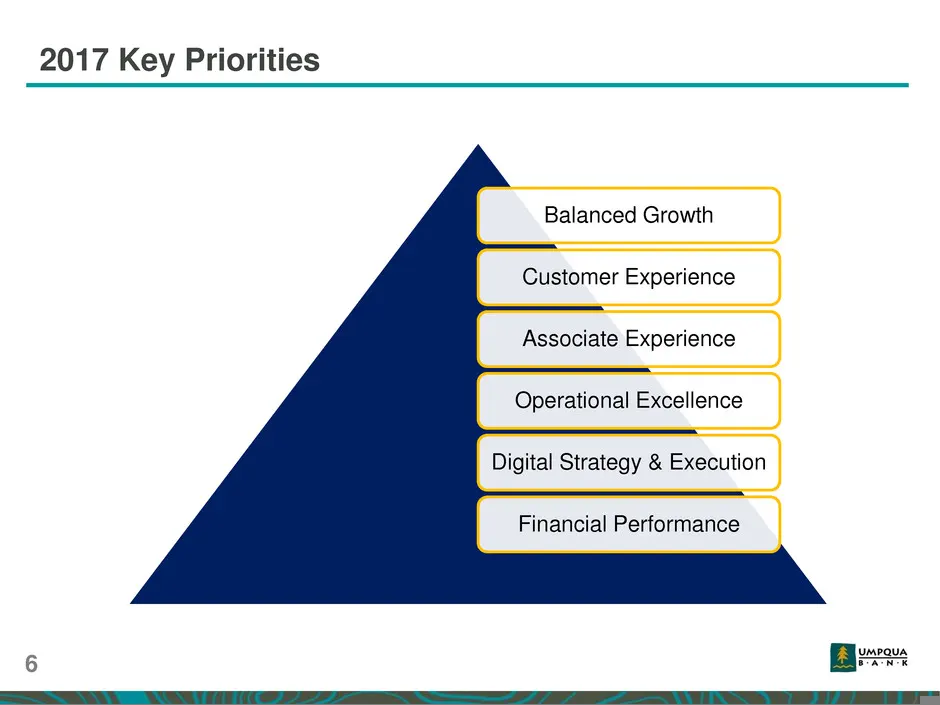
6 Balanced Growth Customer Experience Associate Experience Operational Excellence Digital Strategy & Execution Financial Performance 2017 Key Priorities
Slide 7: Q1 2017 Highlights
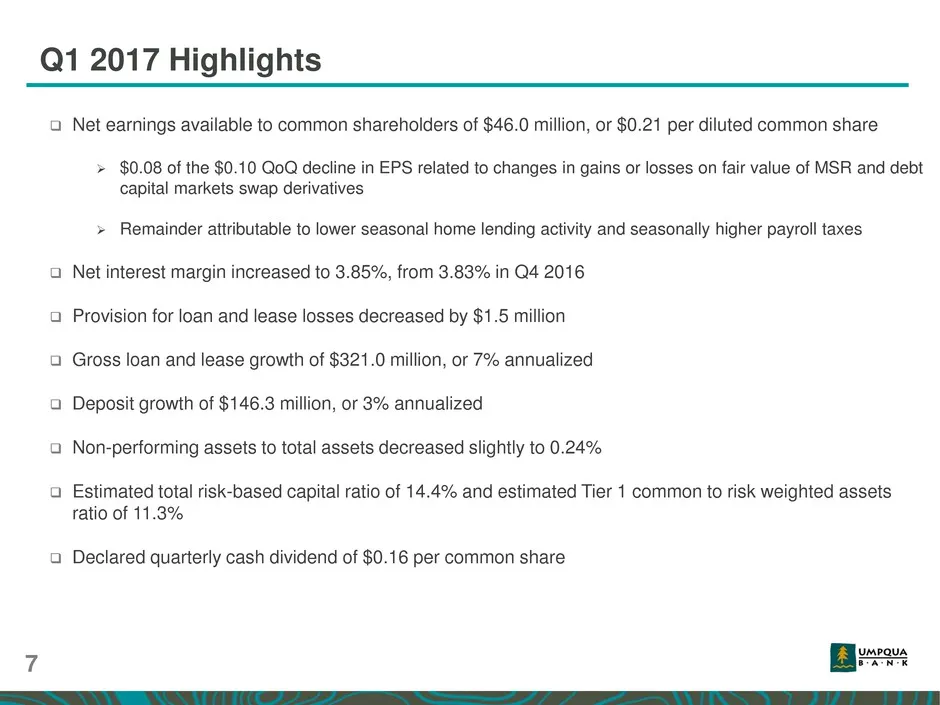
Q1 2017 Highlights 7 Net earnings available to common shareholders of $46.0 million, or $0.21 per diluted common share $0.08 of the $0.10 QoQ decline in EPS related to changes in gains or losses on fair value of MSR and debt capital markets swap derivatives Remainder attributable to lower seas
Slide 8: Net Interest Income and Margin
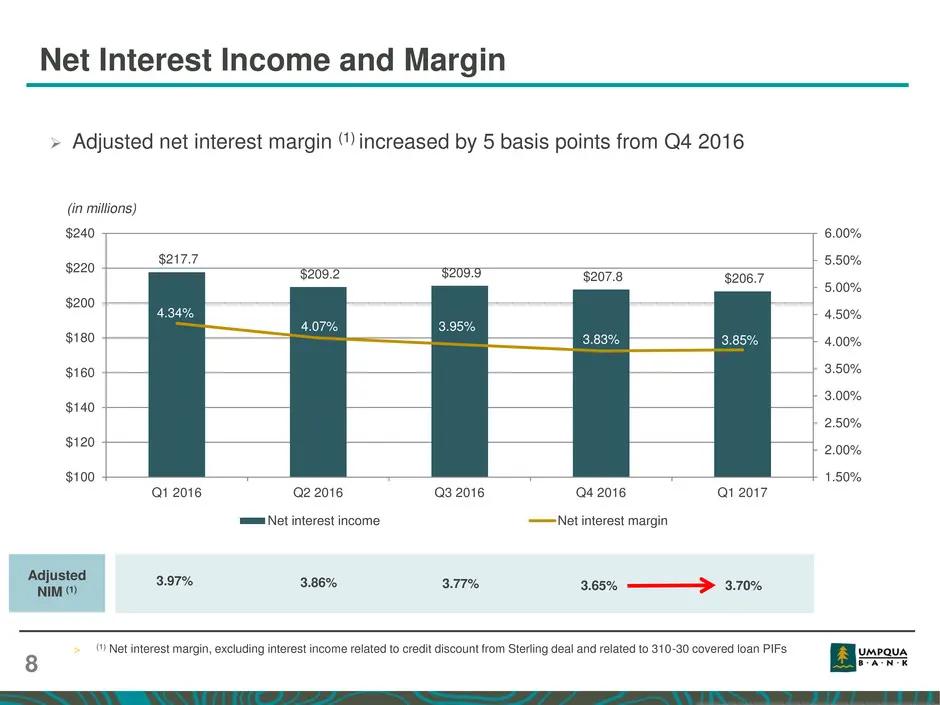
Net Interest Income and Margin 8 $217.7 $209.2 $209.9 $207.8 $206.7 4.34% 4.07% 3.95% 3.83% 3.85% 1.50% 2.00% 2.50% 3.00% 3.50% 4.00% 4.50% 5.00% 5.50% 6.00% $100 $120 $140 $160 $180 $200 $220 $240 Q1 2016 Q2 2016 Q3 2016 Q4 2016 Q1 2017 Net interest income Net interest margin (in millions) 3.97% 3.
Slide 9: Balanced Loan Growth
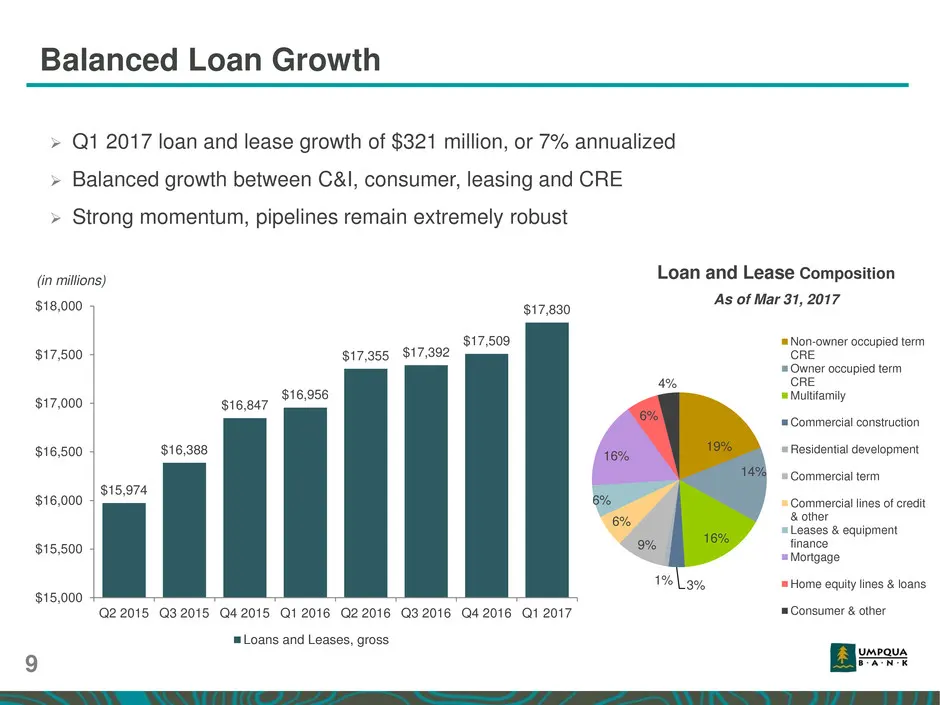
Balanced Loan Growth 9 Q1 2017 loan and lease growth of $321 million, or 7% annualized Balanced growth between C&I, consumer, leasing and CRE Strong momentum, pipelines remain extremely robust $15,974 $16,388 $16,847 $16,956 $17,355 $17,392 $17,509 $17,830 $15,000 $15,500 $16,000 $16,500 $17,0
Slide 10: Stable Low-cost Deposit Franchise
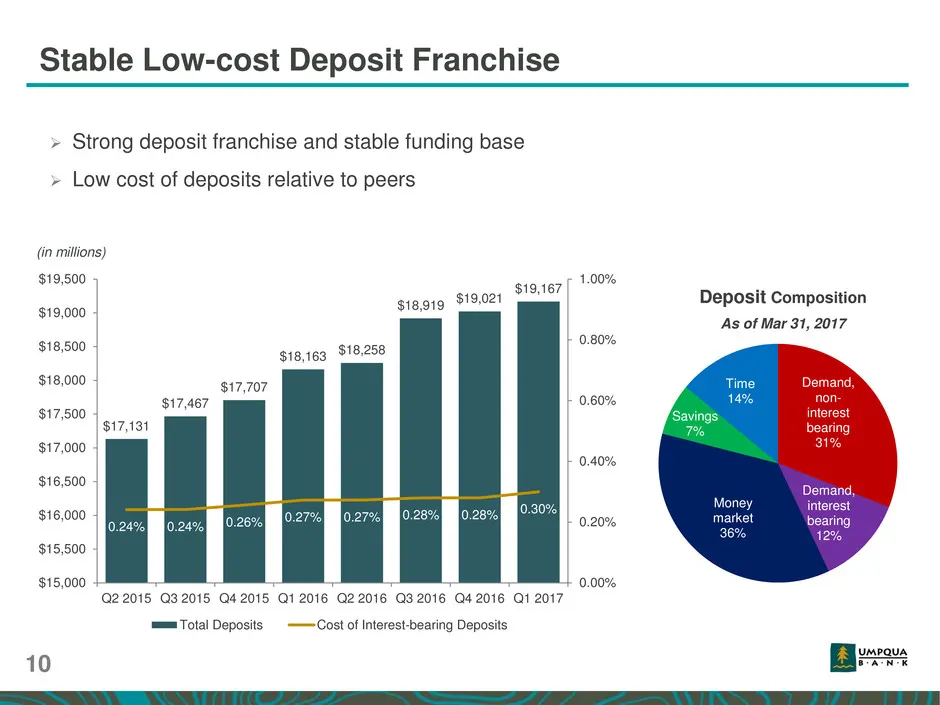
Stable Low-cost Deposit Franchise 10 (in millions) Deposit Composition As of Mar 31, 2017 Demand, non- interest bearing 31% Demand, interest bearing 12% Money market 36% Savings 7% Time 14% $17,131 $17,467 $17,707 $18,163 $18,258 $18,919 $19,021 $19,167 0.24% 0.24% 0.26% 0.27% 0.27% 0.28% 0.28% 0.30
Slide 11: Leasing & Equipment Finance Portfolio
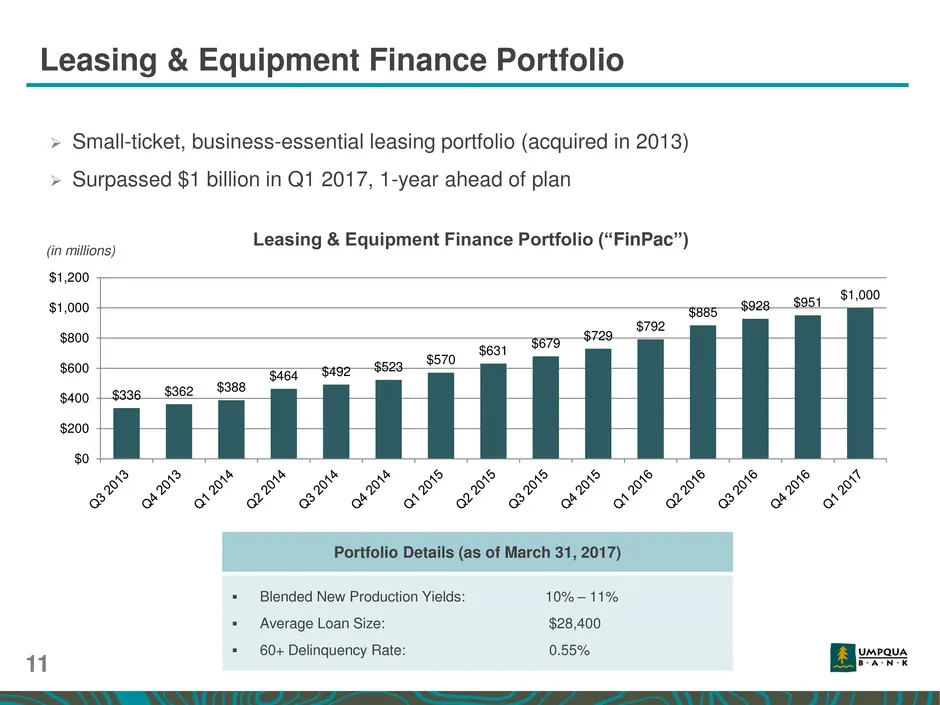
Blended New Production Yields: 10% – 11% Average Loan Size: $28,400 60+ Delinquency Rate: 0.55% Leasing & Equipment Finance Portfolio 11 Leasing & Equipment Finance Portfolio (“FinPac”) (in millions) Portfolio Details (as of March 31, 2017) Small-ticket, business-essential leasing portfolio
Slide 12: Mortgage Banking Business
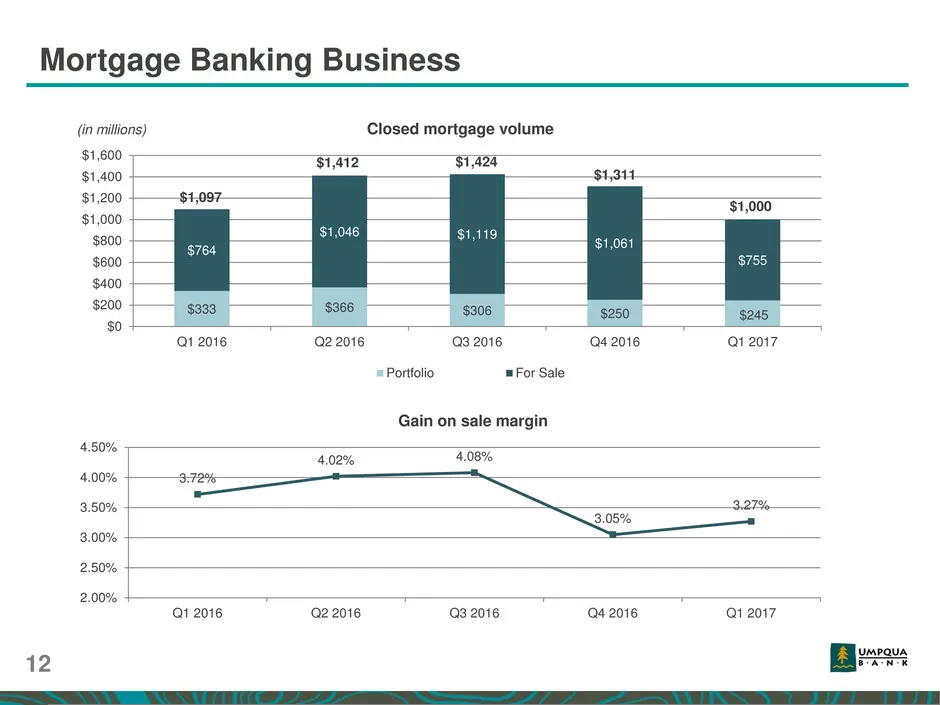
Mortgage Banking Business 12 $333 $366 $306 $250 $245 $764 $1,046 $1,119 $1,061 $755 $0 $200 $400 $600 $800 $1,000 $1,200 $1,400 $1,600 Q1 2016 Q2 2016 Q3 2016 Q4 2016 Q1 2017 Closed mortgage volume Portfolio For Sale (in millions) $1,097 $1,412 $1,424 $1,311 $1,000 3.72% 4.02% 4.08% 3.05% 3.27% 2.0
Slide 13: Non-interest Expense and Efficiency Ratio
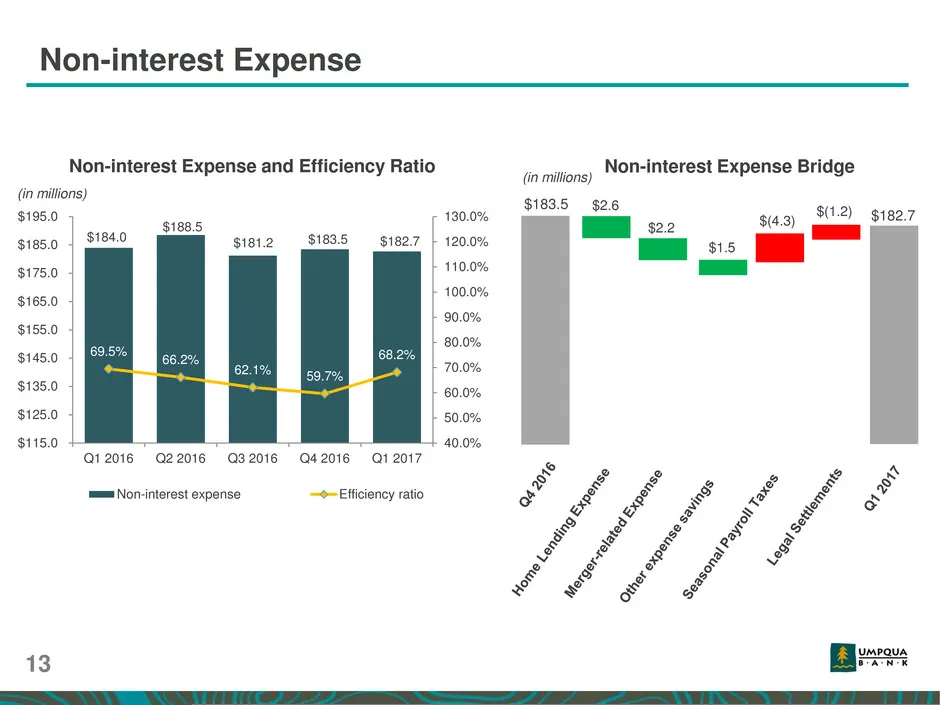
Non-interest Expense (in millions) Non-interest Expense and Efficiency Ratio Non-interest Expense Bridge $183.5 $182.7 $184.0 $188.5 $181.2 $183.5 $182.7 69.5% 66.2% 62.1% 59.7% 68.2% 40.0% 50.0% 60.0% 70.0% 80.0% 90.0% 100.0% 110.0% 120.0% 130.0% $115.0 $125.0 $135.0 $145.0 $155.0 $165.0 $175.0 $18
Slide 14: Stable Credit Quality
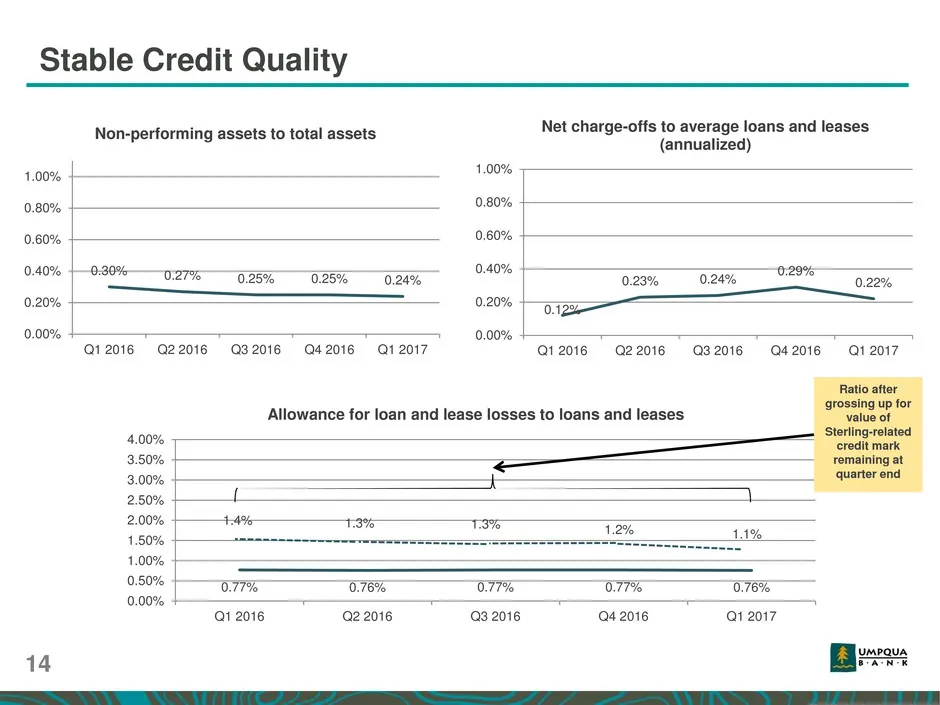
Stable Credit Quality 14 0.77% 0.76% 0.77% 0.77% 0.76% 0.00% 0.50% 1.00% 1.50% 2.00% 2.50% 3.00% 3.50% 4.00% Q1 2016 Q2 2016 Q3 2016 Q4 2016 Q1 2017 Allowance for loan and lease losses to loans and leases 0.30% 0.27% 0.25% 0.25% 0.24% 0.00% 0.20% 0.40% 0.60% 0.80% 1.00% Q1 2016 Q2 2016 Q3 2016 Q4 20
Slide 15: Track Record of Prudent Capital Management
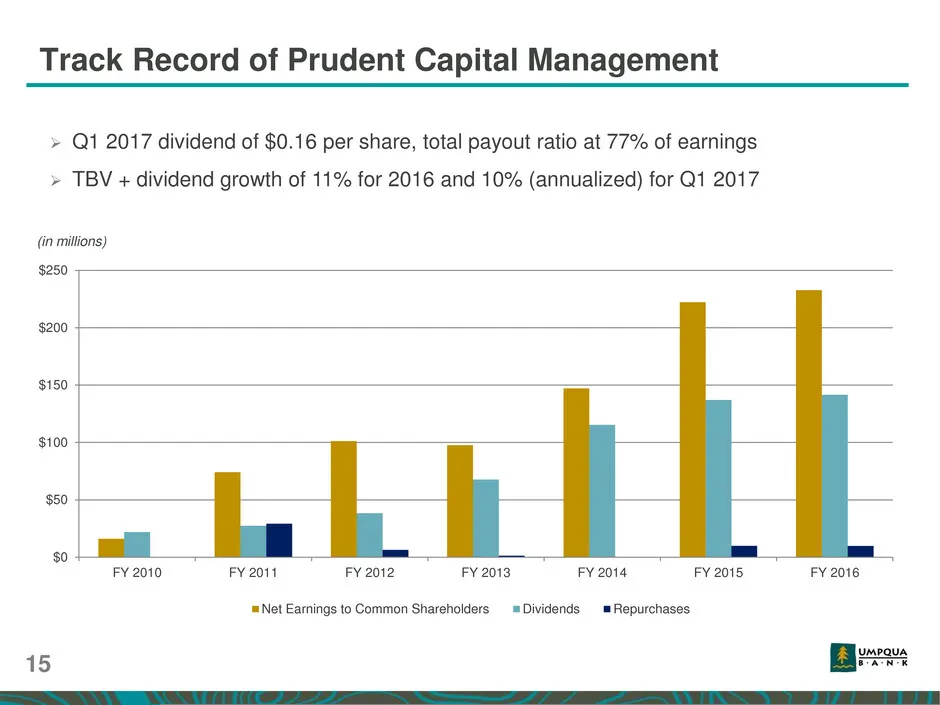
Track Record of Prudent Capital Management 15 (in millions) Q1 2017 dividend of $0.16 per share, total payout ratio at 77% of earnings TBV + dividend growth of 11% for 2016 and 10% (annualized) for Q1 2017 $0 $50 $100 $150 $200 $250 FY 2010 FY 2011 FY 2012 FY 2013 FY 2014 FY 2015 FY 2016 Net Ear

Slide 16: Questions?
Mi i [dna ia in Wy all WA Ui : ai Ke I, y , « % Sat (e Questions?
Source: SEC EDGAR · 8-K filed May 9, 2017
More decks from Umpqua Holdings Corporation
 Q4 2022 Earnings Presentation33 slides · Jan 24, 2023
 Q3 2022 Earnings Presentation35 slides · Oct 19, 2022
 Q2 2022 Earnings Presentation37 slides · Sep 2, 2022
 Q2 2022 Earnings Presentation37 slides · Jul 20, 2022
 Q1 2022 Earnings Presentation37 slides · May 26, 2022
 Q1 2022 Earnings Presentation36 slides · Apr 20, 2022