NN Group N.V. · EURONEXT:NN
NN — H1 2020 Earnings Presentation
22 slides from NN's earnings presentation, Aug 6, 2020

Slide 1: Half-year 2020 results
Half-year 2020 results 6 August 2020

Slide 2: 1H20 highlights
1H20 highlights David Knibbe, CEO
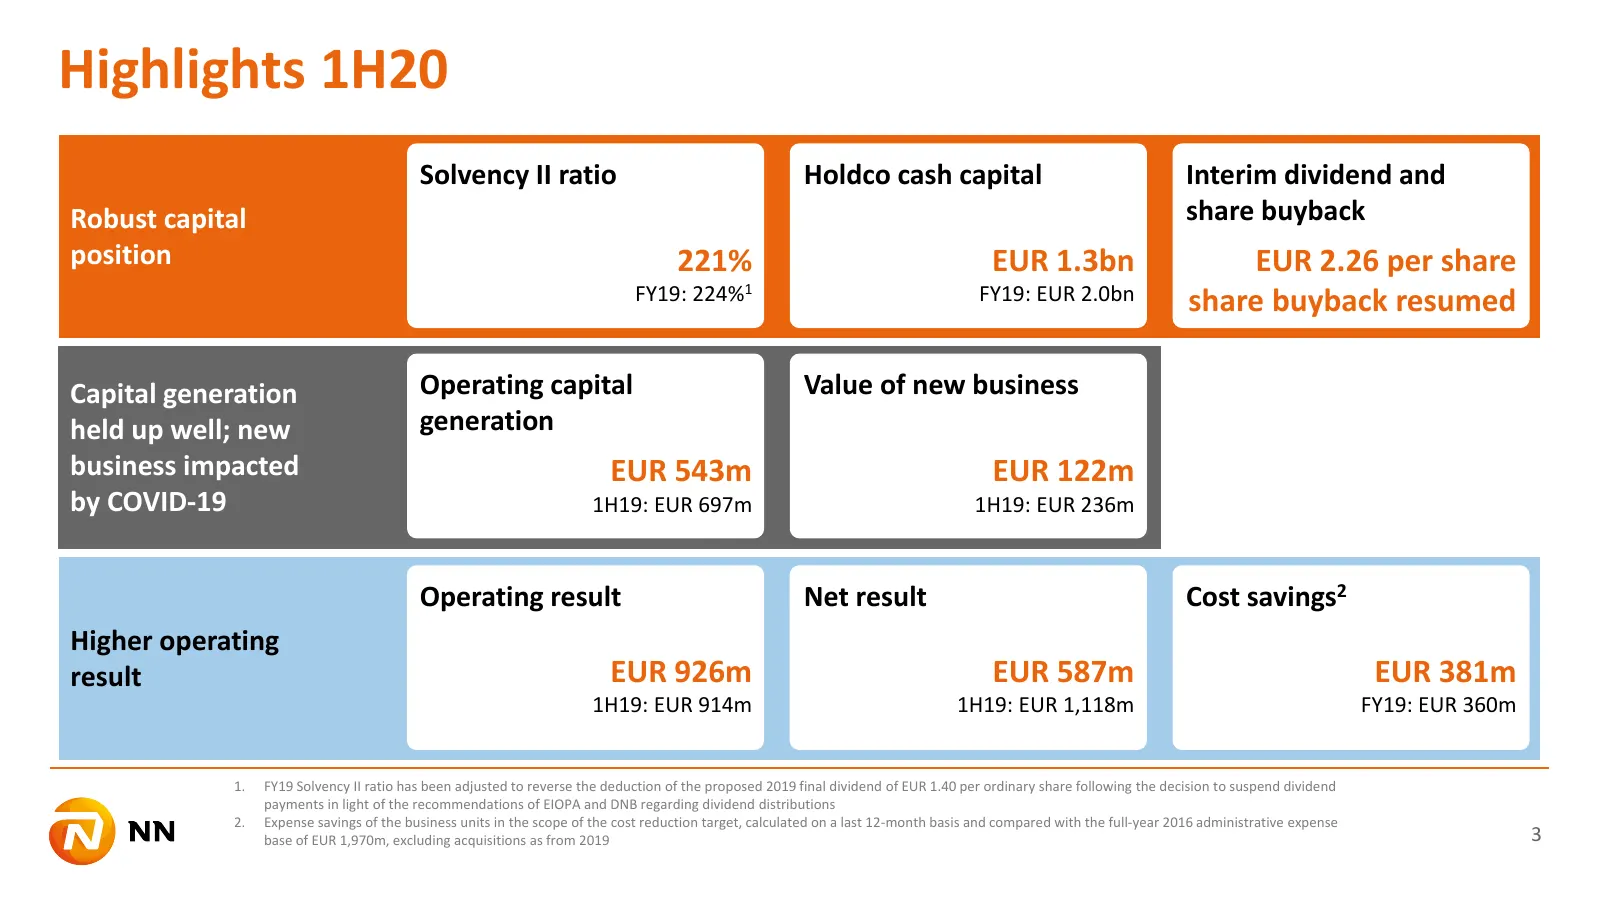
Slide 3: Highlights 1H20
Highlights 1H20 Solvency II ratio Holdco cash capital Interim dividend and Robust capital share buyback position 221% EUR 1.3bn EUR 2.26 per share FY19: 224%1 FY19: EUR 2.0bn share buyback resumed Capital generation Operating capital Value of new business held up well; new generation business impact
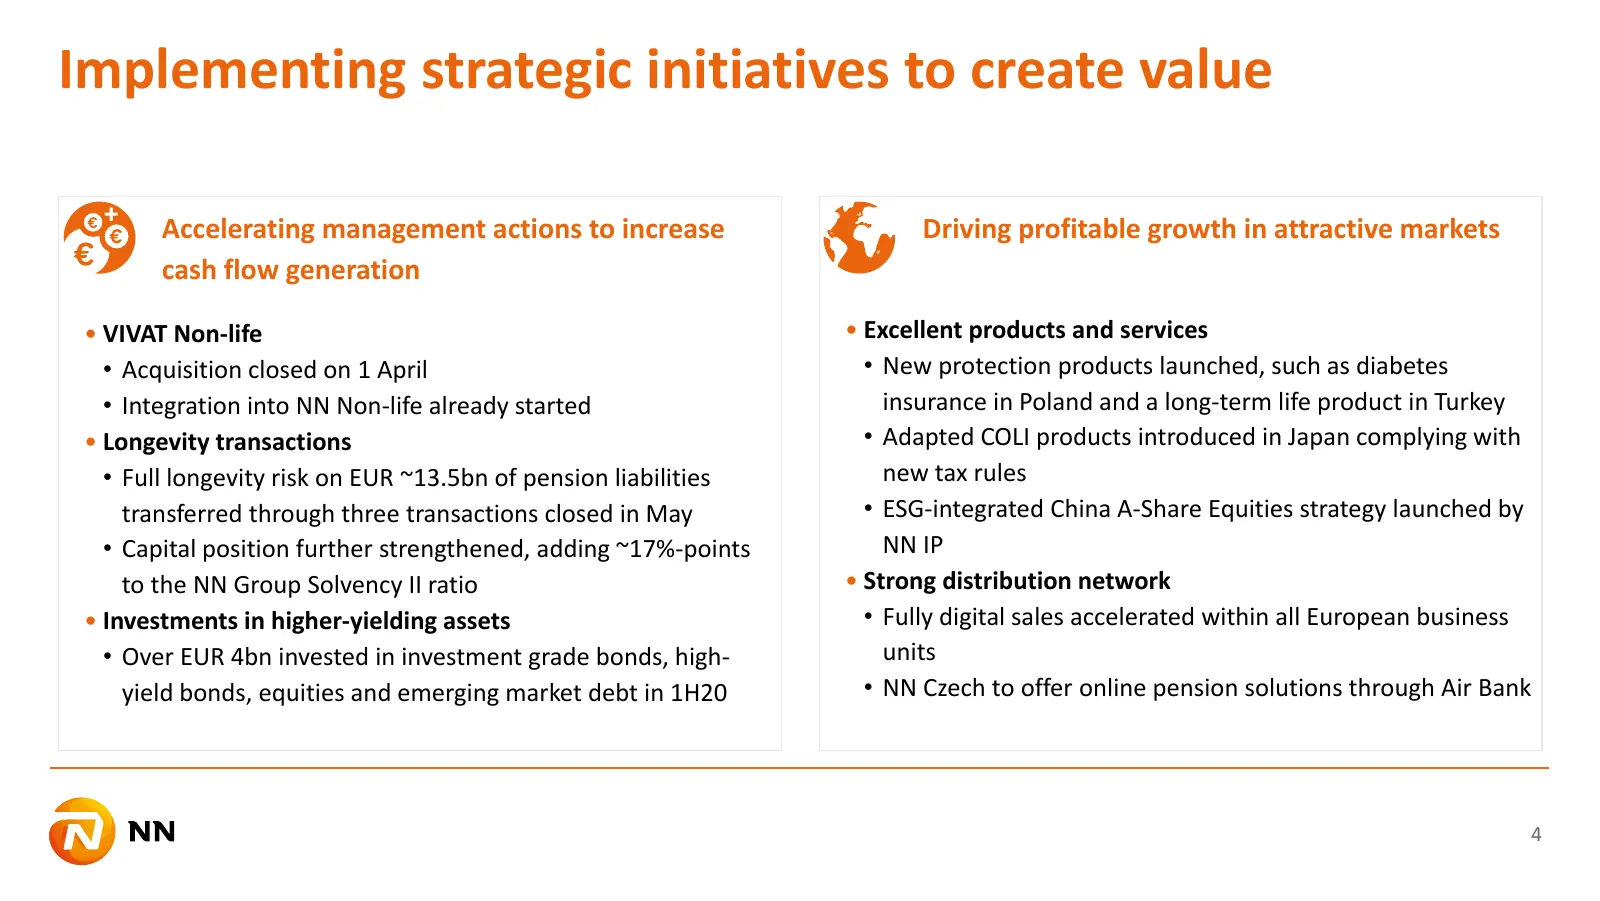
Slide 4: Implementing strategic initiatives to create value
Implementing strategic initiatives to create value Accelerating management actions to increase Driving profitable growth in attractive markets cash flow generation • VIVAT Non-life • Excellent products and services • Acquisition closed on 1 April • New protection products launched, such as diabetes
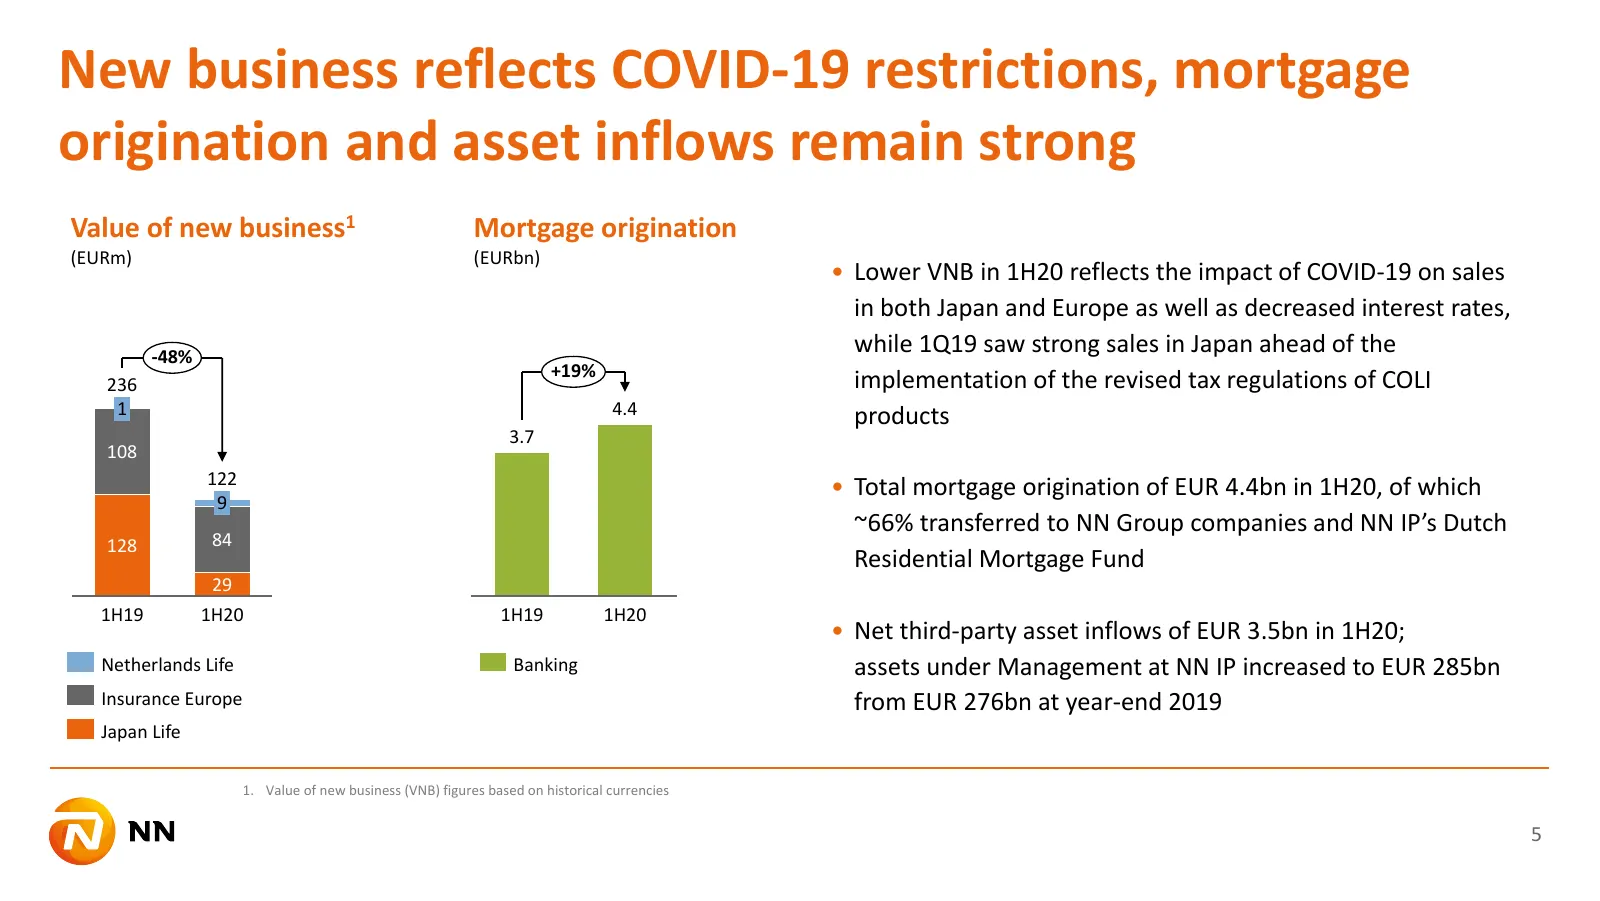
Slide 5: New business reflects COVID-19 restrictions, mortgage origination and asset inflows remain strong
New business reflects COVID-19 restrictions, mortgage origination and asset inflows remain strong Value of new business1 Mortgage origination (EURm) (EURbn) • Lower VNB in 1H20 reflects the impact of COVID-19 on sales in both Japan and Europe as well as decreased interest rates, -48% while 1Q19 saw
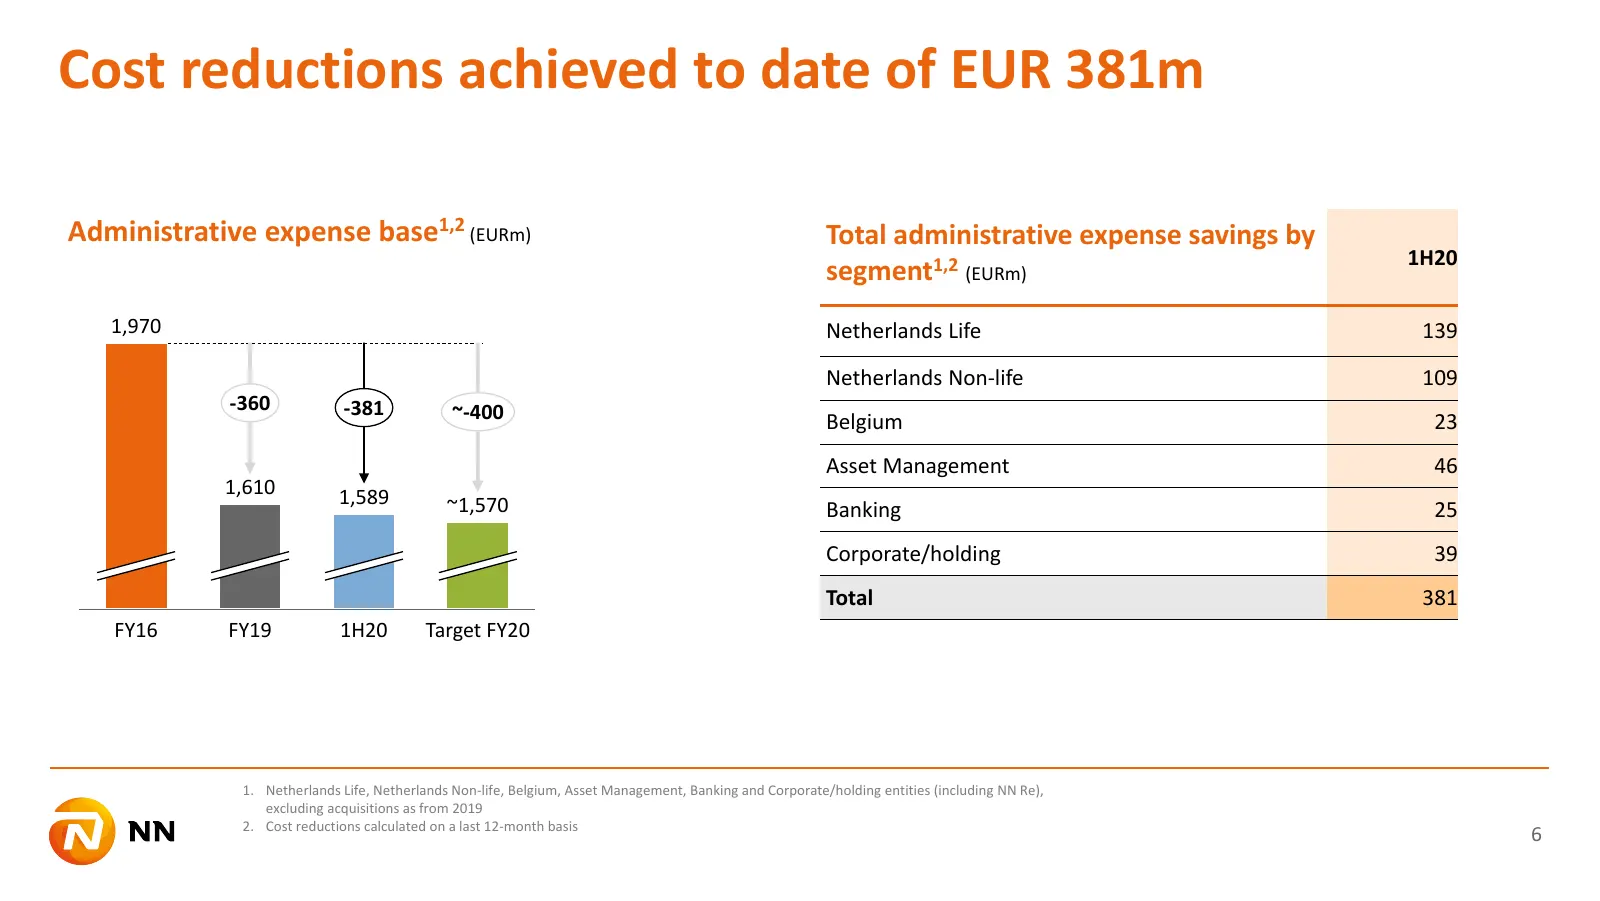
Slide 6: Cost reductions achieved to date of EUR 381m
Cost reductions achieved to date of EUR 381m Administrative expense base1,2 (EURm) Total administrative expense savings by 1H20 segment1,2 (EURm) 1,970 Netherlands Life 139 Netherlands Non-life 109 -360 -381 ~-400 Belgium 23 Asset Management 46 1,610 1,589 ~1,570 Banking 25 Corporate/holding 39 Tota
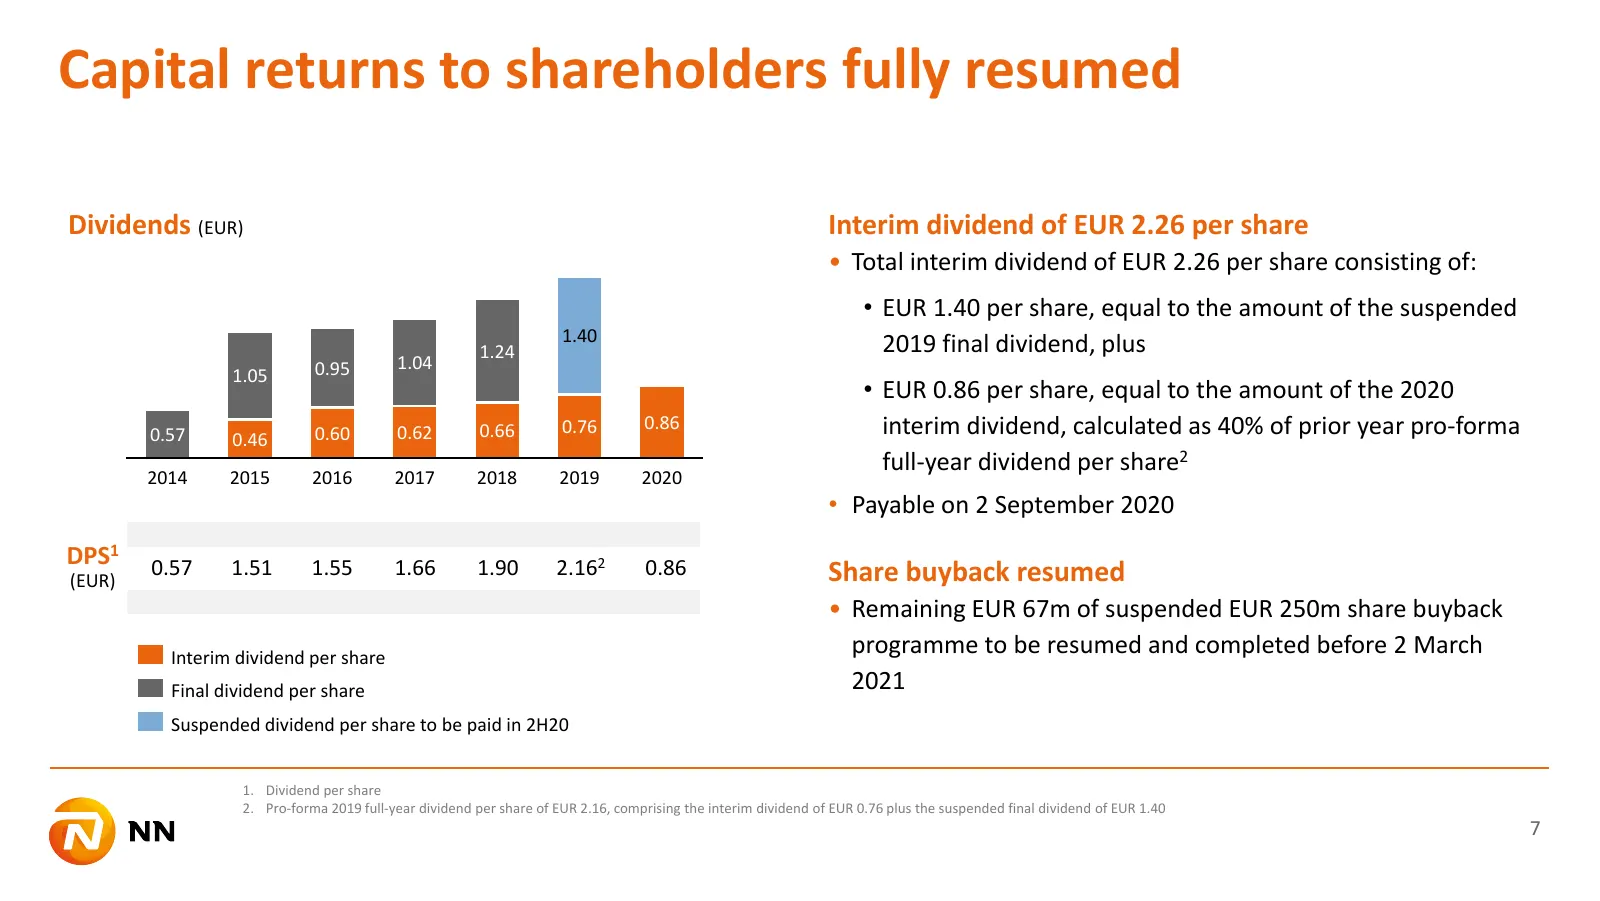
Slide 7: Capital returns to shareholders fully resumed
Capital returns to shareholders fully resumed Dividends (EUR) Interim dividend of EUR 2.26 per share • Total interim dividend of EUR 2.26 per share consisting of: • EUR 1.40 per share, equal to the amount of the suspended 1.40 2019 final dividend, plus 1.24 0.95 1.04 1.05 • EUR 0.86 per share, equal
Slide 8: 1H20 results
1H20 results Delfin Rueda, CFO
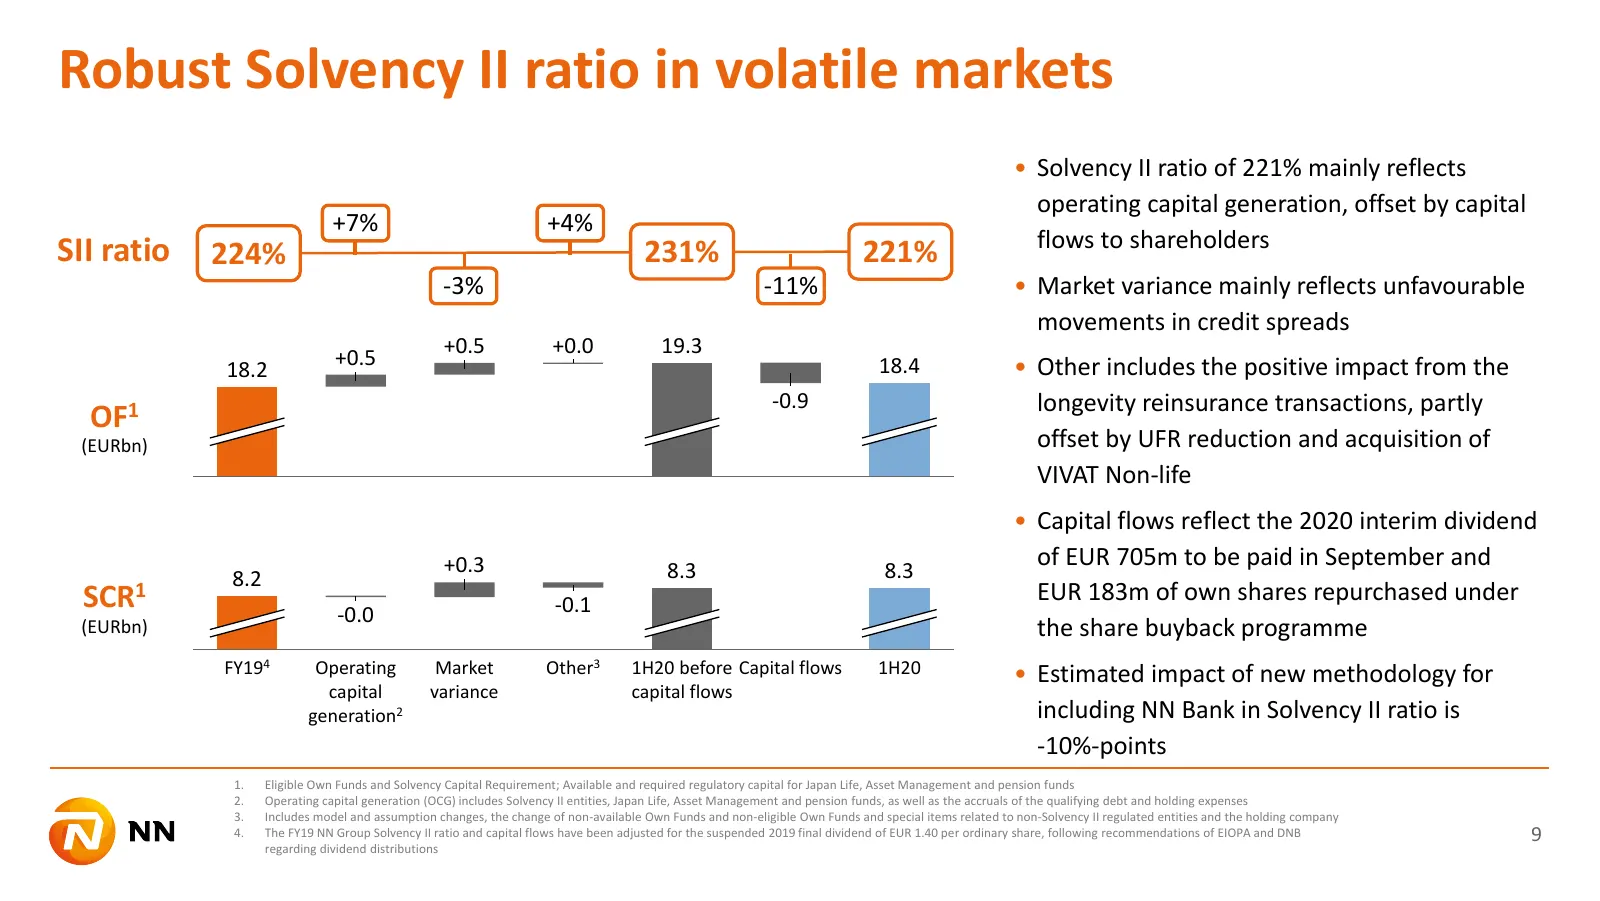
Slide 9: Robust Solvency II ratio in volatile markets
Robust Solvency II ratio in volatile markets • Solvency II ratio of 221% mainly reflects operating capital generation, offset by capital +7% +4% SII ratio flows to shareholders 224% 231% 221% -3% -11% • Market variance mainly reflects unfavourable movements in credit spreads +0.5 +0.0 19.3 +0.5 18.4
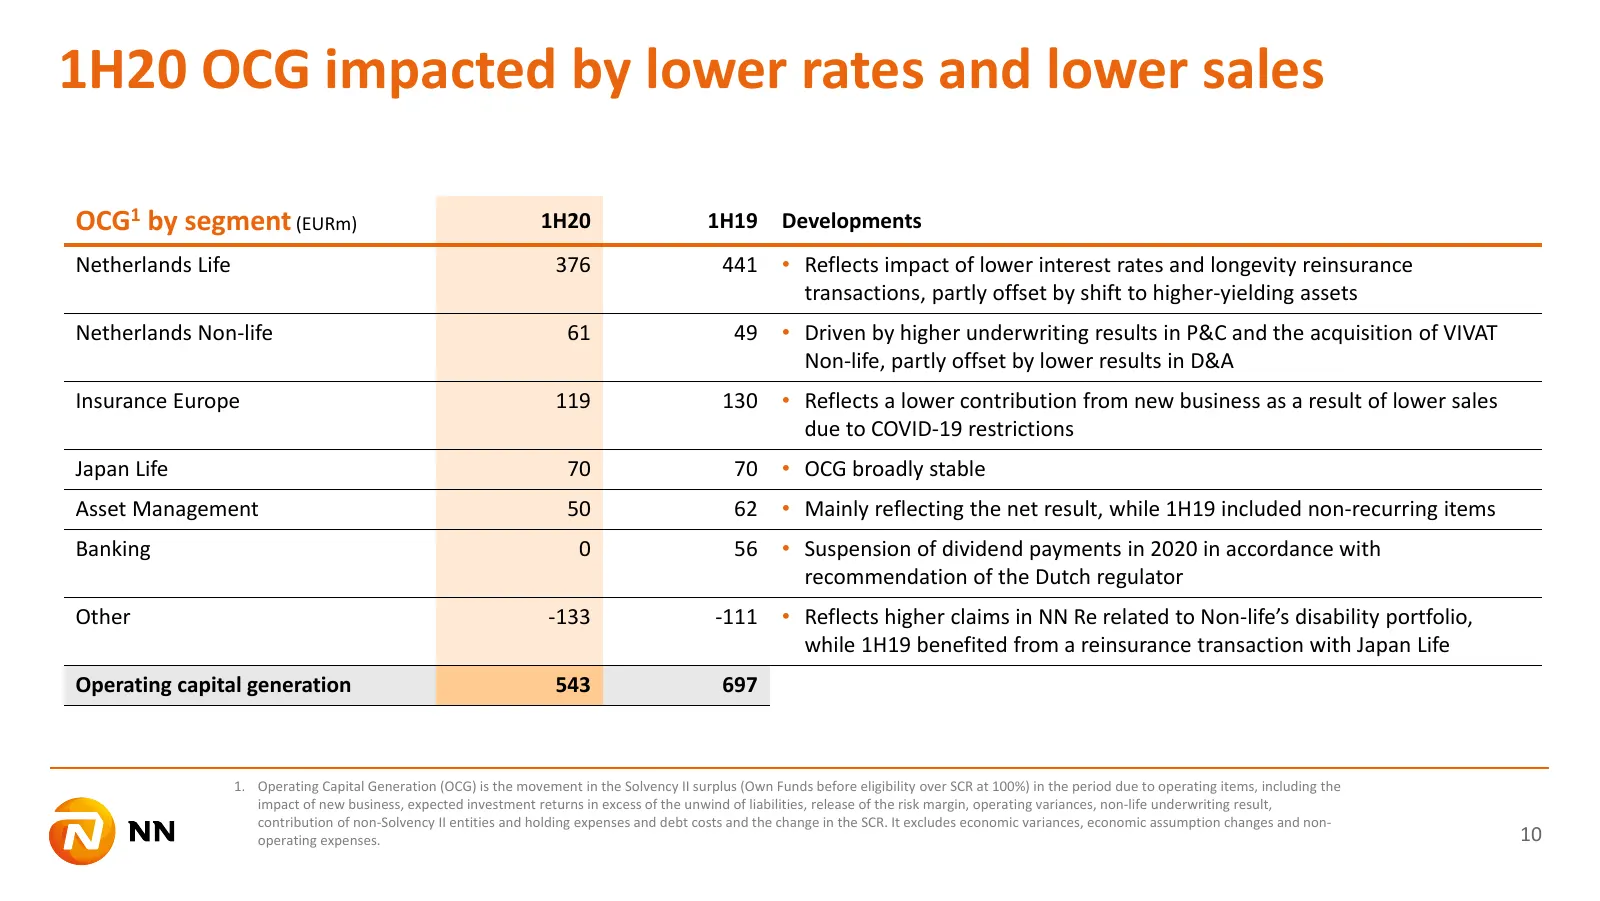
Slide 10: 1H20 OCG impacted by lower rates and lower sales
1H20 OCG impacted by lower rates and lower sales OCG1 by segment (EURm) 1H20 1H19 Developments Netherlands Life 376 441 • Reflects impact of lower interest rates and longevity reinsurance transactions, partly offset by shift to higher-yielding assets Netherlands Non-life 61 49 • Driven by higher und
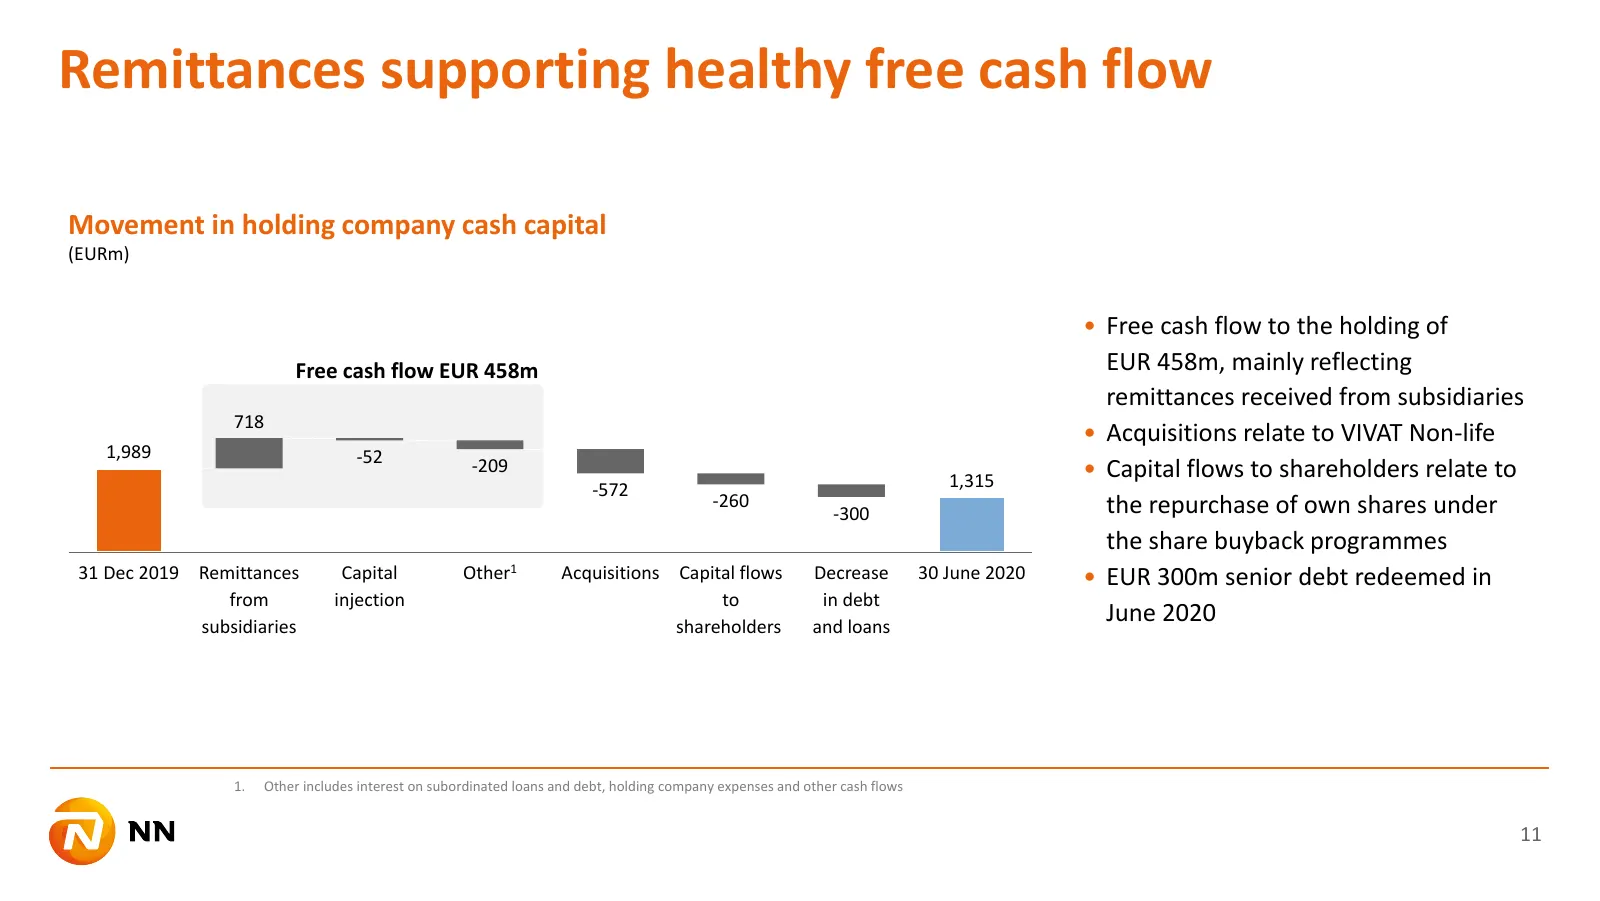
Slide 11: Remittances supporting healthy free cash flow
Remittances supporting healthy free cash flow Movement in holding company cash capital (EURm) • Free cash flow to the holding of Free cash flow EUR 458m EUR 458m, mainly reflecting remittances received from subsidiaries 718 • Acquisitions relate to VIVAT Non-life 1,989 -52 -209 1,315 • Capital flows
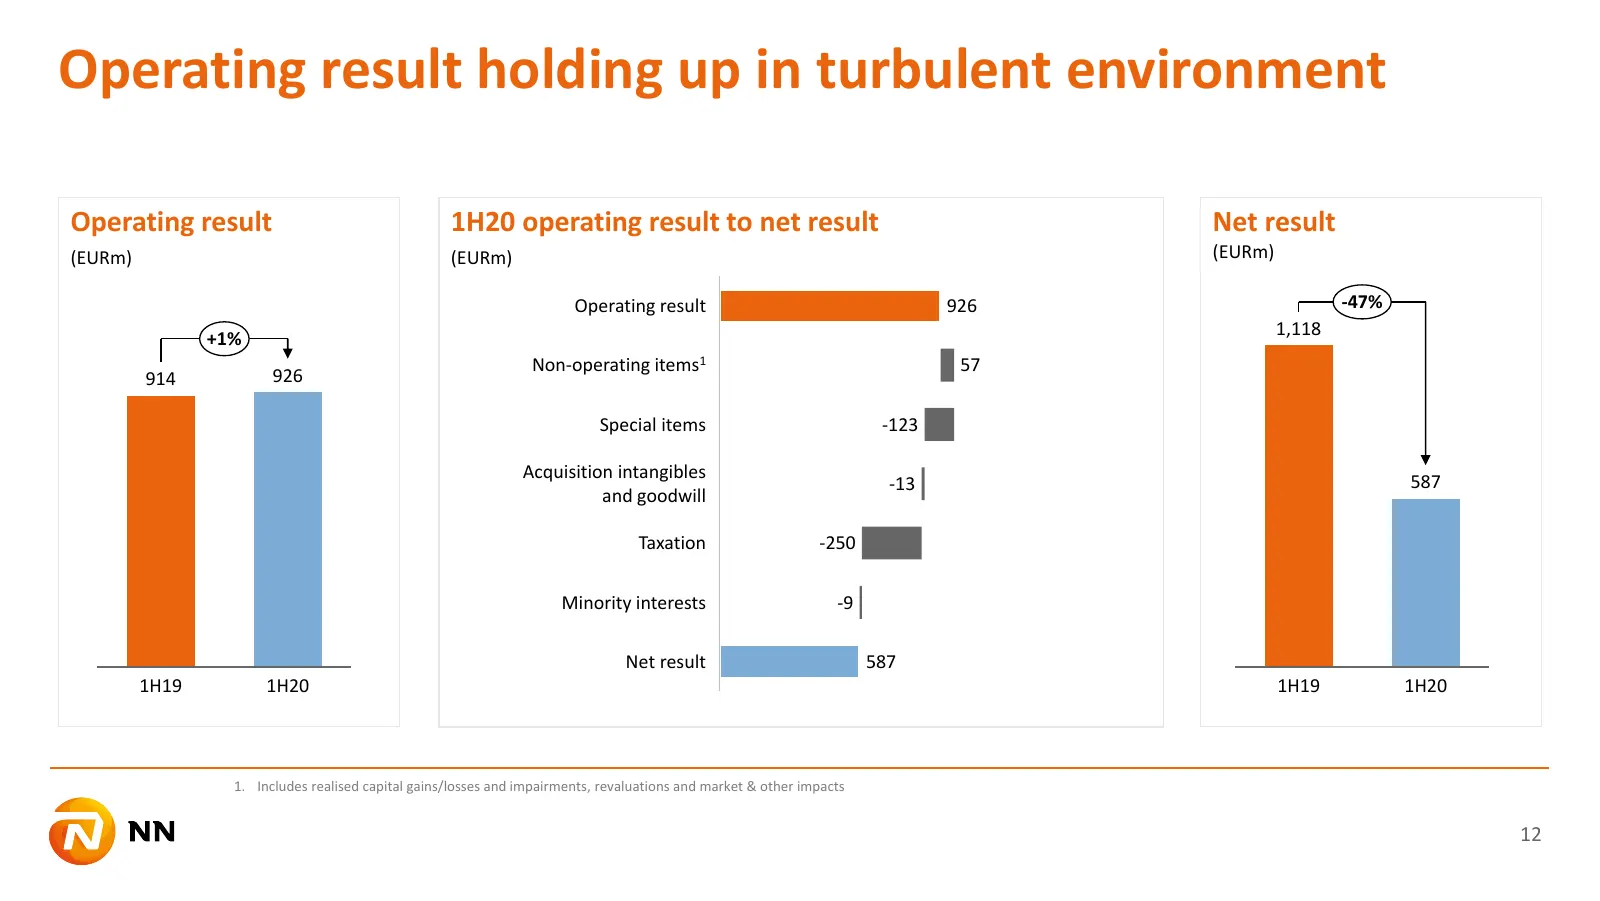
Slide 12: Operating result holding up in turbulent environment
Operating result holding up in turbulent environment Operating result 1H20 operating result to net result Net result (EURm) (EURm) (EURm) Operating result 926 -47% 1,118 +1% Non-operating items1 57 914 926 Special items -123 Acquisition intangibles -13 587 and goodwill Taxation -250 Minority interes
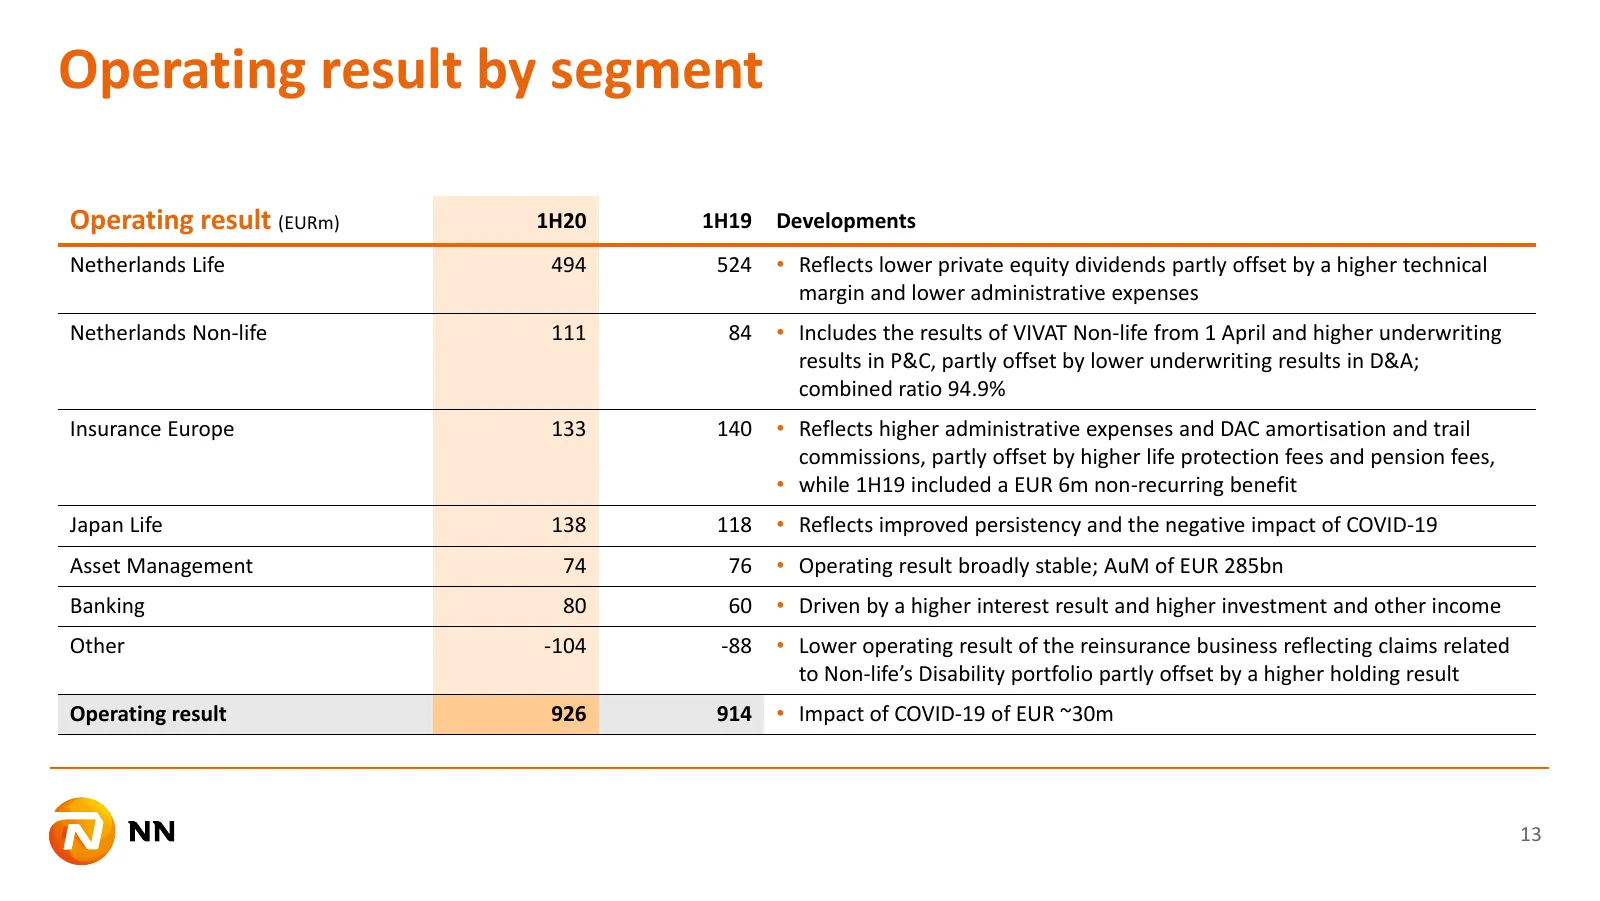
Slide 13: Operating result by segment
Operating result by segment Operating result (EURm) 1H20 1H19 Developments Netherlands Life 494 524 • Reflects lower private equity dividends partly offset by a higher technical margin and lower administrative expenses Netherlands Non-life 111 84 • Includes the results of VIVAT Non-life from 1 April

Slide 14: Key takeaways
Key takeaways David Knibbe, CEO
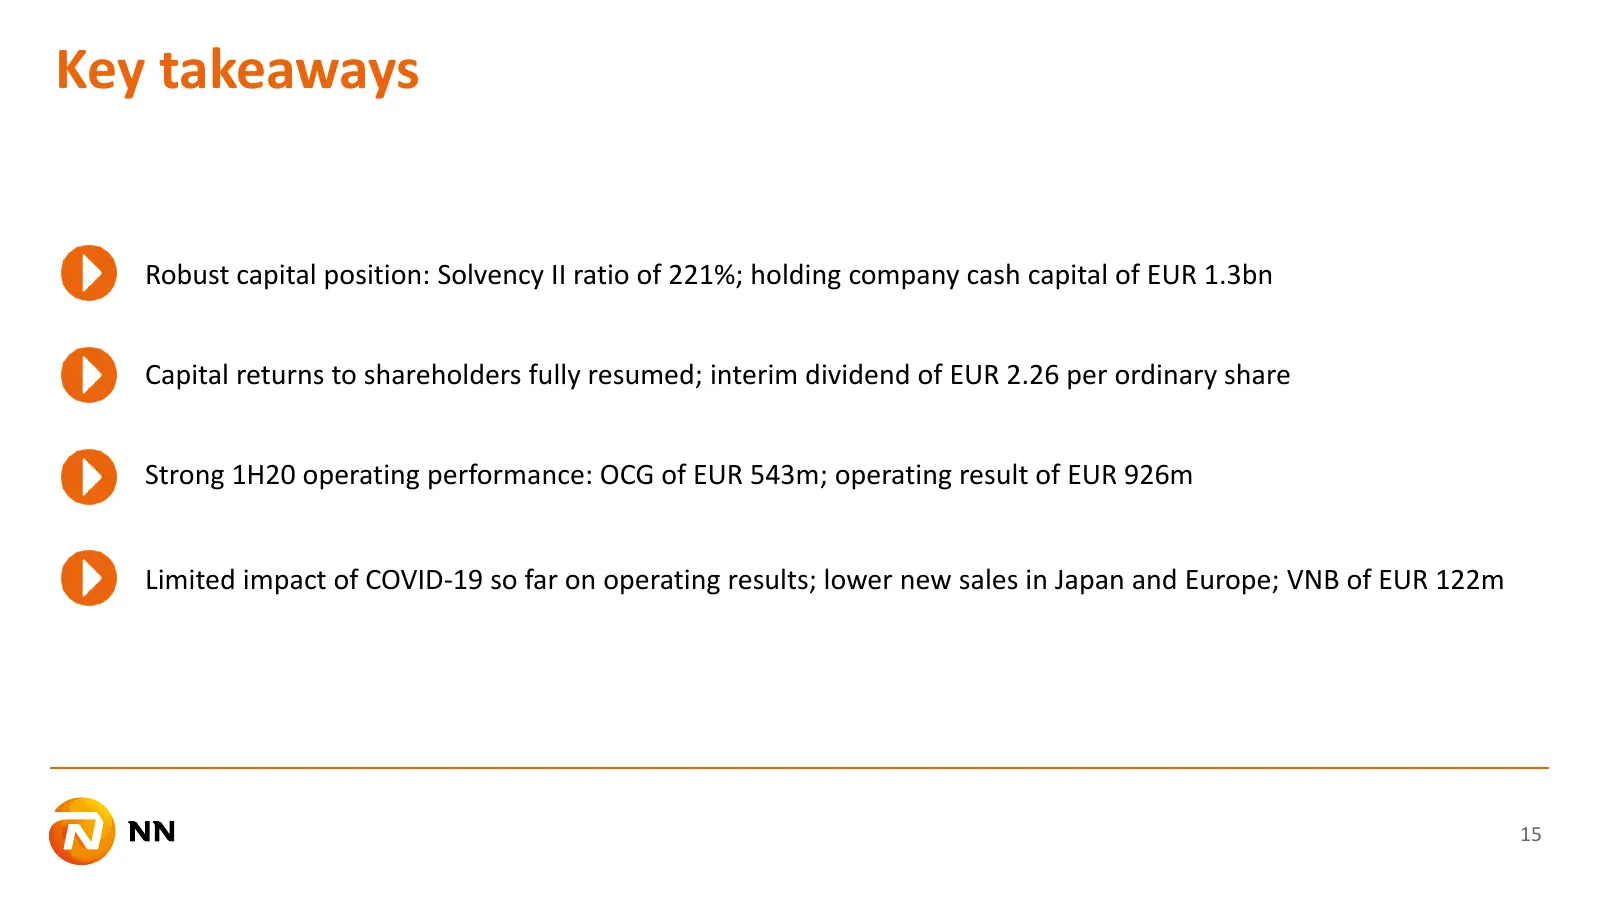
Slide 15: Key takeaways
Key takeaways Robust capital position: Solvency II ratio of 221%; holding company cash capital of EUR 1.3bn Capital returns to shareholders fully resumed; interim dividend of EUR 2.26 per ordinary share Strong 1H20 operating performance: OCG of EUR 543m; operating result of EUR 926m Limited impact o
Slide 16: Q&A
Q&A David Knibbe, Delfin Rueda, Bernhard Kaufmann

Slide 17: Appendices
Appendices @»s
Slide 18: Operating capital generation by source
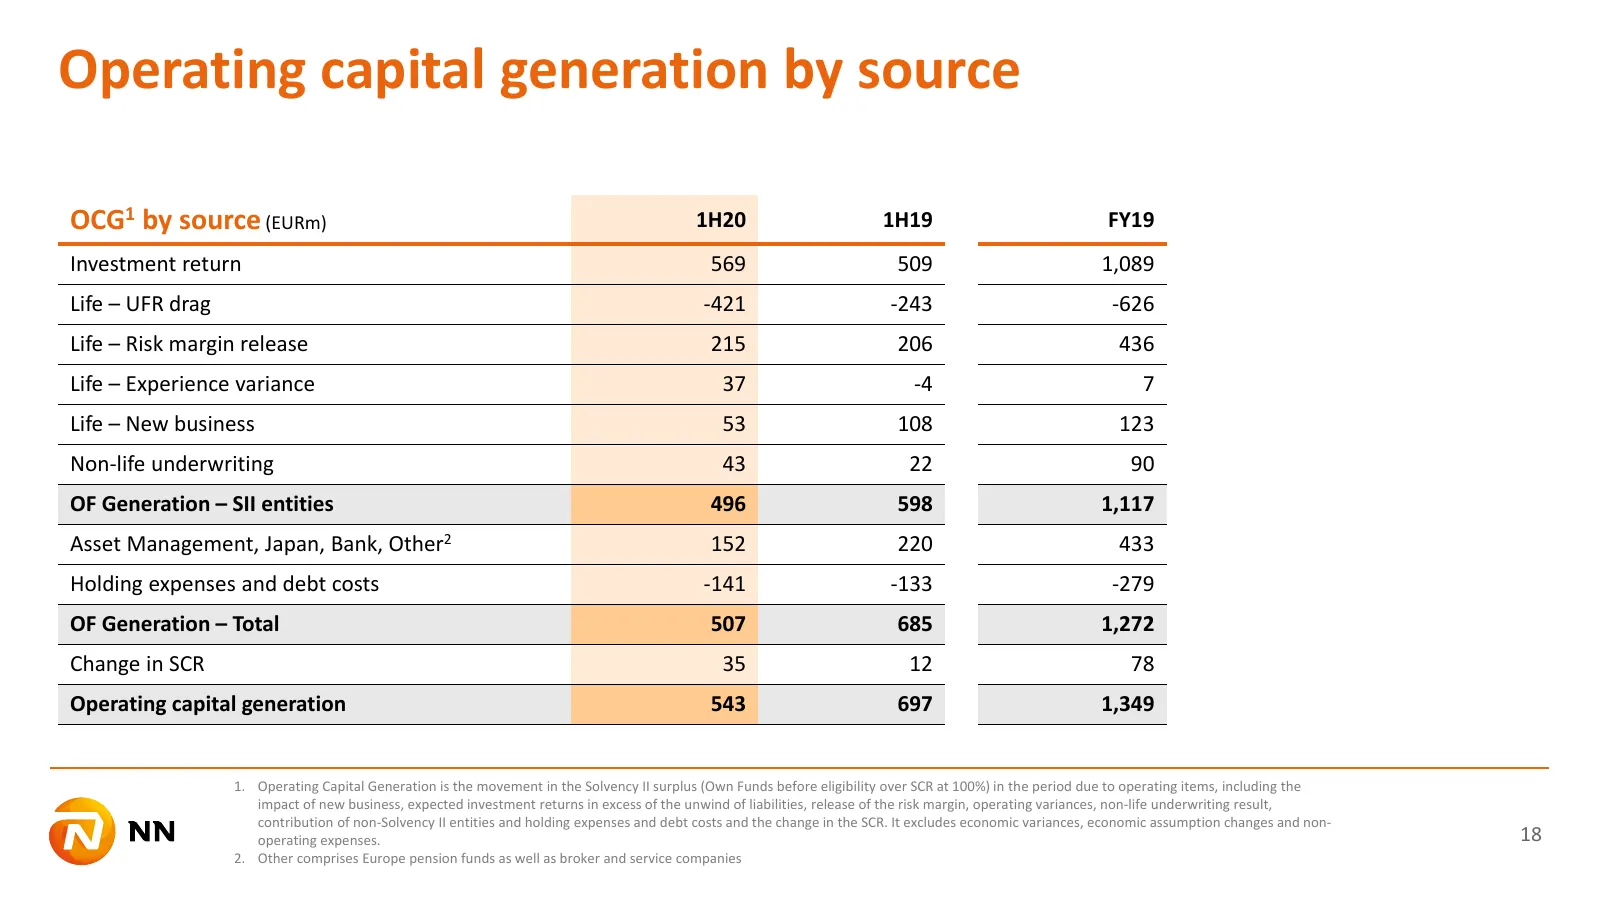
Operating capital generation by source OCG1 by source (EURm) 1H20 1H19 FY19 Investment return 569 509 1,089 Life – UFR drag -421 -243 -626 Life – Risk margin release 215 206 436 Life – Experience variance 37 -4 7 Life – New business 53 108 123 Non-life underwriting 43 22 90 OF Generation – SII entit
Slide 19: Solvency II sensitivities
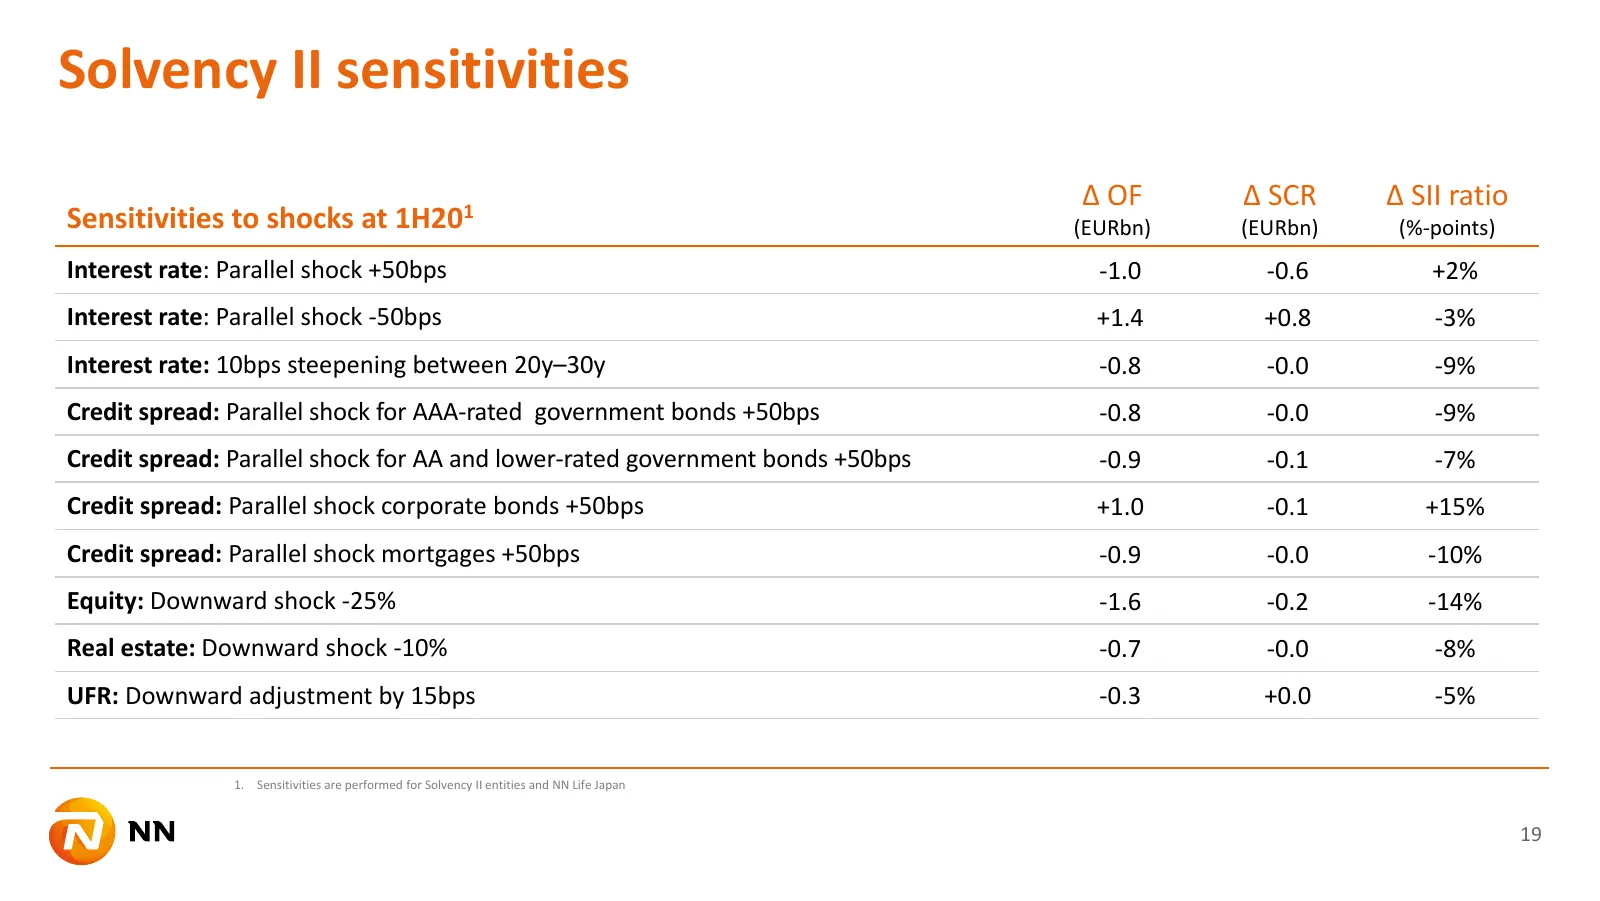
Solvency II sensitivities Δ OF Δ SCR Δ SII ratio Sensitivities to shocks at 1H201 (EURbn) (EURbn) (%-points) Interest rate: Parallel shock +50bps -1.0 -0.6 +2% Interest rate: Parallel shock -50bps +1.4 +0.8 -3% Interest rate: 10bps steepening between 20y–30y -0.8 -0.0 -9% Credit spread: Parallel sho
Slide 20: Remittances from subsidiaries
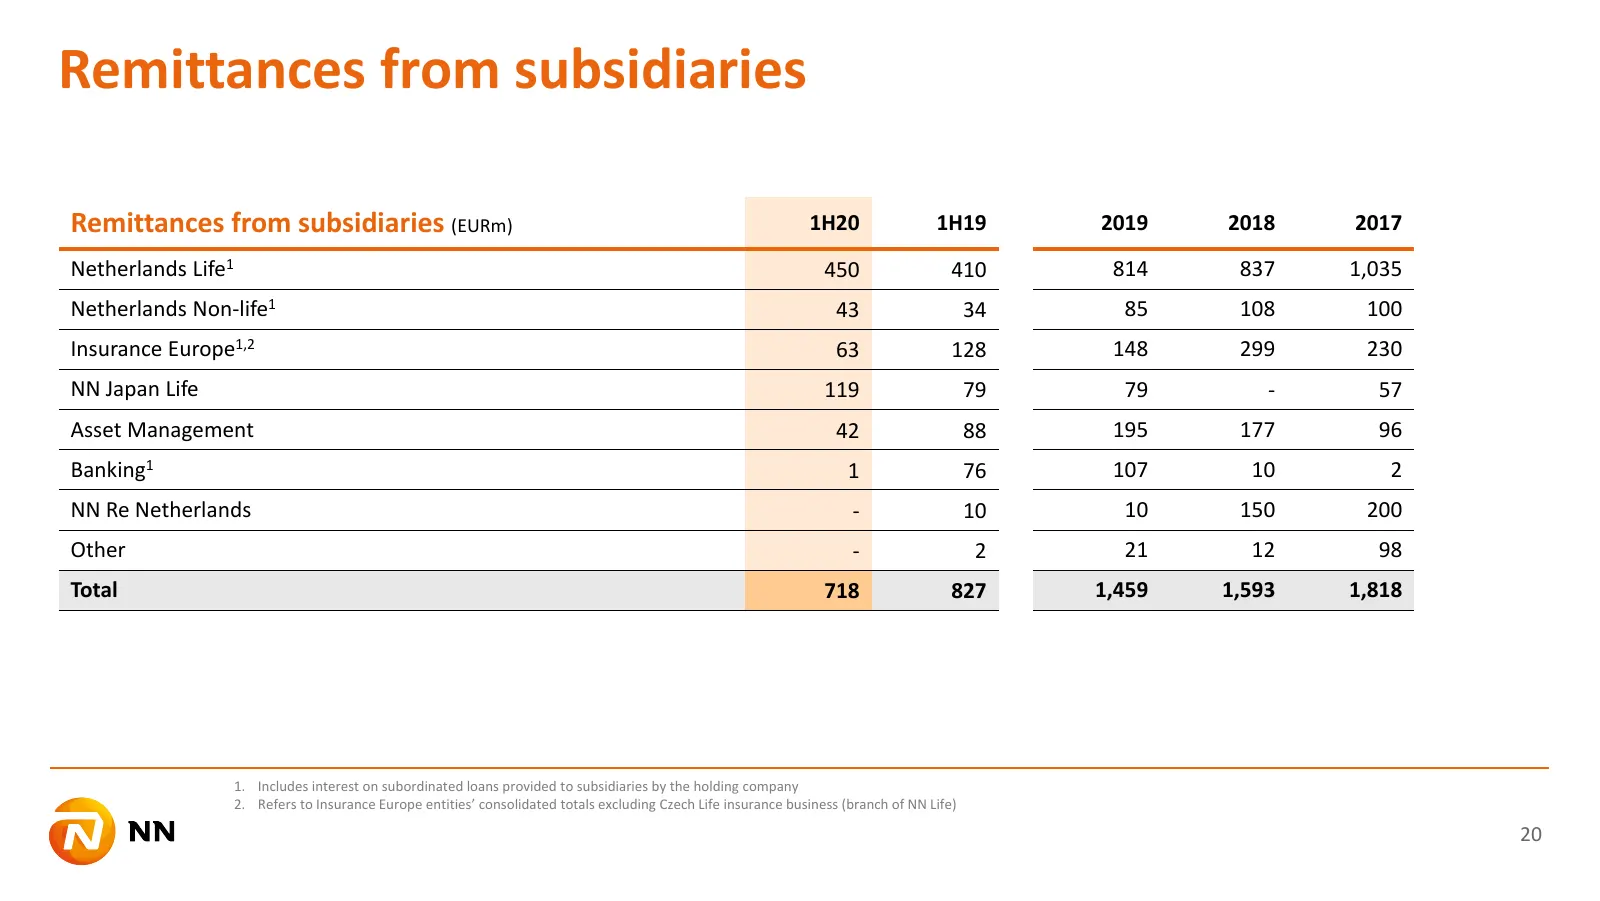
Remittances from subsidiaries Remittances from subsidiaries (EURm) 1H20 1H19 2019 2018 2017 Netherlands Life1 450 410 814 837 1,035 Netherlands Non-life1 43 34 85 108 100 Insurance Europe1,2 63 128 148 299 230 NN Japan Life 119 79 79 - 57 Asset Management 42 88 195 177 96 Banking1 1 76 107 10 2 NN R
Slide 21: Important legal information
Important legal information NN Group’s Consolidated Annual Accounts are prepared in accordance with International Financial Reporting Standards as adopted by the European Union (“IFRS-EU”) and with Part 9 of Book 2 of the Dutch Civil Code. In preparing the financial information in this document, the

Slide 22
Source: Internet Archive copy of nn-group.com
More decks from NN Group N.V.
 ESG Presentation (August 2026)33 slides · Aug 6, 2026
 1H26 Earnings Presentation31 slides · Aug 6, 2026
 Nationale-Nederlanden Bank — Debt Investor Presentation (April 2026)51 slides · Apr 16, 2026
 ESG Presentation (February 2026)33 slides · Feb 12, 2026
 FY2025 Earnings Presentation37 slides · Feb 12, 2026
 Nationale-Nederlanden Bank — Debt Investor Presentation (September 2025)61 slides · September 2025