ACS, Actividades de Construccion y Servicios SA · BME:ACS
ACS, Actividades de Construccion y Servicios SA — Q3 2023 Earnings Presentation
18 slides from ACS, Actividades de Construccion y Servicios SA's earnings presentation, Nov 13, 2023
Slide 1: Q3 2023 Results Presentation
Q3 2023 Results Presentation November 13th, 2023
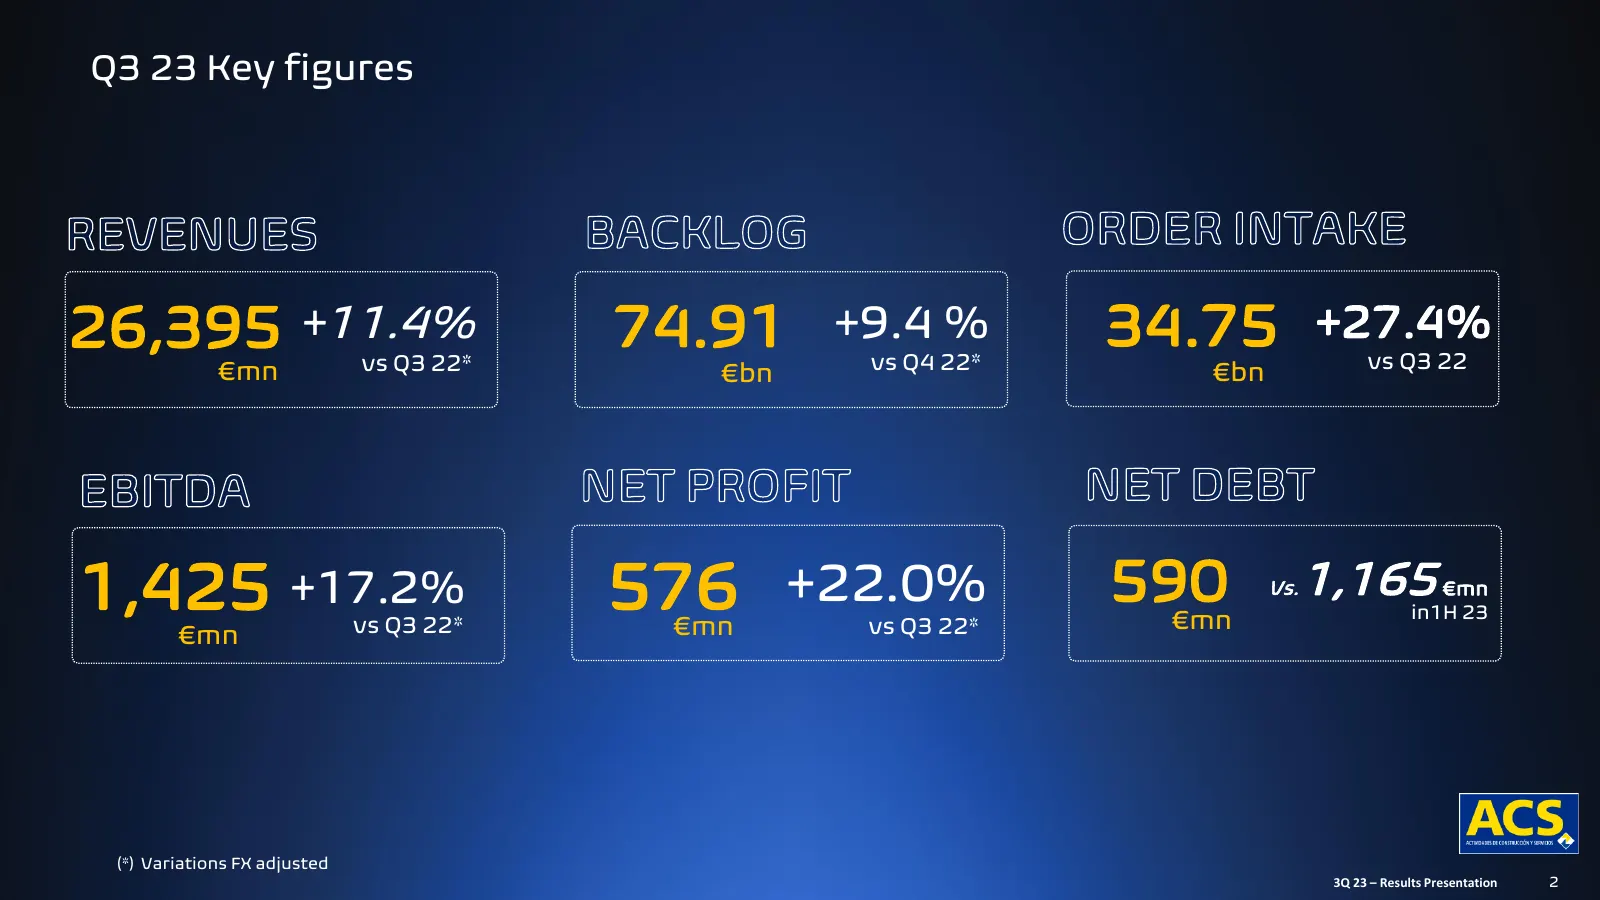
Slide 2: Q3 Key figures
Q3 23 Key figures 26,395 +11.4% vs Q3 22* 74.91 +9.4 % vs Q4 22* 34.75 +27.4% vs Q3 22 €mn €bn €bn 1,425 +17.2% 576 +22.0% 590 €mn Vs. 1,165 €mn in1H 23 €mn vs Q3 22* €mn vs Q3 22* (*) Variations FX adjusted 3Q 23 – Results Presentation 2
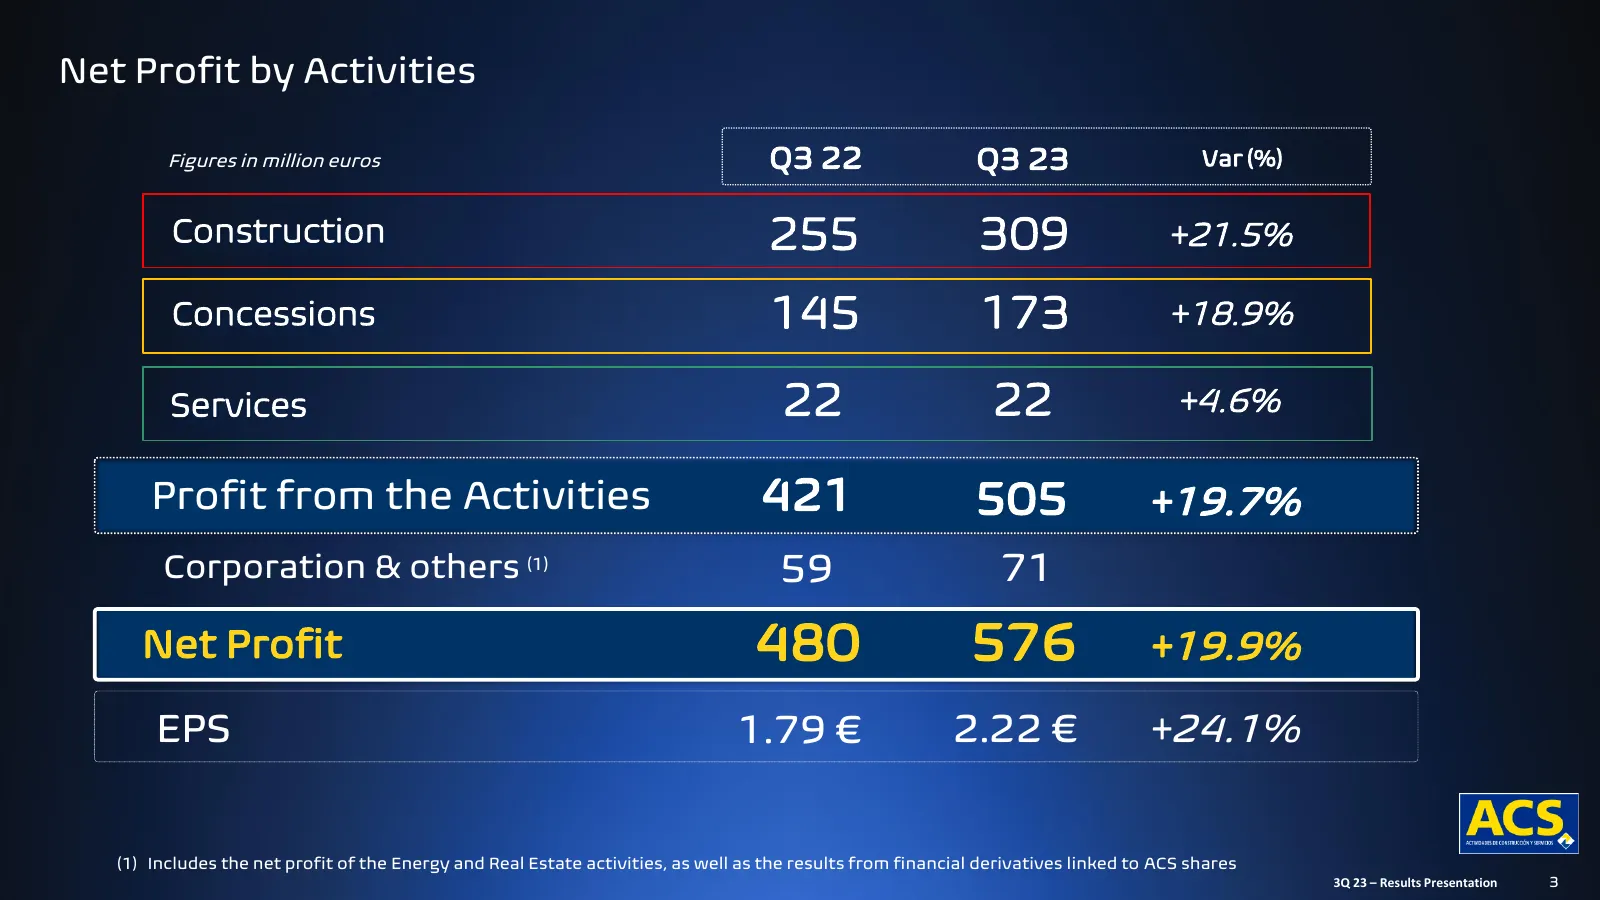
Slide 3: Net Profit by Activities
Net Profit by Activities Figures in million euros Q3 22 Q3 23 Var (%) Construction 255 309 +21.5% Concessions 145 173 +18.9% Services 22 22 +4.6% Profit from the Activities 421 505 +19.7% Corporation & others (1) 59 71 Net Profit 480 576 +19.9% EPS 1.79 € 2.22 € +24.1% (1) Includes the net profit of
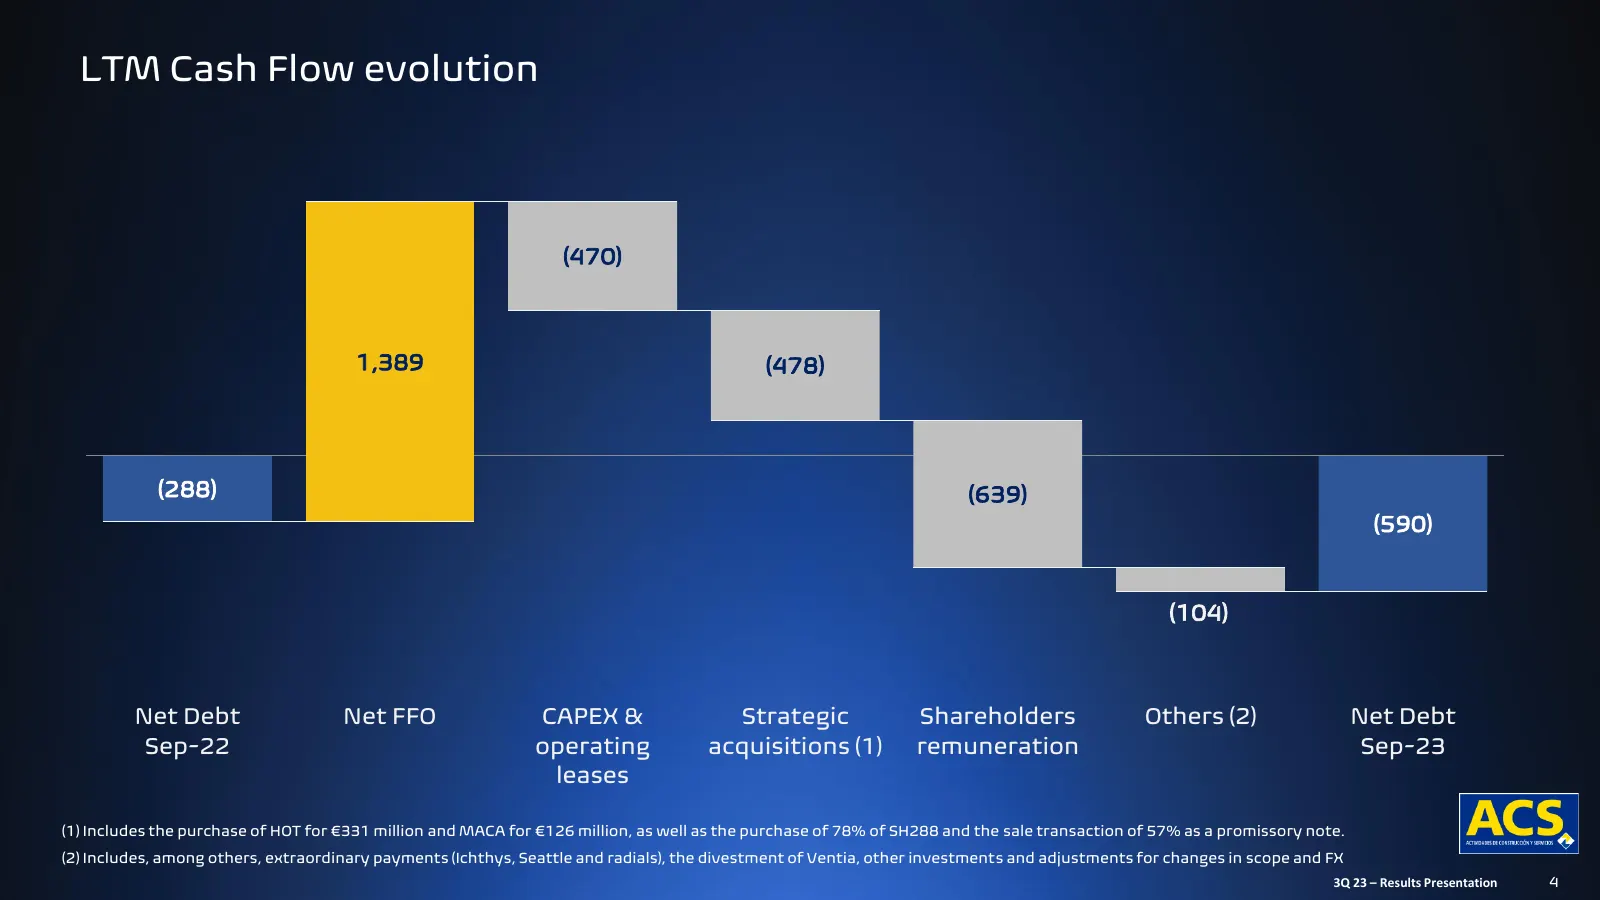
Slide 4: LTM Cash Flow evolution
LTM Cash Flow evolution (470) 1,389 (478) (288) (639) (590) (104) Net Debt Net FFO CAPEX & Strategic Shareholders Others (2) Net Debt Sep-22 operating acquisitions (1) remuneration Sep-23 leases (1) Includes the purchase of HOT for €331 million and MACA for €126 million, as well as the purchase of 7
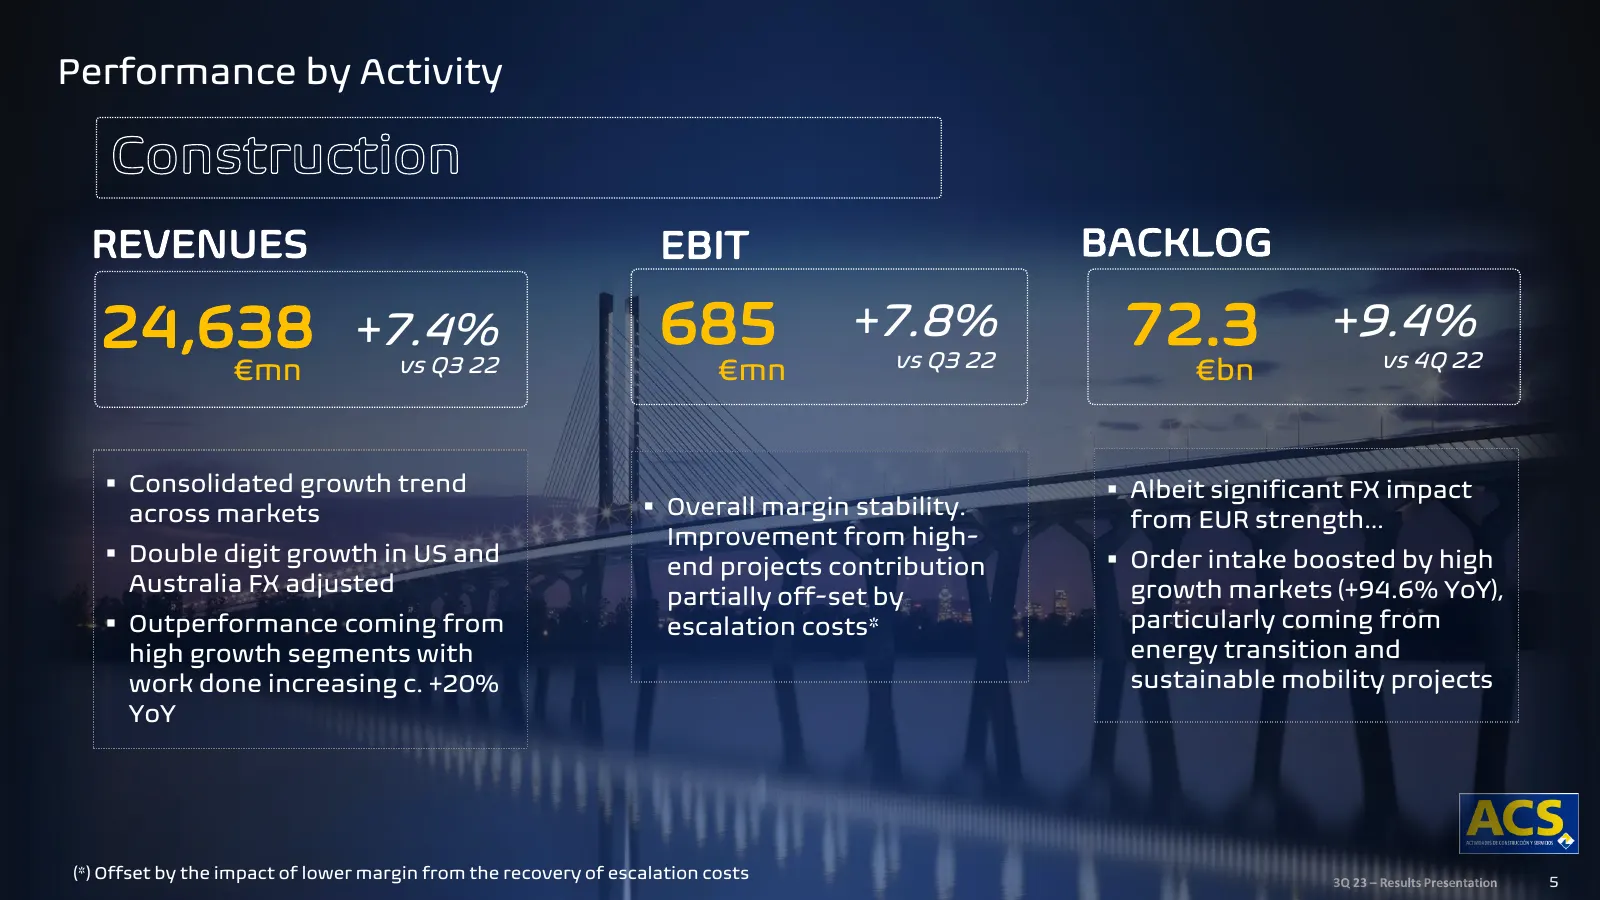
Slide 5: Performance by Activity: Construction
Performance by Activity REVENUES EBIT BACKLOG 24,638 +7.4% 685 +7.8% vs Q3 22 72.3 +9.4% vs 4Q 22 €mn vs Q3 22 €mn €bn ▪ Consolidated growth trend ▪ Albeit significant FX impact across markets ▪ Overall margin stability. from EUR strength… Improvement from high- ▪ Double digit growth in US and end p
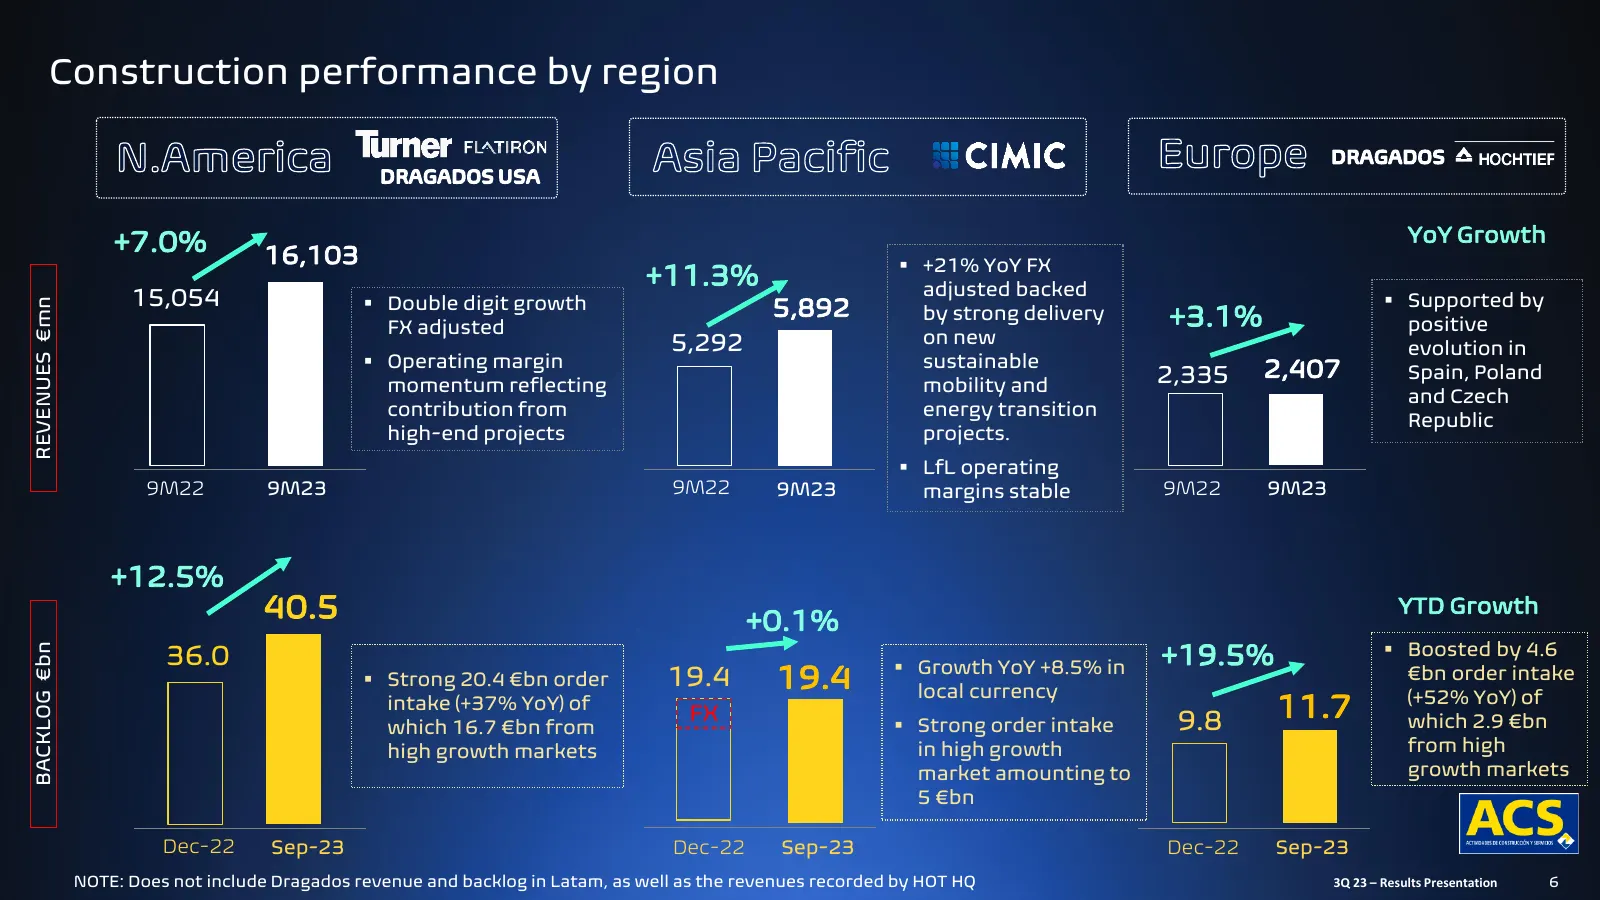
Slide 6: Construction performance by region
Construction performance by region +7.0% YoY Growth 16,103 ▪ +21% YoY FX +11.3% adjusted backed 15,054 ▪ Double digit growth 5,892 ▪ Supported by REVENUES €mn FX adjusted by strong delivery +3.1% positive 5,292 on new evolution in ▪ Operating margin sustainable 2,407 momentum reflecting mobility and
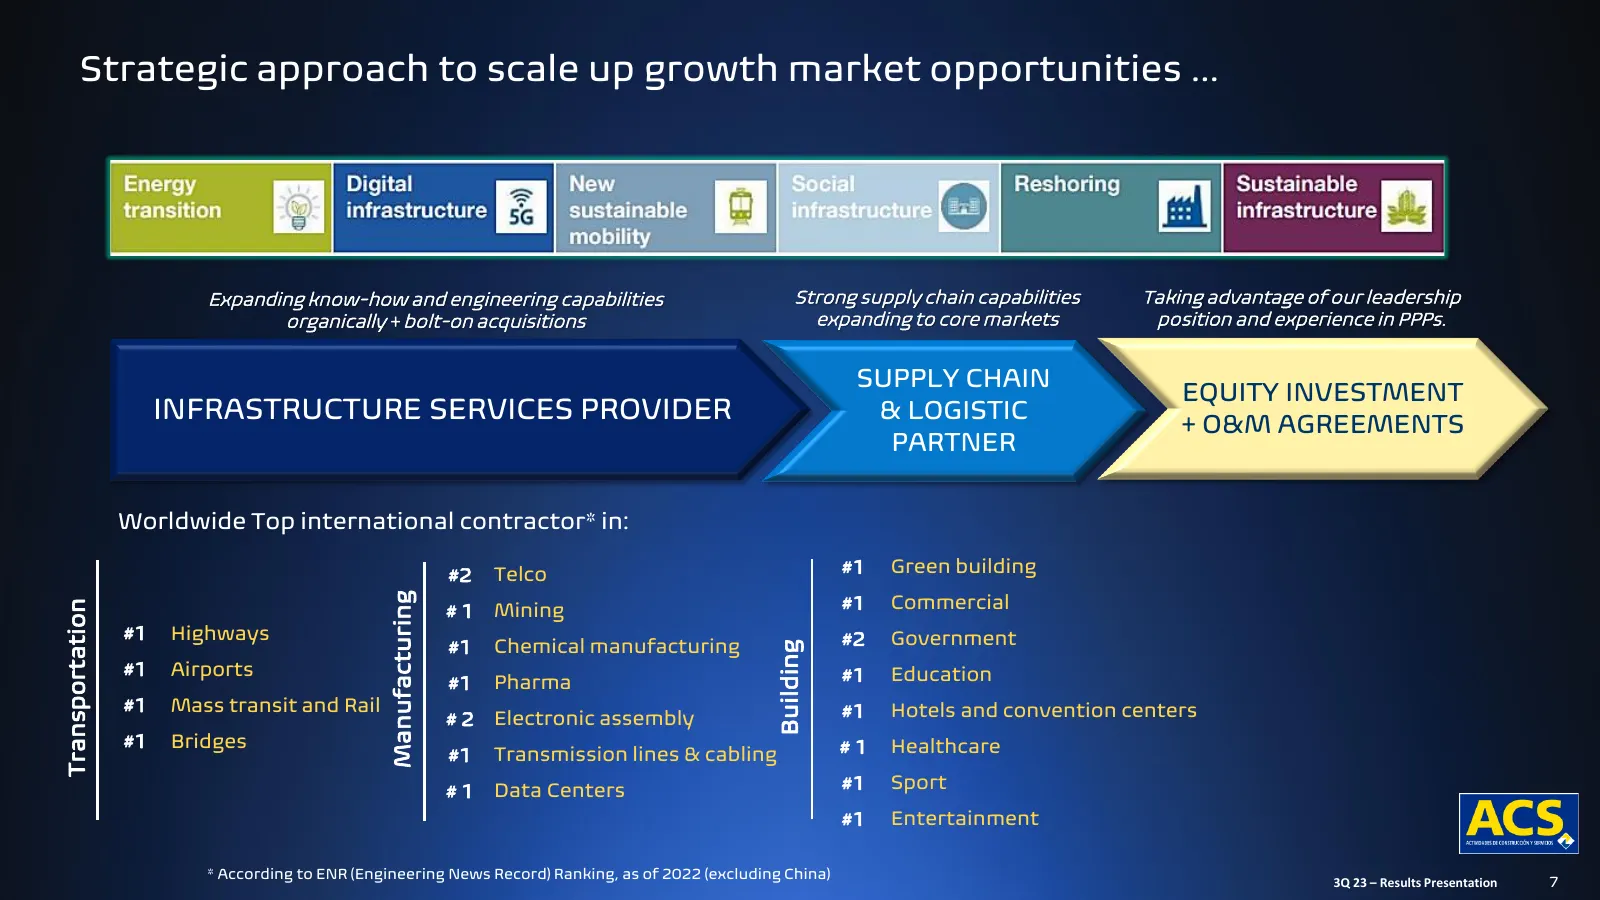
Slide 7: Strategic approach to scale up growth market opportunities
Strategic approach to scale up growth market opportunities … Expanding know-how and engineering capabilities Strong supply chain capabilities Taking advantage of our leadership organically + bolt-on acquisitions expanding to core markets position and experience in PPPs. SUPPLY CHAIN EQUITY INVESTMEN
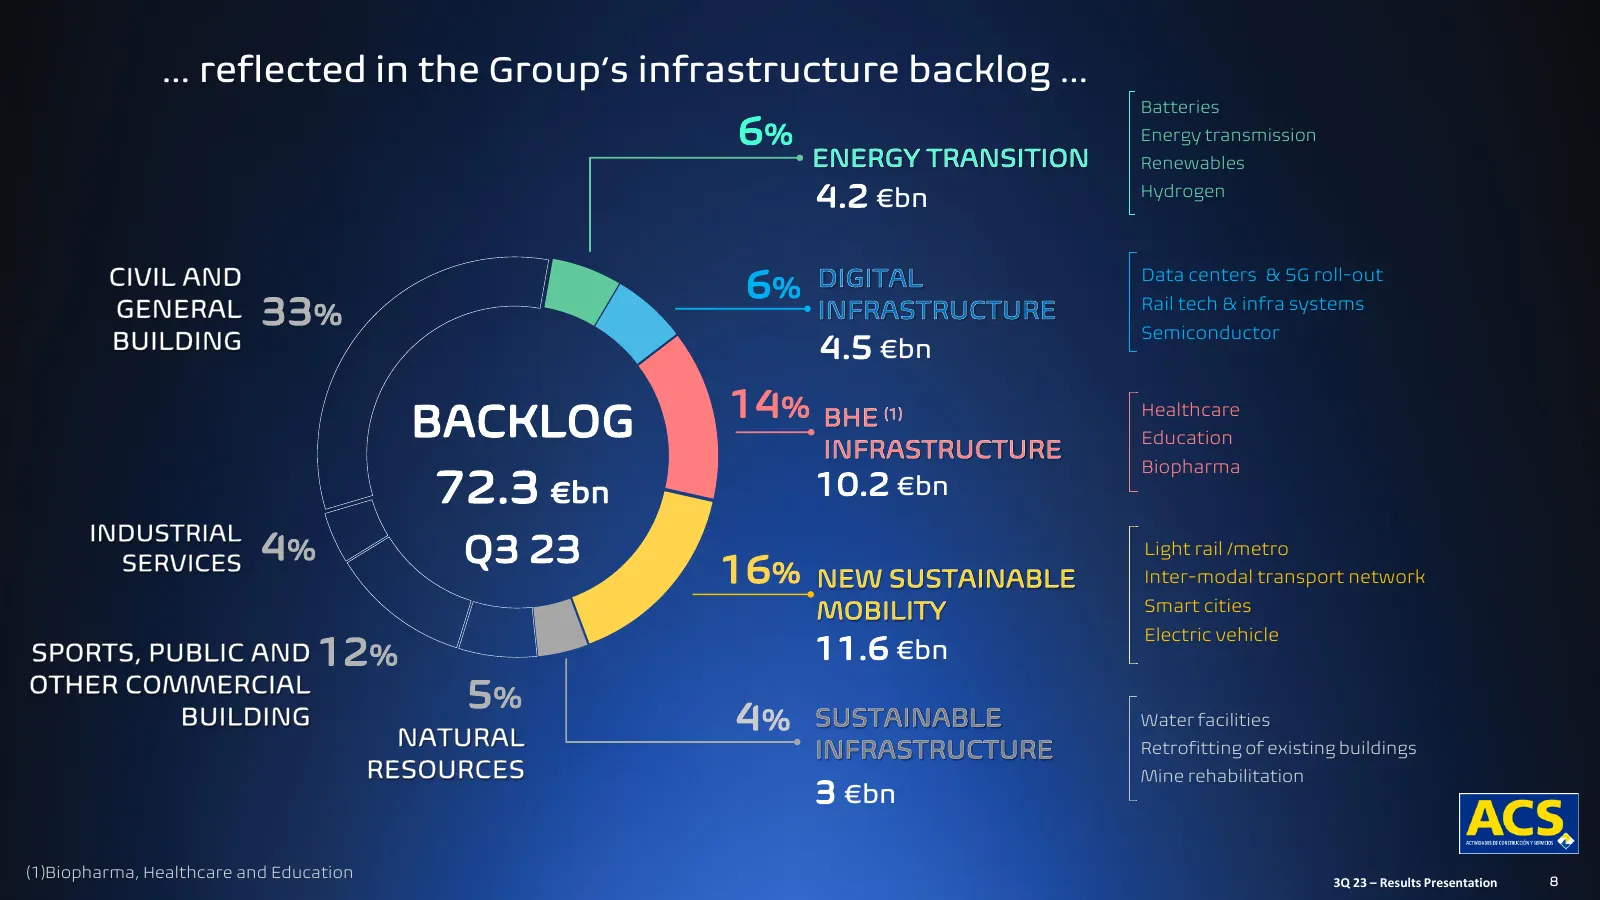
Slide 8: Group's infrastructure backlog
… reflected in the Group’s infrastructure backlog … Batteries 6% Energy transmission Renewables 4.2 €bn Hydrogen 6% Data centers & 5G roll-out 33% Rail tech & infra systems Semiconductor 4.5 €bn BACKLOG 14% Healthcare Education Biopharma 72.3 €bn 10.2 €bn 4% Q3 23 Light rail /metro 16% Inter-modal t
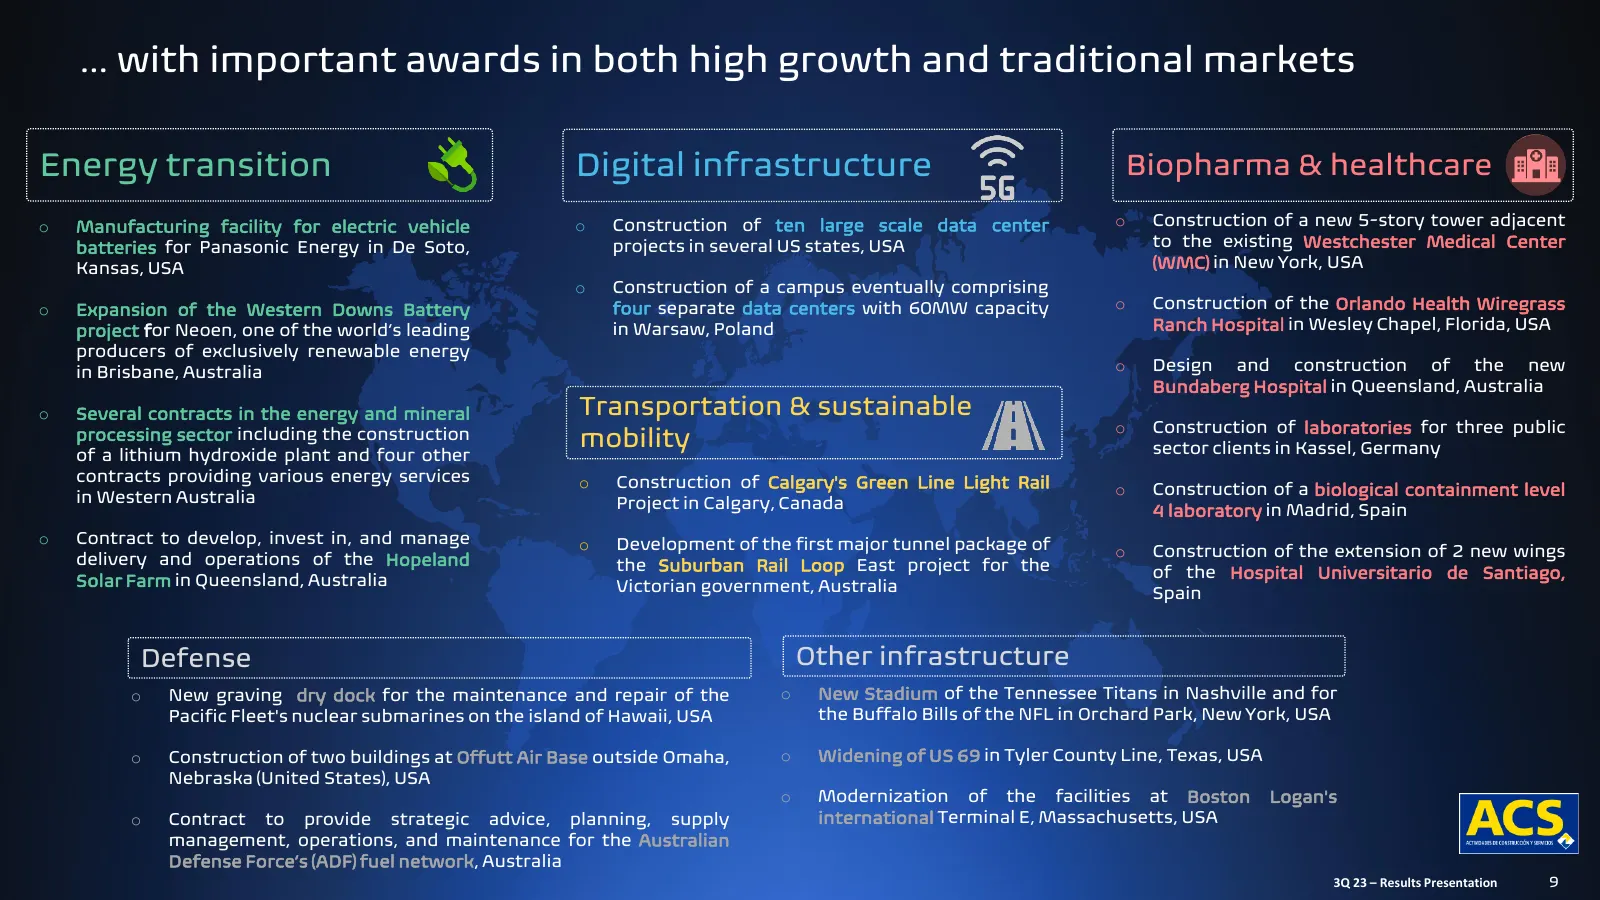
Slide 9: Important awards in both high growth and traditional markets
… with important awards in both high growth and traditional markets Energy transition Digital infrastructure Biopharma & healthcare o Manufacturing facility for electric vehicle o Construction of ten large scale data center o Construction of a new 5-story tower adjacent batteries for Panasonic Energ
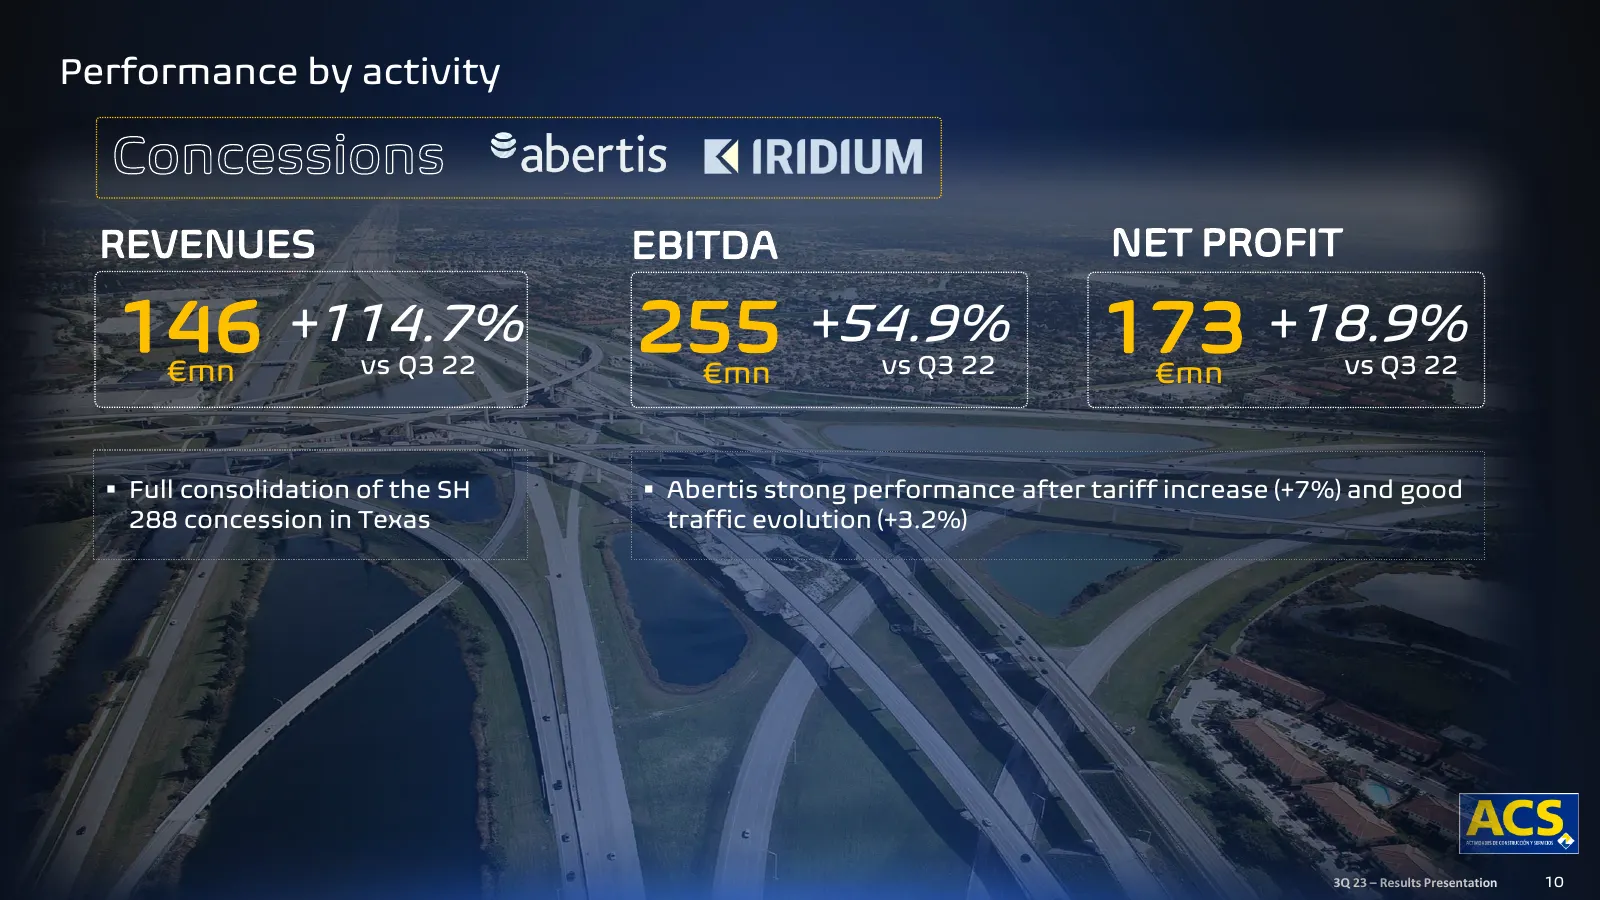
Slide 10: Performance by activity: Concessions
Performance by activity REVENUES EBITDA NET PROFIT 146 €mn +114.7% vs Q3 22 255 €mn +54.9% vs Q3 22 173 €mn +18.9% vs Q3 22 ▪ Full consolidation of the SH ▪ Abertis strong performance after tariff increase (+7%) and good 288 concession in Texas traffic evolution (+3.2%) 3Q 23 – Results Presentation
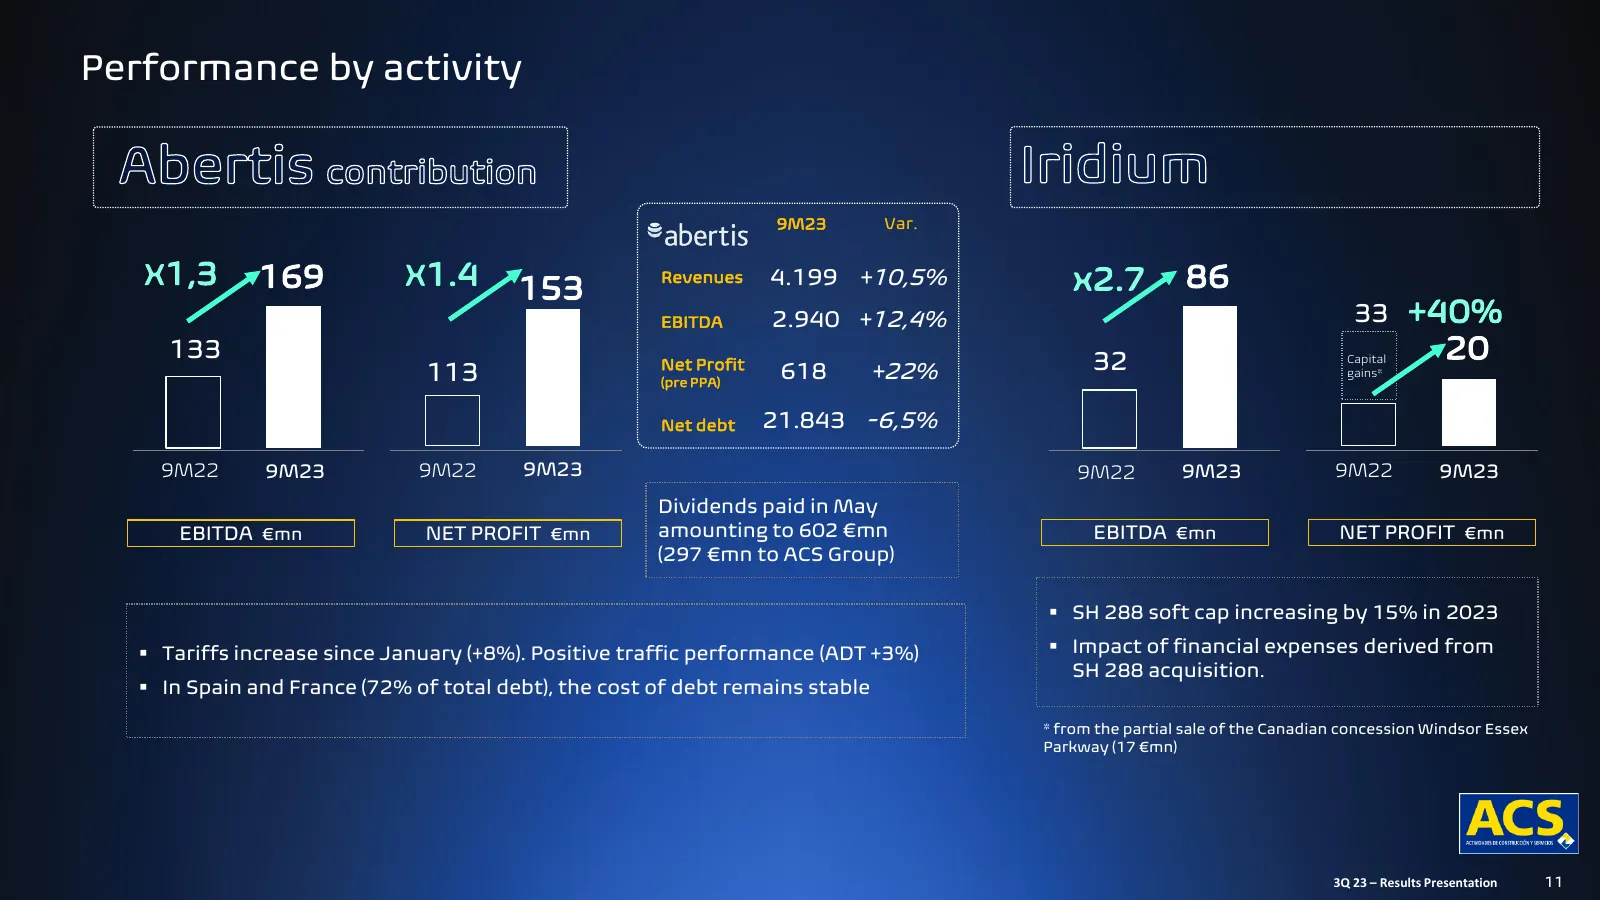
Slide 11: Performance by activity: Abertis
Performance by activity 9M23 Var. X1,3 169 X1.4 153 Revenues 4.199 +10,5% x2.7 86 EBITDA 2.940 +12,4% 33 +40% 133 Net Profit 32 Capital 20 113 (pre PPA) 618 +22% gains* Net debt 21.843 -6,5% 9M22 9M23 9M22 9M23 9M22 9M23 9M22 9M23 Dividends paid in May EBITDA €mn NET PROFIT €mn amounting to 602 €mn
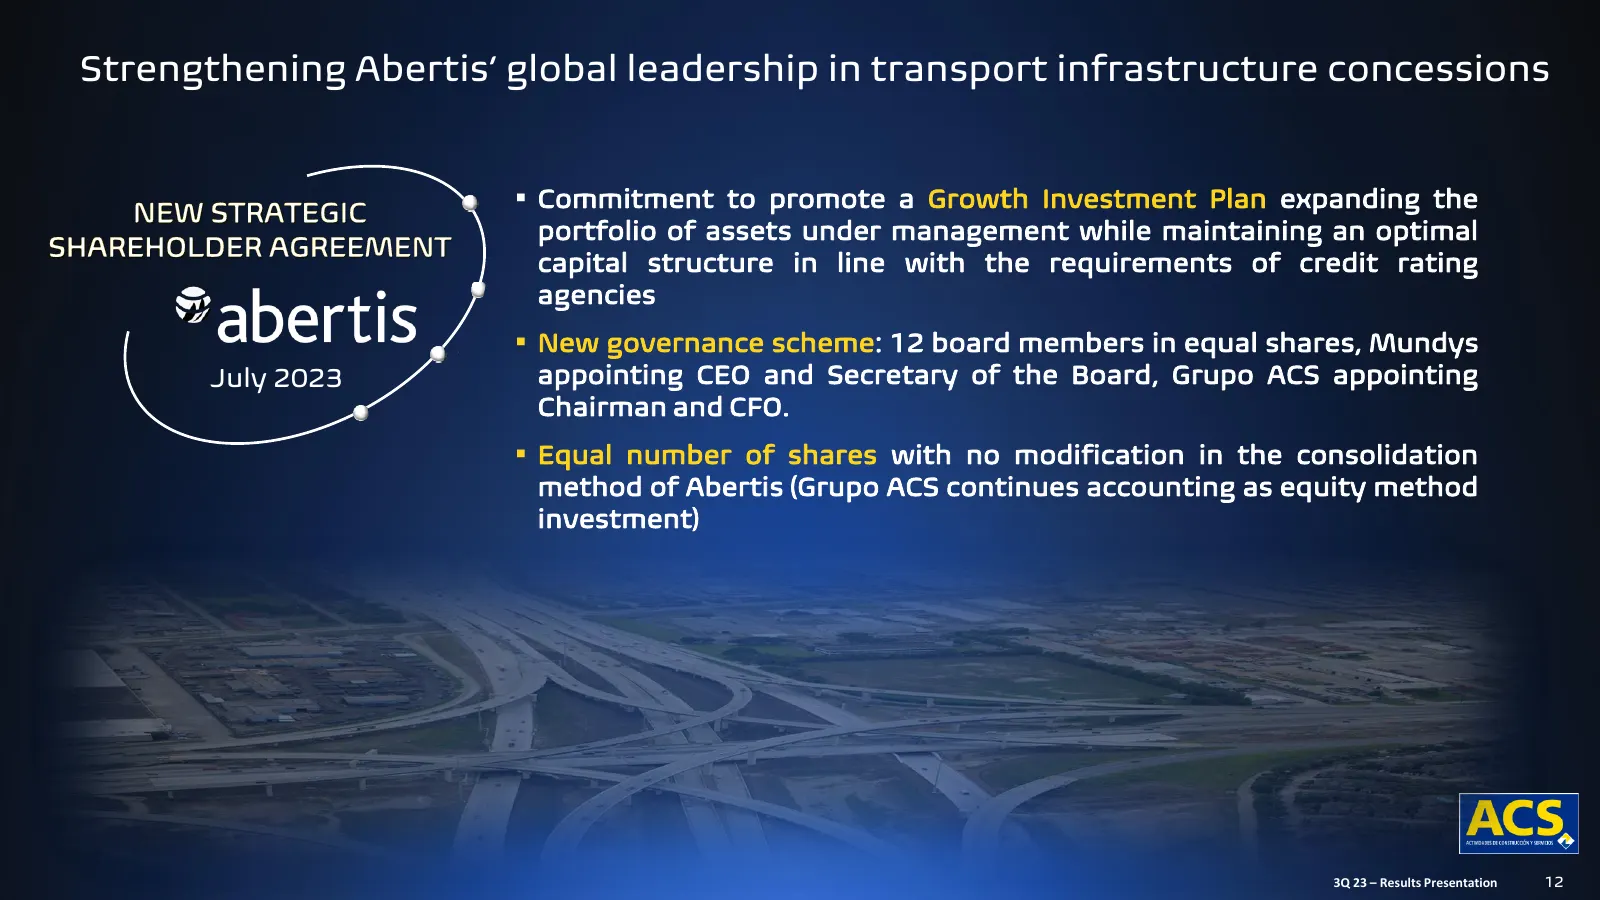
Slide 12: Strengthening Abertis' global leadership in transport infrastructure concessions
Strengthening Abertis‘ global leadership in transport infrastructure concessions ▪ Commitment to promote a Growth Investment Plan expanding the portfolio of assets under management while maintaining an optimal capital structure in line with the requirements of credit rating agencies ▪ New governance
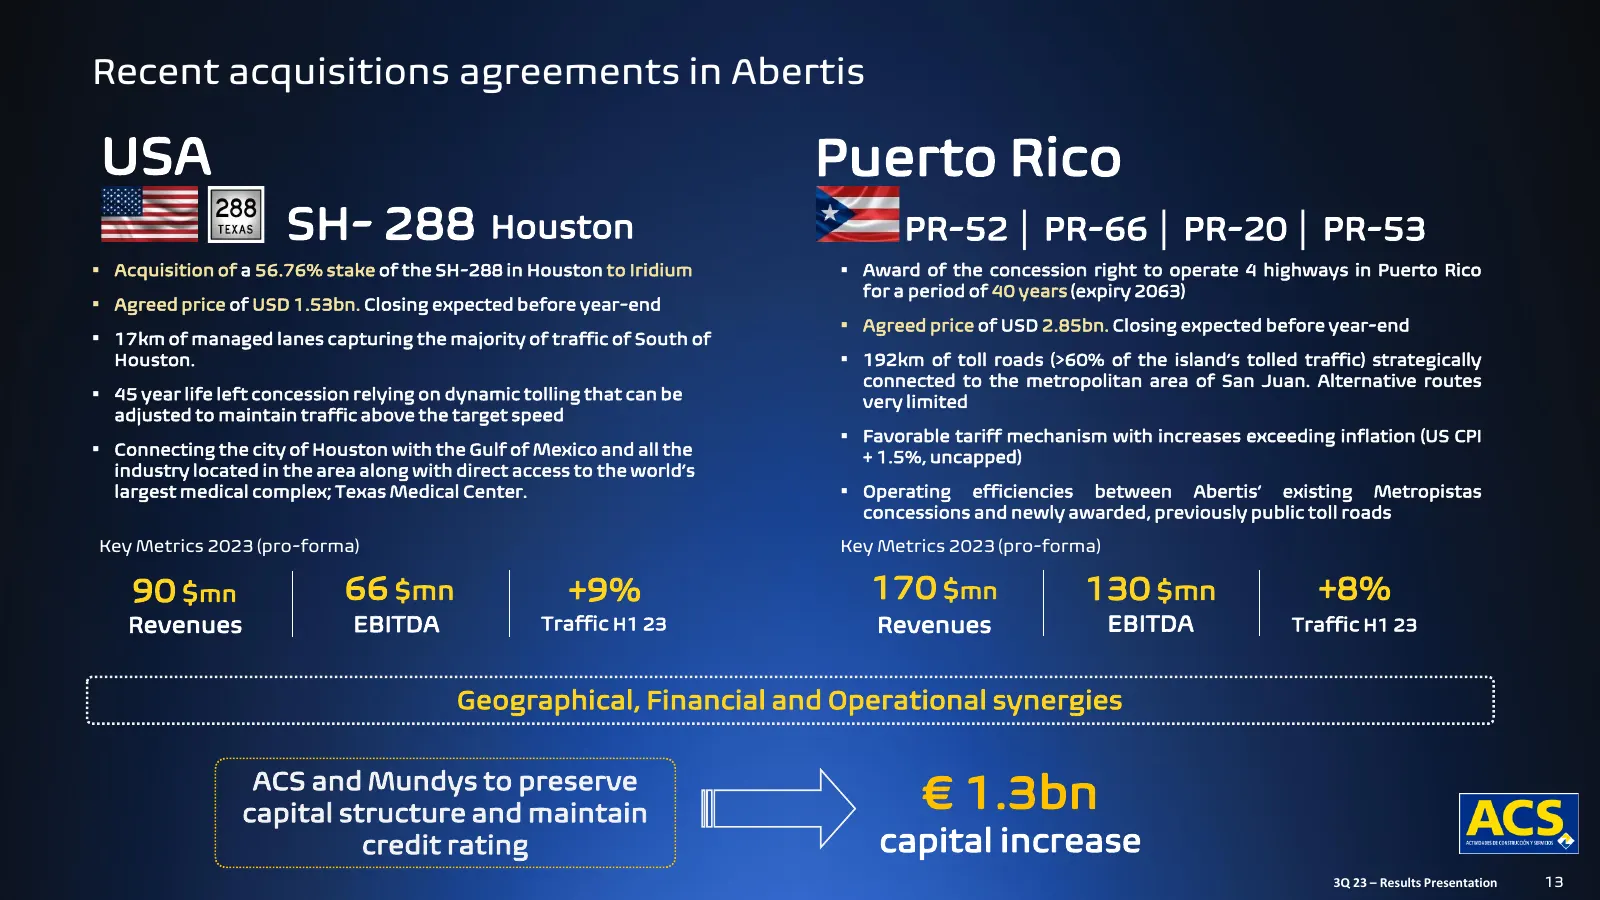
Slide 13: Recent acquisitions agreements in Abertis
Recent acquisitions agreements in Abertis USA Puerto Rico SH- 288 Houston PR-52 │ PR-66 │ PR-20 │ PR-53 ▪ Acquisition of a 56.76% stake of the SH-288 in Houston to Iridium ▪ Award of the concession right to operate 4 highways in Puerto Rico for a period of 40 years (expiry 2063) ▪ Agreed price of US
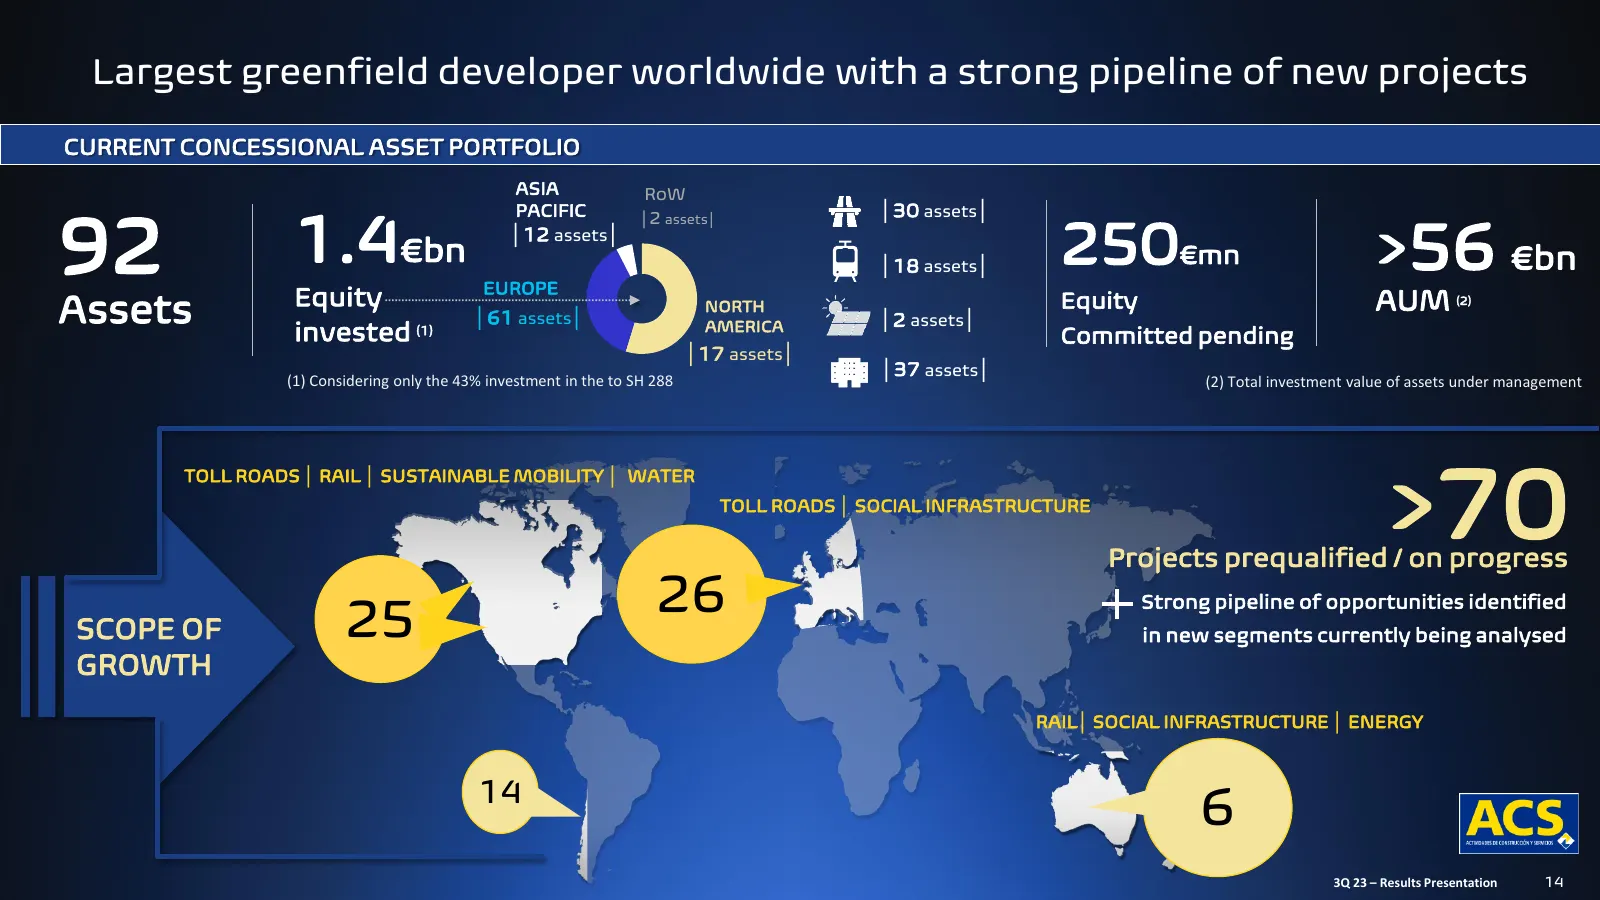
Slide 14: Largest greenfield developer worldwide with a strong pipeline of new projects
Largest greenfield developer worldwide with a strong pipeline of new projects CURRENT CONCESSIONAL ASSET PORTFOLIO ASIA RoW 92 1.4€bn PACIFIC │30 assets│ 250€mn >56 €bn │2 assets│ │12 assets│ │18 assets│ EUROPE Equity AUM (2) Assets invested (1) │61 assets│ NORTH AMERICA │2 assets│ Equity Committed
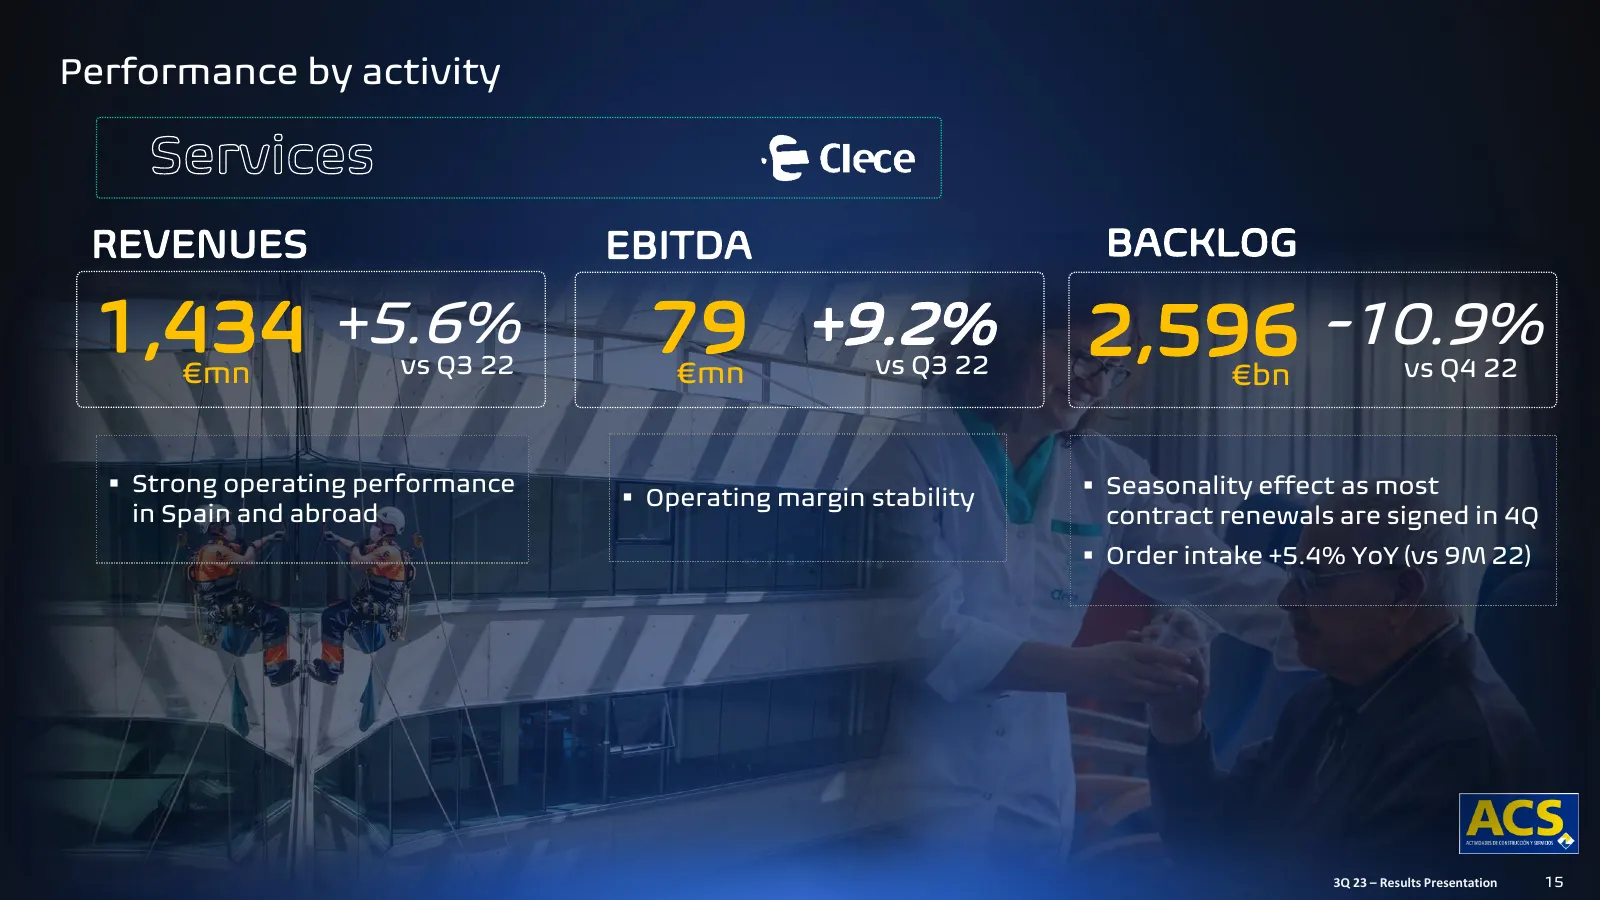
Slide 15: Performance by activity: Services
Performance by activity REVENUES EBITDA BACKLOG 1,434 €mn +5.6% vs Q3 22 79 €mn +9.2% vs Q3 22 2,596 €bn -10.9% vs Q4 22 ▪ Strong operating performance ▪ Seasonality effect as most ▪ Operating margin stability in Spain and abroad contract renewals are signed in 4Q ▪ Order intake +5.4% YoY (vs 9M 22)
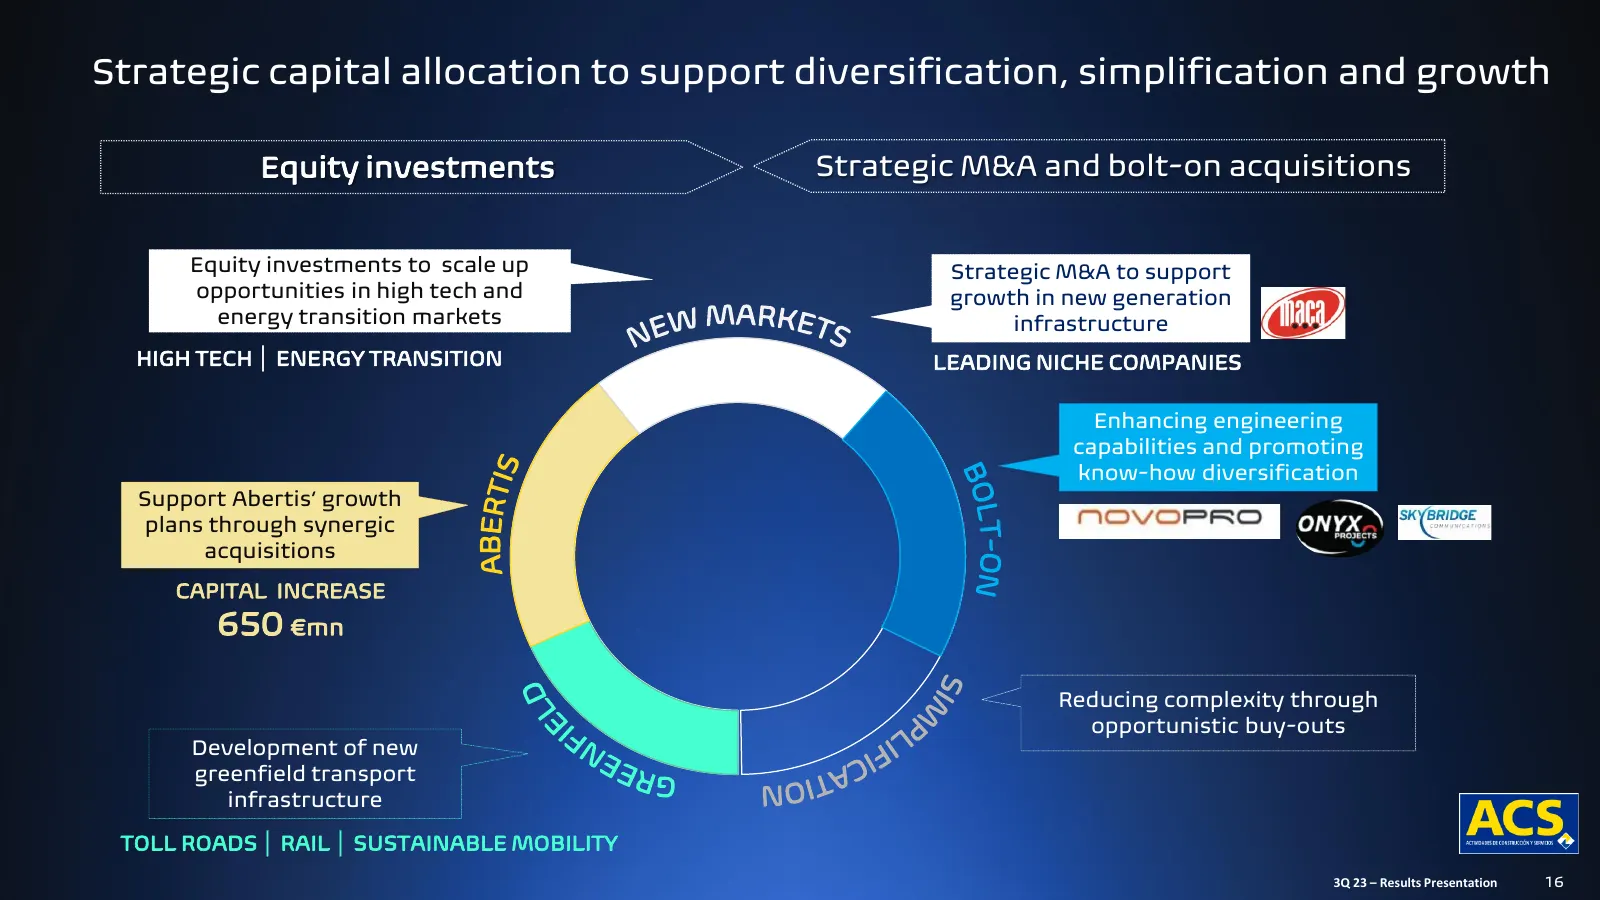
Slide 16: Strategic capital allocation to support diversification, simplification and growth
Strategic capital allocation to support diversification, simplification and growth Equity investments Strategic M&A and bolt-on acquisitions Equity investments to scale up Strategic M&A to support opportunities in high tech and growth in new generation energy transition markets infrastructure HIGH T
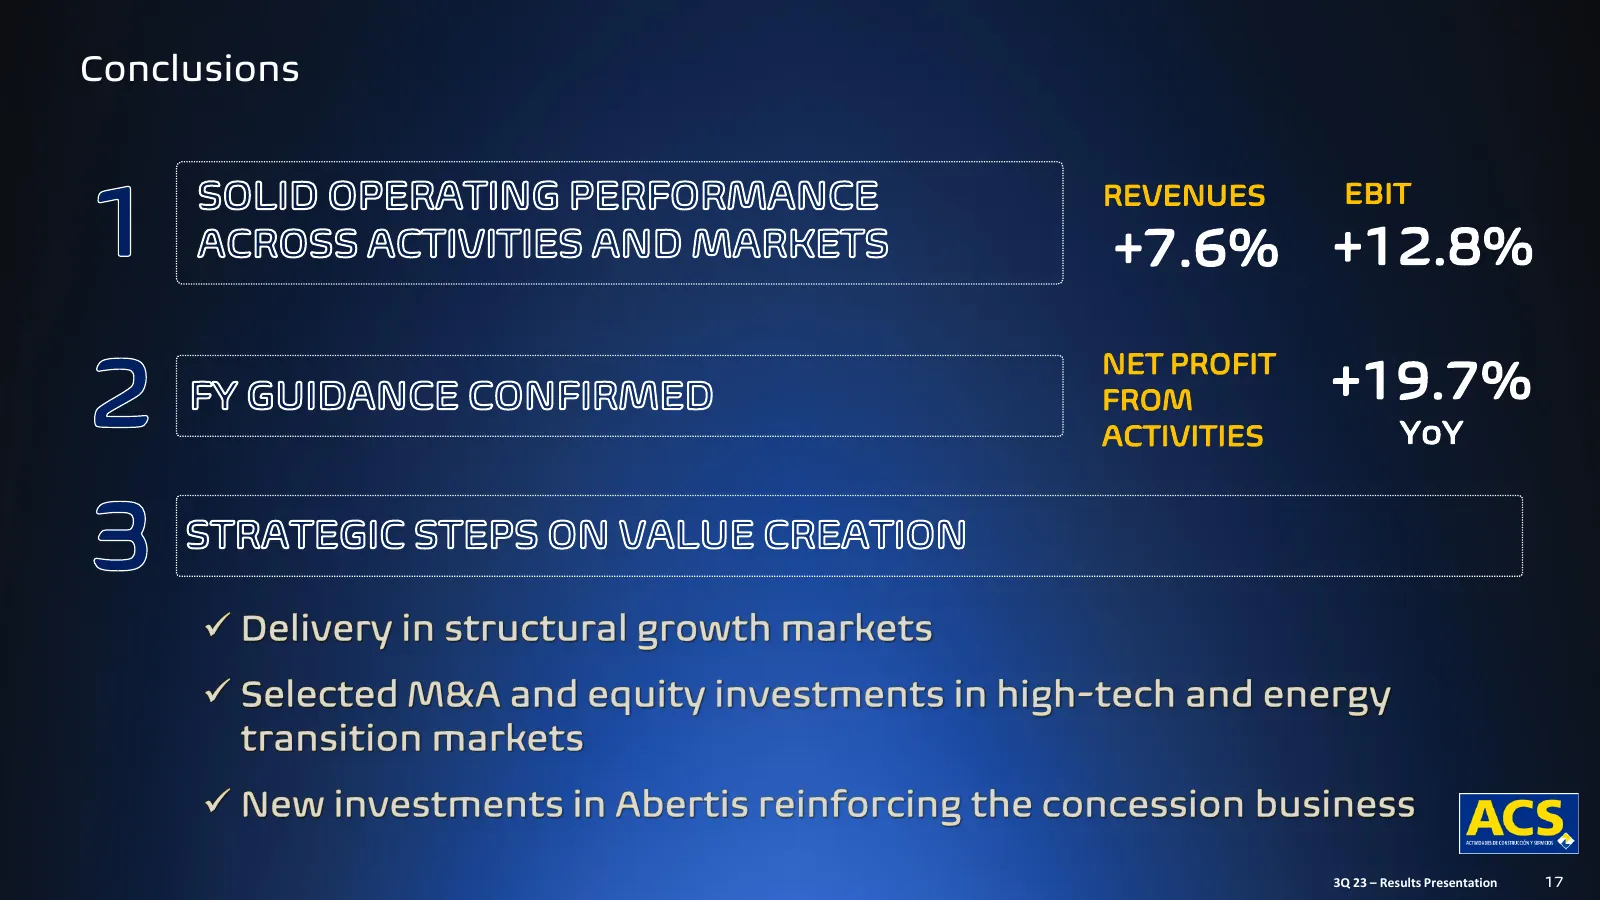
Slide 17: Conclusions
Conclusions REVENUES EBIT +7.6% +12.8% NET PROFIT FROM +19.7% ACTIVITIES YoY 3Q 23 – Results Presentation 17
Slide 18: Legal Disclaimer
WIP Legal Disclaimer This document contains forward-looking statements on the intentions. expectations or forecasts of Grupo ACS or its management at the time the document was drawn up and in reference to various matters including. among others. its customer base. its performance. the foreseeable gr
Source: Internet Archive copy of grupoacs.com
More decks from ACS, Actividades de Construccion y Servicios SA
 Investor Day (November 2026)177 slides · Nov 12, 2026
 Investor Day (November 2026)104 slides · Nov 12, 2026
 Investor Day (November 2026)14 slides · Nov 12, 2026
 Investor Day (November 2026)17 slides · Nov 12, 2026
 Investor Day (November 2026)13 slides · Nov 12, 2026
 Investor Day (November 2026)17 slides · Nov 12, 2026
All 139 ACS, Actividades de Construccion y Servicios SA decks