GAIN Capital — FY2015 Earnings Presentation
28 slides from GAIN Capital's earnings presentation, Mar 15, 2016
Slide 1: Financial and Operating Results Fourth Quarter and Full Year 2015
Financial and Operating Results Fourth Quarter and Full Year 2015 March 2016
Slide 2: Safe Harbor Statement
GAIN Capital 2 Safe Harbor Statement Forward Looking Statements The forward-looking statements contained herein include, without limitation, statements relating to GAIN Capital’s and/or City Index (Holdings) Limited (“City Index”) expectations regarding the opportunities and strengths of the combine
Slide 3: Fourth Quarter and Full Year Overview
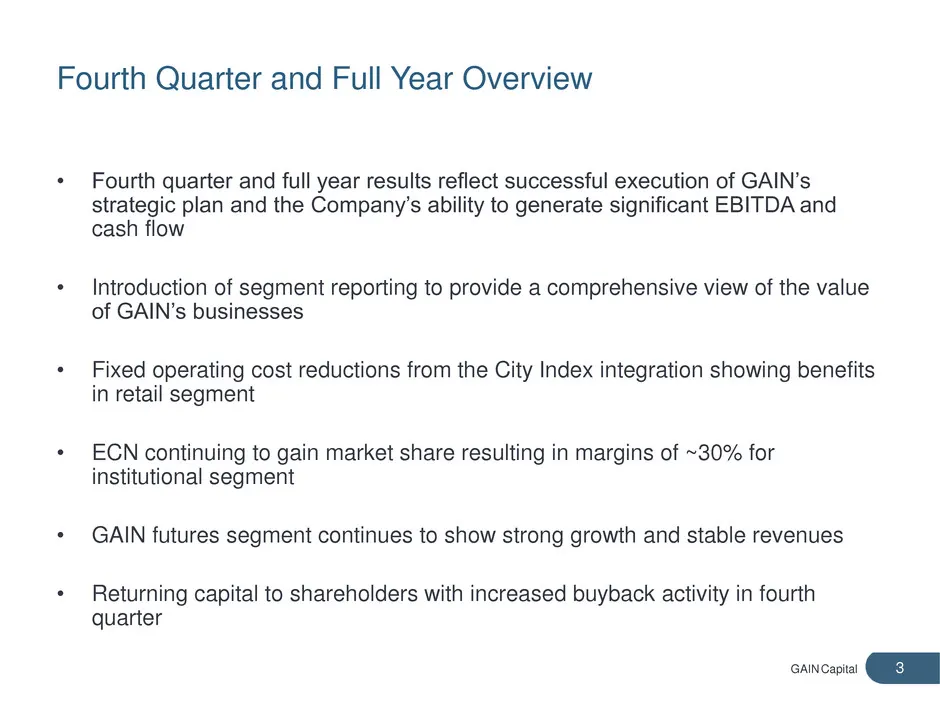
GAIN Capital 3 Fourth Quarter and Full Year Overview • Fourth quarter and full year results reflect successful execution of GAIN’s strategic plan and the Company’s ability to generate significant EBITDA and cash flow • Introduction of segment reporting to provide a comprehensive view of the value of
Slide 4: 4th Quarter 2015 Financial and Operating Results
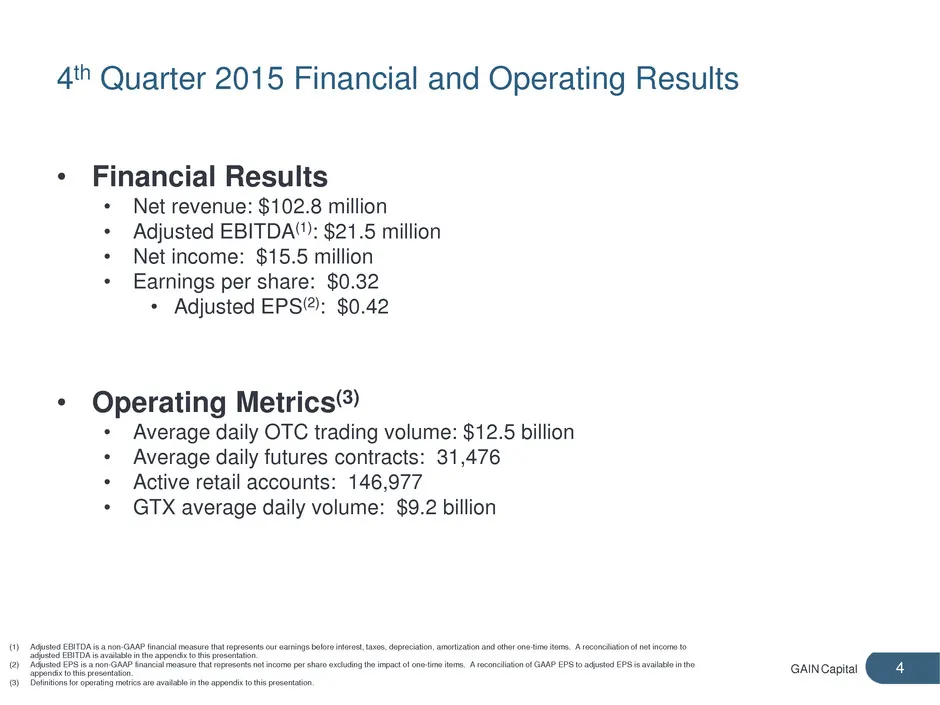
GAIN Capital 4 4th Quarter 2015 Financial and Operating Results • Financial Results • Net revenue: $102.8 million • Adjusted EBITDA(1): $21.5 million • Net income: $15.5 million • Earnings per share: $0.32 • Adjusted EPS(2): $0.42 • Operating Metrics(3) • Average daily OTC trading volume: $12.5 bill
Slide 5: Full Year 2015 Financial and Operating Results
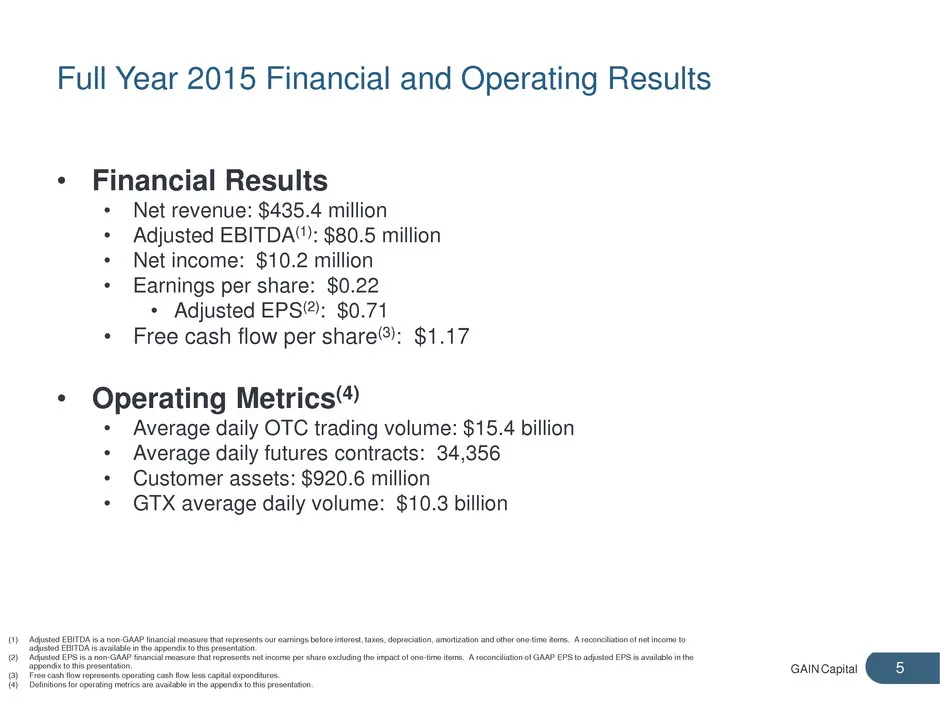
GAIN Capital 5 Full Year 2015 Financial and Operating Results • Financial Results • Net revenue: $435.4 million • Adjusted EBITDA(1): $80.5 million • Net income: $10.2 million • Earnings per share: $0.22 • Adjusted EPS(2): $0.71 • Free cash flow per share(3): $1.17 • Operating Metrics(4) • Average d
Slide 6: Segment Reporting
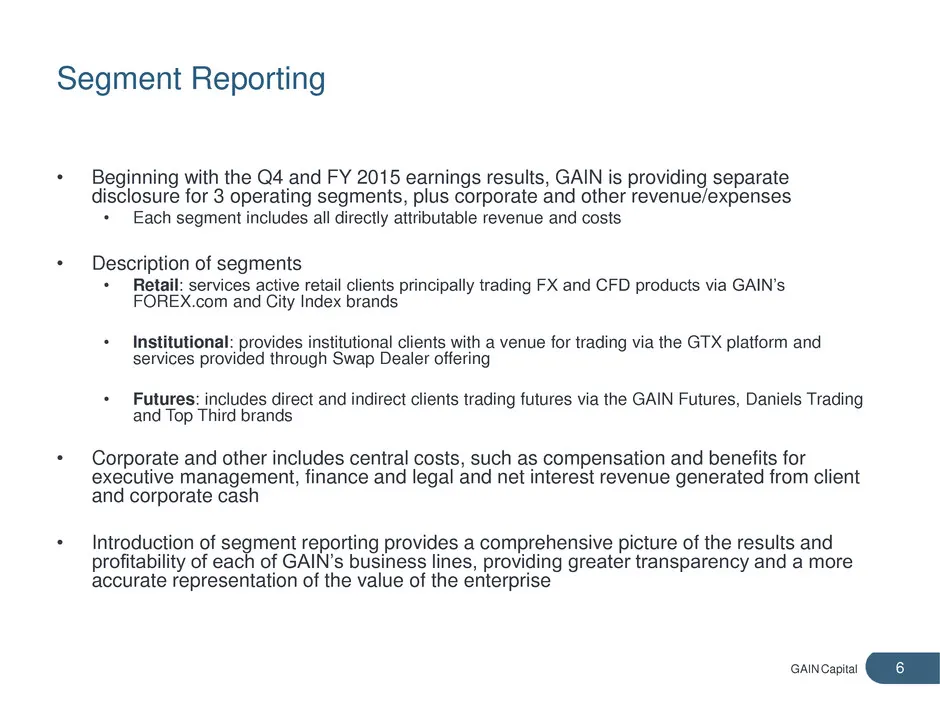
GAIN Capital 6 Segment Reporting • Beginning with the Q4 and FY 2015 earnings results, GAIN is providing separate disclosure for 3 operating segments, plus corporate and other revenue/expenses • Each segment includes all directly attributable revenue and costs • Description of segments • Retail: ser
Slide 7: Summary Operating Segments/Corporate & Other
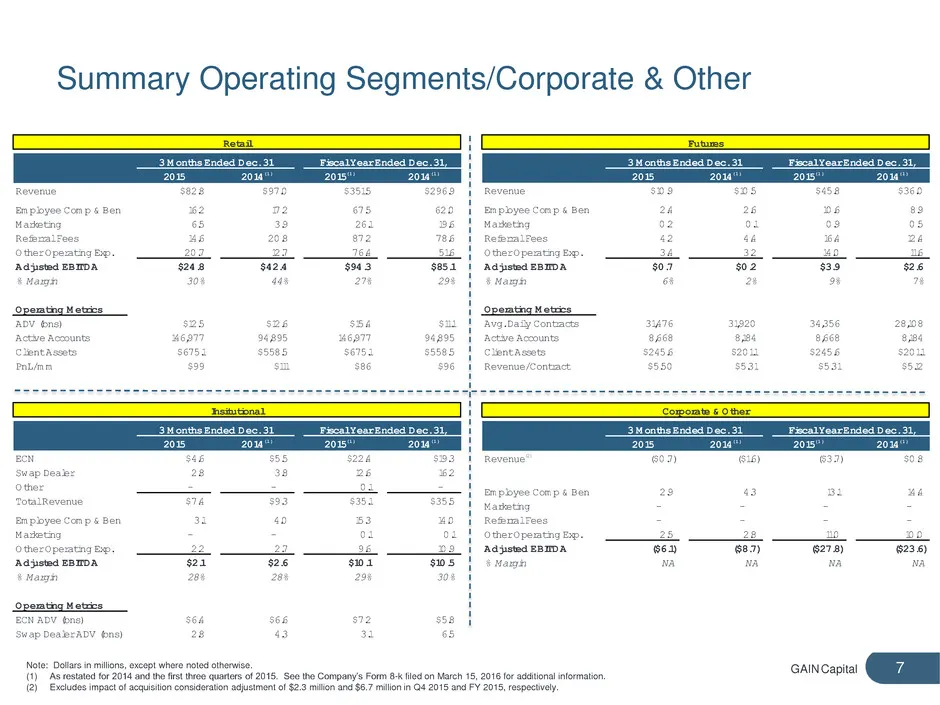
GAIN Capital 7 Summary Operating Segments/Corporate & Other Note: Dollars in millions, except where noted otherwise. (1) As restated for 2014 and the first three quarters of 2015. See the Company’s Form 8-k filed on March 15, 2016 for additional information. (2) Excludes impact of acquisition consid
Slide 8: Retail Segment
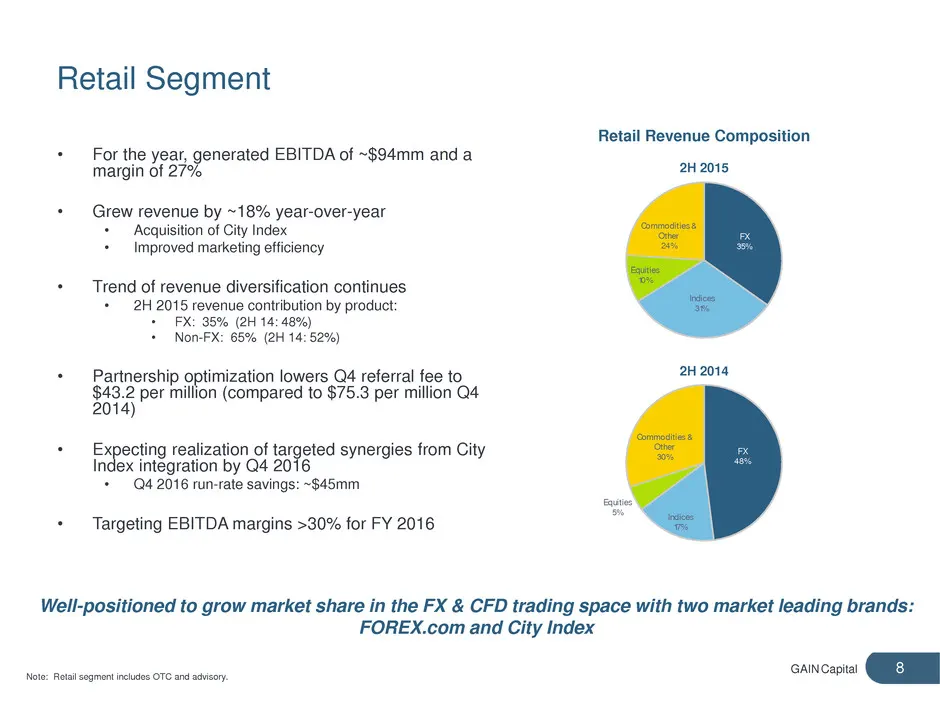
GAIN Capital 8 Retail Segment • For the year, generated EBITDA of ~$94mm and a margin of 27% • Grew revenue by ~18% year-over-year • Acquisition of City Index • Improved marketing efficiency • Trend of revenue diversification continues • 2H 2015 revenue contribution by product: • FX: 35% (2H 14: 48%
Slide 9: Institutional Segment
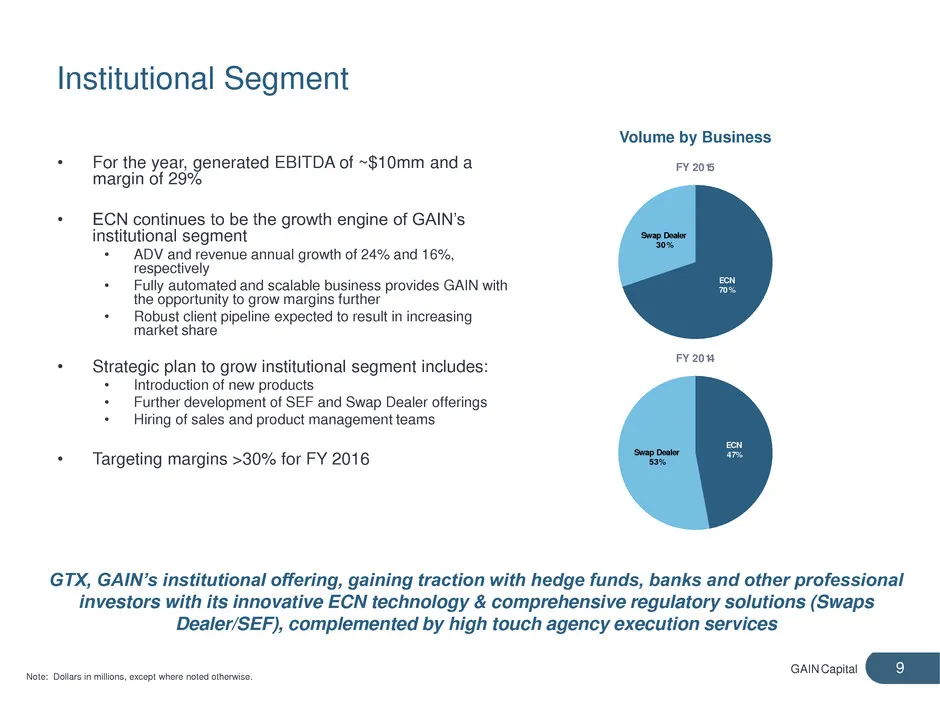
GAIN Capital 9 Institutional Segment • For the year, generated EBITDA of ~$10mm and a margin of 29% • ECN continues to be the growth engine of GAIN’s institutional segment • ADV and revenue annual growth of 24% and 16%, respectively • Fully automated and scalable business provides GAIN with the oppo
Slide 10: Futures Segment
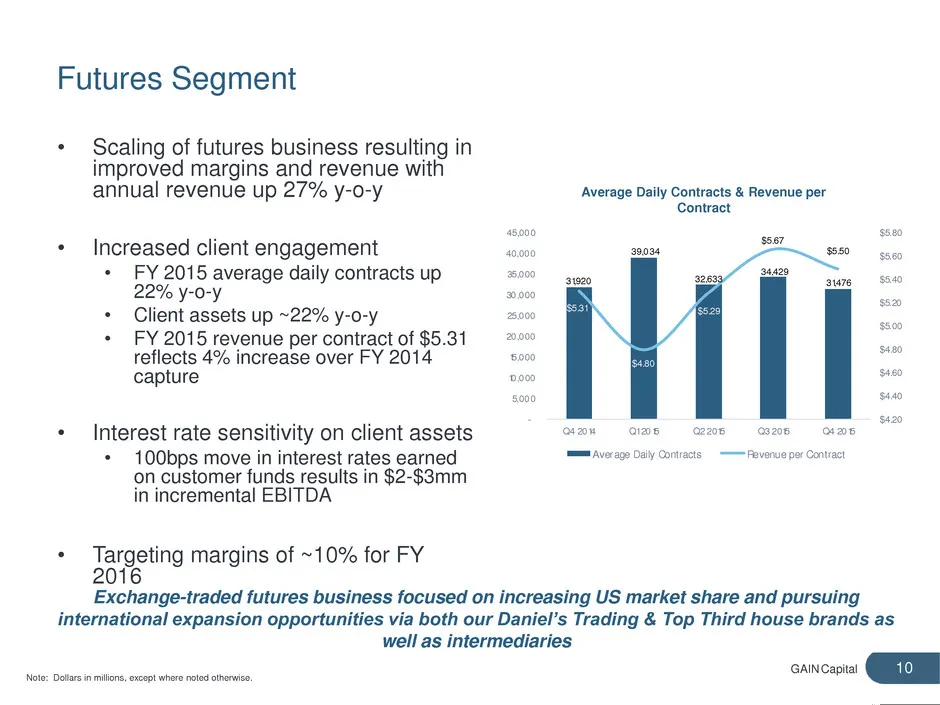
GAIN Capital 10 Futures Segment • Scaling of futures business resulting in improved margins and revenue with annual revenue up 27% y-o-y • Increased client engagement • FY 2015 average daily contracts up 22% y-o-y • Client assets up ~22% y-o-y • FY 2015 revenue per contract of $5.31 reflects 4% incr
Slide 11: Pro Forma Operating Expenses
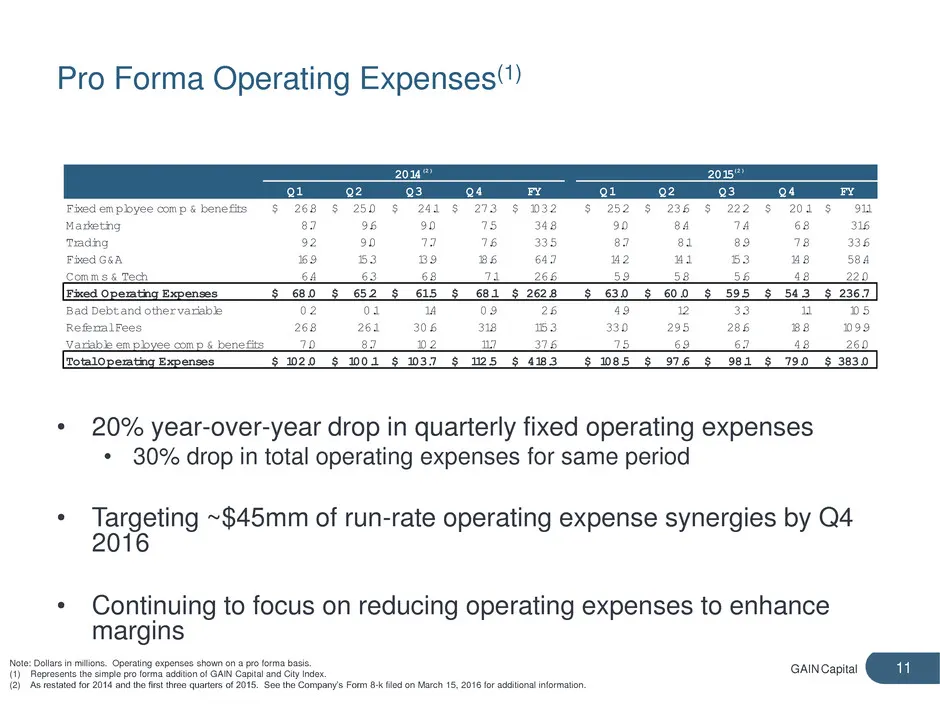
GAIN Capital 11 Pro Forma Operating Expenses(1) Note: Dollars in millions. Operating expenses shown on a pro forma basis. (1) Represents the simple pro forma addition of GAIN Capital and City Index. (2) As restated for 2014 and the first three quarters of 2015. See the Company’s Form 8-k filed on Ma
Slide 12: GAIN Returning Capital to Shareholders via Dividends and Buybacks
GAIN Capital 12 GAIN Returning Capital to Shareholders via Dividends and Buybacks • For the year, GAIN returned $14.6mm to shareholders via buybacks and dividends • Buybacks: $5.1mm • Dividends: $9.5mm • GAIN continued to repurchase shares in Q4 • Repurchased 388,095 shares at an average price of $7
Slide 13: February 2016 Operating Metrics
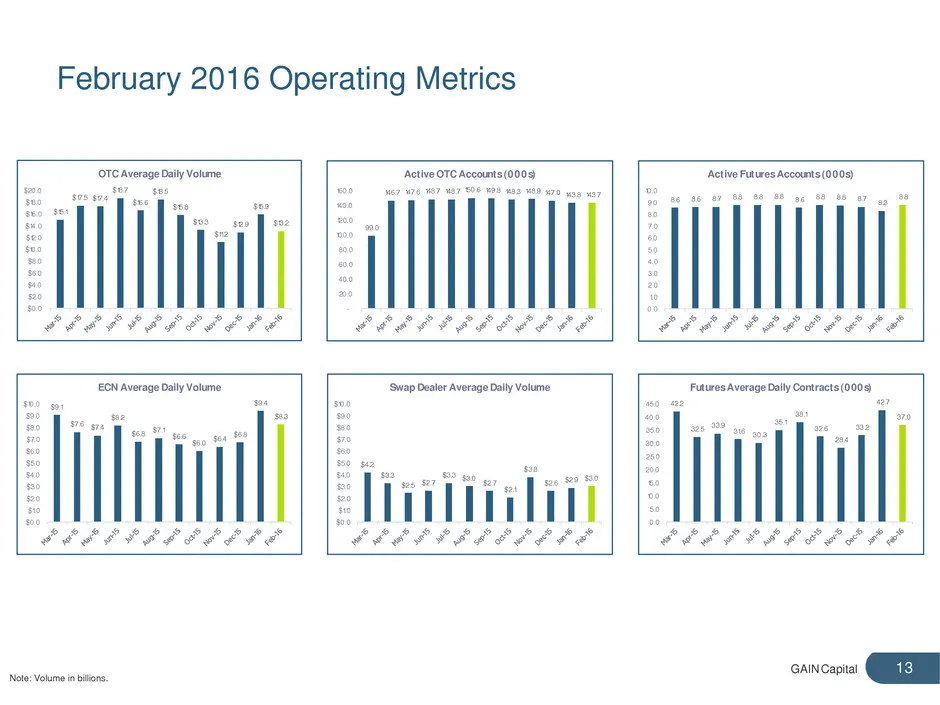
GAIN Capital 13 February 2016 Operating Metrics Note: Volume in billions. $15.1 $17.5 $17.4 $18.7 $16.6 $18.5 $15.8 $13.3 $11.2 $12.9 $15.9 $13.2 $0.0 $2.0 $4.0 $6.0 $8.0 $10.0 $12.0 $14.0 $16.0 $18.0 $20.0 OTC Average Daily Volume 99.0 146.7 147.6 148.7 148.7 150.6 149.8 148.3 148.9 147.0 143.8 143
Slide 14: Closing Remarks
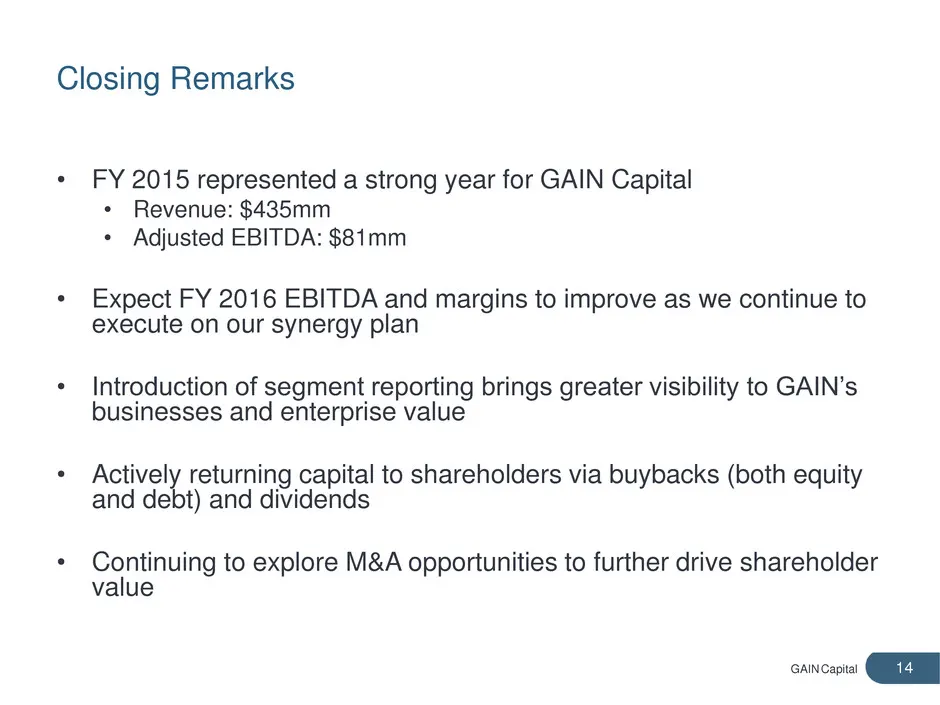
GAIN Capital 14 Closing Remarks • FY 2015 represented a strong year for GAIN Capital • Revenue: $435mm • Adjusted EBITDA: $81mm • Expect FY 2016 EBITDA and margins to improve as we continue to execute on our synergy plan • Introduction of segment reporting brings greater visibility to GAIN’s busines

Slide 15: Appendix
GAIN Capital Appendix 15
Slide 16: Consolidated Statement of Operations
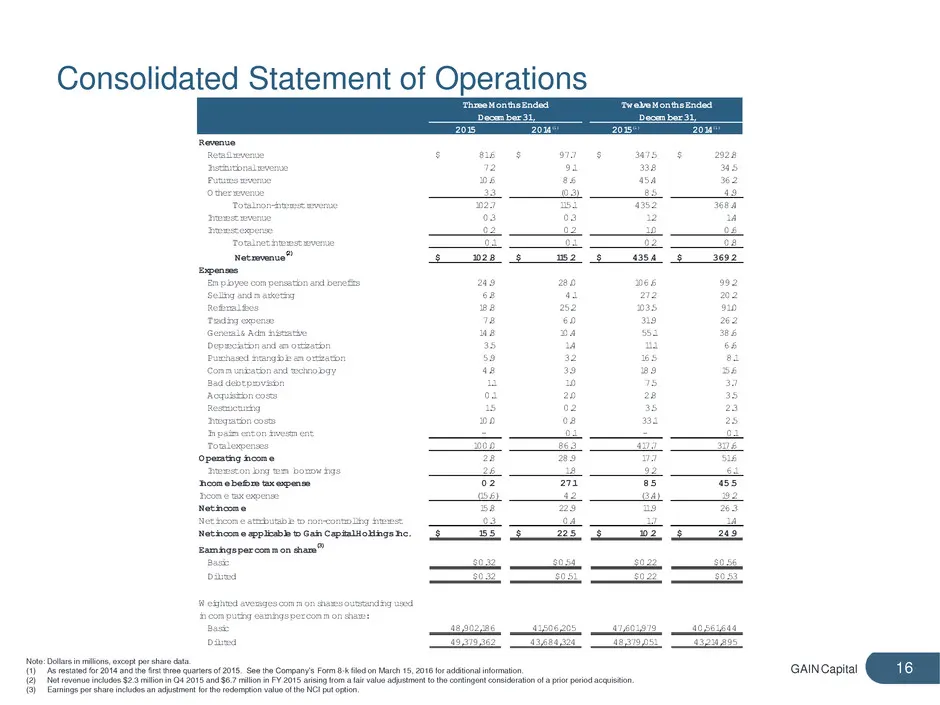
GAIN Capital 16 Consolidated Statement of Operations Note: Dollars in millions, except per share data. (1) As restated for 2014 and the first three quarters of 2015. See the Company’s Form 8-k filed on March 15, 2016 for additional information. (2) Net revenue includes $2.3 million in Q4 2015 and $6
Slide 17: Consolidated Balance Sheet
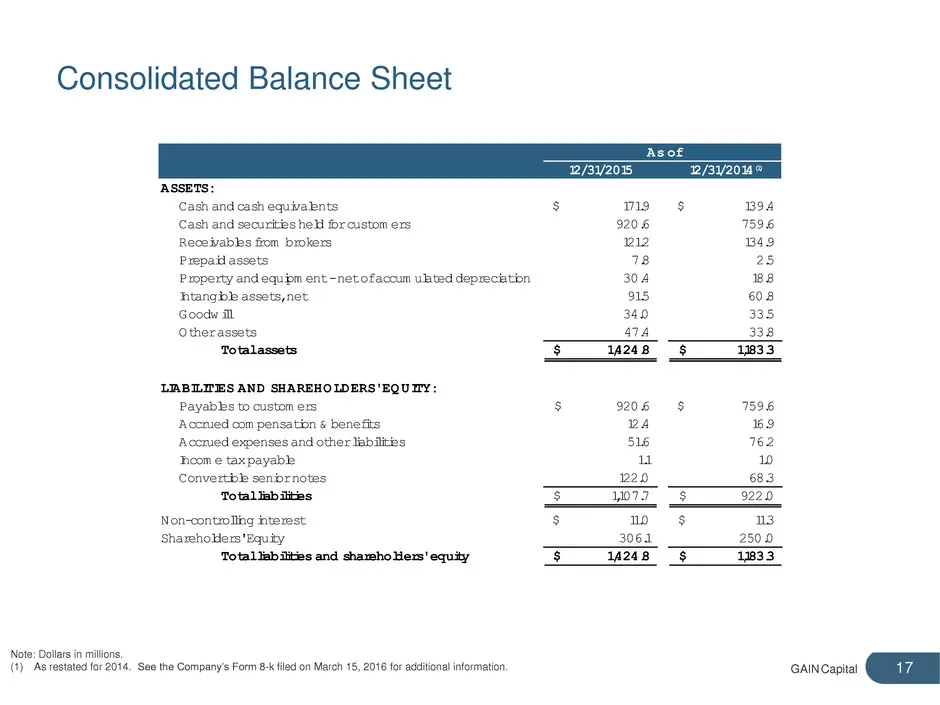
GAIN Capital 17 Consolidated Balance Sheet Note: Dollars in millions. (1) As restated for 2014. See the Company’s Form 8-k filed on March 15, 2016 for additional information. As of 12/31/2015 12/31/2014(1) ASSETS: Cash and cash equivalents 171.9$ 139.4$ Cash and securities held for custom ers 920.6
Slide 18: Cash Flow Statement
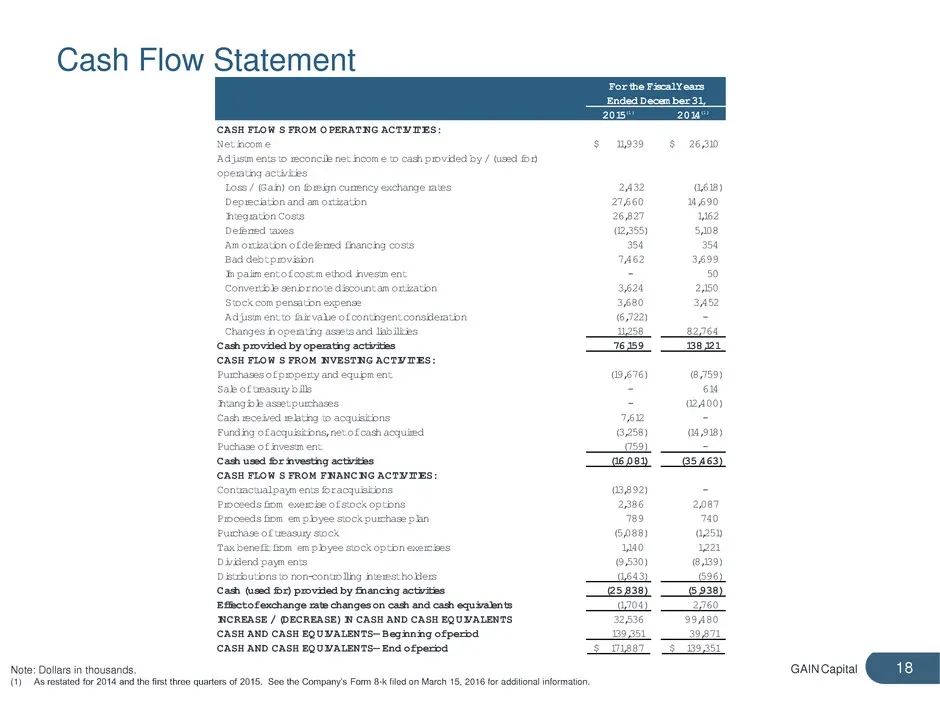
GAIN Capital 18 Cash Flow Statement Note: Dollars in thousands. (1) As restated for 2014 and the first three quarters of 2015. See the Company’s Form 8-k filed on March 15, 2016 for additional information. For the Fiscal Years Ended Decem ber 31, 2015(1 ) 2014(1 ) CASH FLOW S FROM OPERATING ACTIVITI
Slide 19: Current Liquidity
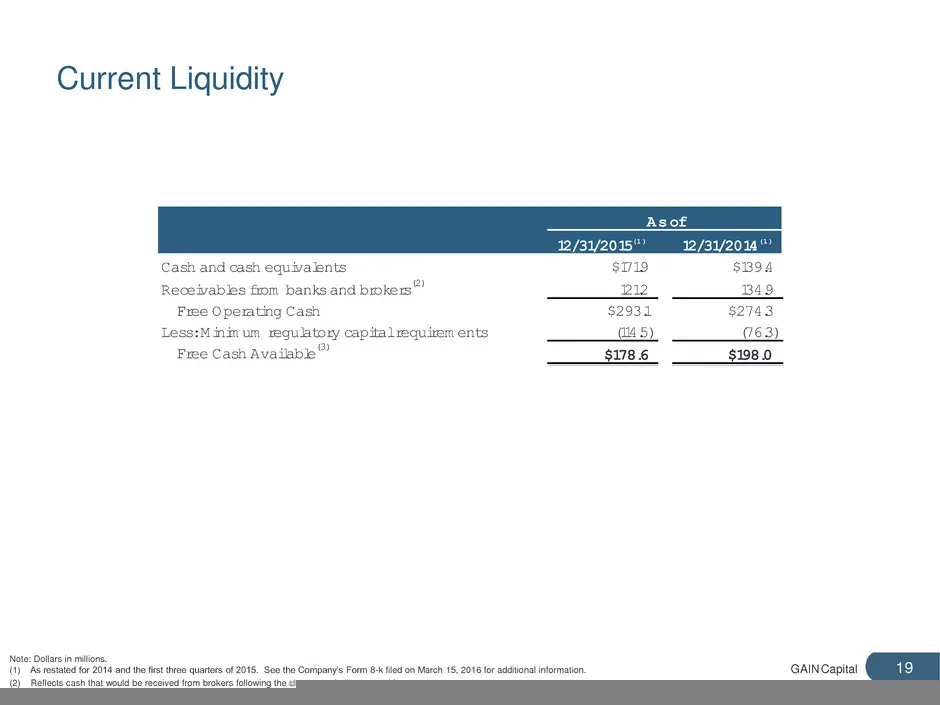
GAIN Capital 19 Current Liquidity Note: Dollars in millions. (1) As restated for 2014 and the first three quarters of 2015. See the Company’s Form 8-k filed on March 15, 2016 for additional information. (2) Reflects cash that would be received from brokers following the close-out of all open positio
Slide 20: Adjusted EBITDA & Margin Reconciliation
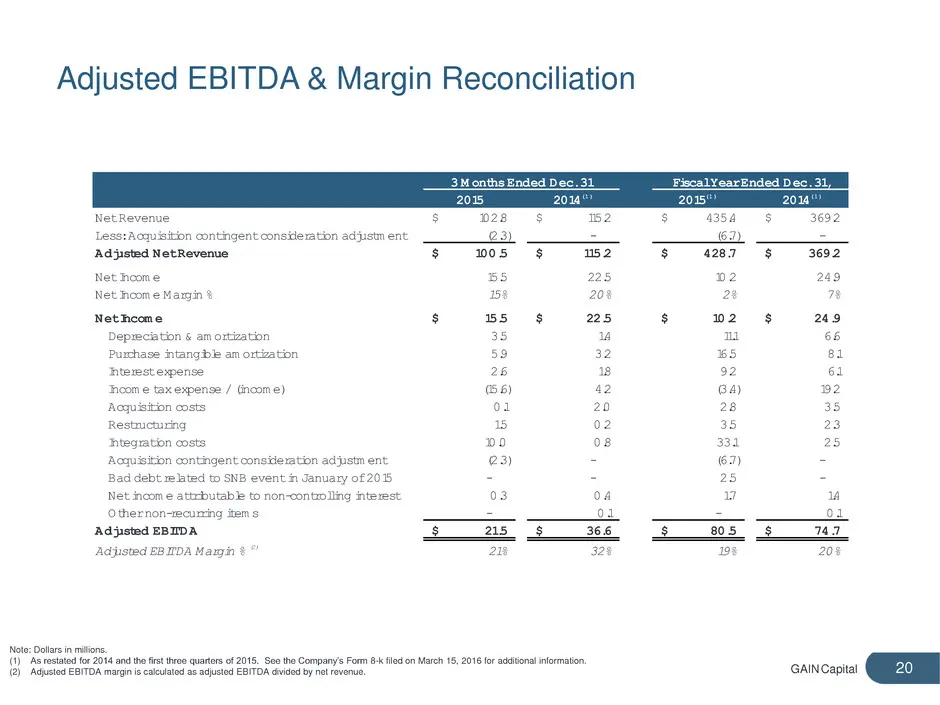
GAIN Capital 20 Adjusted EBITDA & Margin Reconciliation Note: Dollars in millions. (1) As restated for 2014 and the first three quarters of 2015. See the Company’s Form 8-k filed on March 15, 2016 for additional information. (2) Adjusted EBITDA margin is calculated as adjusted EBITDA divided by net
Slide 21: Adjusted Net Income and EPS Reconciliation
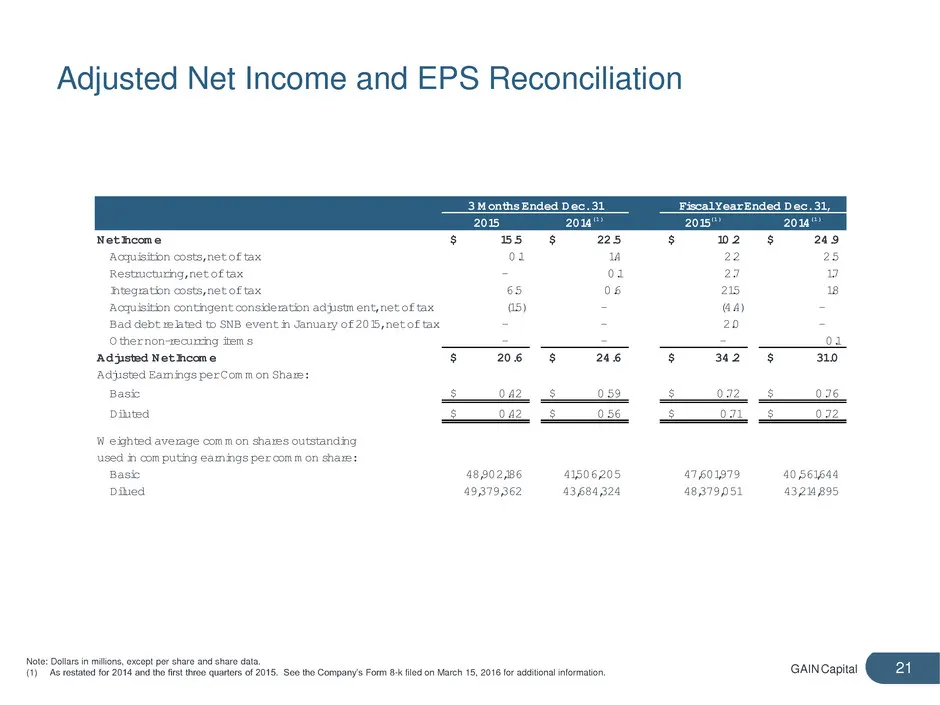
GAIN Capital 21 Adjusted Net Income and EPS Reconciliation Note: Dollars in millions, except per share and share data. (1) As restated for 2014 and the first three quarters of 2015. See the Company’s Form 8-k filed on March 15, 2016 for additional information. 3 M onths Ended Dec. 31 Fiscal Year End
Slide 22: Free Cash Flow per Share
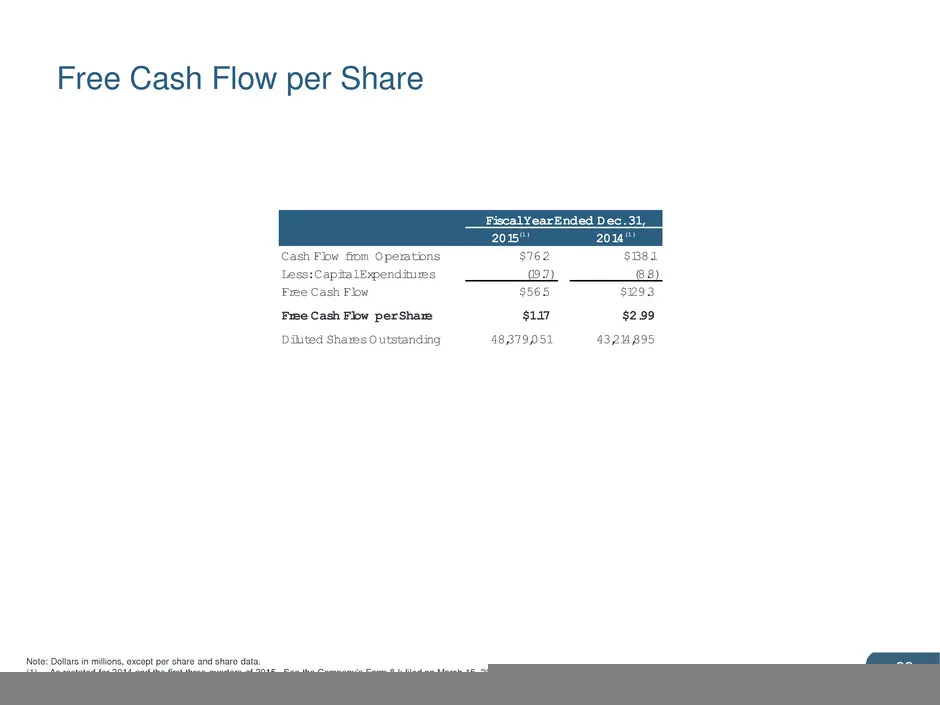
GAIN Capital 22 Free Cash Flow per Share Note: Dollars in millions, except per share and share data. (1) As restated for 2014 and the first three quarters of 2015. See the Company’s Form 8-k filed on March 15, 2016 for additional information. Fiscal Year Ended Dec. 31, 2015 (1 ) 2014 (1 ) Cash Flow
Slide 23: Q4 and FY 2015 Key Financial Results
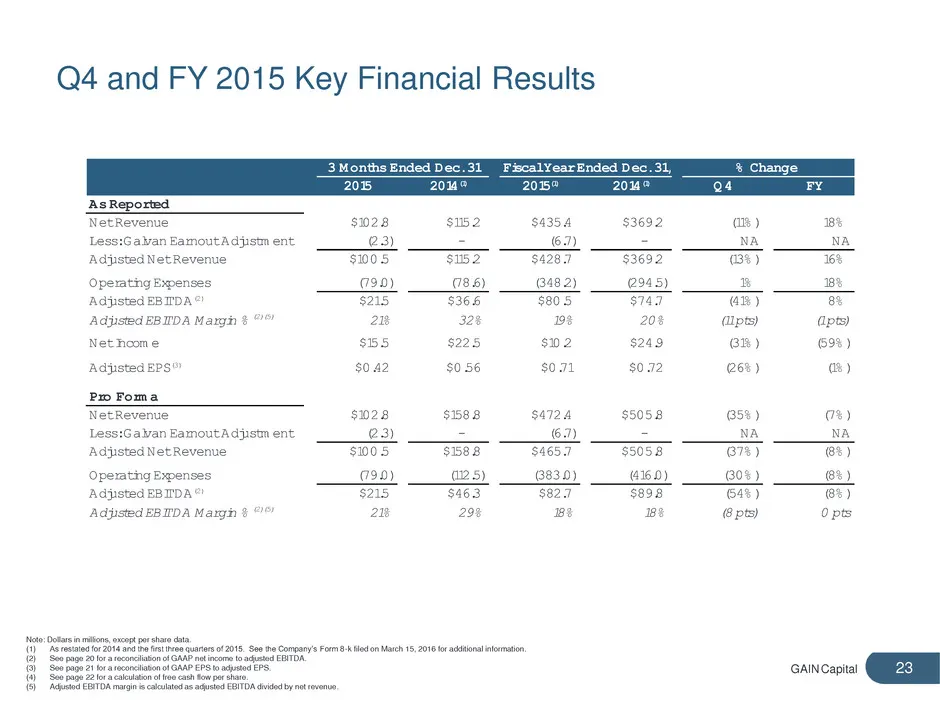
GAIN Capital 23 Q4 and FY 2015 Key Financial Results Note: Dollars in millions, except per share data. (1) As restated for 2014 and the first three quarters of 2015. See the Company’s Form 8-k filed on March 15, 2016 for additional information. (2) See page 20 for a reconciliation of GAAP net income
Slide 24: Pro Forma Reconciliation – 2015
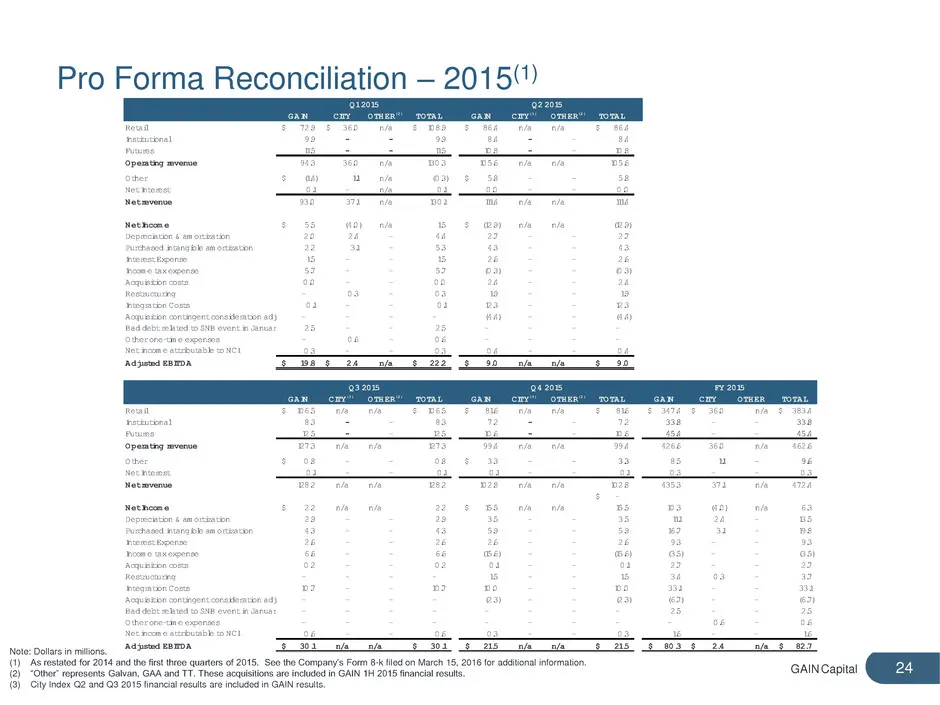
GAIN Capital 24 Pro Forma Reconciliation – 2015(1) Note: Dollars in millions. (1) As restated for 2014 and the first three quarters of 2015. See the Company’s Form 8-k filed on March 15, 2016 for additional information. (2) “Other” represents Galvan, GAA and TT. These acquisitions are included in GA
Slide 25: Pro Forma Reconciliation – 2014
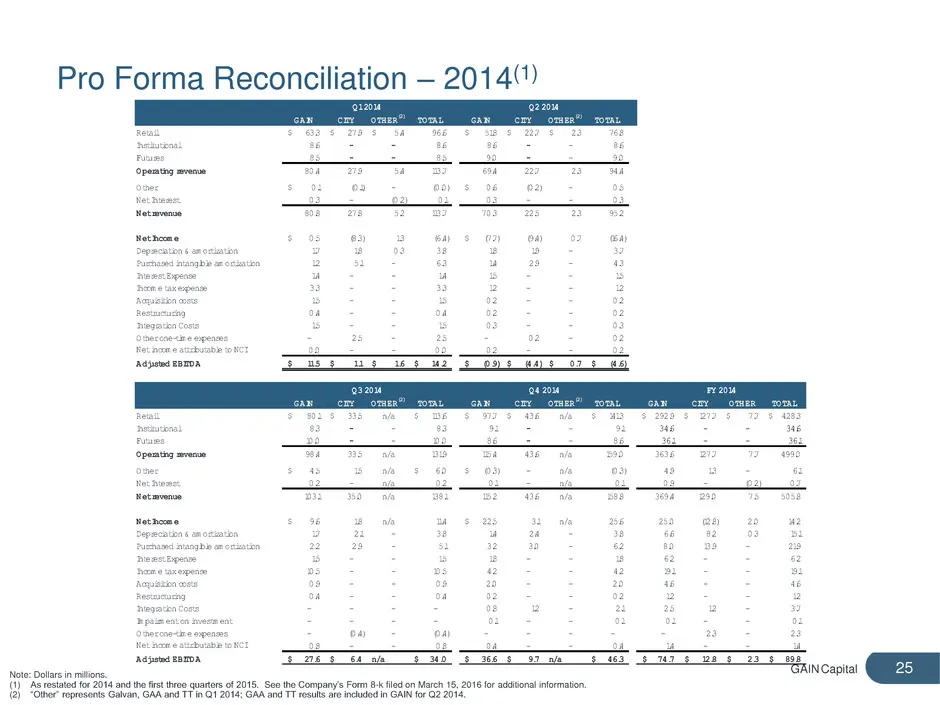
GAIN Capital 25 Pro Forma Reconciliation – 2014(1) Note: Dollars in millions. (1) As restated for 2014 and the first three quarters of 2015. See the Company’s Form 8-k filed on March 15, 2016 for additional information. (2) “Other” represents Galvan, GAA and TT in Q1 2014; GAA and TT results are inc
Slide 26: Quarterly Operating Metrics
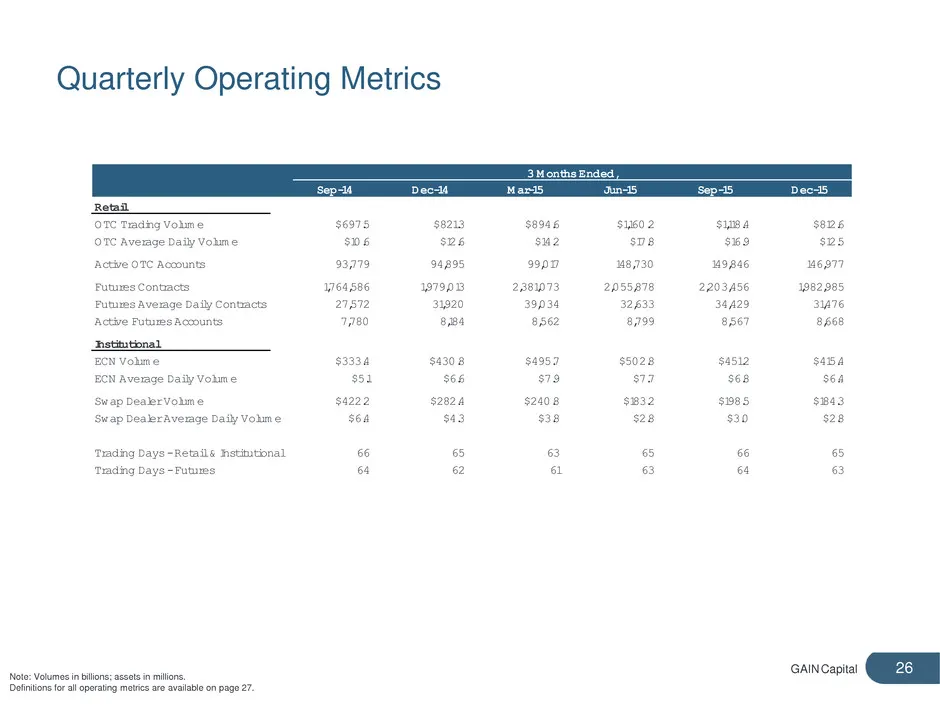
GAIN Capital 26 Quarterly Operating Metrics Note: Volumes in billions; assets in millions. Definitions for all operating metrics are available on page 27. 3 M onths Ended, Sep-14 Dec-14 M ar-15 Jun-15 Sep-15 Dec-15 Retail OTC Trading Volum e $697.5 $821.3 $894.6 $1,160.2 $1,118.4 $812.6 OTC Average
Slide 27: Definition of Metrics
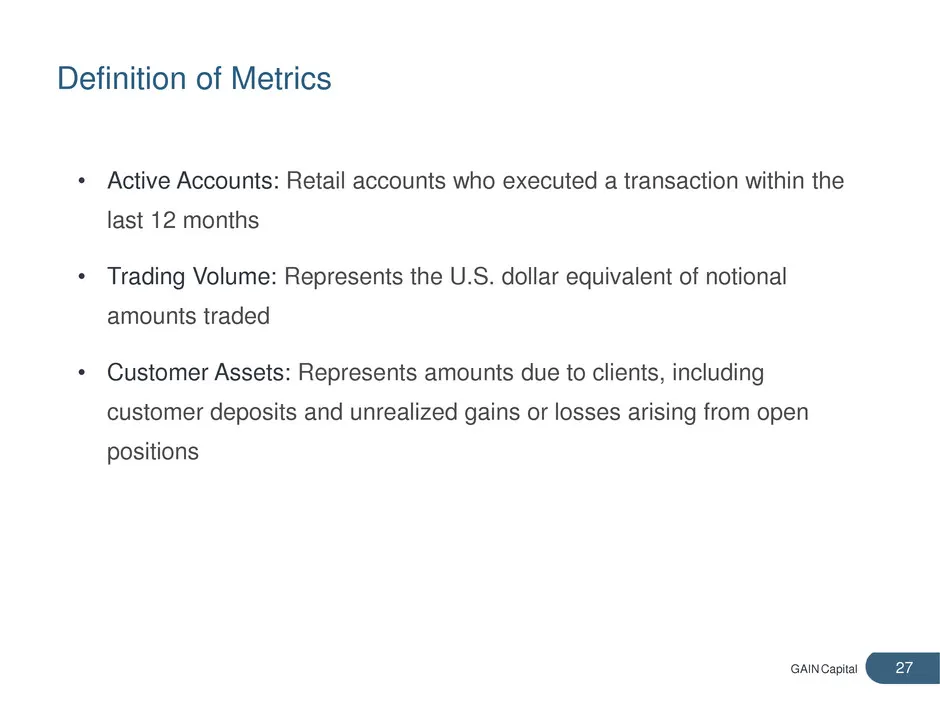
GAIN Capital 27 Definition of Metrics • Active Accounts: Retail accounts who executed a transaction within the last 12 months • Trading Volume: Represents the U.S. dollar equivalent of notional amounts traded • Customer Assets: Represents amounts due to clients, including customer deposits and unrea
Slide 28: Financial and Operating Results Fourth Quarter and Full Year 2015
Financial and Operating Results Fourth Quarter and Full Year 2015 March 2016
Source: SEC EDGAR · 8-K filed Mar 15, 2016
More decks from GAIN Capital Holdings Inc
 Q2 2020 Earnings Presentation24 slides · Jul 23, 2020
 Merger or Acquisition (May 2020)10 slides · May 15, 2020
 Q1 2020 Earnings Presentation25 slides · Apr 23, 2020
 FY2019 Earnings Presentation35 slides · Feb 27, 2020
 Q3 2019 Earnings Presentation32 slides · Oct 25, 2019
 Q2 2019 Earnings Presentation33 slides · Jul 25, 2019