GAIN Capital — Q1 2013 Earnings Presentation
25 slides from GAIN Capital's earnings presentation, May 7, 2013
Slide 1: 1st Quarter 2013 Financial and Operating Results
Exhibit 99.2 st 1 Quarter 2013 Financial and Operating Results May 7, 2013
Slide 2: Special Note Regarding Forward-Looking Information
Special Note Regarding Forward-Looking Information In addition to historical information, this presentation contains "forward-looking" statements that reflect management's expectations for the future. The forward-looking statements contained in this earnings presentation include, without limitation,
Slide 3: Overview
Overview Glenn Stevens, CEO
Slide 4: Highlights
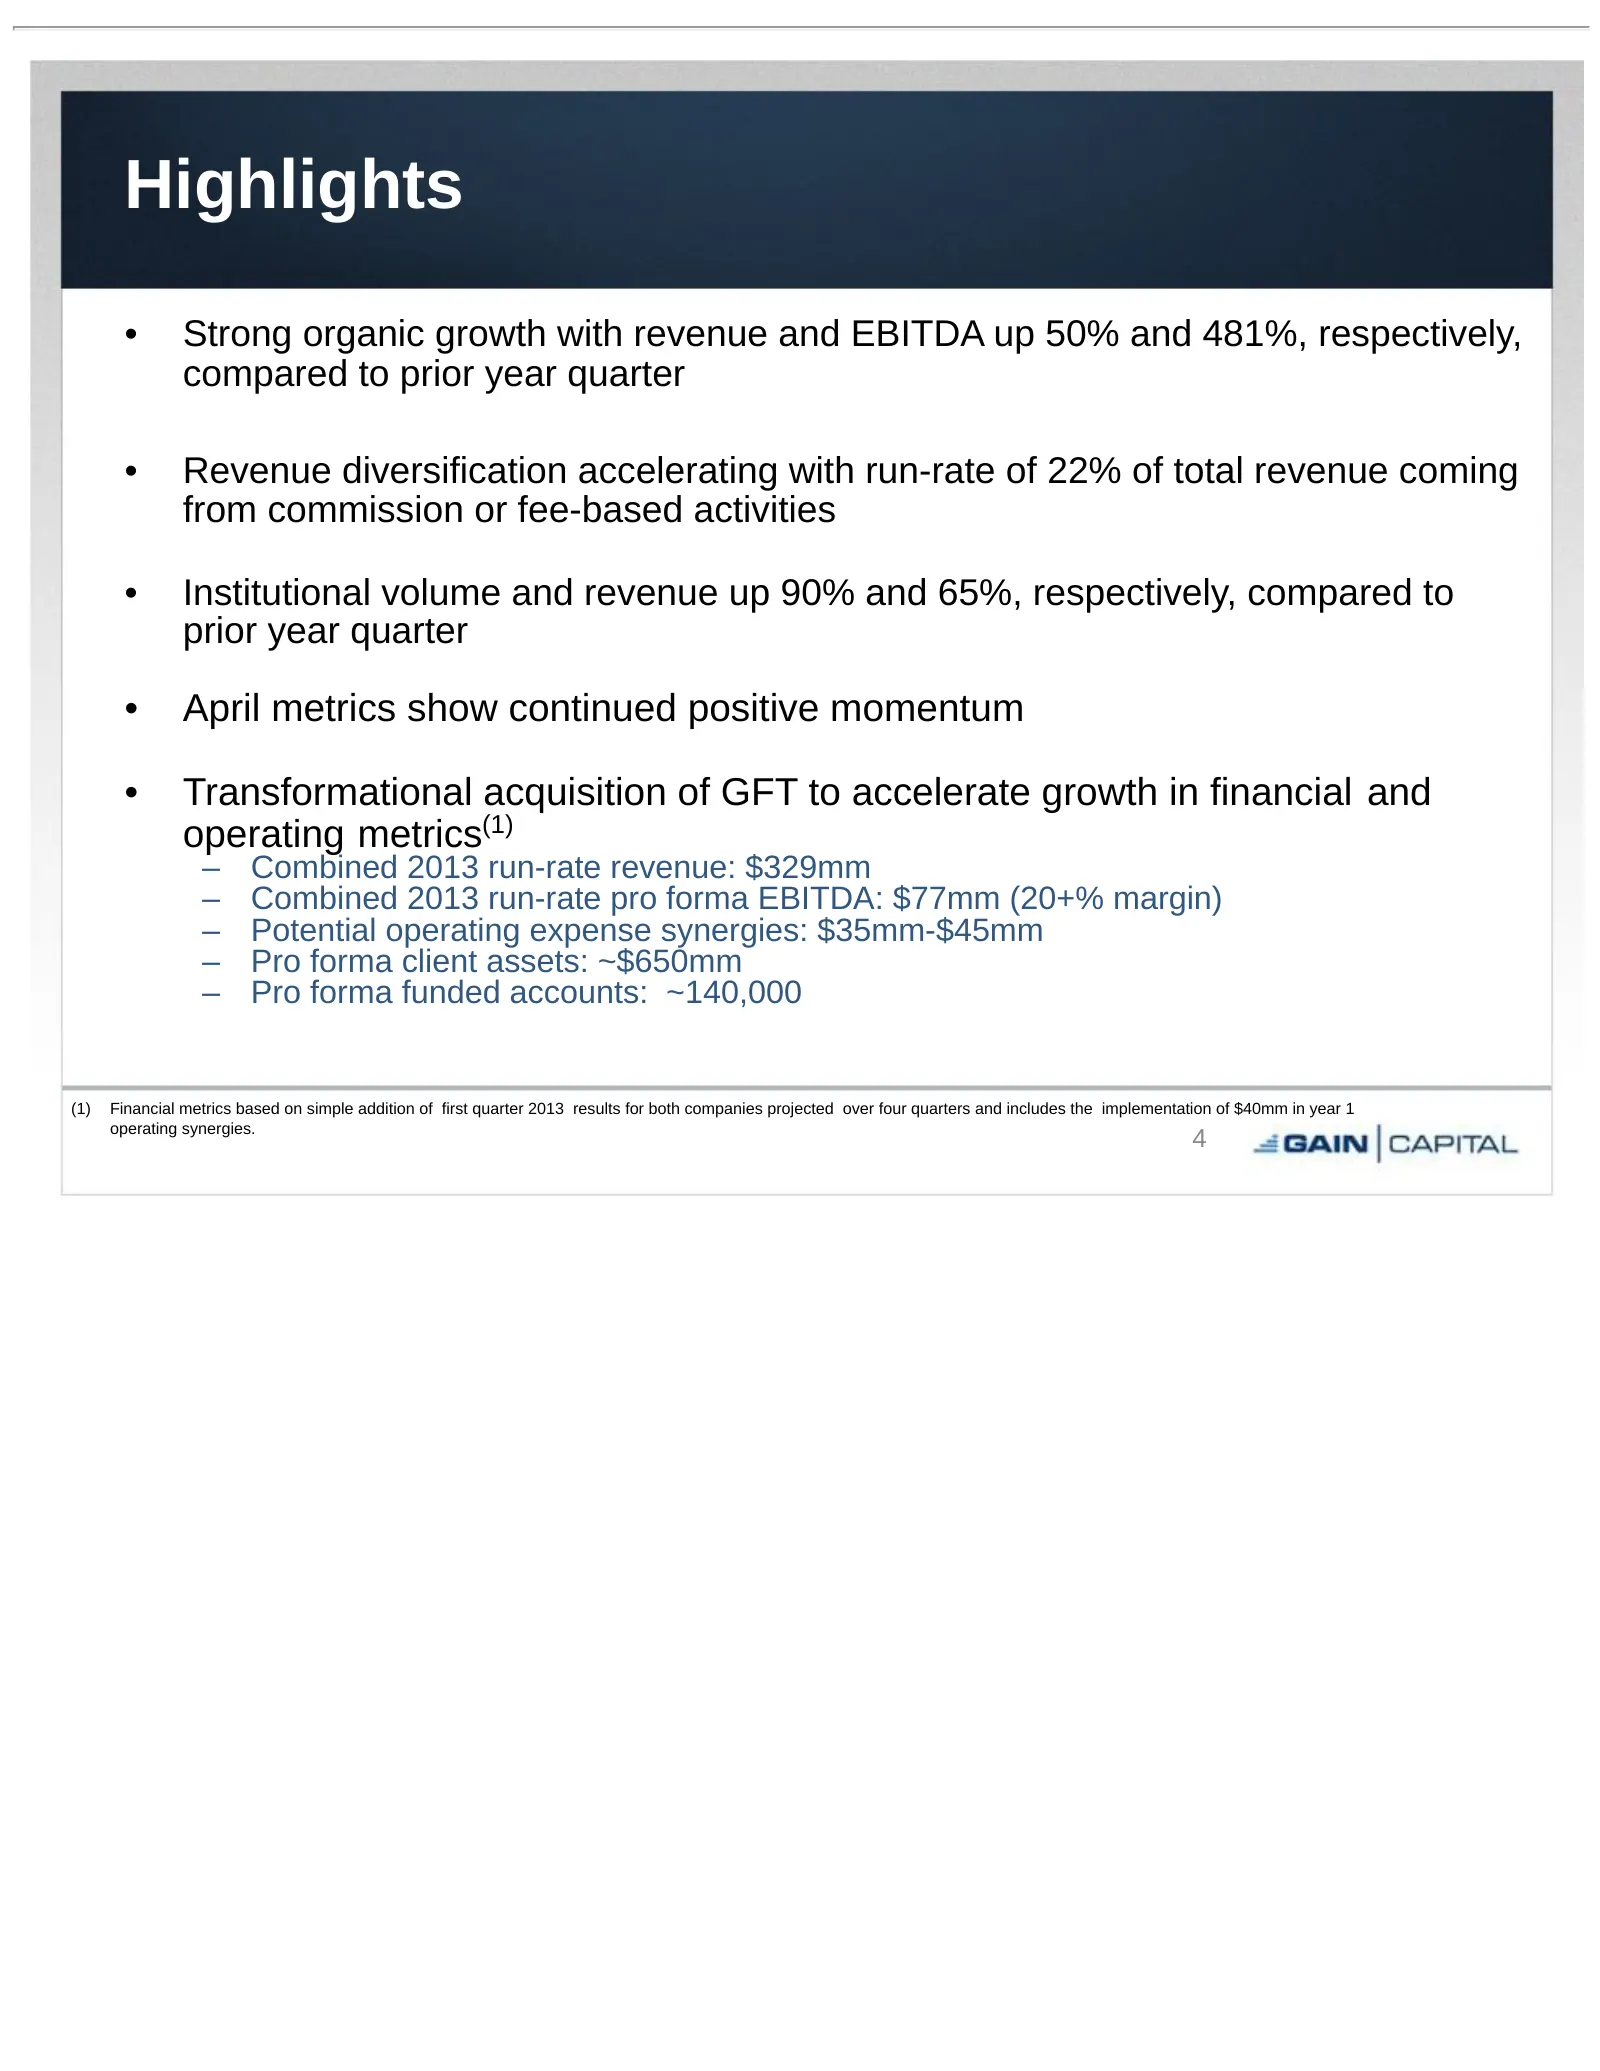
Highlights • Strong organic growth with revenue and EBITDA up 50% and 481%, respectively, compared to prior year quarter • Revenue diversification accelerating with run-rate of 22% of total revenue coming from commission or fee-based activities • Institutional volume and revenue up 90% and 65%, resp
Slide 5: 1st Quarter 2013 Results Overview
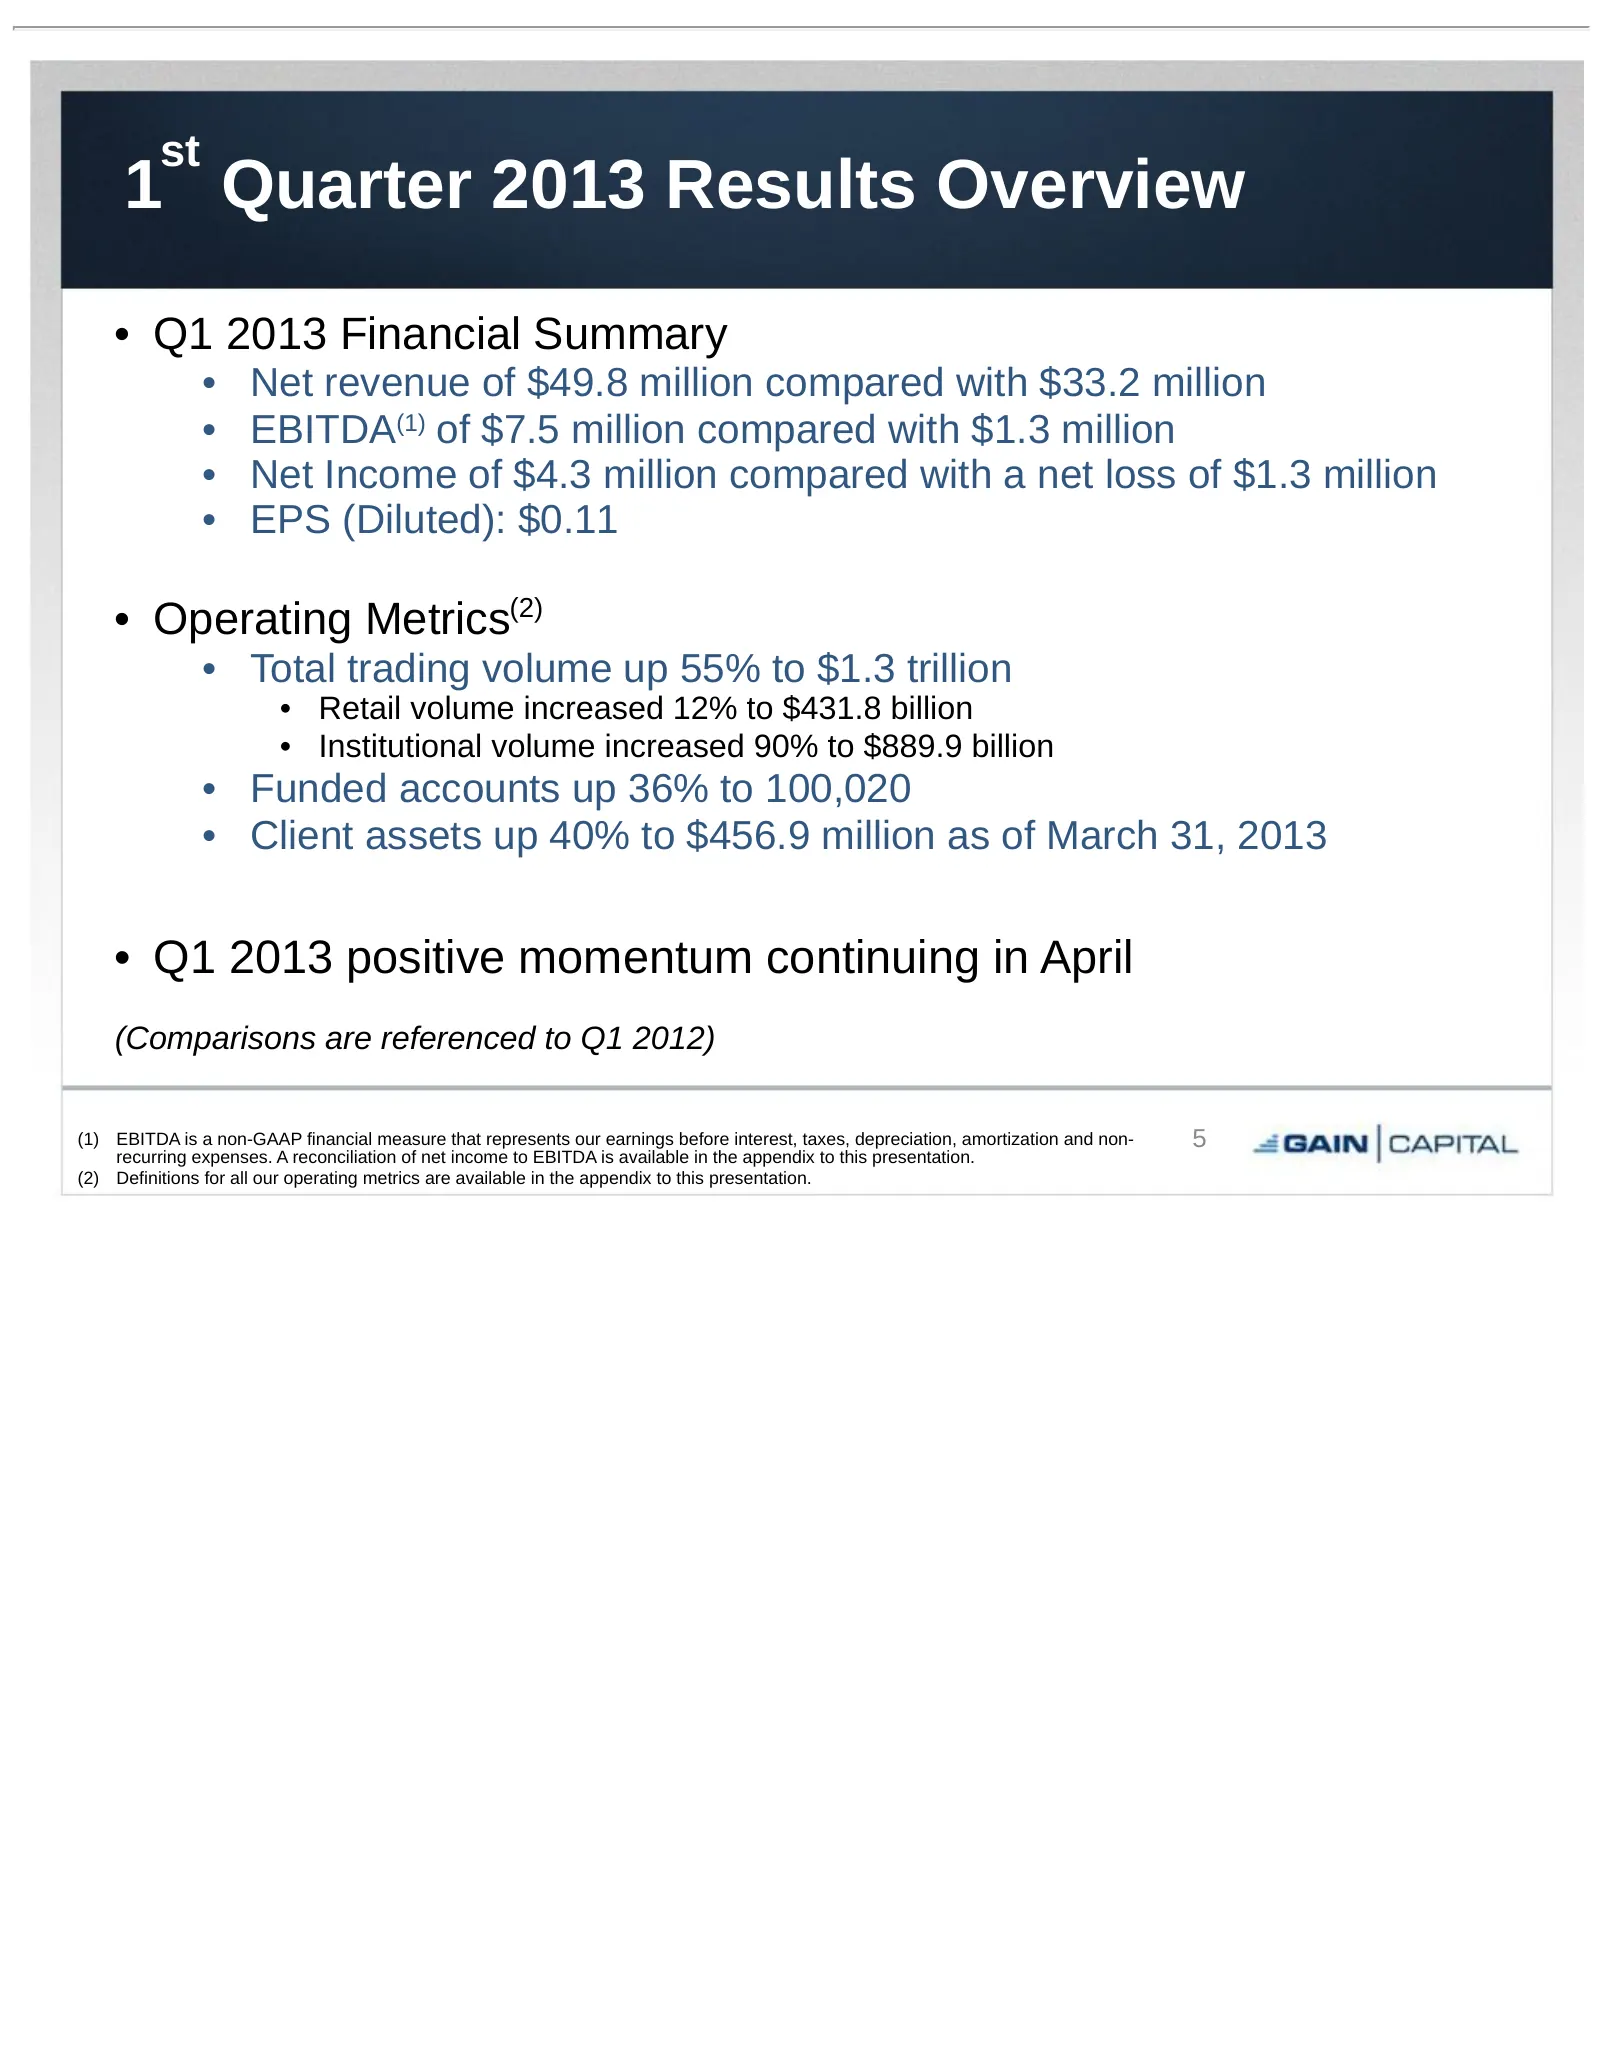
st 1 Quarter 2013 Results Overview • Q1 2013 Financial Summary • Net revenue of $49.8 million compared with $33.2 million • EBITDA(1) of $7.5 million compared with $1.3 million • Net Income of $4.3 million compared with a net loss of $1.3 million • EPS (Diluted): $0.11 • Operating Metrics(2) • Total
Slide 6: Q1 2013 Market Conditions
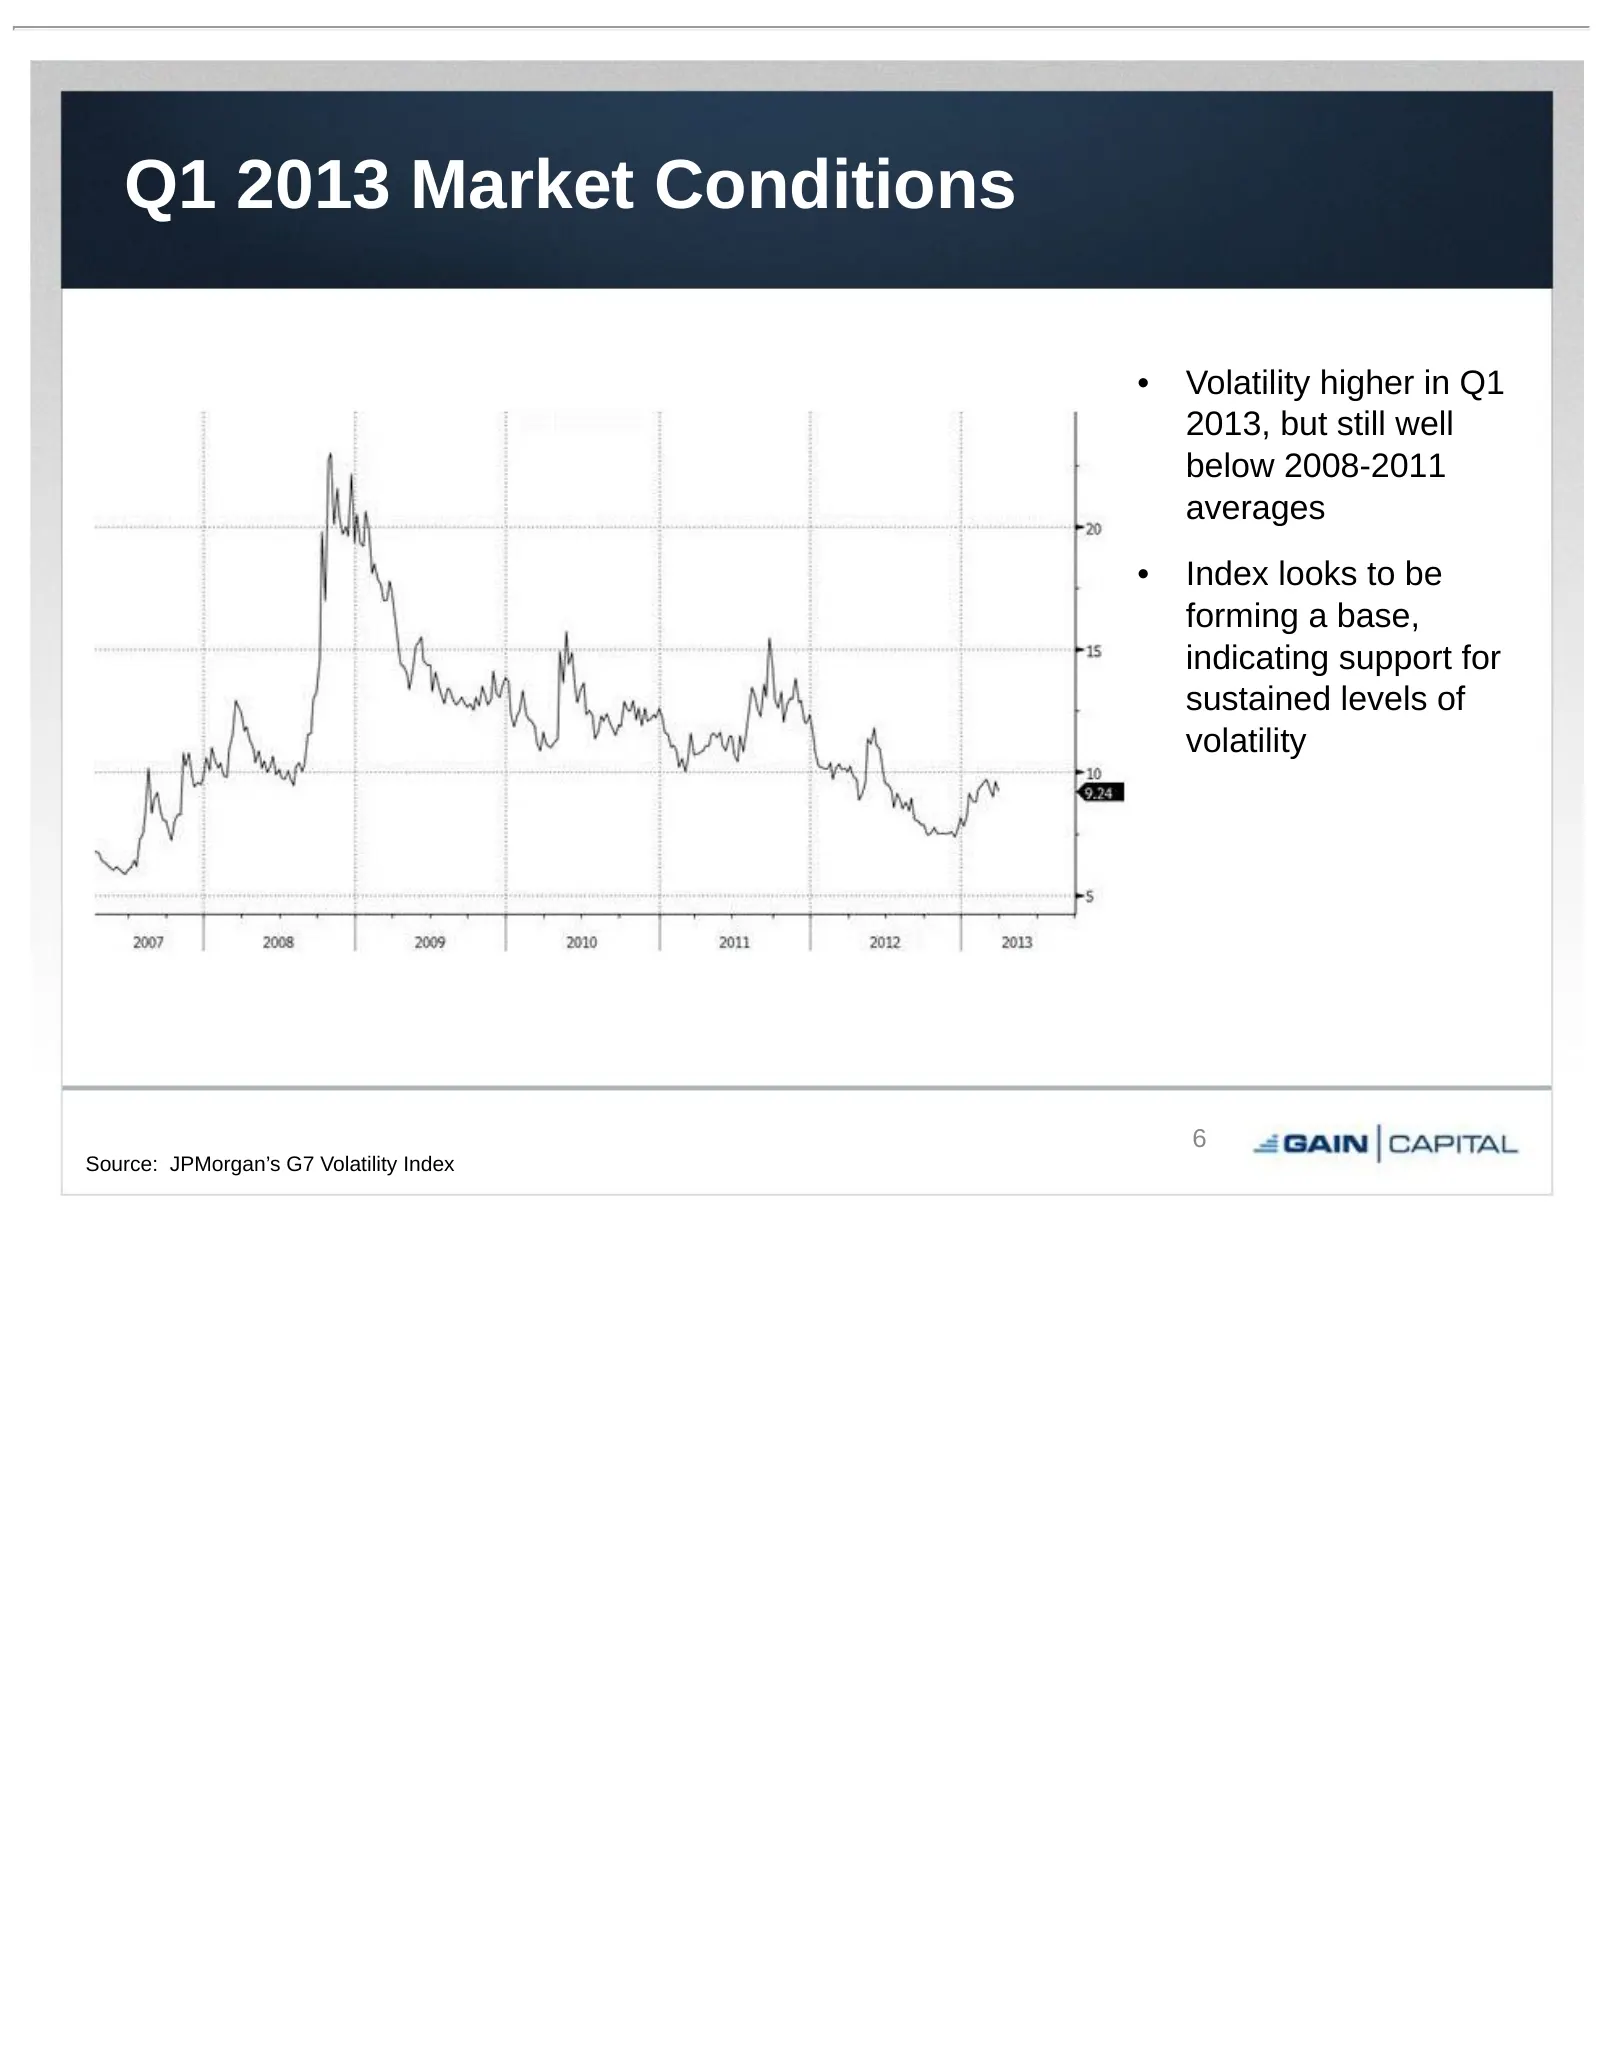
Q1 2013 Market Conditions • Volatility higher in Q1 2013, but still well below 2008-2011 averages • Index looks to be forming a base, indicating support for sustained levels of volatility 6 Source: JPMorgan’s G7 Volatility Index
Slide 7: Retail OTC
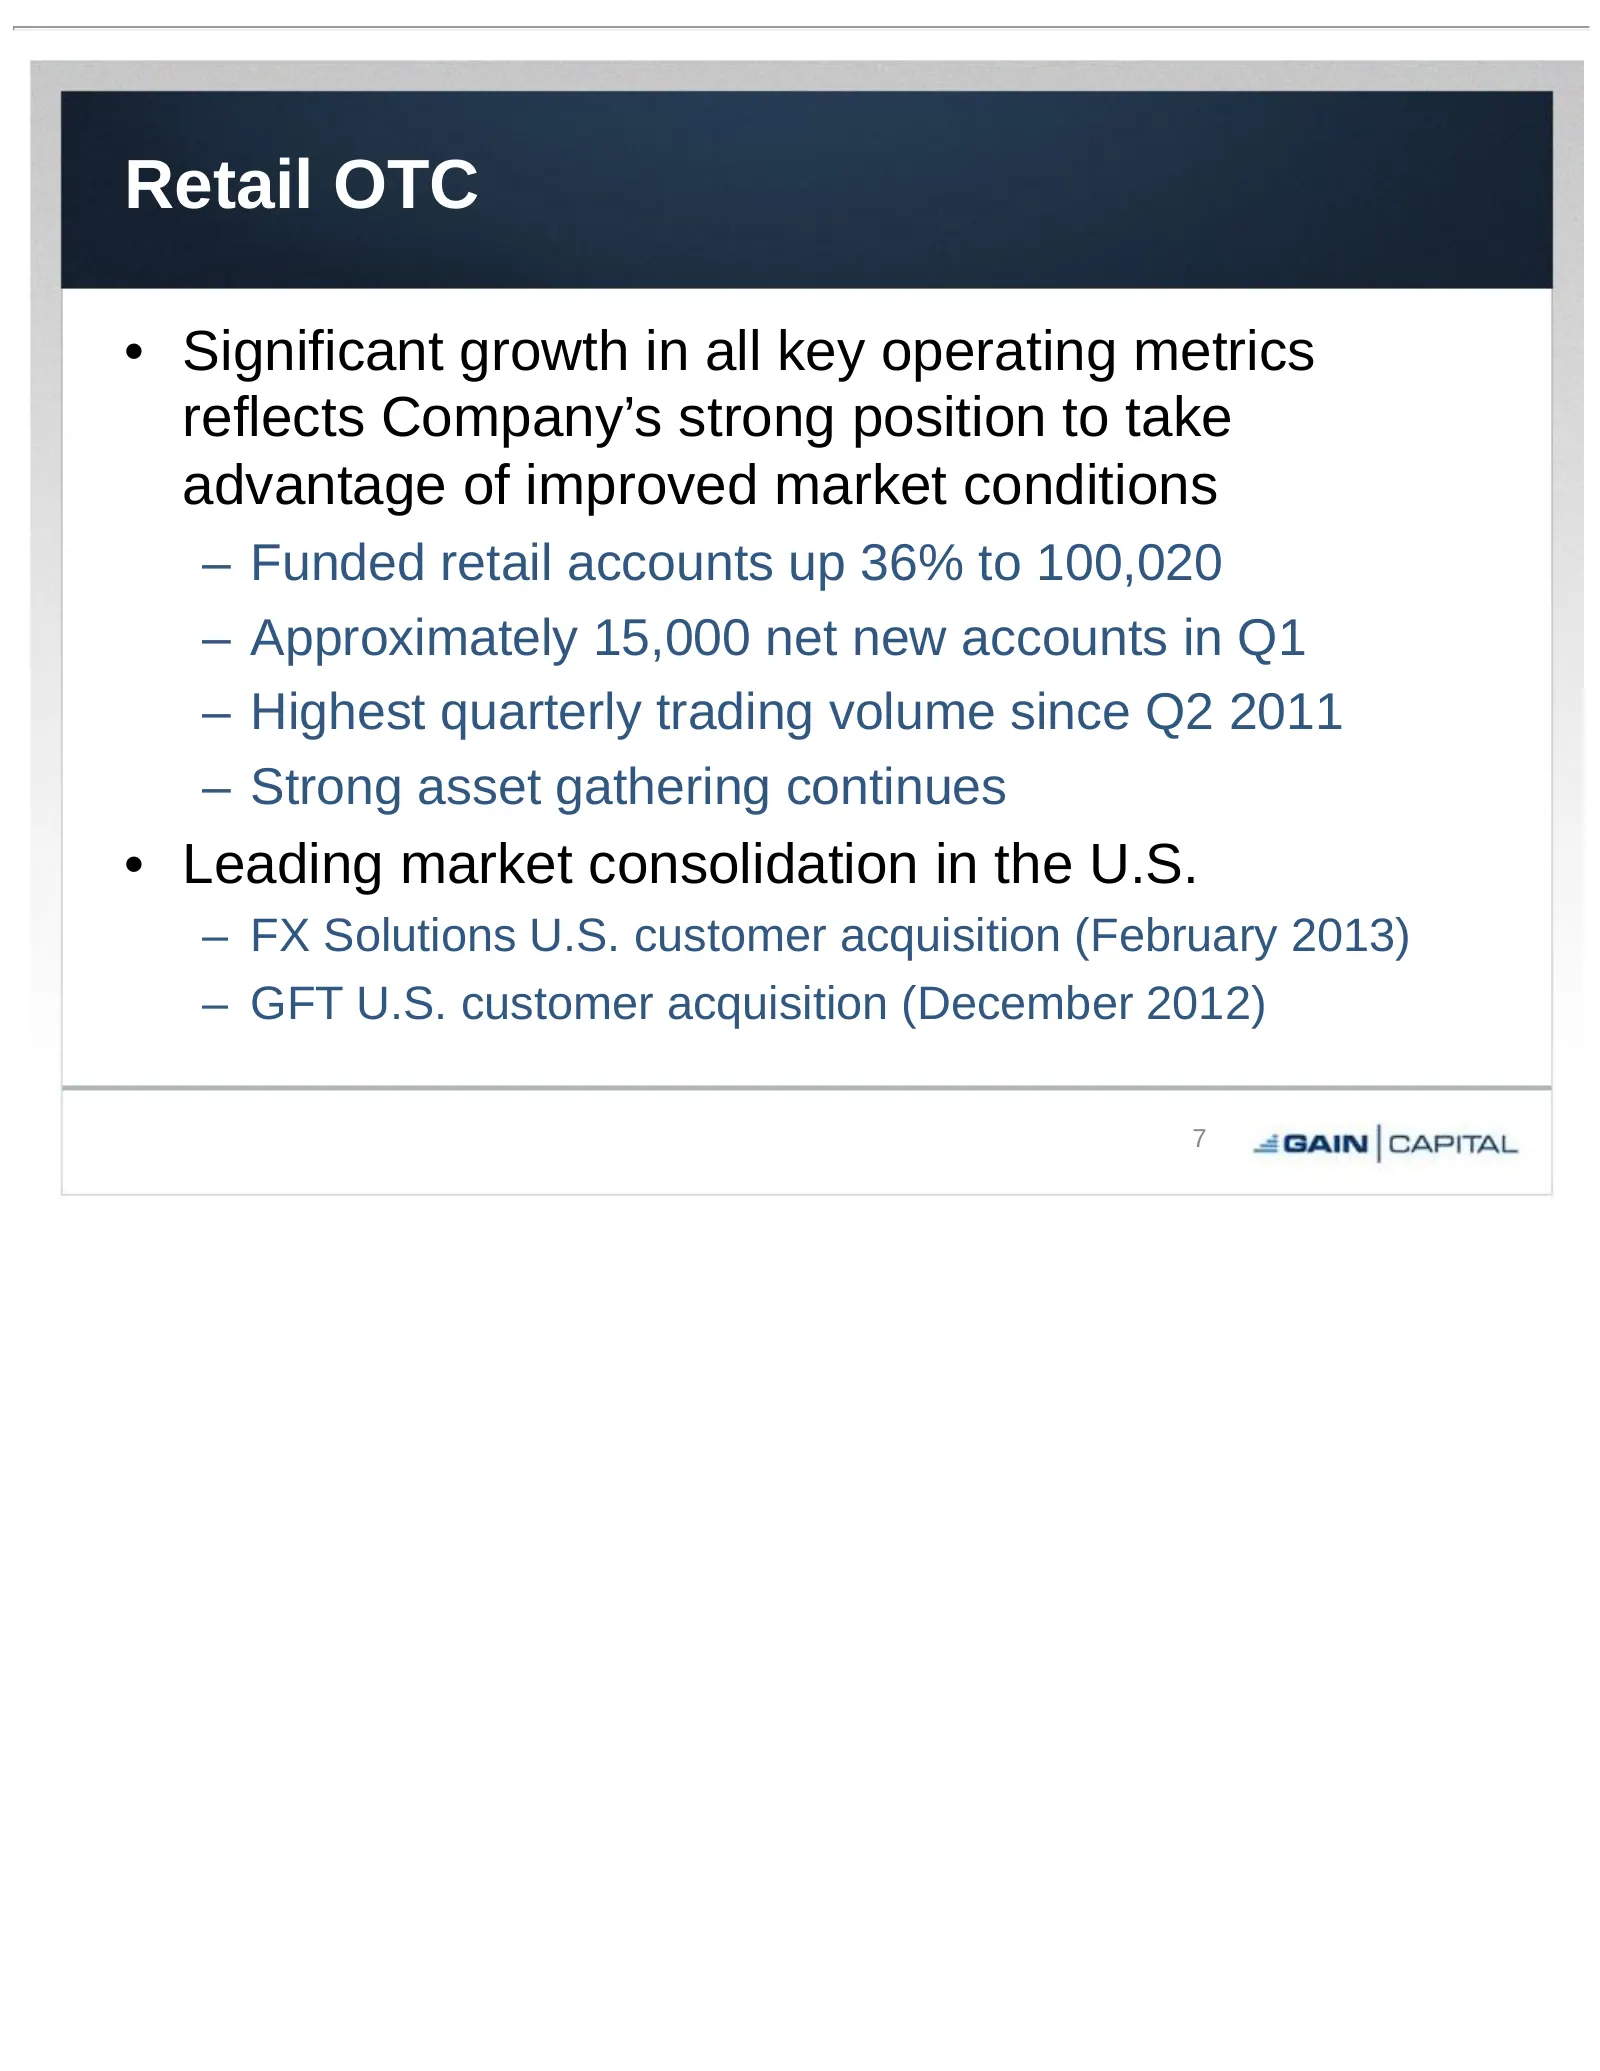
Retail OTC • Significant growth in all key operating metrics reflects Company’s strong position to take advantage of improved market conditions – Funded retail accounts up 36% to 100,020 – Approximately 15,000 net new accounts in Q1 – Highest quarterly trading volume since Q2 2011 – Strong asset gat
Slide 8: Commission-Based Business
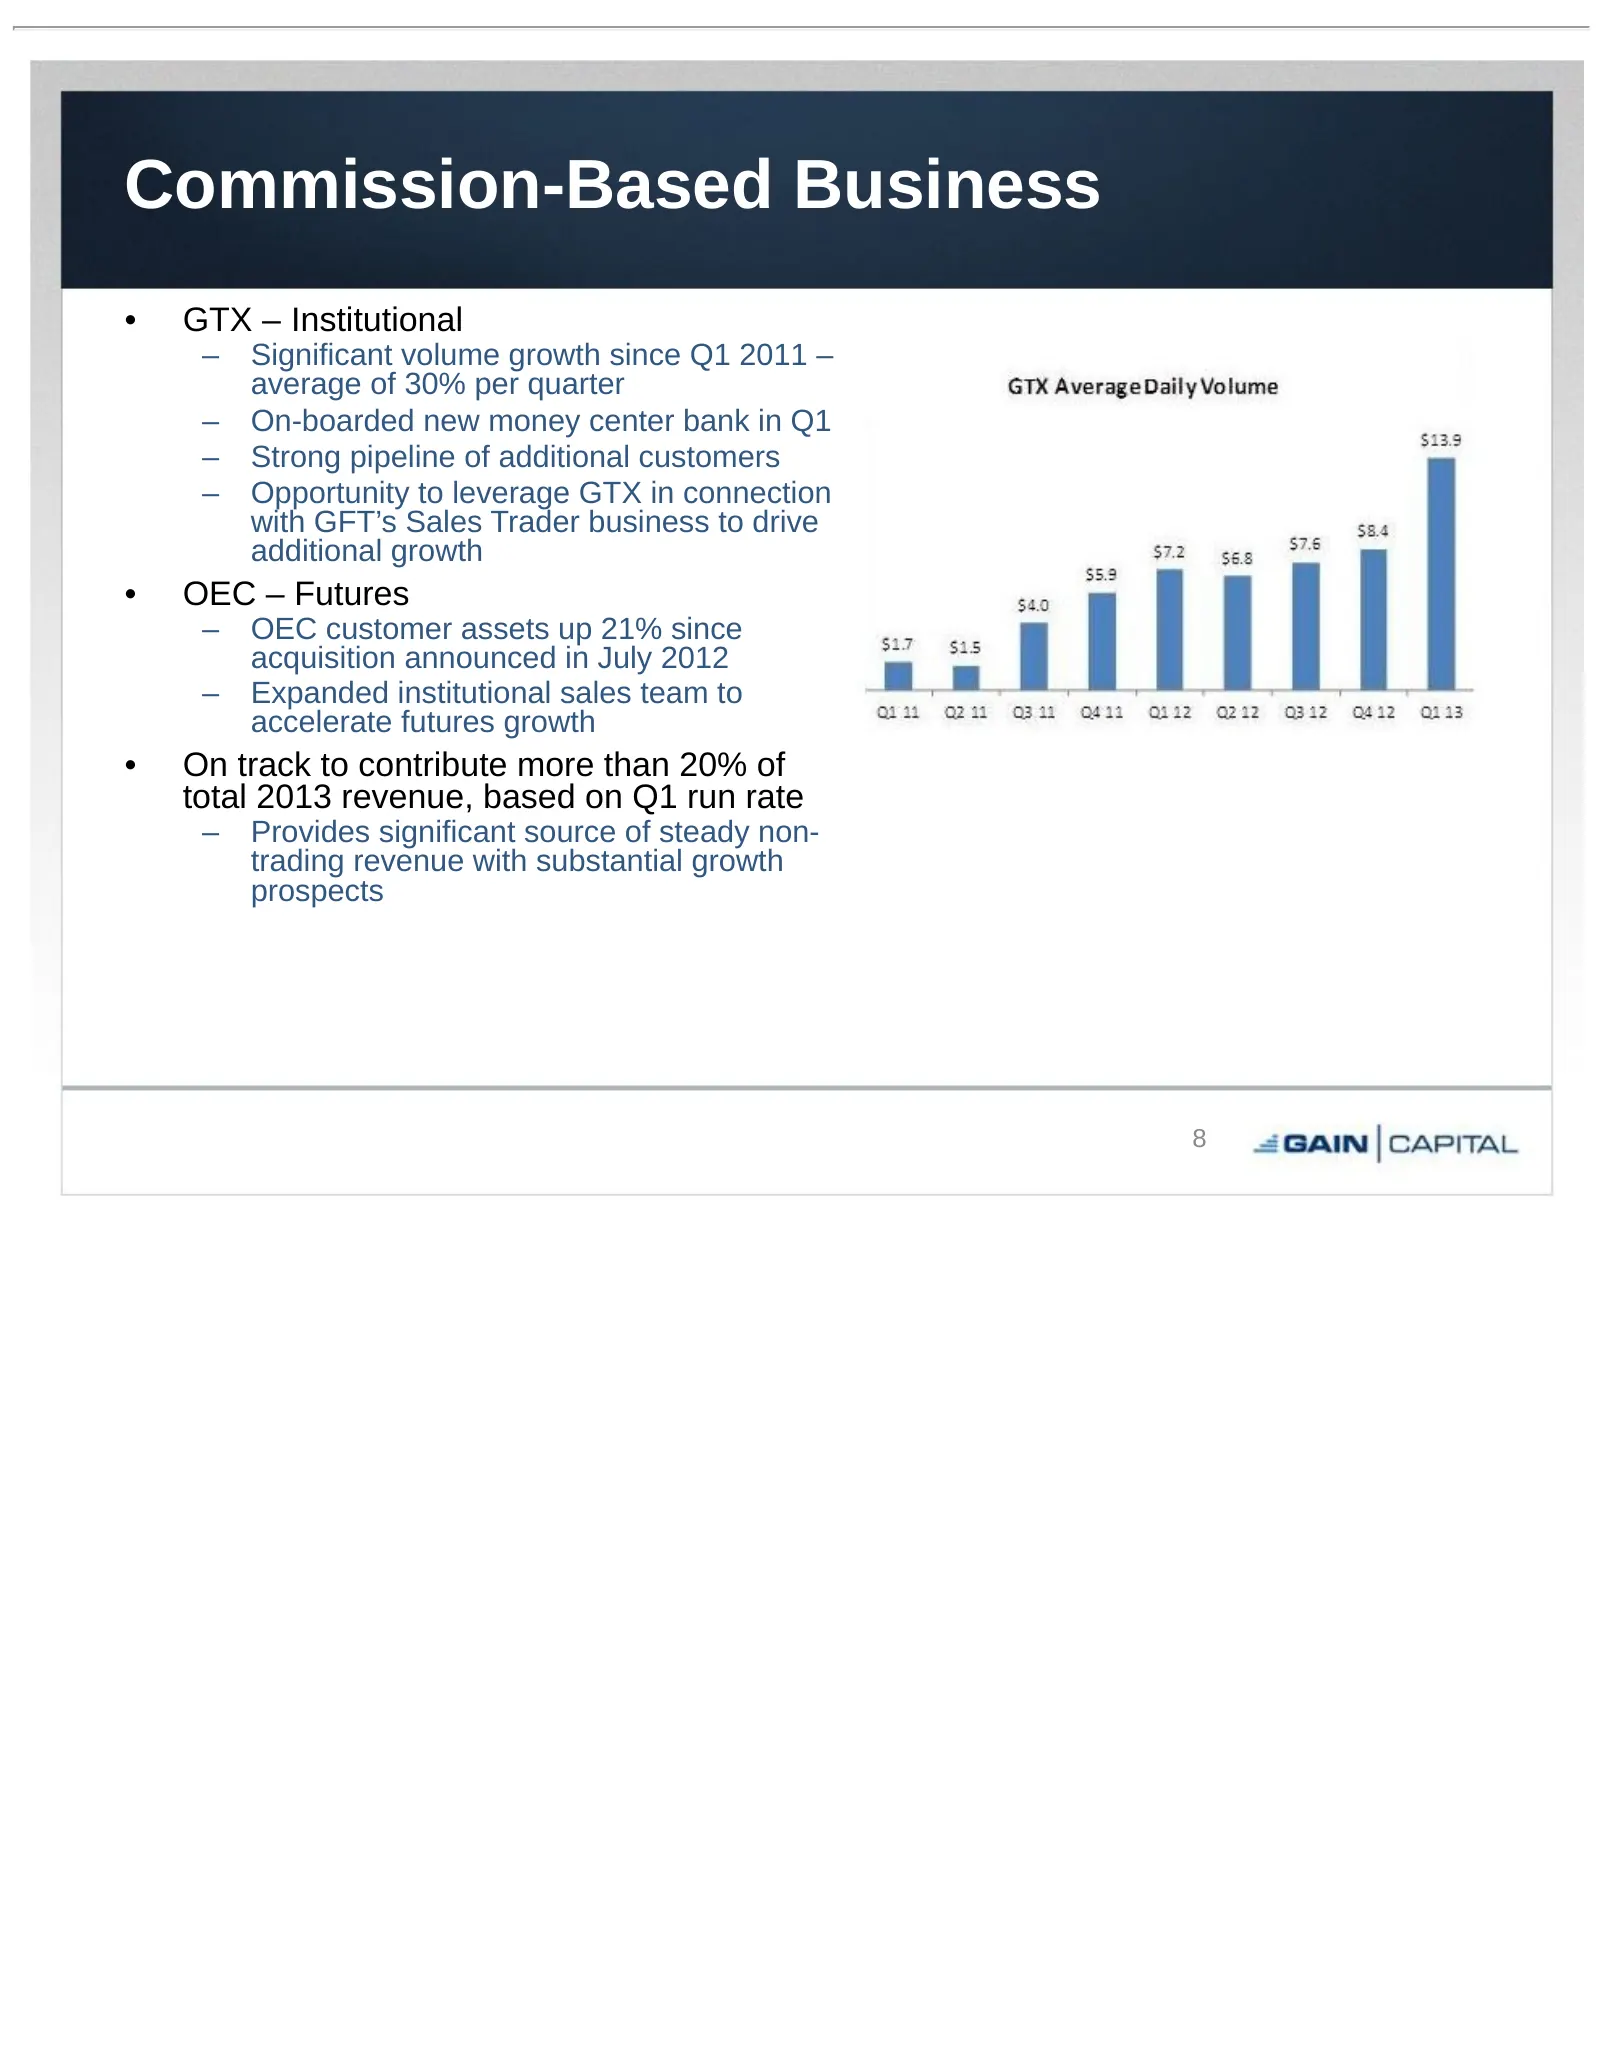
Commission-Based Business • GTX – Institutional – Significant volume growth since Q1 2011 – average of 30% per quarter – On-boarded new money center bank in Q1 – Strong pipeline of additional customers – Opportunity to leverage GTX in connection with GFT’s Sales Trader business to drive additional g
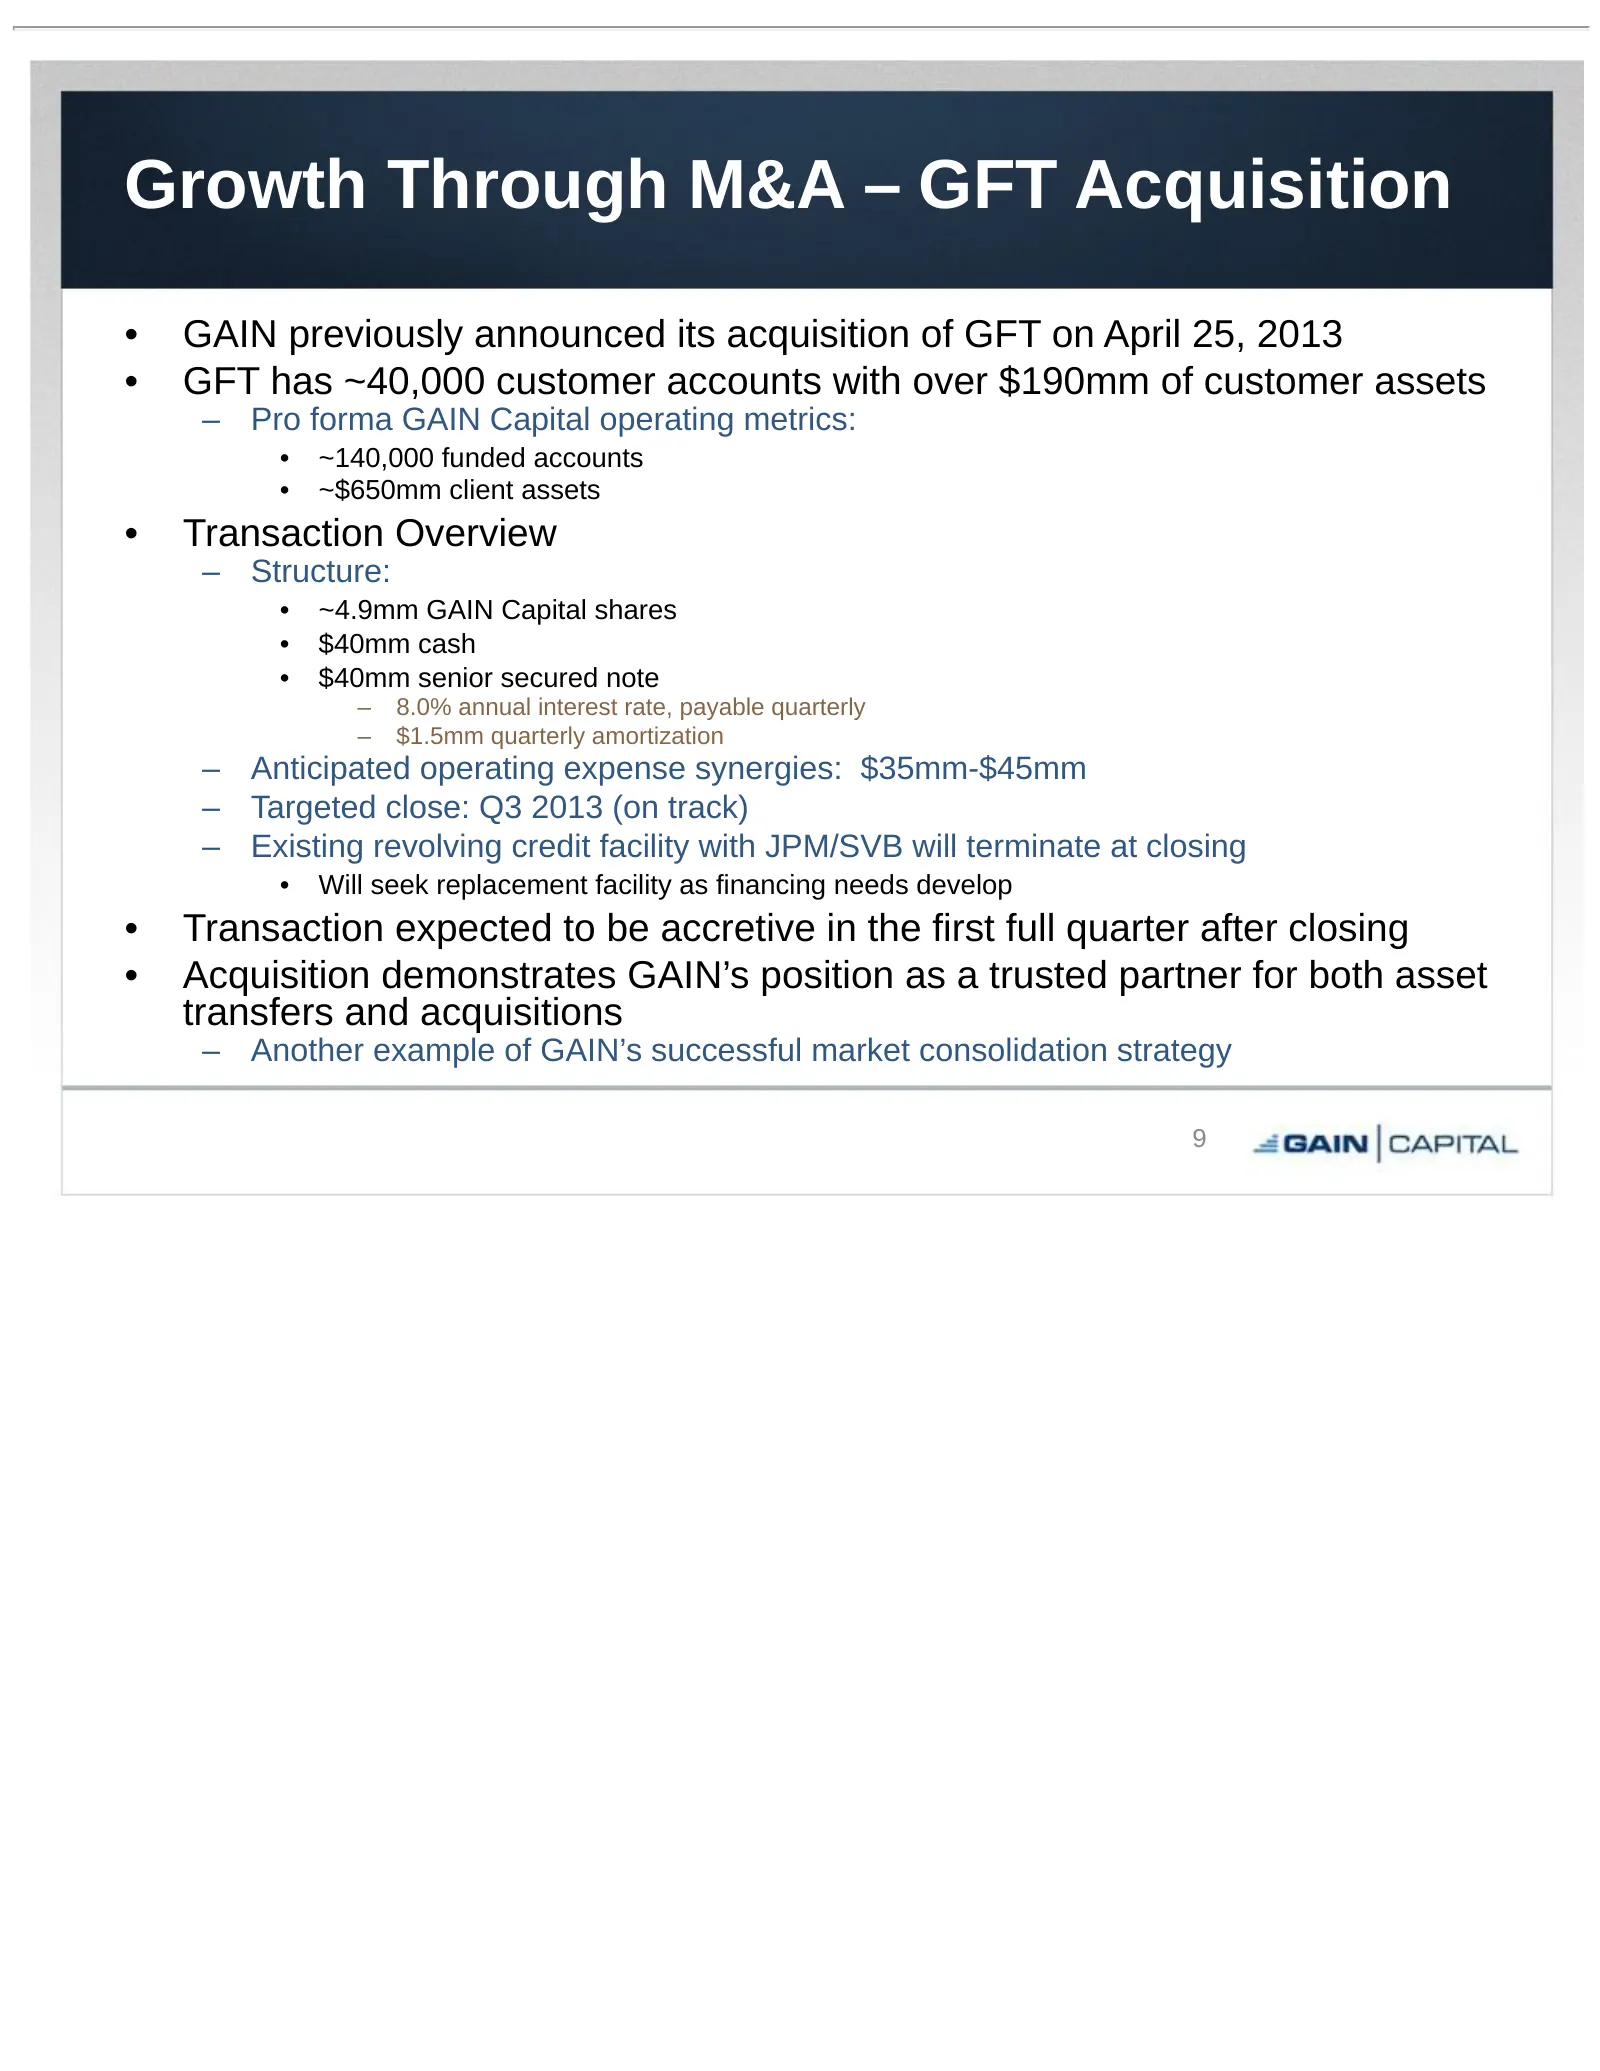
Slide 9: Growth Through M&A – GFT Acquisition
Growth Through M&A – GFT Acquisition • GAIN previously announced its acquisition of GFT on April 25, 2013 • GFT has ~40,000 customer accounts with over $190mm of customer assets – Pro forma GAIN Capital operating metrics: • ~140,000 funded accounts • ~$650mm client assets • Transaction Overview – St
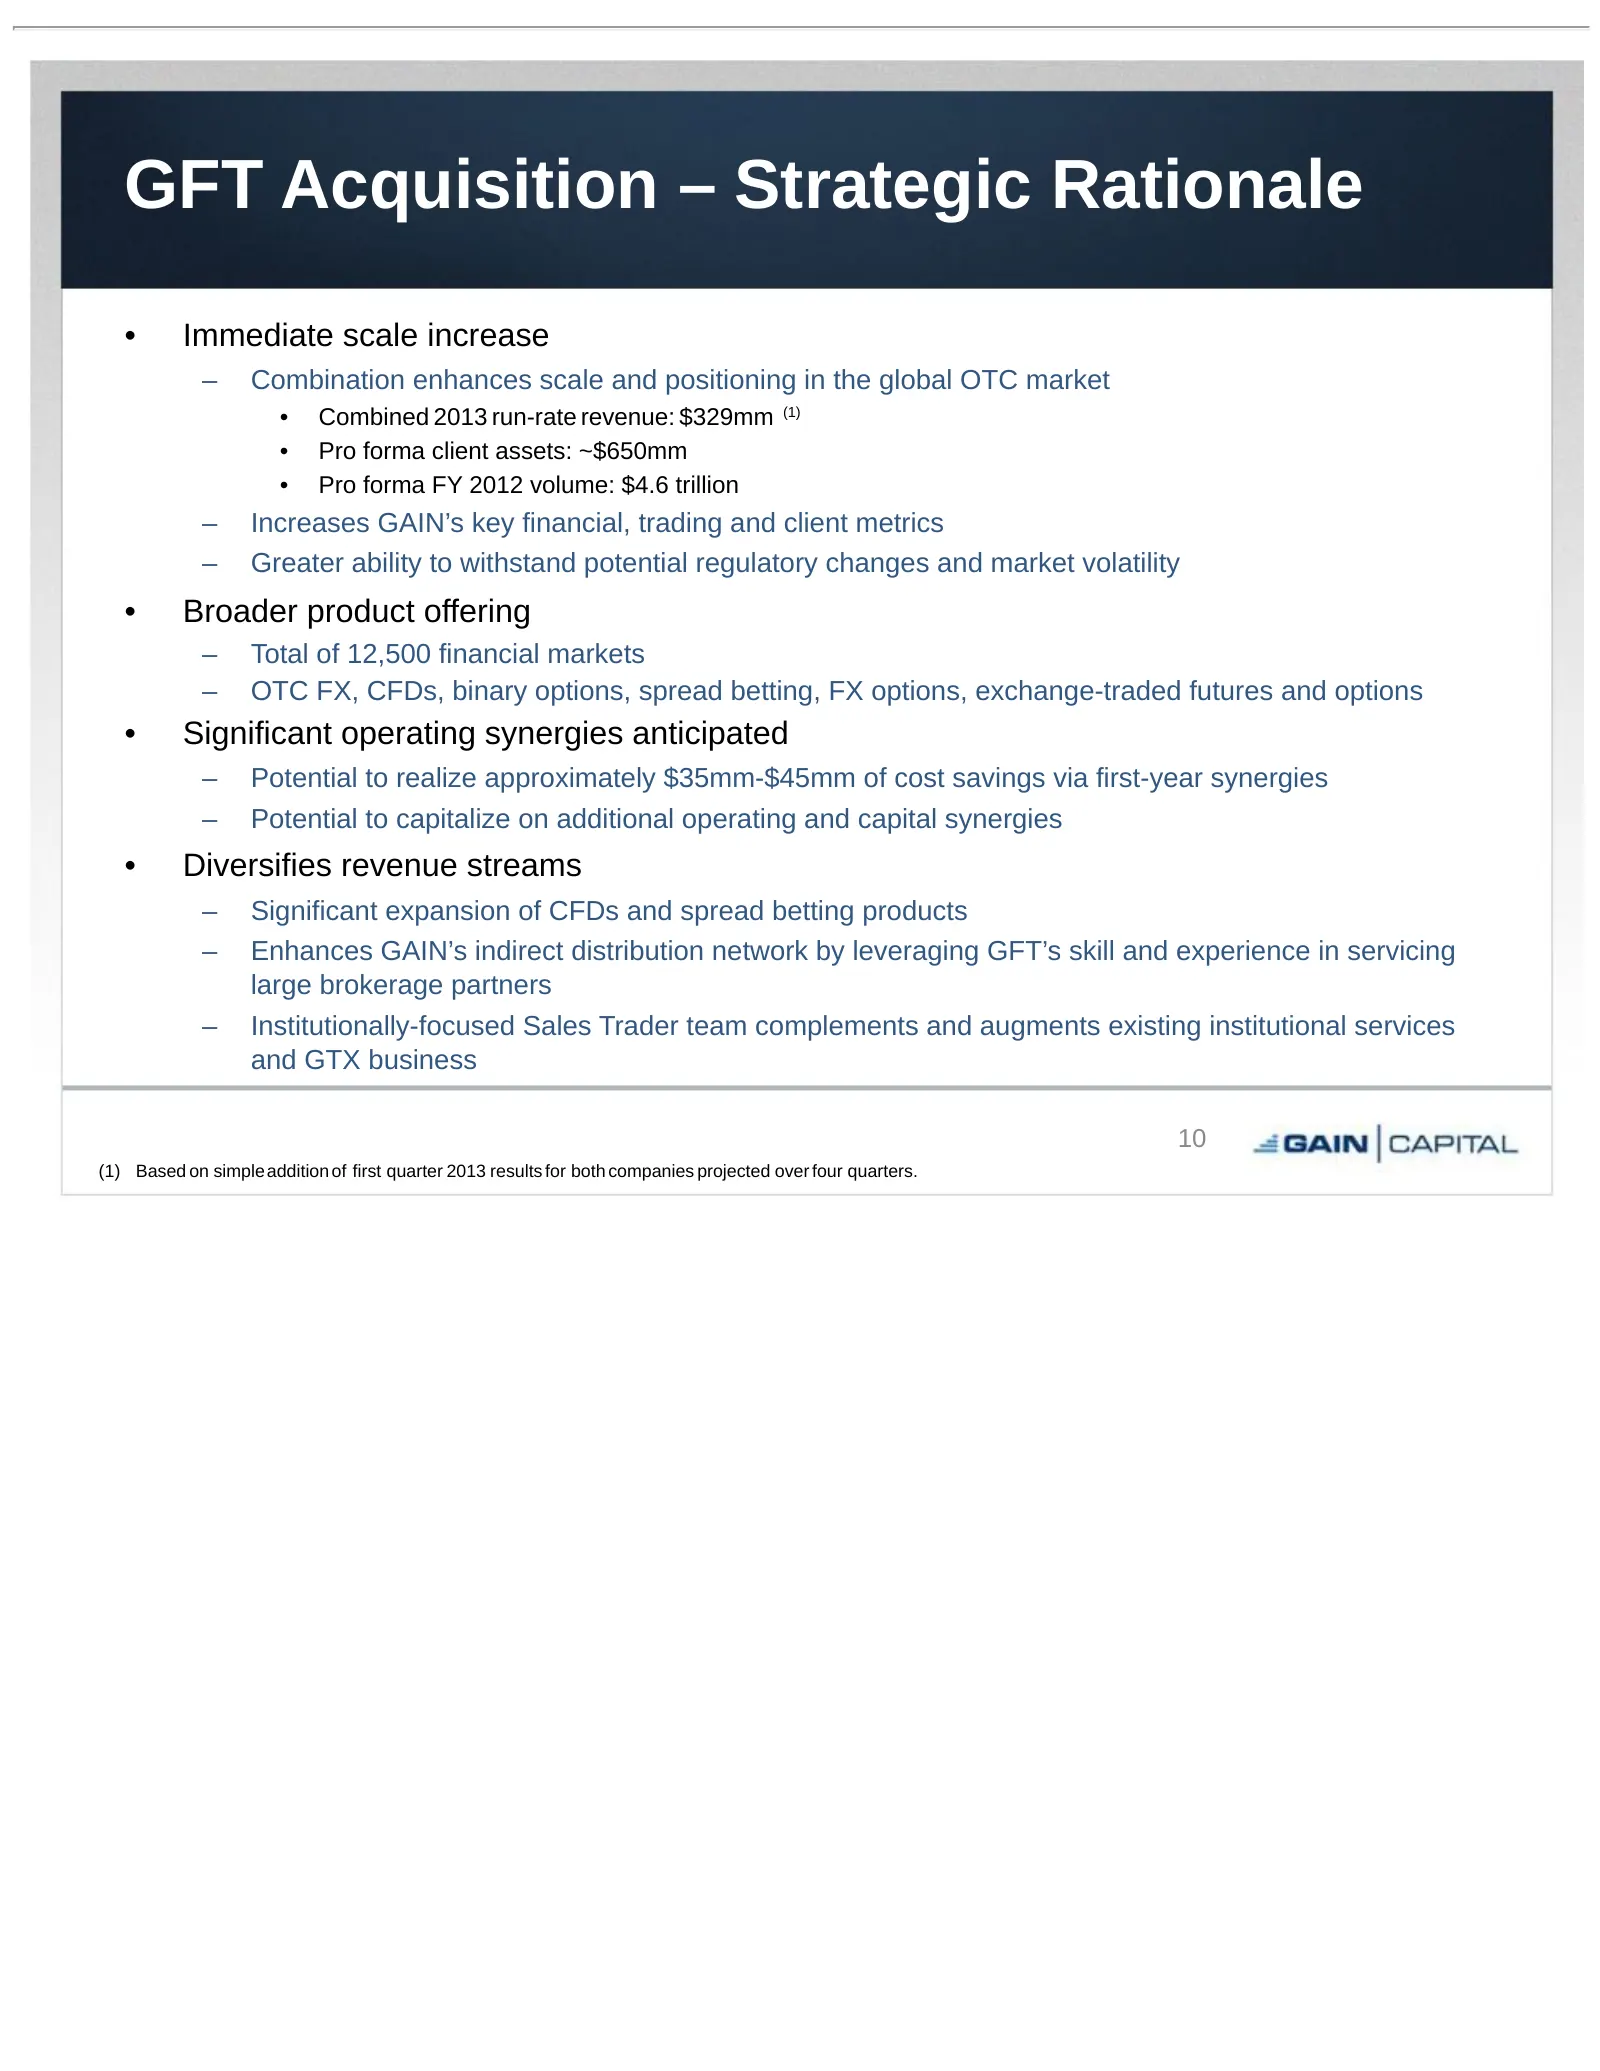
Slide 10: GFT Acquisition – Strategic Rationale
GFT Acquisition – Strategic Rationale • Immediate scale increase – Combination enhances scale and positioning in the global OTC market • Combined 2013 run-rate revenue: $329mm (1) • Pro forma client assets: ~$650mm • Pro forma FY 2012 volume: $4.6 trillion – Increases GAIN’s key financial, trading a
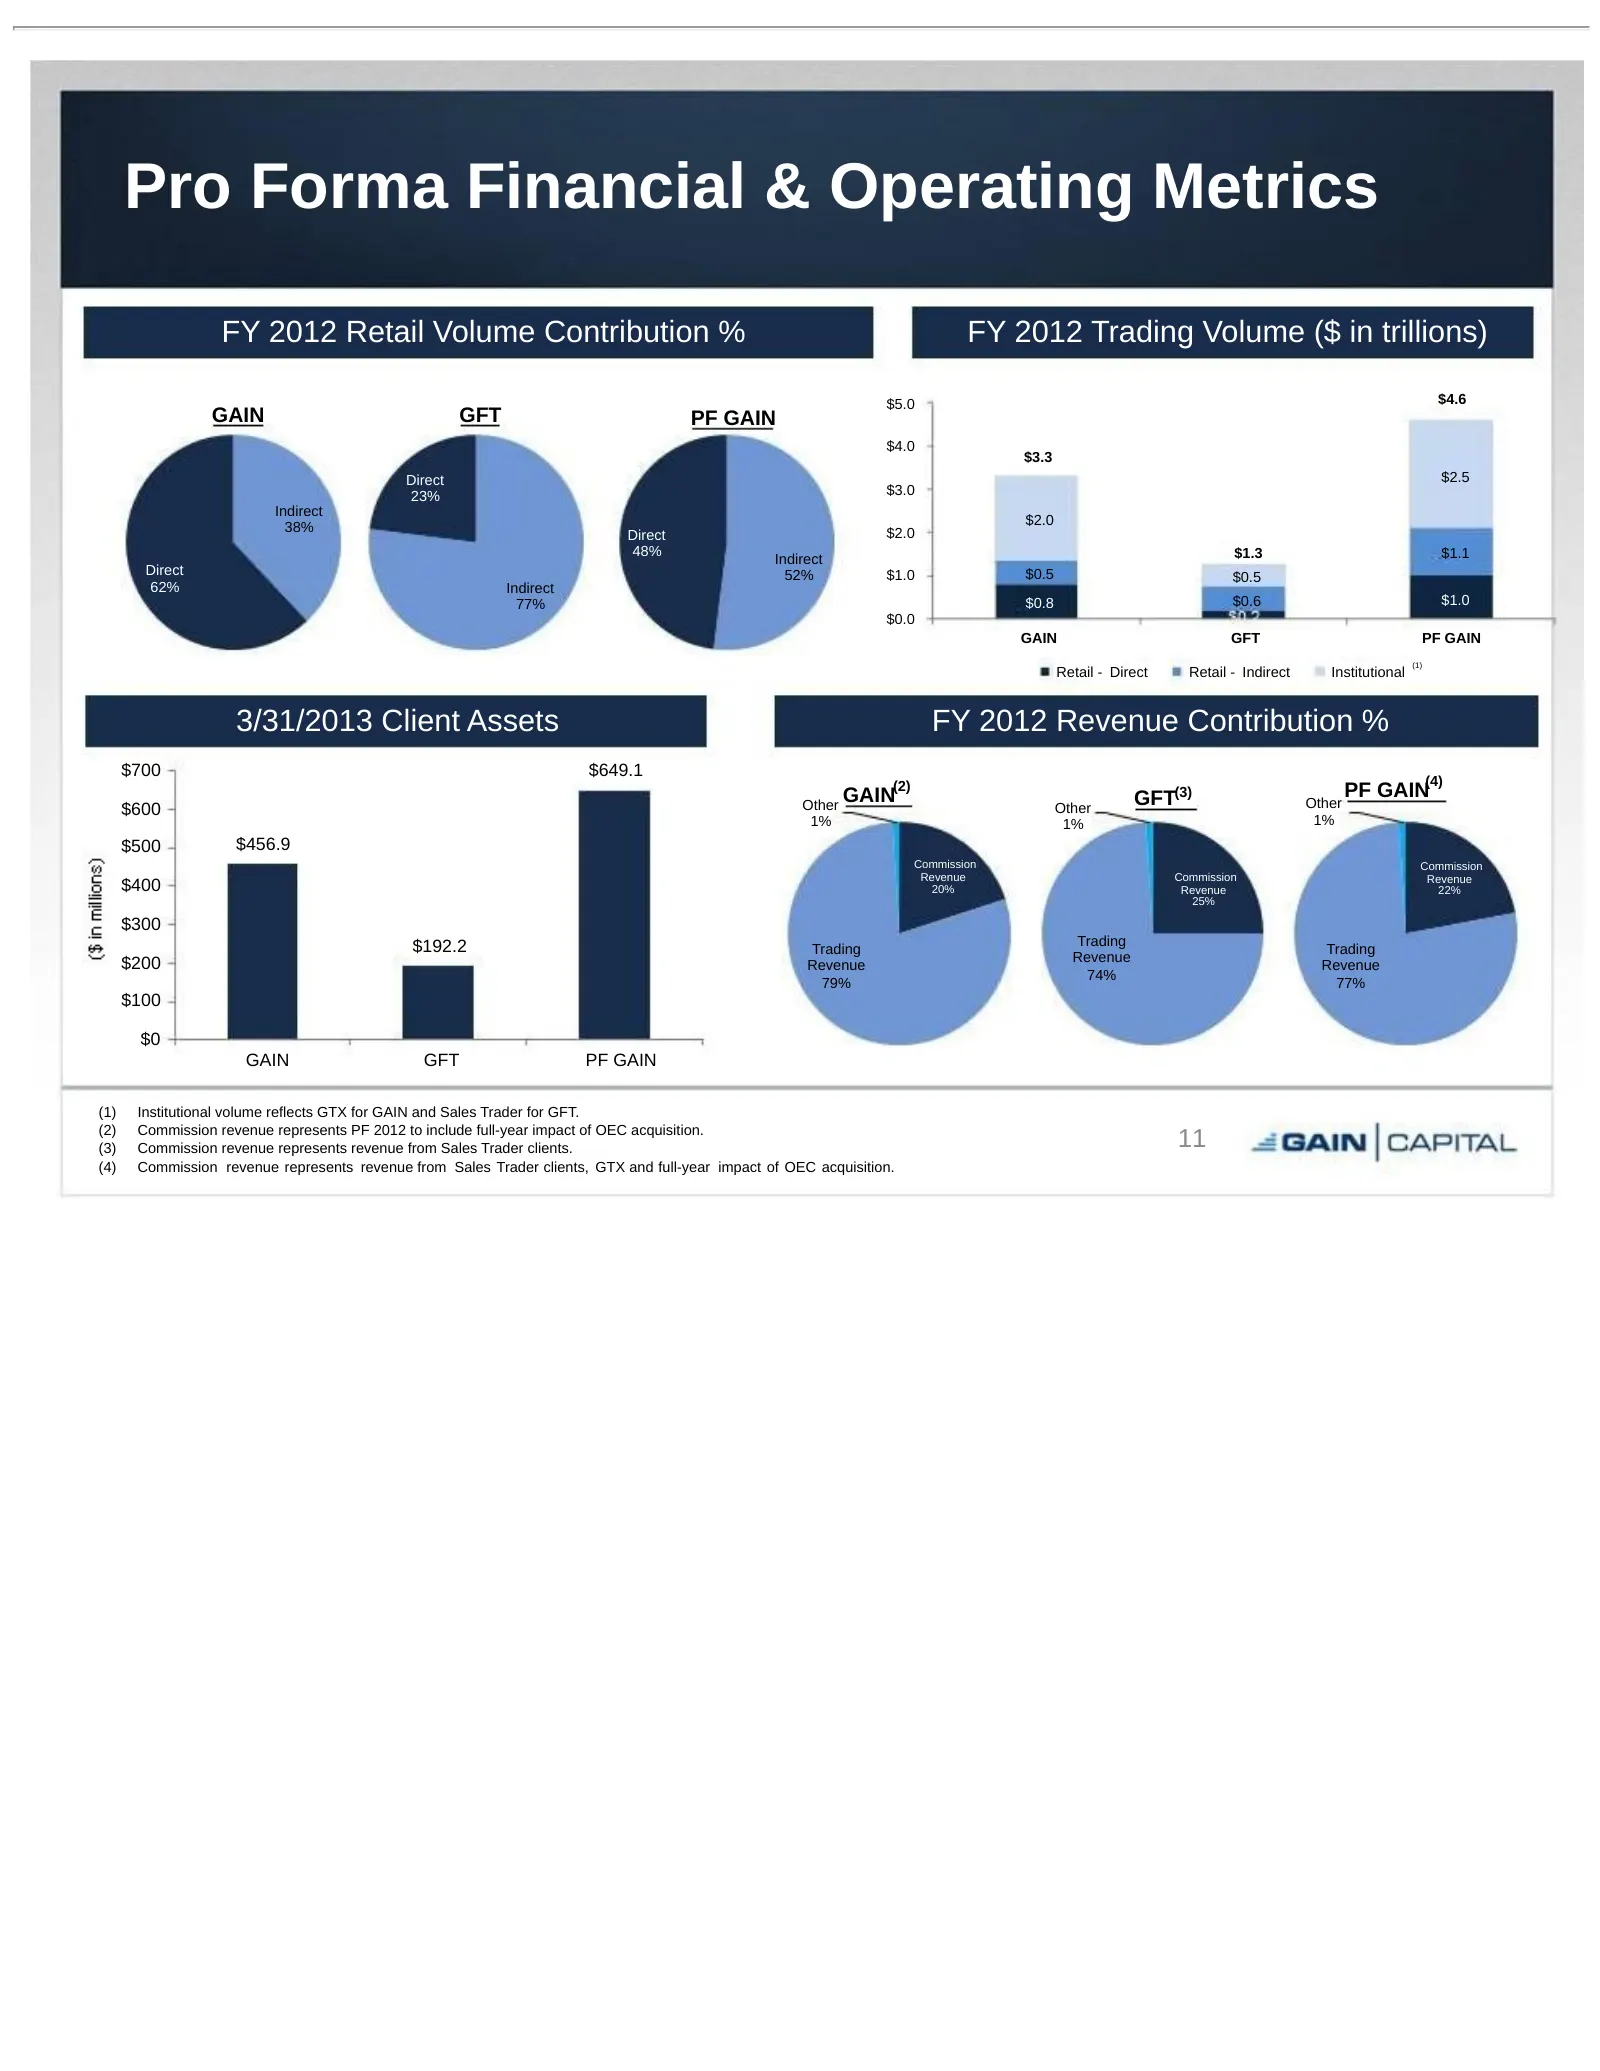
Slide 11: Pro Forma Financial & Operating Metrics
Pro Forma Financial & Operating Metrics FY 2012 Retail Volume Contribution % FY 2012 Trading Volume ($ in trillions) $5.0 $4.6 GAIN GFT PF GAIN $4.0 $3.3 Direct $2.5 23% $3.0 Indirect 38% $2.0 Direct $2.0 48% $1.3 $1.1 Indirect Direct 52% $1.0 $0.5 $0.5 62% Indirect 77% $0.8 $0.6 $1.0 $0.0 GAIN GFT

Slide 12: Financial Review
Financial Review Daryl Carlough, Interim CFO
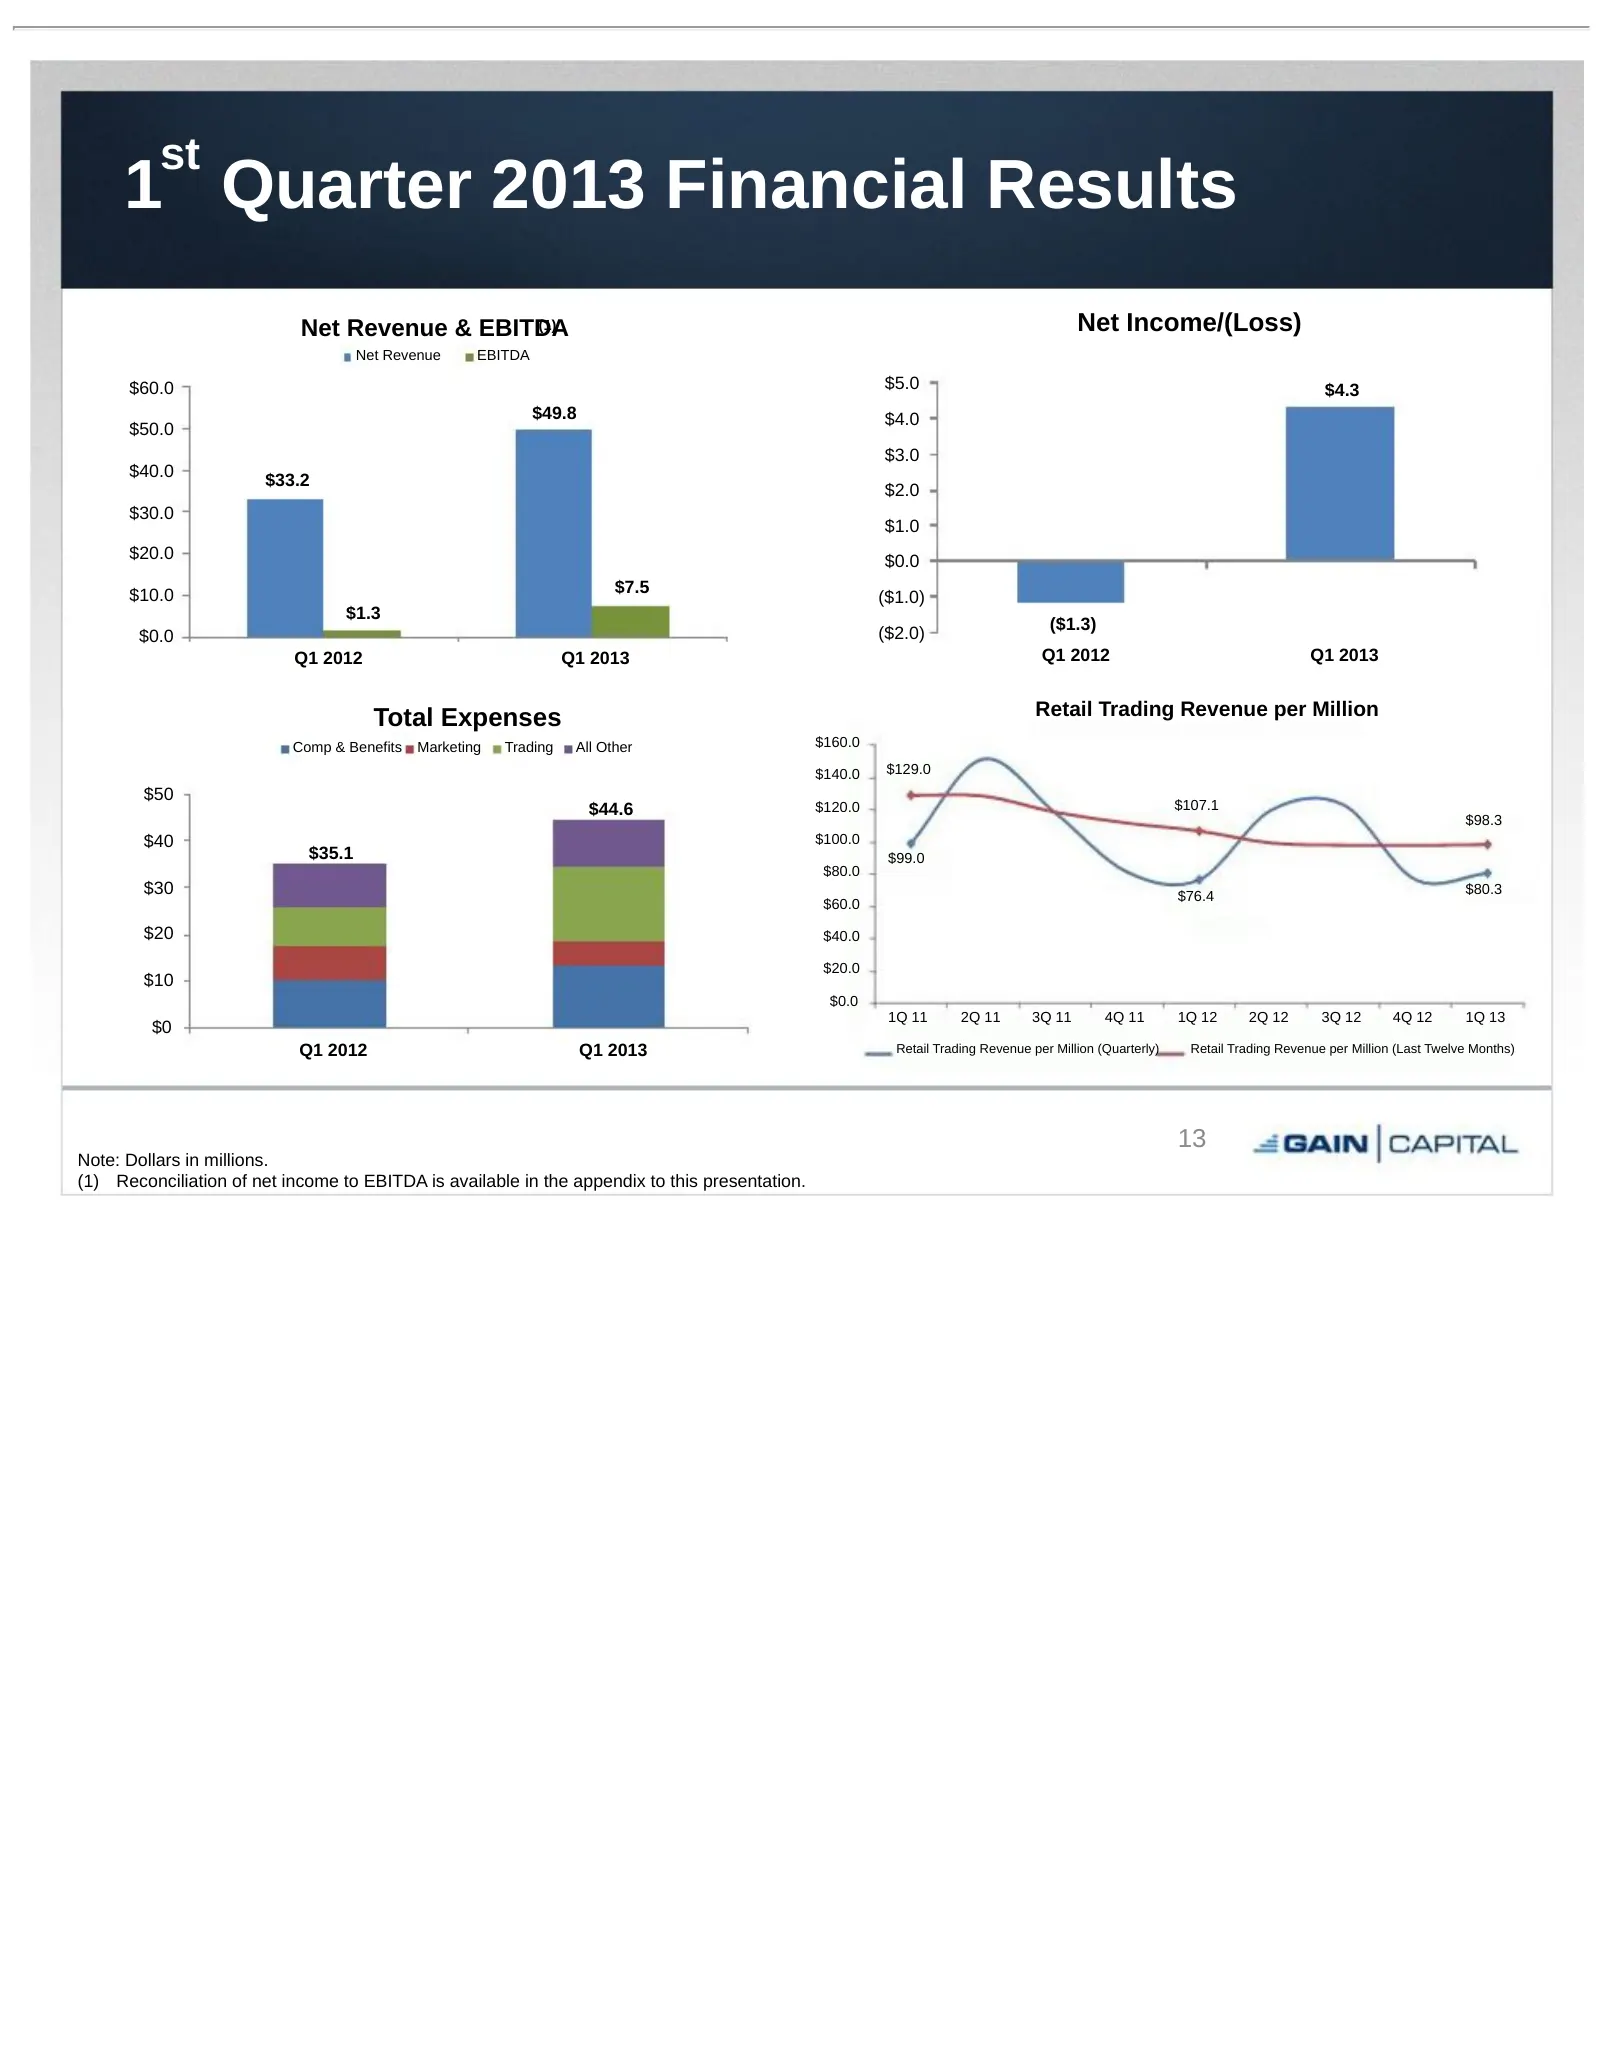
Slide 13: 1st Quarter 2013 Financial Results
st 1 Quarter 2013 Financial Results Net Revenue & EBITDA (1) Net Income/(Loss) Net Revenue EBITDA $60.0 $5.0 $4.3 $49.8 $4.0 $50.0 $3.0 $40.0 $33.2 $2.0 $30.0 $1.0 $20.0 $0.0 $10.0 $7.5 ($1.0) $1.3 ($2.0) ($1.3) $0.0 Q1 2012 Q1 2013 Q1 2012 Q1 2013 Total Expenses Retail Trading Revenue per Million C
Slide 14: Quarterly Dividend & Share Buyback
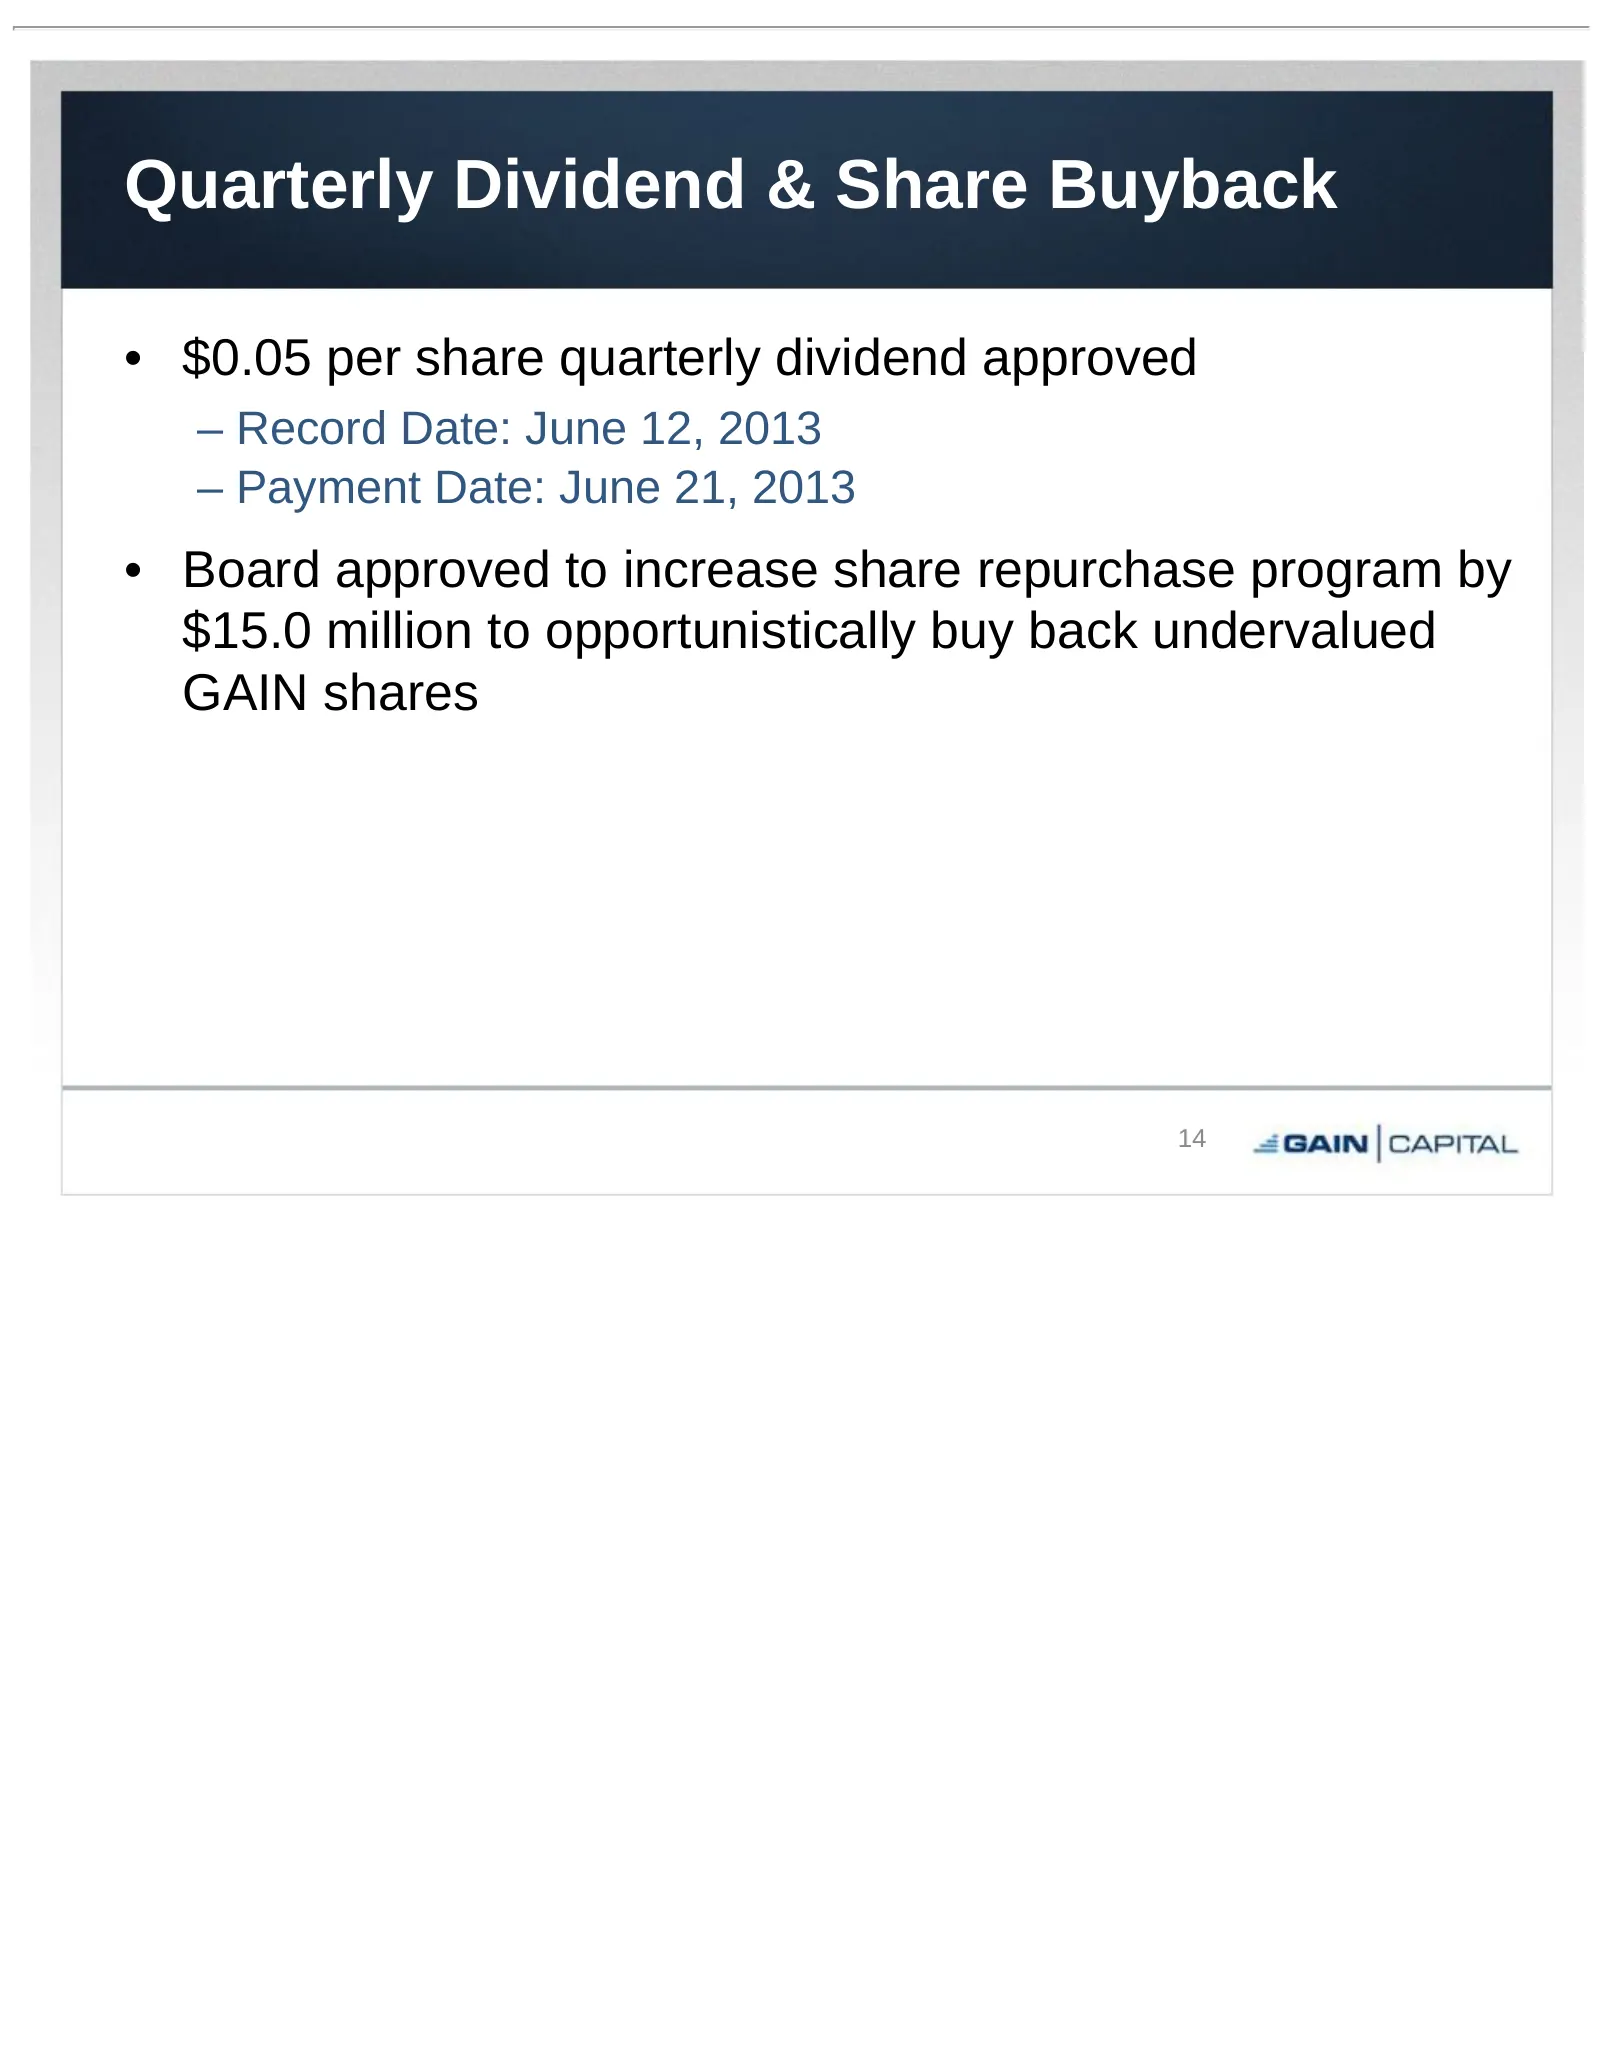
Quarterly Dividend & Share Buyback • $0.05 per share quarterly dividend approved – Record Date: June 12, 2013 – Payment Date: June 21, 2013 • Board approved to increase share repurchase program by $15.0 million to opportunistically buy back undervalued GAIN shares 14
Slide 15: Monthly Operating Metrics
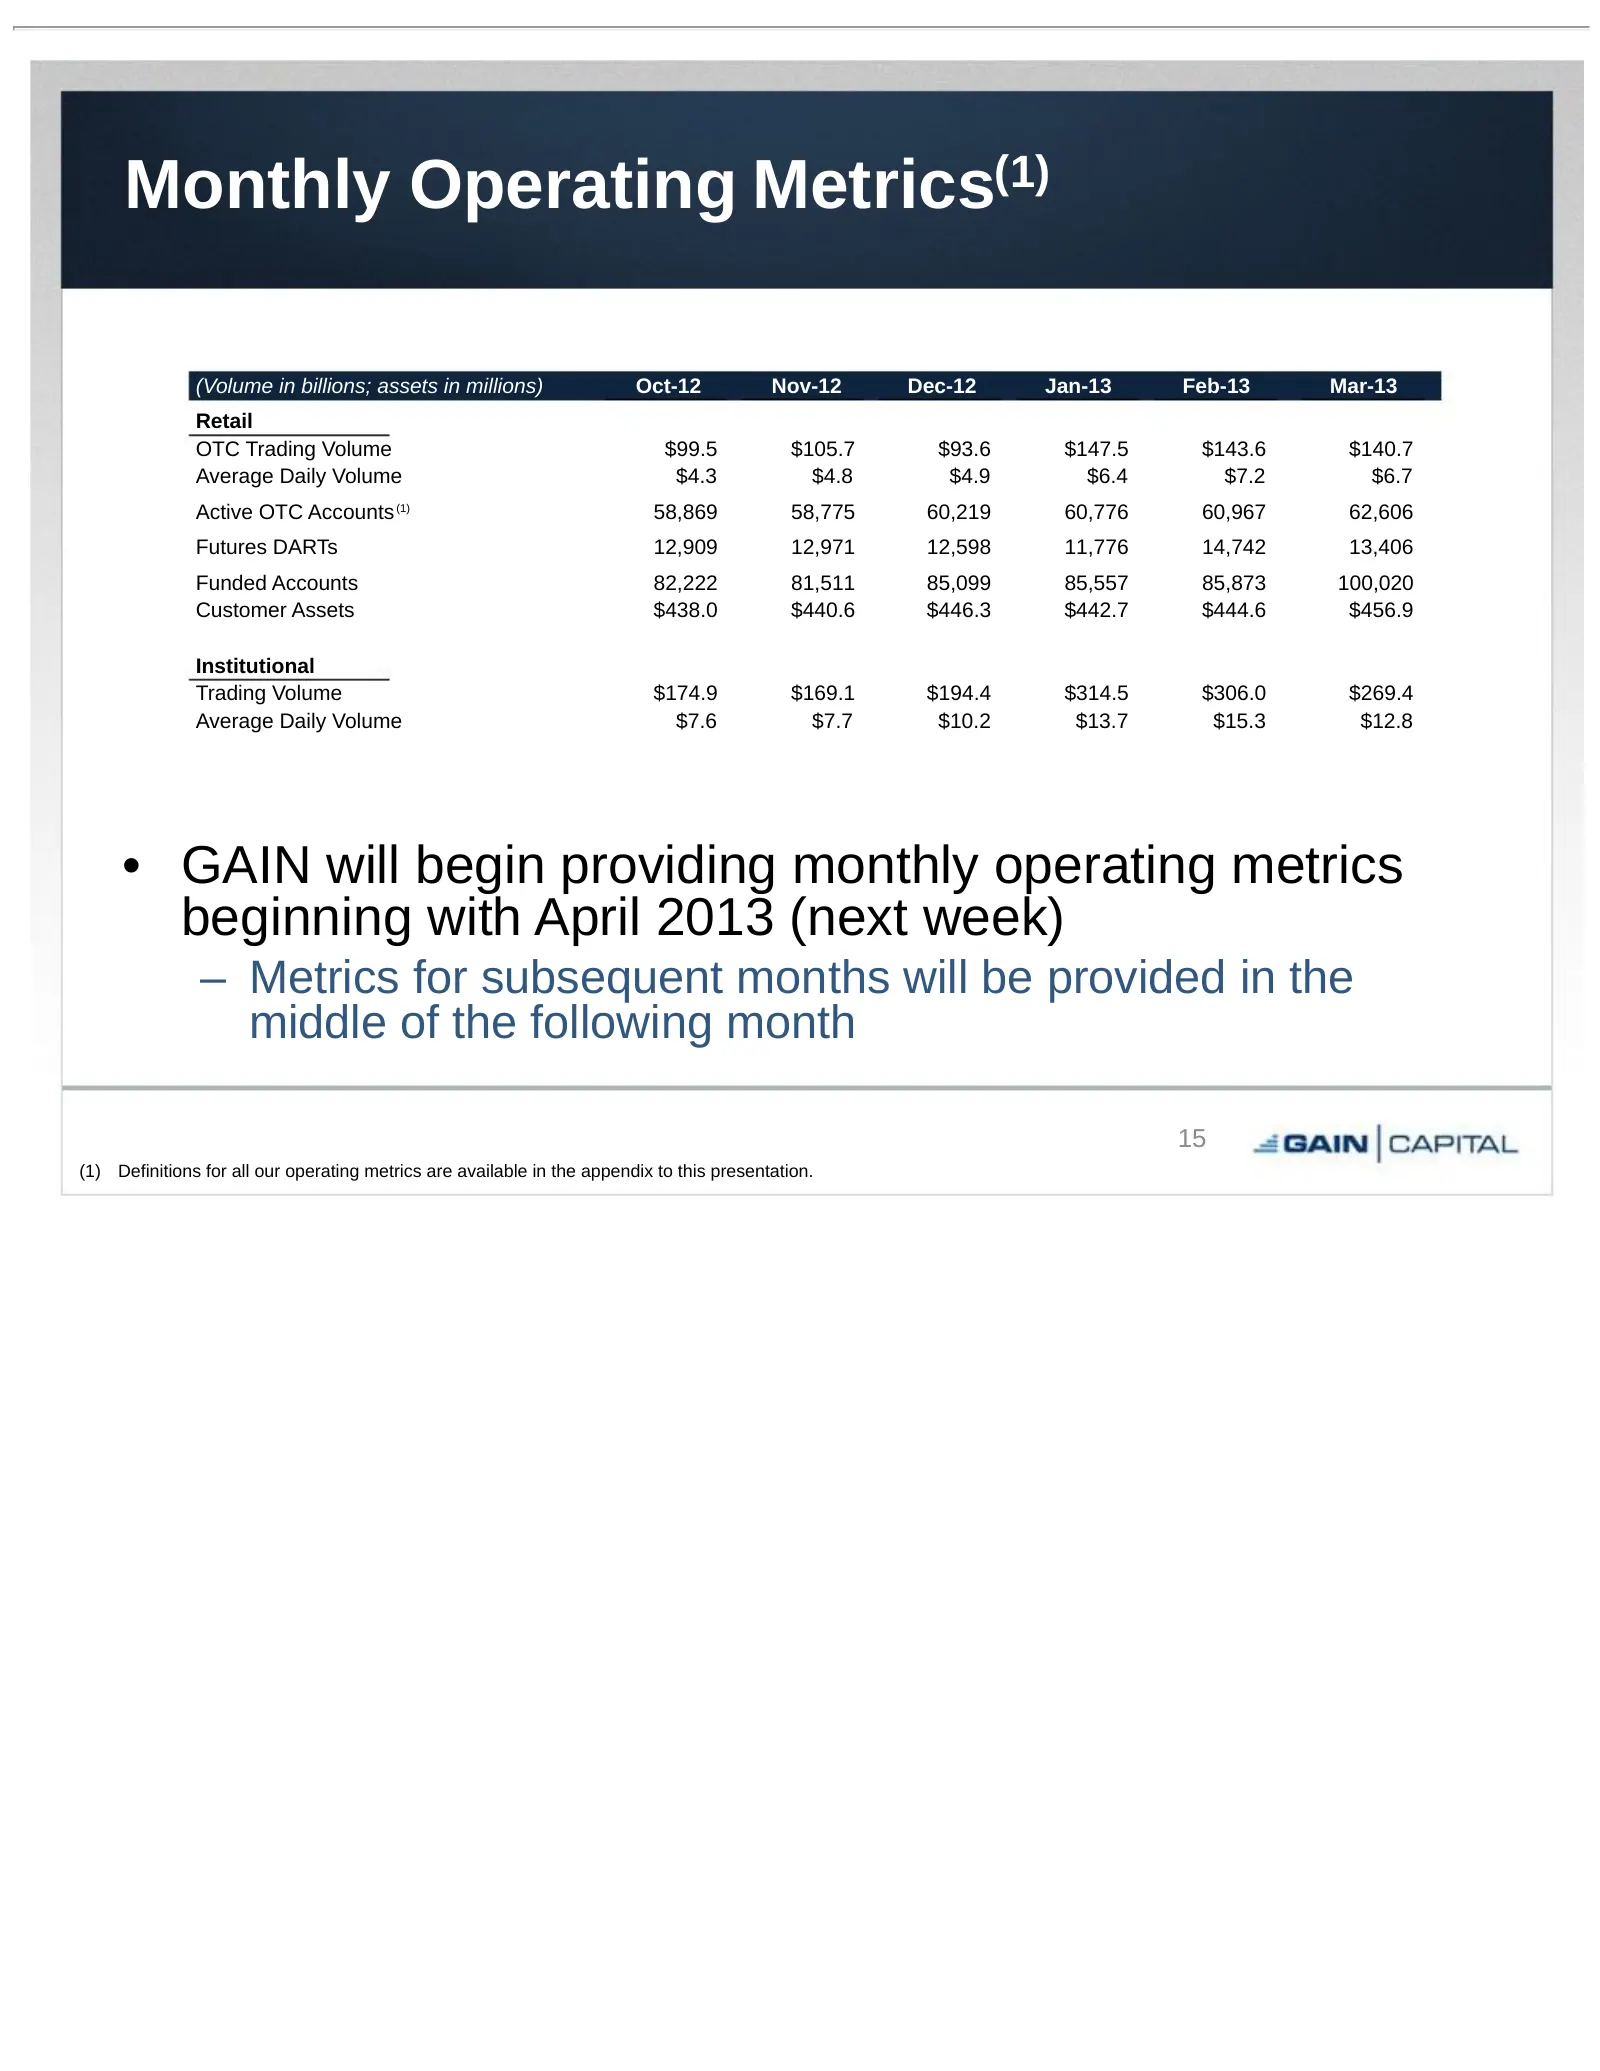
Monthly Operating Metrics(1) (Volume in billions; assets in millions) Oct-12 Nov-12 Dec-12 Jan-13 Feb-13 Mar-13 Retail OTC Trading Volume $99.5 $105.7 $93.6 $147.5 $143.6 $140.7 Average Daily Volume $4.3 $4.8 $4.9 $6.4 $7.2 $6.7 Active OTC Accounts (1) 58,869 58,775 60,219 60,776 60,967 62,606 Futur
Slide 16: Closing Remarks
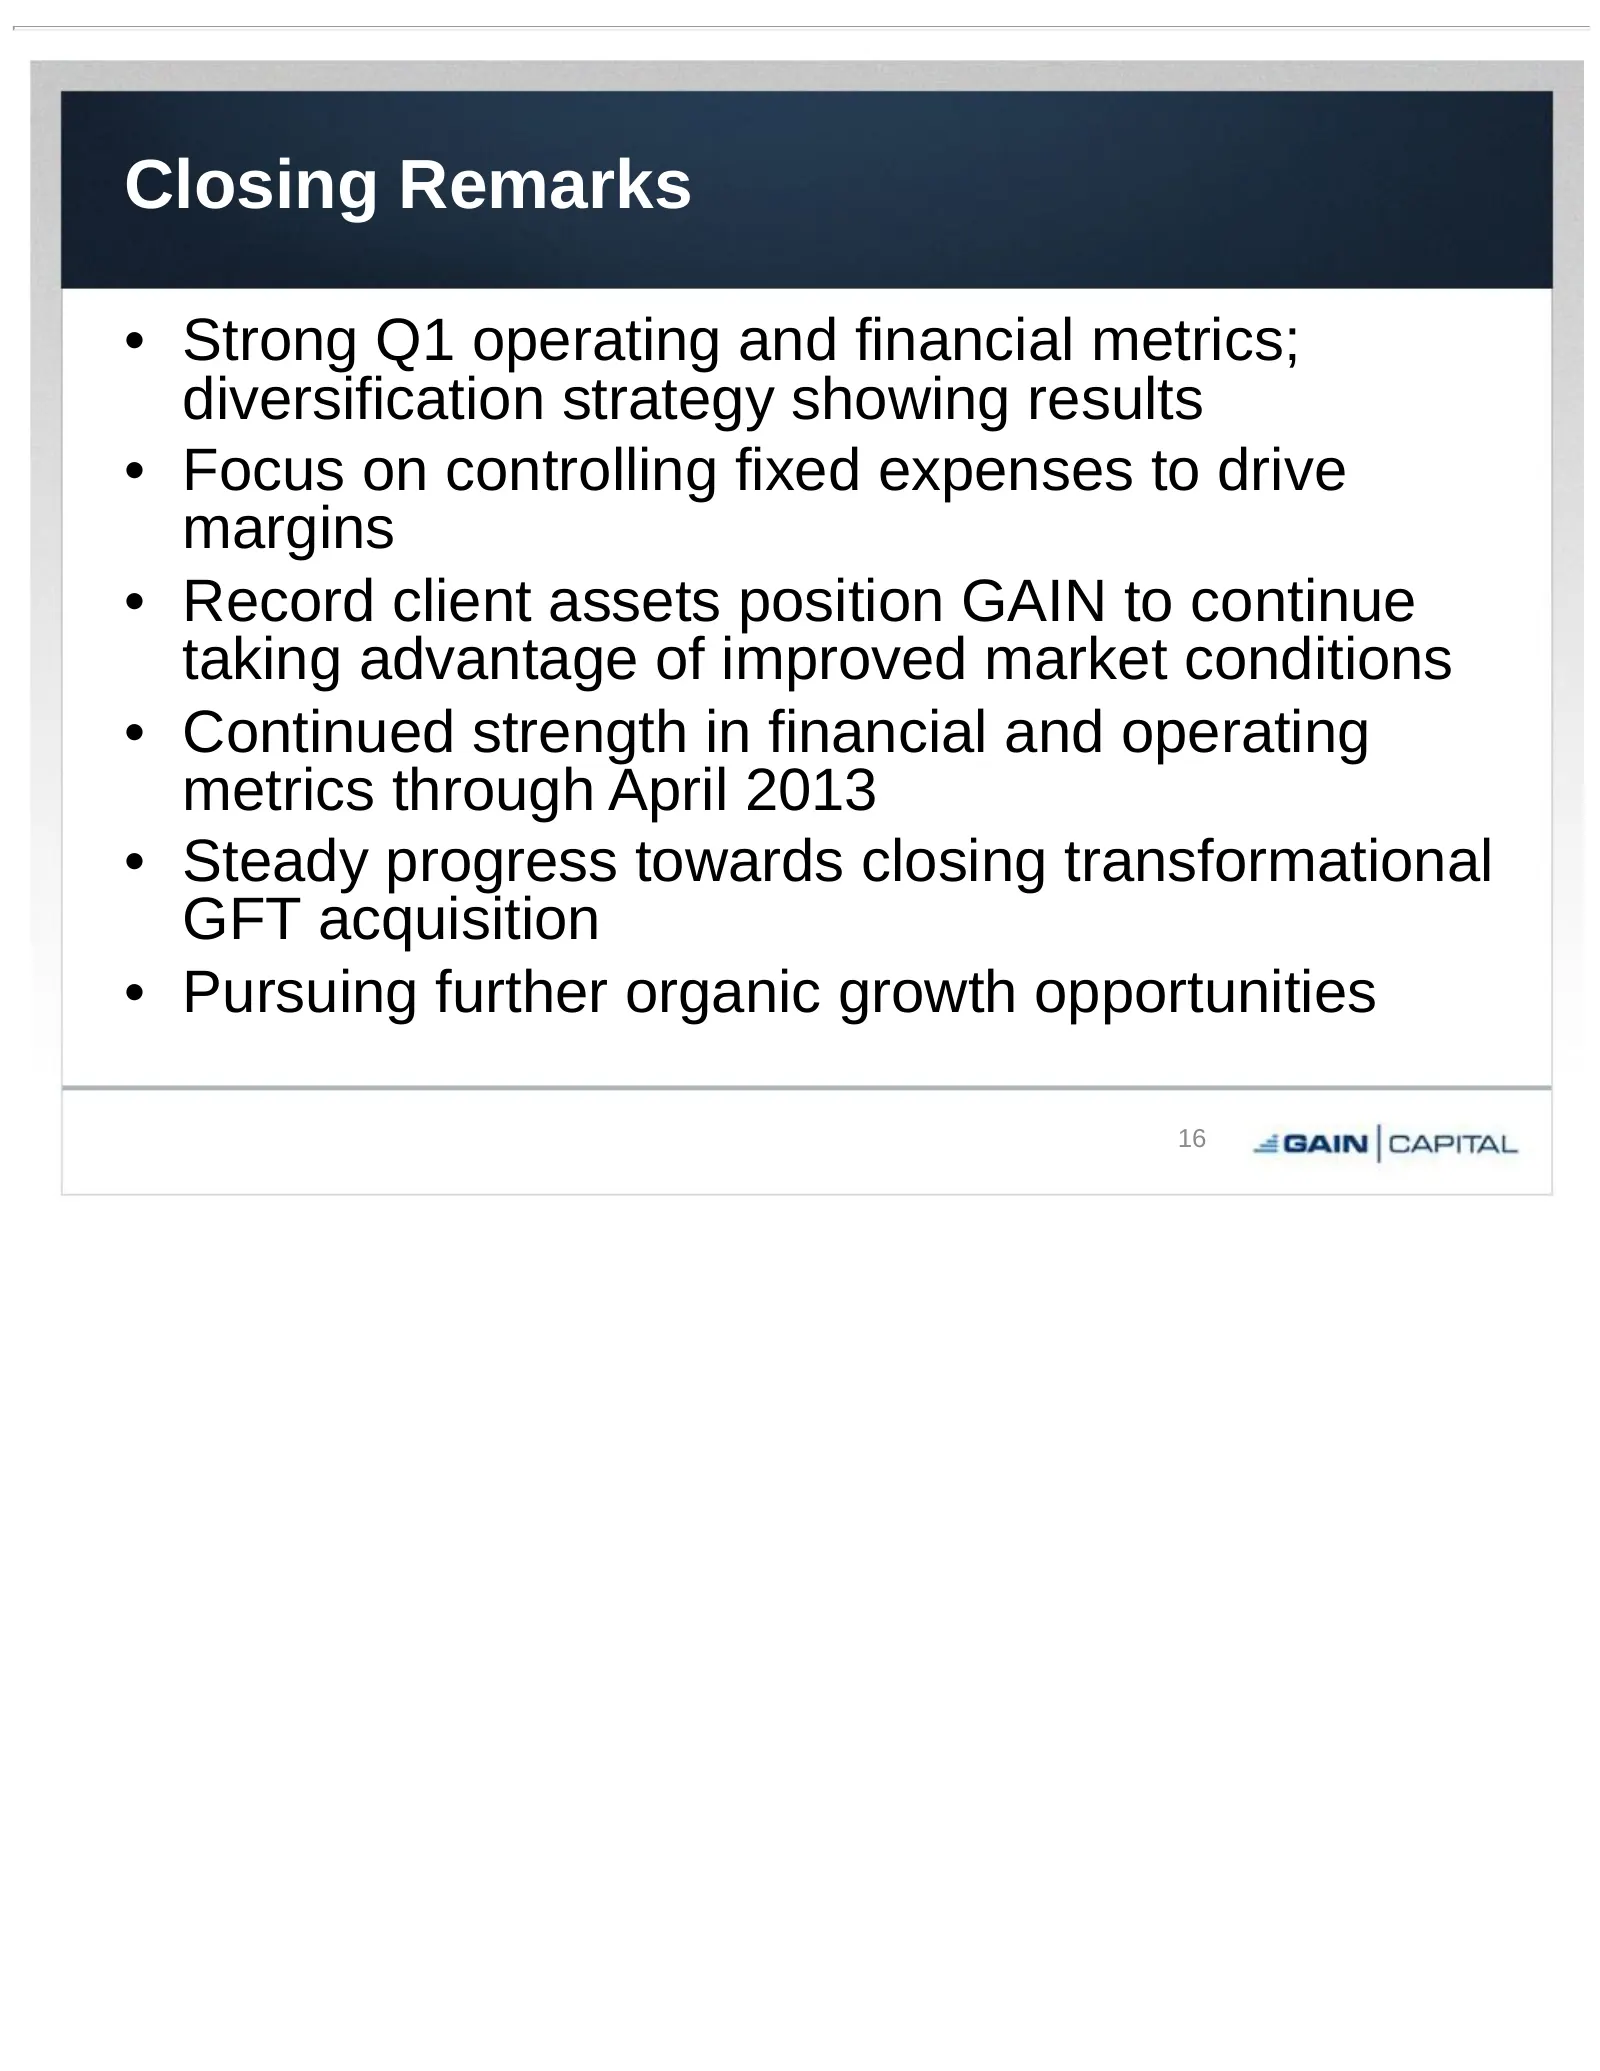
Closing Remarks • Strong Q1 operating and financial metrics; diversification strategy showing results • Focus on controlling fixed expenses to drive margins • Record client assets position GAIN to continue taking advantage of improved market conditions • Continued strength in financial and operating
Slide 17: Appendix
Appendix
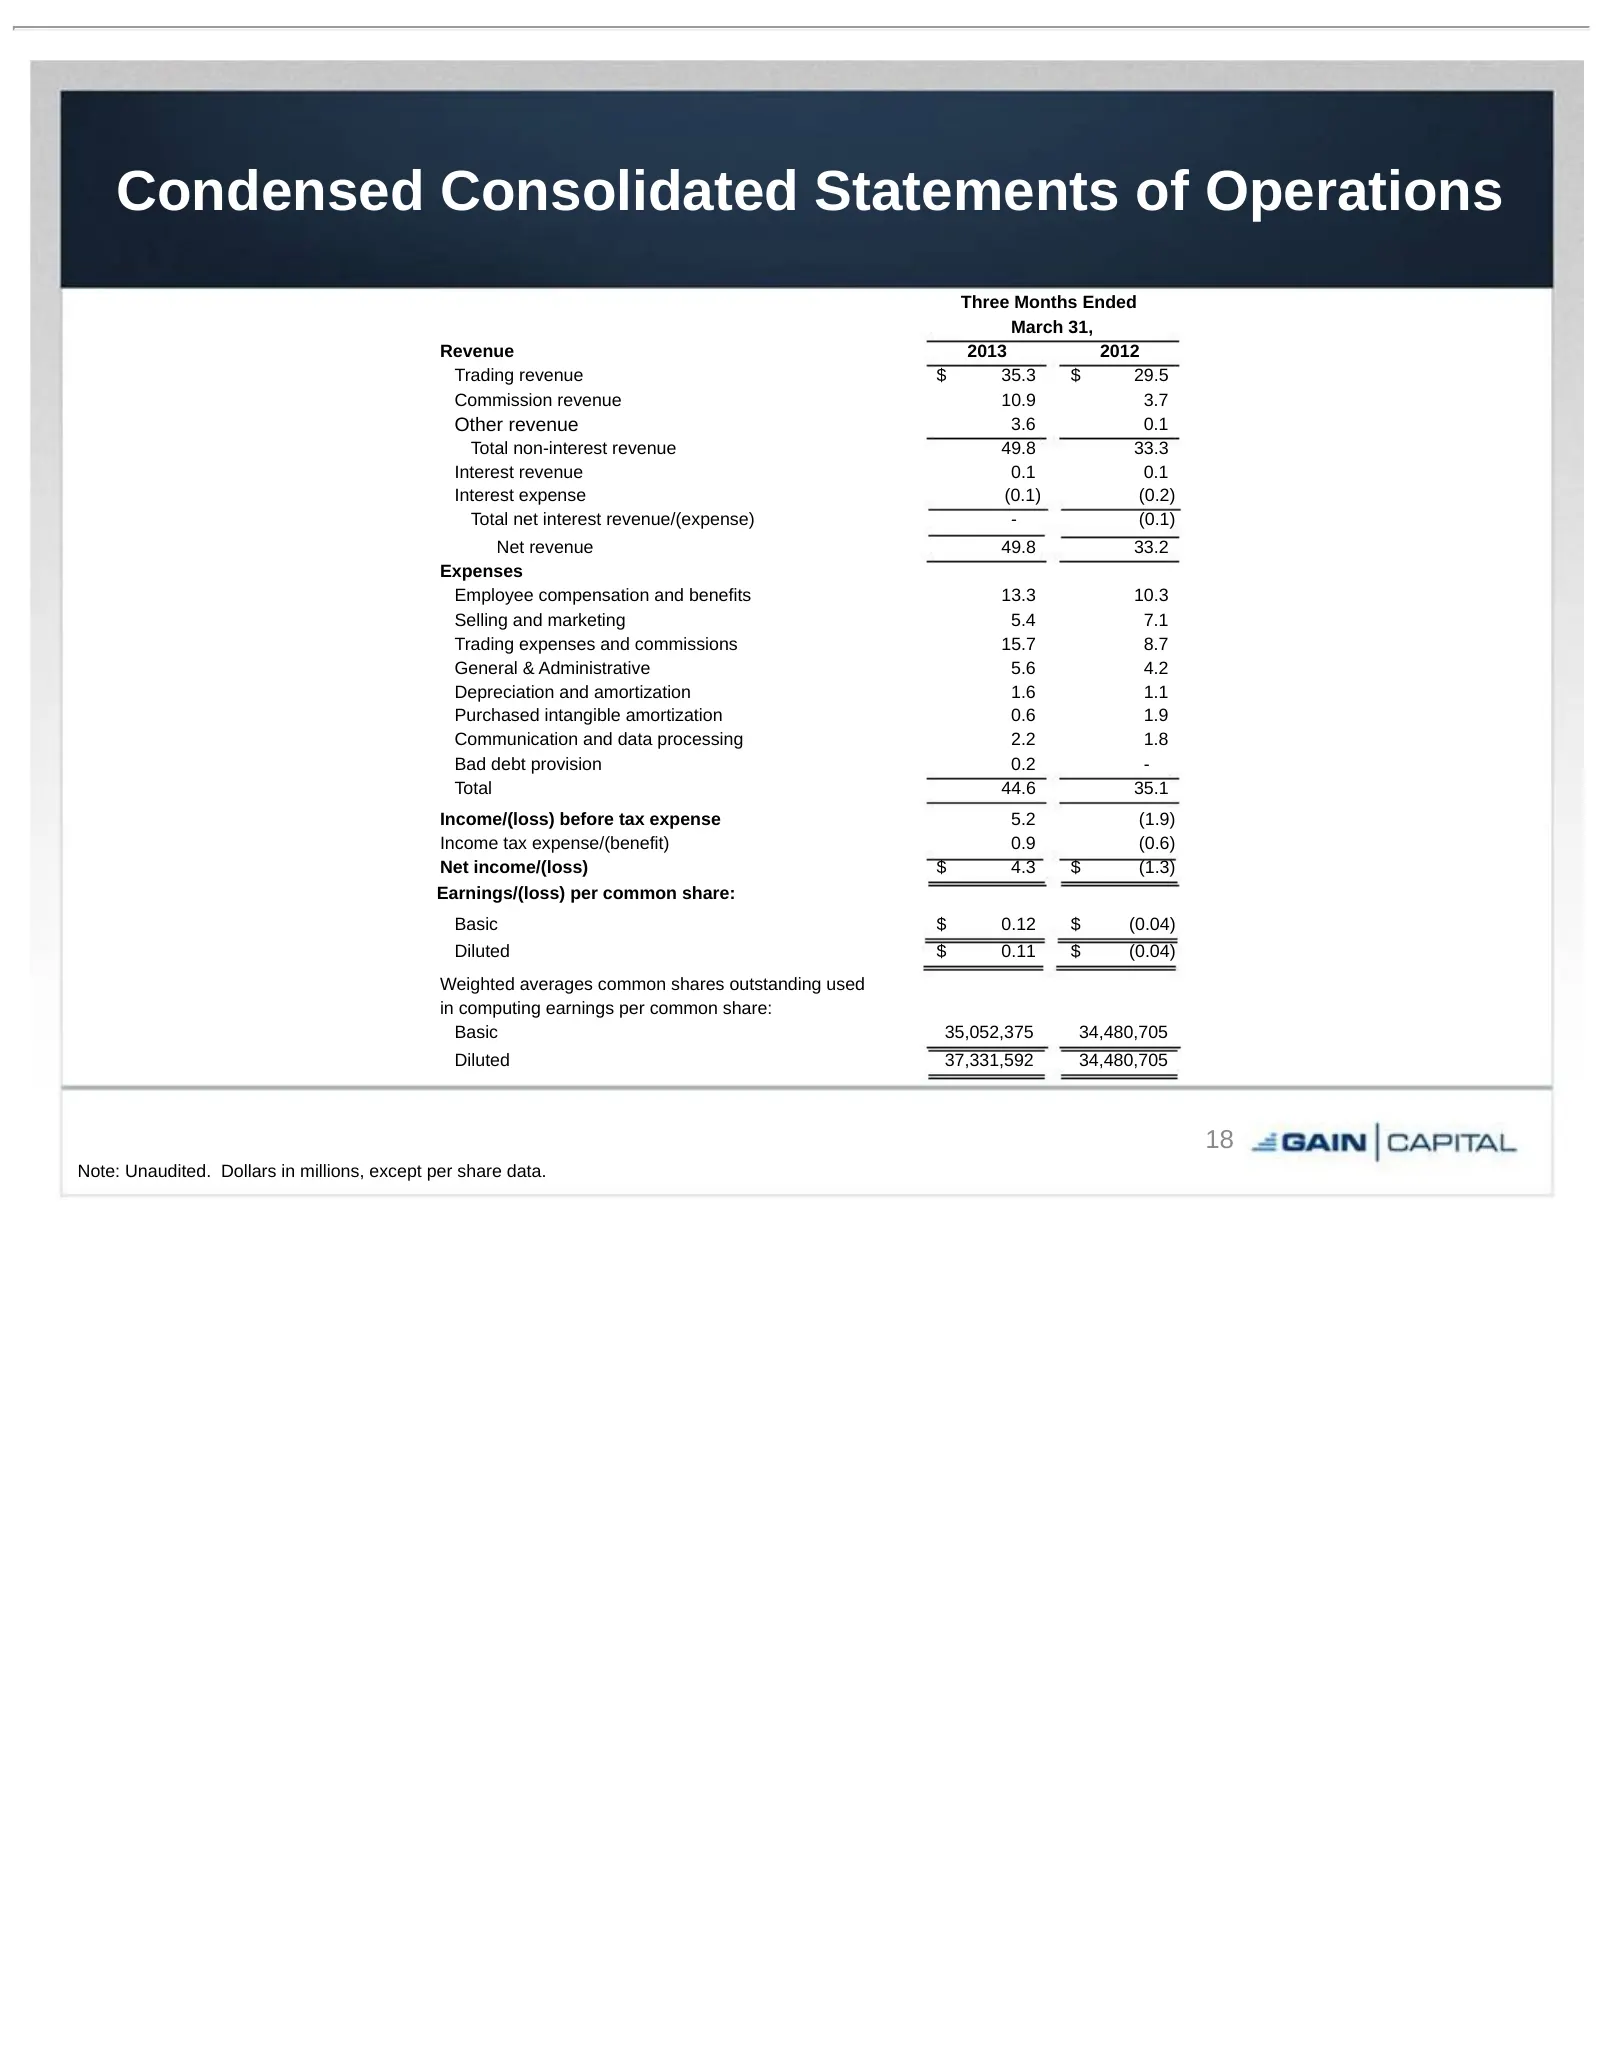
Slide 18: Condensed Consolidated Statements of Operations
Condensed Consolidated Statements of Operations Three Months Ended March 31, Revenue 2013 2012 Trading revenue $ 35.3 $ 29.5 Commission revenue 10.9 3.7 Other revenue 3.6 0.1 Total non-interest revenue 49.8 33.3 Interest revenue 0.1 0.1 Interest expense (0.1) (0.2) Total net interest revenue/(expens
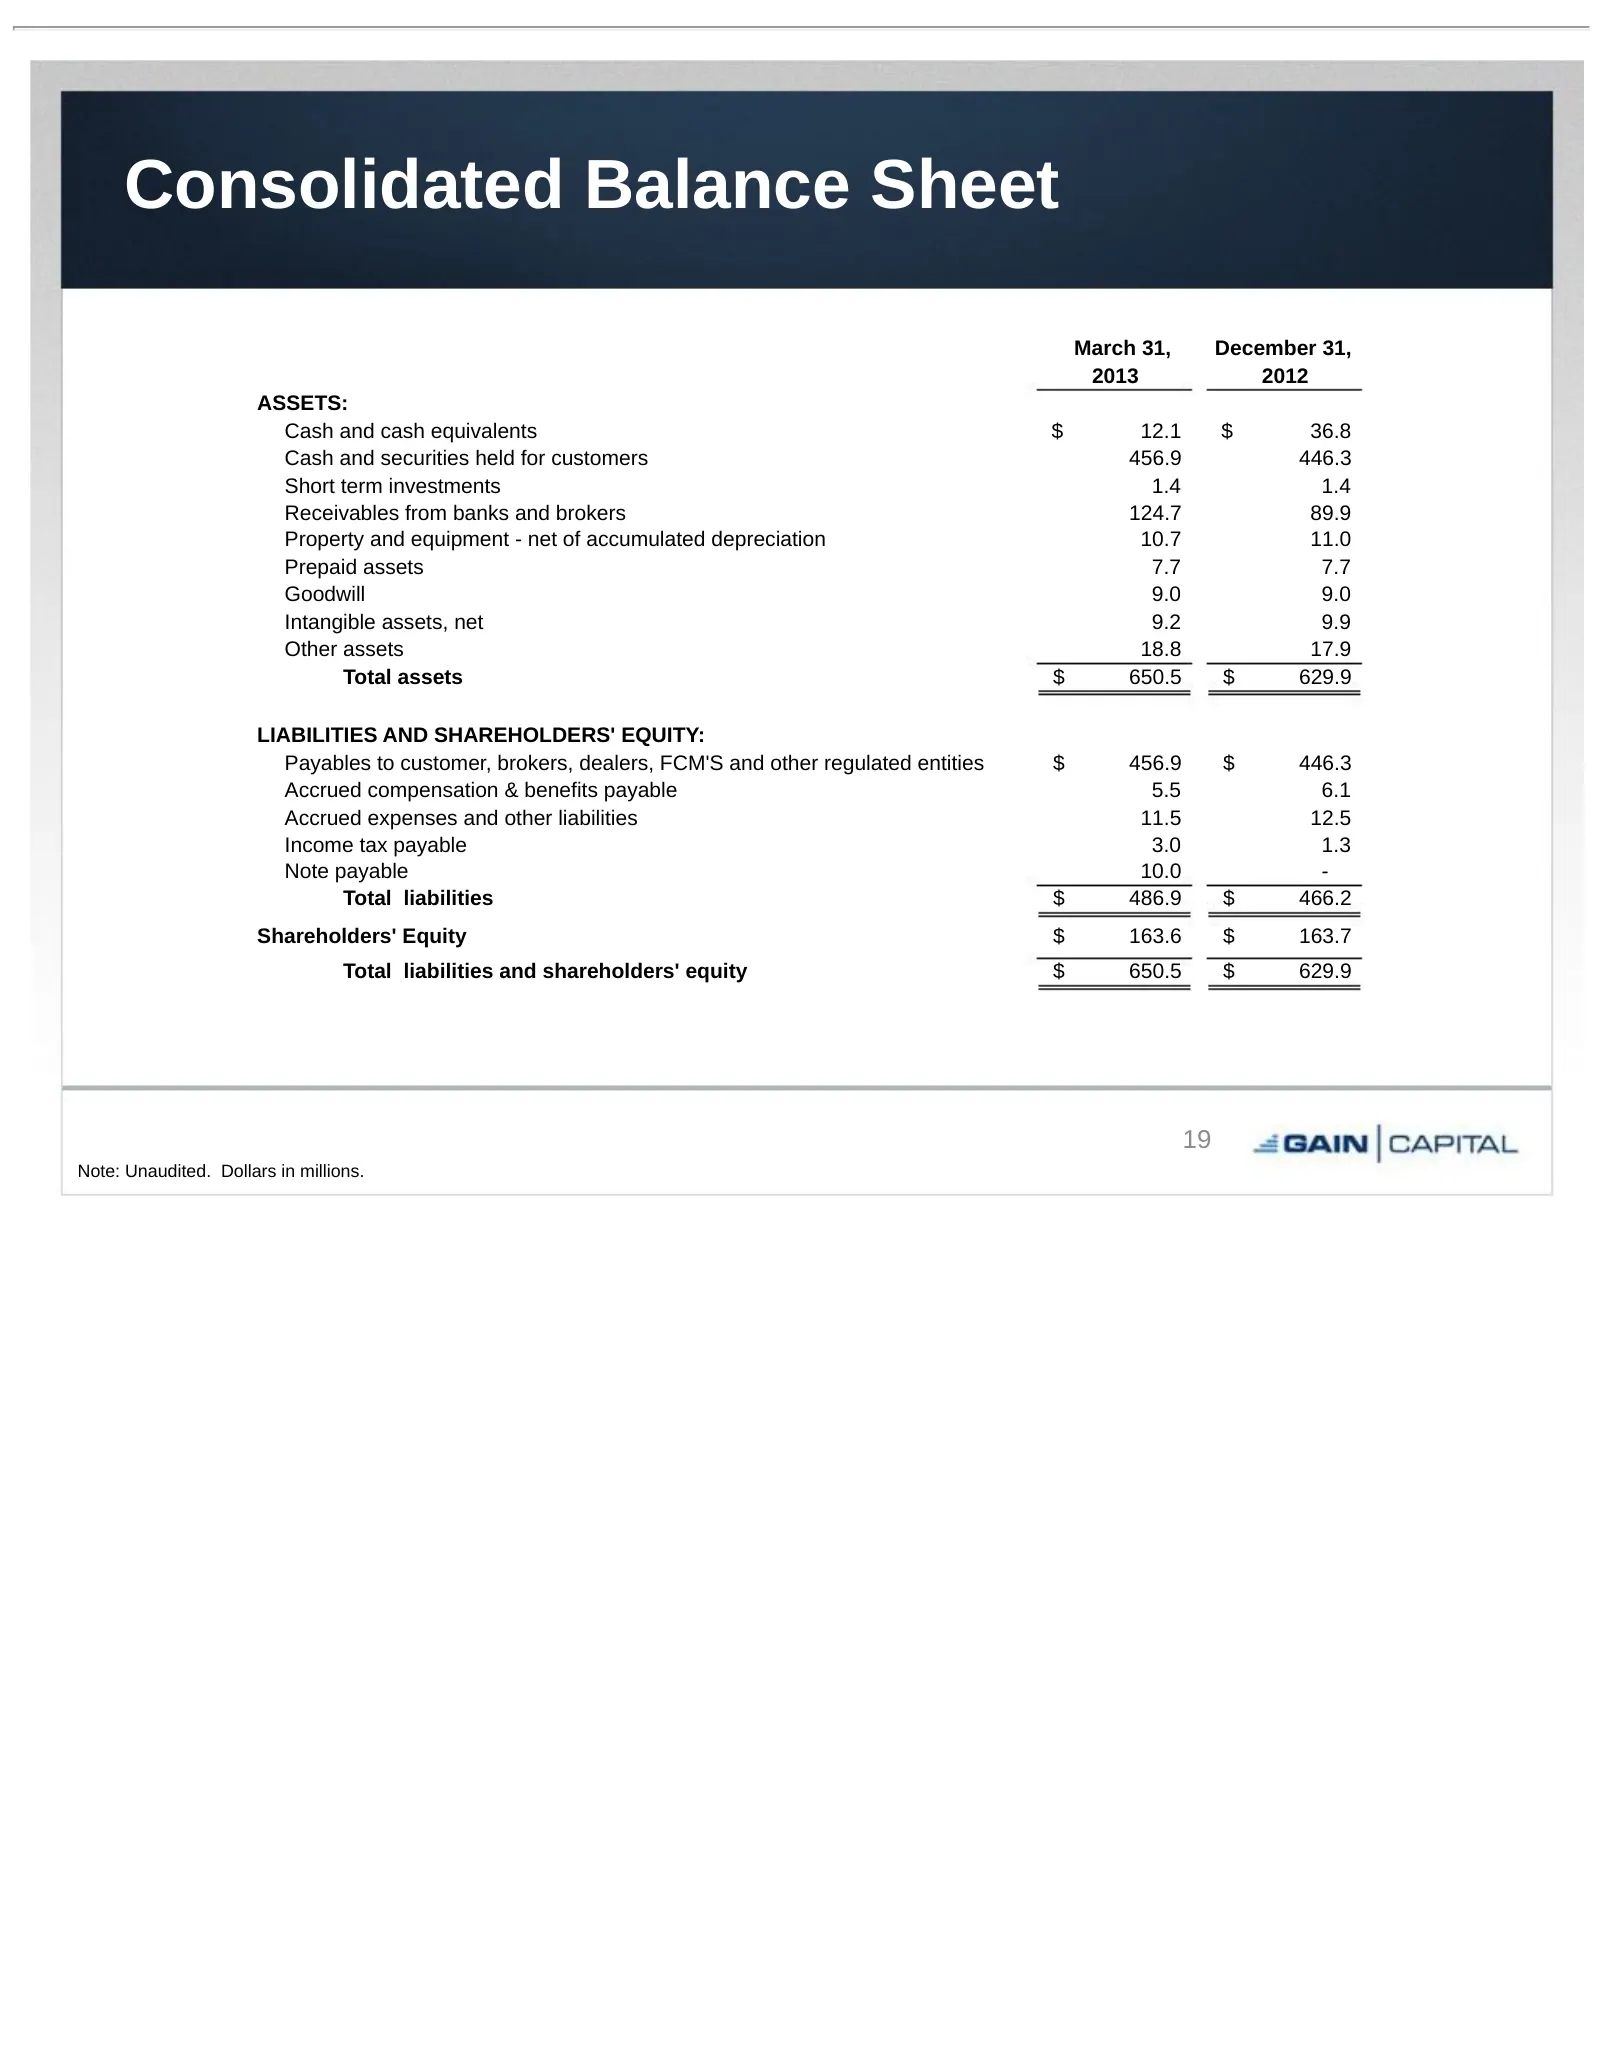
Slide 19: Consolidated Balance Sheet
Consolidated Balance Sheet March 31, December 31, 2013 2012 ASSETS: Cash and cash equivalents $ 12.1 $ 36.8 Cash and securities held for customers 456.9 446.3 Short term investments 1.4 1.4 Receivables from banks and brokers 124.7 89.9 Property and equipment - net of accumulated depreciation 10.7 11
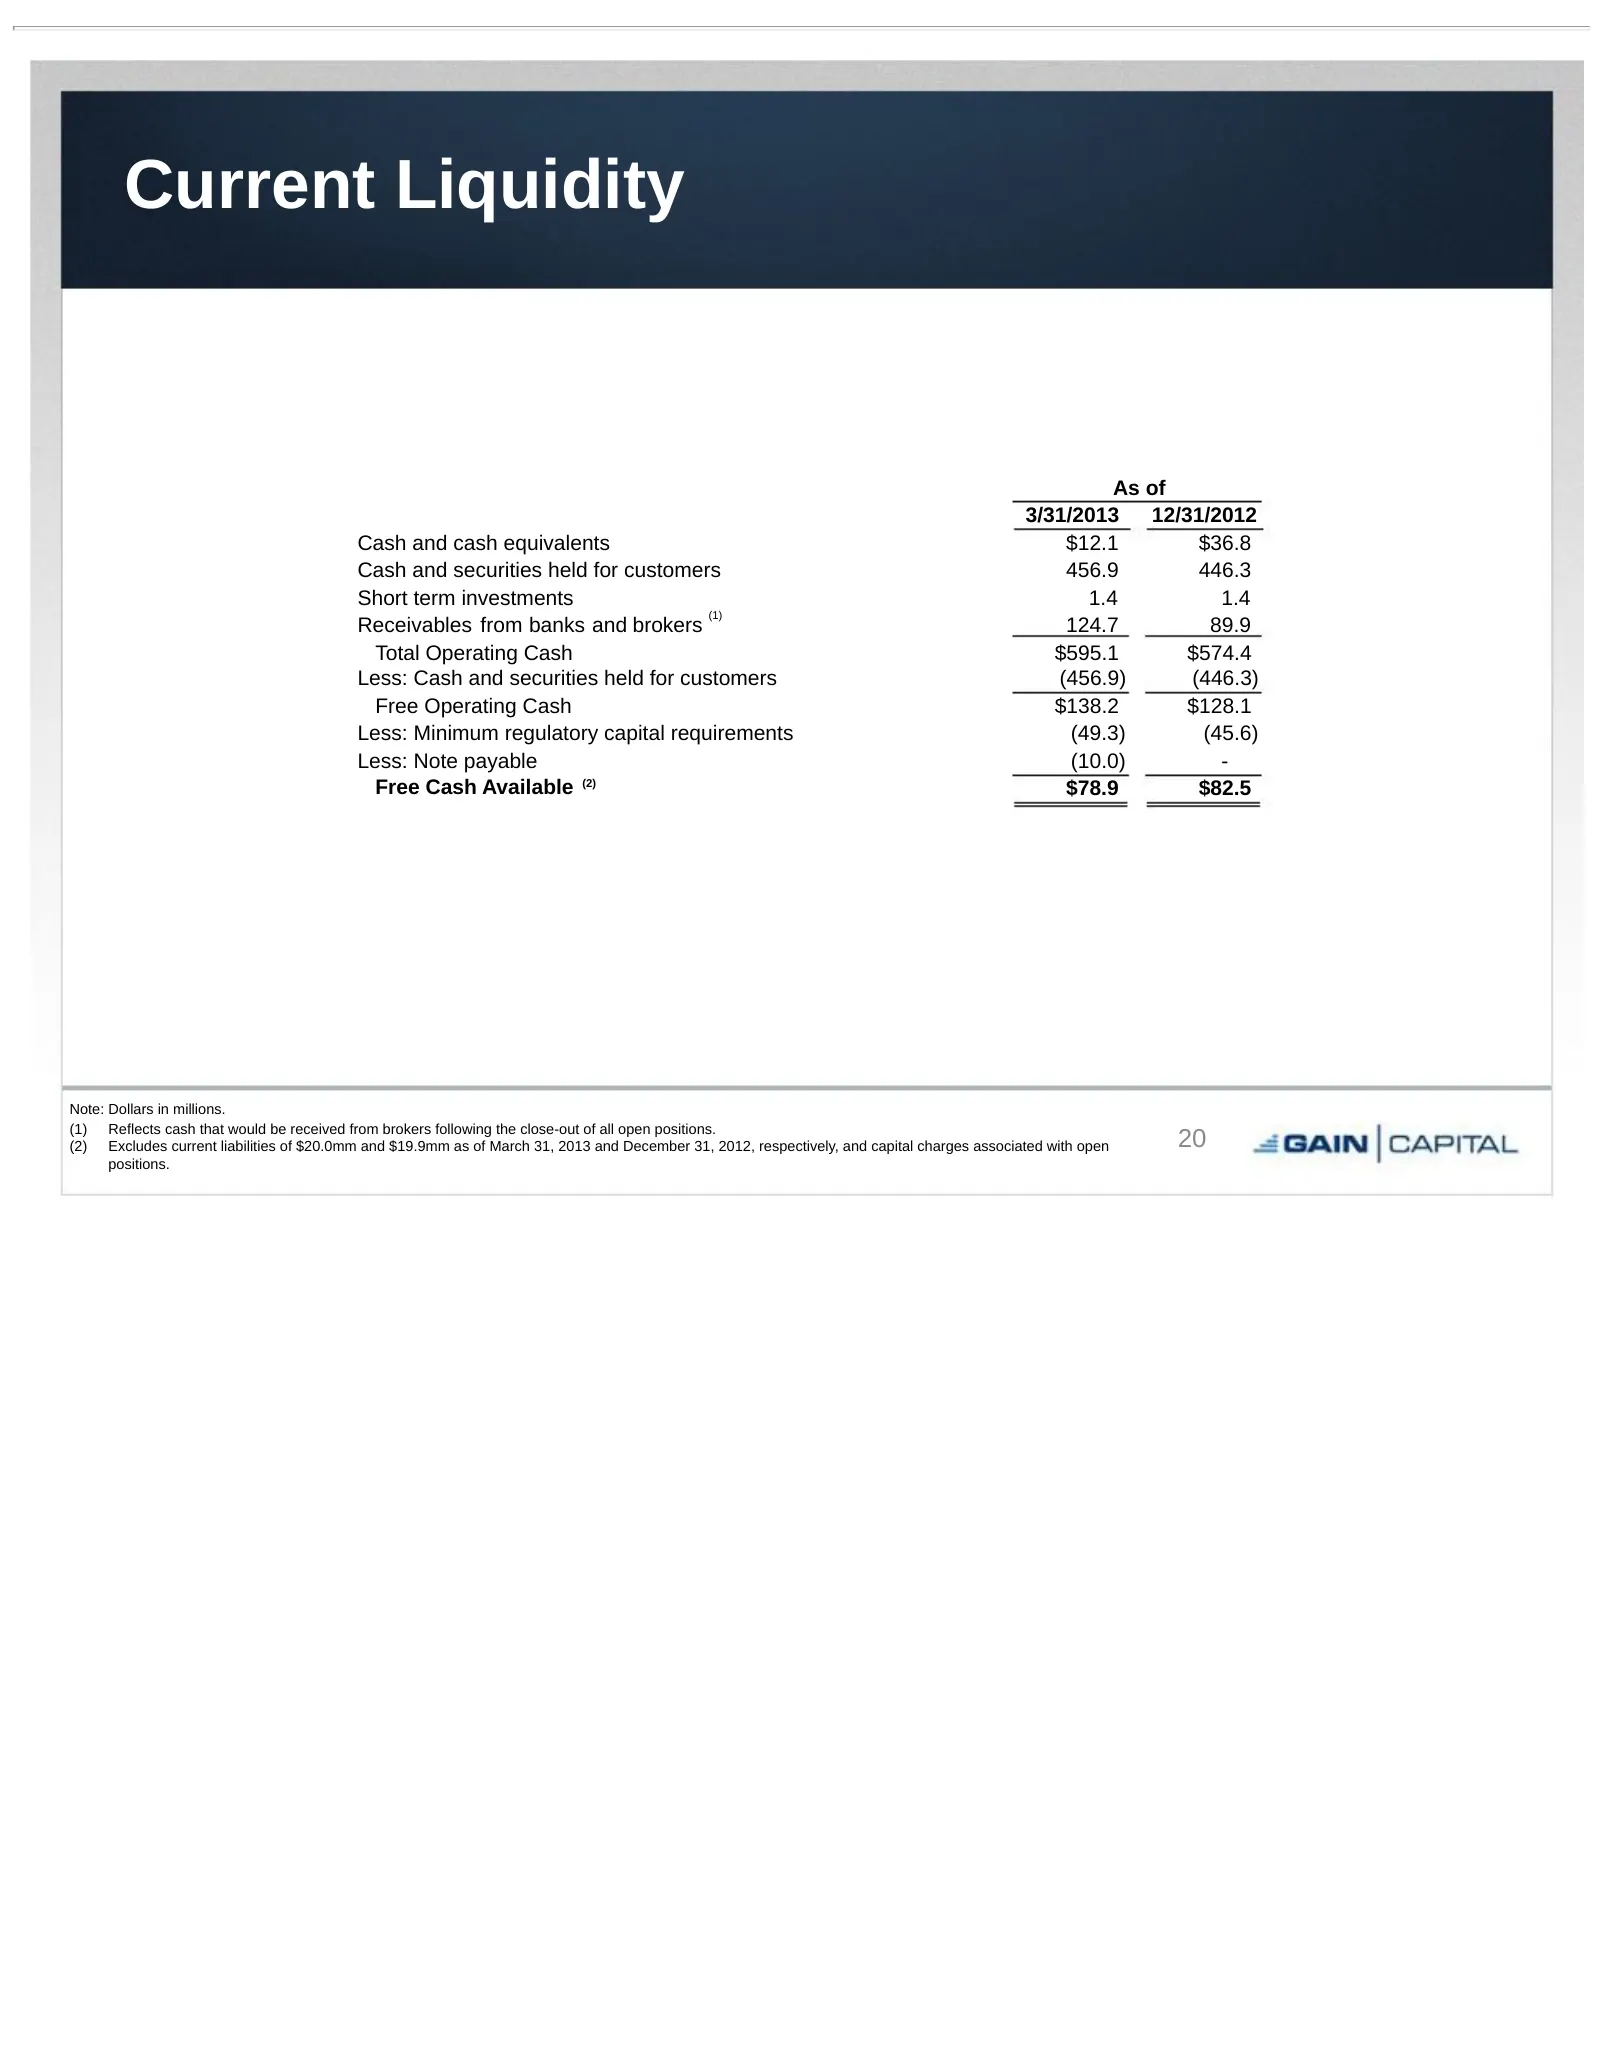
Slide 20: Current Liquidity
Current Liquidity As of 3/31/2013 12/31/2012 Cash and cash equivalents $12.1 $36.8 Cash and securities held for customers 456.9 446.3 Short term investments 1.4 1.4 (1) Receivables from banks and brokers 124.7 89.9 Total Operating Cash $595.1 $574.4 Less: Cash and securities held for customers (456.
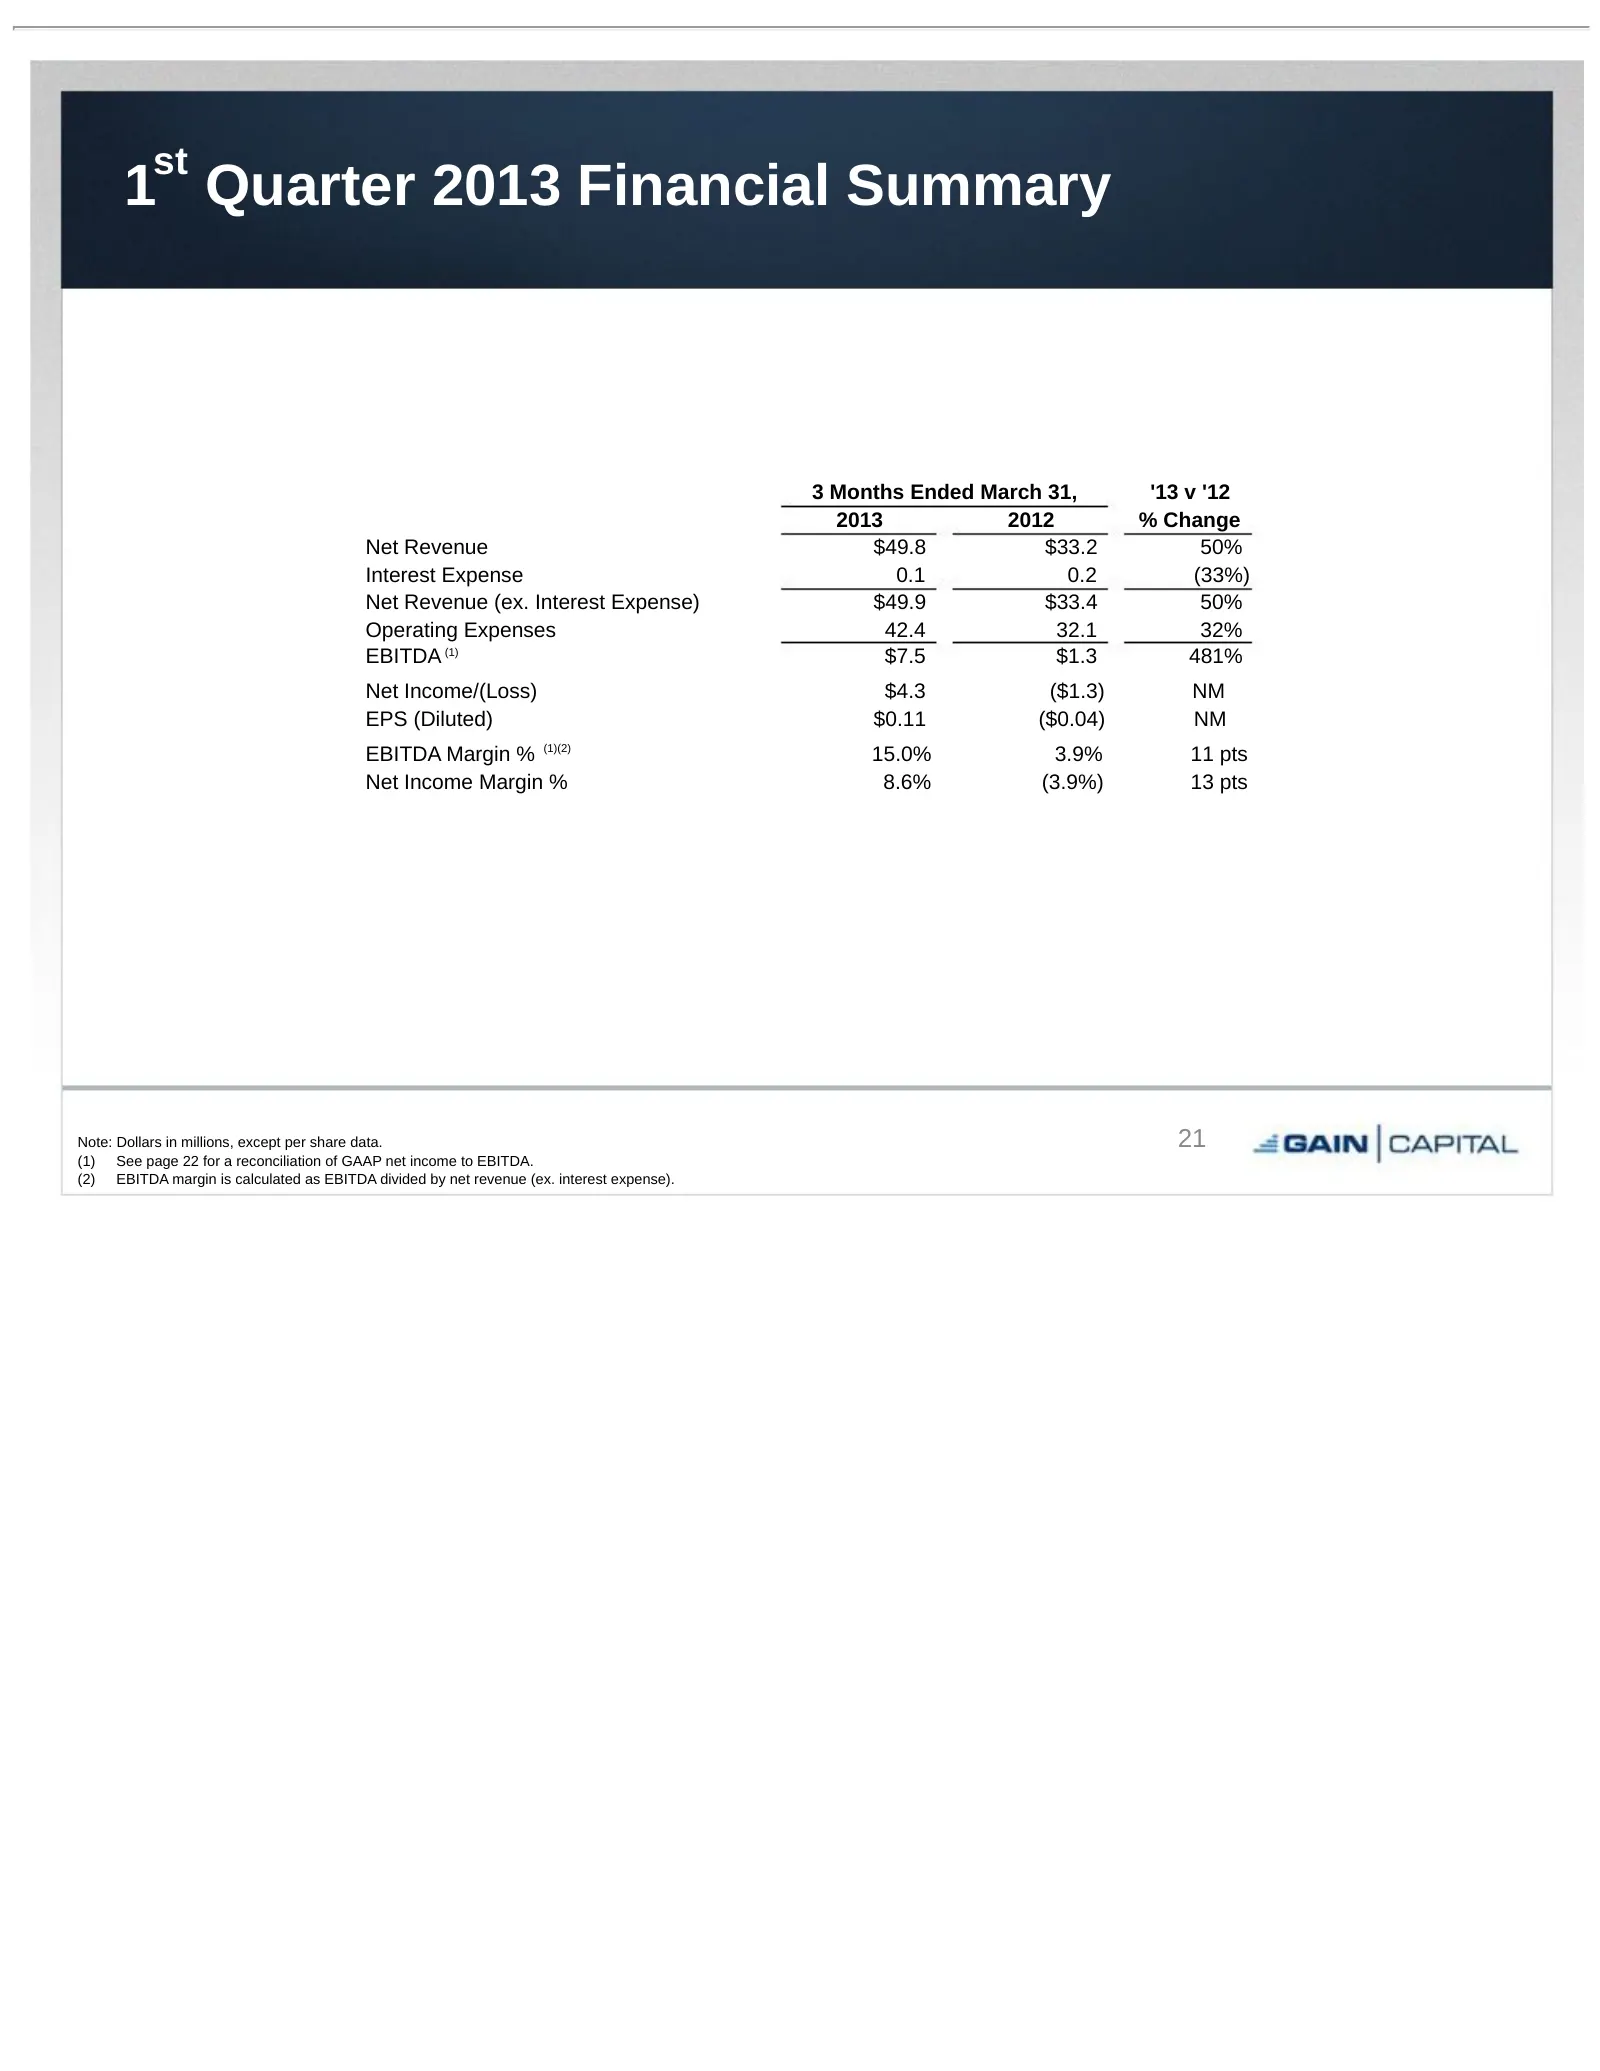
Slide 21: 1st Quarter 2013 Financial Summary
st 1 Quarter 2013 Financial Summary 3 Months Ended March 31, '13 v '12 2013 2012 % Change Net Revenue $49.8 $33.2 50% Interest Expense 0.1 0.2 (33%) Net Revenue (ex. Interest Expense) $49.9 $33.4 50% Operating Expenses 42.4 32.1 32% EBITDA (1) $7.5 $1.3 481% Net Income/(Loss) $4.3 ($1.3) NM EPS (Dil
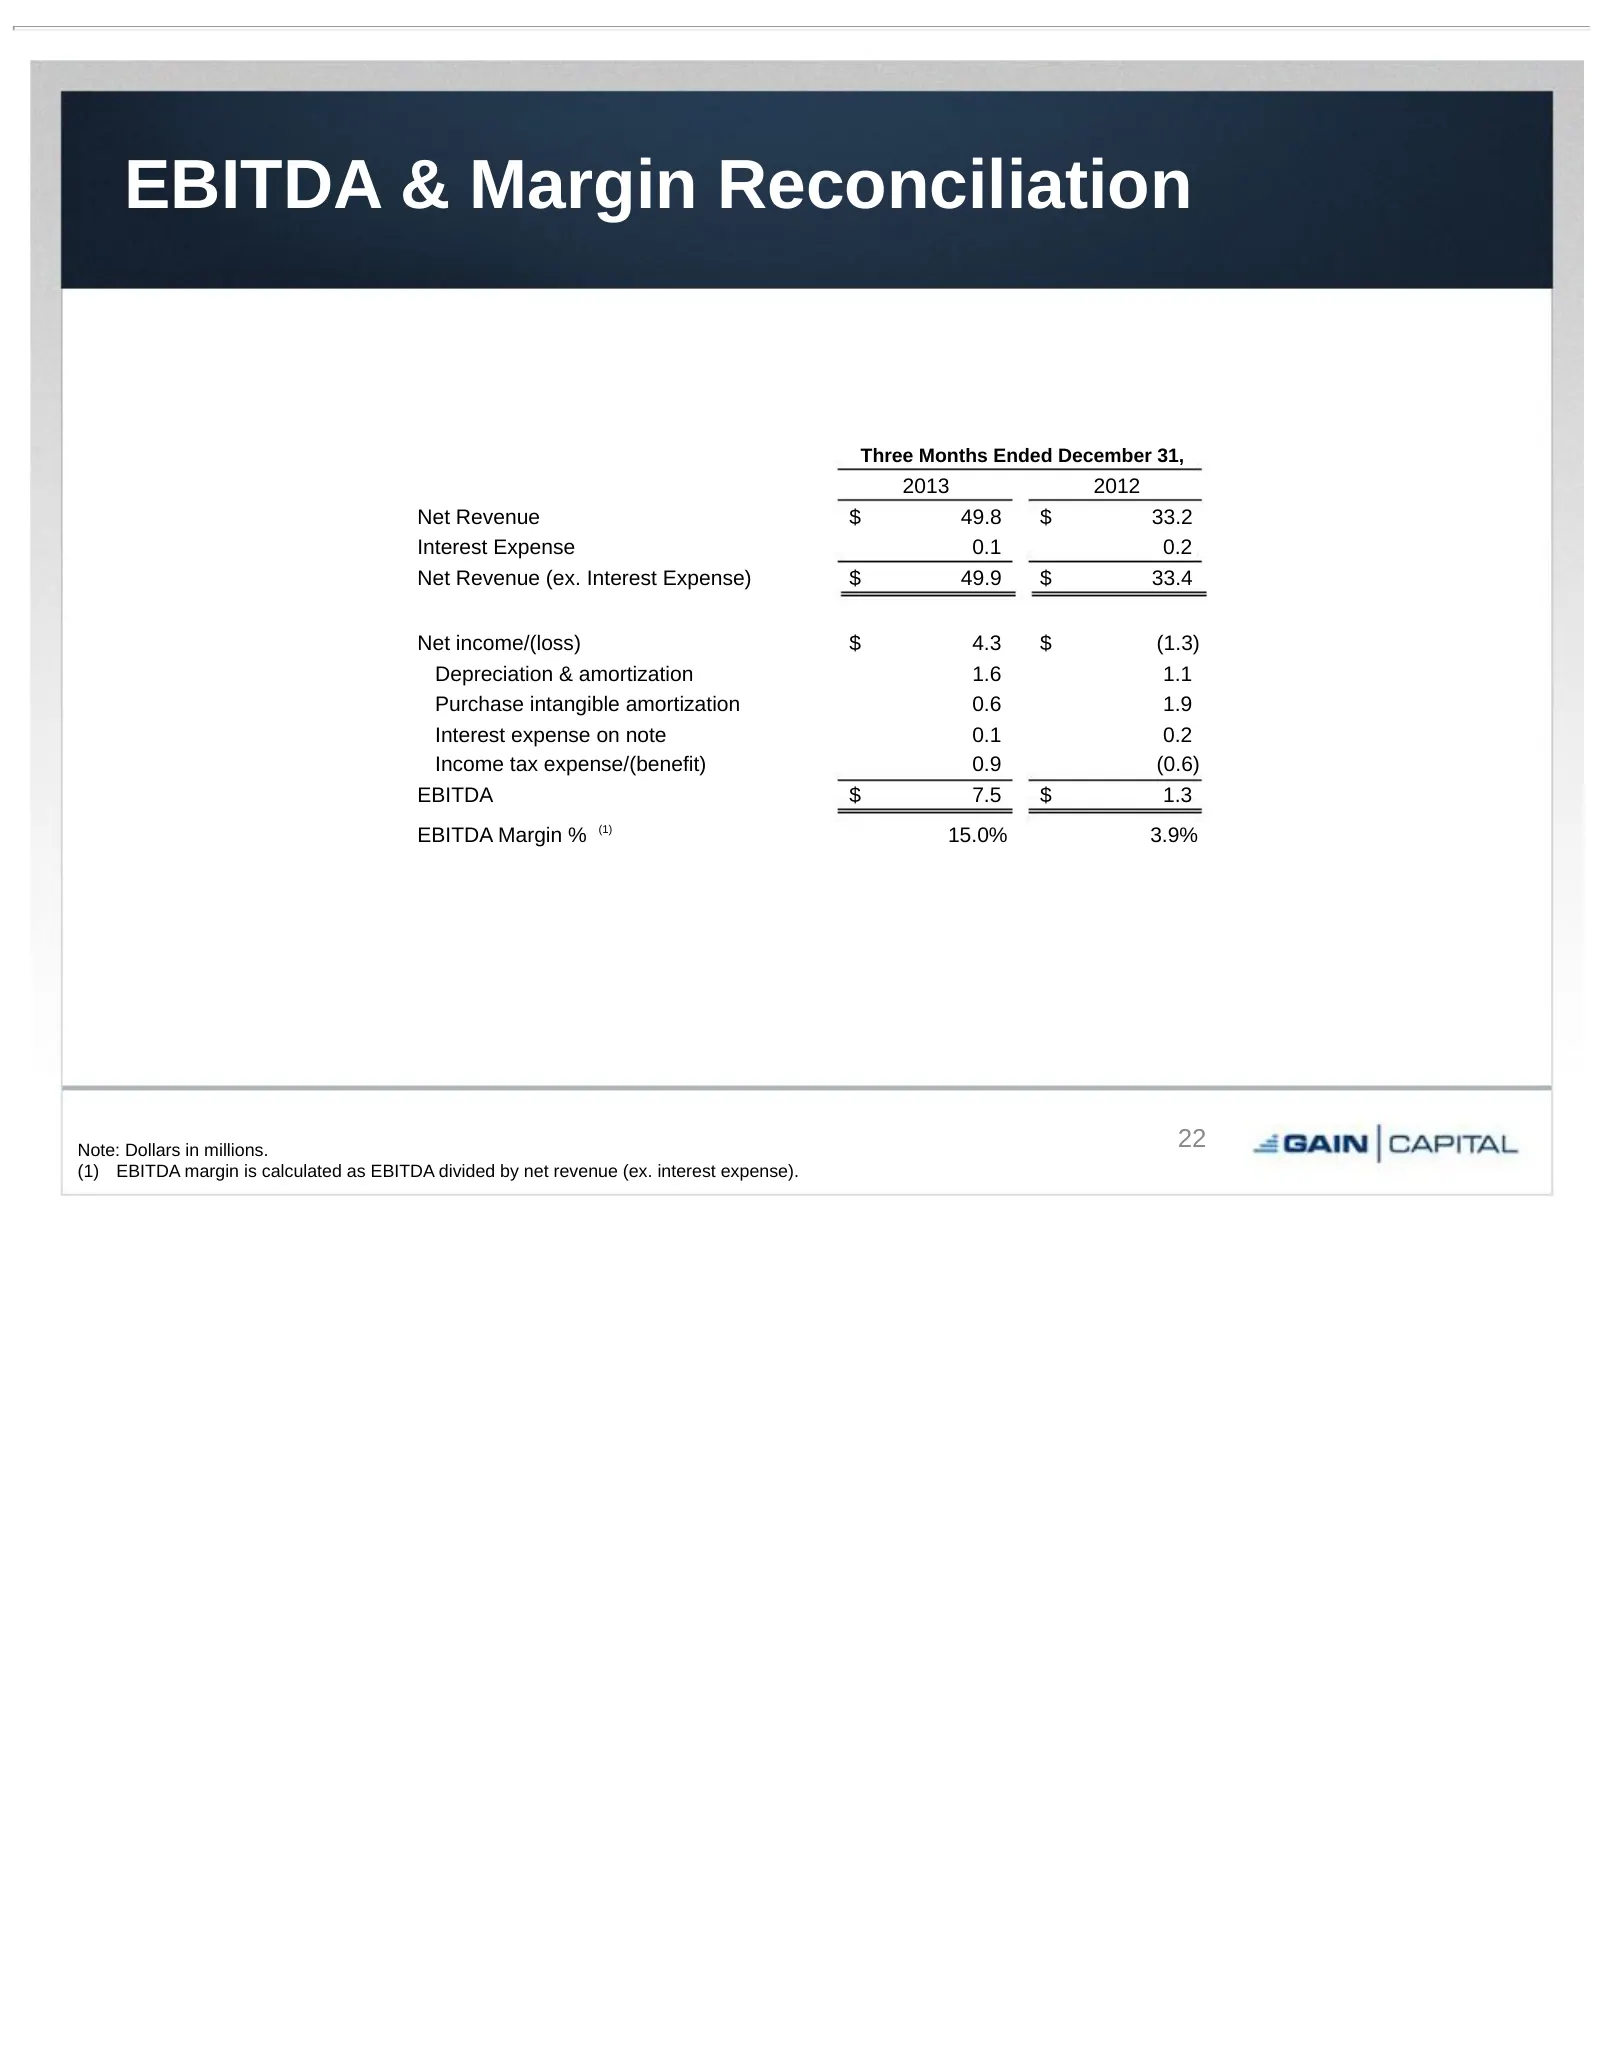
Slide 22: EBITDA & Margin Reconciliation
EBITDA & Margin Reconciliation Three Months Ended December 31, 2013 2012 Net Revenue $ 49.8 $ 33.2 Interest Expense 0.1 0.2 Net Revenue (ex. Interest Expense) $ 49.9 $ 33.4 Net income/(loss) $ 4.3 $ (1.3) Depreciation & amortization 1.6 1.1 Purchase intangible amortization 0.6 1.9 Interest expense o
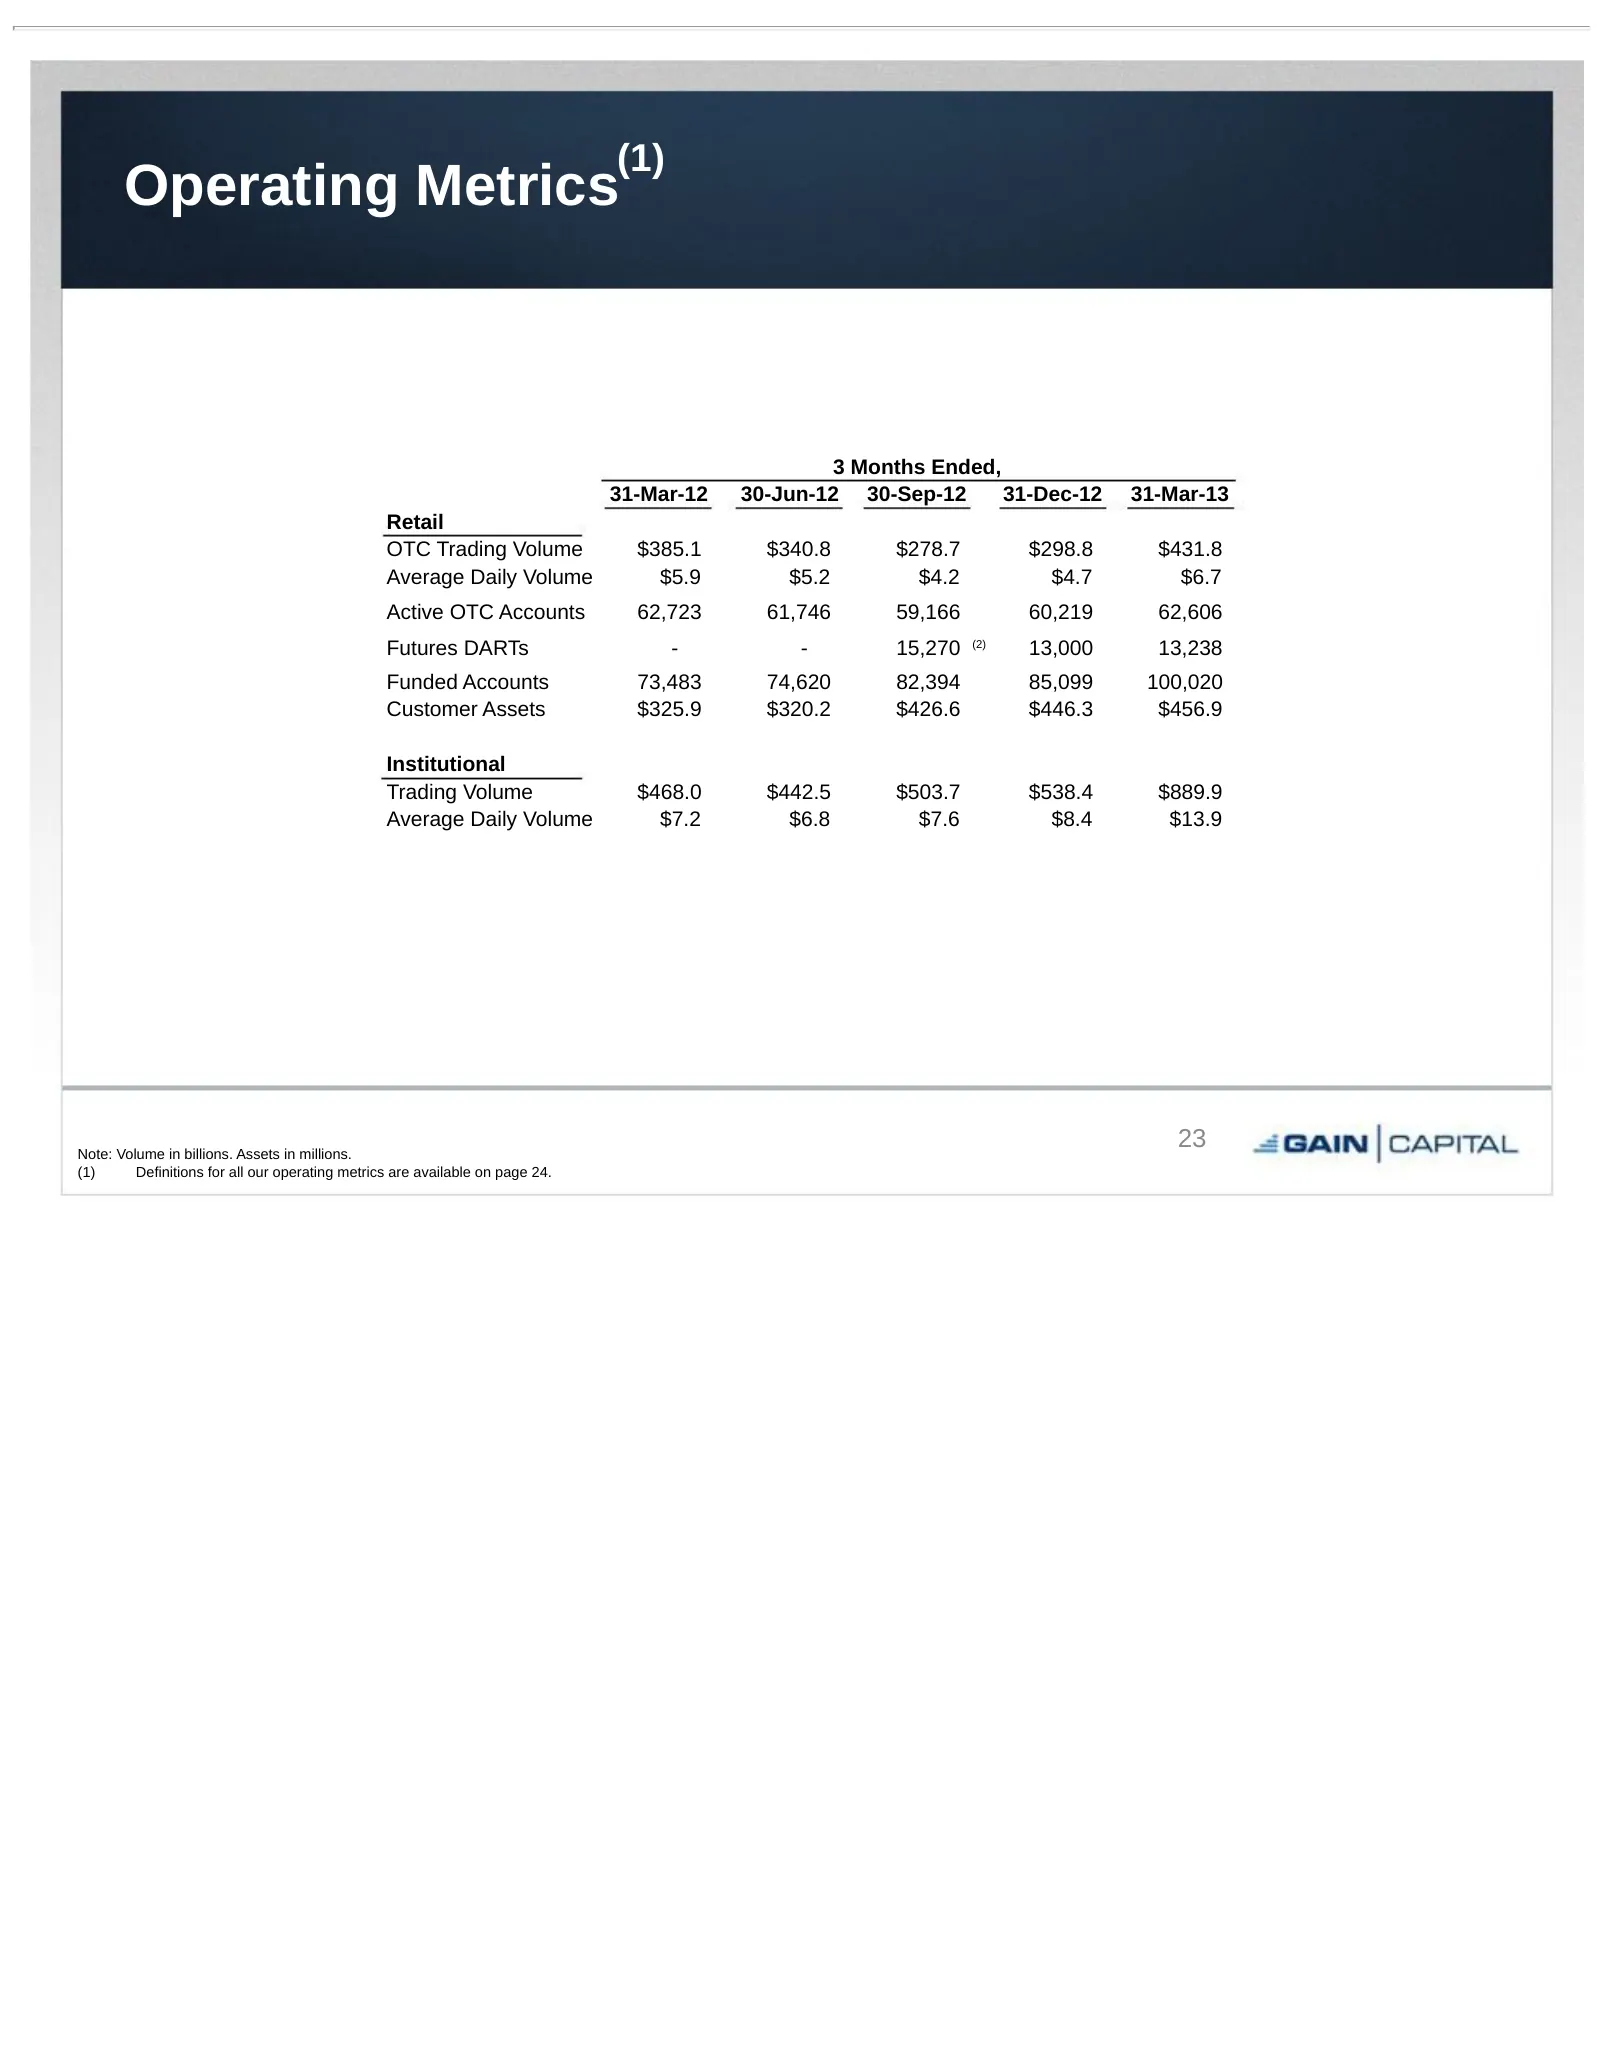
Slide 23: Operating Metrics
(1) Operating Metrics 3 Months Ended, 31-Mar-12 30-Jun-12 30-Sep-12 31-Dec-12 31-Mar-13 Retail OTC Trading Volume $385.1 $340.8 $278.7 $298.8 $431.8 Average Daily Volume $5.9 $5.2 $4.2 $4.7 $6.7 Active OTC Accounts 62,723 61,746 59,166 60,219 62,606 Futures DARTs - - 15,270 (2) 13,000 13,238 Funded
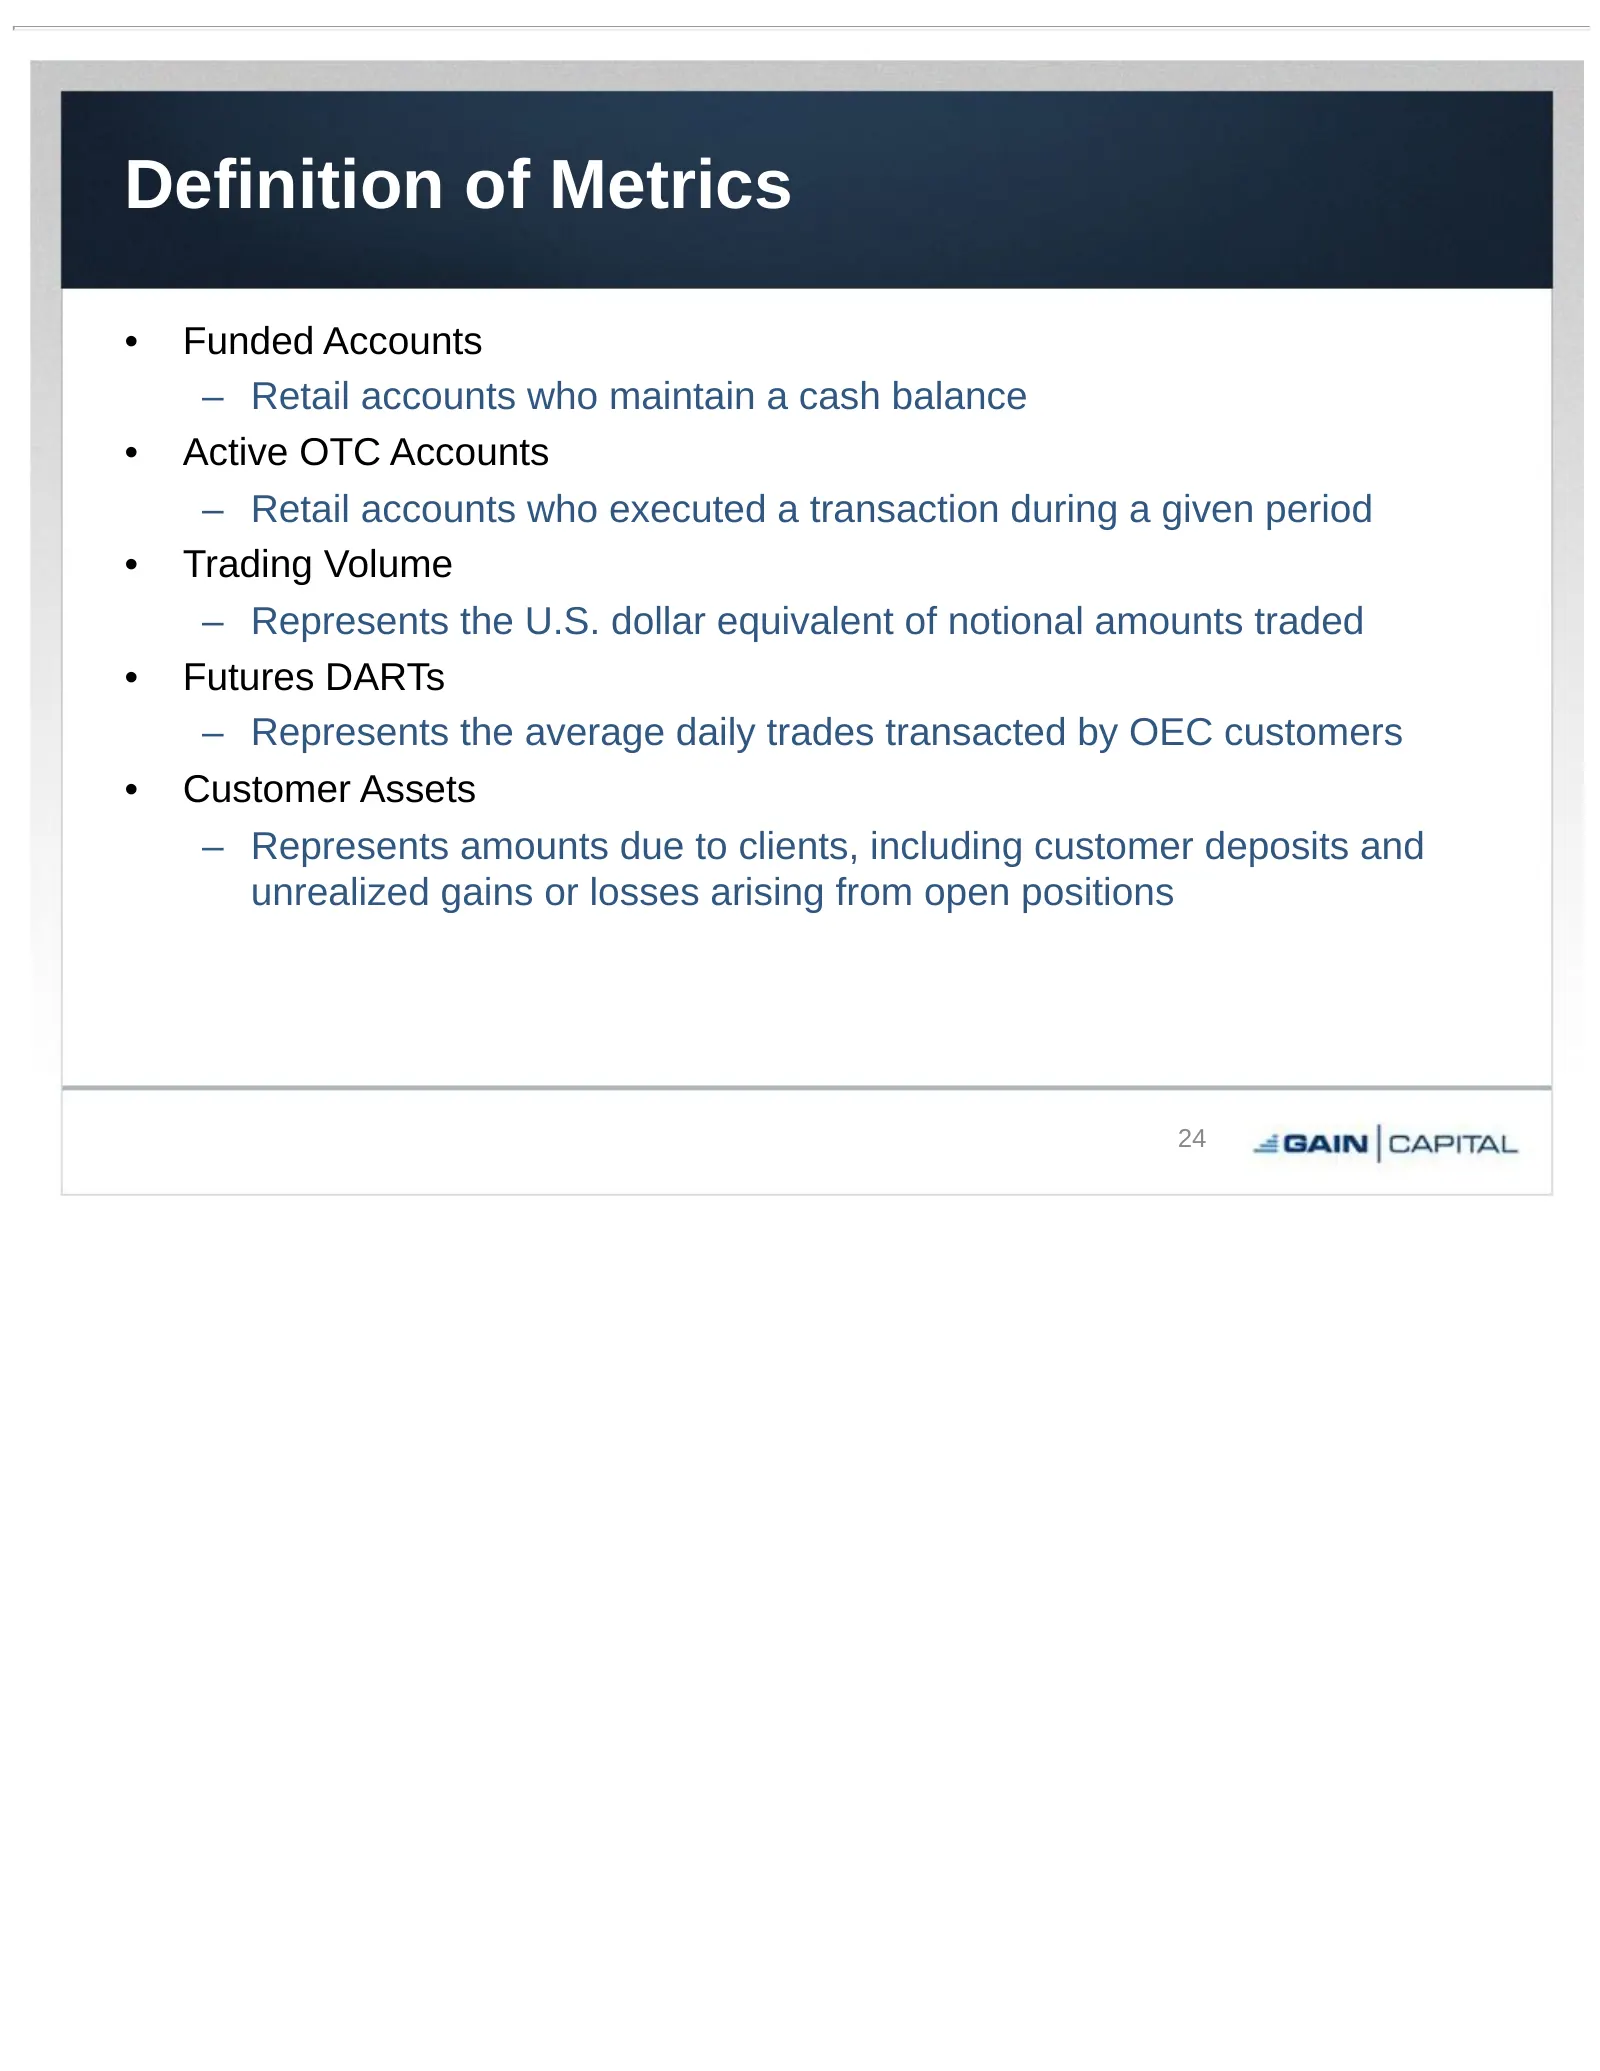
Slide 24: Definition of Metrics
Definition of Metrics • Funded Accounts – Retail accounts who maintain a cash balance • Active OTC Accounts – Retail accounts who executed a transaction during a given period • Trading Volume – Represents the U.S. dollar equivalent of notional amounts traded • Futures DARTs – Represents the average
Slide 25: 1st Quarter 2013 Financial and Operating Results
st 1 Quarter 2013 Financial and Operating Results May 7, 2013
Source: SEC EDGAR · 8-K filed May 7, 2013
More decks from GAIN Capital Holdings Inc
 Q2 2020 Earnings Presentation24 slides · Jul 23, 2020
 Merger or Acquisition (May 2020)10 slides · May 15, 2020
 Q1 2020 Earnings Presentation25 slides · Apr 23, 2020
 FY2019 Earnings Presentation35 slides · Feb 27, 2020
 Q3 2019 Earnings Presentation32 slides · Oct 25, 2019
 Q2 2019 Earnings Presentation33 slides · Jul 25, 2019