James River Coal — New York Coal Trade Association Conference 2009
38 slides from James River Coal's conference presentation, Mar 10, 2009

Slide 1: New York Coal Trade Association
New York Coal Trade Association Peter T Socha March 6, 2009
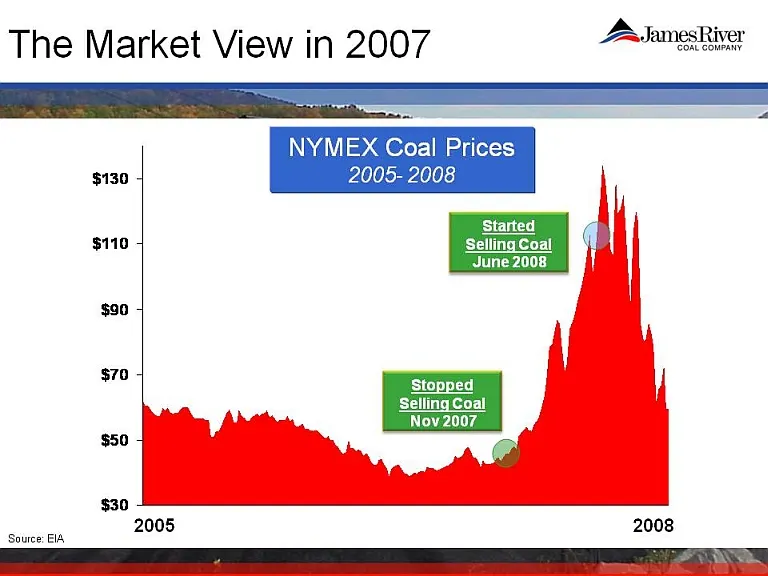
Slide 2: The Market View in 2007: NYMEX Coal Prices 2005-2008
The Market View in 2007 NYMEX Coal Prices2005-2008 Started Selling Coal June 2008 Stopped Selling Coal Nov 2007 $130 $110 $90 $70 $50 $30 2005 2008
Slide 3: What We Saw in 2007…..What We See Today
What We Saw in 2007…..What We See Today
Slide 4: Agenda
Agenda ●Our Pricing Model ●The Market View in 2007 ●The Market View in 2009 ●Things We Are Watching ●Our Strategy
Slide 5: Our Pricing Model
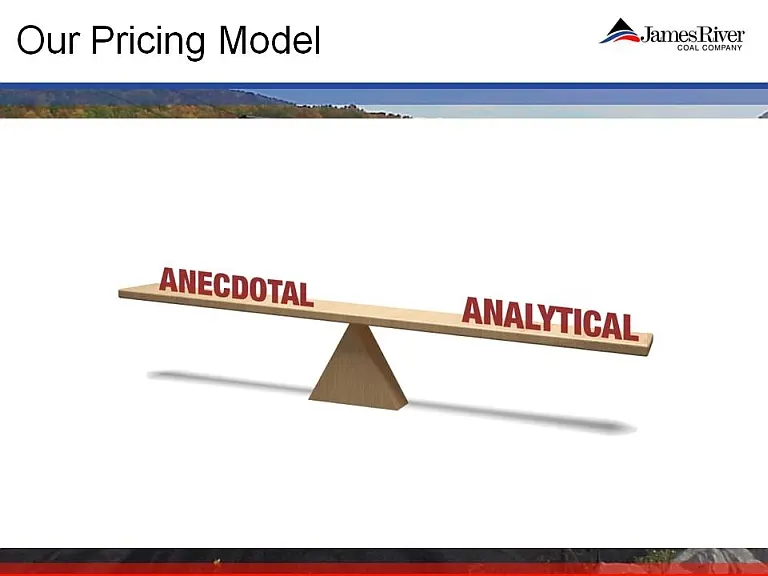
Our Pricing Model Anecdotal Analytical
Slide 6: Our Pricing Model: Anecdotal
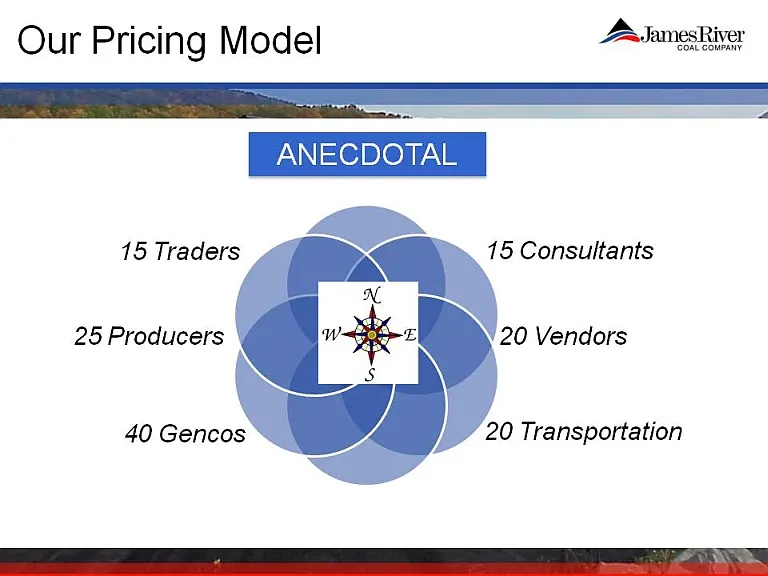
Our Pricing Model ANECDOTA: 15 Traders 25 Producers 40 Gencos15 Consultants 20 Vendors20 Transportation
Slide 7: Our Pricing Model: Analytical
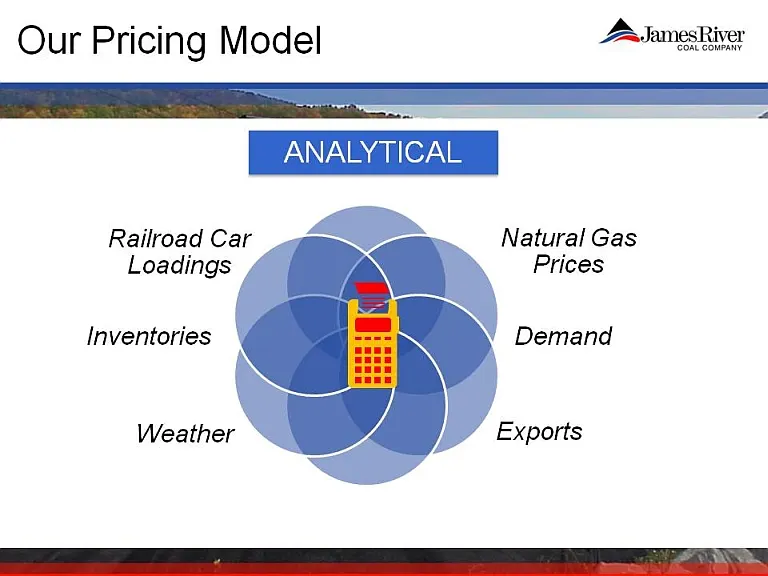
Our Pricing Model ANALYTICAL Railroad Car Loadings Inventories Weather Natural Gas Prices Demand Exports
Slide 8: Agenda
Agenda ●Our Pricing Model ●The Market View in 2007●The Market View in 2009 ●Things We Are Watching ●Our Strategy
Slide 9: 2007
The Market View in 2007 ●Supply is Coming Down ●Demand is Going Up ●Exports are Going Up ●Inventories are Adjusting
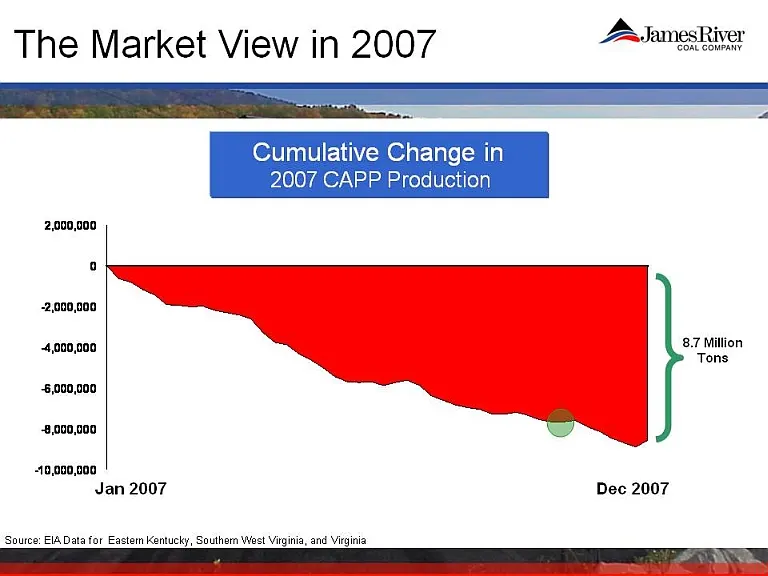
Slide 10: 2007 Cumulative Change CAPP Production
The Market View in 2007 Cumulative Change 2007 CAPP Production 2,000,000 -2,000,000 0 - -6,000,000 -4,000,000 -10,000,000 -8,000,000 Jan 2007 8.7 Million Tons Source: EIA Data for Eastern Kentucky, Southern West Virginia, and Virginia
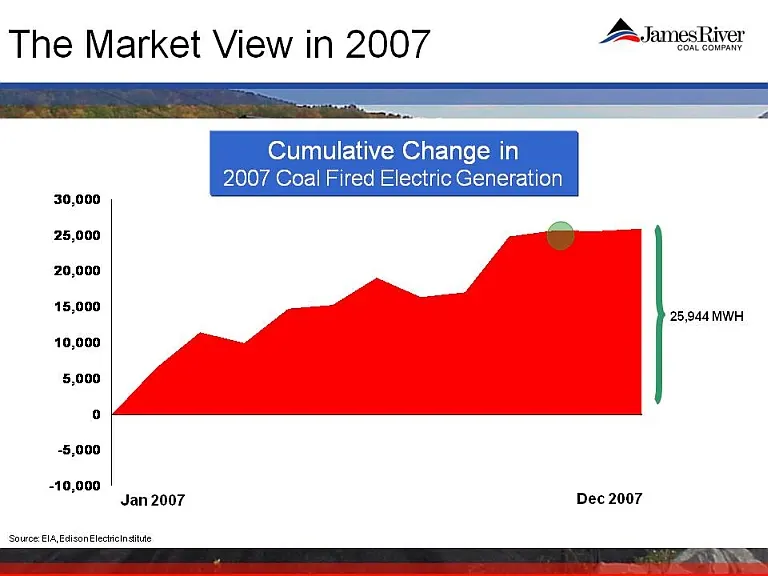
Slide 11: 2007 Cumulative Change in Coal Fired Electric Generation
The Market View in 2007 Cumulative Change in 2007 Coal Fired Electric Generation 25,000 30,000 15,000 20,000 5,000 10,000 -10,000 -5,000 Source: EIA, Edison Electric Institute Jan 2007 Dec 200725,944 MWH
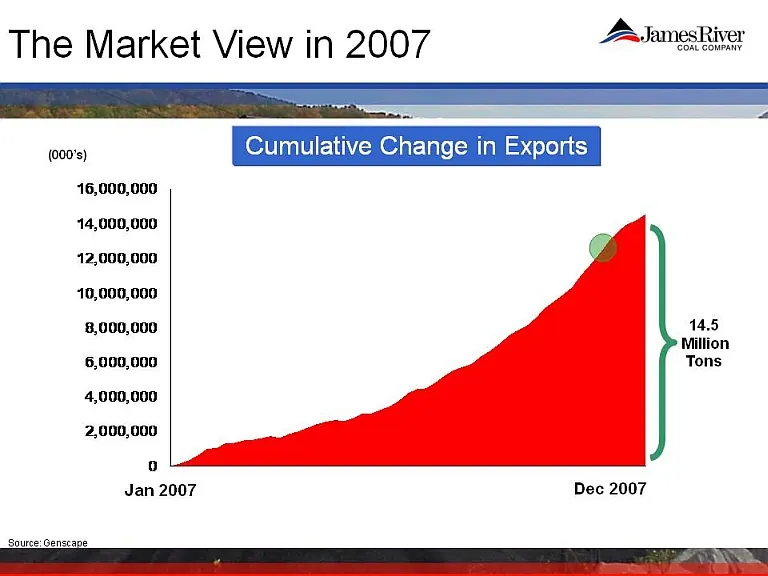
Slide 12: 2007 Cumulative Change in Exports
The Market View in 2007 Cumulative Change in Exports (000’s) 14,000,000 16,000,000 10,000,000 12,000,000 8,000,000 4,000,000 6,000,000 0 2,000,000 14.5 Million Tons Jan 2007 Dec 2007
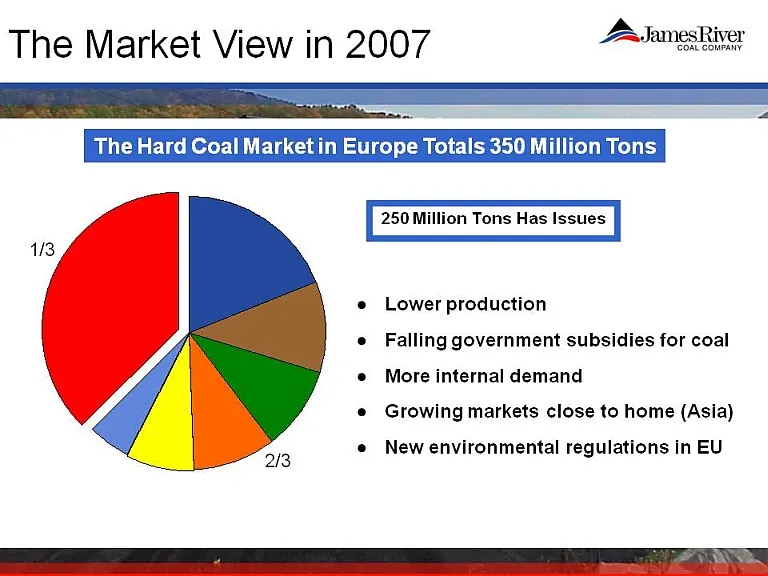
Slide 13: 2007 The Hard Coal Market in Europe
The Market View in 2007 The Hard Coal Market in Europe Totals 350 Million Tons 250 Million Tons Has Issues ●Lower production ●Falling government subsidies for coal ●More internal demand Growing markets close to home (Asia) ●New environmental regulations in EU2/3 1/3
Slide 14: 2007 The Rate of Change in Inventories
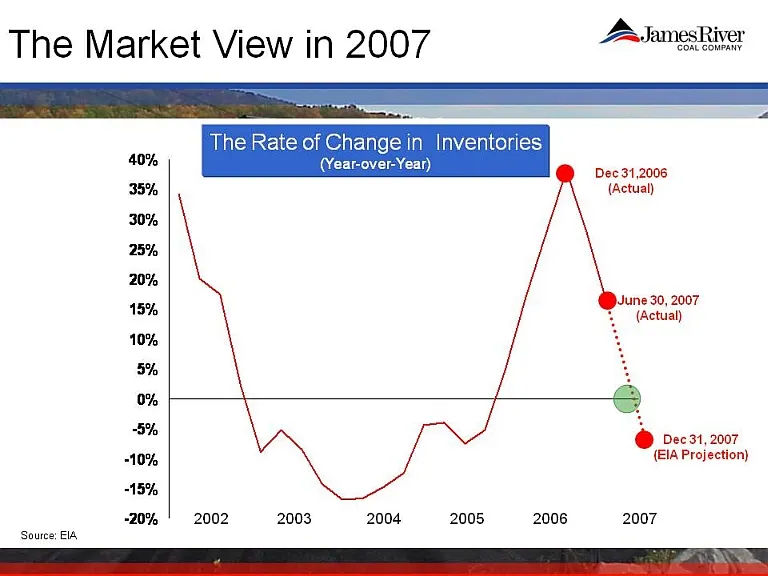
The Market View in 2007 The Rate of Change in Inventories (Year-over-Year)(Year-over-Year) Dec 31, 2006 (Actual) June 30, 2007 (Actual) Dec 31, 2007 (EIA Projection) 2002 2005 2006 2007 2003 2004 40% 30% 35% 25% 15% 20% 0% 5% 10% -10%-5% -15% -20%
Slide 15: 2007 Market Quotes on Steam Coal Exports
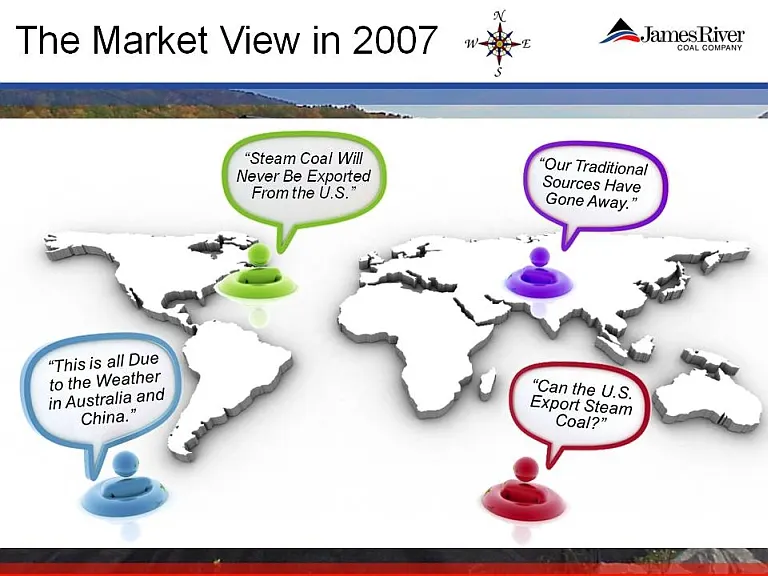
The Market View in 2007 “Steam Coal Will Never Be Exported From the U.S.” “Our Traditional Sources Have Gone Away.” “This is all Due to the Weather in Australia and China.” “Can the U.S. Export Steam Coal”
Slide 16: 2007 Uncommitted 2009 CAPP
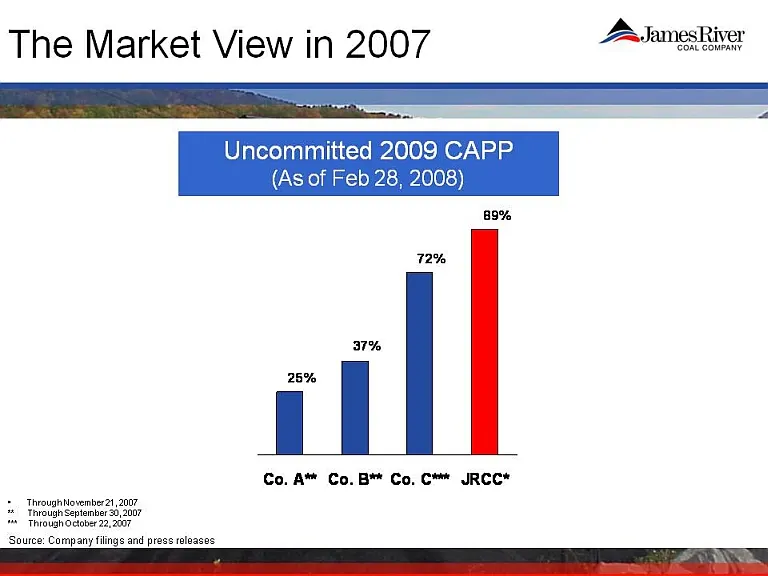
The Market View in 2007 Uncommitted 2009 CAPP(As of Feb 28, 2008) •Through November 21, 2007** Through September 30, 2007*** Through October 22, 2007Source: Company filings and press releases 25% 37% 72% 89% Co. A**Co. B**Co. C***JRCC*
Slide 17: Agenda
Agenda ●Our Pricing Model ●The Market View in 2007 ●The Market View in 2009 ●Things We Are Watching ●Our Strategy
Slide 18: 2009
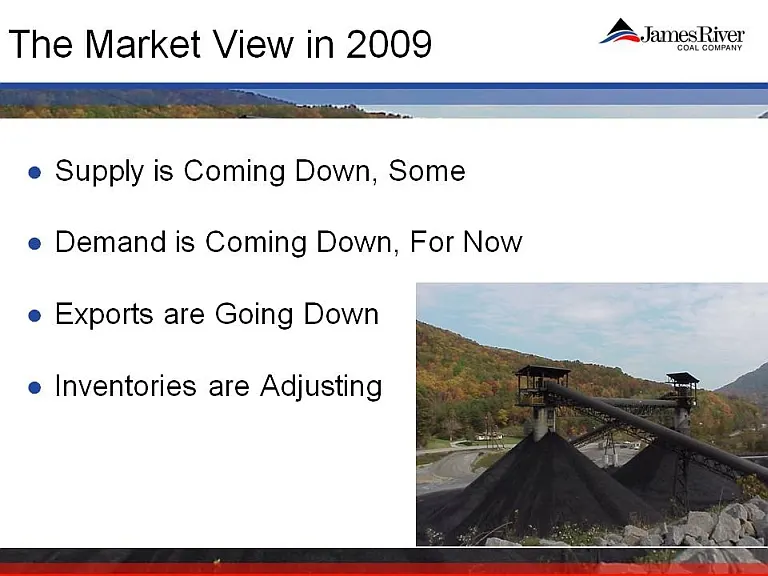
The Market View in 2009 ●Supply is Coming Down, Some Demand is Coming Down, For Now ●Exports are Going Down ●Inventories are Adjusting
Slide 19: 2009 Cumulative Change CAPP Production
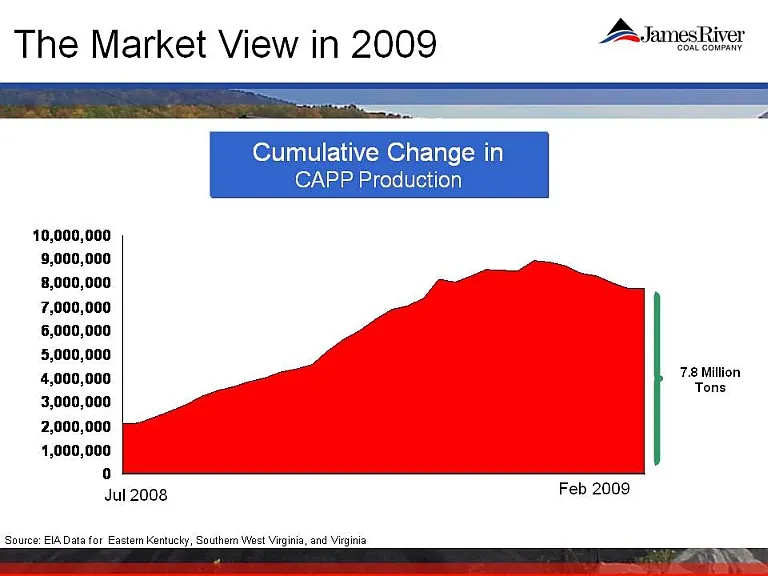
The Market View in 2009 Cumulative Change CAPP Production 10,000,000 7,000,000 8,000,000 9,000,000 6,000,000 3,000,000 4,000,000 5,000,0000 1,000,000 2,000,000 Jul 2008 Feb 2009 7.8 MillionTons
Slide 20: 2009 Cumulative Change in Coal Fired Electric Generation
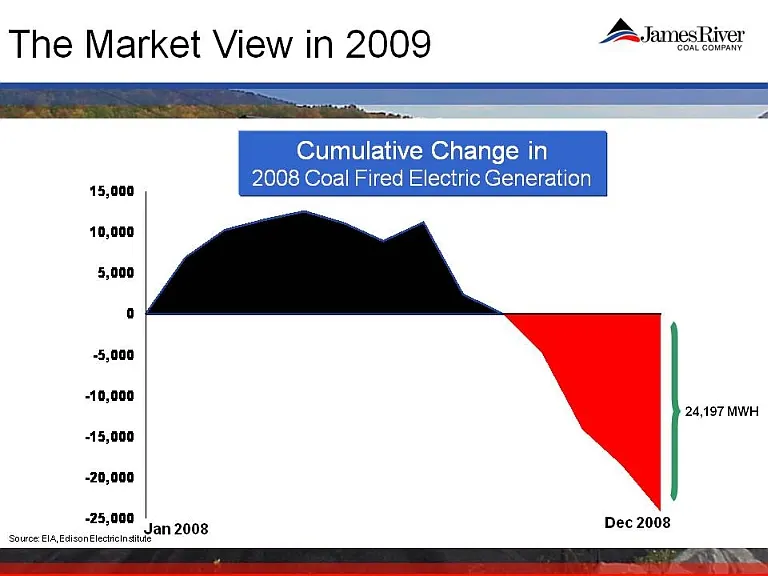
The Market View in 2009 Cumulative Change in2008 Coal Fired Electric Generation 10,000 15,0000 5,000 -10,000 -5,000 - -20,000- 15,000 Source: EIA, Edison Electric Institute-25,000Jan 2008Dec 2008 24,197 MWH
Slide 21: 2009 Weekly Exports
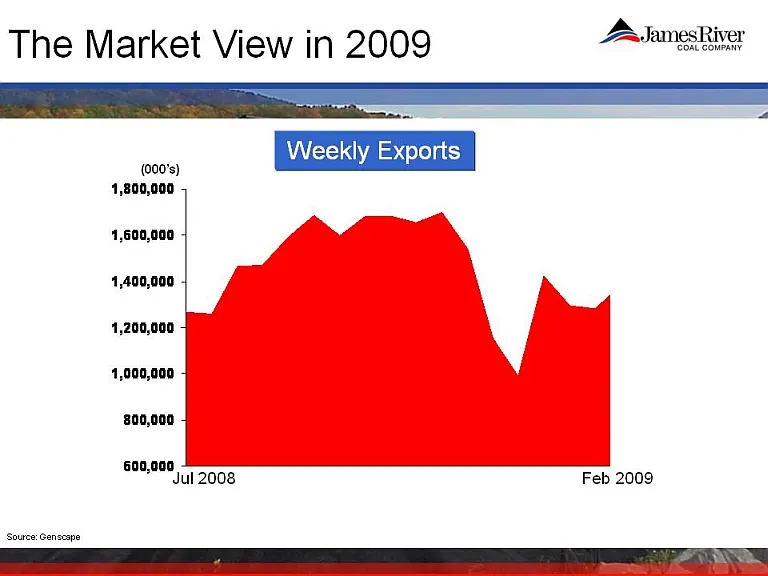
The Market View in 2009 Weekly Exports(000’) 1,600,000 1,800,0001,400,000 1,200,000 1,000,000 600,000 800,000 Jul 2008 Feb 2009
Slide 22: 2009 South Atlantic Coal Inventories Year-Over-Year Change
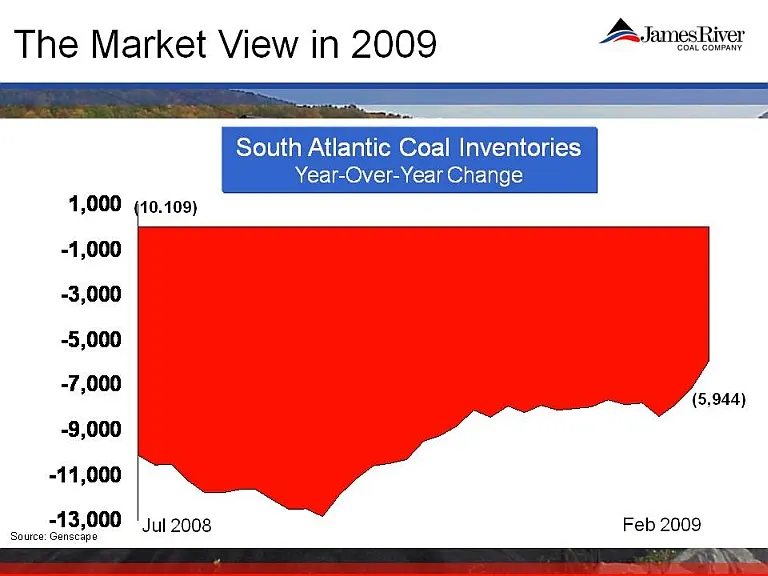
The Market View in 2009 South Atlantic Coal Inventories Year-Over-Year Change 1,000 (10.109) -3,000-1,000 -7,000 -5,000 (5,944) -11,000 -9,000 -13,000 Jul 2008 Feb 2009 Source: Genscape
Slide 23: 2009 Market Quotes
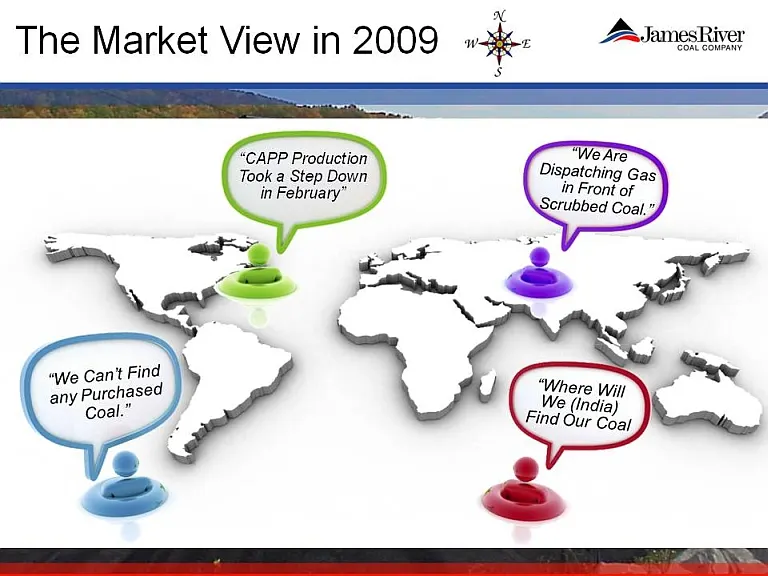
The Market View in 2009 “CAPP Production Took a Step Down in February” We are Dispatching Gas in Front of Scrubbed Coal. We Can’t Find any Purchased Coal Where Will We (India) Find Our Coal
Slide 24: Agenda
Agenda ●Our Pricing Model ●The Market View in 2007 ●The Market View in 2009 ●Things We Are Watching ●Our Strategy
Slide 25: Things
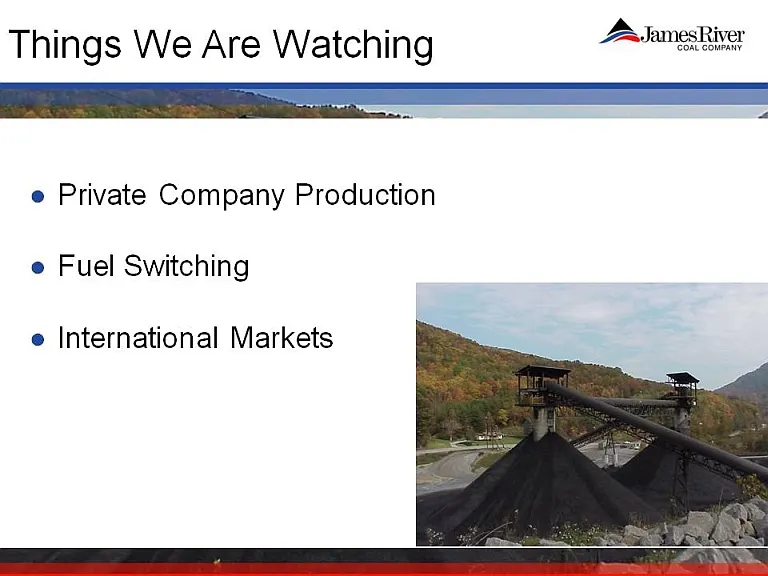
Things We Are Watching ●Private Company Production ●Fuel Switching ●International Markets
Slide 26: Production From Smallest Private Underground Mines
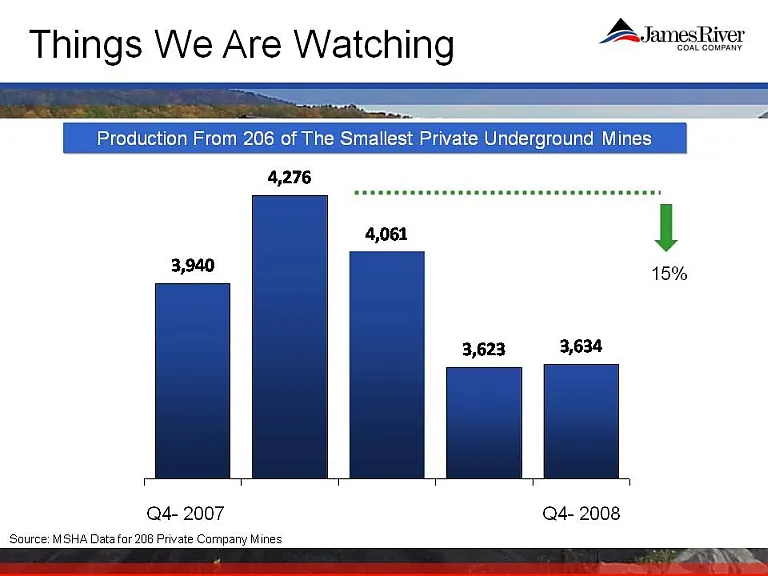
Things We Are Watching Production From 206 of The Smallest Private Underground Mines 3,940 4,276 4,061 3,623 3,634 15% Q4-2007Q4-2008Source: MSHA Data for 206 Private Company Mines
Slide 27: Production From Smallest Private Surface Mines
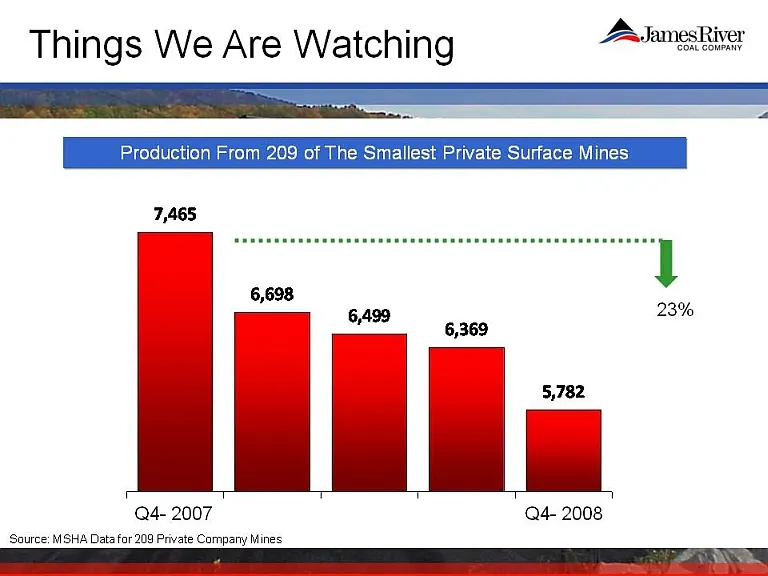
Things We Are Watching Production From 209 of The Smallest Private Surface Mines 7,465 6,698 6,499 6,369 5,782 23% Q4-2007Q4-2008Source: MSHA Data for 209 Private Company Mines
Slide 28: Permit Backlog
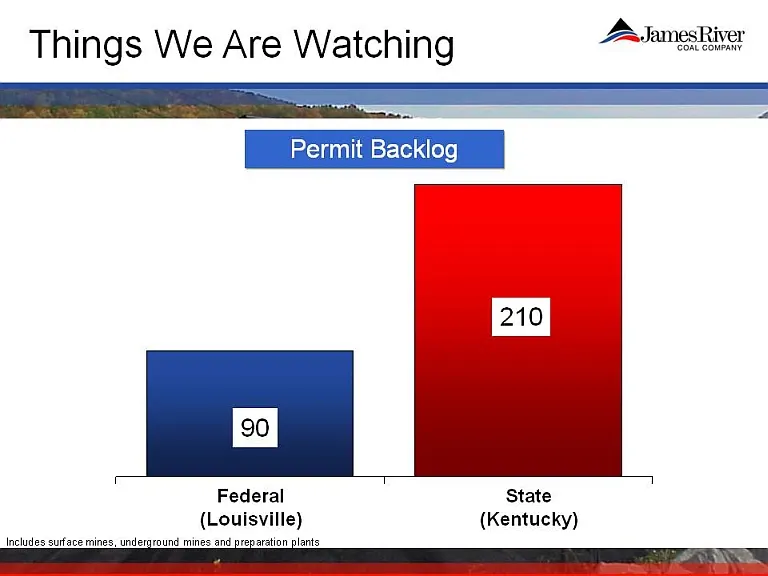
Things We Are Watching Permit Backlog 90 210 Federal(Louisville)State(Kentucky)Includes surface mines, underground mines and preparation plants
Slide 29: Weekly EIA Production Data
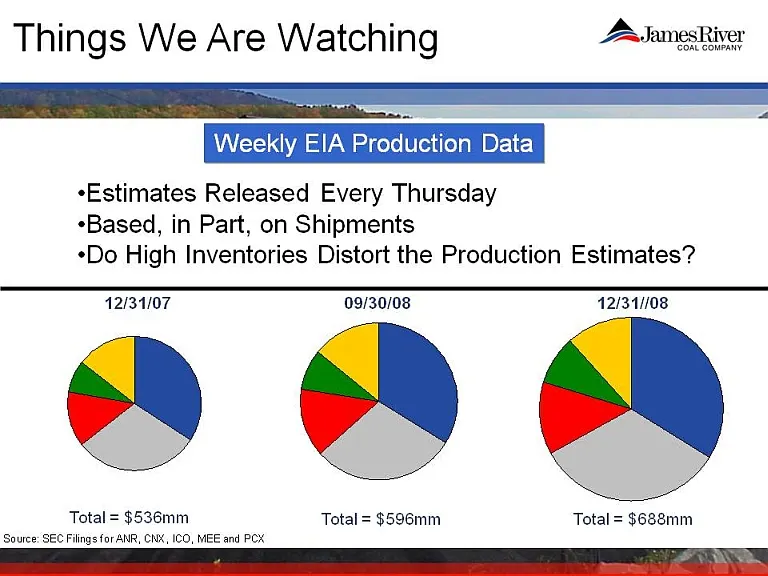
Things We Are Watching Weekly EIA Production Data •Estimates Released Every Thursday •Based, in Part, on Shipments •Do High Inventories Distort the Production Estimates? 12/31/07 09/30/08 12/31//08 Total = $536mmTotal = $596mmTotal = $688mmSource: SEC Filings for ANR, CNX, ICO, MEE and PCX
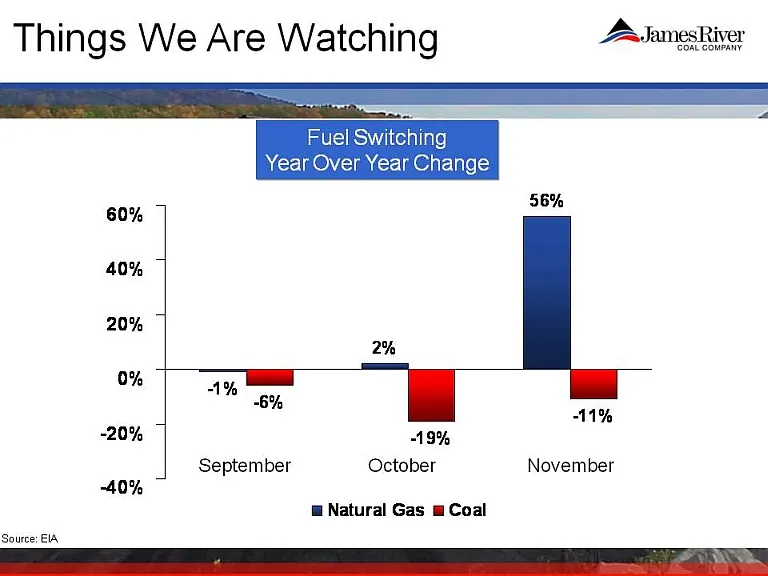
Slide 30: Fuel Switching
Things We Are Watching Fuel Switching Year Over Year Change 56% 60% 40% 20% -1% 2% -6% 11% 0% -19% -11% -40% -20% September October November 0% Natural Gas CoalSource: EIA
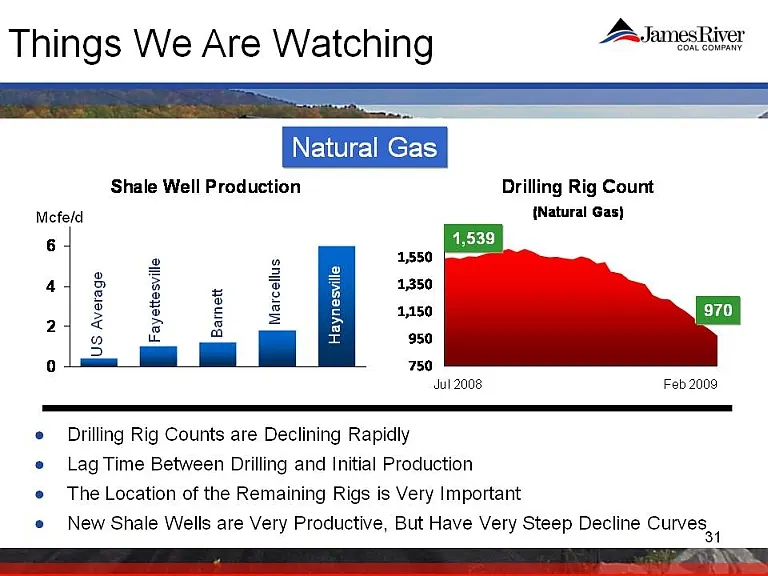
Slide 31: Natural Gas Shale Well Production
Things We Are Watching Natural Gas Shale Well Production Drilling Rig Count (Natural Gas) US Average Fayettesville Barnett Marcellus Haynesville Mcfe/d 0 2 41 6 750 950 1,150, 1,350, 1,550, 1,539,970, Jul 2008 Feb 2009 ●Drilling Rig Counts are Declining Rapidly ●Lag Time Between Drilling and Initial
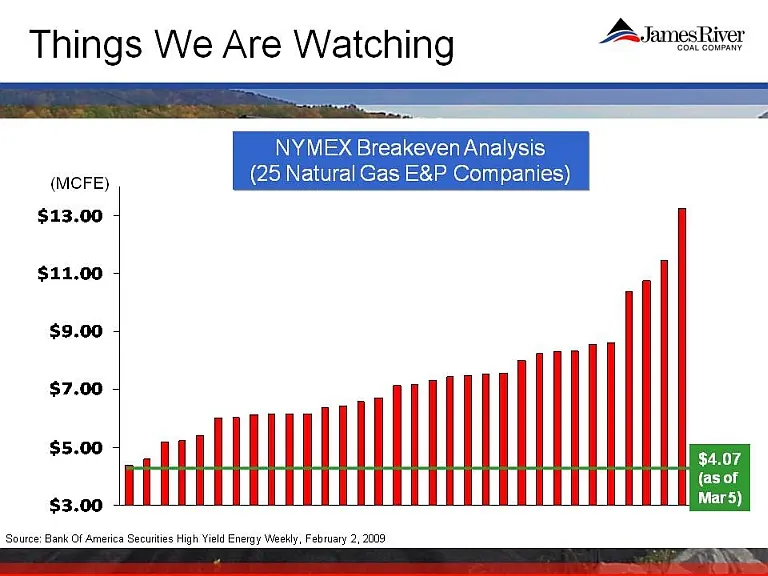
Slide 32: NYMEX Breakeven Analysis
Things We Are Watching NYMEX Breakeven Analysis(25 Natural Gas E&P Companies)(MCFE) $13.00 $11.00 $9.00 $7.00 $5.00 $3.00Source: Bank Of America Securities High Yield Energy Weekly, February 2, 2009 $4.07(as of Mar 5)
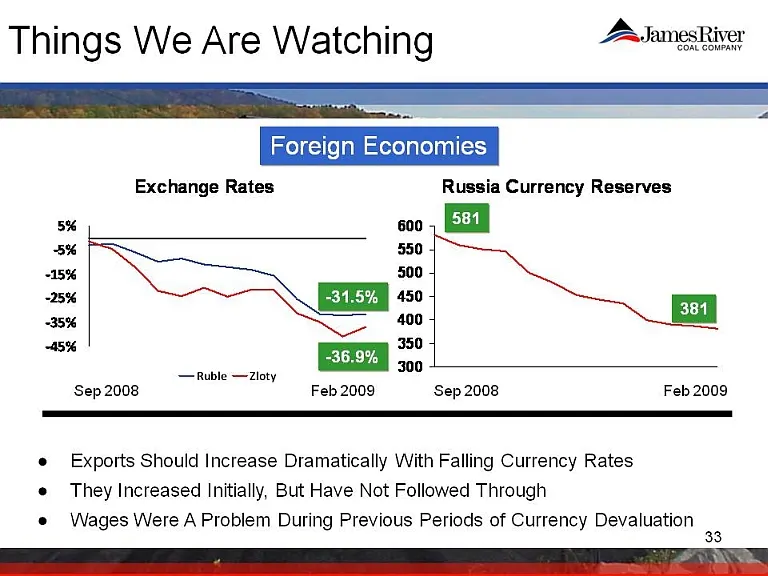
Slide 33: Foreign Economies Exchange Rates
Things We Are Watching Foreign Economies Exchange Rates Russia Currency Reserves-31.5% -36.9% 581 381 5% -5% -15% -25% - -35% -45% 600 550 500 450 400 6350 300Sep 2008 Feb 2009 Ruble Zloty ●Exports Should Increase Dramatically With Falling Currency Rates They Increased Initially, But Have Not Follow
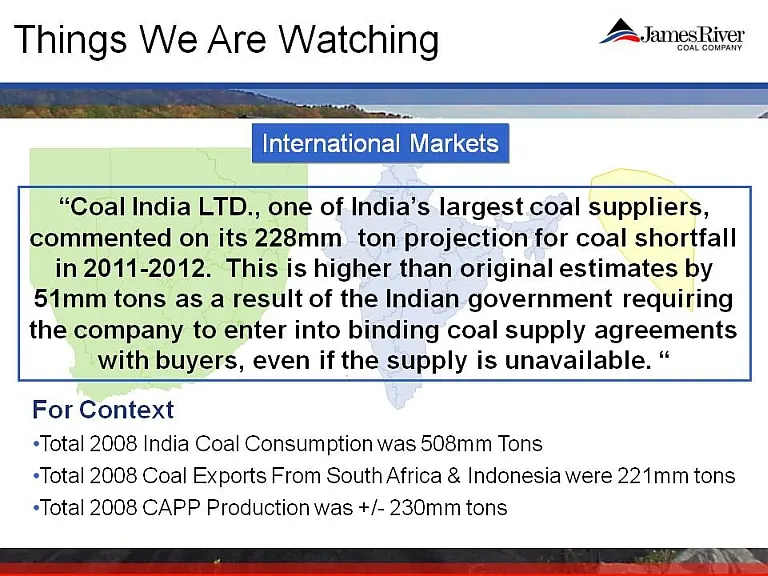
Slide 34: International Markets
Things We Are Watching International Markets “Coal India LTD., one of India’s largest coal suppliers, commented on its 228mm ton projection for coal shortfall 8pjin 2011-2012. This is higher than original estimates by 51mm tons as a result of the Indian government requiring the company to enter into
Slide 35: Agenda
Agenda ●Our Pricing Model ●The Market View in 2007●The Market View in 2009 ●Our Strategy ●Things We Are Watching
Slide 36: Our Current Strategy
Our Current Strategy ●The International Markets will be Interesting, but not a Key Driver of US Prices for 12-24 Months ●Coal Fired Demand is Falling First, but Should Moderate Later ●Coal Supply will Fall Later, But Harder Industrial Gas Demand will be an Important Indicator ●This Commodity Cycle w

Slide 37: Group Discussion
Group Discussion

Slide 38: James River Coal Company
Ay JamesRiver COAL COMPANY
Source: SEC EDGAR · 8-K filed Mar 10, 2009
More decks from James River Coal Company
 Corporate Update (November 2013)19 slides · Nov 7, 2013
 Q2 2013 Earnings Presentation20 slides · Aug 9, 2013
 Q1 2013 Earnings Presentation18 slides · May 1, 2013
 Corporate Update (March 2013)19 slides · Mar 7, 2013
 Corporate Update (November 2012)17 slides · Nov 7, 2012
 Q2 2012 Earnings Presentation19 slides · Aug 9, 2012