ALS Ltd. · ASX:ALQ
ALS — H1 FY27 Earnings Presentation
37 slides from ALS's earnings presentation, November 2026
Slide 1: H1 FY27 results
personal use only H1 FY27 results For the half year ending 30 September 2026 Malcolm Deane, CEO and Managing Director Stuart Hutton, Chief Financial Officer right solutions. right partner.
Slide 2: Important notice and disclaimer
Important notice and disclaimer personal use only This presentation has been prepared by ALS Limited (Company) and contains general information about certain Forward-looking statements current or proposed activities of the Company and its related bodies corporate (Group) as at the date of the This p
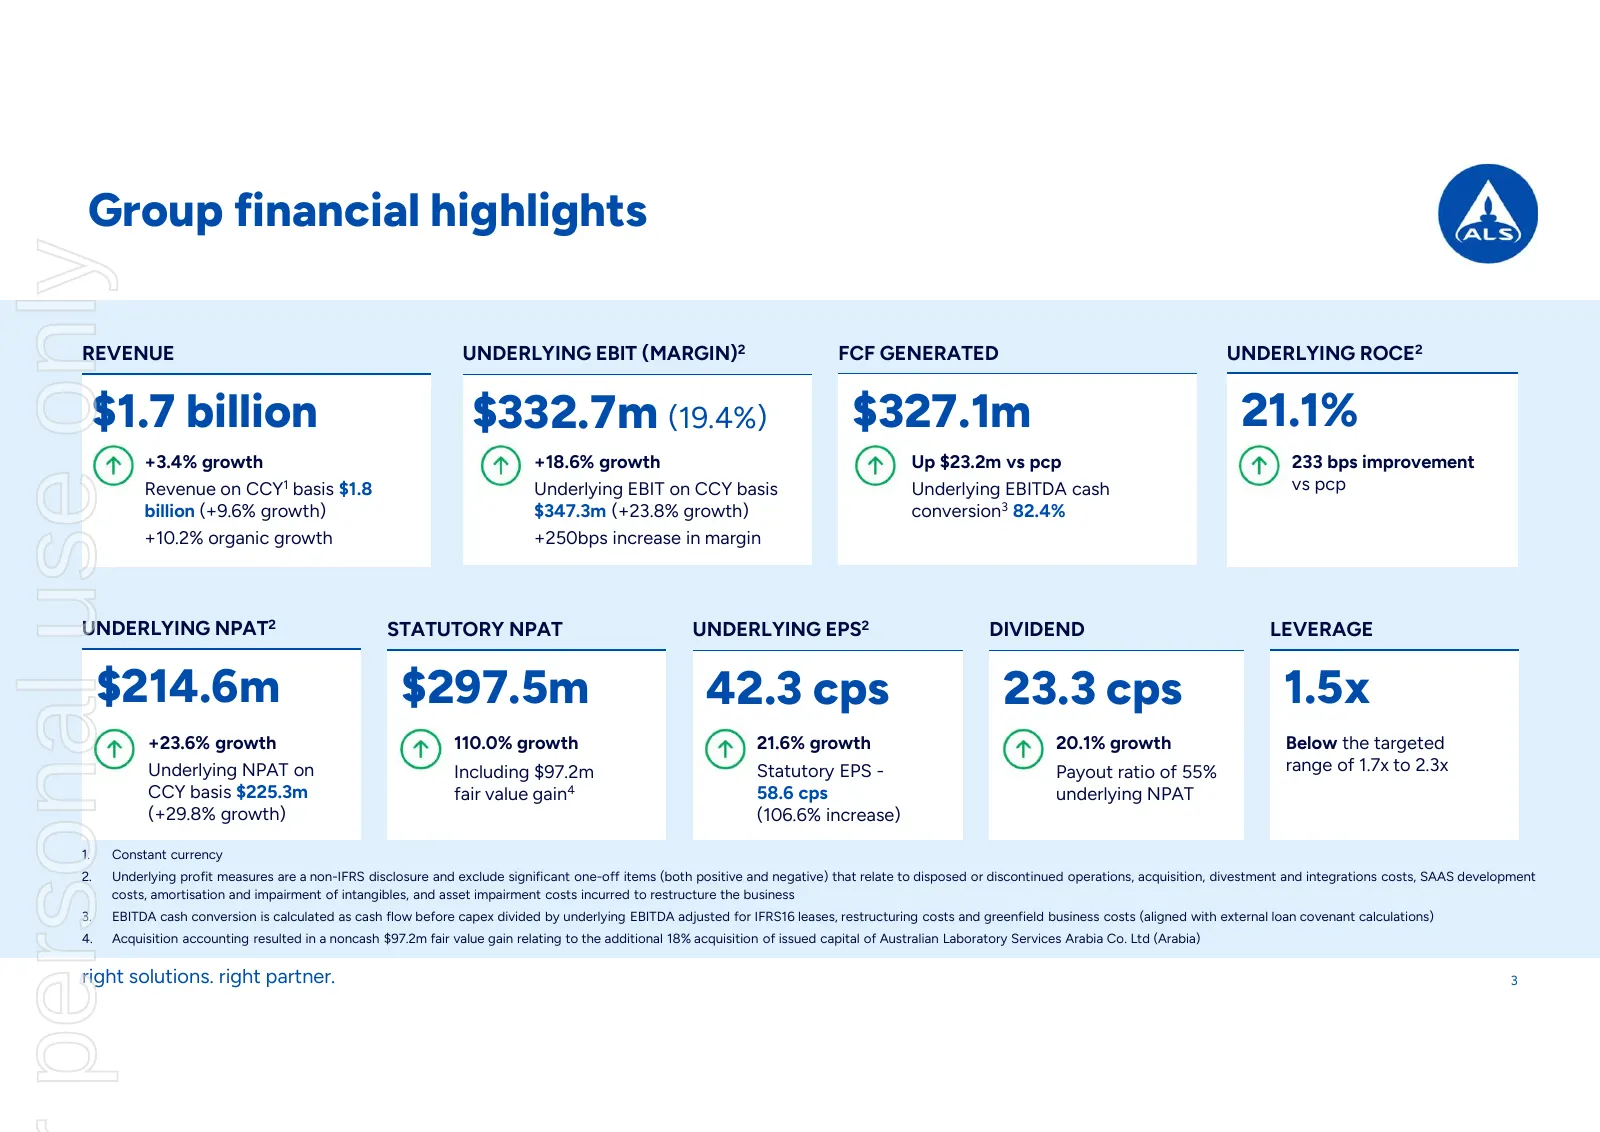
Slide 3: Group financial highlights
Group financial highlights personal use only REVENUE UNDERLYING EBIT (MARGIN)2 FCF GENERATED UNDERLYING ROCE2 $1.7 billion $332.7m (19.4%) $327.1m 21.1% +3.4% growth +18.6% growth Up $23.2m vs pcp 233 bps improvement Revenue on CCY1 basis $1.8 Underlying EBIT on CCY basis Underlying EBITDA cash vs p
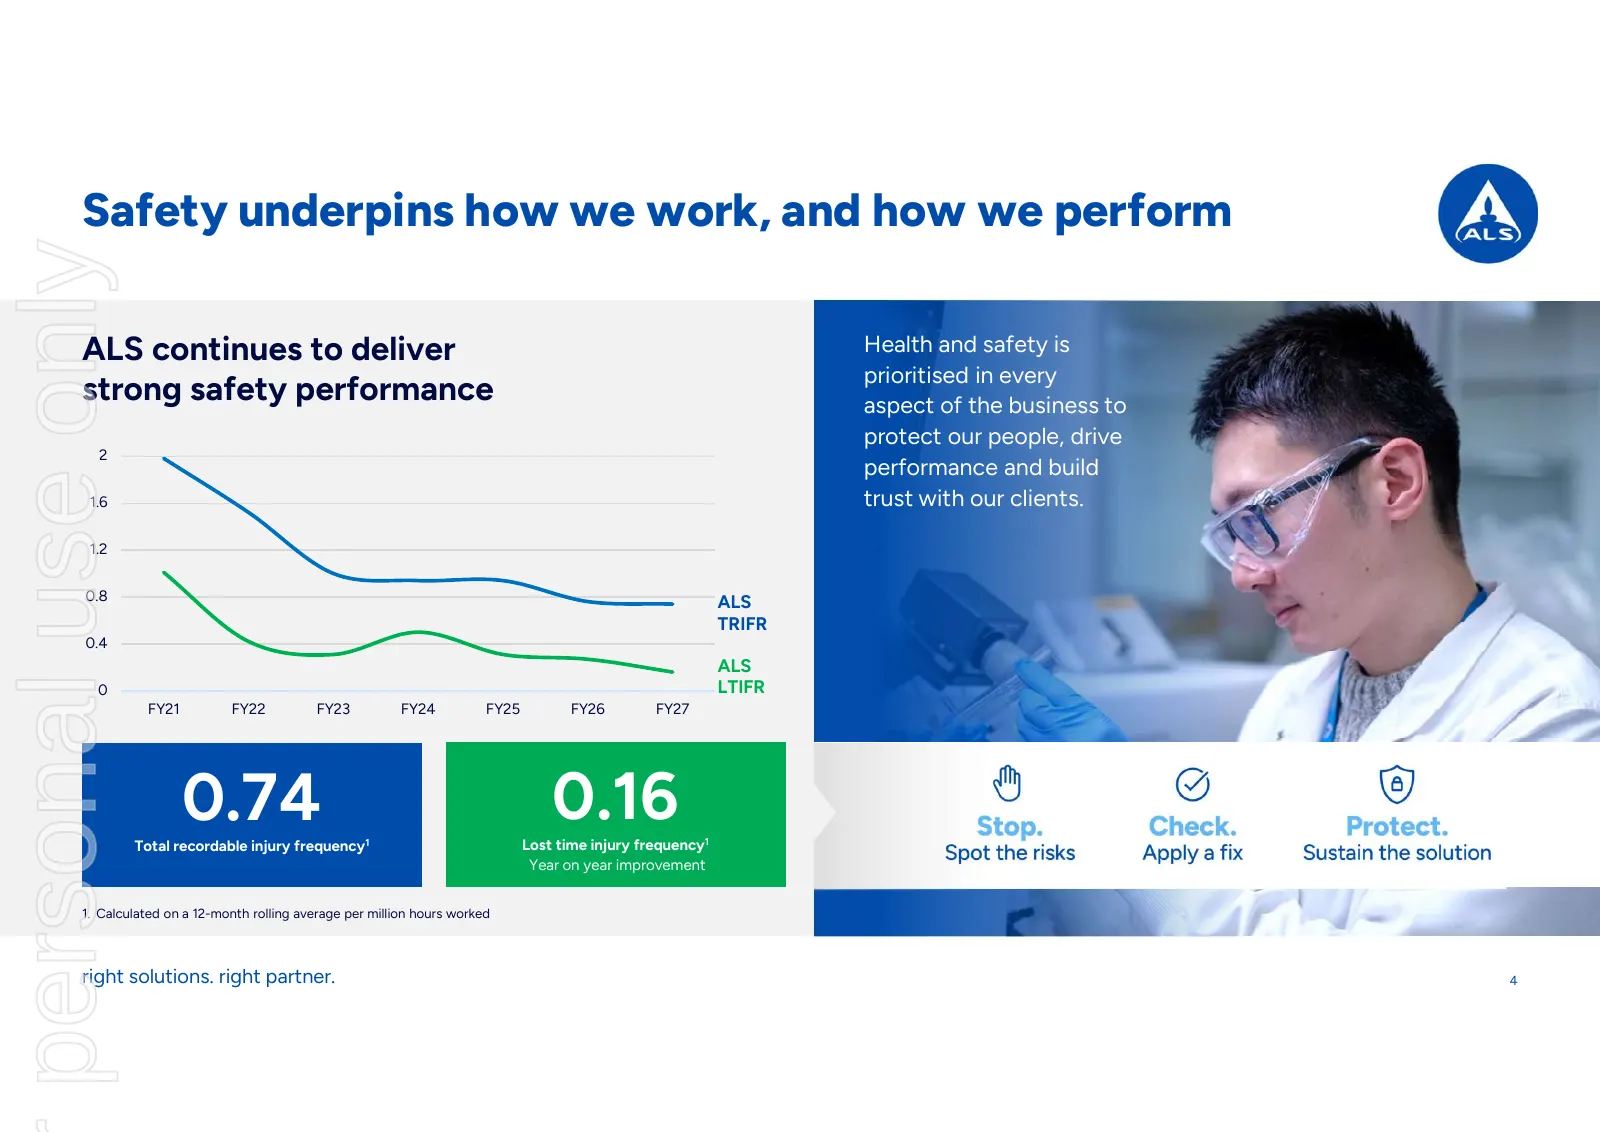
Slide 4: Safety underpins how we work, and how we perform
Safety underpins how we work, and how we perform personal use only ALS continues to deliver Health and safety is prioritised in every strong safety performance aspect of the business to protect our people, drive 2 performance and build 1.6 trust with our clients. 1.2 0.8 ALS TRIFR 0.4 ALS 0 LTIFR FY
Slide 5: Business highlights – key takeaways
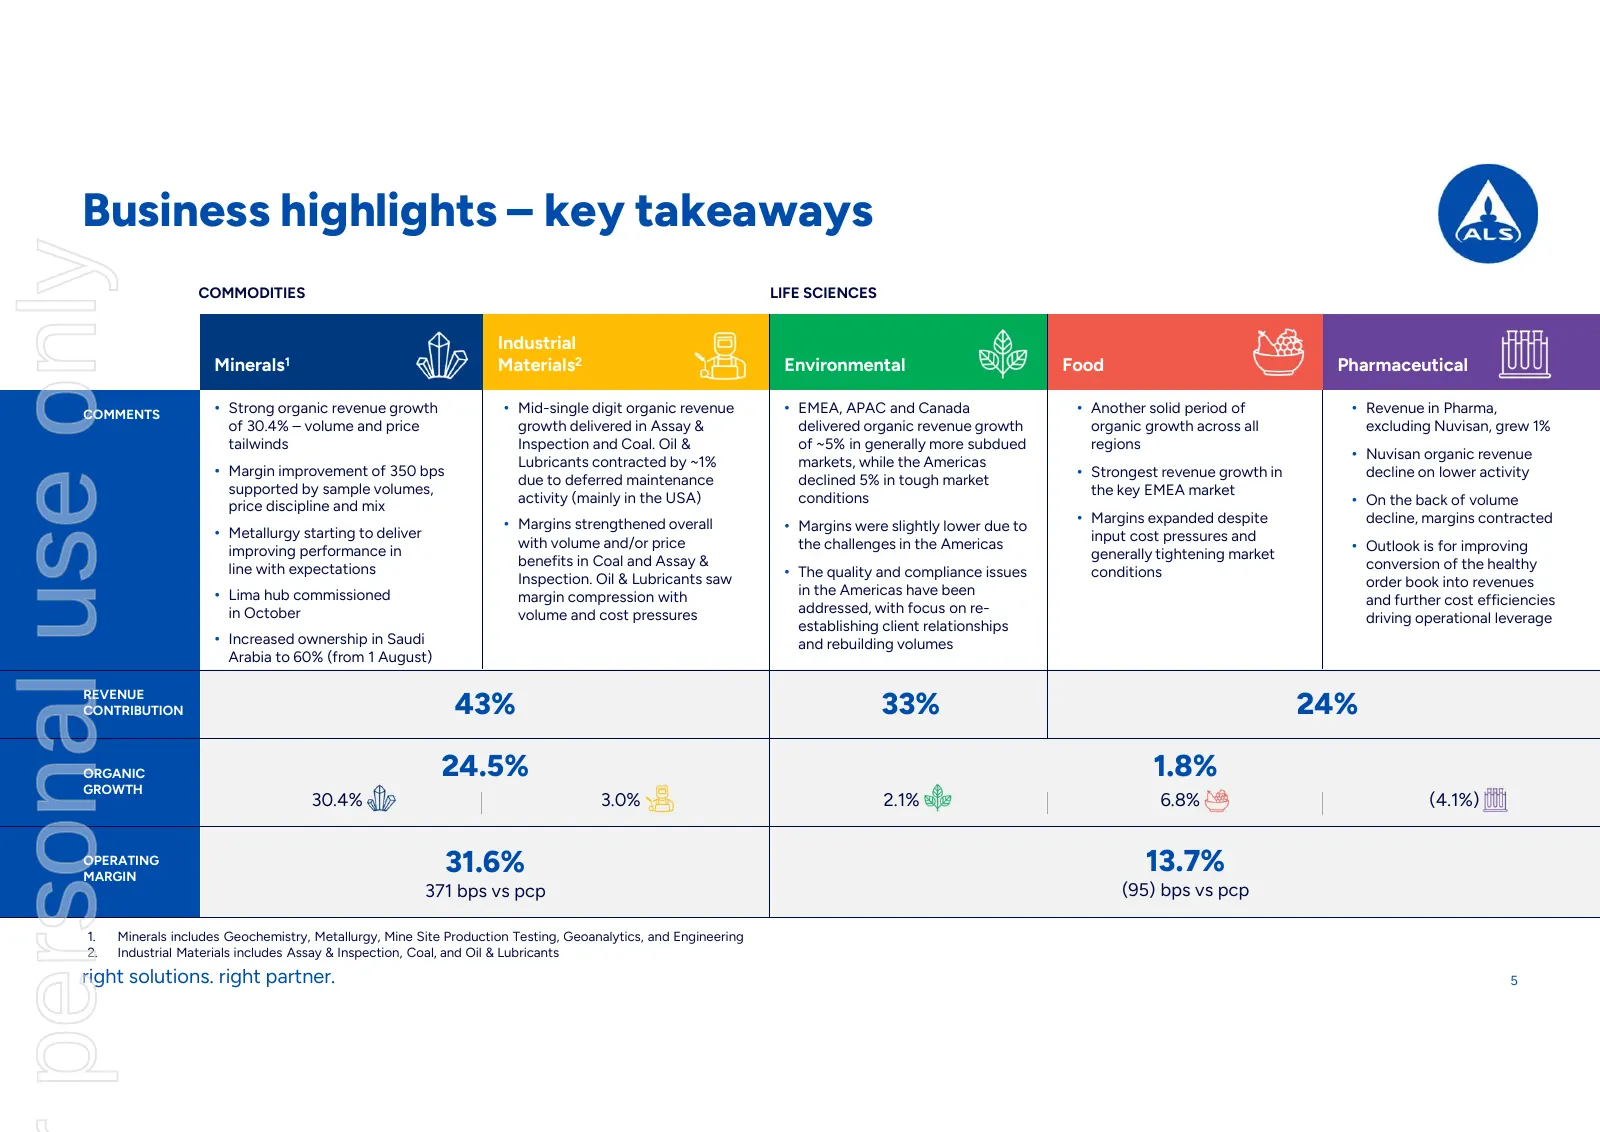
Business highlights – key takeaways personal use only COMMODITIES LIFE SCIENCES Industrial Minerals1 Materials2 Environmental Food Pharmaceutical COMMENTS • Strong organic revenue growth • Mid-single digit organic revenue • EMEA, APAC and Canada • Another solid period of • Revenue in Pharma, of 30.4
Slide 6: Strong organic revenue growth of 10.2%
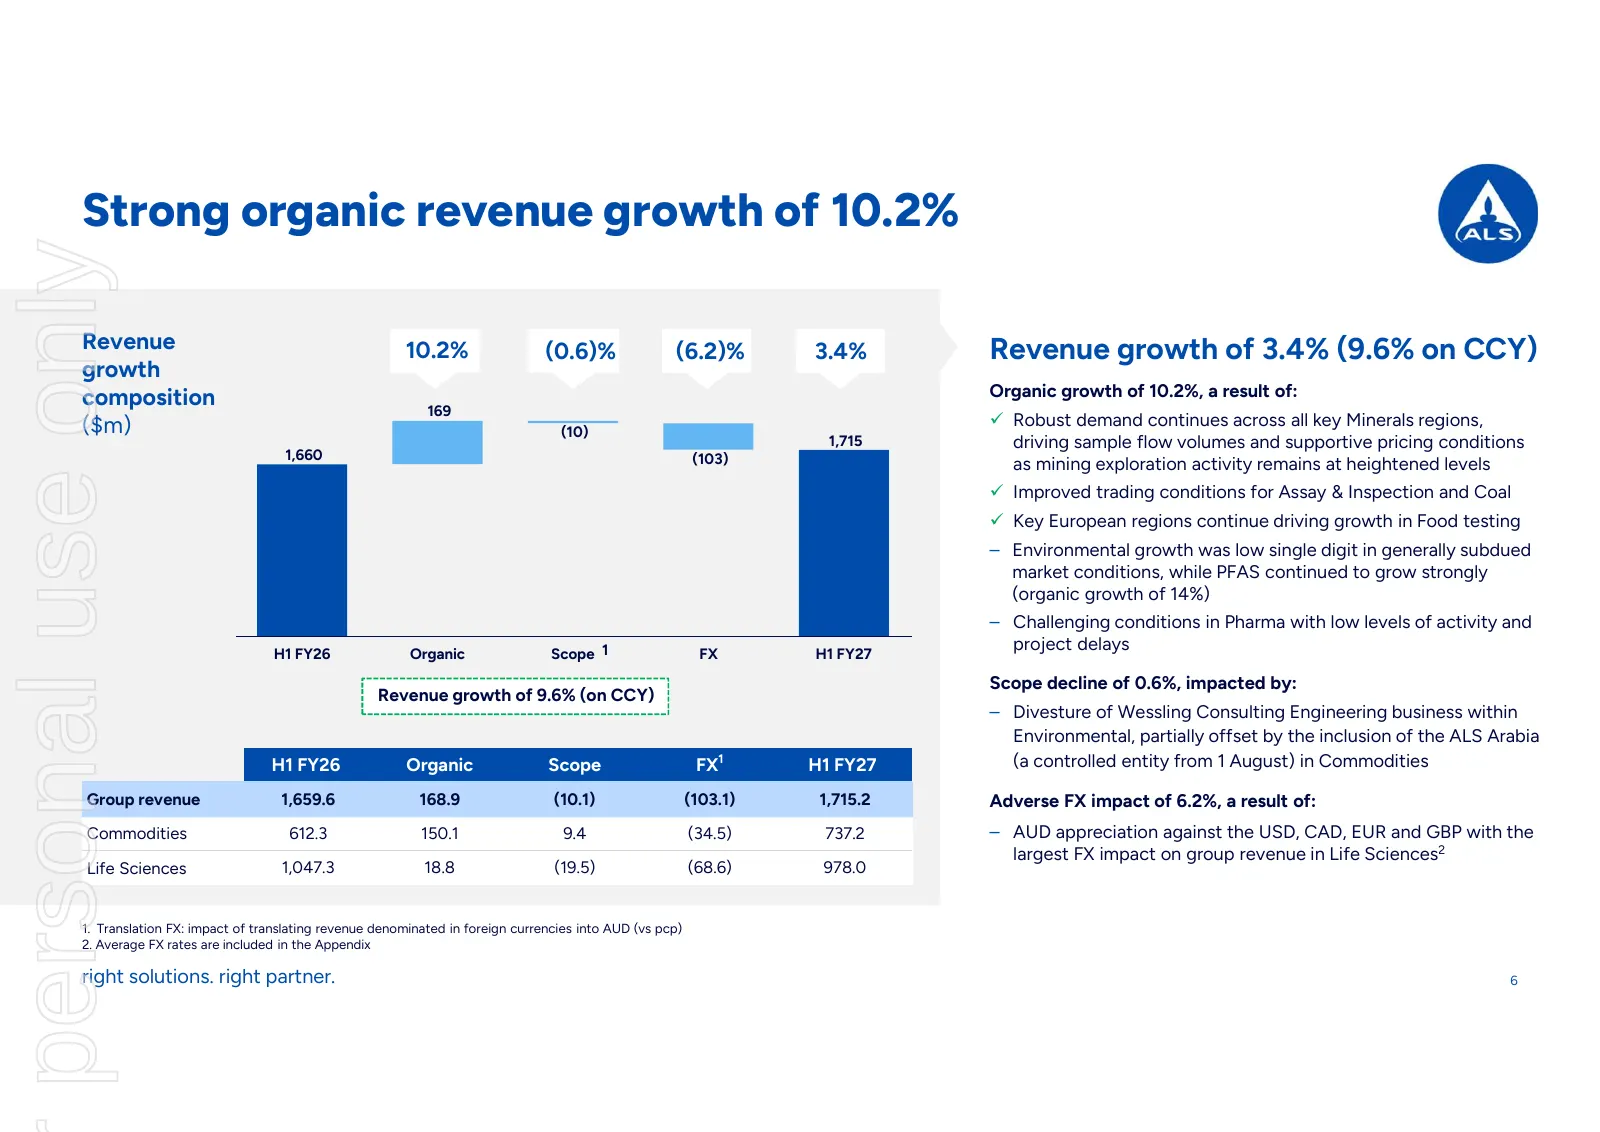
Strong organic revenue growth of 10.2% personal use only Revenue 10.2% (0.6)% (6.2)% 3.4% Revenue growth of 3.4% (9.6% on CCY) growth composition Organic growth of 10.2%, a result of: 169 ($m) Robust demand continues across all key Minerals regions, (10) 1,715 driving sample flow volumes and suppo
Slide 7: Commodities
personal use only Commodities
Slide 8: Strong execution in Commodities underpinning continued growth and performance
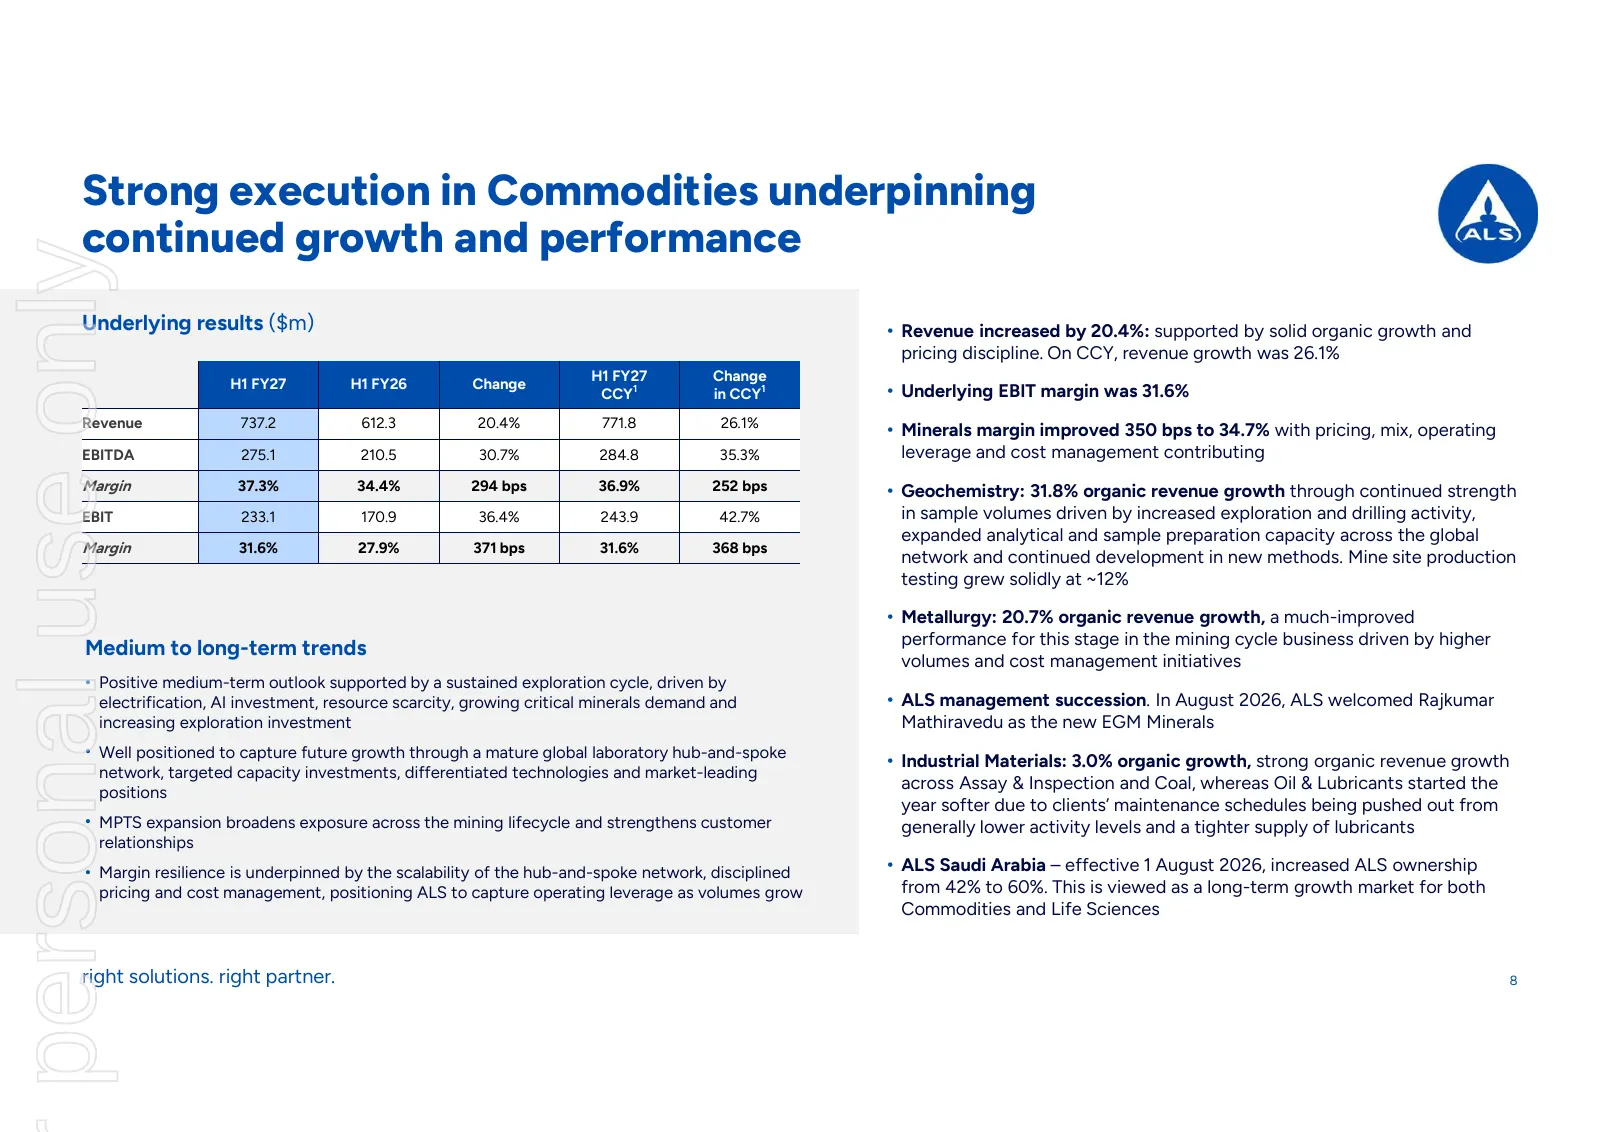
Strong execution in Commodities underpinning continued growth and performance personal use only Underlying results ($m) • Revenue increased by 20.4%: supported by solid organic growth and pricing discipline. On CCY, revenue growth was 26.1% H1 FY27 Change H1 FY27 H1 FY26 Change CCY1 in CCY1 • Underl
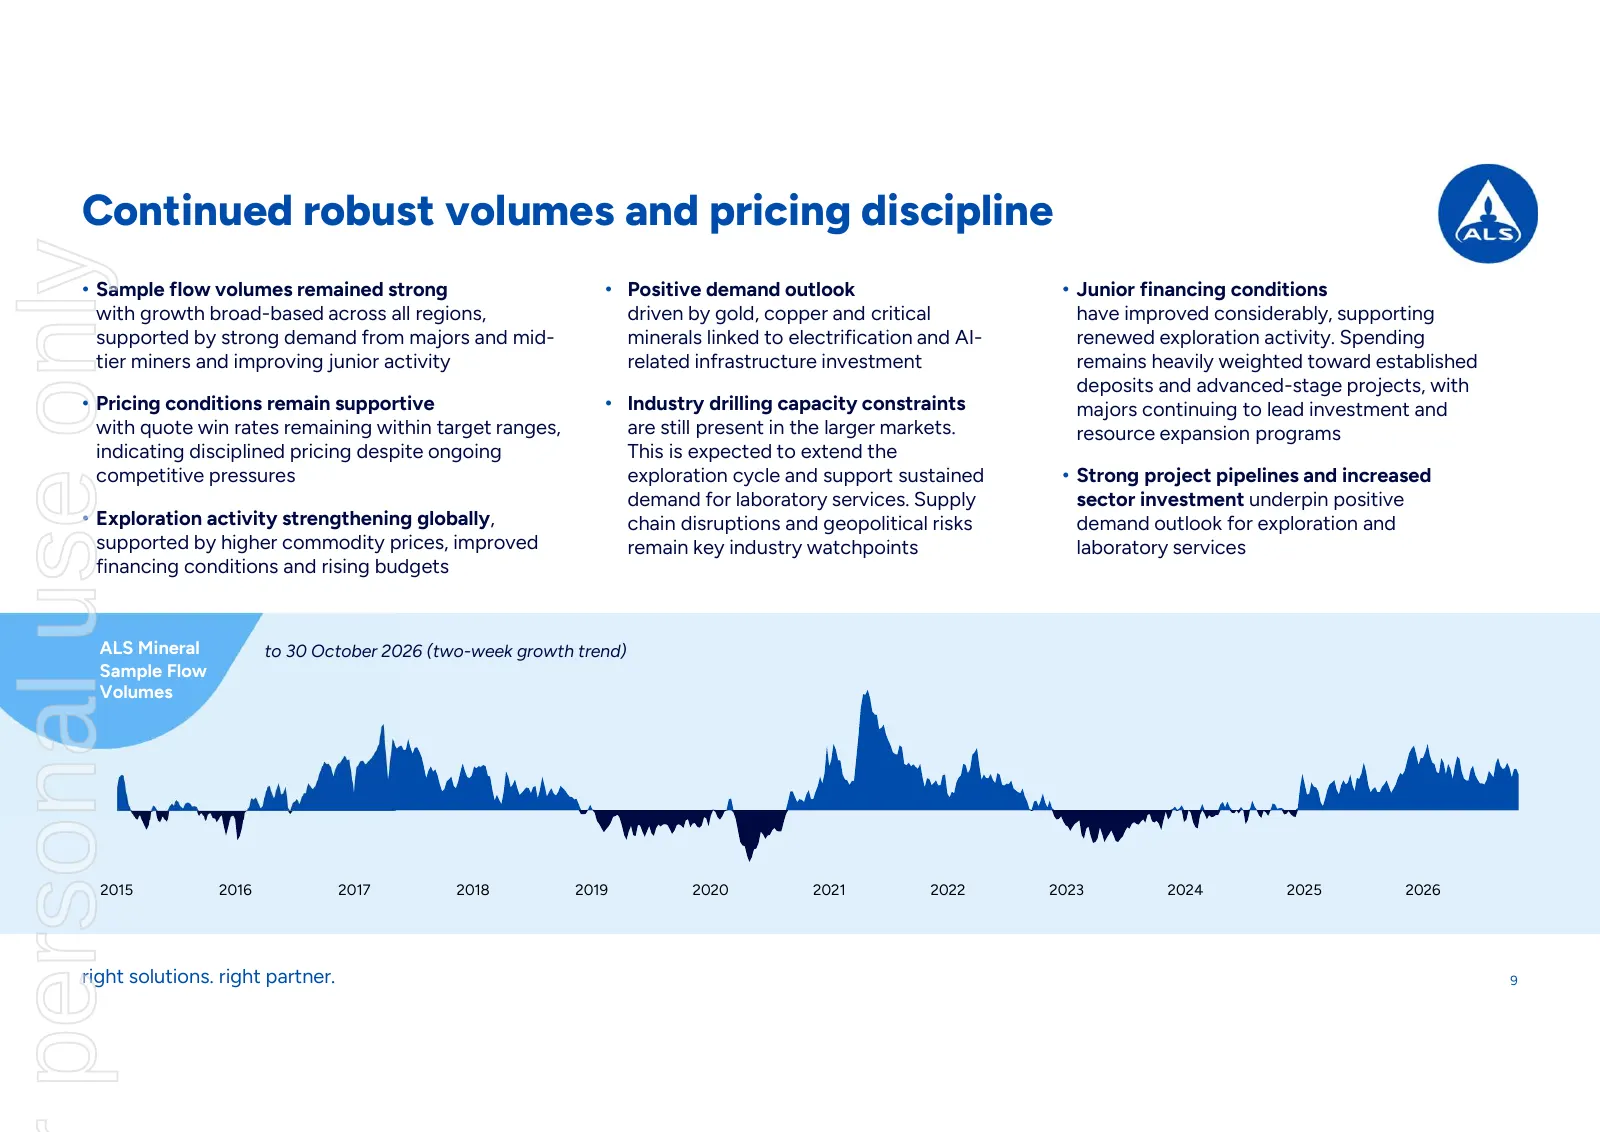
Slide 9: Continued robust volumes and pricing discipline
Continued robust volumes and pricing discipline personal use only • Sample flow volumes remained strong • Positive demand outlook • Junior financing conditions with growth broad-based across all regions, driven by gold, copper and critical have improved considerably, supporting supported by strong d
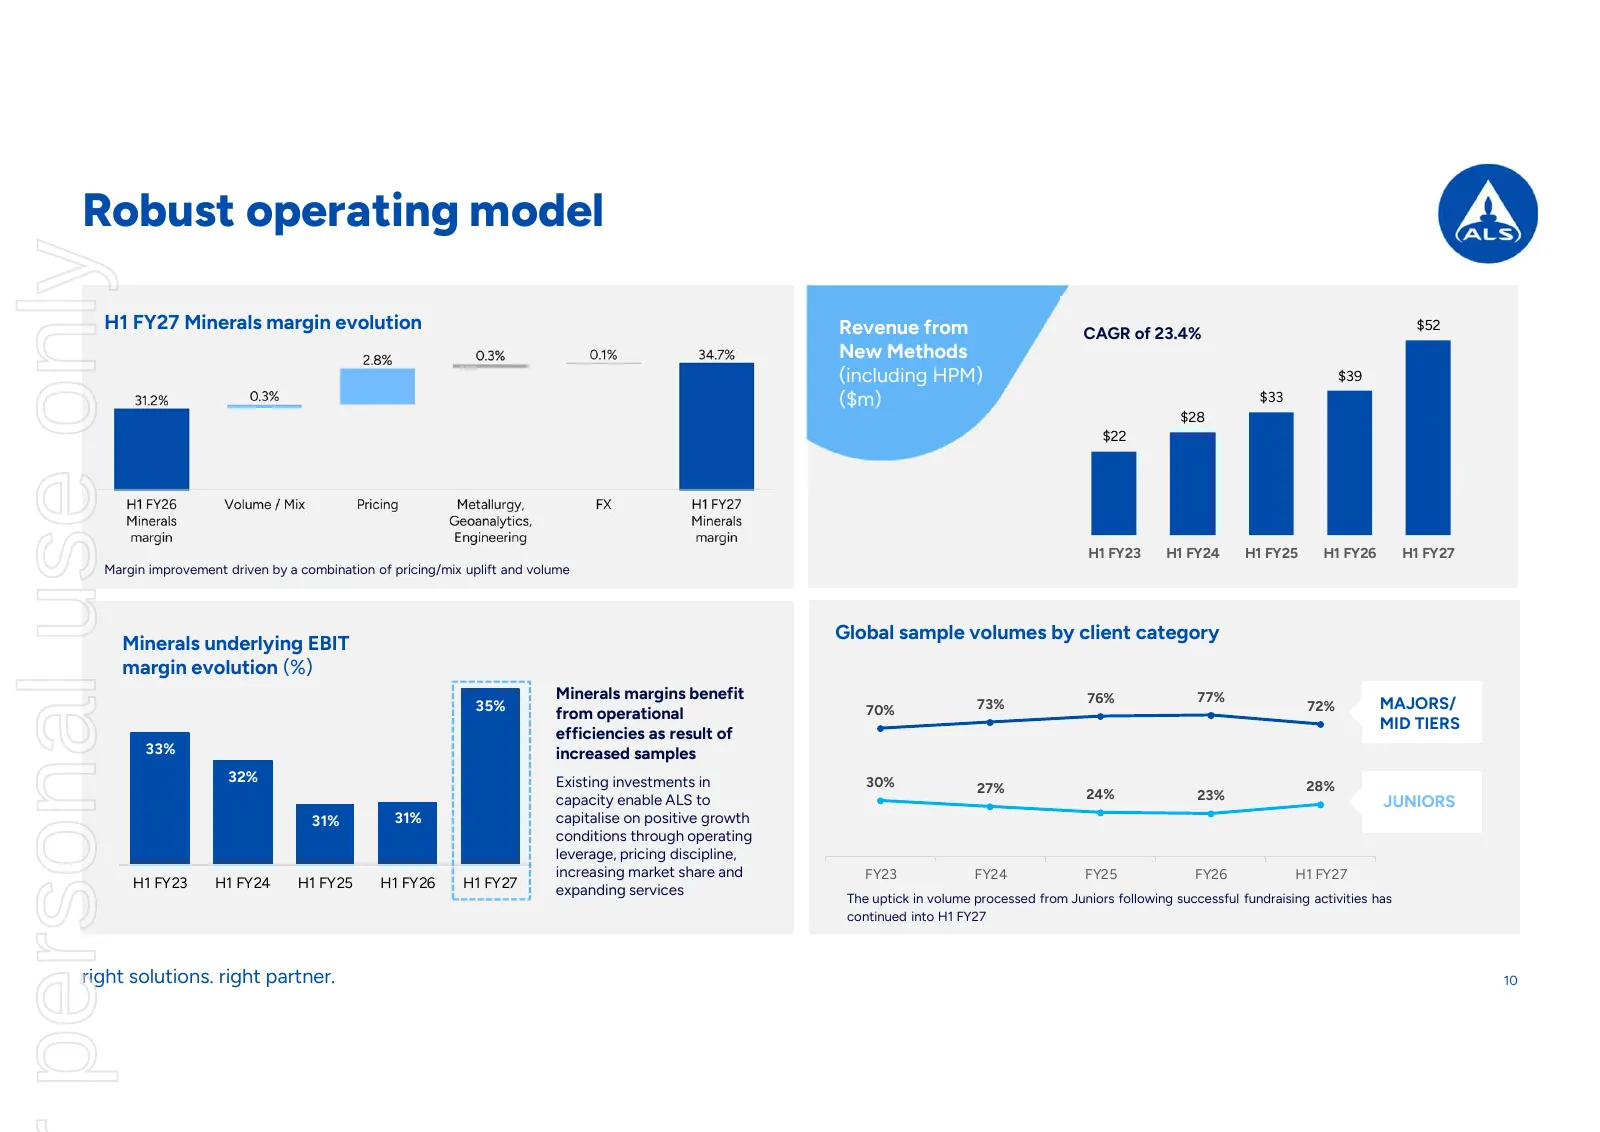
Slide 10: Robust operating model
Robust operating model personal use only H1 FY27 Minerals margin evolution Revenue from CAGR of 23.4% $52 New Methods (including HPM) $39 ($m) $33 $28 $22 H1 FY23 H1 FY24 H1 FY25 H1 FY26 H1 FY27 Margin improvement driven by a combination of pricing/mix uplift and volume Global sample volumes by clie
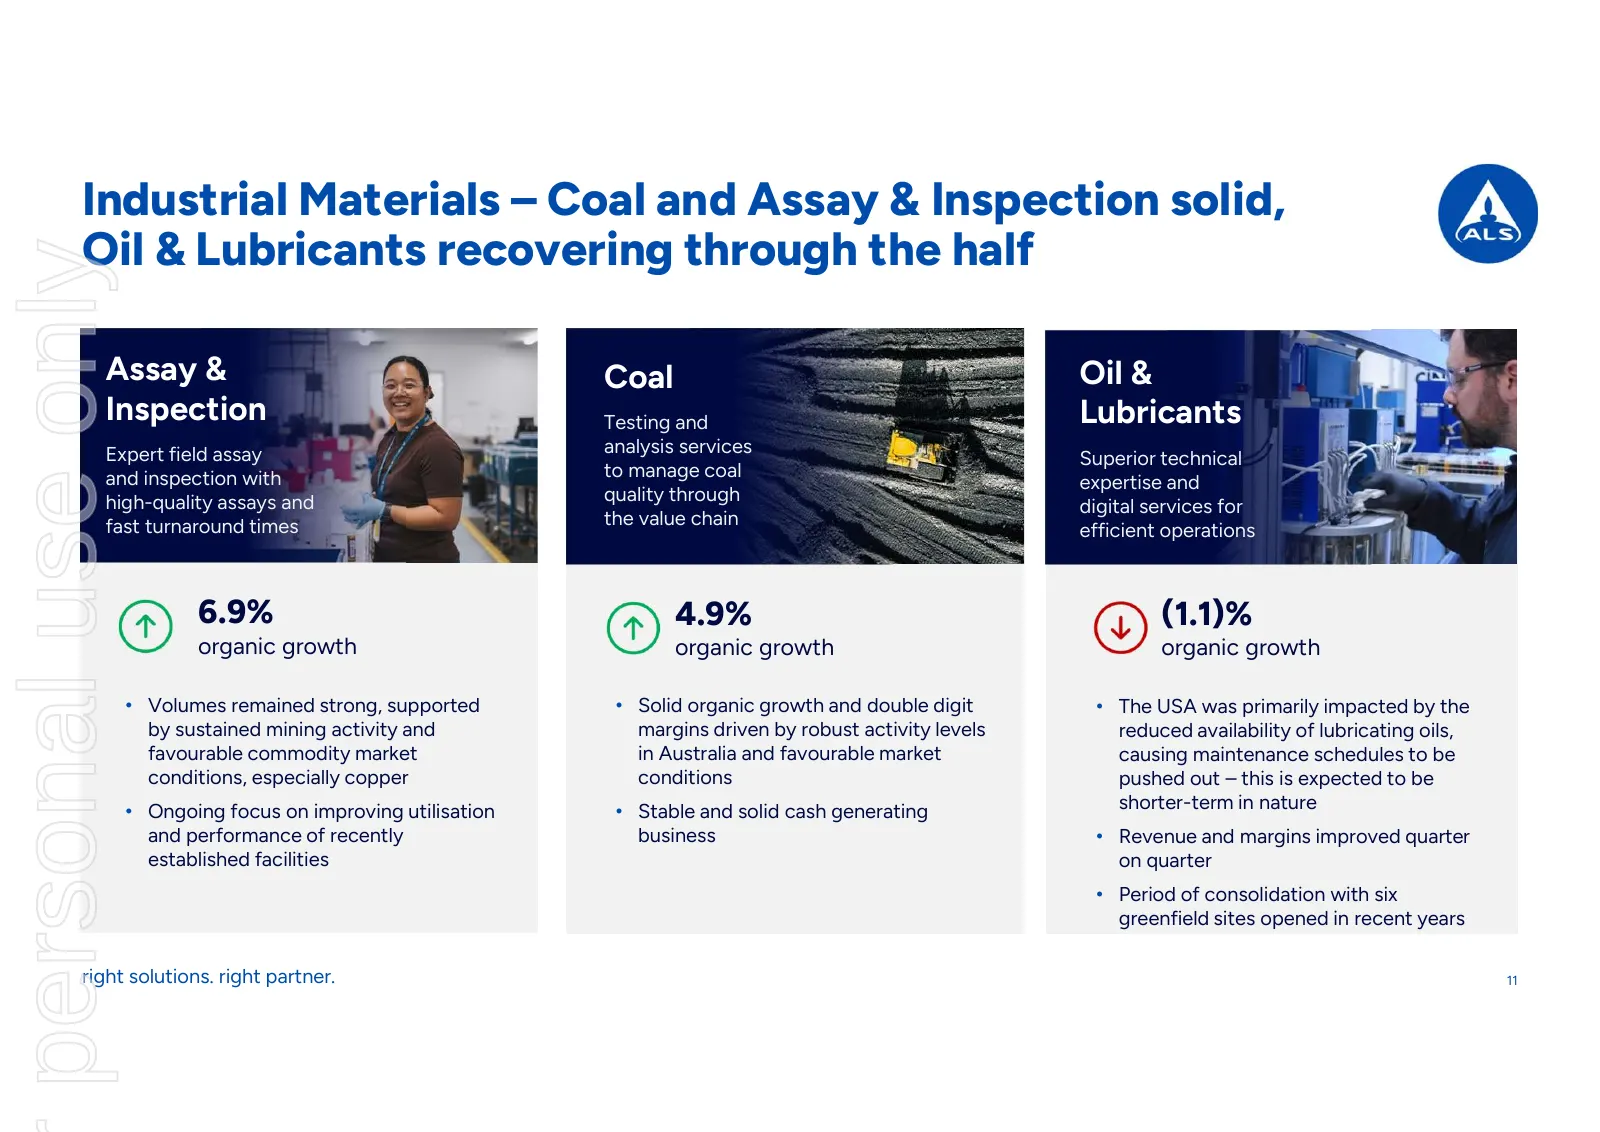
Slide 11: Industrial Materials – Coal and Assay & Inspection solid, Oil & Lubricants recovering
Industrial Materials – Coal and Assay & Inspection solid, Oil & Lubricants recovering through the half personal use only Assay Coal & Assa Coal & Oil & Inspection Testing and Inspection Testing and Lubricants analysis Expert services field assay analysis services Expert field assay Superior technica

Slide 12: Life Sciences
personal use only Life Sciences
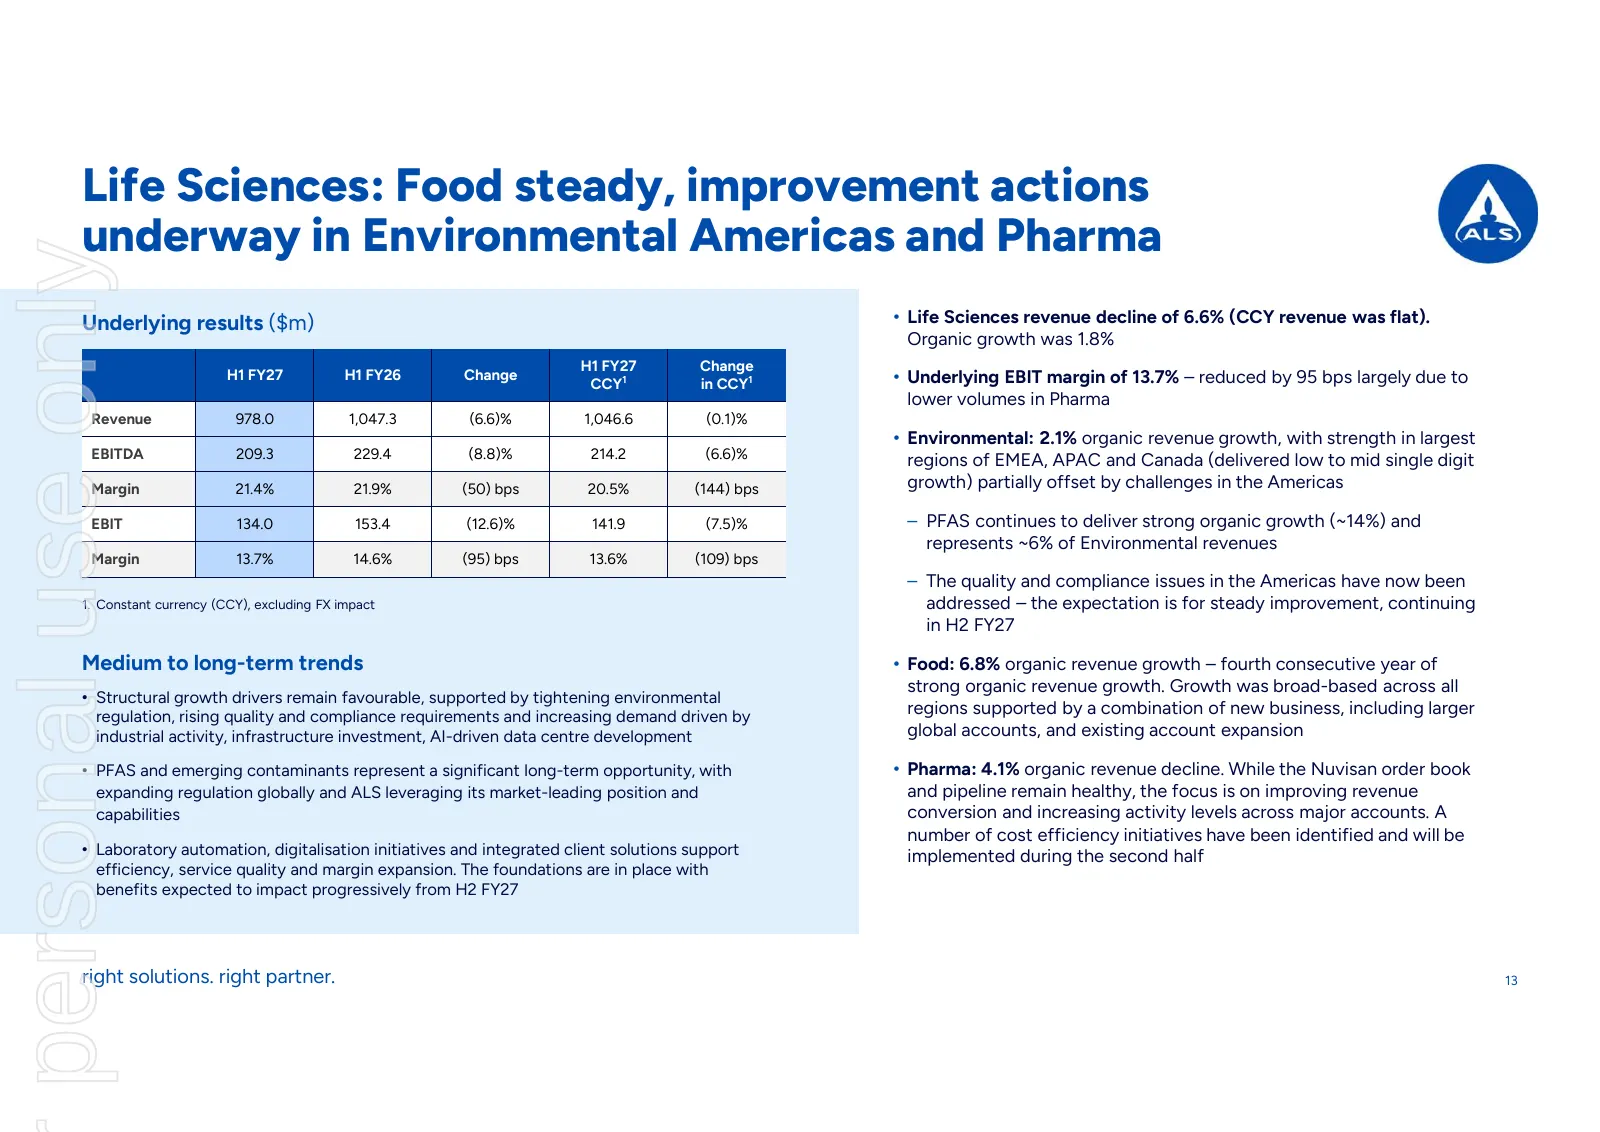
Slide 13: Life Sciences: Food steady, improvement actions underway in Environmental Americas and Pharma
Life Sciences: Food steady, improvement actions underway in Environmental Americas and Pharma personal use only Underlying results ($m) • Life Sciences revenue decline of 6.6% (CCY revenue was flat). Organic growth was 1.8% H1 FY27 Change H1 FY27 H1 FY26 Change • Underlying EBIT margin of 13.7% – re
Slide 14: Group performance – Financial review
personal use only Group performance Financial review
Slide 15: H1 FY27 financials – solid revenue and earnings growth
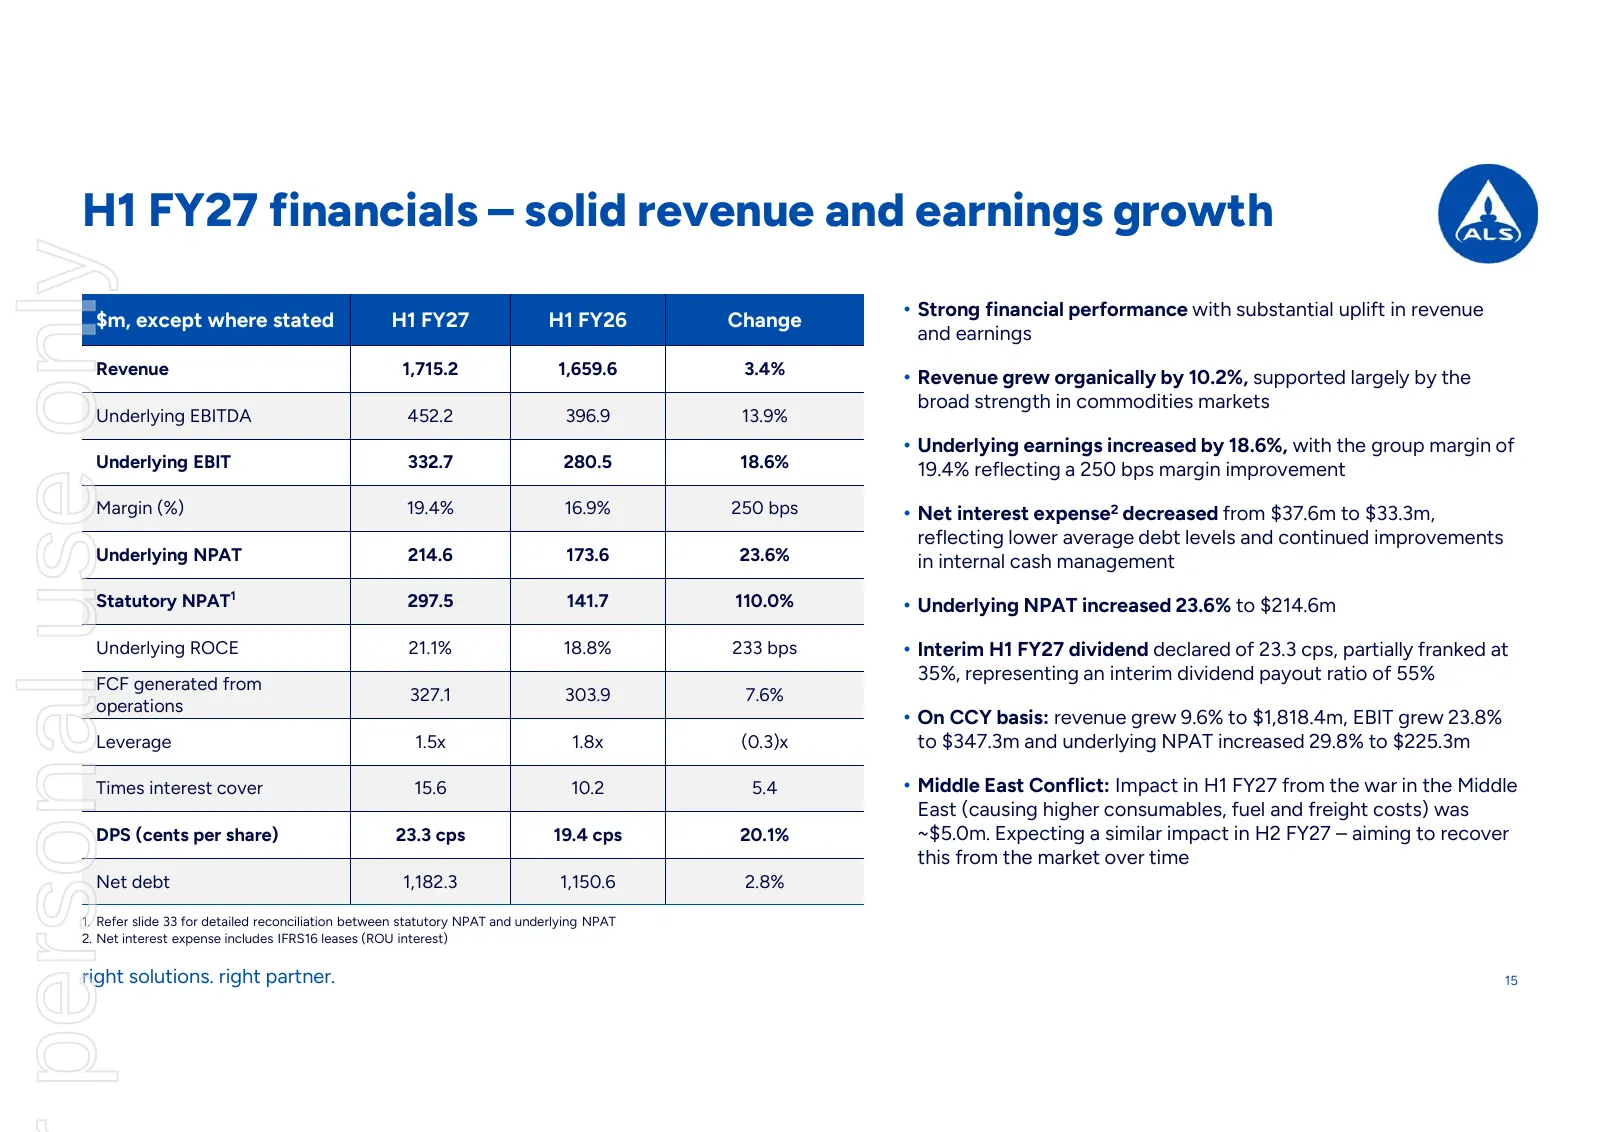
H1 FY27 financials – solid revenue and earnings growth personal use only • Strong financial performance with substantial uplift in revenue $m, except where stated H1 FY27 H1 FY26 Change and earnings Revenue 1,715.2 1,659.6 3.4% • Revenue grew organically by 10.2%, supported largely by the broad stre
Slide 16: Operating margins remain strong
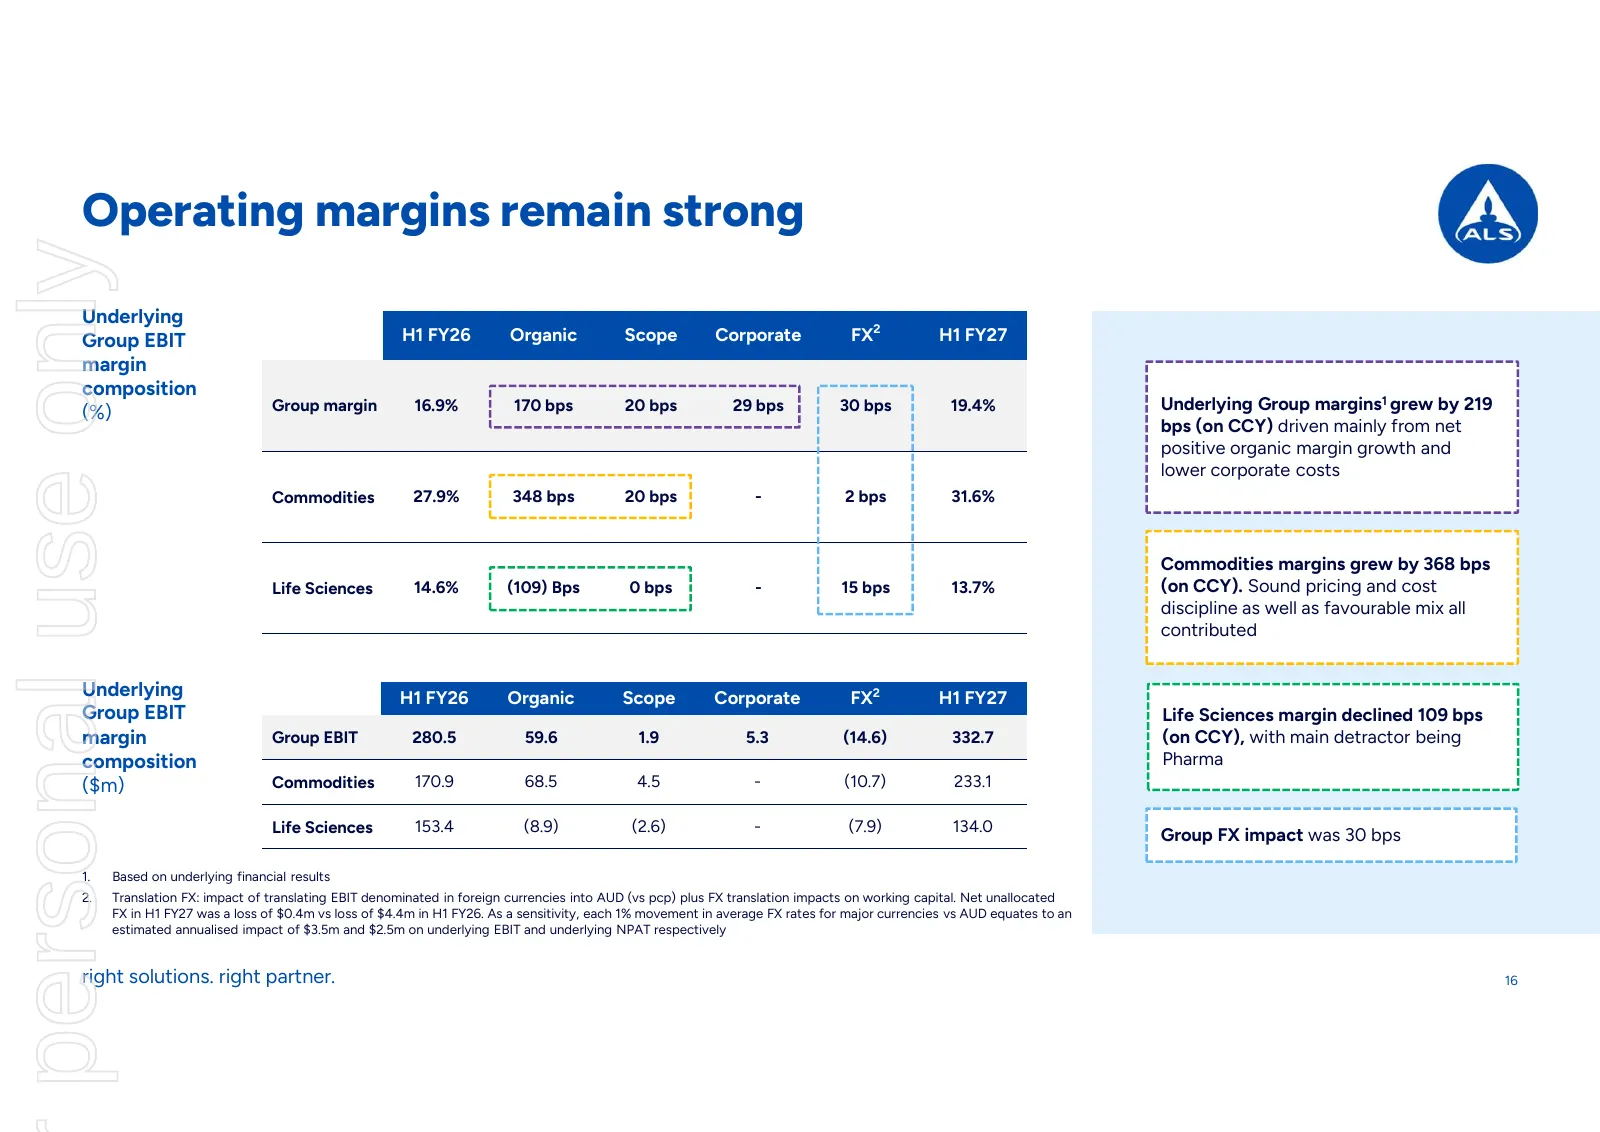
Operating margins remain strong personal use only Underlying Group EBIT H1 FY26 Organic Scope Corporate FX2 H1 FY27 margin composition Group margin 16.9% 170 bps 20 bps 29 bps 30 bps 19.4% Underlying Group margins1 grew by 219 (%) bps (on CCY) driven mainly from net positive organic margin growth an
Slide 17: Capital management delivering on objectives
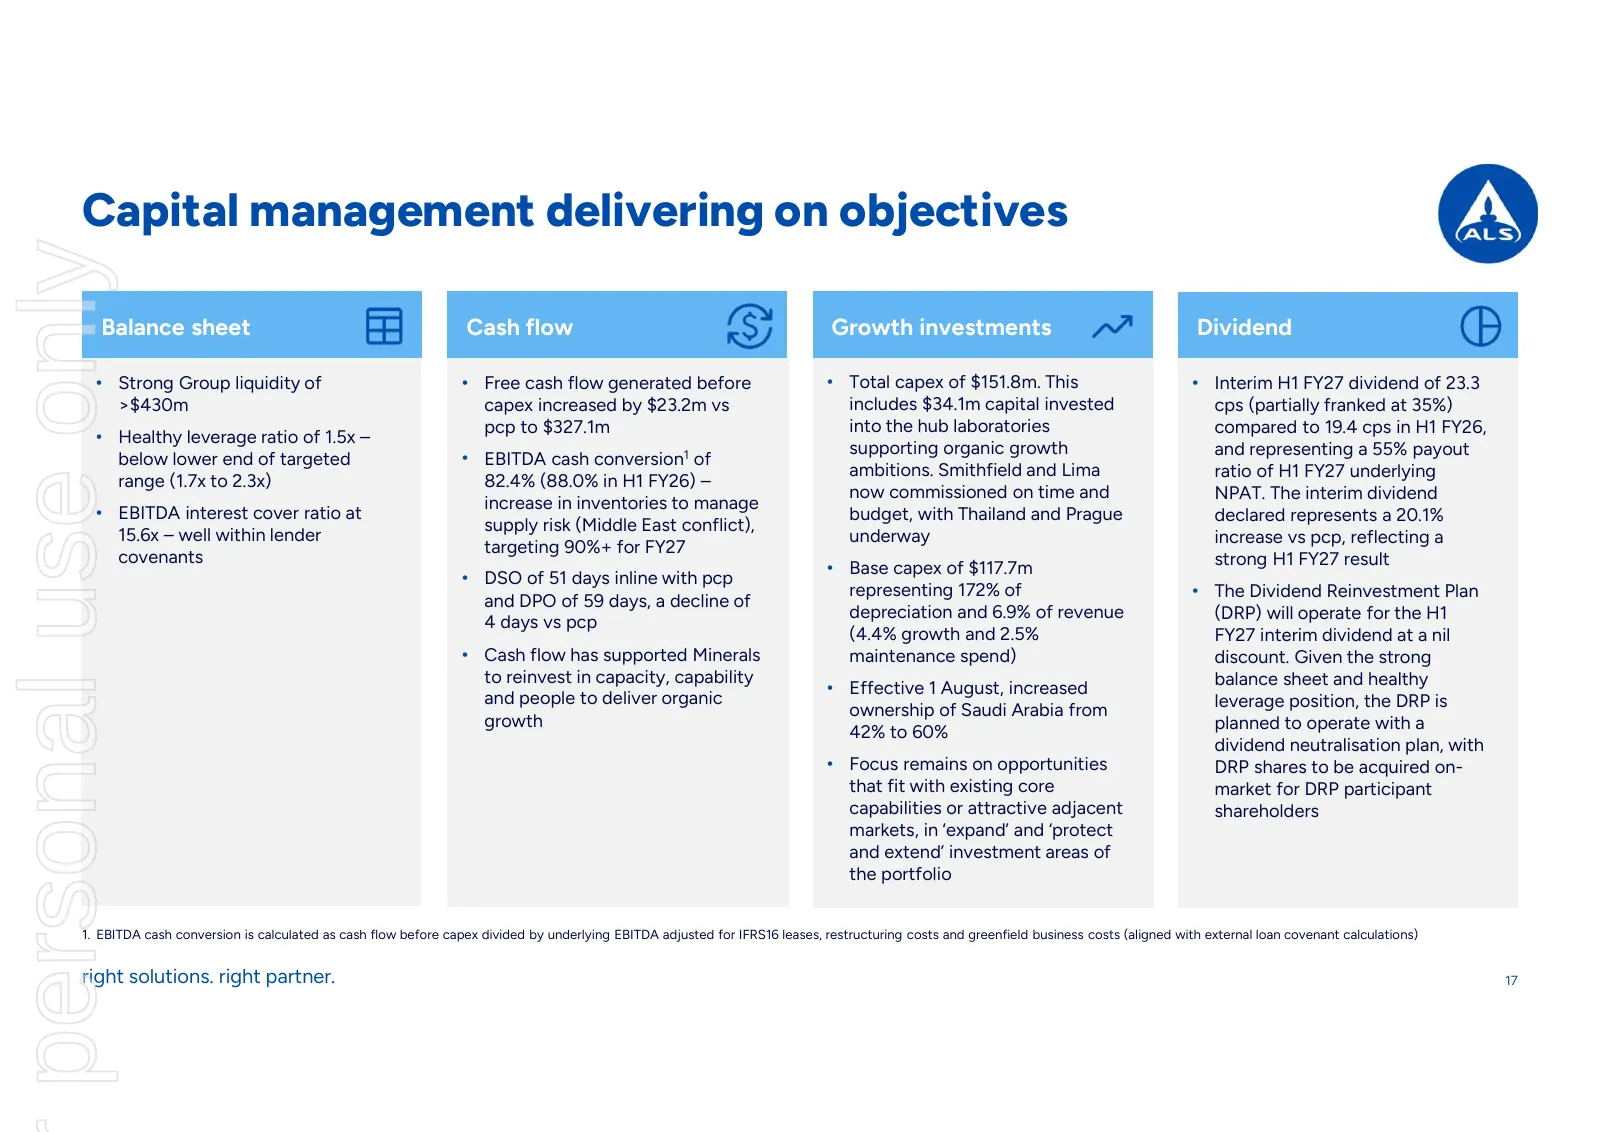
Capital management delivering on objectives personal use only Balance sheet Cash flow Growth investments Dividend • Strong Group liquidity of • Free cash flow generated before • Total capex of $151.8m. This • Interim H1 FY27 dividend of 23.3 >$430m capex increased by $23.2m vs includes $34.1m capita
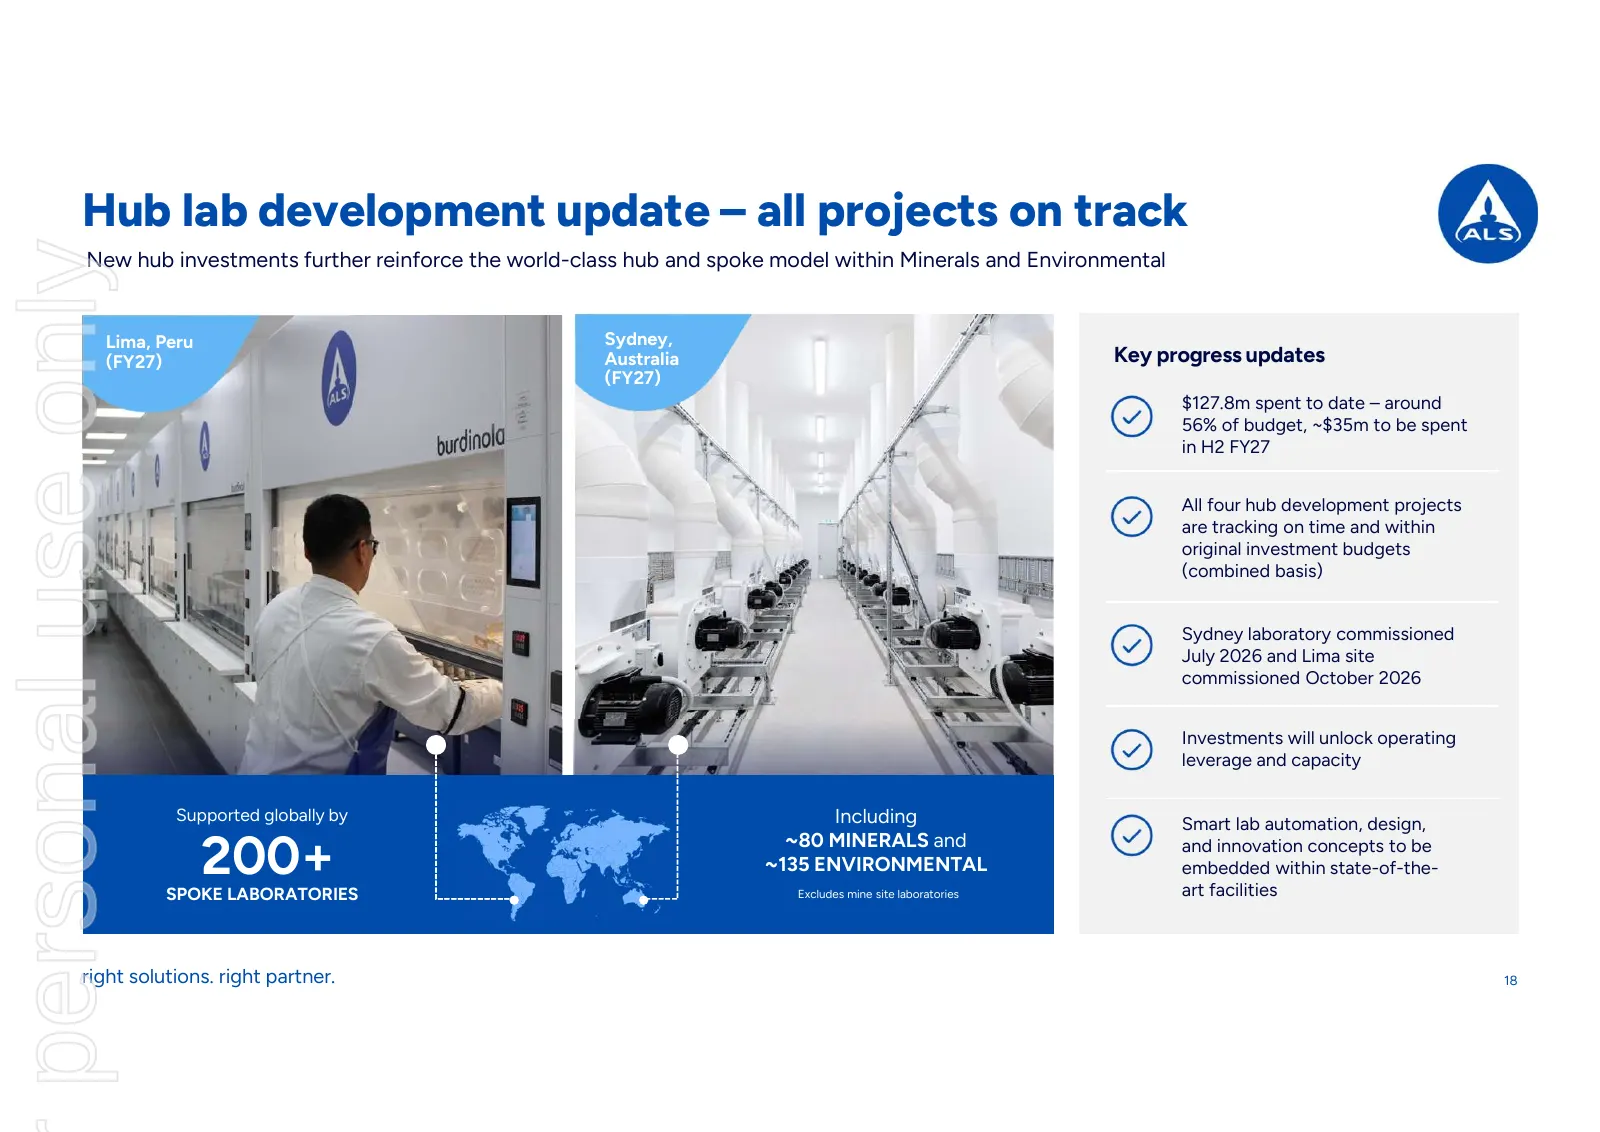
Slide 18: Hub lab development update – all projects on track
Hub lab development update – all projects on track personal use only New hub investments further reinforce the world-class hub and spoke model within Minerals and Environmental Lima, Peru Sydney, (FY27) Australia Key progress updates (FY27) $127.8m spent to date – around 56% of budget, ~$35m to be s
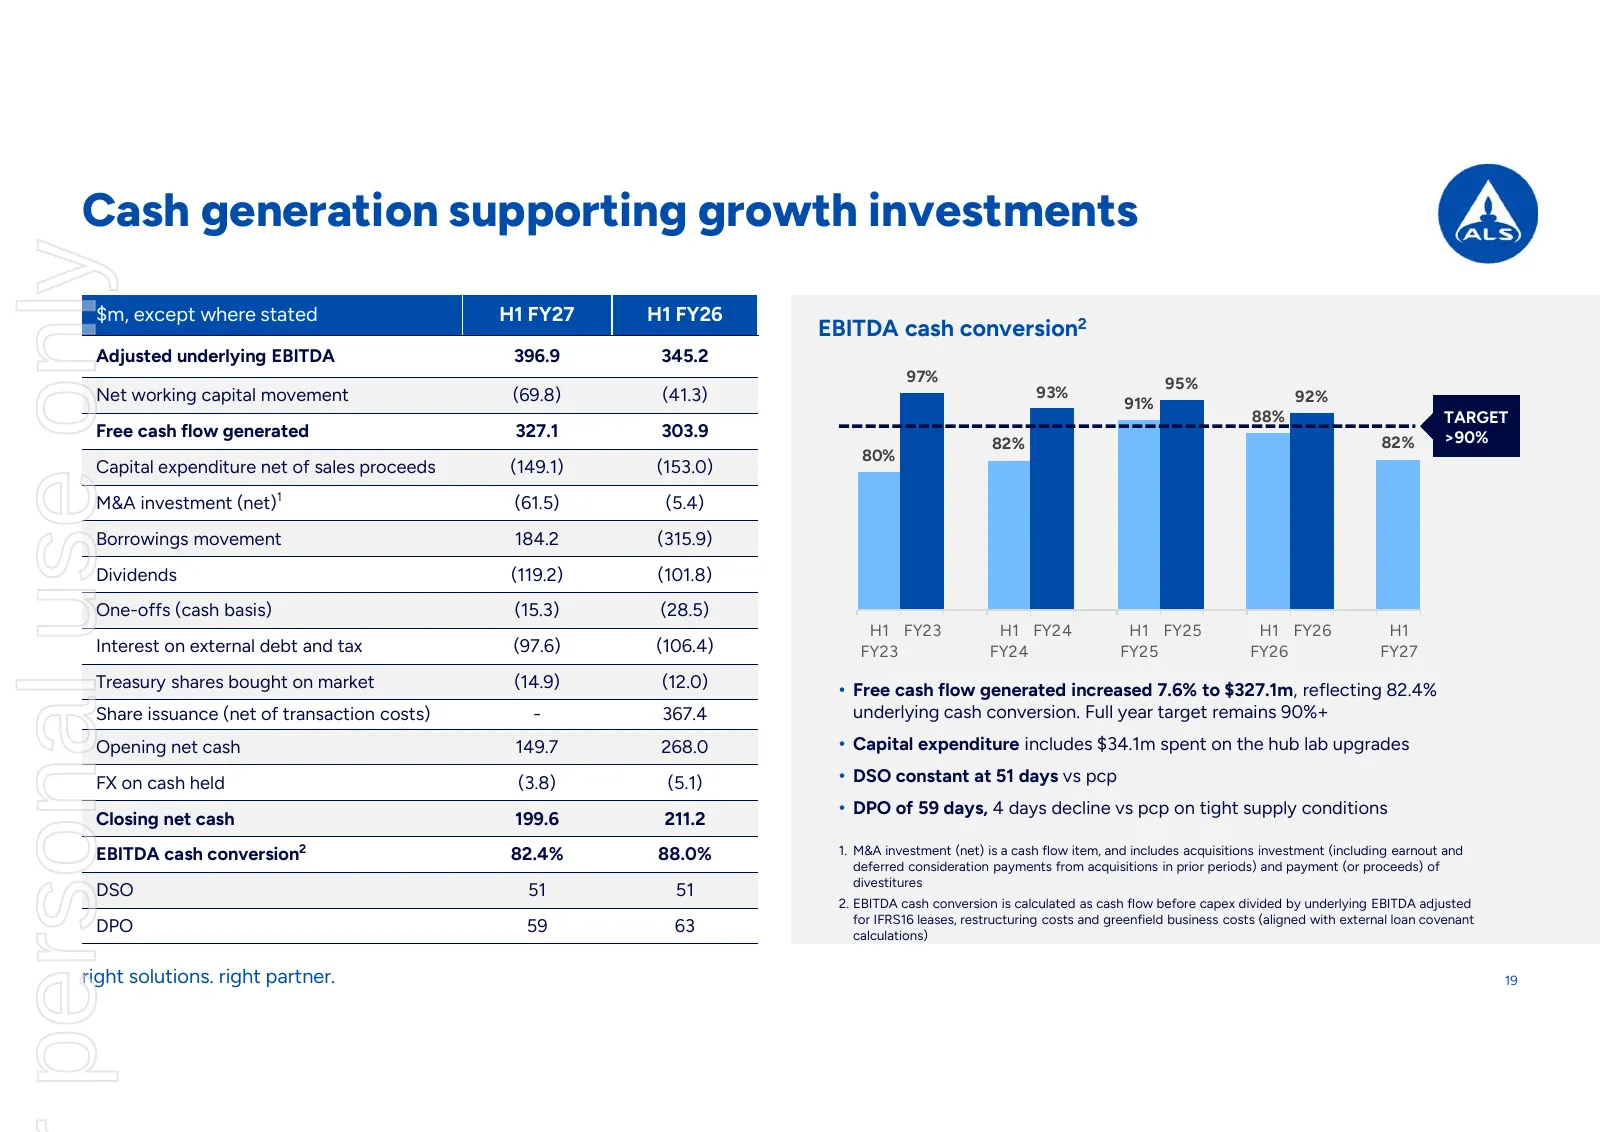
Slide 19: Cash generation supporting growth investments
Cash generation supporting growth investments personal use only $m, except where stated H1 FY27 H1 FY26 EBITDA cash conversion2 Adjusted underlying EBITDA 396.9 345.2 97% 95% Net working capital movement (69.8) (41.3) 93% 92% 91% 88% TARGET Free cash flow generated 327.1 303.9 >90% 82% 82% 80% Capit
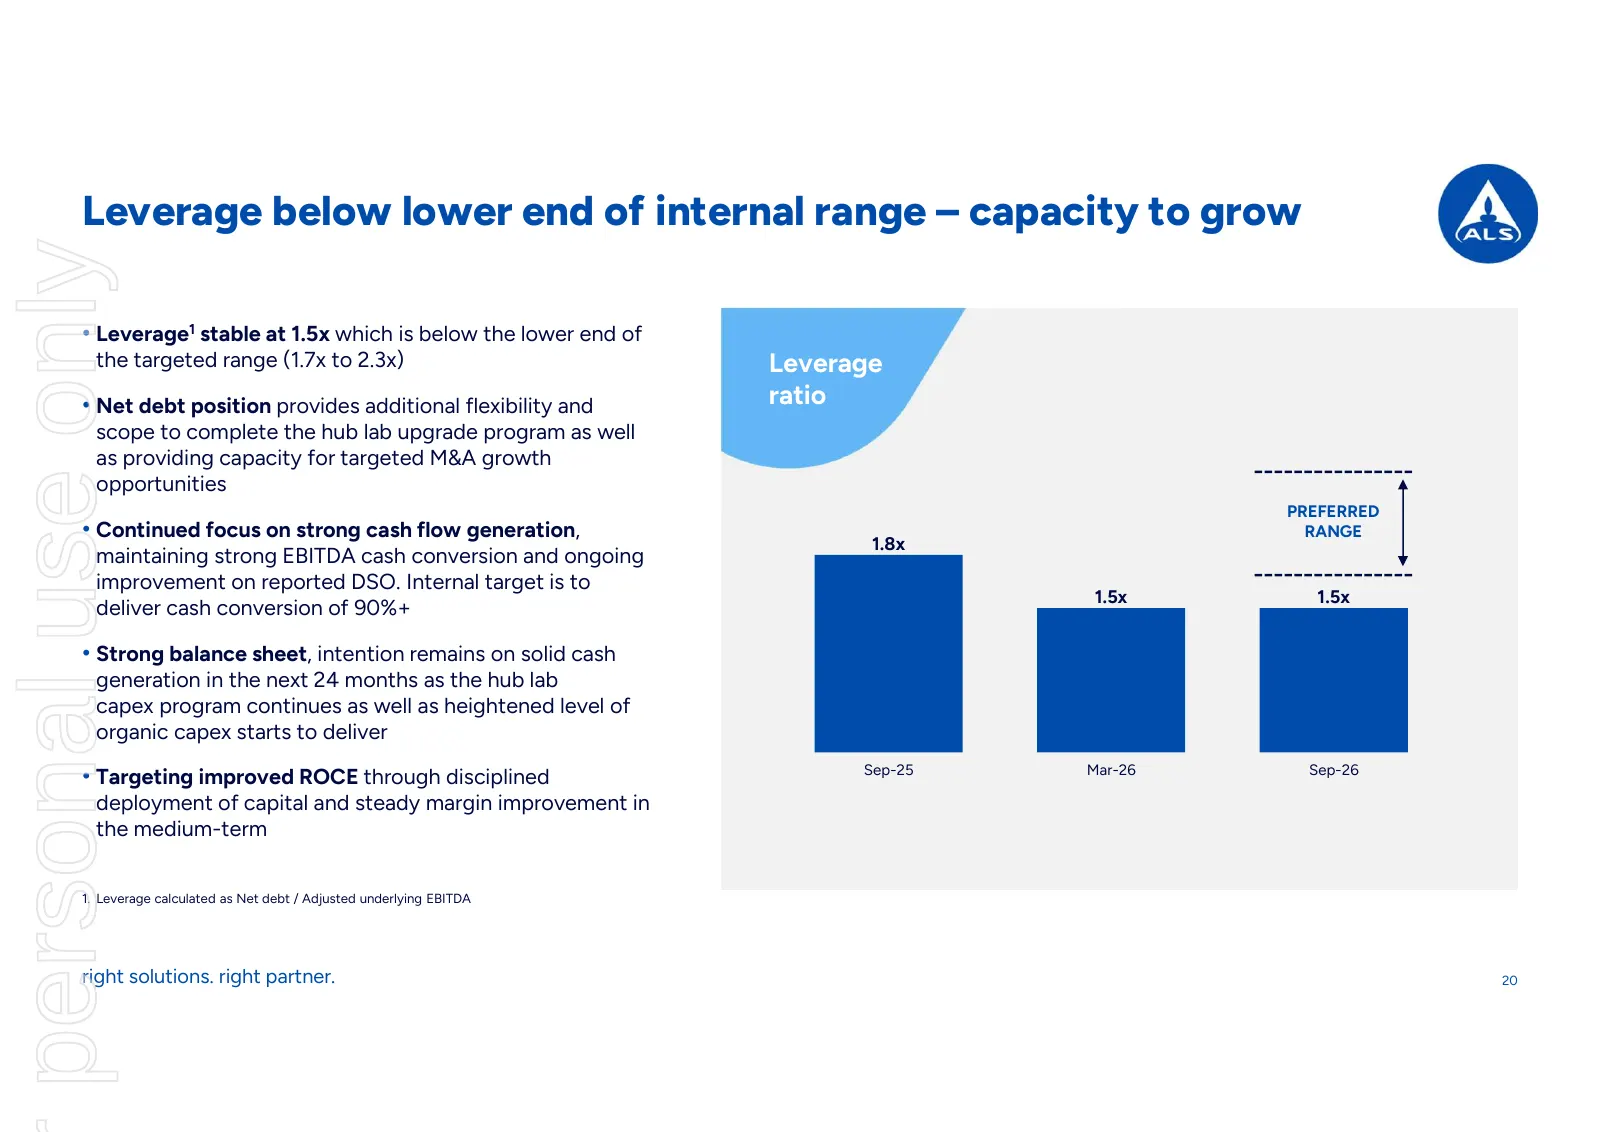
Slide 20: Leverage below lower end of internal range – capacity to grow
Leverage below lower end of internal range – capacity to grow personal use only • Leverage1 stable at 1.5x which is below the lower end of the targeted range (1.7x to 2.3x) Leverage • Net debt position provides additional flexibility and ratio scope to complete the hub lab upgrade program as well as
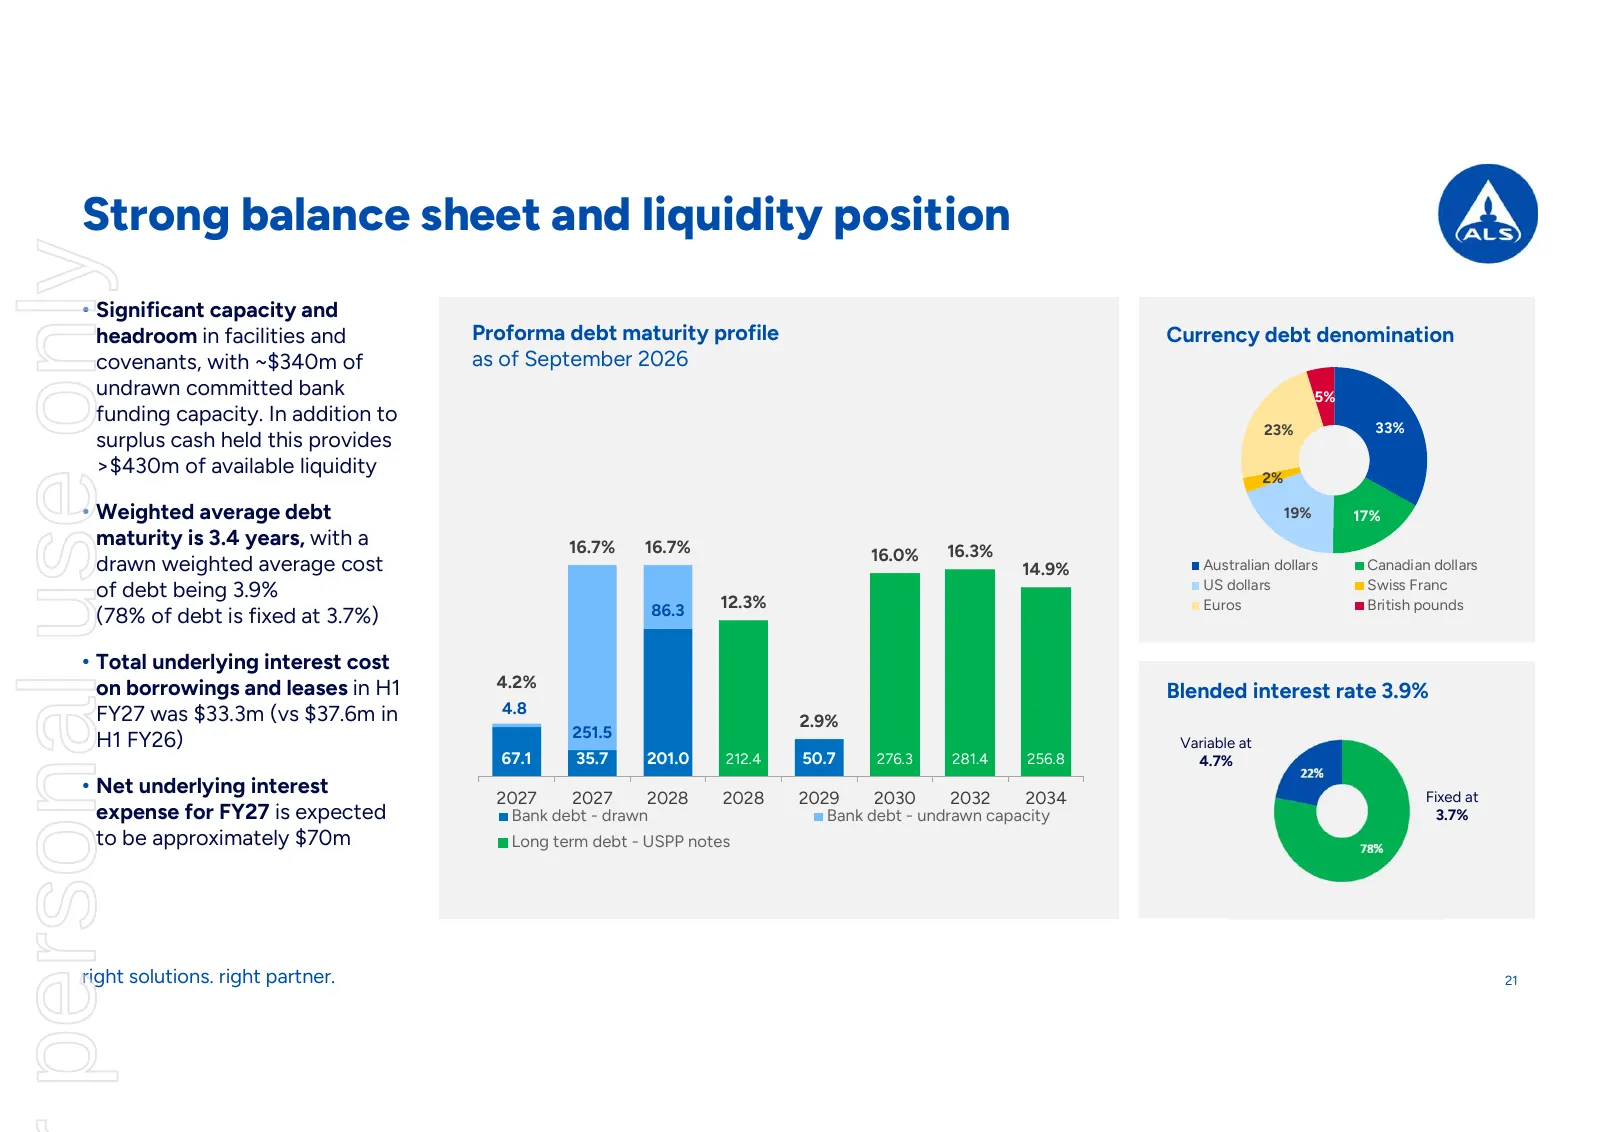
Slide 21: Strong balance sheet and liquidity position
Strong balance sheet and liquidity position personal use only • Significant capacity and headroom in facilities and Proforma debt maturity profile Currency debt denomination covenants, with ~$340m of as of September 2026 undrawn committed bank 5% funding capacity. In addition to 23% 33% surplus cash
Slide 22: Corporate costs at lower end of expectations
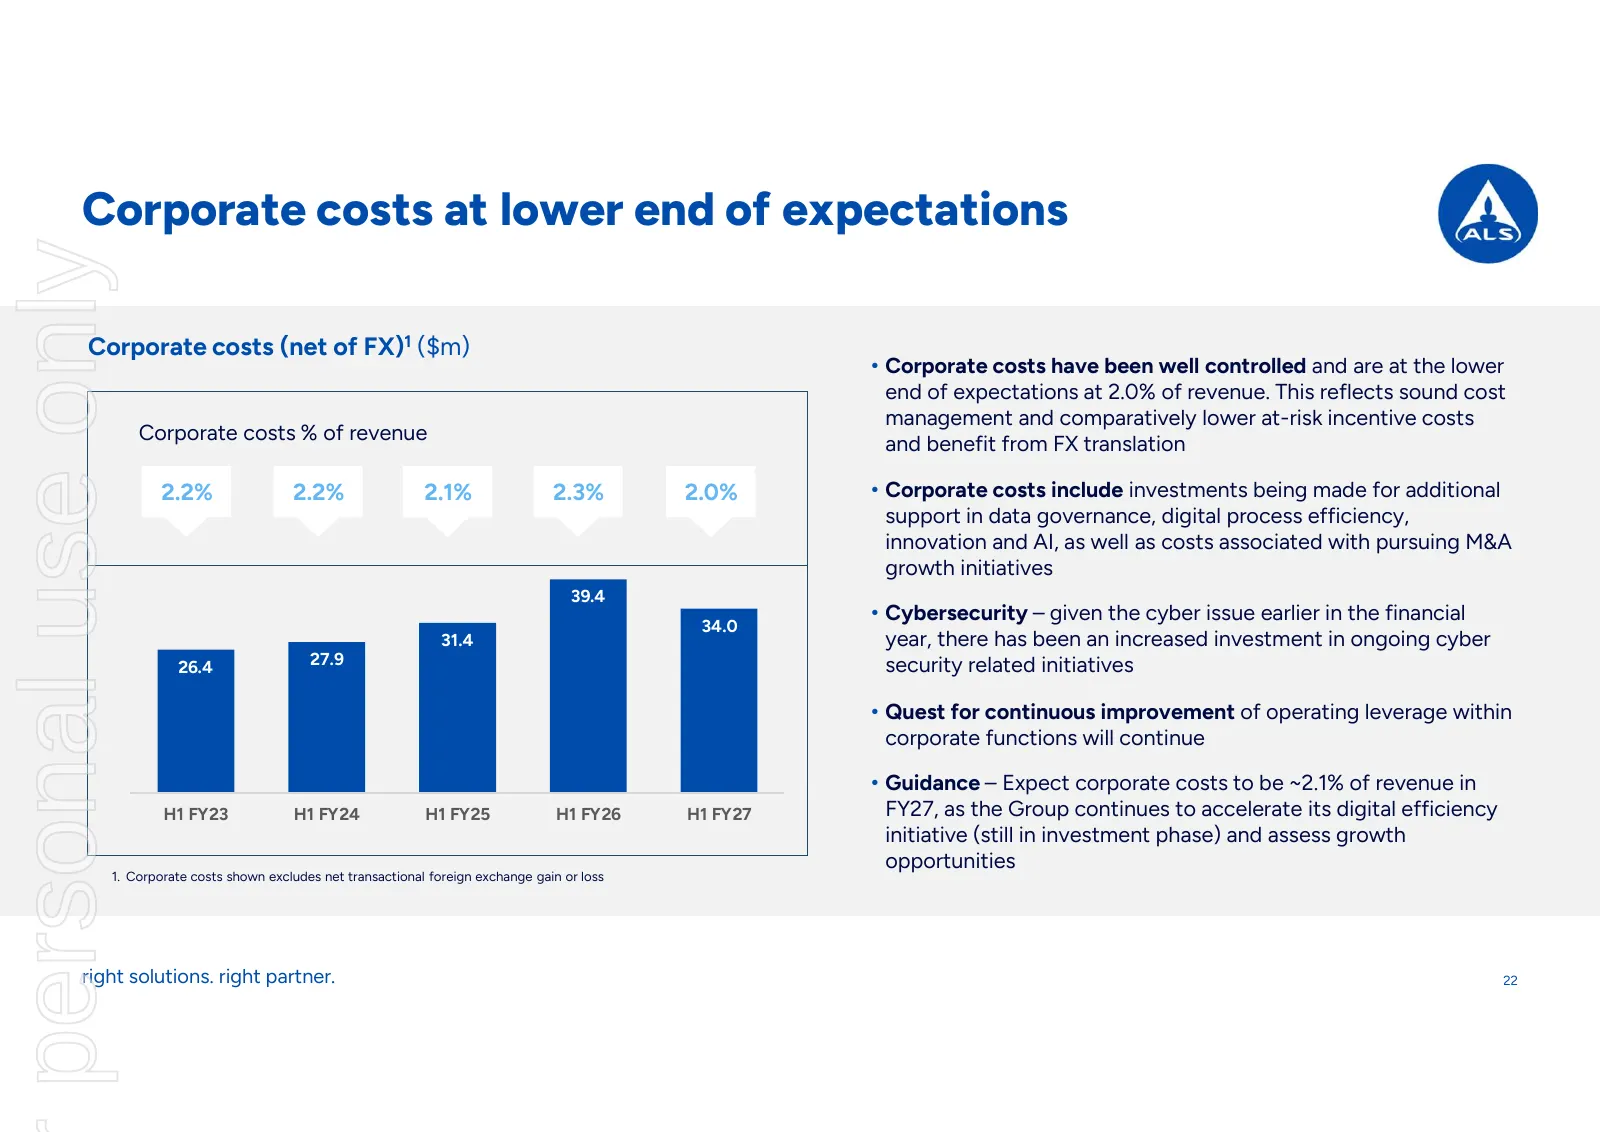
Corporate costs at lower end of expectations personal use only Corporate costs (net of FX)1 ($m) • Corporate costs have been well controlled and are at the lower end of expectations at 2.0% of revenue. This reflects sound cost management and comparatively lower at-risk incentive costs Corporate cost
Slide 23: H1 FY27 scorecard and priorities ahead
personal use only H1 FY27 scorecard and priorities ahead
Slide 24: H1 FY27 scorecard
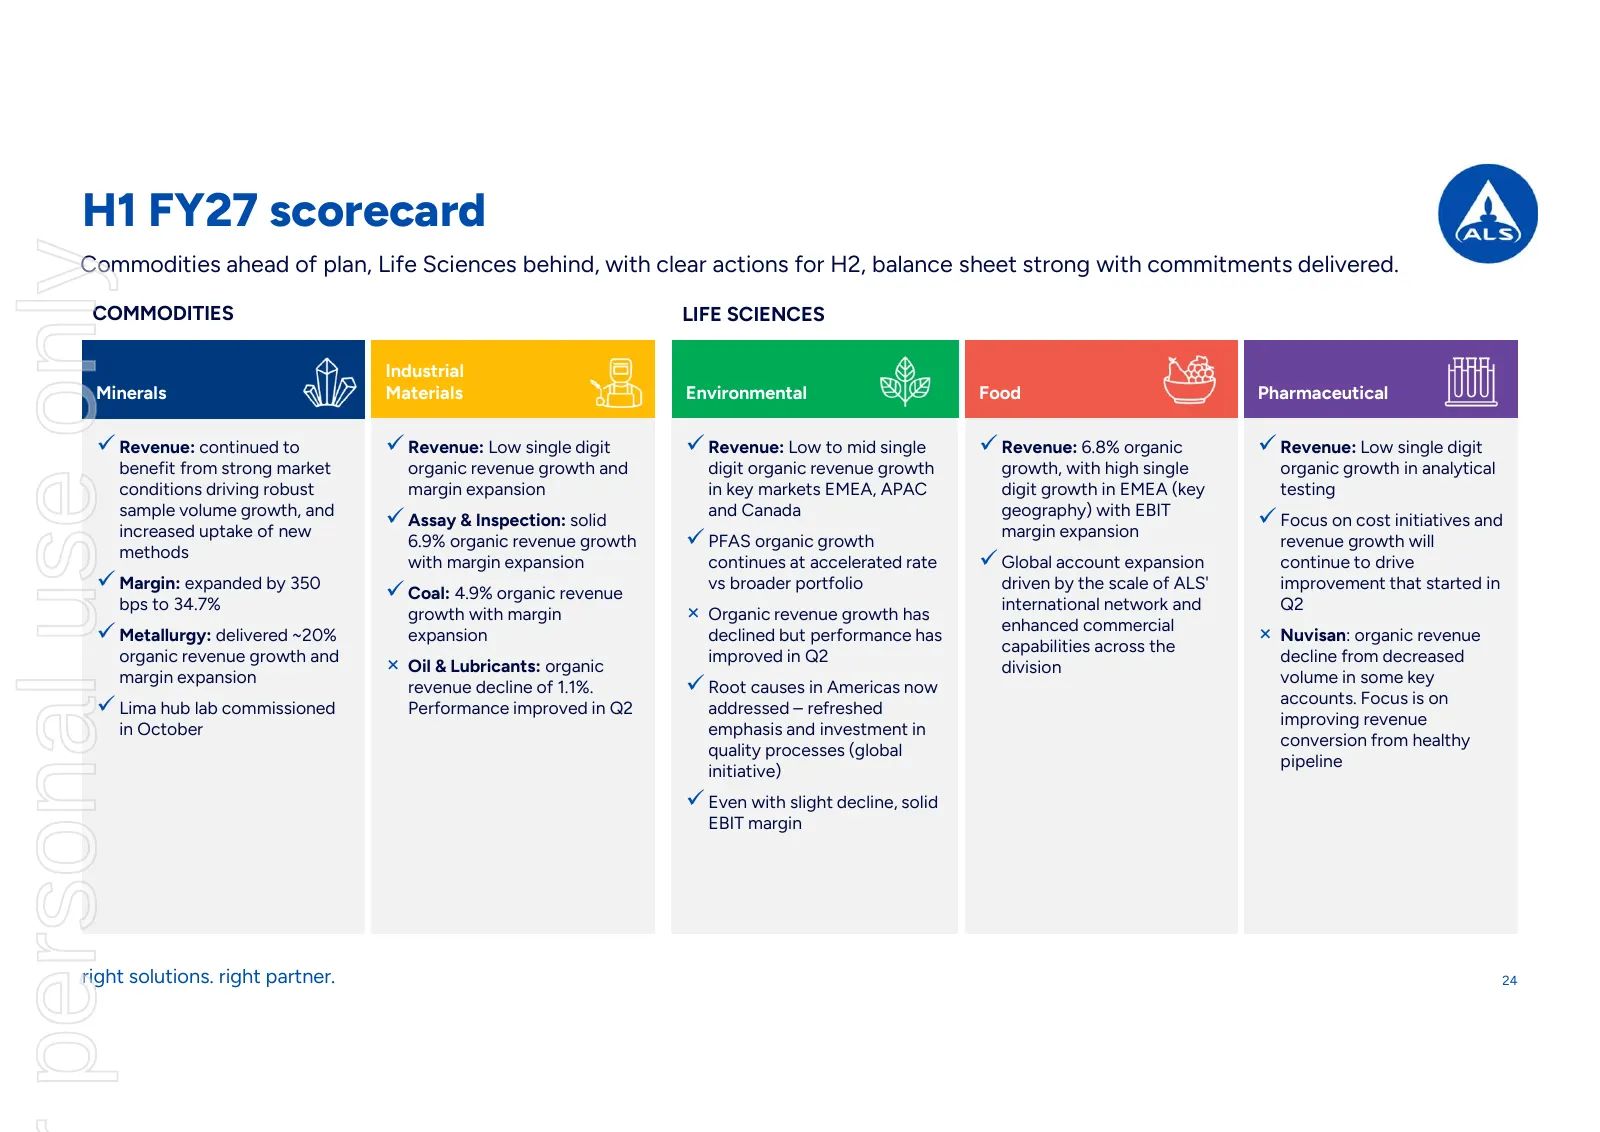
H1 FY27 scorecard personal use only Commodities ahead of plan, Life Sciences behind, with clear actions for H2, balance sheet strong with commitments delivered. COMMODITIES LIFE SCIENCES Industrial Minerals Materials Environmental Food Pharmaceutical Revenue: continued to Revenue: Low single dig
Slide 25: H1 FY27: scaling AI and automation across ALS
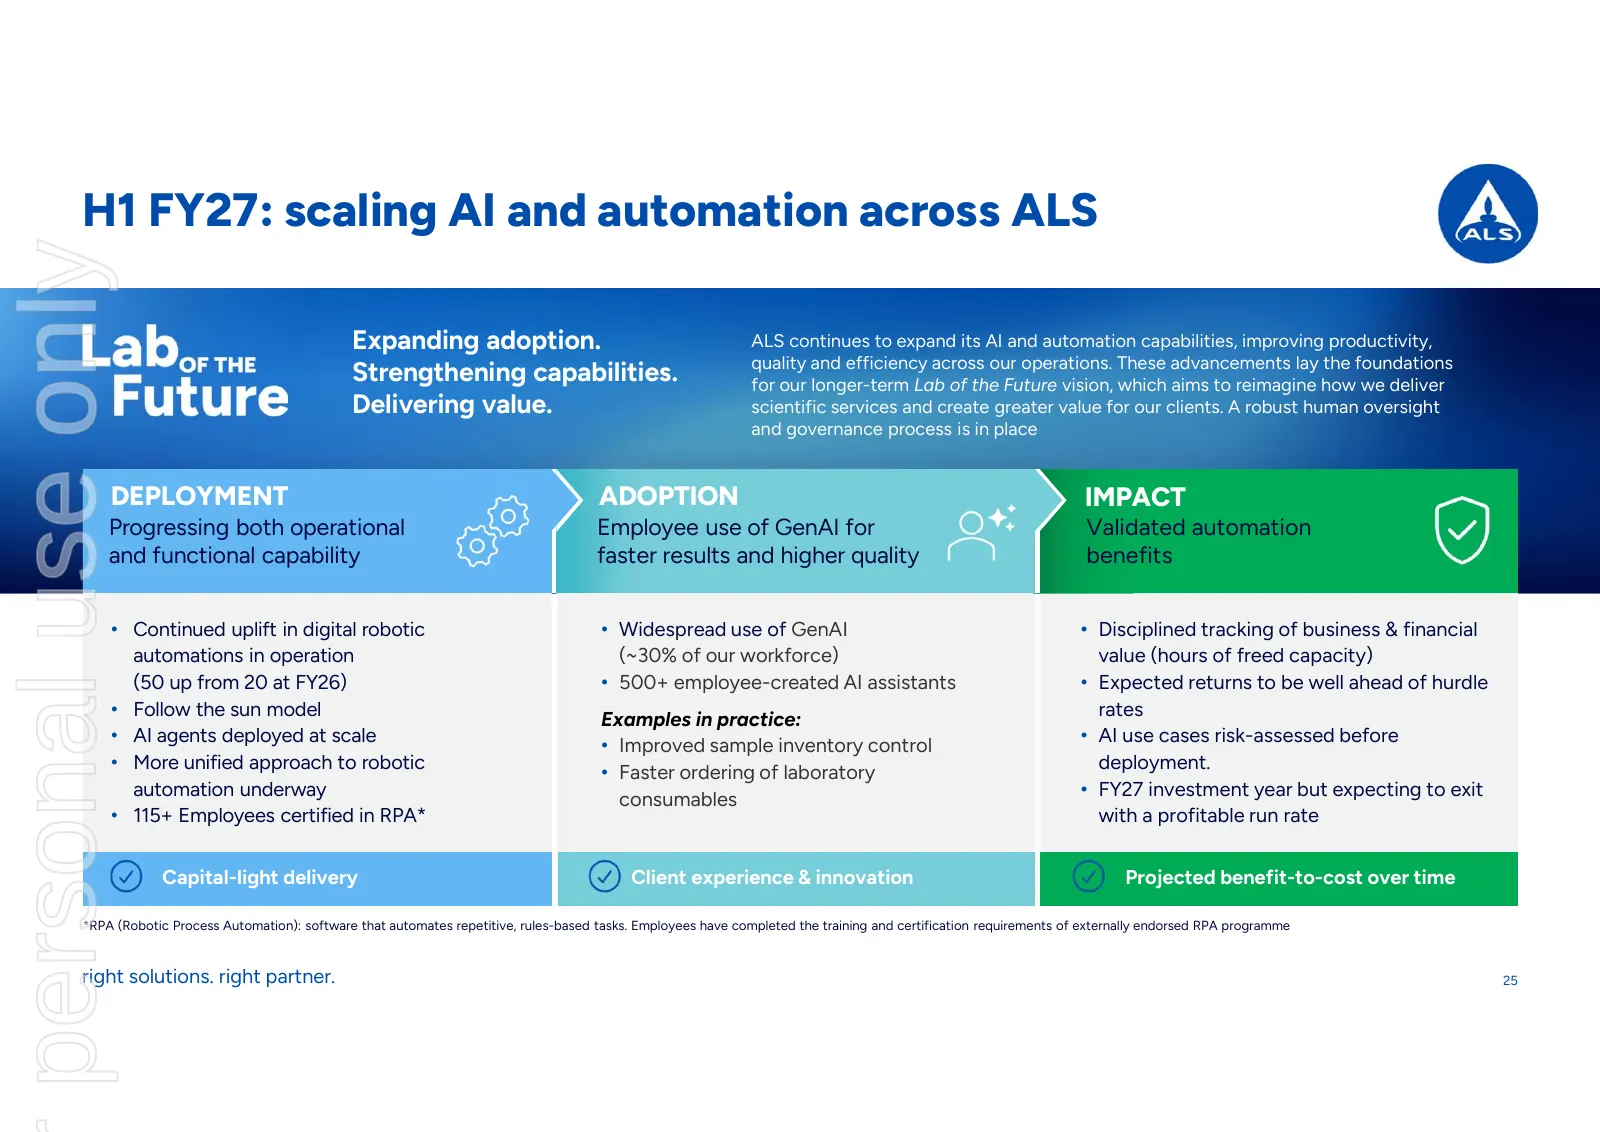
H1 FY27: scaling AI and automation across ALS personal use only Expanding adoption. ALS continues to expand its AI and automation capabilities, improving productivity, quality and efficiency across our operations. These advancements lay the foundations Strengthening capabilities. for our longer-term
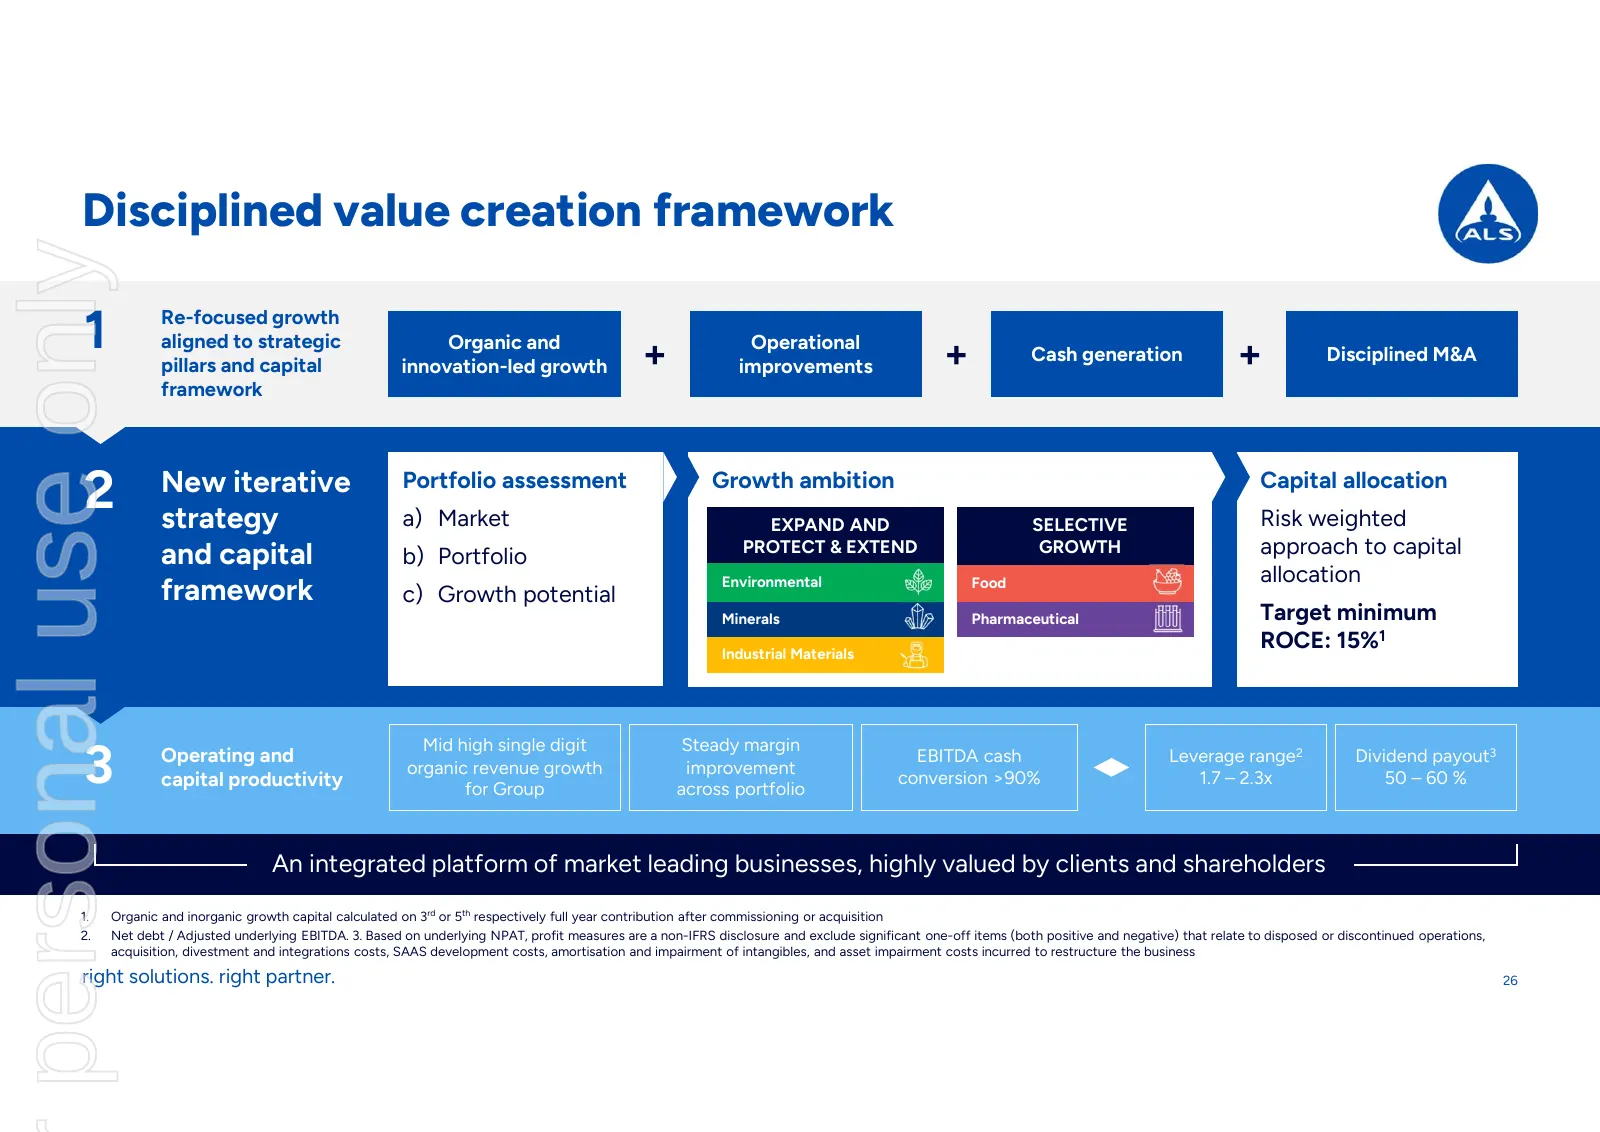
Slide 26: Disciplined value creation framework
Disciplined value creation framework personal use only 1 Re-focused growth aligned to strategic pillars and capital Organic and innovation-led growth + Operational improvements + Cash generation + Disciplined M&A framework 2 New iterative strategy Portfolio assessment a) Market Growth ambition EXPAN
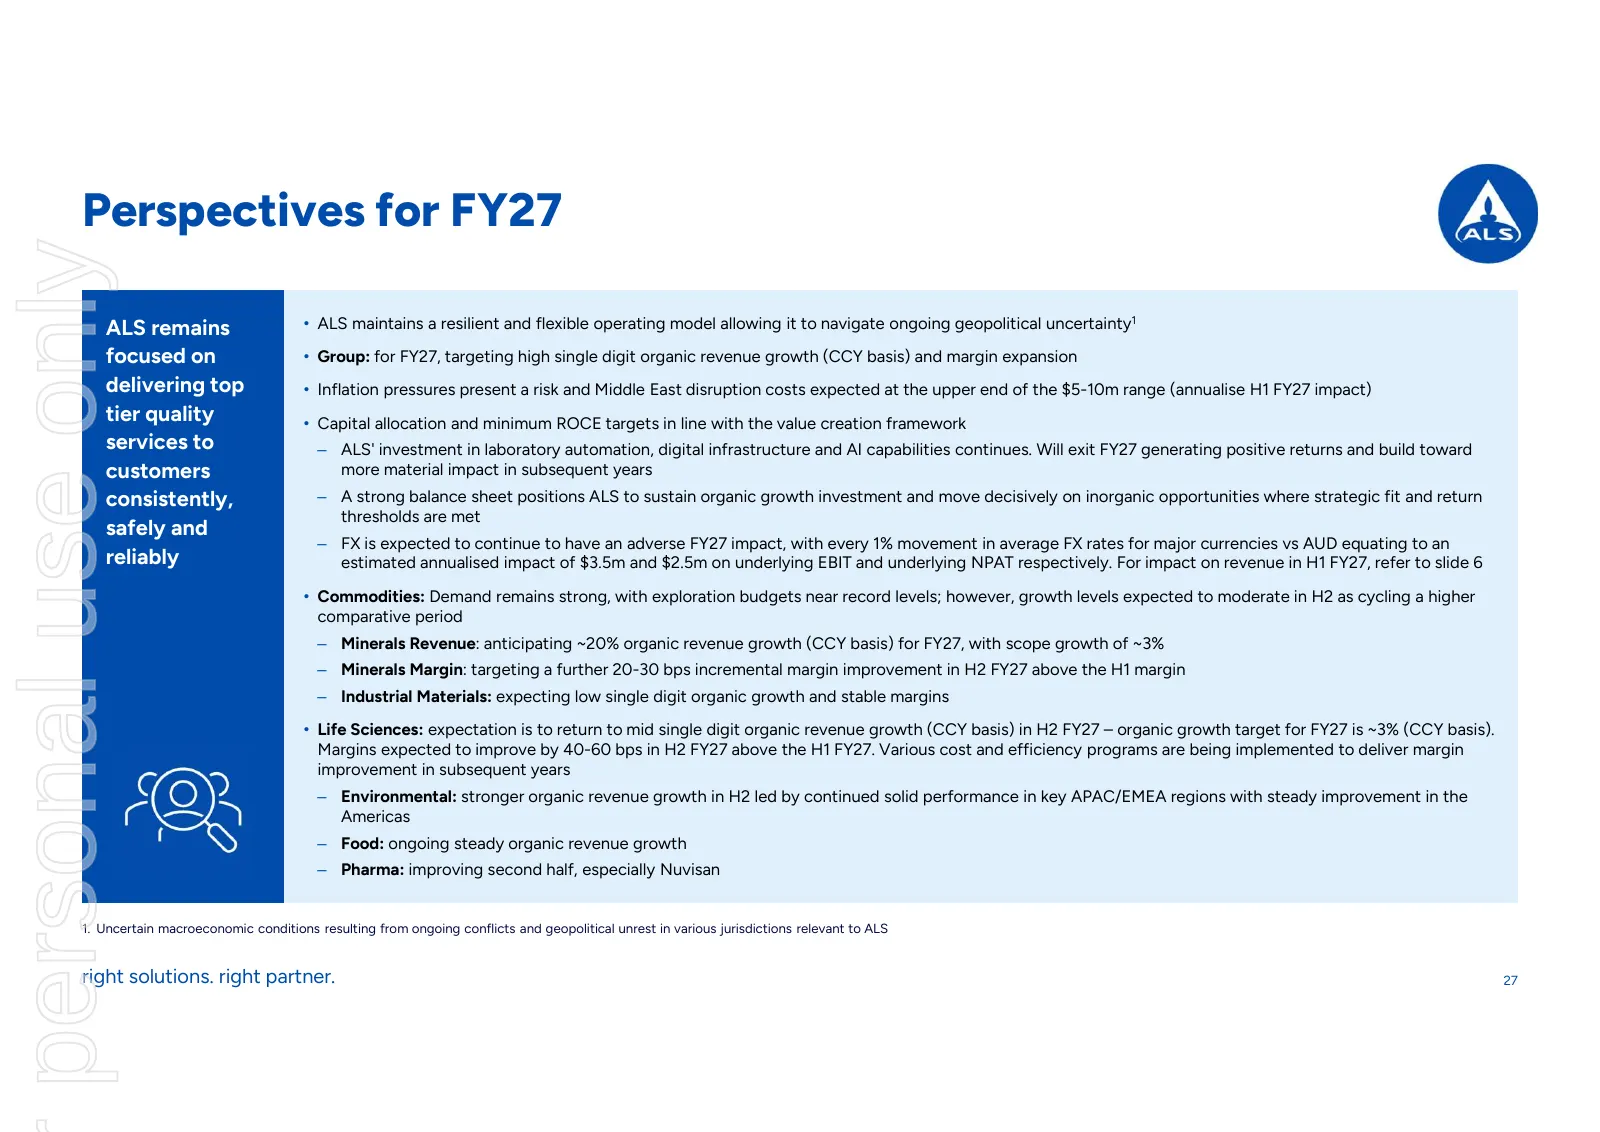
Slide 27: Perspectives for FY27
Perspectives for FY27 personal use only ALS remains • ALS maintains a resilient and flexible operating model allowing it to navigate ongoing geopolitical uncertainty1 focused on • Group: for FY27, targeting high single digit organic revenue growth (CCY basis) and margin expansion delivering top • In
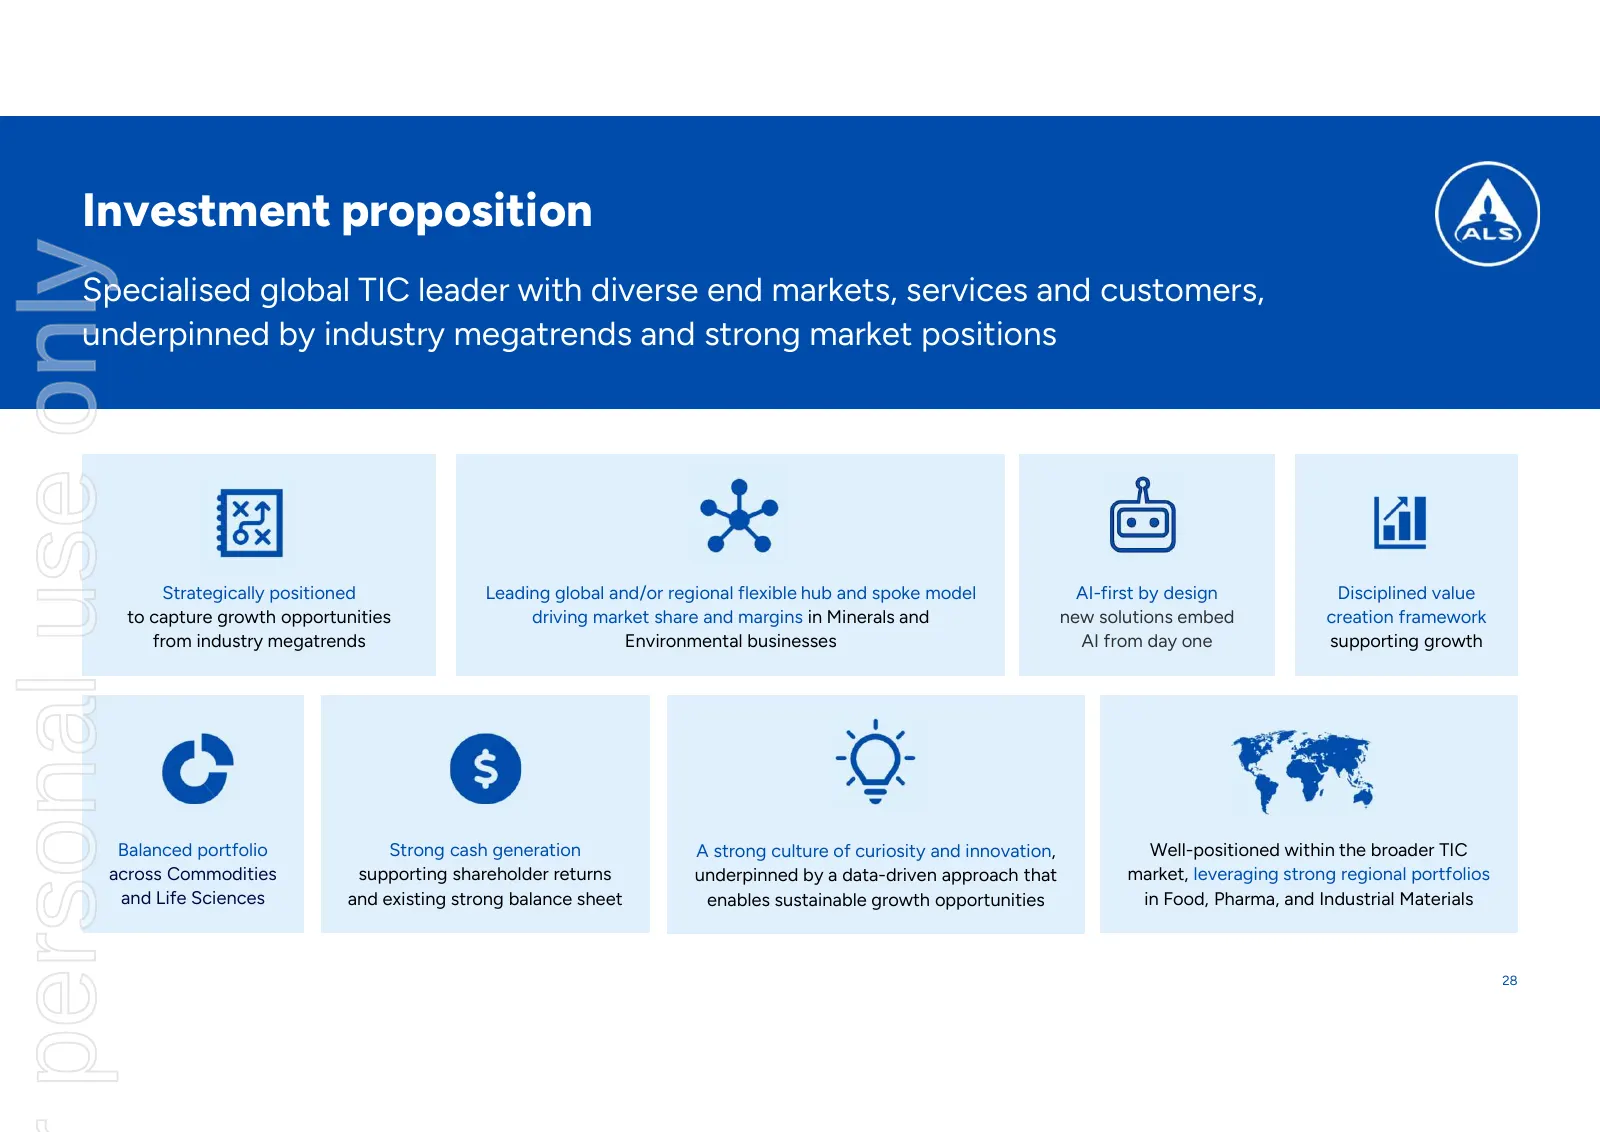
Slide 28: Investment proposition
Investment proposition personal use only Specialised global TIC leader with diverse end markets, services and customers, underpinned by industry megatrends and strong market positions Strategically positioned Leading global and/or regional flexible hub and spoke model AI-first by design Disciplined
Slide 29: Appendix
personal use only Appendix H1 FY27 results
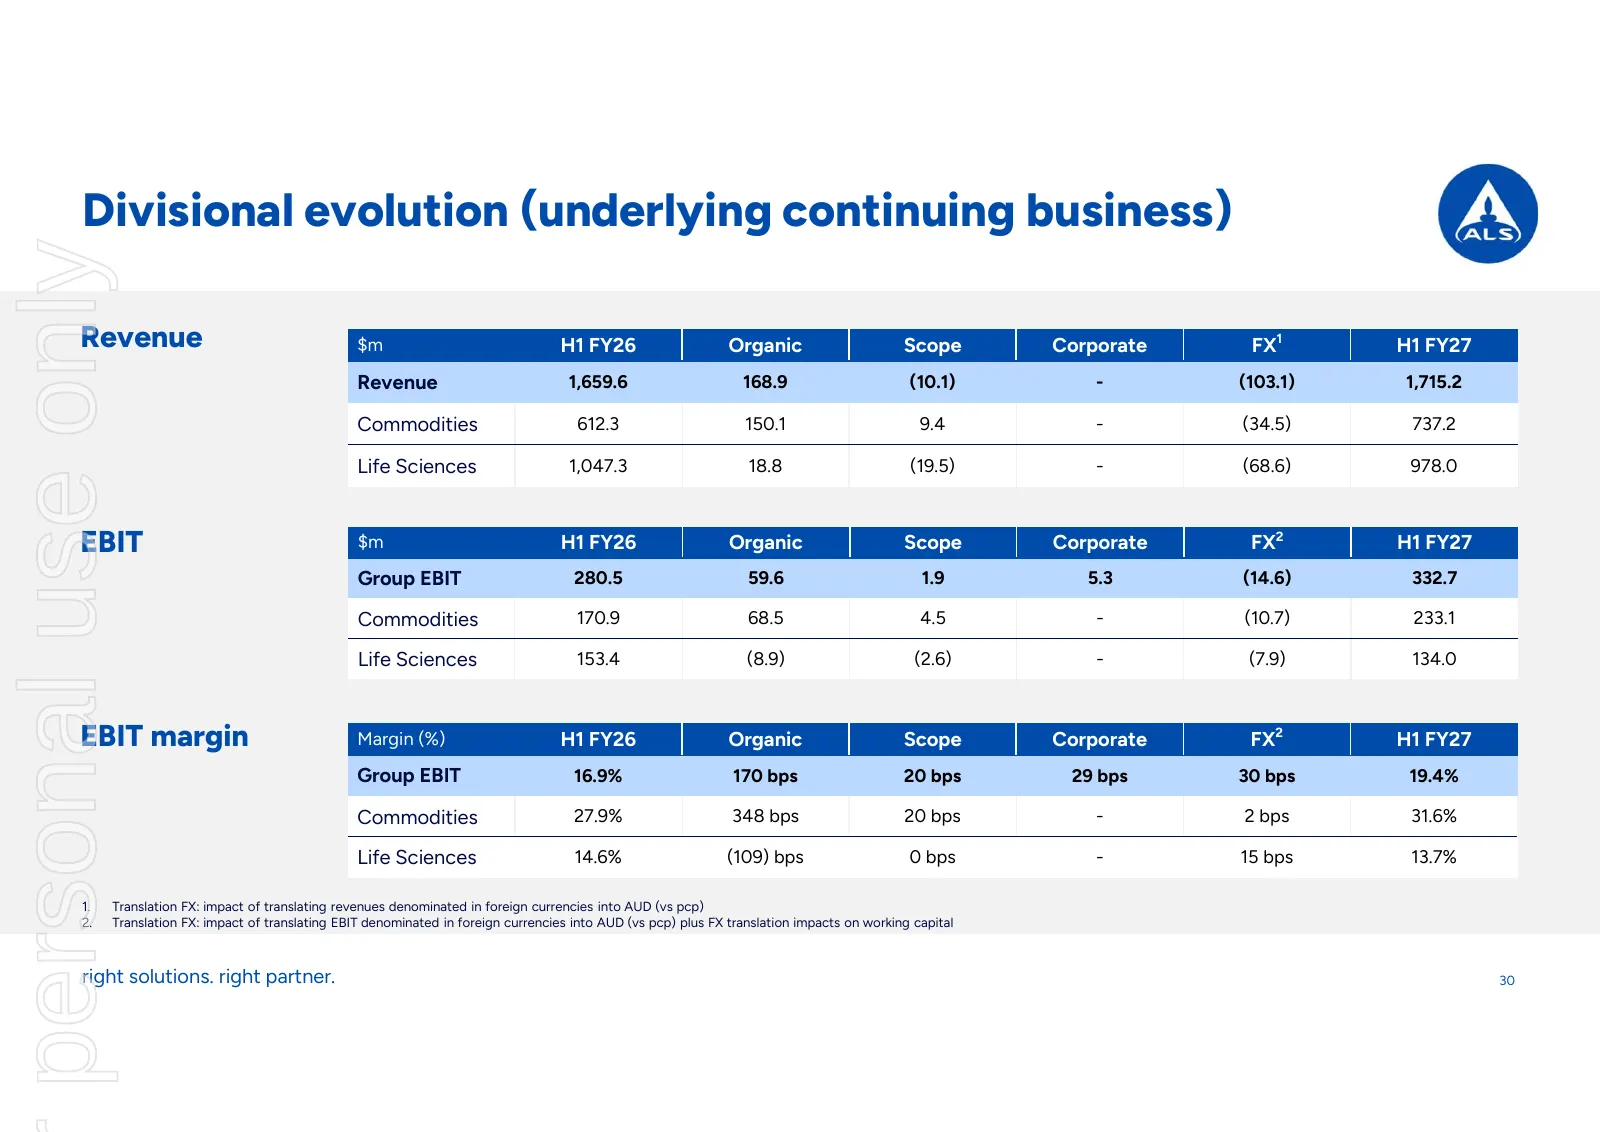
Slide 30: Divisional evolution (underlying continuing business)
Divisional evolution (underlying continuing business) personal use only Revenue $m H1 FY26 Organic Scope Corporate FX1 H1 FY27 Revenue 1,659.6 168.9 (10.1) - (103.1) 1,715.2 Commodities 612.3 150.1 9.4 - (34.5) 737.2 Life Sciences 1,047.3 18.8 (19.5) - (68.6) 978.0 EBIT $m H1 FY26 Organic Scope Corp
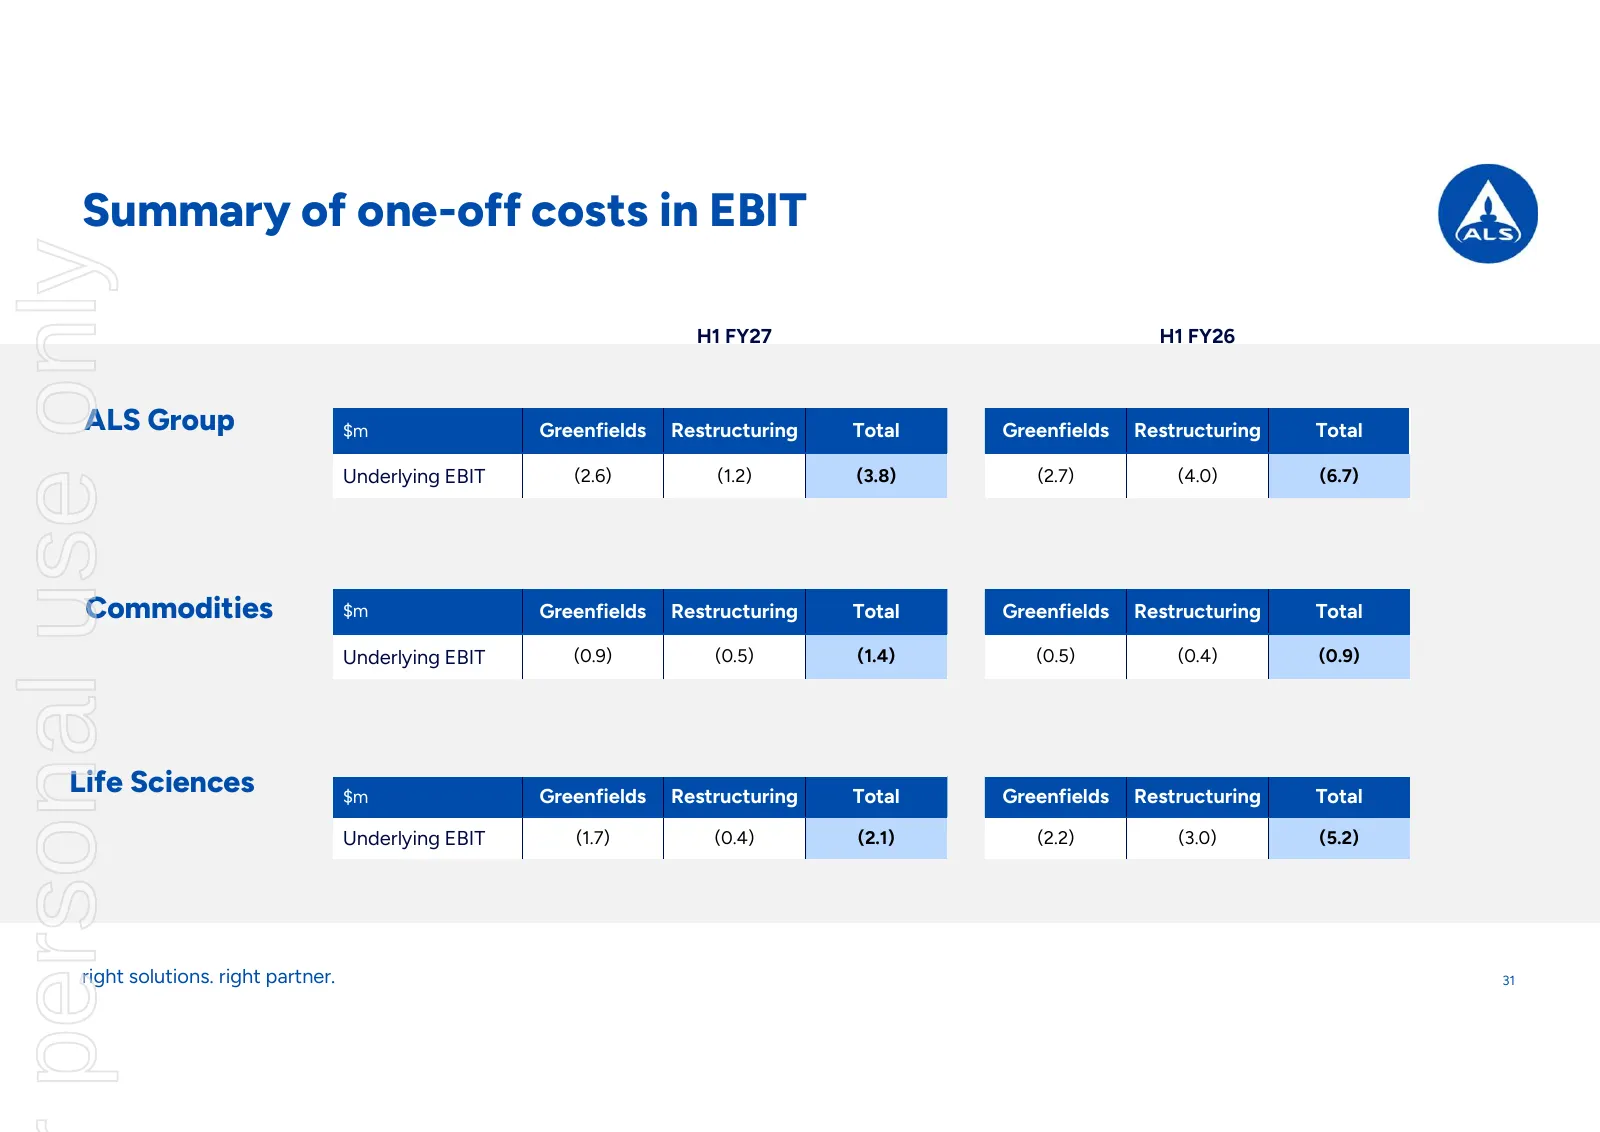
Slide 31: Summary of one-off costs in EBIT
Summary of one-off costs in EBIT personal use only H1 FY27 H1 FY26 ALS Group $m Greenfields Restructuring Total Greenfields Restructuring Total Underlying EBIT (2.6) (1.2) (3.8) (2.7) (4.0) (6.7) Commodities $m Greenfields Restructuring Total Greenfields Restructuring Total Underlying EBIT (0.9) (0.
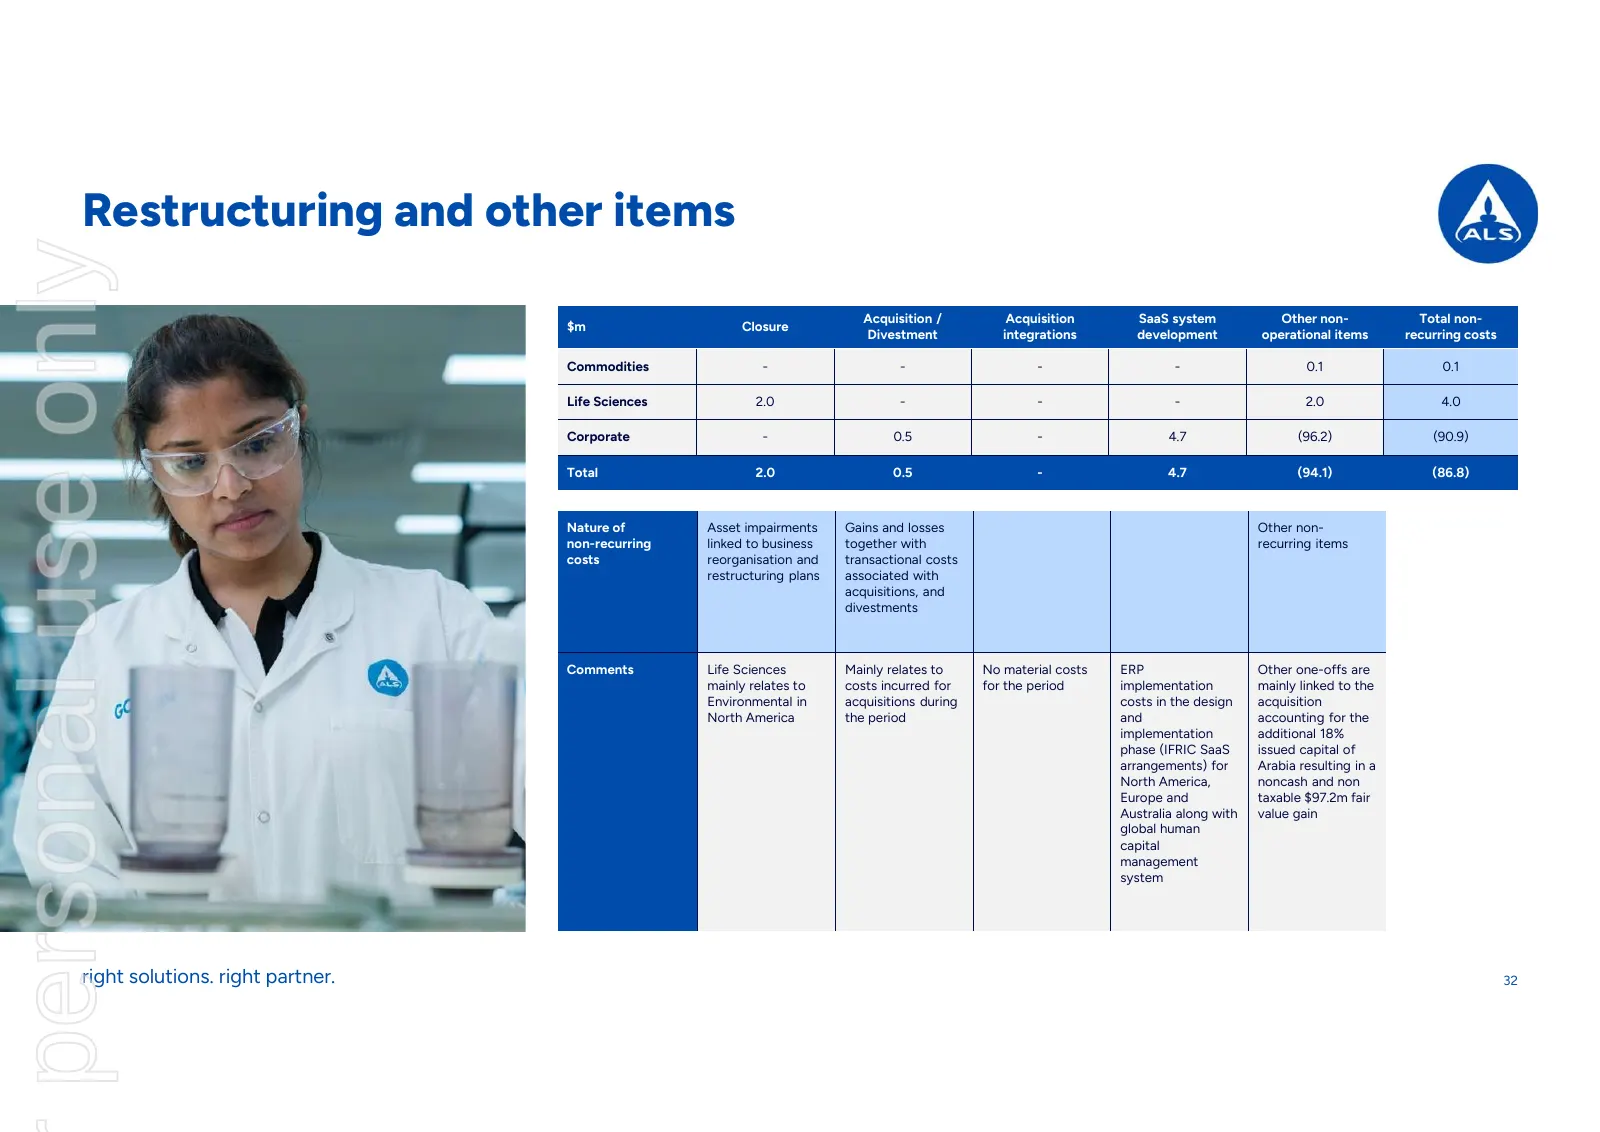
Slide 32: Restructuring and other items
Restructuring and other items personal use only Acquisition / Acquisition SaaS system Other non- Total non- $m Closure Divestment integrations development operational items recurring costs Commodities - - - - 0.1 0.1 Life Sciences 2.0 - - - 2.0 4.0 Corporate - 0.5 - 4.7 (96.2) (90.9) Total 2.0 0.5 -
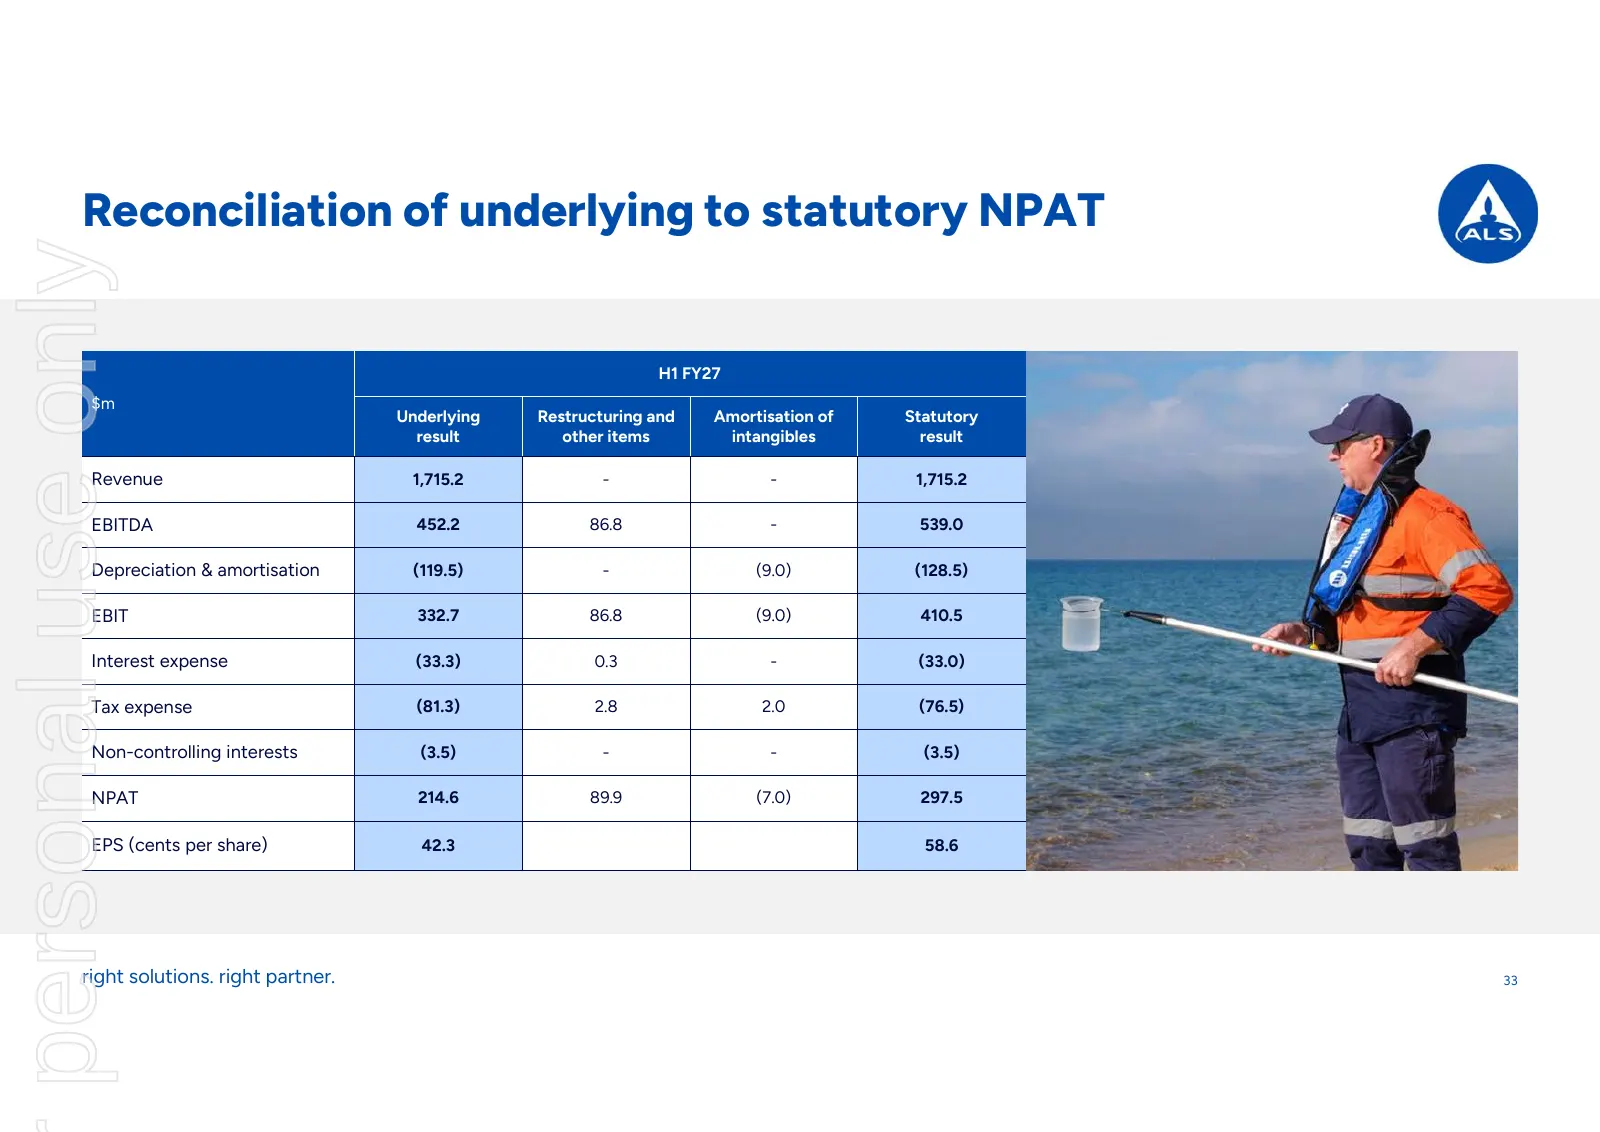
Slide 33: Reconciliation of underlying to statutory NPAT
Reconciliation of underlying to statutory NPAT personal use only H1 FY27 $m Underlying Restructuring and Amortisation of Statutory result other items intangibles result Revenue 1,715.2 - - 1,715.2 EBITDA 452.2 86.8 - 539.0 Depreciation & amortisation (119.5) - (9.0) (128.5) EBIT 332.7 86.8 (9.0) 410
Slide 34: Underlying effective tax rate movement
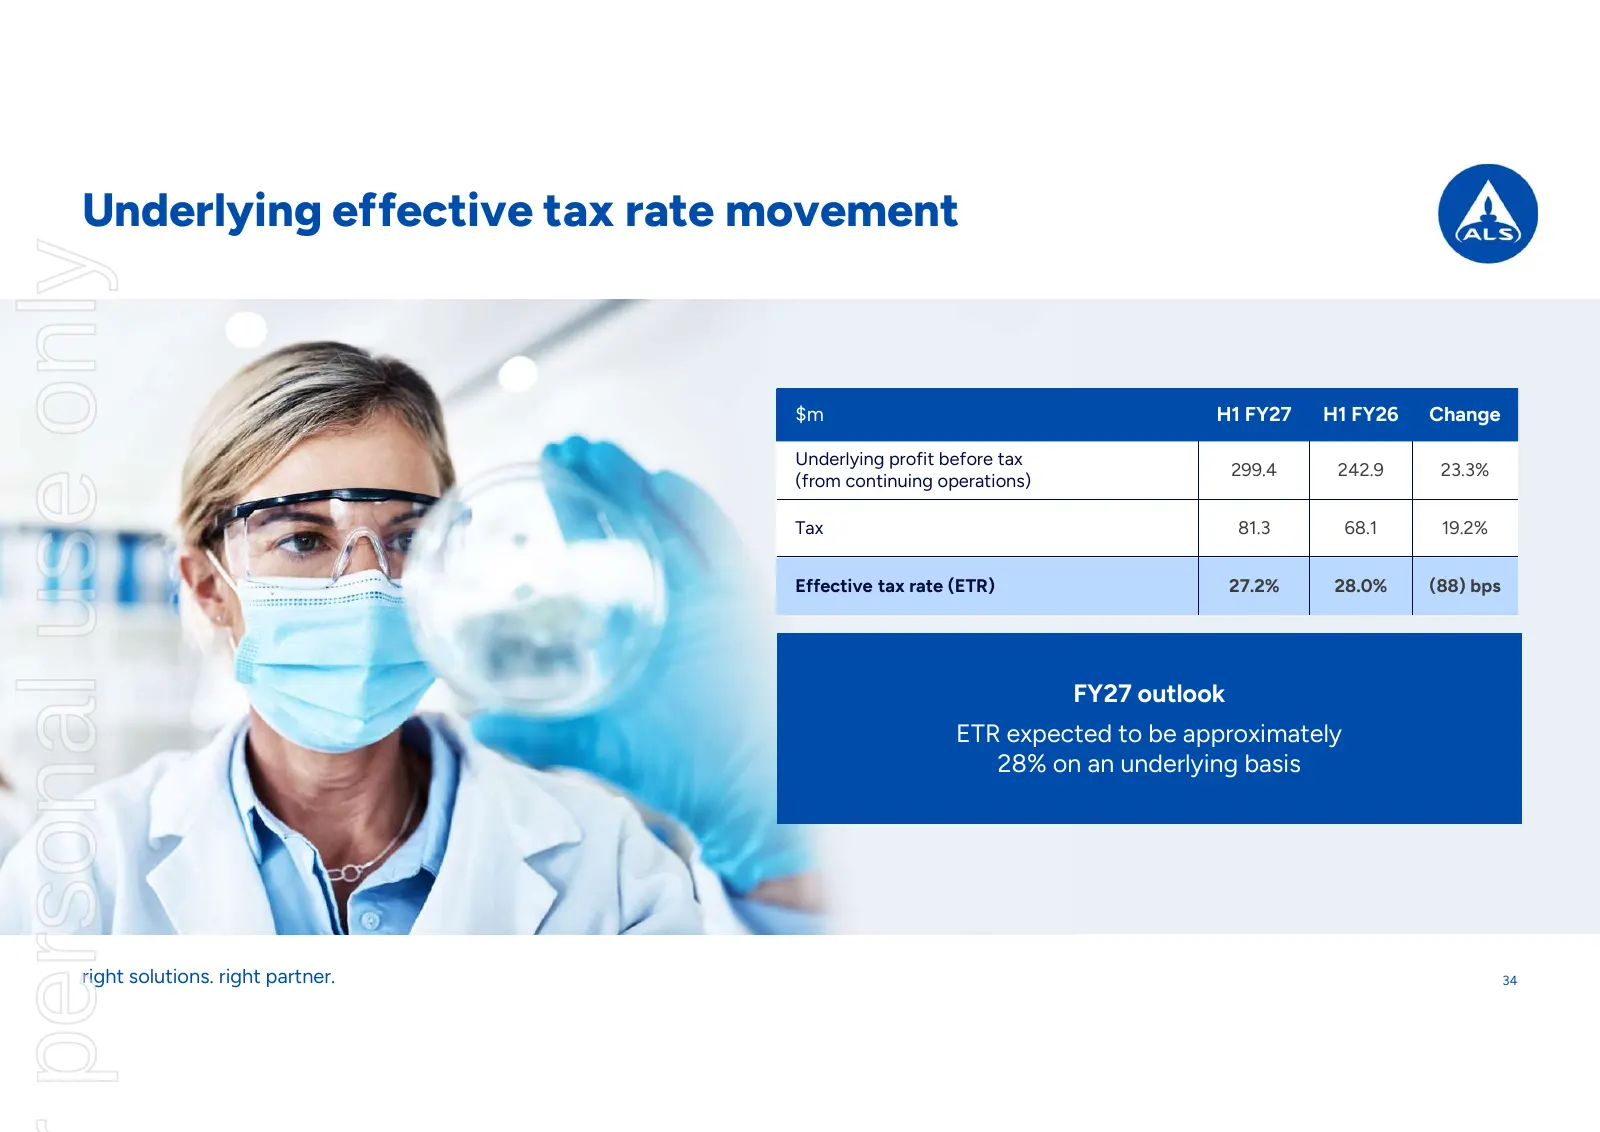
Underlying effective tax rate movement personal use only $m H1 FY27 H1 FY26 Change Underlying profit before tax 299.4 242.9 23.3% (from continuing operations) Tax 81.3 68.1 19.2% Effective tax rate (ETR) 27.2% 28.0% (88) bps FY27 outlook ETR expected to be approximately 28% on an underlying basis ri
Slide 35: Average FX rates
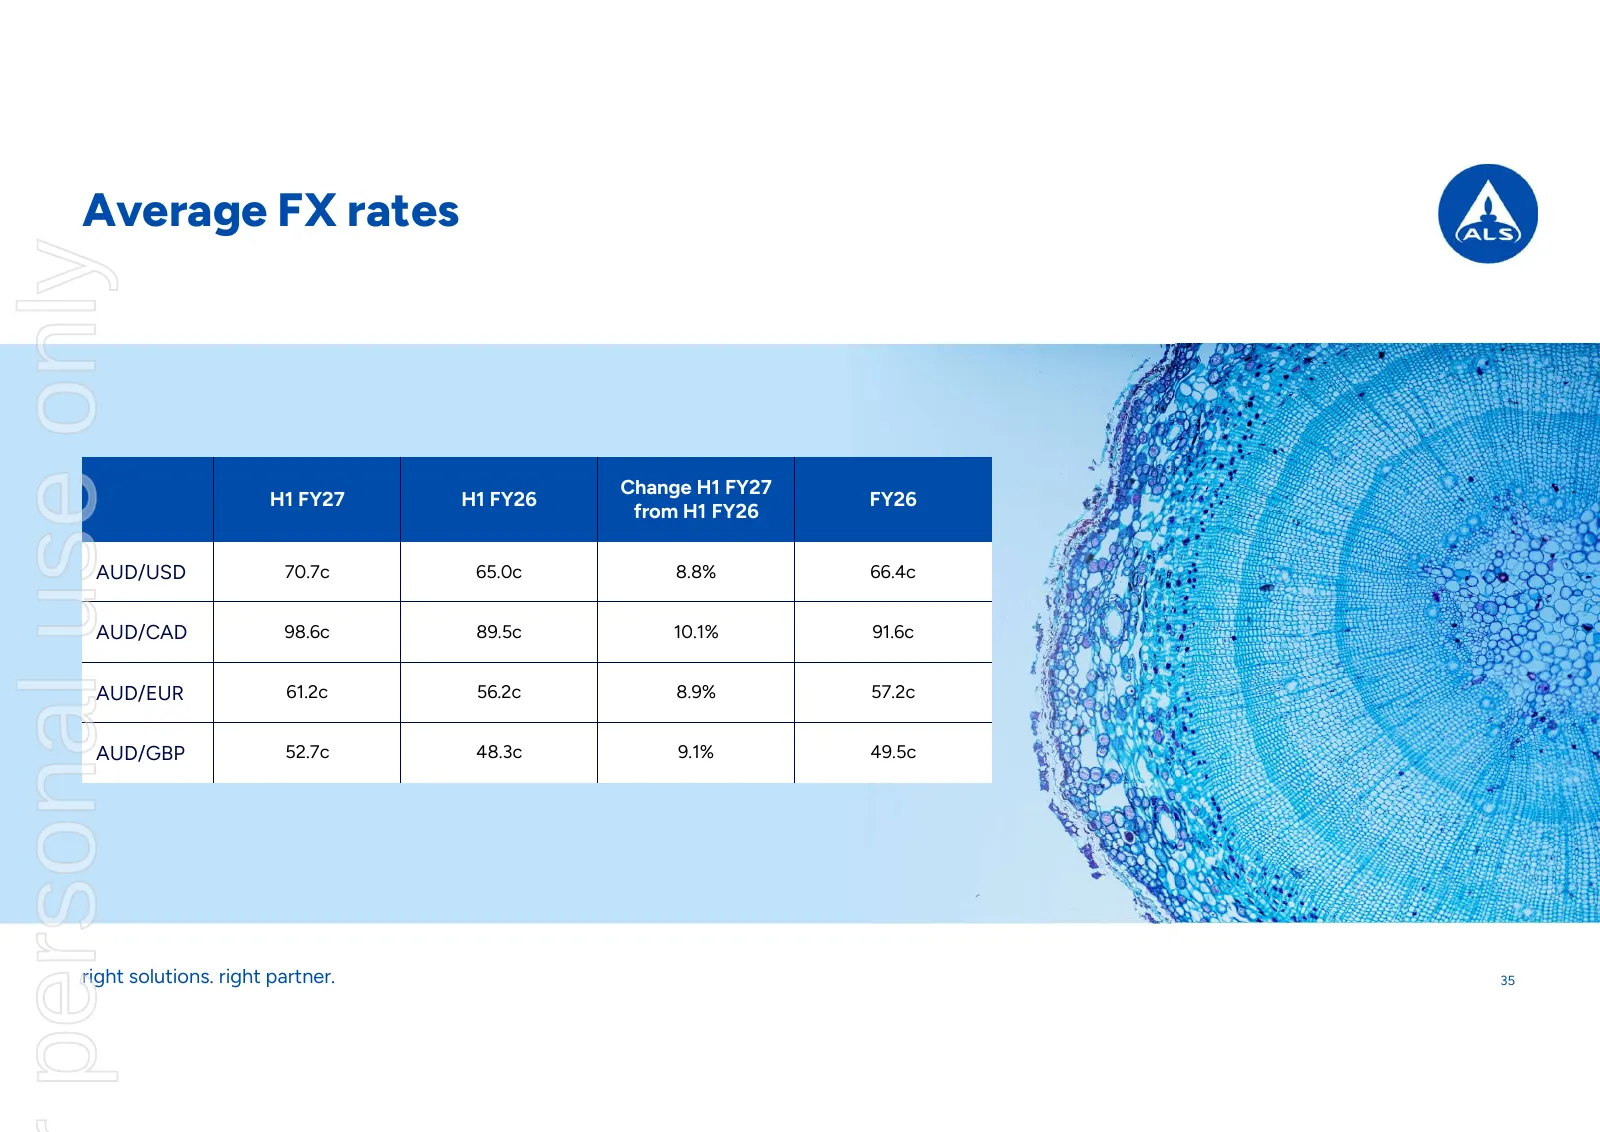
Average FX rates personal use only Change H1 FY27 H1 FY27 H1 FY26 FY26 from H1 FY26 AUD/USD 70.7c 65.0c 8.8% 66.4c AUD/CAD 98.6c 89.5c 10.1% 91.6c AUD/EUR 61.2c 56.2c 8.9% 57.2c AUD/GBP 52.7c 48.3c 9.1% 49.5c right solutions. right partner. 35
Slide 36: Acronyms and definitions
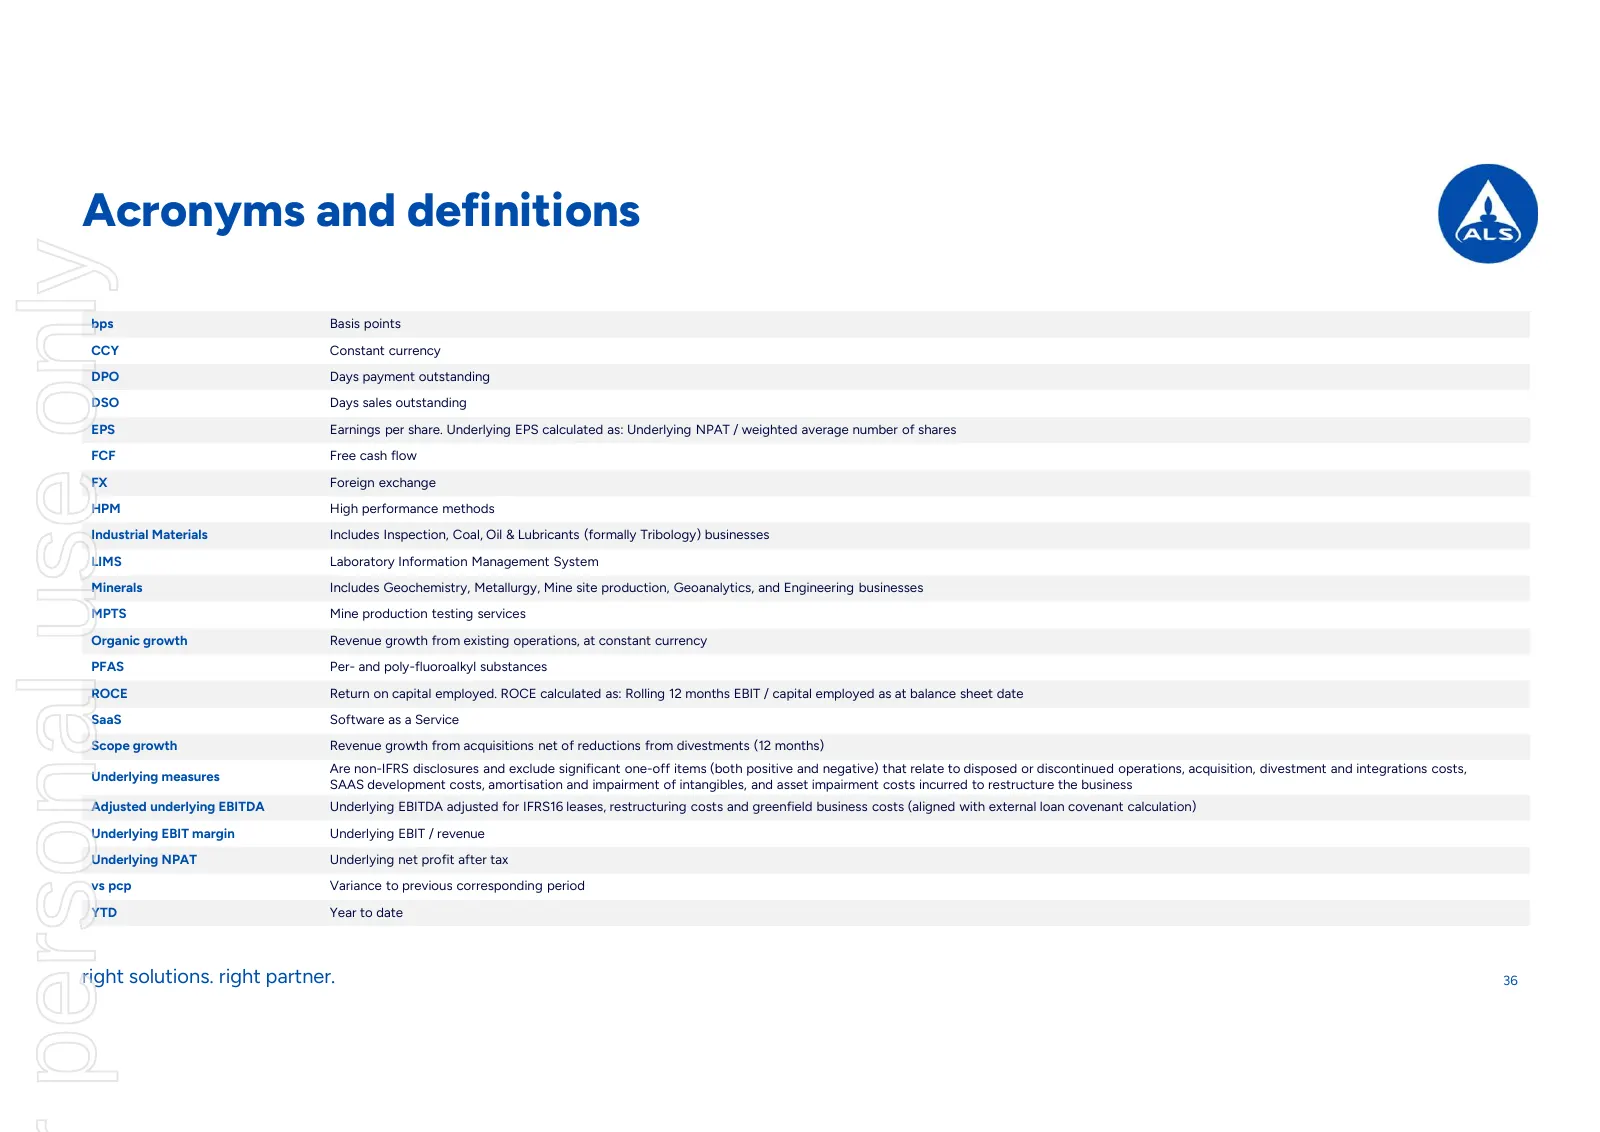
Acronyms and definitions personal use only bps Basis points CCY Constant currency DPO Days payment outstanding DSO Days sales outstanding EPS Earnings per share. Underlying EPS calculated as: Underlying NPAT / weighted average number of shares FCF Free cash flow FX Foreign exchange HPM High performa

Slide 37: personal use only
personal use only
Source: ASX announcement, Nov 23, 2026
More decks from ALS Ltd.
 FY2026 Earnings Presentation41 slides · May 18, 2026
 H1 FY26 Earnings Presentation39 slides · Nov 18, 2025
 Investor Day (July 2025)79 slides · Jul 31, 2025
 Investor Presentation (May 2025)41 slides · May 27, 2025
 FY2025 Earnings Presentation42 slides · May 27, 2025
 Conference Presentation (2025)4 slides · May 23, 2025