Detection Technology Oy · OMXHEX:DETEC
Detection Technology Oy — Q1 2018 Earnings Presentation
12 slides from Detection Technology Oy's earnings presentation, Apr 25, 2018

Slide 1: Q1 2018 January-March
Q1 2018 JANUARY-MARCH PRESIDENT AND CEO HANNU MARTOLA 25 APRIL 2018

Slide 2: Q1 2018 net sales and EBIT
19.3 2.4 3.7 19.4 Q1 2018 net sales, M€ (18.9) net sales growth-% (22.7) EBIT, M€ (3.7) EBIT-% (19.6 ) 2 25/4/2018 DETECTION TECHNOLOGY PLC BUSINESS REVIEW JANUARY-MARCH 2018

Slide 3: After an excellent 2017 sales started slowly
After an excellent 2017 sales started slowly Profitability remained good despite increased R&D costs Q1 2018 MBU had a strong quarter with growth coming from both North America and China SBU-sales fell slightly due to timing of deliveries, especially in the Chinese market Sales split was more even b
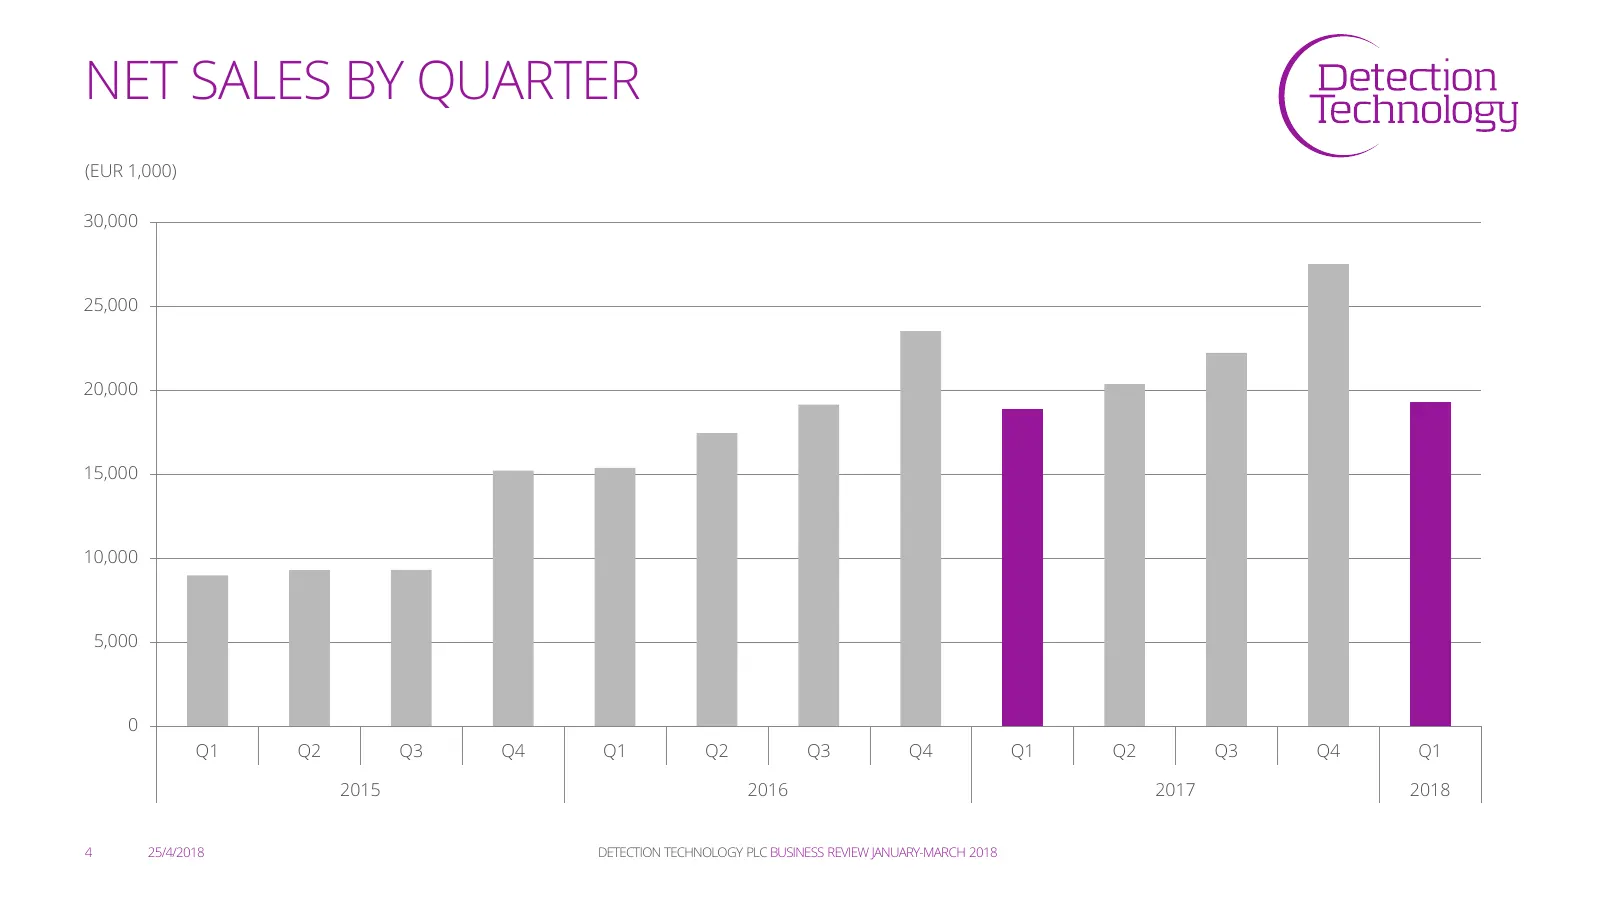
Slide 4: Net sales by quarter
NET SALES BY QUARTER (EUR 1,000) 30,000 25,000 20,000 15,000 10,000 5,000 0 Q1 Q2 Q3 Q4 Q1 Q2 Q3 Q4 Q1 Q2 Q3 Q4 Q1 2015 2016 2017 2018 4 25/4/2018 DETECTION TECHNOLOGY PLC BUSINESS REVIEW JANUARY-MARCH 2018
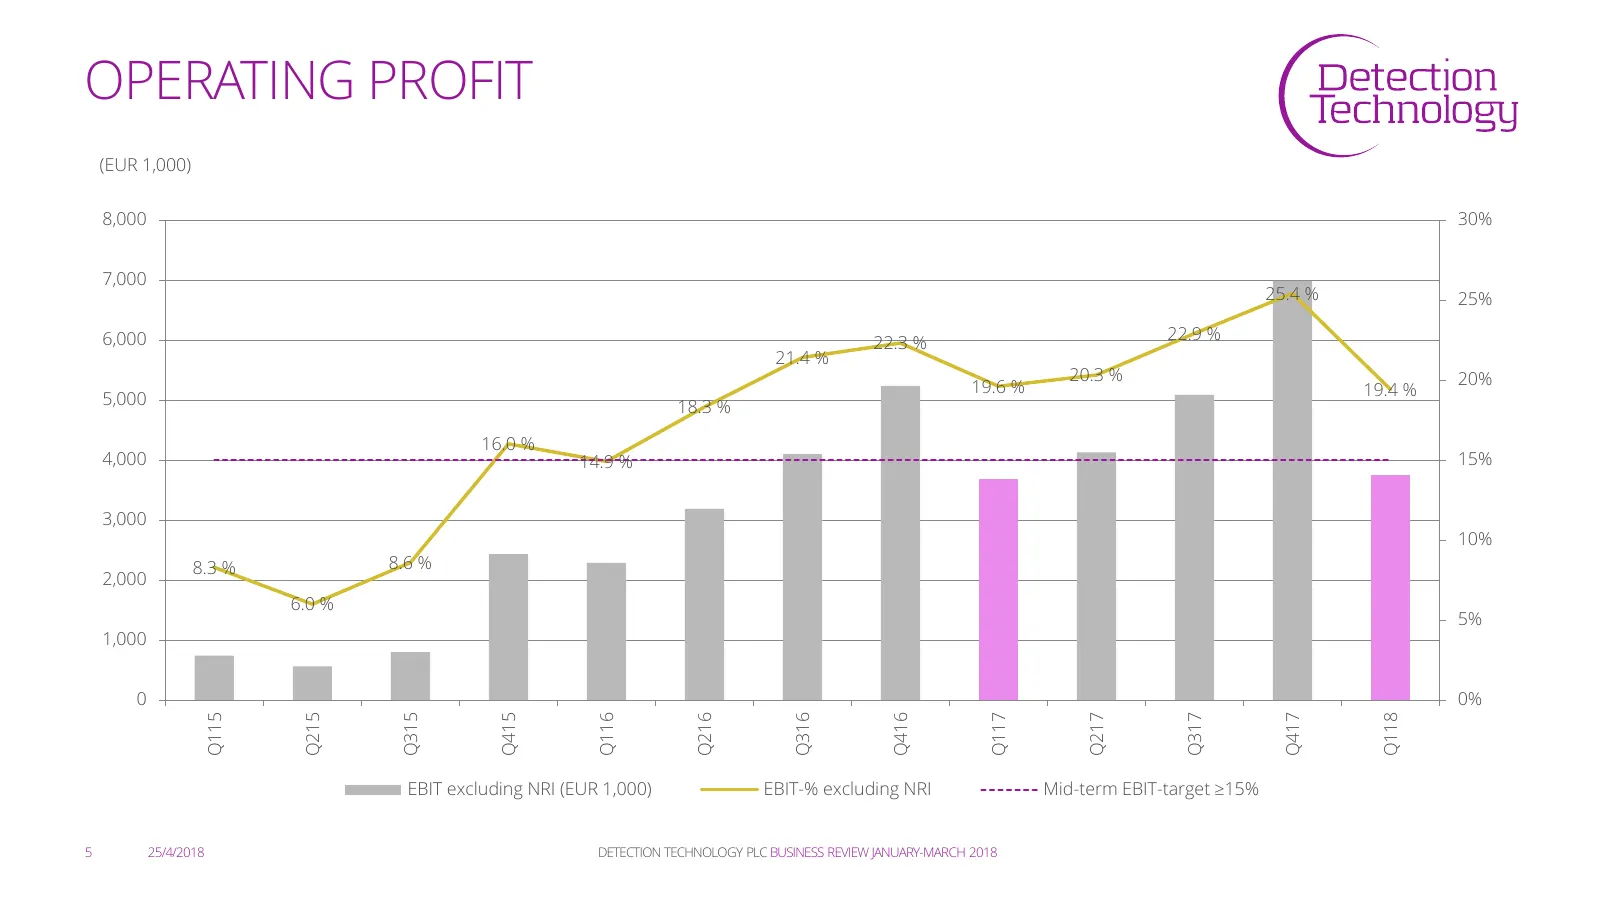
Slide 5: Operating profit
OPERATING PROFIT (EUR 1,000) 8,000 30% 7,000 25.4 % 25% 6,000 22.9 % 22.3 % 21.4 % 20.3 % 20% 19.6 % 19.4 % 5,000 18.3 % 16.0 % 4,000 14.9 % 15% 3,000 10% 8.3 % 8.6 % 2,000 6.0 % 5% 1,000 0 0% Q115 Q215 Q315 Q415 Q116 Q216 Q316 Q416 Q117 Q217 Q317 Q417 Q118 EBIT excluding NRI (EUR 1,000) EBIT-% excl
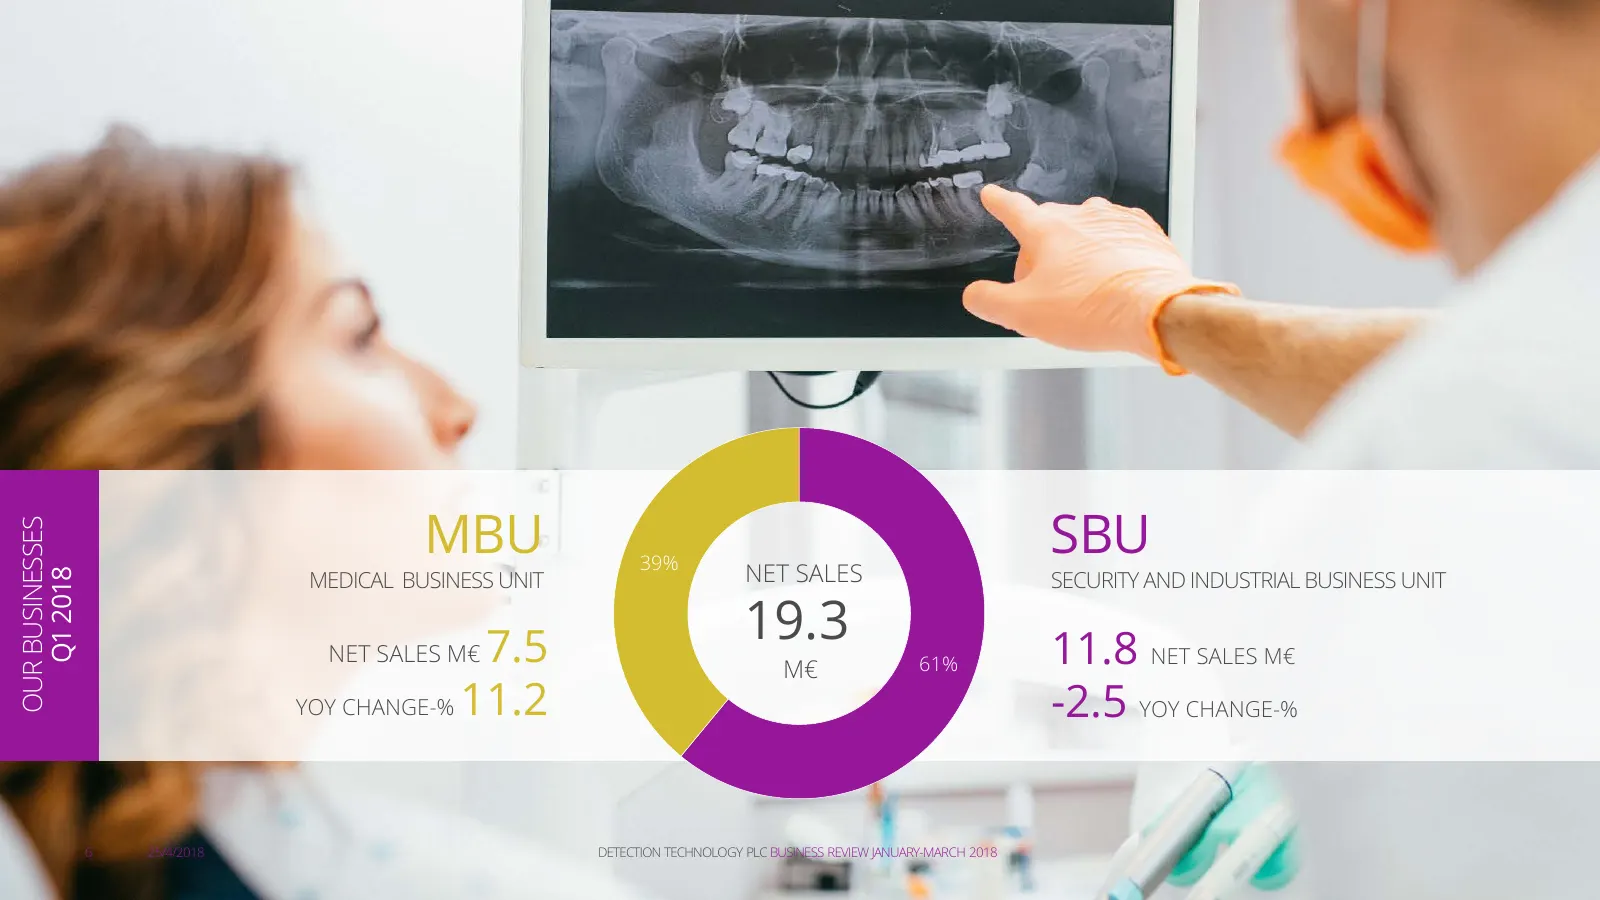
Slide 6: Our businesses
MBU SBU OUR BUSINESSES 39% MEDICAL BUSINESS UNIT NET SALES SECURITY AND INDUSTRIAL BUSINESS UNIT Q1 2018 NET SALES M€7.5 19.3 11.8 NET SALES M€ M€ 61% YOY CHANGE-% 11.2 -2.5 YOY CHANGE-% 6 25/4/2018 DETECTION TECHNOLOGY PLC BUSINESS REVIEW JANUARY-MARCH 2018
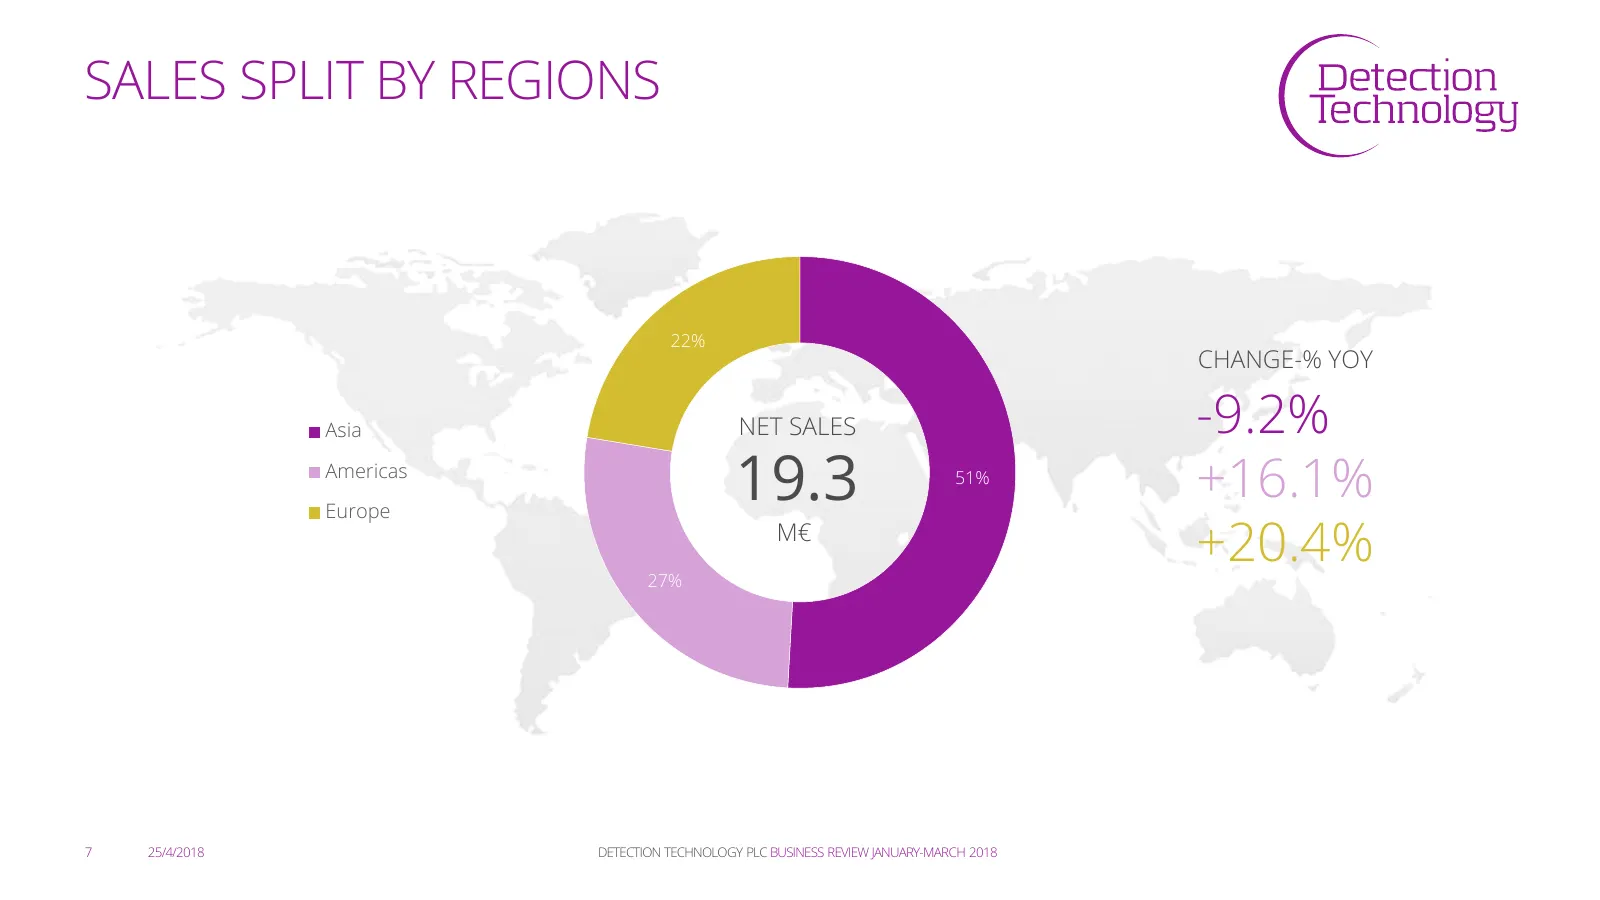
Slide 7: Sales split by regions
SALES SPLIT BY REGIONS 22% CHANGE-% YOY Asia NET SALES -9.2% Americas Europe 19.3 51% +16.1% 27% M€ +20.4% 7 25/4/2018 DETECTION TECHNOLOGY PLC BUSINESS REVIEW JANUARY-MARCH 2018
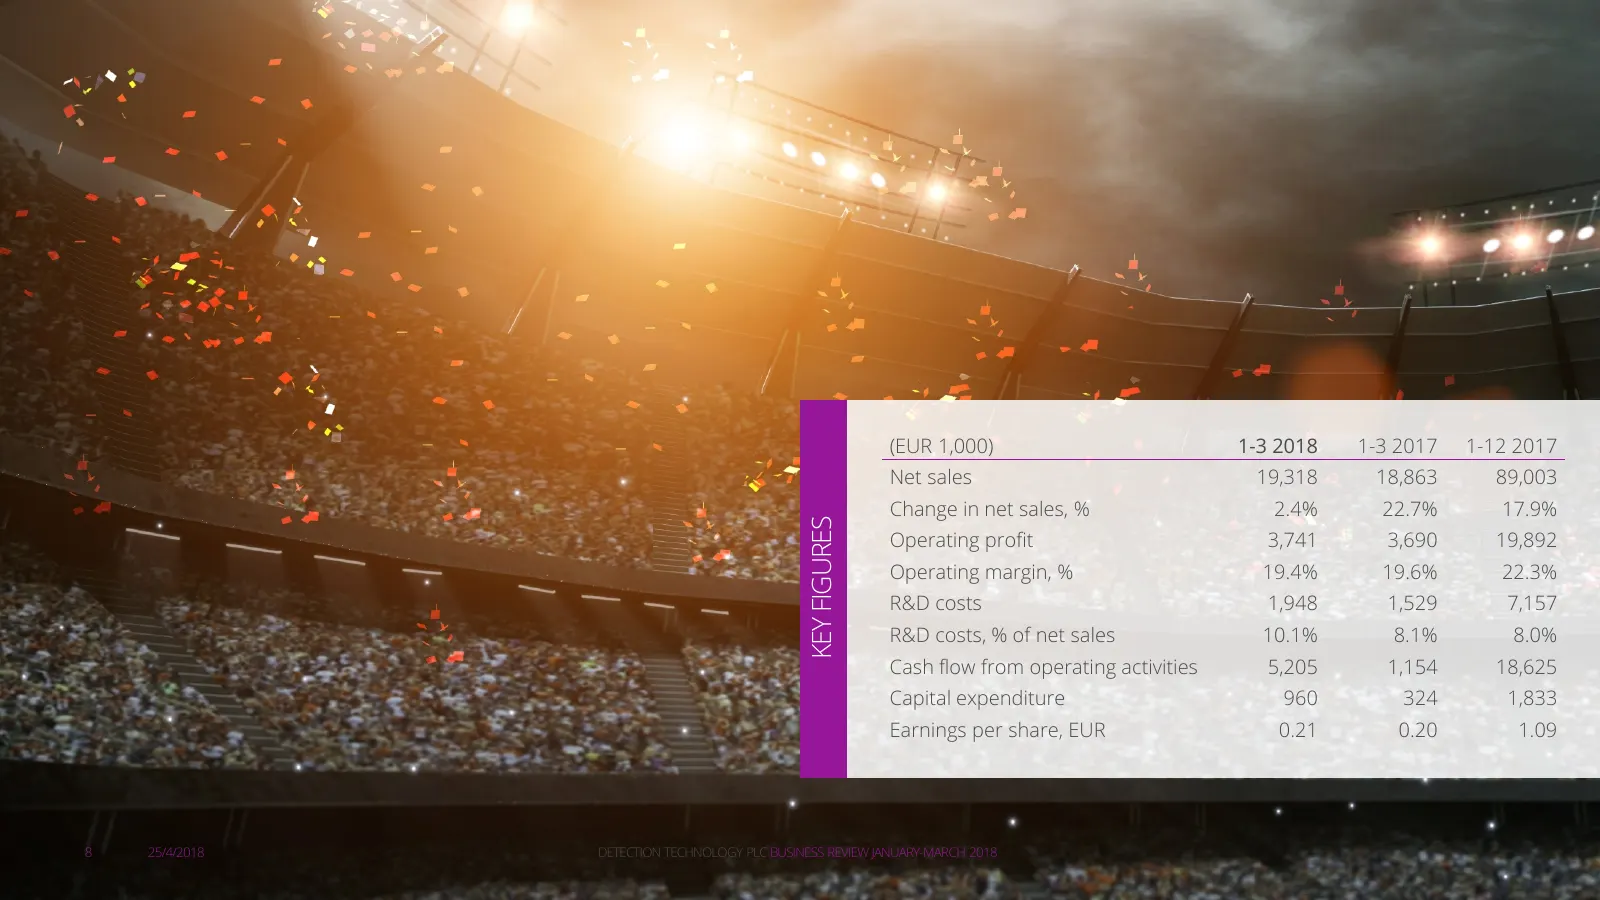
Slide 8: Key figures
(EUR 1,000) 1-3 2018 1-3 2017 1-12 2017 Net sales 19,318 18,863 89,003 Change in net sales, % 2.4% 22.7% 17.9% KEY FIGURES Operating profit 3,741 3,690 19,892 Operating margin, % 19.4% 19.6% 22.3% R&D costs 1,948 1,529 7,157 R&D costs, % of net sales 10.1% 8.1% 8.0% Cash flow from operating activiti

Slide 9: Strategy
• Product development projects and investments in new technology development as well as new STRATEGY customer acquisitions continued as planned • Proceeded to implement the Enterprise Resource Planning System (ERP) and focused on finalizing the Product Data Management System (PDM) 9 25/4/2018 DETECT
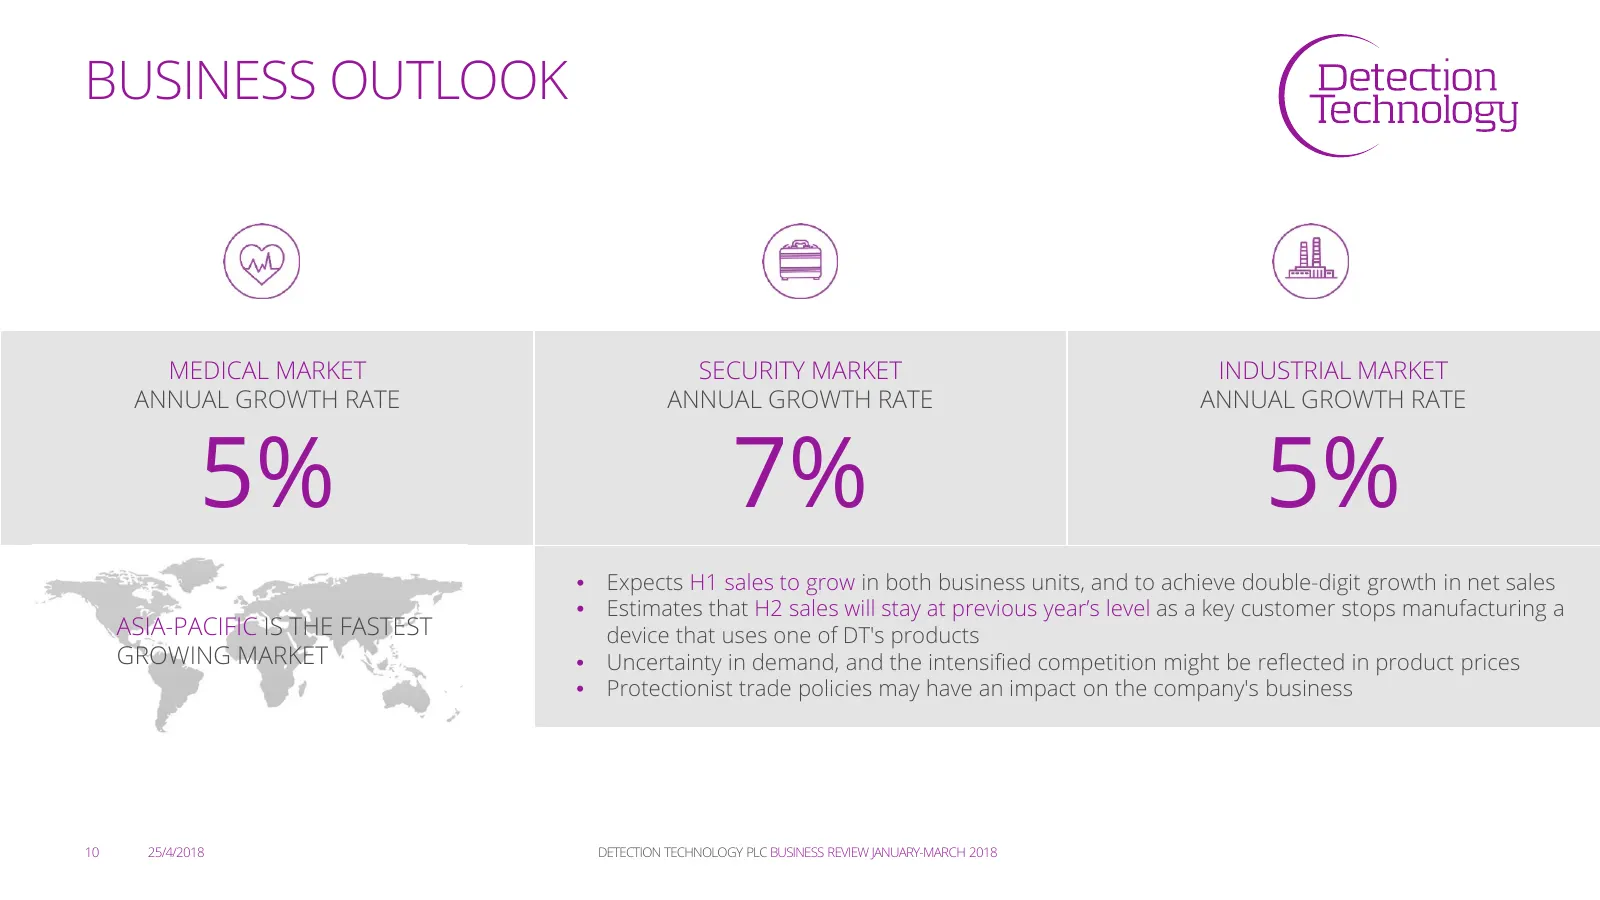
Slide 10: Business outlook
BUSINESS OUTLOOK MEDICAL MARKET SECURITY MARKET INDUSTRIAL MARKET ANNUAL GROWTH RATE ANNUAL GROWTH RATE ANNUAL GROWTH RATE 5% 7% 5% • Expects H1 sales to grow in both business units, and to achieve double-digit growth in net sales • Estimates that H2 sales will stay at previous year’s level as a key
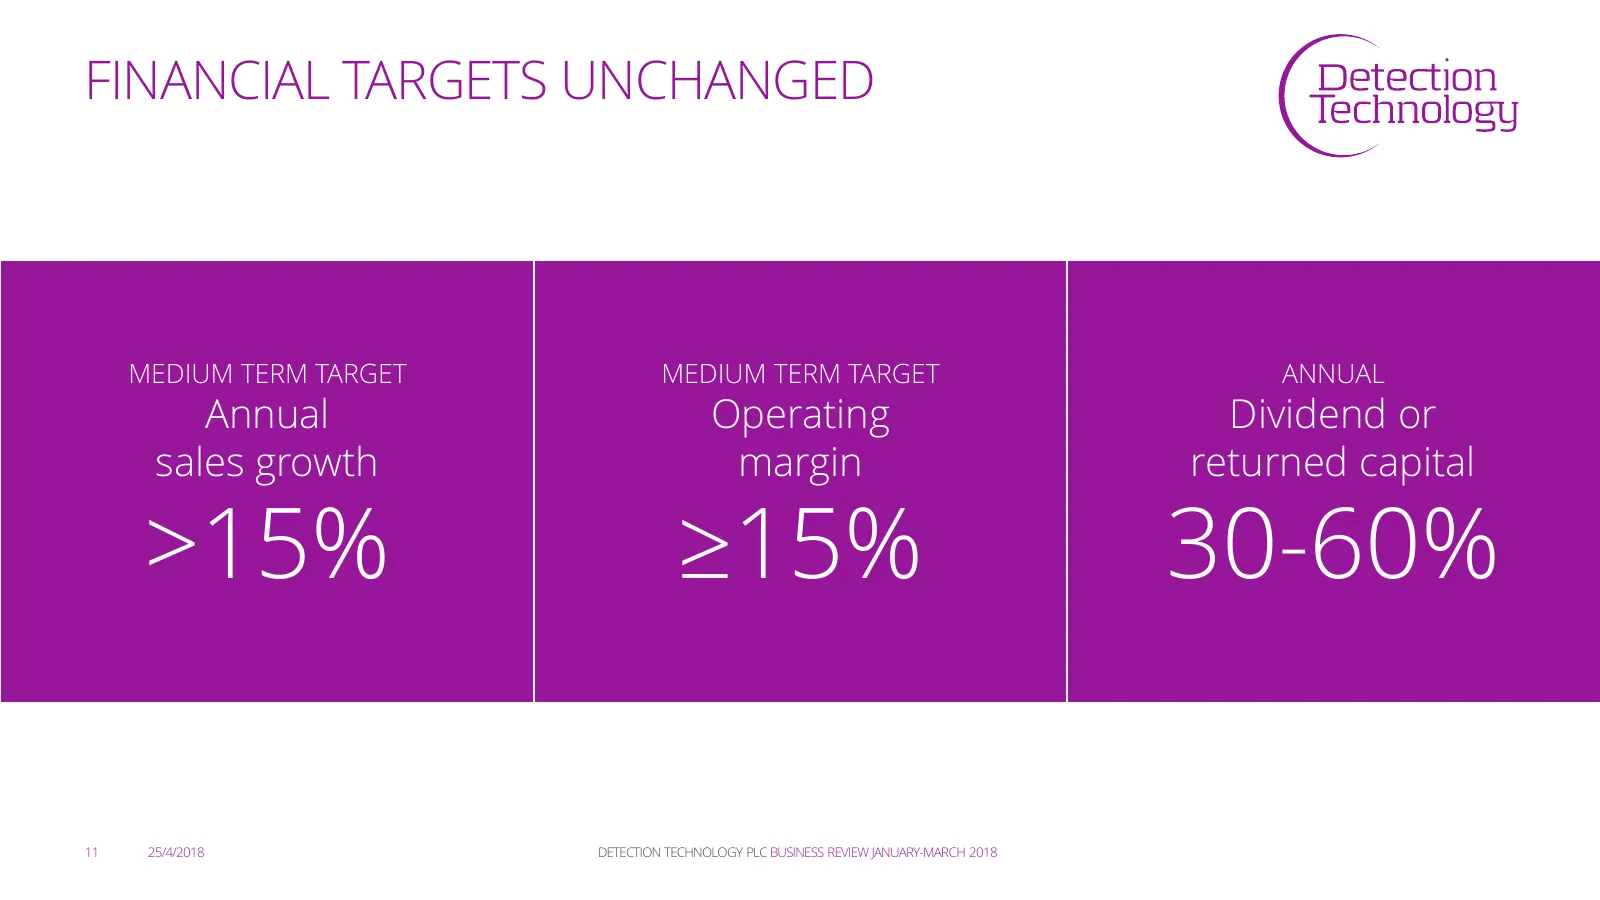
Slide 11: Financial targets unchanged
FINANCIAL TARGETS UNCHANGED MEDIUM TERM TARGET MEDIUM TERM TARGET ANNUAL Annual Operating Dividend or sales growth margin returned capital >15% ≥15% 30-60% 11 25/4/2018 DETECTION TECHNOLOGY PLC BUSINESS REVIEW JANUARY-MARCH 2018

Slide 12: Foreknow. Foresave.
FOREKNOW. FORESAVE. ® 12
Source: Internet Archive copy of deetee.com
More decks from Detection Technology Oy
 Q1 2026 Earnings Presentation15 slides · Apr 23, 2026
 Investor Day (November 2025)79 slides · Nov 18, 2025
 Q3 2025 Earnings Presentation17 slides · Oct 30, 2025
 Q1 2025 Earnings Presentation13 slides · Apr 24, 2025
 Q3 2024 Earnings Presentation17 slides · Oct 29, 2024
 Q1 2024 Earnings Presentation13 slides · Apr 25, 2024