Pioneer Natural Resources — Investor Presentation (January 2009)
42 slides from Pioneer Natural Resources's investor presentation, Jan 13, 2009
Slide 1: Investor Presentation January 2009
Investor Presentation January 2009
Slide 2: Forward-Looking Statements
Forward-Looking Statements Except for historical information contained herein, the statements, charts and graphs in this presentation are forward-looking statements that are made pursuant to the Safe Harbor Provisions of the Private Securities Litigation Reform Act of 1995. Forward- looking statemen
Slide 3: Investment Highlights
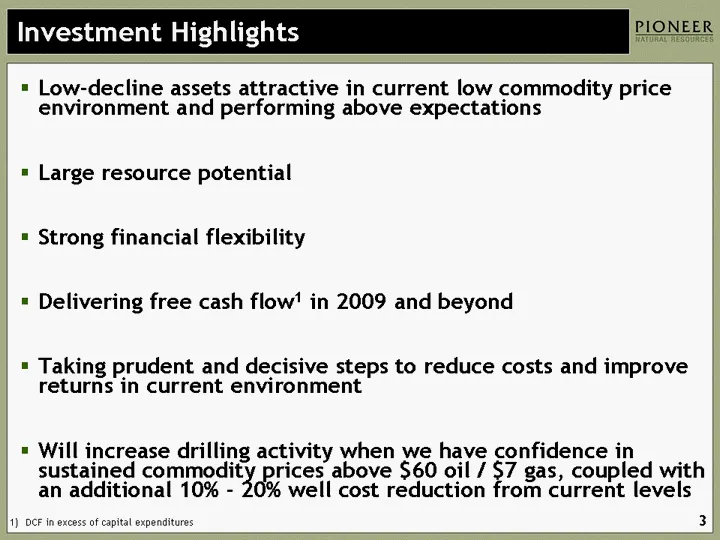
Investment Highlights Low-decline assets attractive in current low commodity price environment and performing above expectations Large resource potential Strong financial flexibility Delivering free cash flow1 in 2009 and beyond Taking prudent and decisive steps to reduce costs and improve returns i
Slide 4: Low-Decline Assets Attractive in Current Environment
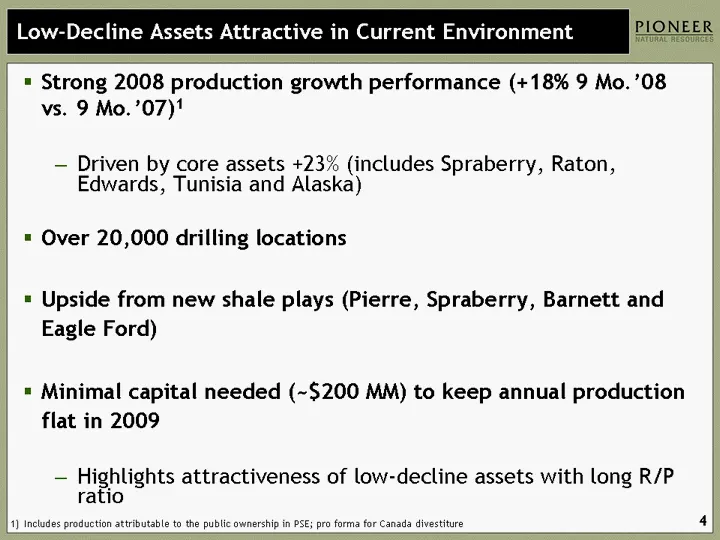
Low-Decline Assets Attractive in Current Environment Strong 2008 production growth performance (+18% 9 Mo.'08 vs. 9 Mo.'07)1 Driven by core assets +23% (includes Spraberry, Raton, Edwards, Tunisia and Alaska) Over 20,000 drilling locations Upside from new shale plays (Pierre, Spraberry, Barnett and
Slide 5: Consistent Production Growth Driven by Low-Risk Drilling
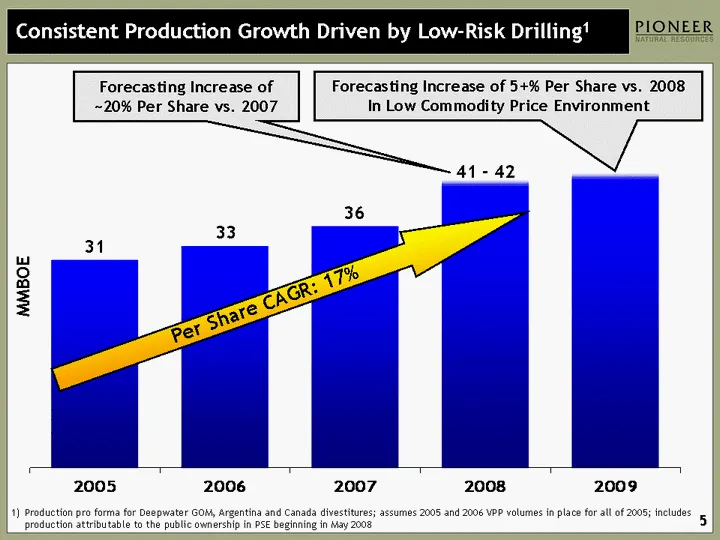
Consistent Production Growth Driven by Low-Risk Drilling1 MMBOE Production pro forma for Deepwater GOM, Argentina and Canada divestitures; assumes 2005 and 2006 VPP volumes in place for all of 2005; includes production attributable to the public ownership in PSE beginning in May 2008 2005 2006 2007
Slide 6: Spraberry Historical IRRs Typically Average 35% - 40%
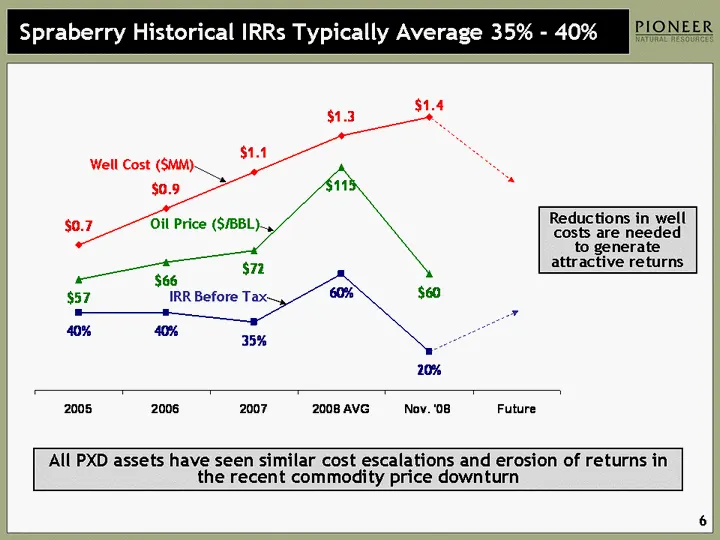
Spraberry Historical IRRs Typically Average 35% - 40% Reductions in well costs are needed to generate attractive returns 2005 2006 2007 2008 AVG Nov. '08 Future Well Cost 0.7 0.9 1.1 1.3 1.4 1 Returns 40 40 35 60 20 40 Oil Price 57 66 72 115 60 60 Well Cost ($MM) Oil Price ($/BBL) IRR Before Tax All
Slide 7: Large Resource Potential
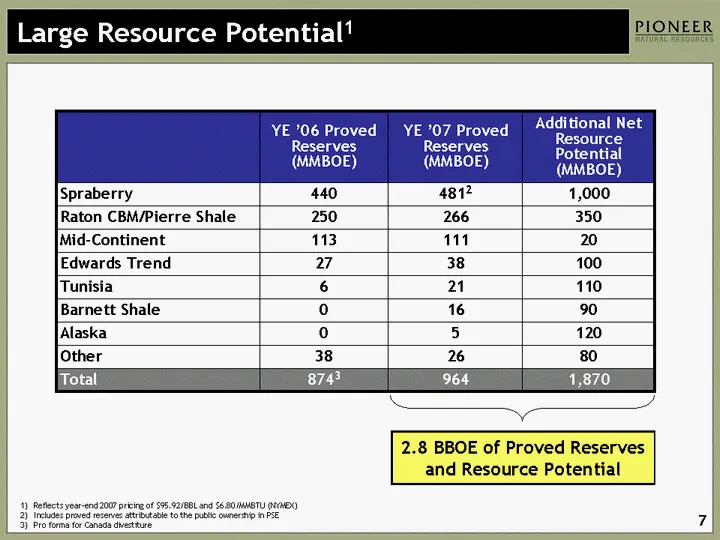
Large Resource Potential1 YE '06 Proved Reserves (MMBOE) YE '07 Proved Reserves (MMBOE) Additional Net Resource Potential (MMBOE) Spraberry 440 4812 1,000 Raton CBM/Pierre Shale 250 266 350 Mid-Continent 113 111 20 Edwards Trend 27 38 100 Tunisia 6 21 110 Barnett Shale 0 16 90 Alaska 0 5 120 Other 3
Slide 8: Strong Financial Flexibility
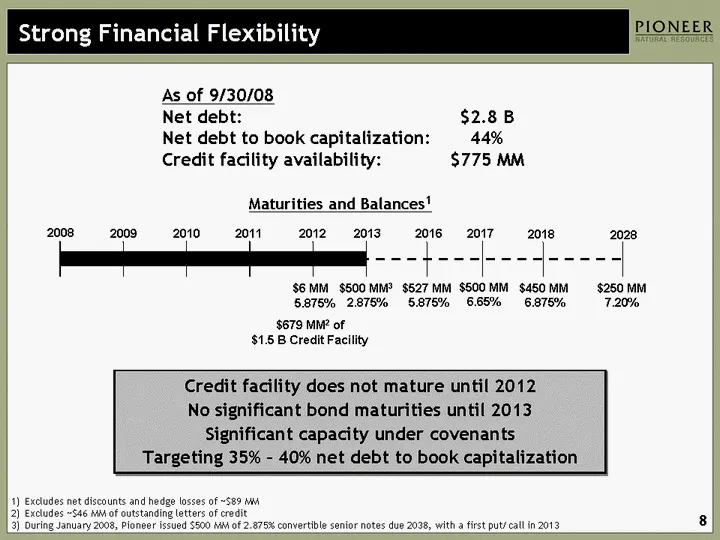
Strong Financial Flexibility 2008 2009 2010 2011 2012 2016 $6 MM 5.875% $250 MM 7.20% 2017 $527 MM 5.875% 2028 $450 MM 6.875% $679 MM2 of $1.5 B Credit Facility Maturities and Balances1 2018 $500 MM 6.65% As of 9/30/08 Net debt: $2.8 B Net debt to book capitalization: 44% Credit facility availabilit
Slide 9: Plan To Deliver Free Cash Flow In 2009 And Beyond
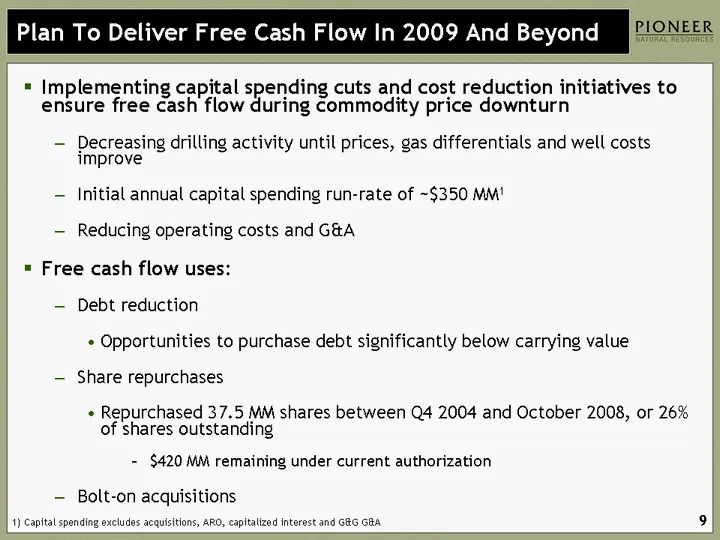
Plan To Deliver Free Cash Flow In 2009 And Beyond Implementing capital spending cuts and cost reduction initiatives to ensure free cash flow during commodity price downturn Decreasing drilling activity until prices, gas differentials and well costs improve Initial annual capital spending run-rate of
Slide 10: Spraberry - Solid Production Growth
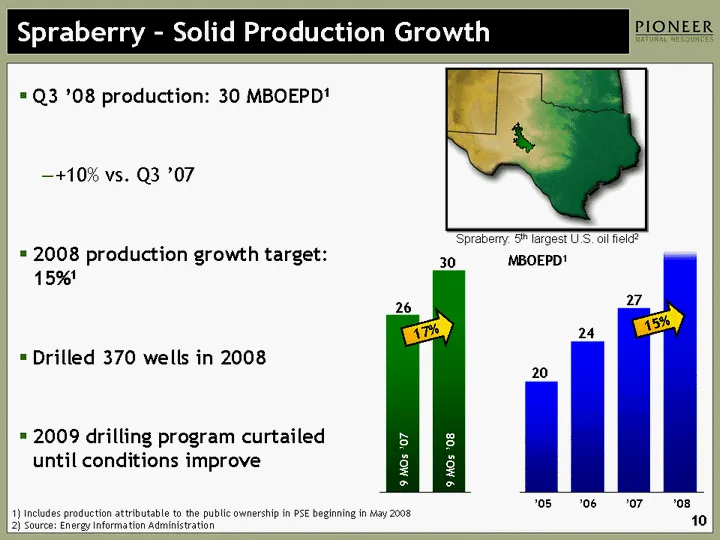
Spraberry - Solid Production Growth Q3 '08 production: 30 MBOEPD1 +10% vs. Q3 '07 2008 production growth target: 15%1 Drilled 370 wells in 2008 2009 drilling program curtailed until conditions improve Includes production attributable to the public ownership in PSE beginning in May 2008 Source: Energ
Slide 11: Spraberry 40-acre Drilling Returns
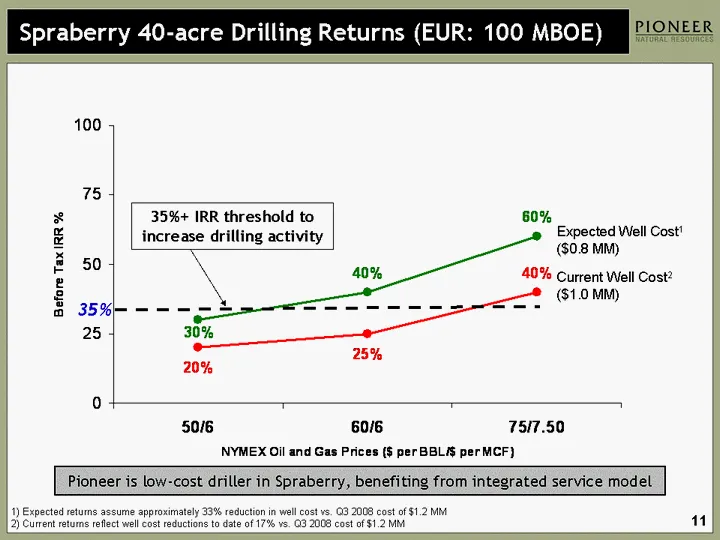
50/6 60/6 75/7.50 Current 20 25 40 Targeted 30 40 60 Spraberry 40-acre Drilling Returns (EUR: 100 MBOE) Expected Well Cost1 ($0.8 MM) Current Well Cost2 ($1.0 MM) 1) Expected returns assume approximately 33% reduction in well cost vs. Q3 2008 cost of $1.2 MM 2) Current returns reflect well cost redu
Slide 12: Spraberry - Continuing to Progress Resource Initiatives
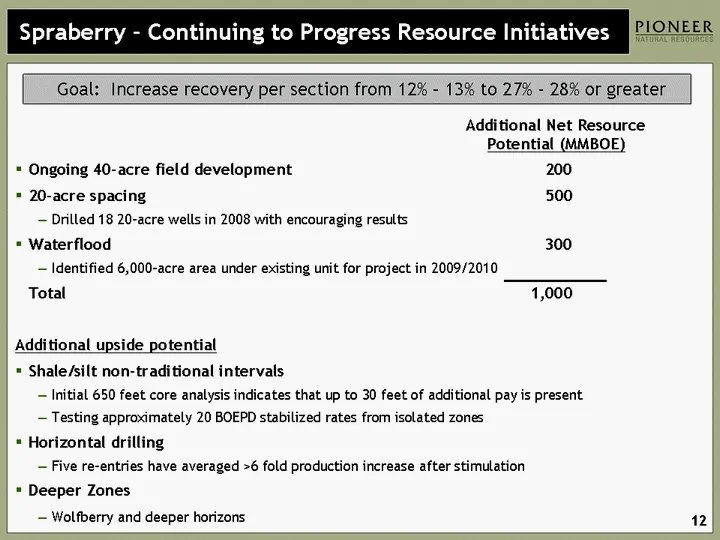
Spraberry - Continuing to Progress Resource Initiatives Ongoing 40-acre field development 200 20-acre spacing 500 Drilled 18 20-acre wells in 2008 with encouraging results Waterflood 300 Identified 6,000-acre area under existing unit for project in 2009/2010 Total 1,000 Additional upside potential S
Slide 13: Wolfberry
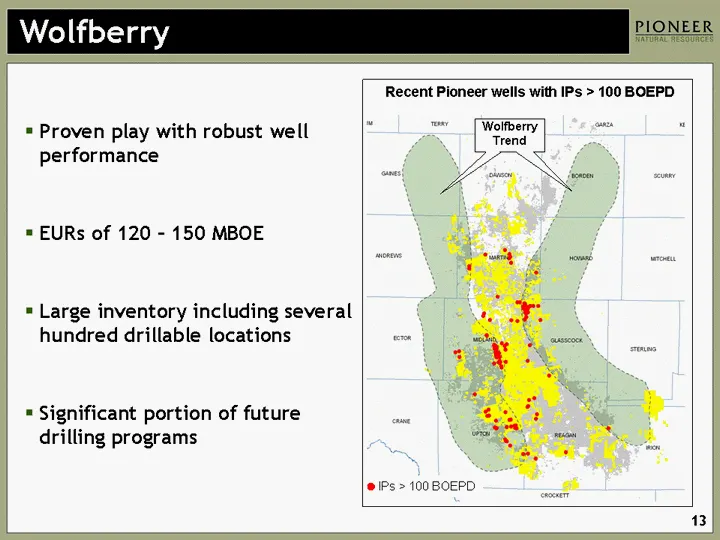
Wolfberry Proven play with robust well performance EURs of 120 - 150 MBOE Large inventory including several hundred drillable locations Significant portion of future drilling programs Recent Pioneer wells with IPs > 100 BOEPD IPs > 100 BOEPD Wolfberry Trend Wolfberry Trend
Slide 14: Wolfberry 40-acre Drilling Returns
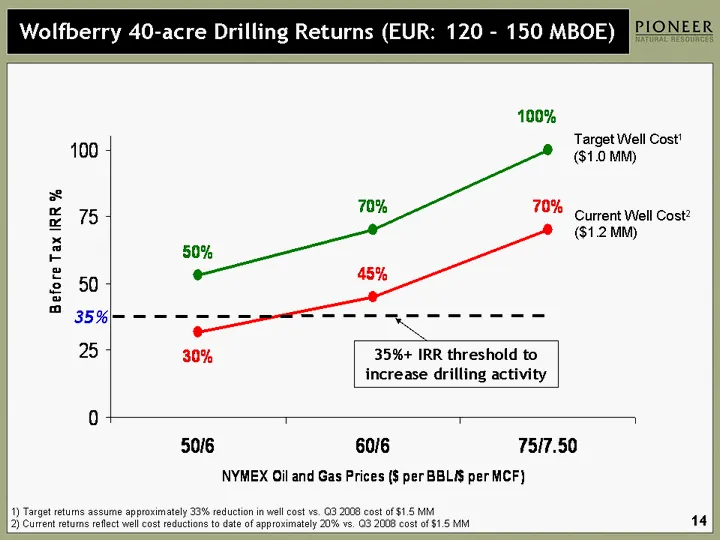
Wolfberry 40-acre Drilling Returns (EUR: 120 - 150 MBOE) 50/6 60/6 75/7.50 Current 32 45 70 Expected 53 70 100 Target Well Cost1 ($1.0 MM) Current Well Cost2 ($1.2 MM) 1) Target returns assume approximately 33% reduction in well cost vs. Q3 2008 cost of $1.5 MM 2) Current returns reflect well cost r
Slide 15: Raton CBM and Pierre Shale - Solid Production Growth
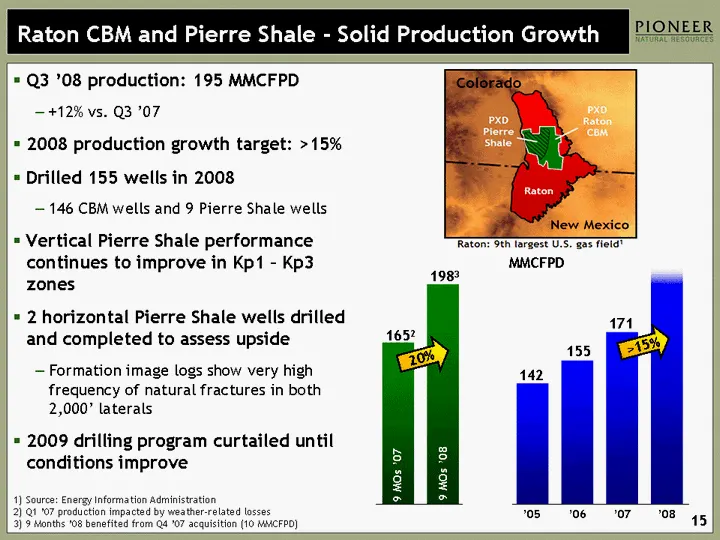
Raton CBM and Pierre Shale - Solid Production Growth Q3 '08 production: 195 MMCFPD +12% vs. Q3 '07 2008 production growth target: >15% Drilled 155 wells in 2008 146 CBM wells and 9 Pierre Shale wells Vertical Pierre Shale performance continues to improve in Kp1 - Kp3 zones 2 horizontal Pierre Shale
Slide 16: Raton CBM Drilling Returns
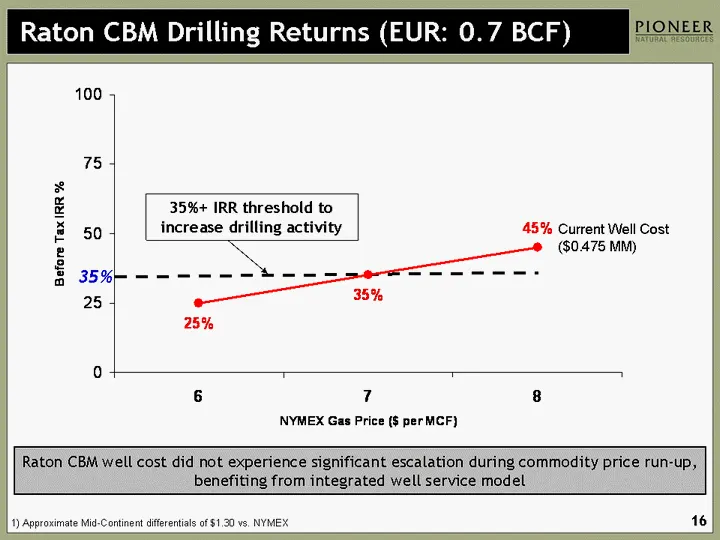
6 7 8 Current 25 35 45 Expected 35 35 45 Raton CBM Drilling Returns (EUR: 0.7 BCF) Current Well Cost ($0.475 MM) Raton CBM well cost did not experience significant escalation during commodity price run-up, benefiting from integrated well service model 1) Approximate Mid-Continent differentials of $1
Slide 17: Edwards Trend Delivering Strong Production Growth
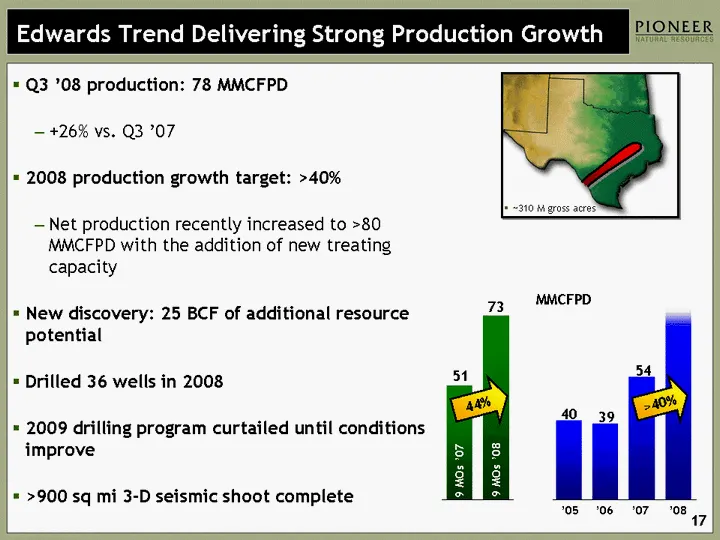
Edwards Trend Delivering Strong Production Growth Q3 '08 production: 78 MMCFPD +26% vs. Q3 '07 2008 production growth target: >40% Net production recently increased to >80 MMCFPD with the addition of new treating capacity New discovery: 25 BCF of additional resource potential Drilled 36 wells in 200
Slide 18: Edwards Drilling Returns
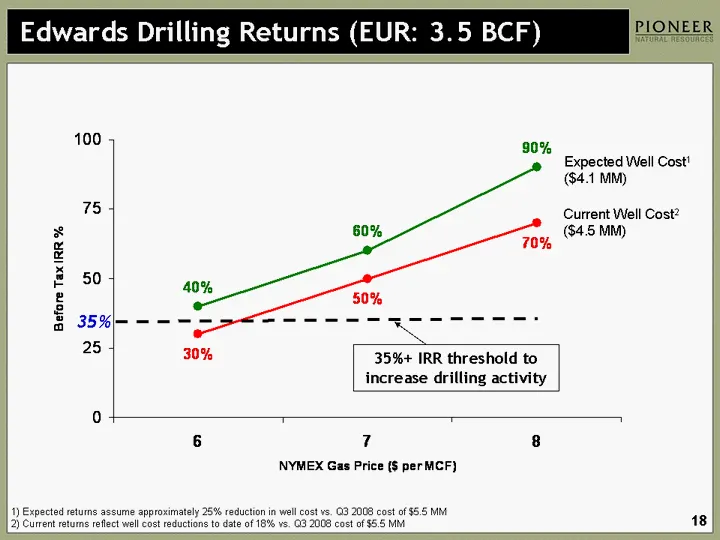
Edwards Drilling Returns (EUR: 3.5 BCF) 6 7 8 Current 30 50 70 Expected 40 60 90 Expected Well Cost1 ($4.1 MM) Current Well Cost2 ($4.5 MM) 1) Expected returns assume approximately 25% reduction in well cost vs. Q3 2008 cost of $5.5 MM 2) Current returns reflect well cost reductions to date of 18% v
Slide 19: Eagle Ford Shale Activity in South Texas
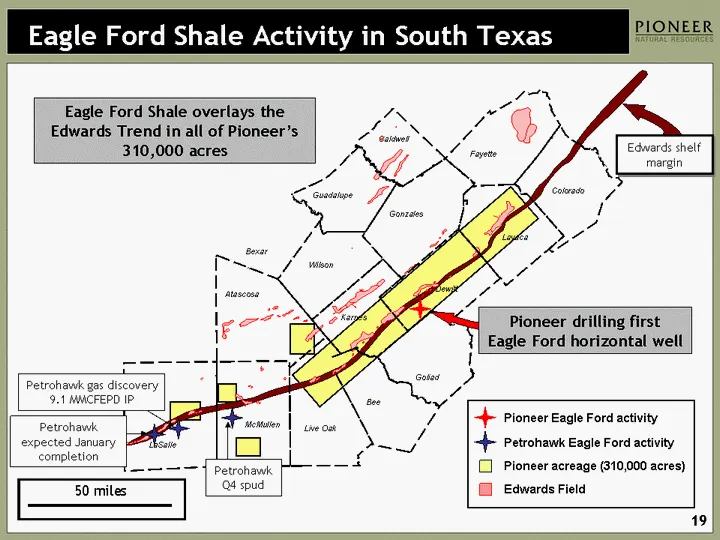
50 miles Eagle Ford Shale Activity in South Texas Bee Goliad Live Oak Karnes McMullen LaSalle Atascosa Wilson Bexar Guadalupe Gonzales Dewitt Lavaca Colorado Fayette Caldwell Edwards shelf margin Edwards Field Pioneer Eagle Ford activity Pioneer acreage (310,000 acres) Petrohawk Eagle Ford activity
Slide 20: Tunisia
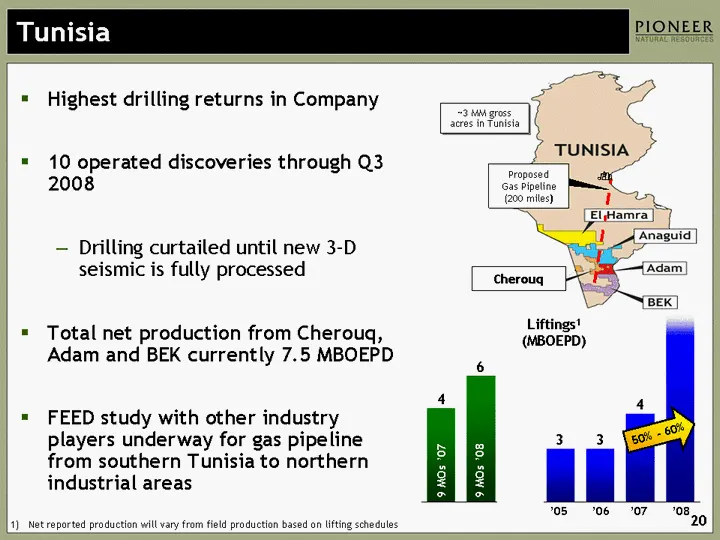
Tunisia 2005 2006 2007 2008 4.521 6.09 2.585 2.585 4.264 8.1 0 1 Liftings1 (MBOEPD) '07 '08 3 4 50% - 60% 3 '05 9 MOs '07 9 MOs '08 6 '06 Proposed Gas Pipeline (200 miles) Cherouq ~3 MM gross acres in Tunisia Highest drilling returns in Company 10 operated discoveries through Q3 2008 Drilling curtai
Slide 21: South Africa Production Expected To Increase 50% In 2009
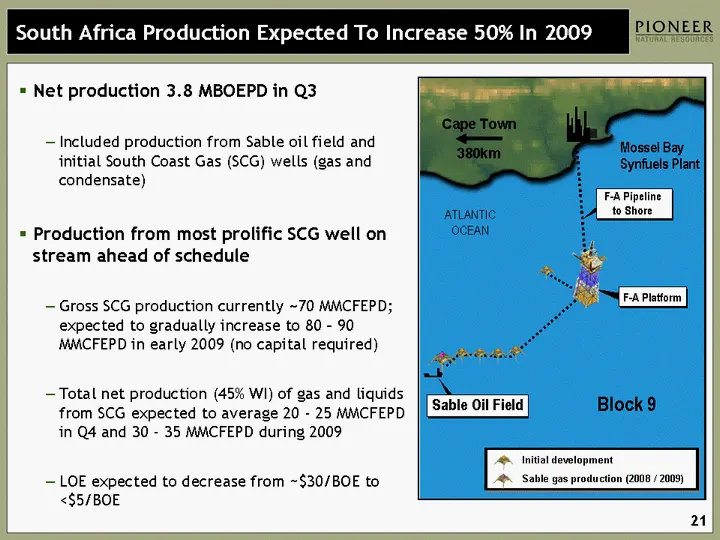
South Africa Production Expected To Increase 50% In 2009 Net production 3.8 MBOEPD in Q3 Included production from Sable oil field and initial South Coast Gas (SCG) wells (gas and condensate) Production from most prolific SCG well on stream ahead of schedule Gross SCG production currently ~70 MMCFEPD
Slide 22: Alaska
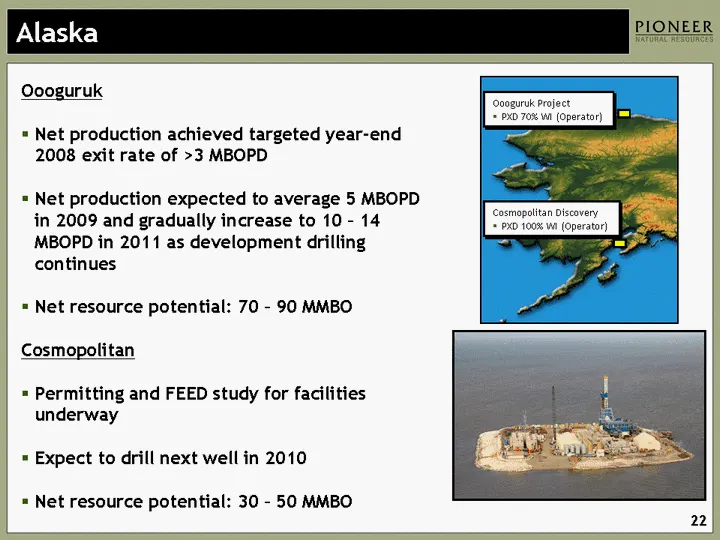
Alaska Oooguruk Net production achieved targeted year-end 2008 exit rate of >3 MBOPD Net production expected to average 5 MBOPD in 2009 and gradually increase to 10 - 14 MBOPD in 2011 as development drilling continues Net resource potential: 70 - 90 MMBO Cosmopolitan Permitting and FEED study for fa
Slide 23: Investment Highlights
Investment Highlights Low-decline assets attractive in current low commodity price environment and performing above expectations Large resource potential Strong financial flexibility Delivering free cash flow1 in 2009 and beyond Taking prudent and decisive steps to reduce costs and improve returns i
Slide 24: Appendix
Appendix
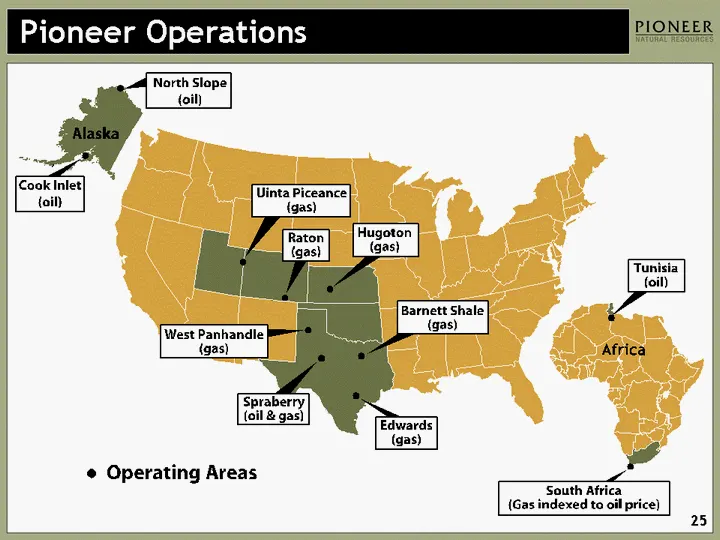
Slide 25: Pioneer Operations
Pioneer Operations PIONEER North Slope (oil) [Cook Inlet] ‘ Uinta Piceance| (oil) (gas) Spraherry (oil & gas) @ Operating Areas South Africa (Gas indexed to oi 25
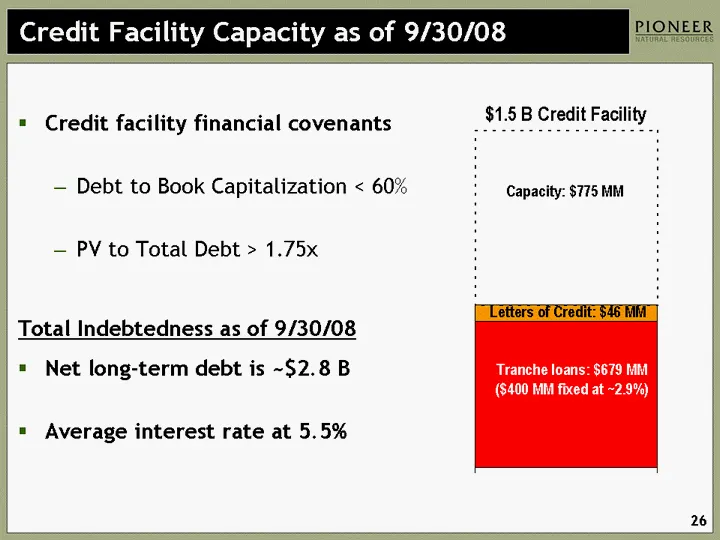
Slide 26: Credit Facility Capacity as of 9/30/08
Credit Facility Capacity as of 9/30/08 Tranche loans: $679 MM ($400 MM fixed at ~2.9%) Letters of Credit: $46 MM Capacity: $775 MM $1.5 B Credit Facility Credit facility financial covenants Debt to Book Capitalization < 60% PV to Total Debt > 1.75x Total Indebtedness as of 9/30/08 Net long-term debt
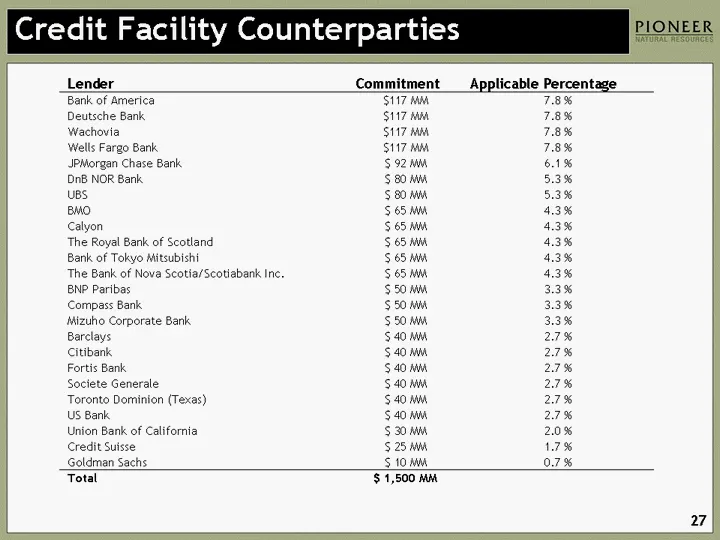
Slide 27: Credit Facility Counterparties
Credit Facility Counterparties Lender Commitment Applicable Percentage Bank of America $117 MM 7.8 % Deutsche Bank $117 MM 7.8 % Wachovia $117 MM 7.8 % Wells Fargo Bank $117 MM 7.8 % JPMorgan Chase Bank $ 92 MM 6.1 % DnB NOR Bank $ 80 MM 5.3 % UBS $ 80 MM 5.3 % BMO $ 65 MM 4.3 % Calyon $ 65 MM 4.3 %
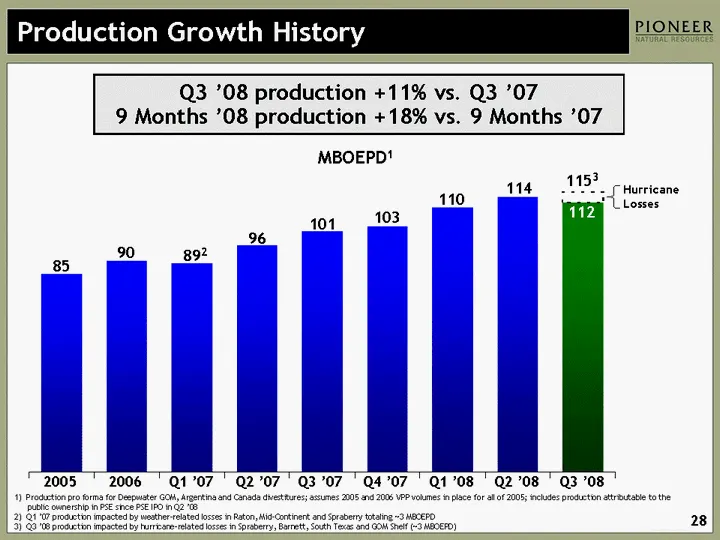
Slide 28: Production Growth History
2005 2006 Q1 2007 Q2 2007 Q3 2007 Q4 2007 Q1 2008 Q2 2008 Q3 2008 East 85 90 89 96 101 103 110 114 112 4 Production Growth History 1) Production pro forma for Deepwater GOM, Argentina and Canada divestitures; assumes 2005 and 2006 VPP volumes in place for all of 2005; includes production attributabl
Slide 29: Production (MBOEPD)
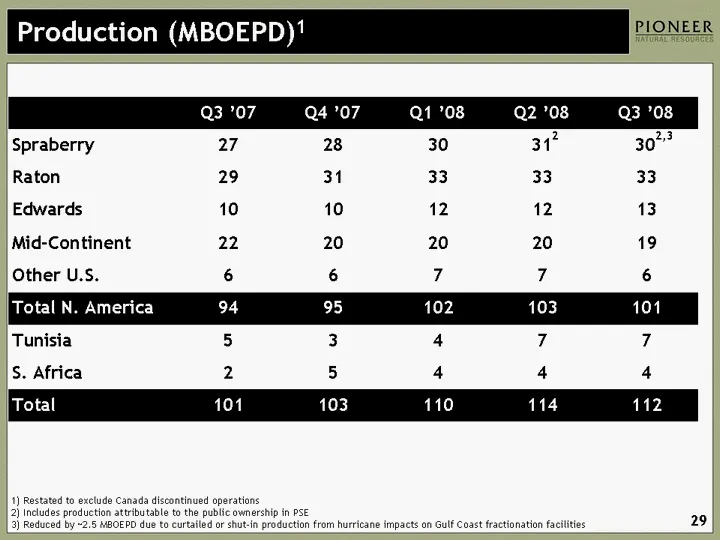
Production (MBOEPD)1 Q3 '07 Q4 '07 Q1 '08 Q2 '08 Q3 '08 Spraberry 27 28 30 312 302,3 Raton 29 31 33 33 33 Edwards 10 10 12 12 13 Mid-Continent 22 20 20 20 19 Other U.S. 6 6 7 7 6 Total N. America 94 95 102 103 101 Tunisia 5 3 4 7 7 S. Africa 2 5 4 4 4 Total 101 103 110 114 112 1) Restated to exclude
Slide 30: Spraberry - Only Large U.S. Onshore Oil Field Growing
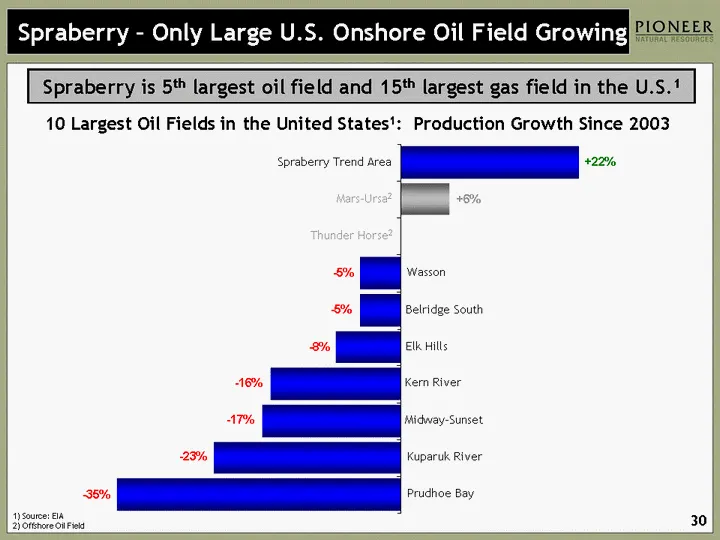
Spraberry - Only Large U.S. Onshore Oil Field Growing 10 Largest Oil Fields in the United States1: Production Growth Since 2003 Spraberry Trend Area Mars-Ursa Thunder Horse Wasson Belridge South Elk Hills Kern River Midway-Sunset Kuparuk River Prudhoe Bay 1997 22.1 31.9 0 15.1 41.1 20.5 48.8 61.6 96
Slide 31: PXD - Largest Spraberry Trend Producer
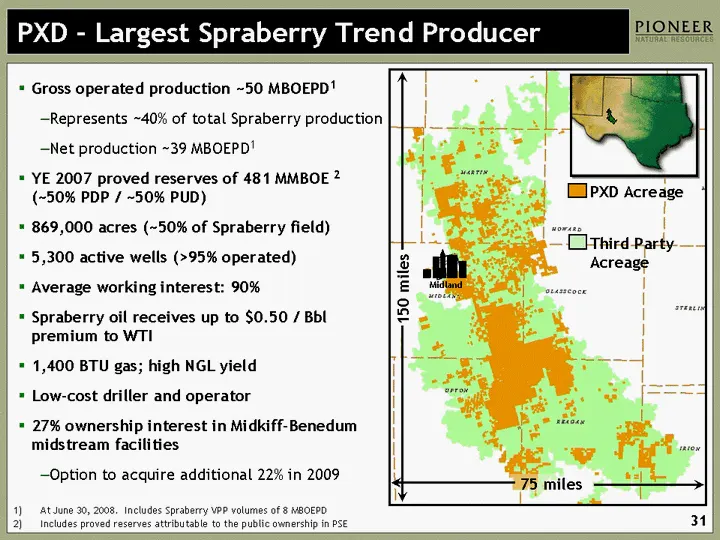
PXD - Largest Spraberry Trend Producer Gross operated production ~50 MBOEPD1 Represents ~40% of total Spraberry production Net production ~39 MBOEPD1 YE 2007 proved reserves of 481 MMBOE 2 (~50% PDP / ~50% PUD) 869,000 acres (~50% of Spraberry field) 5,300 active wells (>95% operated) Average workin
Slide 32: Spraberry 20-Acre Spacing
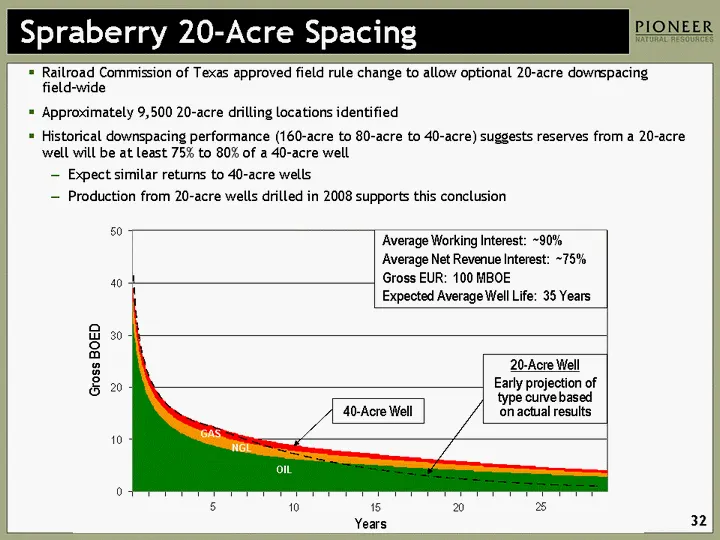
Spraberry 20-Acre Spacing Spraberry 20-Acre Spacing 5 10 15 20 25 Average Working Interest: ~90% Average Net Revenue Interest: ~75% Gross EUR: 100 MBOE Expected Average Well Life: 35 Years 20-Acre Well Early projection of type curve based on actual results OIL NGL GAS Railroad Commission of Texas ap
Slide 33: Pierre Shale - Reservoir Characteristics
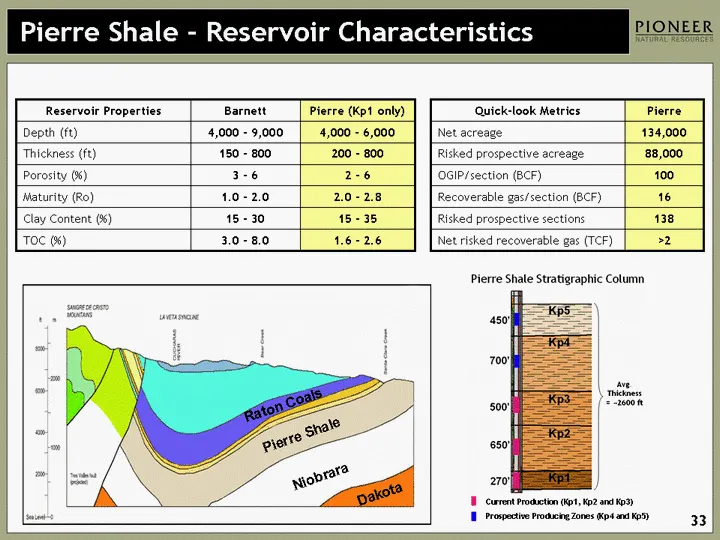
Pierre Shale - Reservoir Characteristics Reservoir Properties Barnett Pierre (Kp1 only) Depth (ft) 4,000 - 9,000 4,000 - 6,000 Thickness (ft) 150 - 800 200 - 800 Porosity (%) 3 - 6 2 - 6 Maturity (Ro) 1.0 - 2.0 2.0 - 2.8 Clay Content (%) 15 - 30 15 - 35 TOC (%) 3.0 - 8.0 1.6 - 2.6 Pierre Shale Raton
Slide 34: Raton CBM Well Type Curve
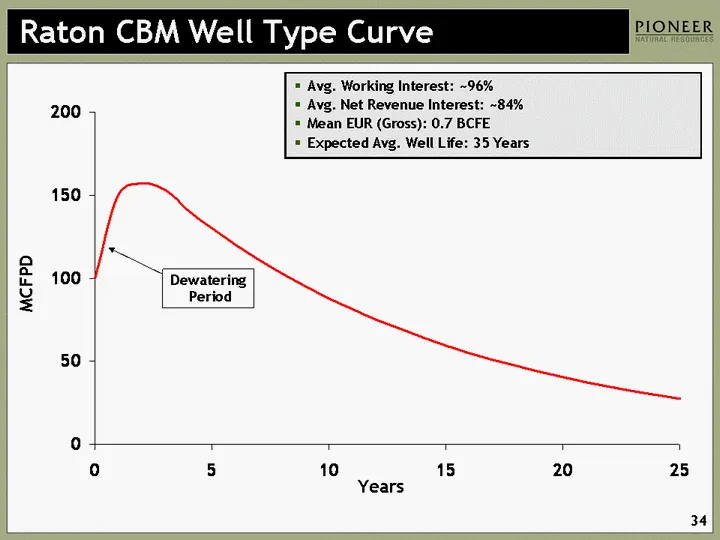
Raton CBM Well Type Curve Years 2004 - 2006 Avg 0 100 1 150 2 157 3 153 4 140.5601195 5 130.0131103 6 120.257502 7 111.2339114 8 102.8874111 9 95.16719519 10 88.02627013 11 81.42116847 12 75.3116844 13 69.66062897 14 64.43360373 15 59.59879133 16 55.12676184 17 50.99029365 18 47.16420773 19 43.62521
Slide 35: Pierre Shale Type Curve
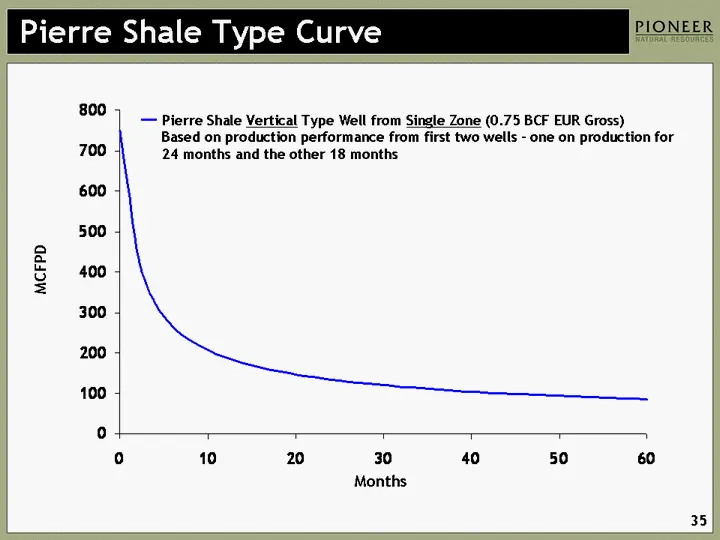
Pierre Shale Type Curve Months Pmean Breakeven 0 750 515 1 599.2607803 411.4924025 2 444.4461843 305.1863799 3 368.7420193 253.2028532 4 321.8928203 221.03307 5 289.282304 198.6405154 6 264.9131288 181.9070151 7 245.814549 168.792657 8 230.3260982 158.1572541 9 217.4377145 149.3072306 10 206.4951555
Slide 36: Barnett Shale Expansion / Tier Area
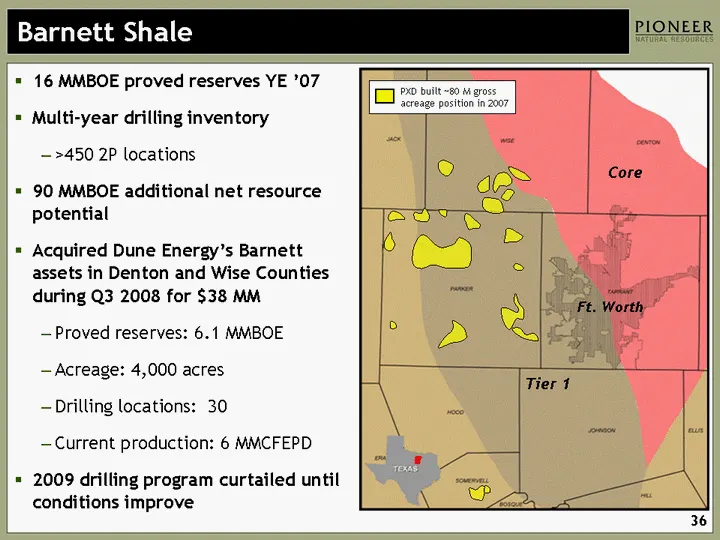
Barnett Shale Expansion / Tier 2 Area 16 MMBOE proved reserves YE '07 Multi-year drilling inventory >450 2P locations 90 MMBOE additional net resource potential Acquired Dune Energy's Barnett assets in Denton and Wise Counties during Q3 2008 for $38 MM Proved reserves: 6.1 MMBOE Acreage: 4,000 acres
Slide 37: Production Growth From VPP Expirations
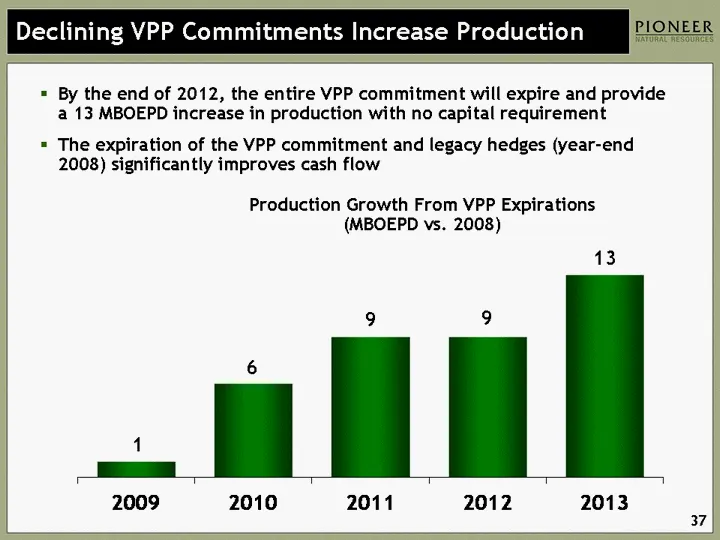
By the end of 2012, the entire VPP commitment will expire and provide a 13 MBOEPD increase in production with no capital requirement The expiration of the VPP commitment and legacy hedges (year-end 2008) significantly improves cash flow 2008 2009 2010 2011 2012 2013 Historical Production VPP Oil 8 7
Slide 38: Minimal Maintenance Capital Requirements in 2009 / 2010
Maintenance capital requirement only $200 MM in both 2009 and 2010 Keeps production flat Maintains drilling in Alaska Maintains acreage leasehold 2009 production growth benefits from startup of most prolific South Coast Gas well in Q4 '08, late 2008 infrastructure adds in Edwards and 1,000 BOEPD of
Slide 39: 9 Months 2008 All-in Costs vs. Peers
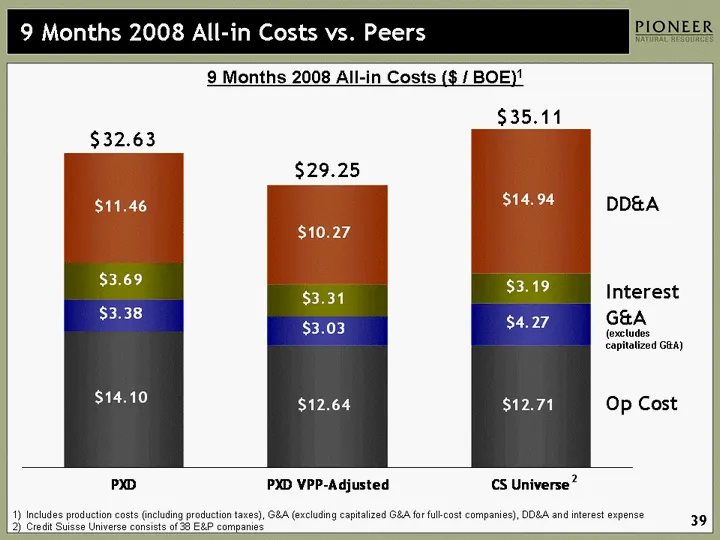
Op Cost G&A Interest DD&A PXD 14.1 3.38 3.69 11.46 PXD VPP-Adjusted 12.64 3.03 3.31 10.27 PEER AVG 11.41 3.02 2.33 14.01 CS Universe 12.71 4.27 3.19 14.94 9 Months 2008 All-in Costs vs. Peers 9 Months 2008 All-in Costs ($ / BOE)1 Includes production costs (including production taxes), G&A (excluding
Slide 40: All-In Finding and Development Costs
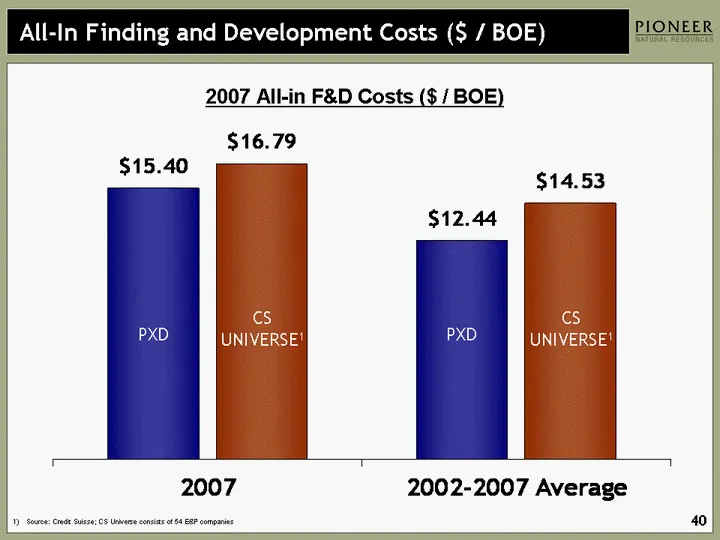
All-In Finding and Development Costs ($ / BOE) 2007 2002-2007 Average PXD 15.4 12.44 CS Universe 16.79 14.53 PXD CS UNIVERSE1 Source: Credit Suisse; CS Universe consists of 54 E&P companies PXD CS UNIVERSE1 2007 All-in F&D Costs ($ / BOE)
Slide 41: Certain Reserve Information
Certain Reserve Information Cautionary Note to U.S. Investors -- The U.S. Securities and Exchange Commission (the "SEC") permits oil and gas companies, in their filings with the SEC, to disclose only proved reserves that a company has demonstrated by actual production or conclusive formation tests t
Slide 42: Finding & Development Costs
Finding & Development Costs "Finding and development costs per BOE," "F&D per BOE," or "All-in F&D Costs per BOE" means total costs incurred divided by the summation of annual proved reserves, on a BOE basis, attributable to revisions of previous estimates, purchases of minerals-in-place and discove
Source: SEC EDGAR · 8-K filed Jan 13, 2009
More decks from Pioneer Natural Resources Co
 Merger or Acquisition (October 2023)15 slides · Oct 11, 2023
 Q3 2020 Earnings Presentation30 slides · Nov 4, 2020
 Merger or Acquisition (October 2020)18 slides · Oct 20, 2020
 IPAA Oil & Gas Investment Symposium 201846 slides · Apr 9, 2018
 Investor Presentation (January 2014)80 slides · Jan 6, 2014
 Q4 2012 Earnings Presentation48 slides · Feb 13, 2013