Pioneer Natural Resources — Investor Presentation (January 2012)
43 slides from Pioneer Natural Resources's investor presentation, Jan 9, 2012

Slide 1: Investor Presentation January 2012
EXHIBIT 99.1 Investor Presentation January 2012

Slide 2: Forward-Looking Statements
Forward-Looking Statements Except for historical information contained herein, the statements, charts and graphs in this presentation are forward-looking statements that are made pursuant to the Safe Harbor Provisions of the Private Securities Litigation Reform Act of 1995. Forward-looking statement
Slide 3: Investment Highlights
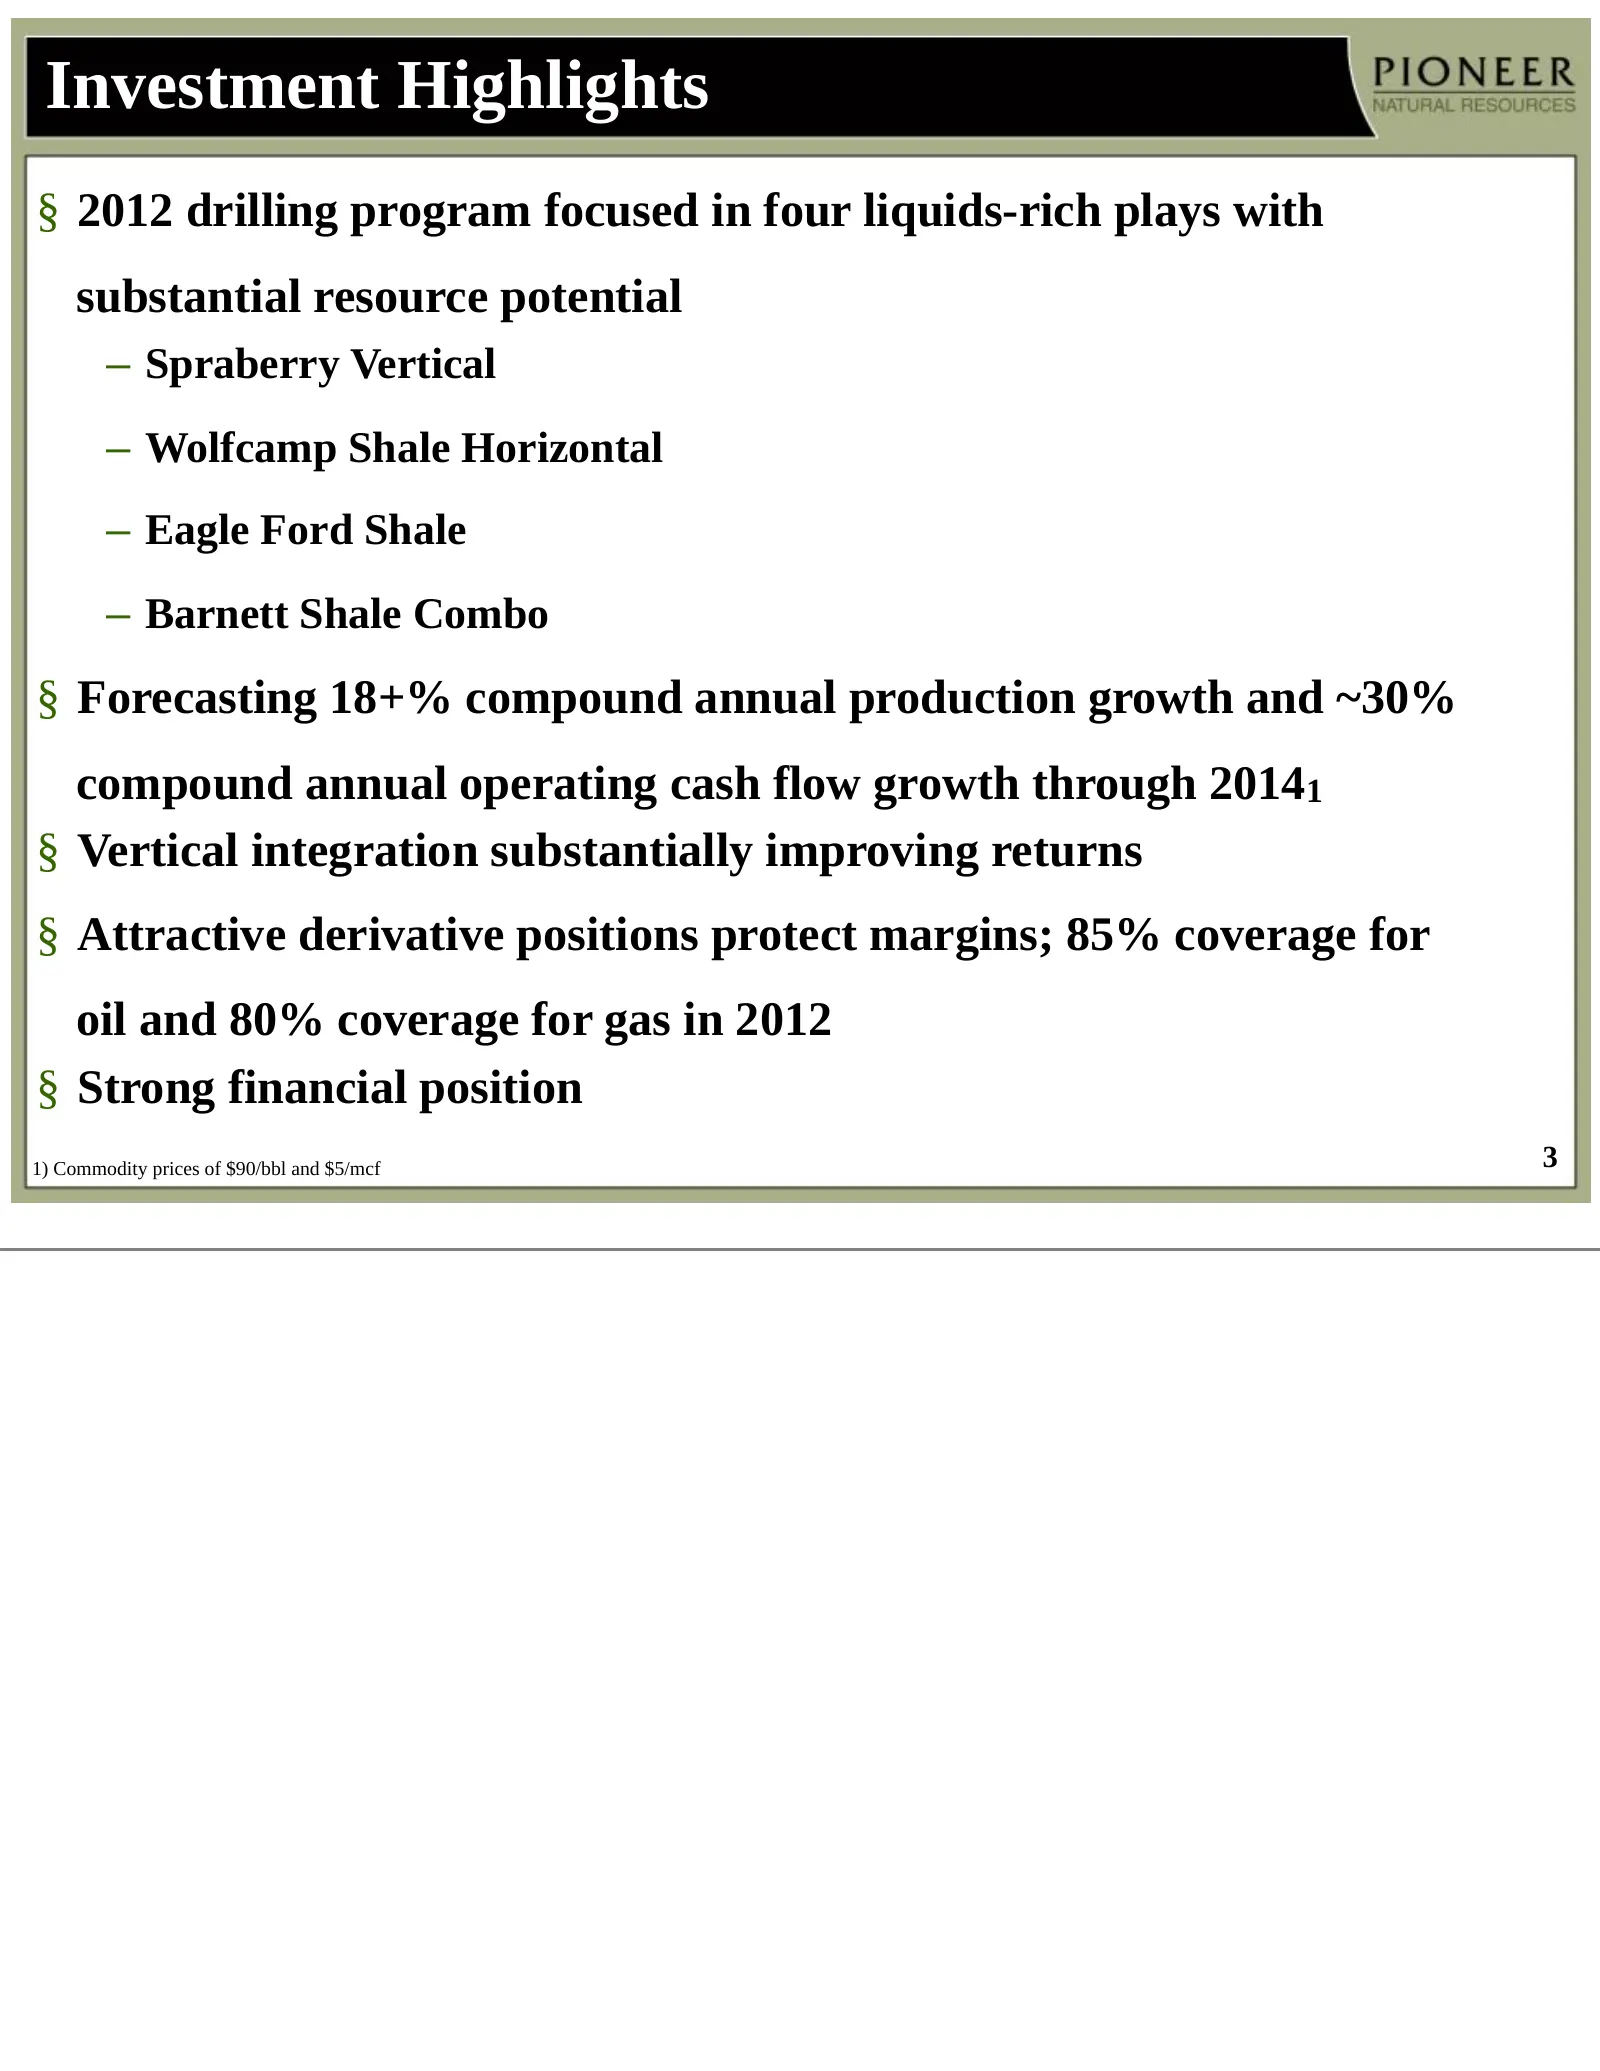
Investment Highlights § 2012 drilling program focused in four liquids-rich plays with substantial resource potential – Spraberry Vertical – Wolfcamp Shale Horizontal – Eagle Ford Shale – Barnett Shale Combo § Forecasting 18+% compound annual production growth and ~30% compound annual operating cash
Slide 4: Pioneer is a Leader in the Two Most Active U.S. Plays
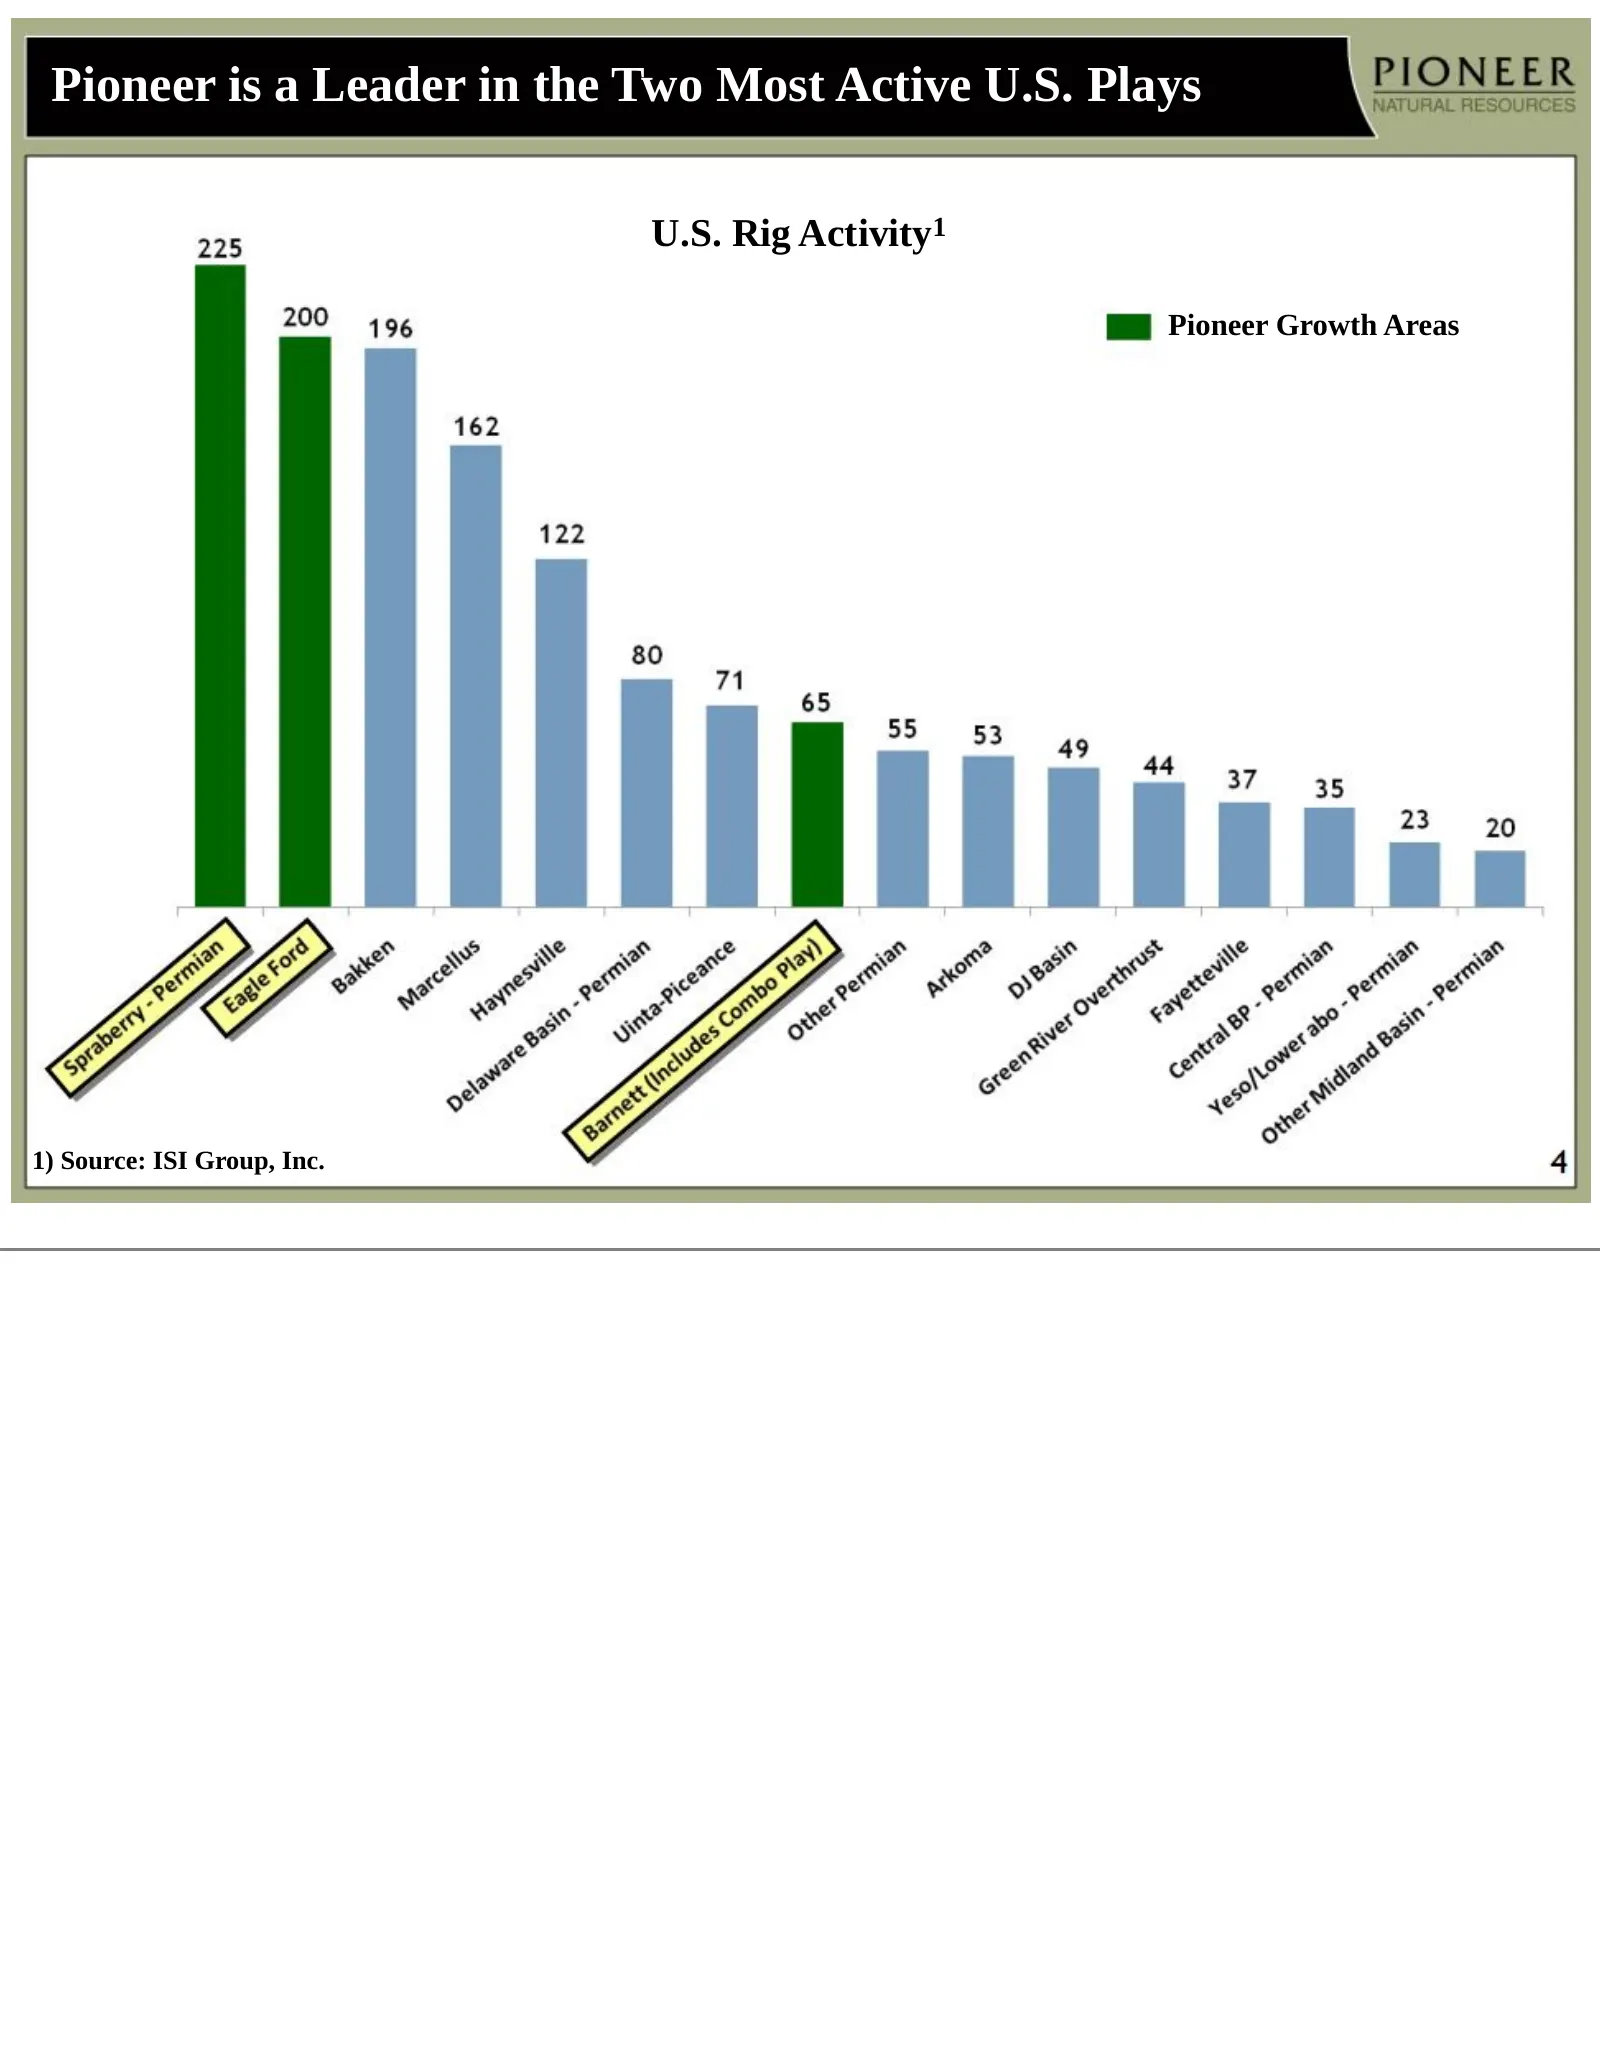
Pioneer is a Leader in the Two Most Active U.S. Plays U.S. Rig Activity1 Pioneer Growth Areas 1) Source: ISI Group, Inc.
Slide 5: Targeting 18+% Compound Annual Production Growth For 2011 - 2014
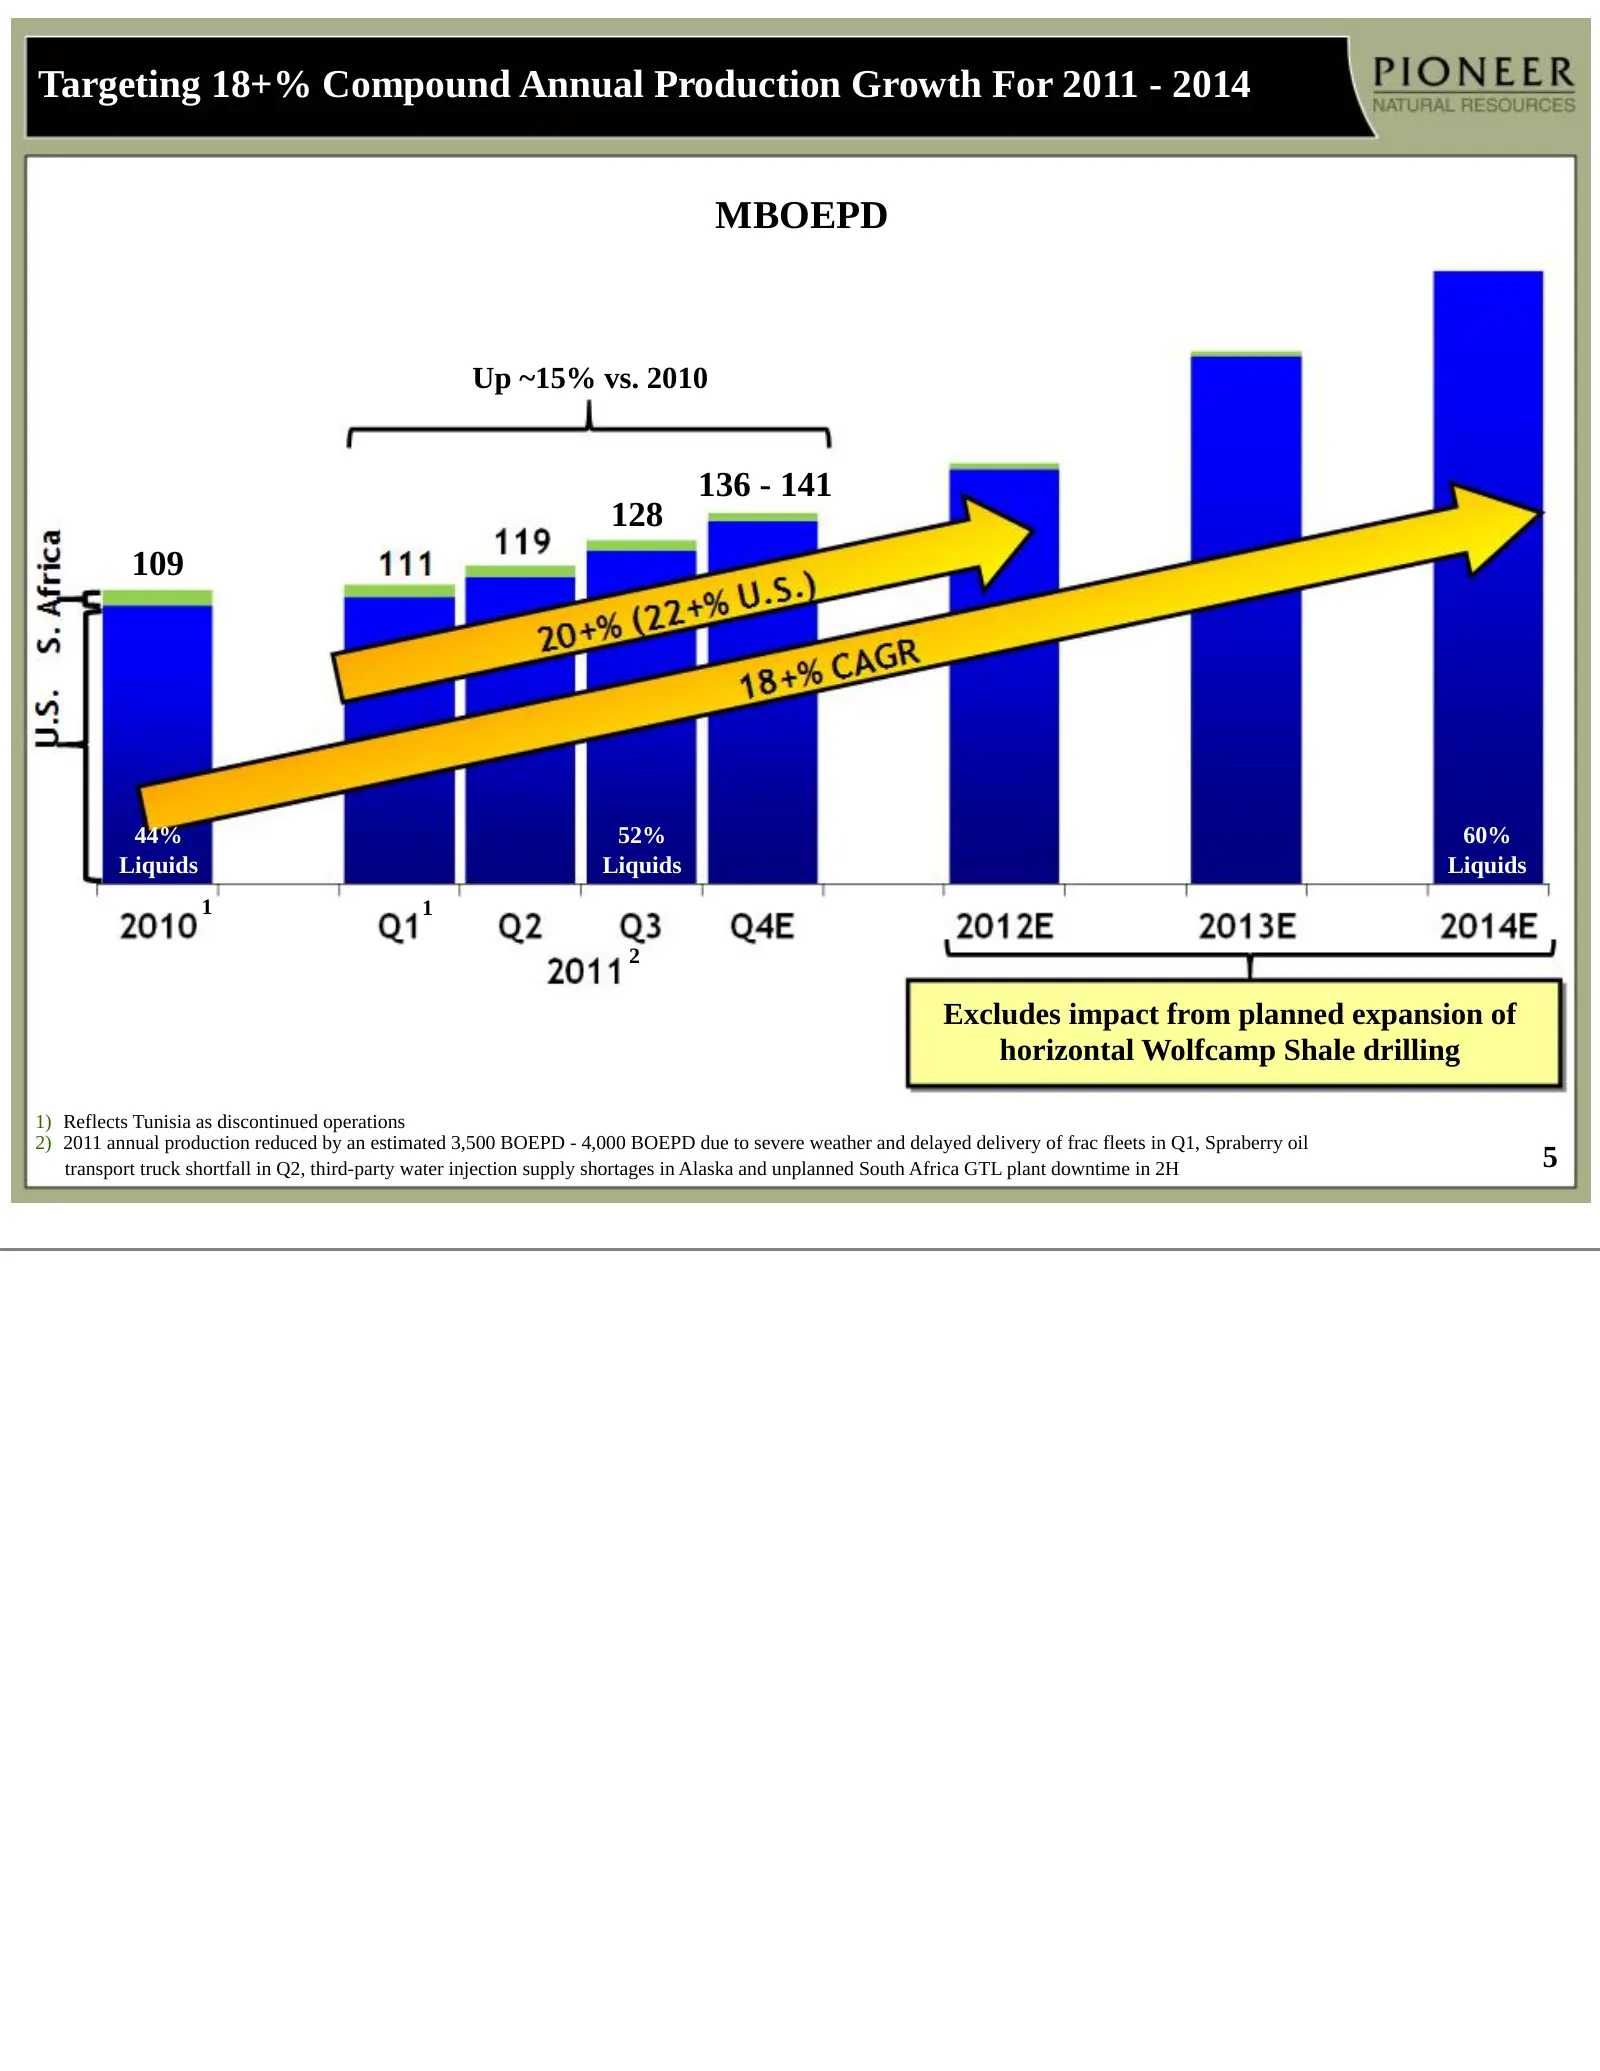
Targeting 18+% Compound Annual Production Growth For 2011 - 2014 MBOEPD Up ~15% vs. 2010 136 - 141 128 109 44% 52% 60% Liquids Liquids Liquids 1 1 2 Excludes impact from planned expansion of horizontal Wolfcamp Shale drilling 1) Reflects Tunisia as discontinued operations 2) 2011 annual production r
Slide 6: PXD Open Commodity Derivative Positions as of 1/4/2012 (includes PSE)
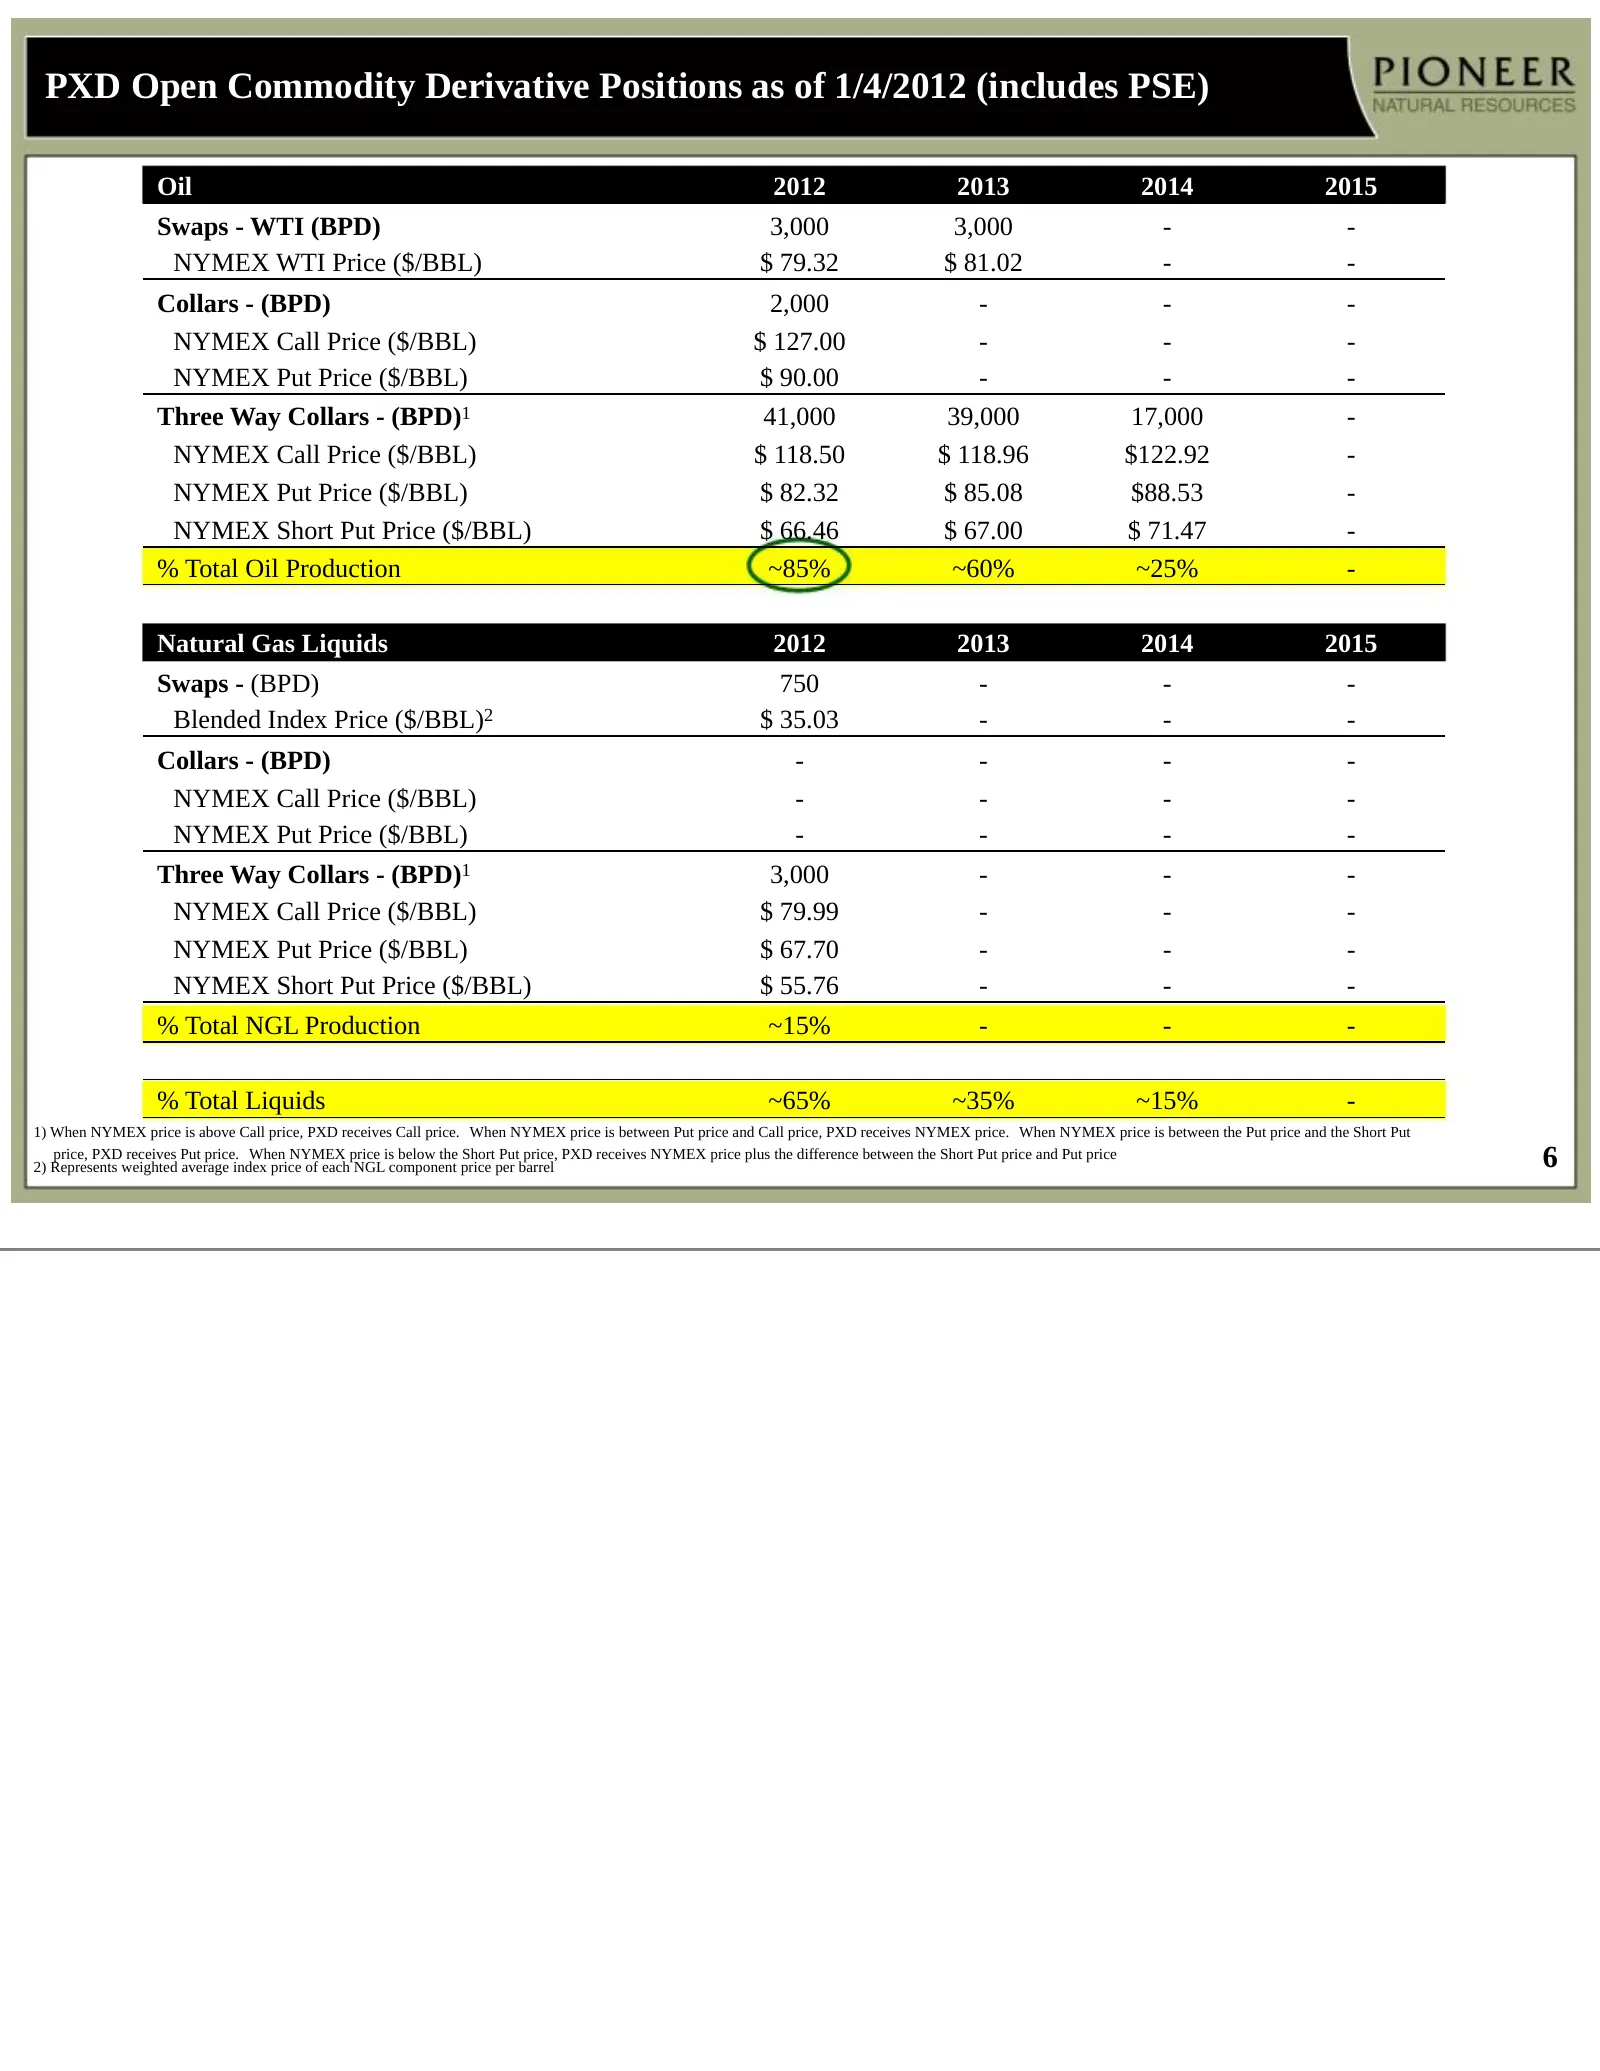
PXD Open Commodity Derivative Positions as of 1/4/2012 (includes PSE) Oil 2012 2013 2014 2015 Swaps - WTI (BPD) 3,000 3,000 - - NYMEX WTI Price ($/BBL) $ 79.32 $ 81.02 - - Collars - (BPD) 2,000 - - - NYMEX Call Price ($/BBL) $ 127.00 - - - NYMEX Put Price ($/BBL) $ 90.00 - - - Three Way Collars - (B
Slide 7: PXD Open Commodity Derivative Positions as of 1/4/2012 (includes PSE)
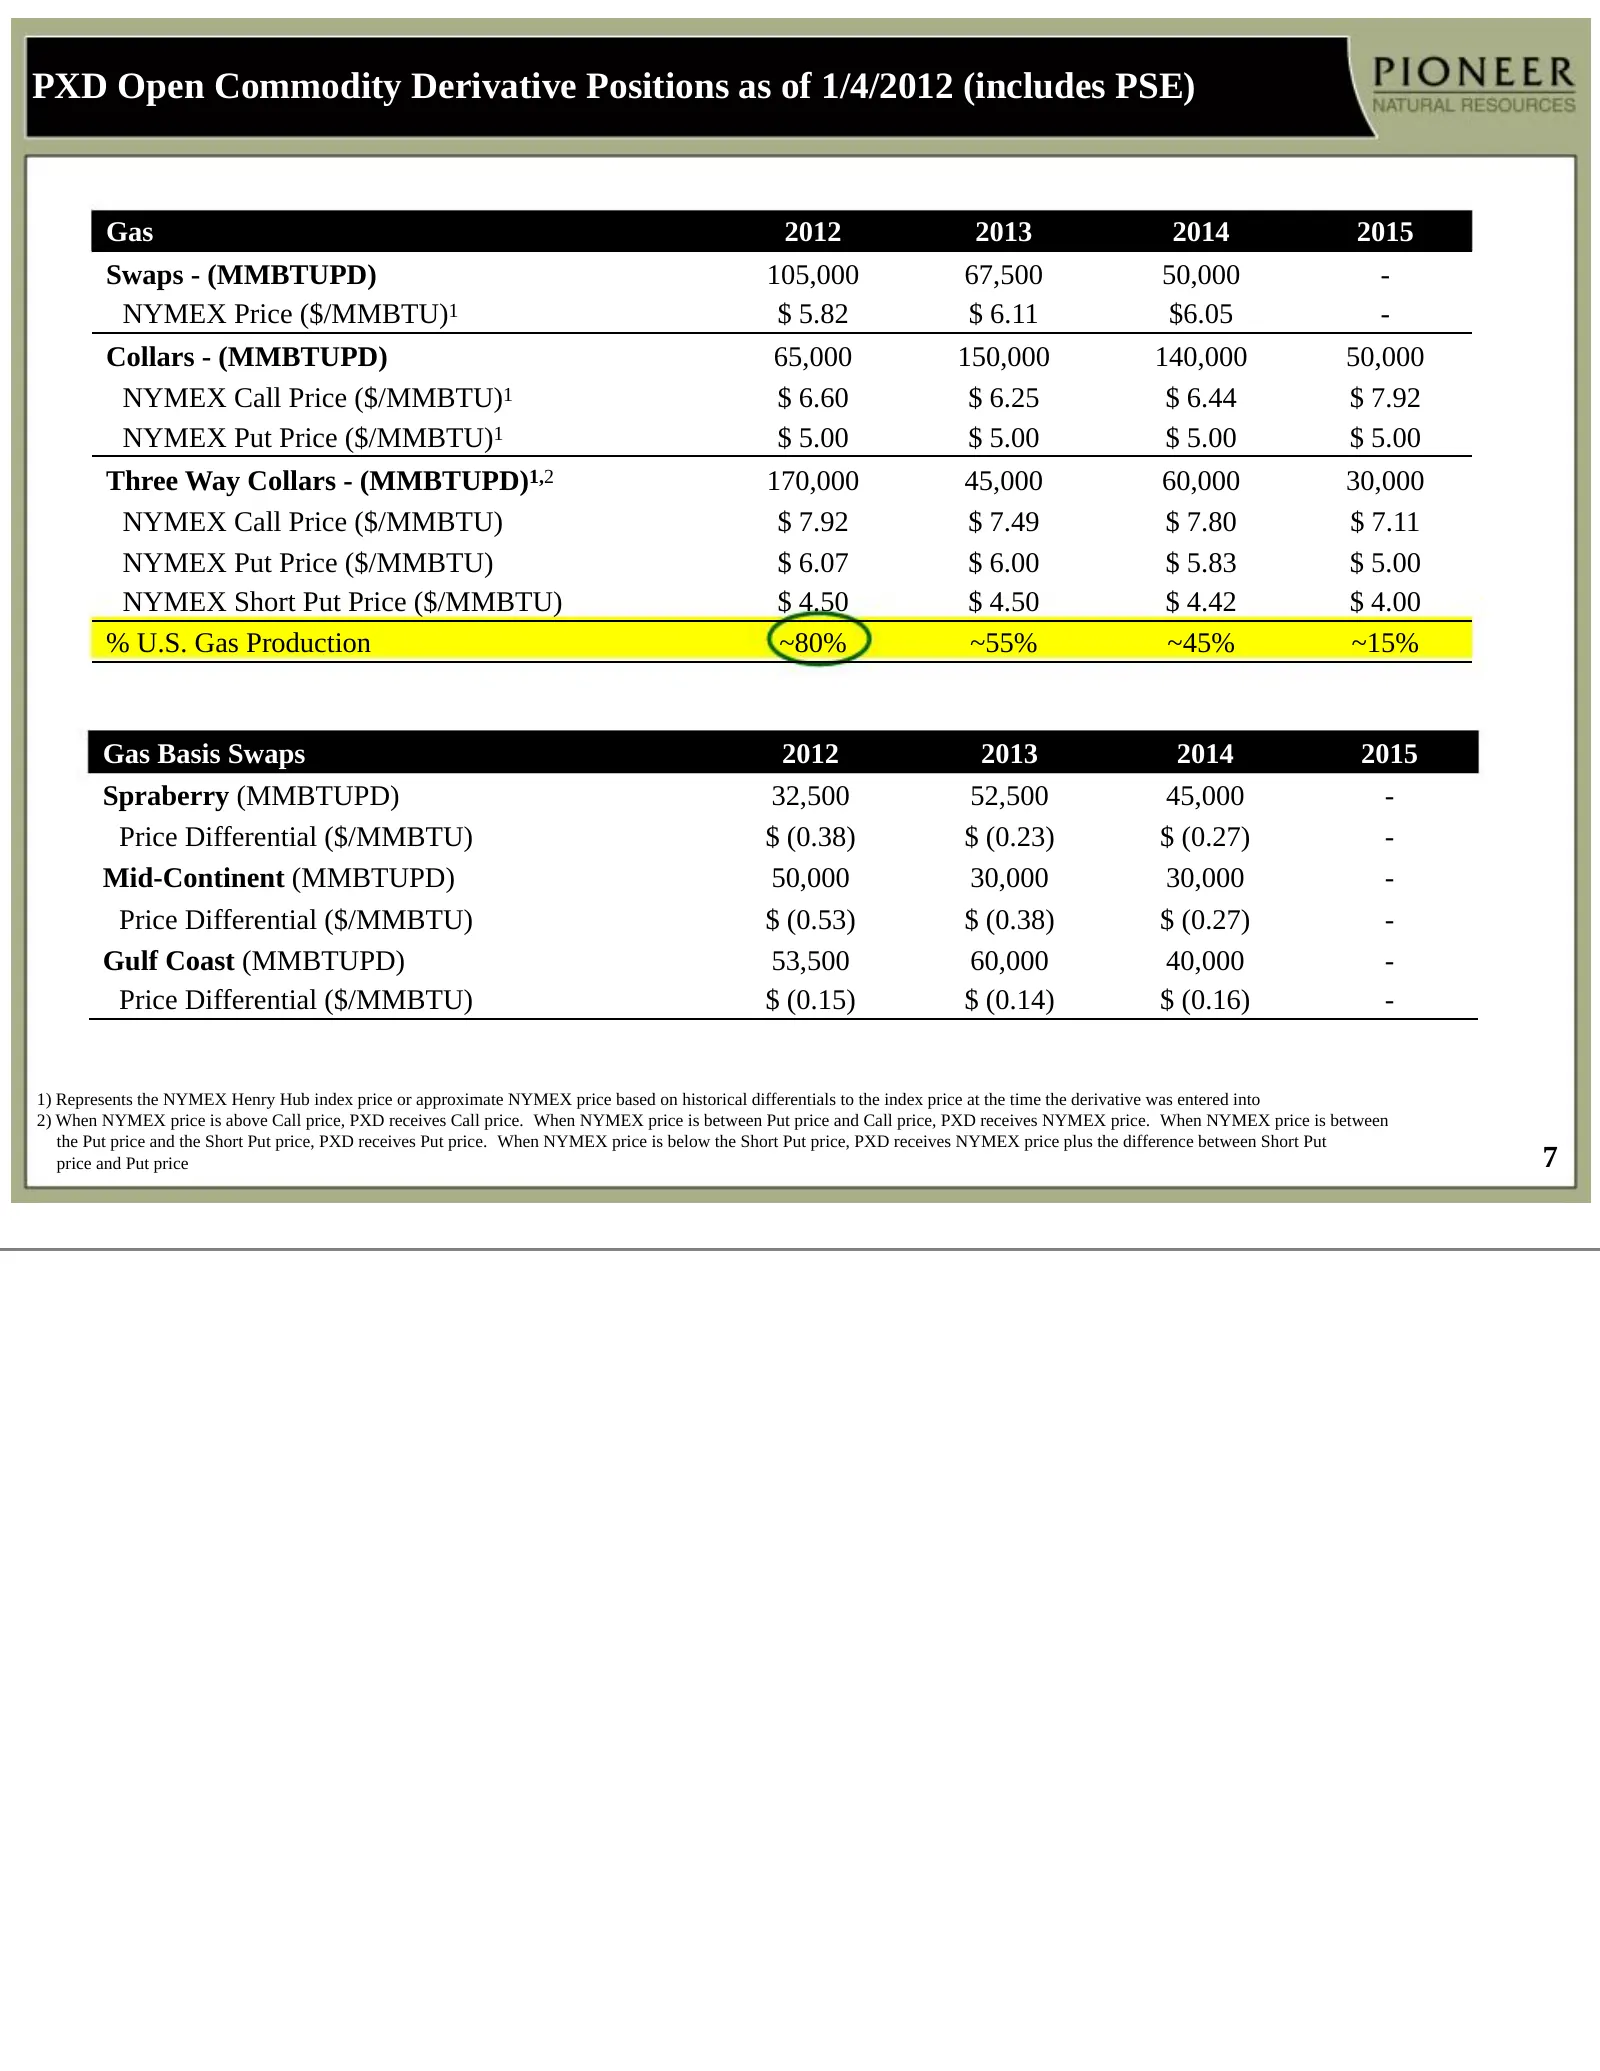
PXD Open Commodity Derivative Positions as of 1/4/2012 (includes PSE) Gas 2012 2013 2014 2015 Swaps - (MMBTUPD) 105,000 67,500 50,000 - NYMEX Price ($/MMBTU)1 $ 5.82 $ 6.11 $6.05 - Collars - (MMBTUPD) 65,000 150,000 140,000 50,000 NYMEX Call Price ($/MMBTU)1 $ 6.60 $ 6.25 $ 6.44 $ 7.92 NYMEX Put Pri
Slide 8: Liquidity Position (09/30/11 Pro Forma)
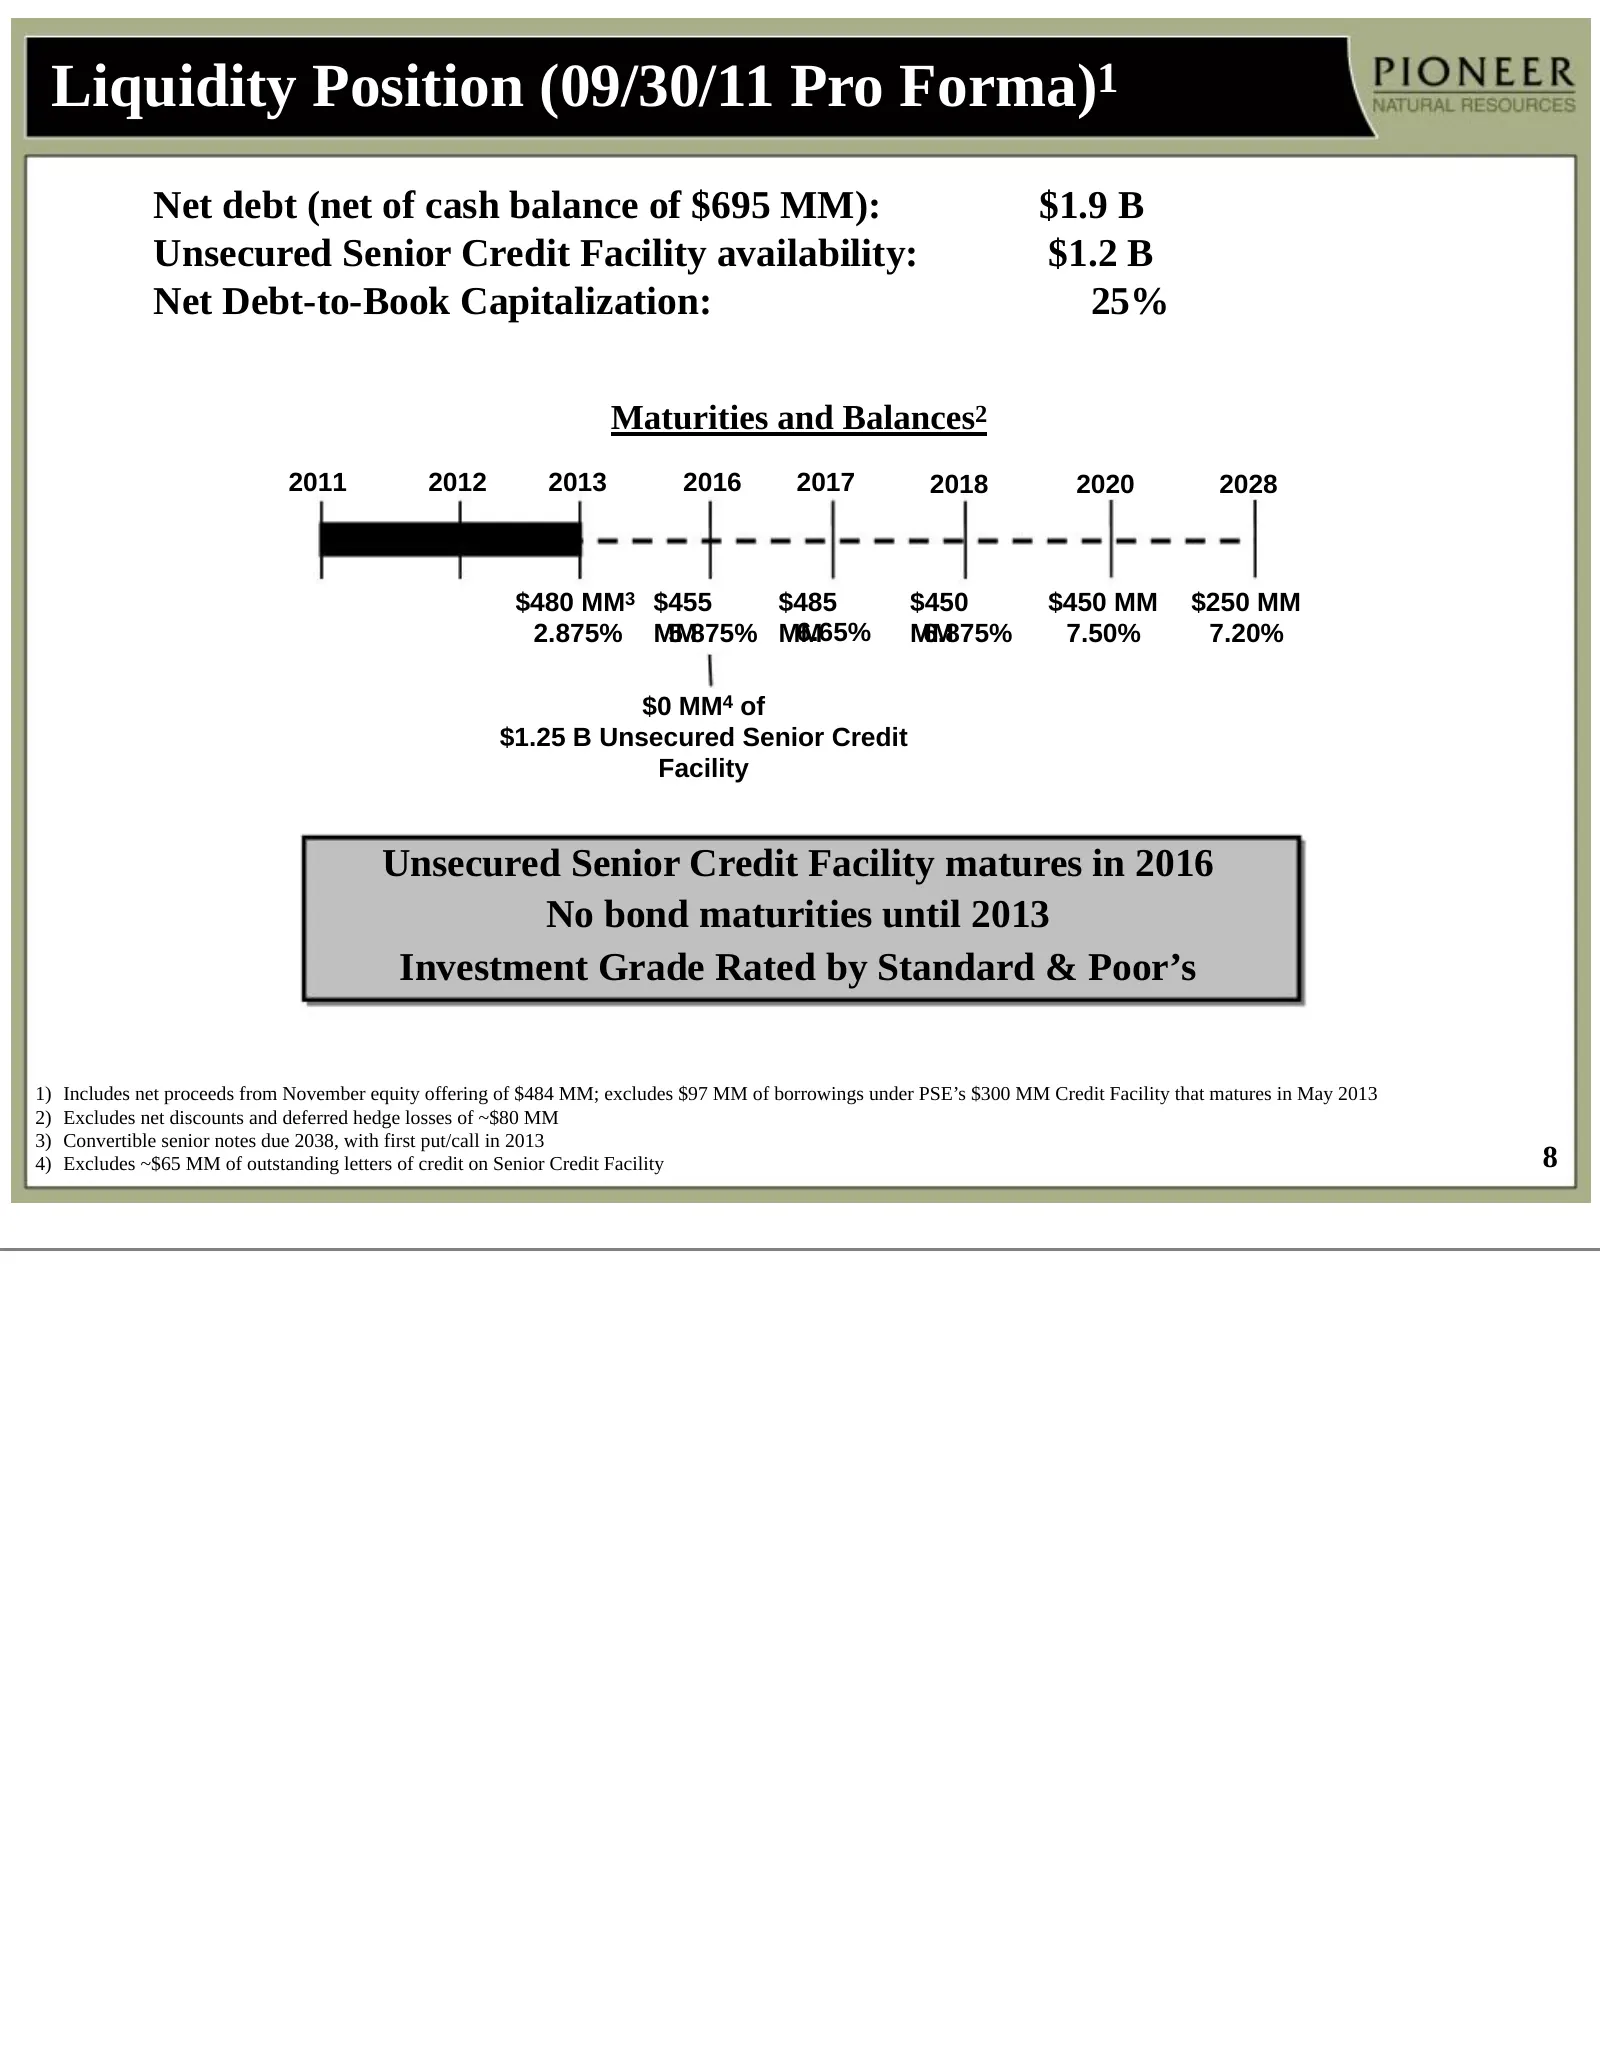
Liquidity Position (09/30/11 Pro Forma)1 Net debt (net of cash balance of $695 MM): $1.9 B Unsecured Senior Credit Facility availability: $1.2 B Net Debt-to-Book Capitalization: 25% Maturities and Balances2 2011 2012 2013 2016 2017 2018 2020 2028 $480 MM3 $455 $485 $450 $450 MM $250 MM 2.875% MM 6.6
Slide 9: Industry Increasing Horizontal Wolfcamp Shale Activity
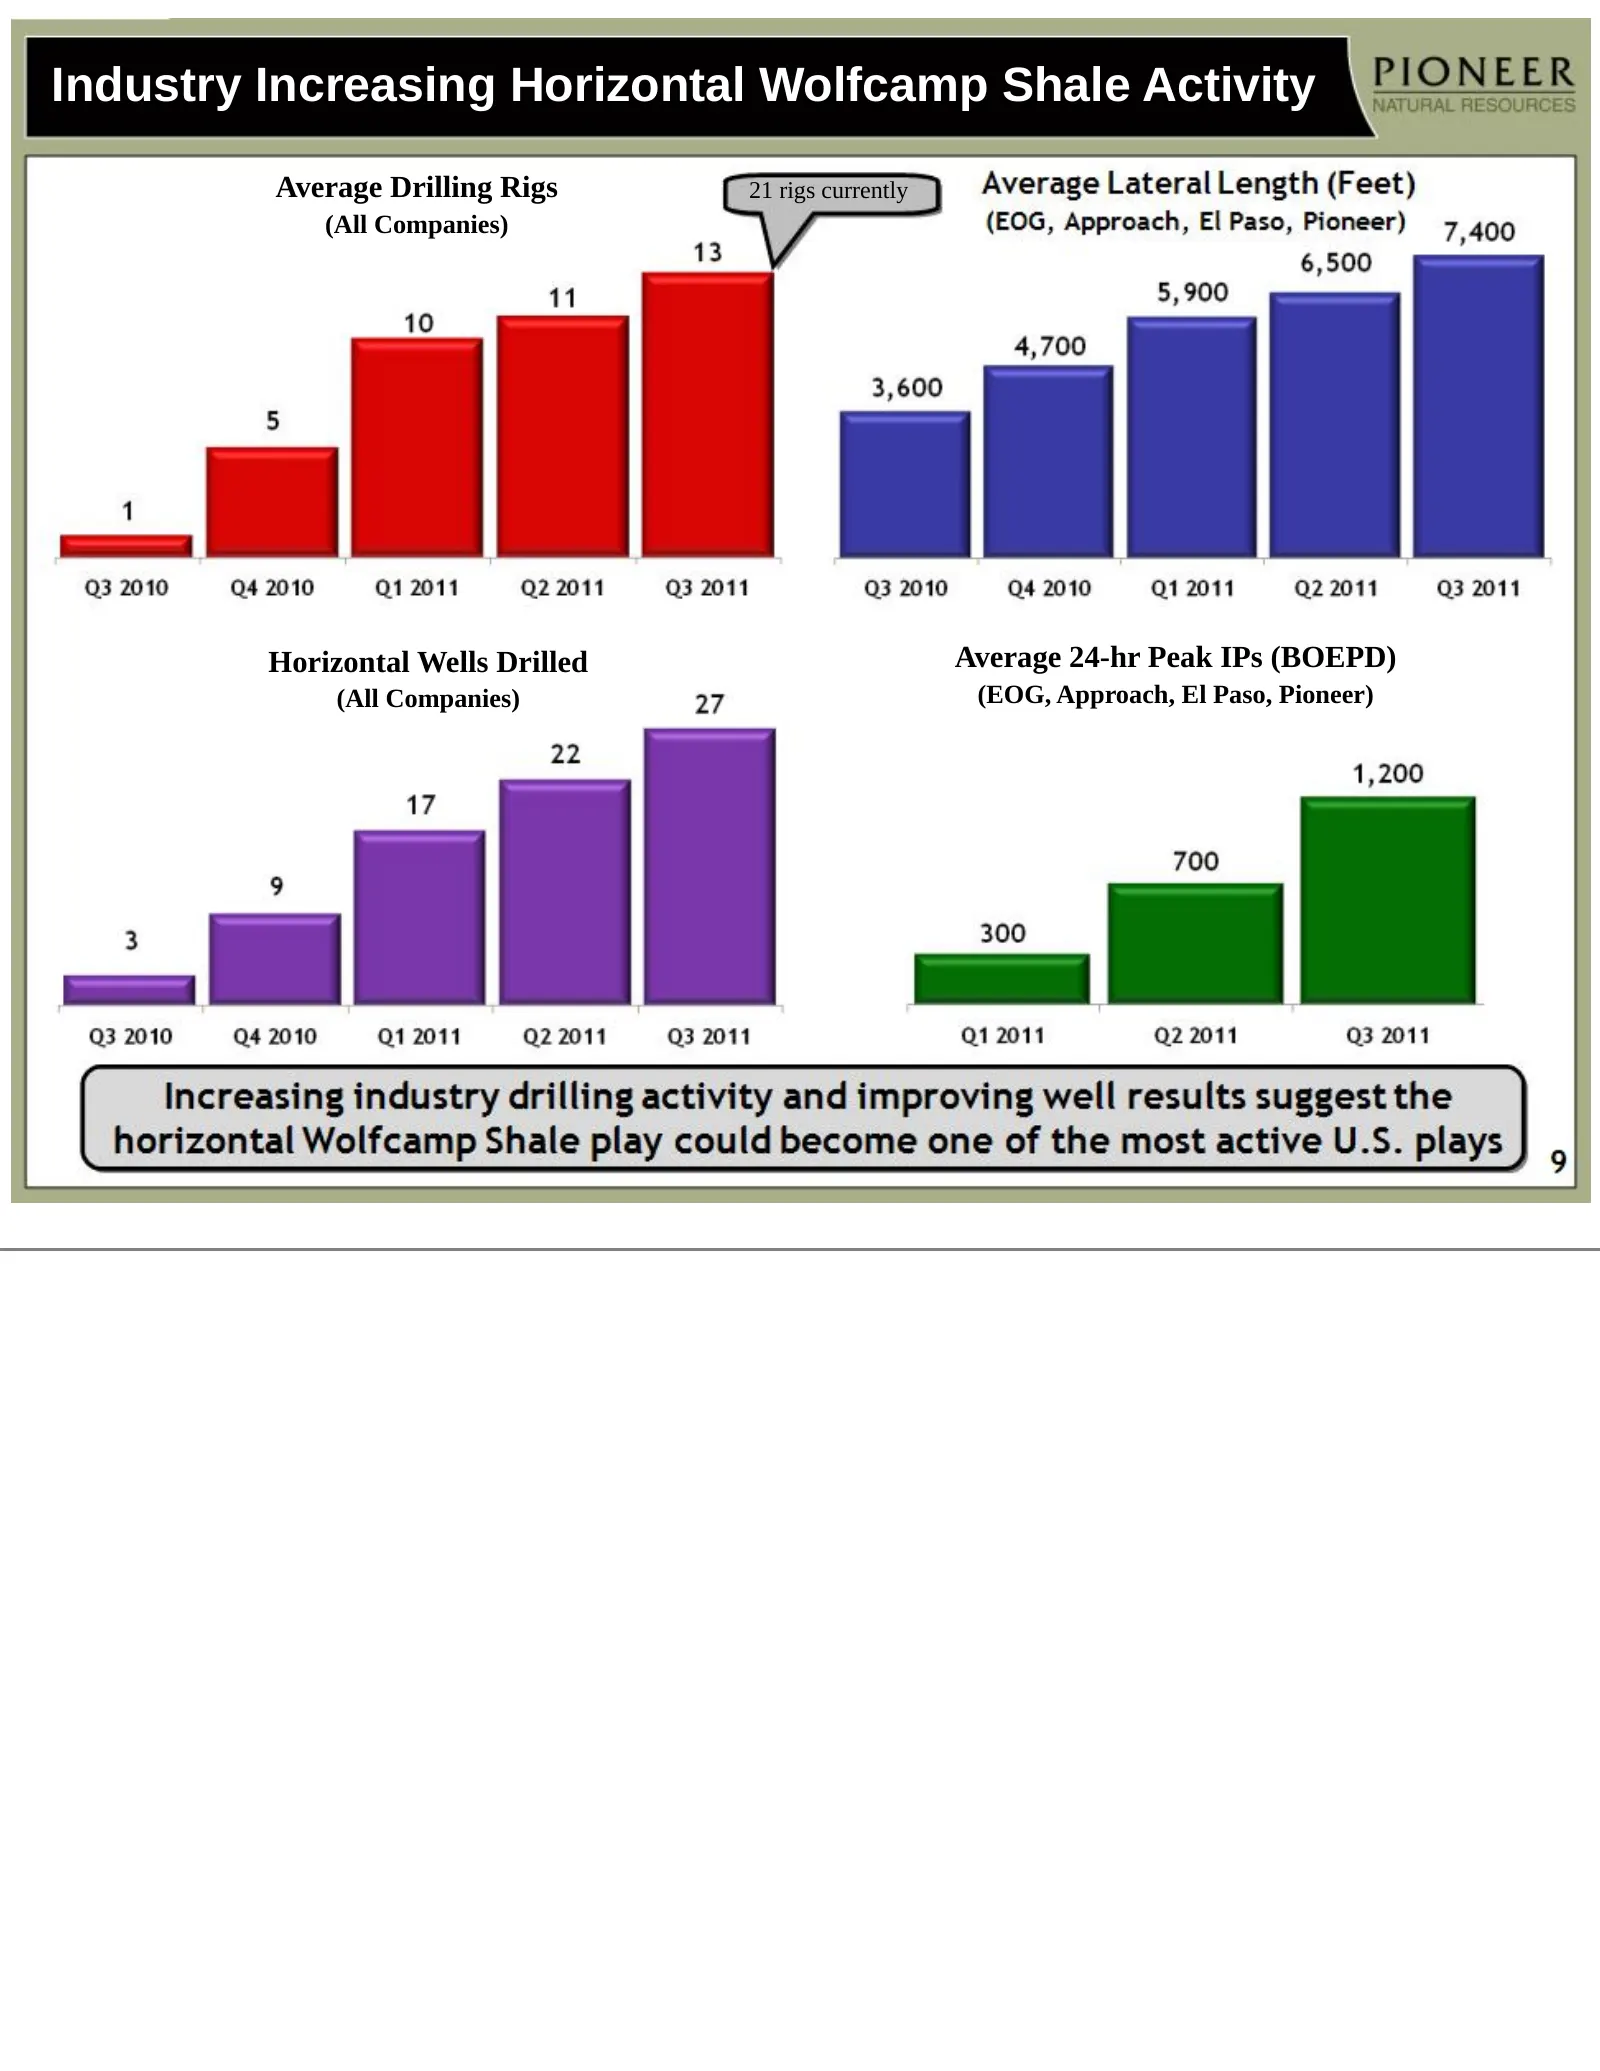
Industry Increasing Horizontal Wolfcamp Shale Activity Average Drilling Rigs 21 rigs currently (All Companies) Horizontal Wells Drilled Average 24-hr Peak IPs (BOEPD) (All Companies) (EOG, Approach, El Paso, Pioneer)
Slide 10: PXD's Successful Horizontal Wolfcamp Shale Well
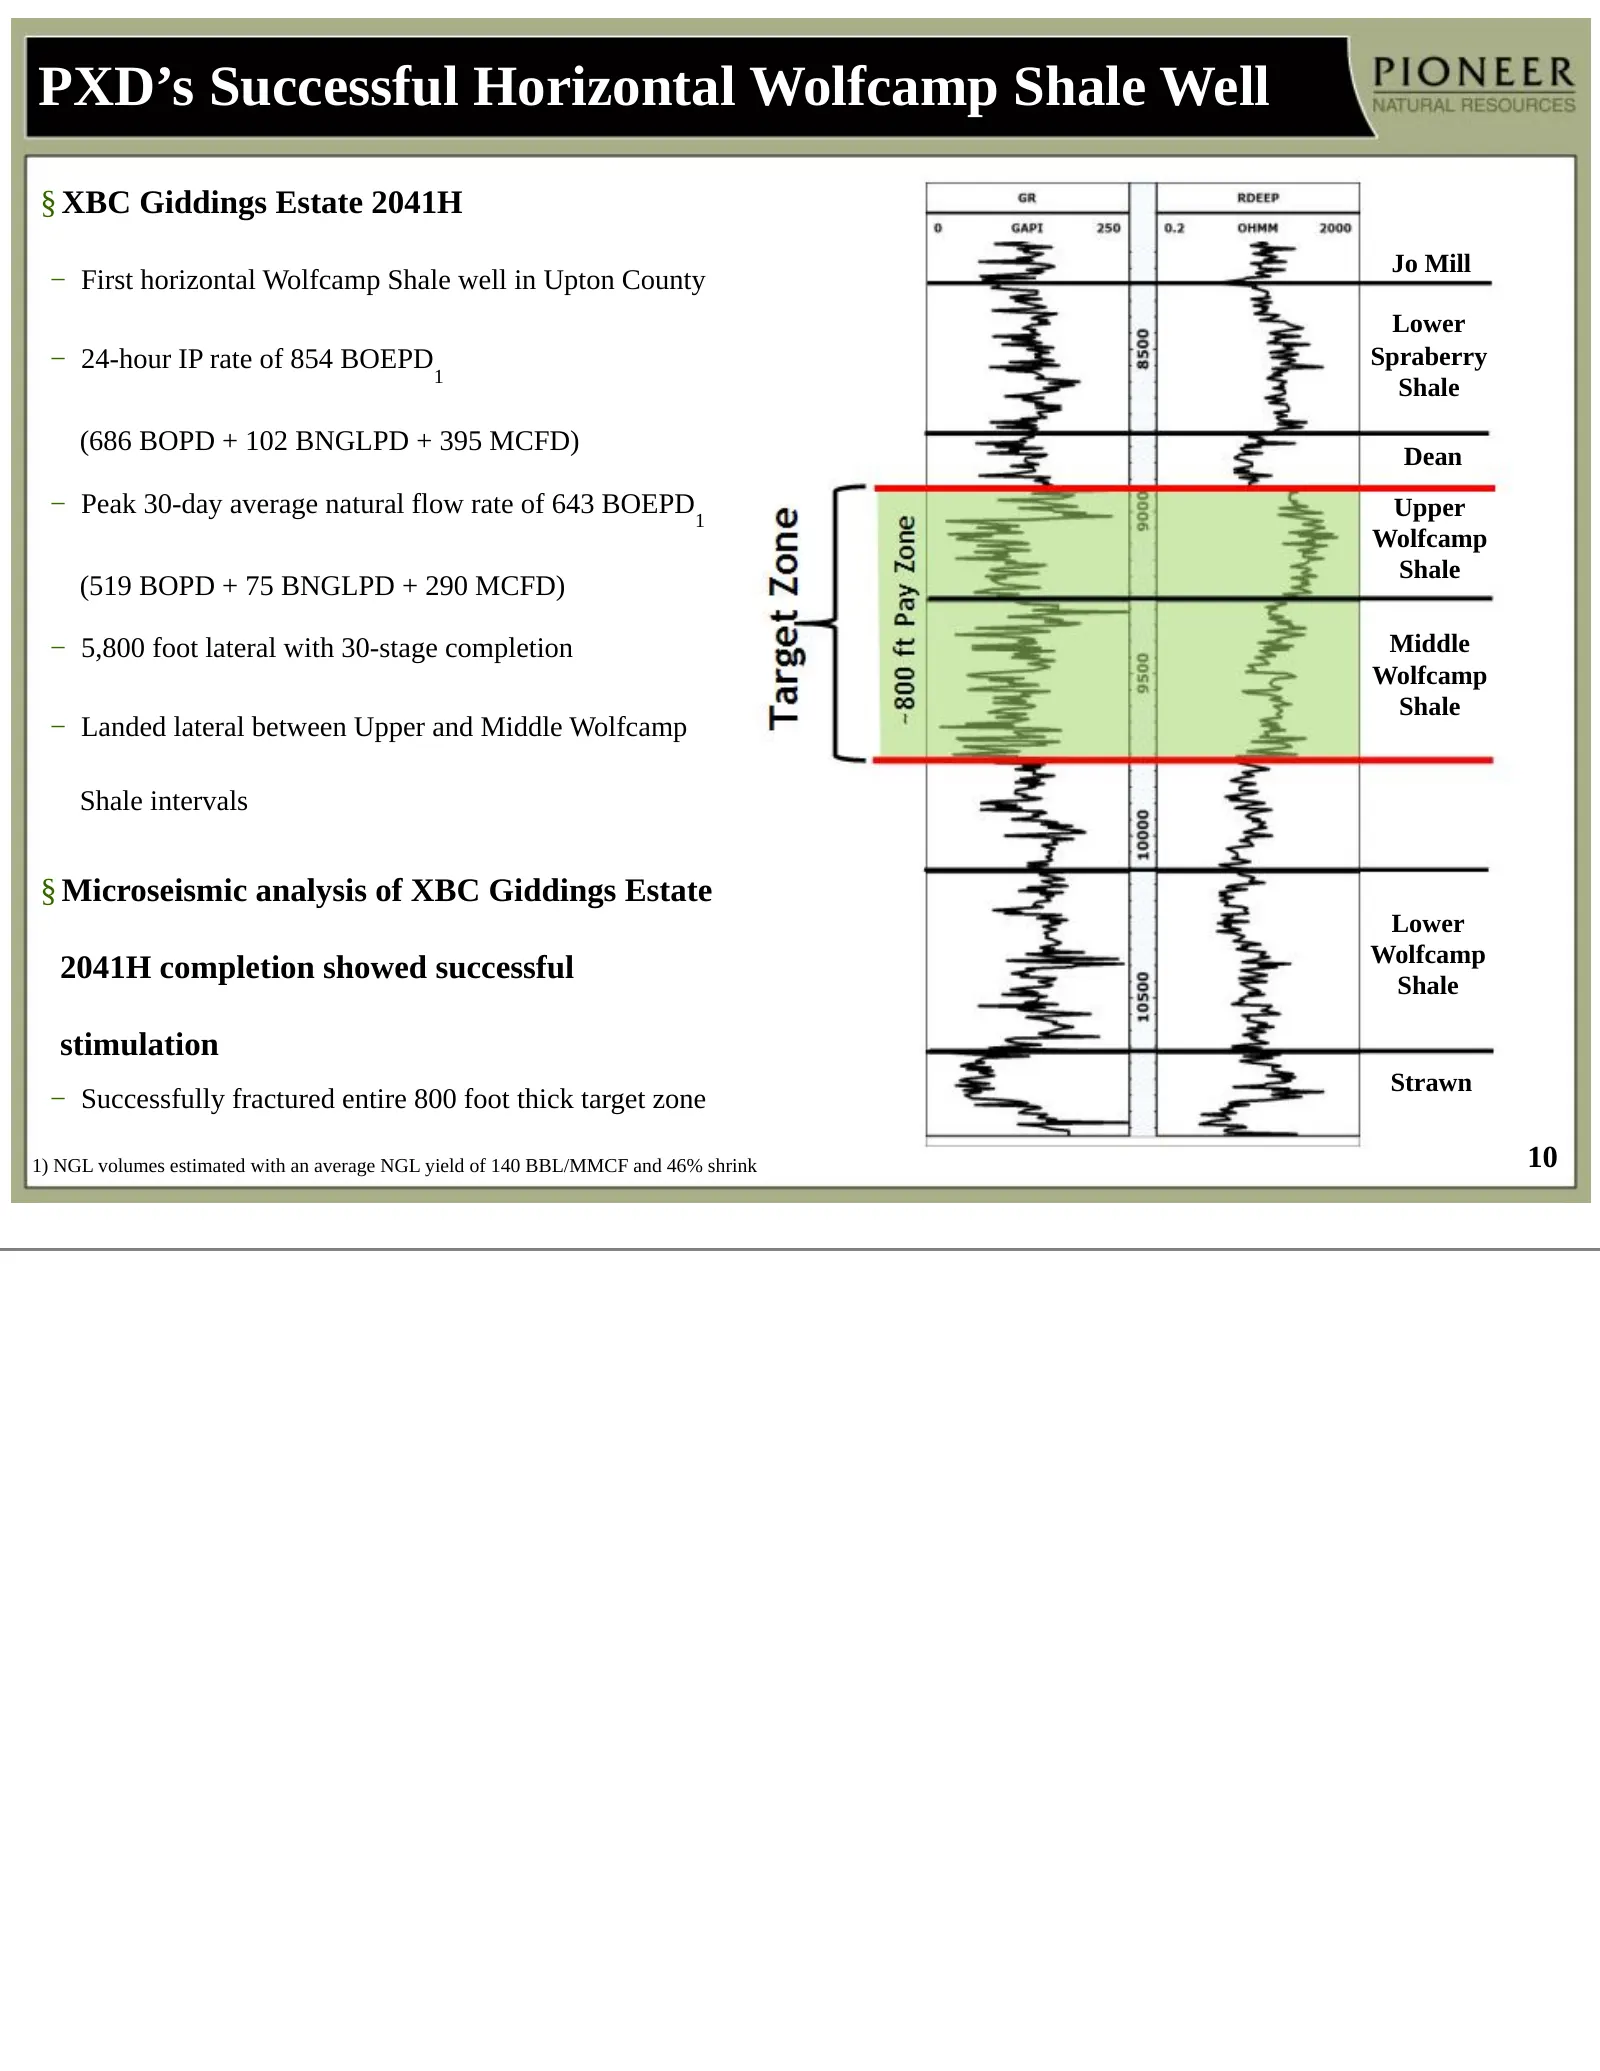
PXD’s Successful Horizontal Wolfcamp Shale Well § XBC Giddings Estate 2041H Jo Mill − First horizontal Wolfcamp Shale well in Upton County Lower − 24-hour IP rate of 854 BOEPD Spraberry 1 Shale (686 BOPD + 102 BNGLPD + 395 MCFD) Dean − Peak 30-day average natural flow rate of 643 BOEPD Upper 1 Wolfc
Slide 11: PXD's Acreage Has Significant Horizontal Wolfcamp Shale Potential
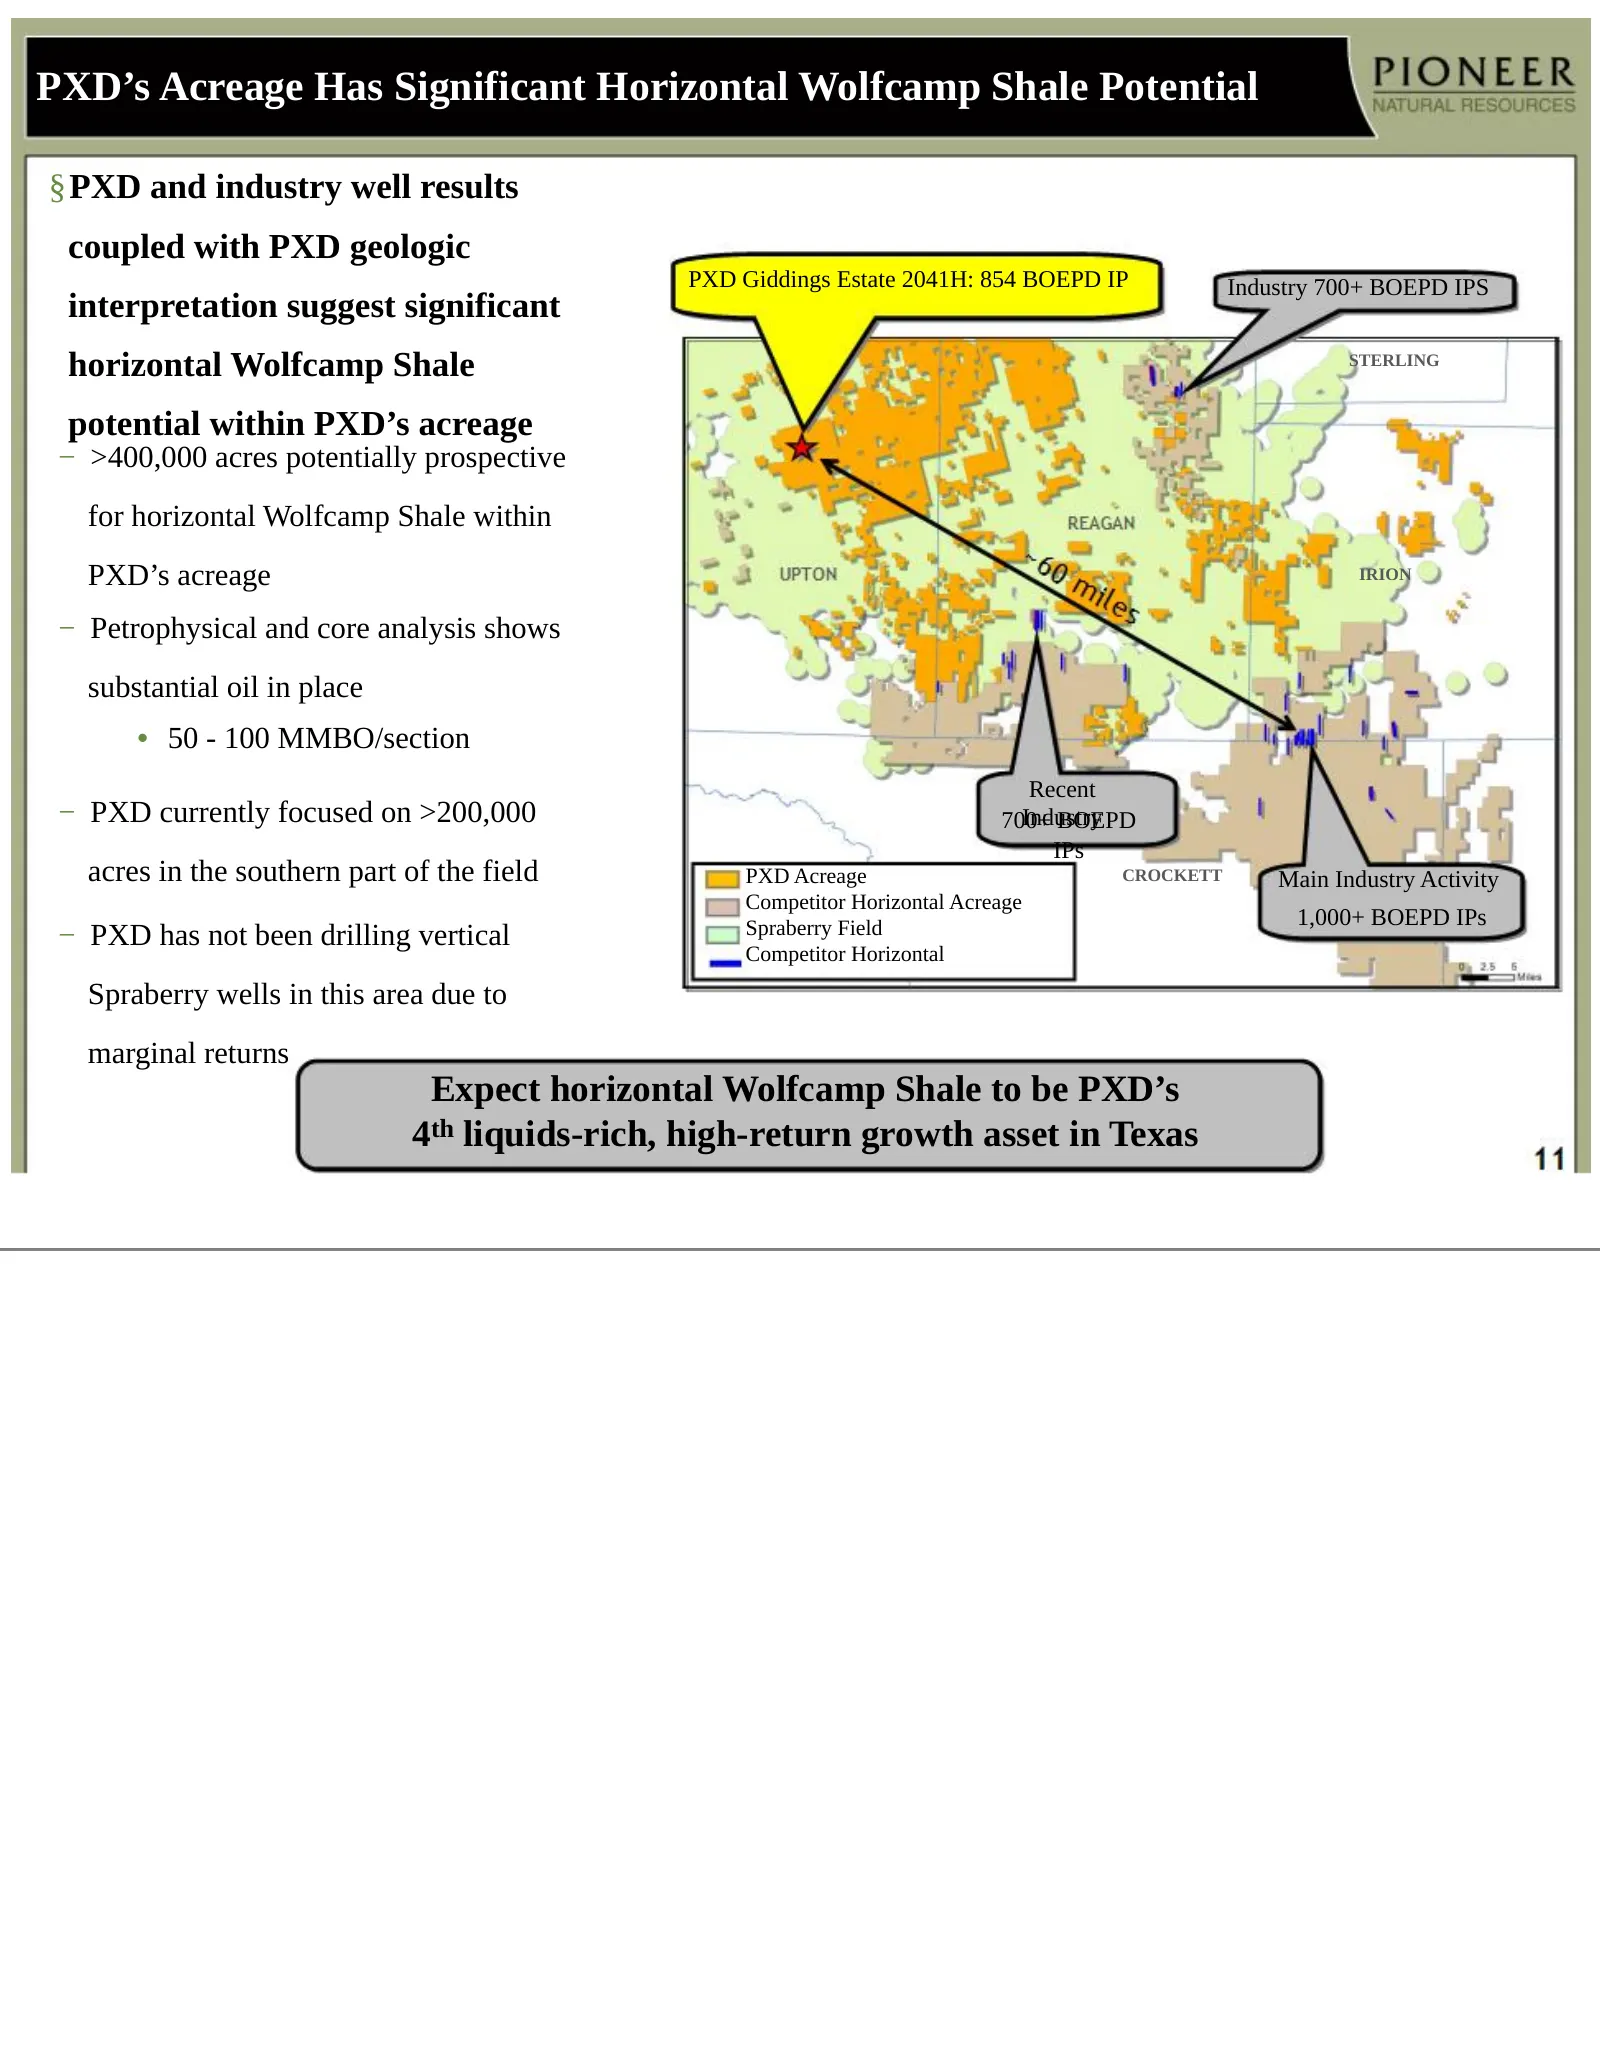
PXD’s Acreage Has Significant Horizontal Wolfcamp Shale Potential §PXD and industry well results coupled with PXD geologic PXD Giddings Estate 2041H: 854 BOEPD IP Industry 700+ BOEPD IPS interpretation suggest significant horizontal Wolfcamp Shale STERLING potential within PXD’s acreage − >400,000 a
Slide 12: PXD's Horizontal Wolfcamp Shale Drilling Metrics & Plan
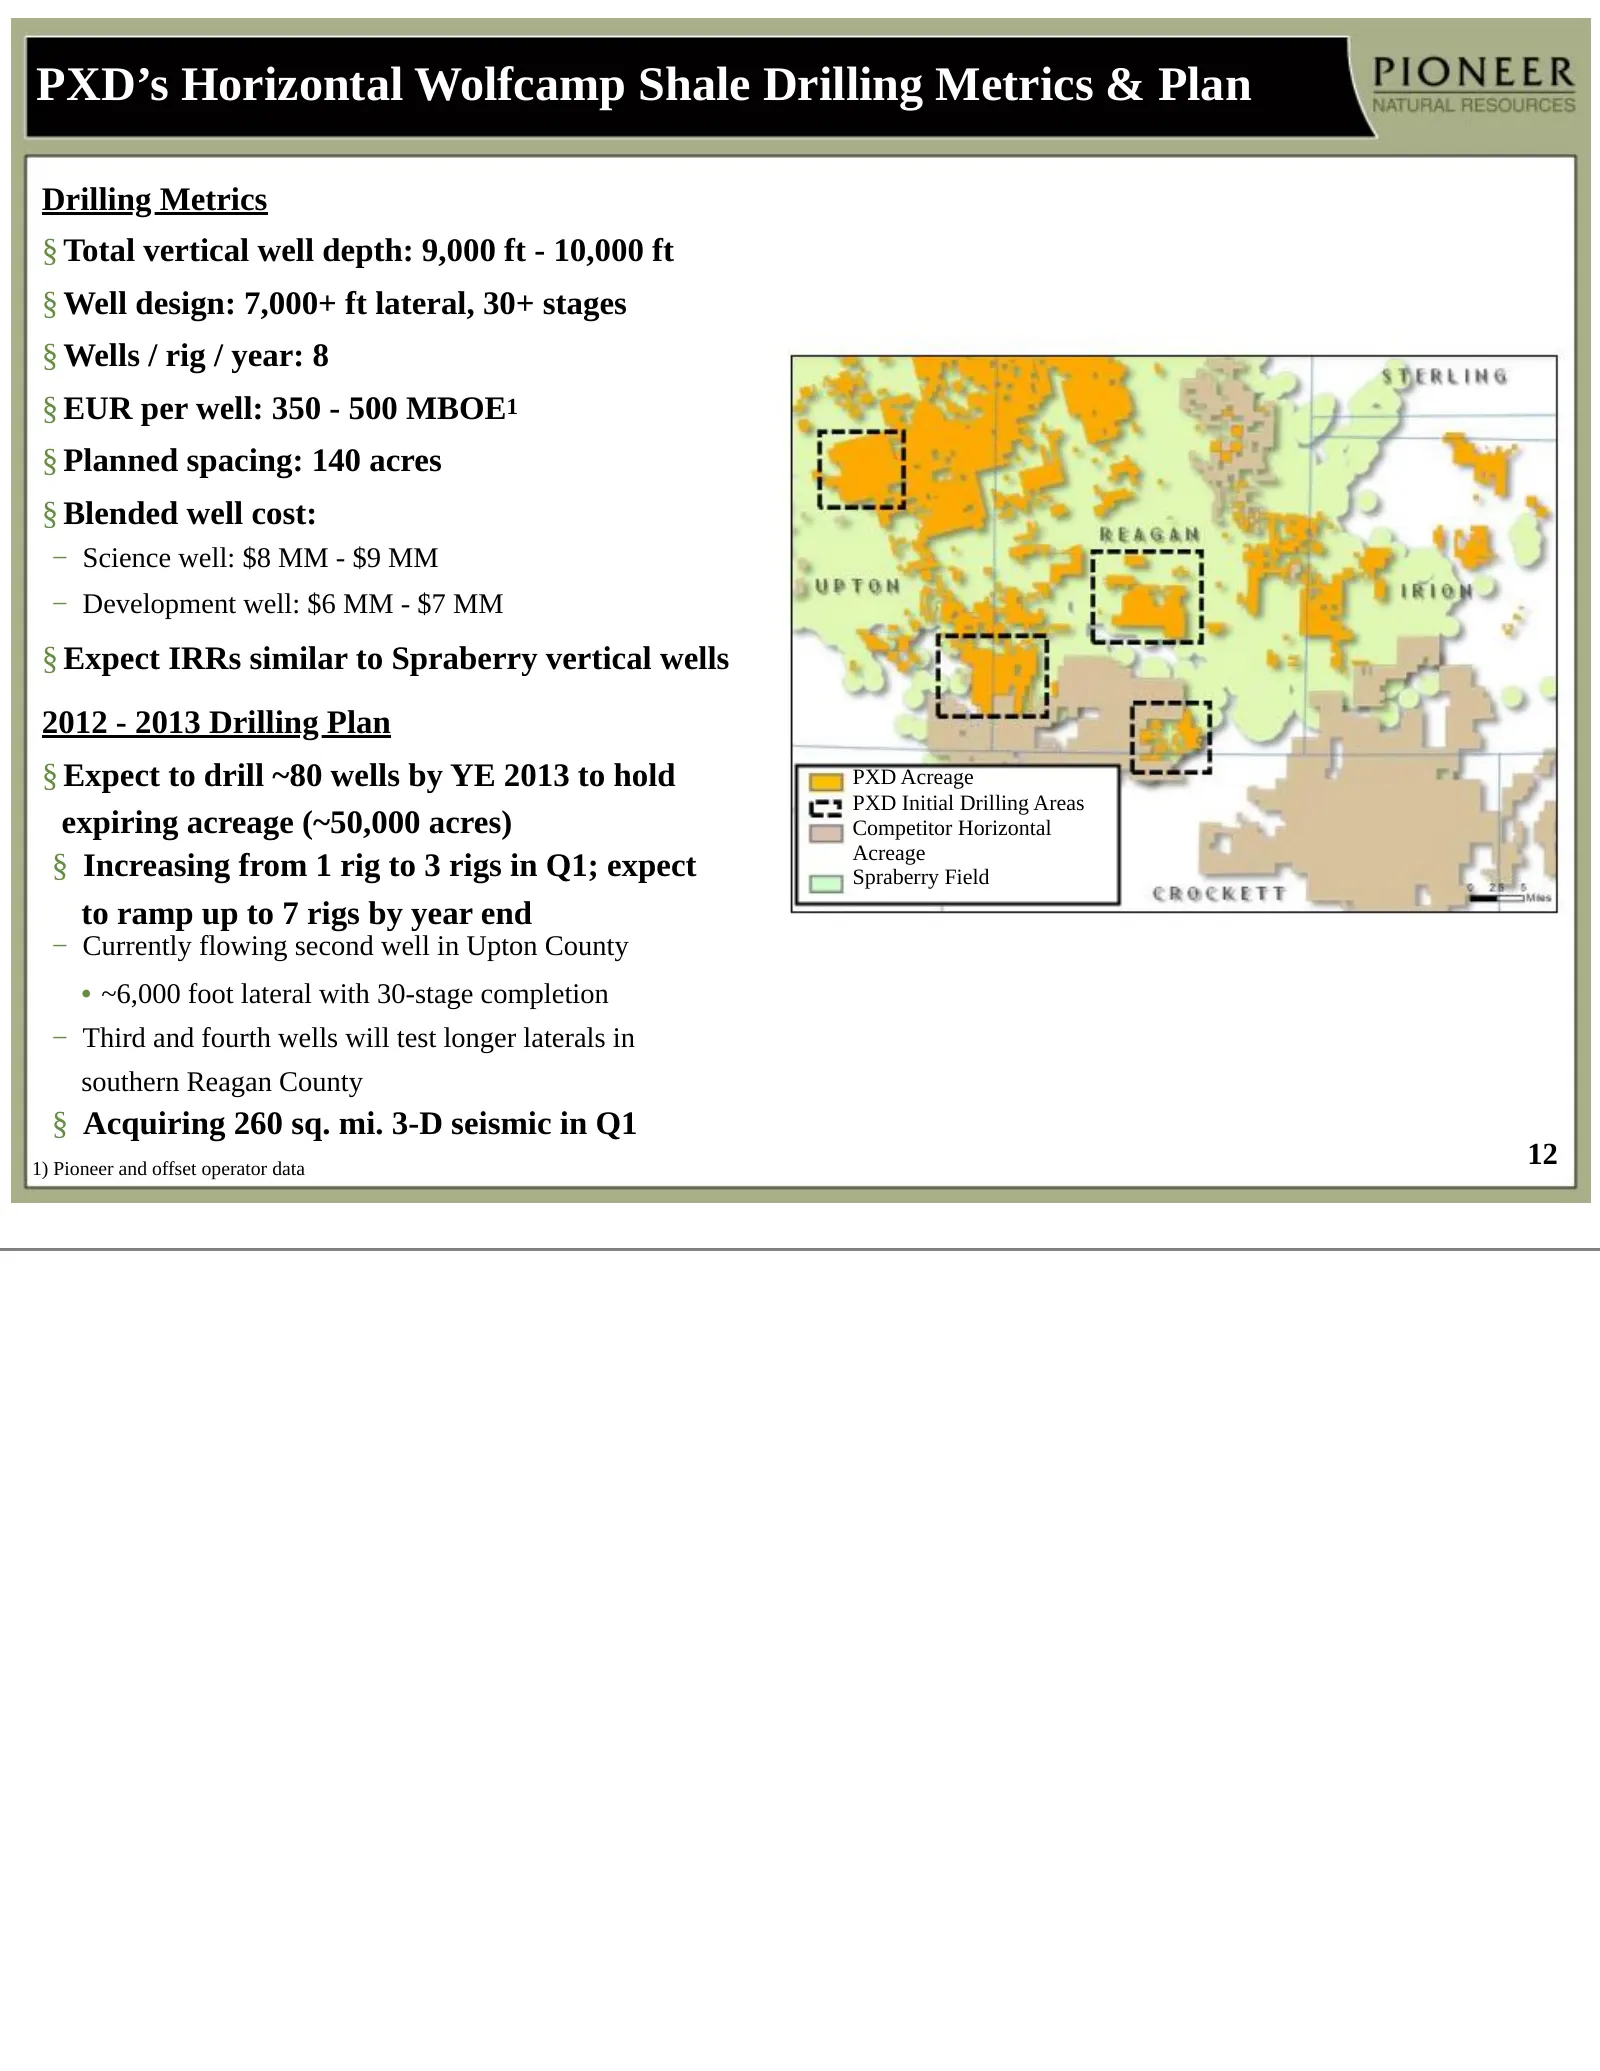
PXD’s Horizontal Wolfcamp Shale Drilling Metrics & Plan Drilling Metrics § Total vertical well depth: 9,000 ft - 10,000 ft § Well design: 7,000+ ft lateral, 30+ stages § Wells / rig / year: 8 § EUR per well: 350 - 500 MBOE1 § Planned spacing: 140 acres § Blended well cost: − Science well: $8 MM - $9
Slide 13: PXD - Largest Spraberry Acreage Holder, Driller and Producer
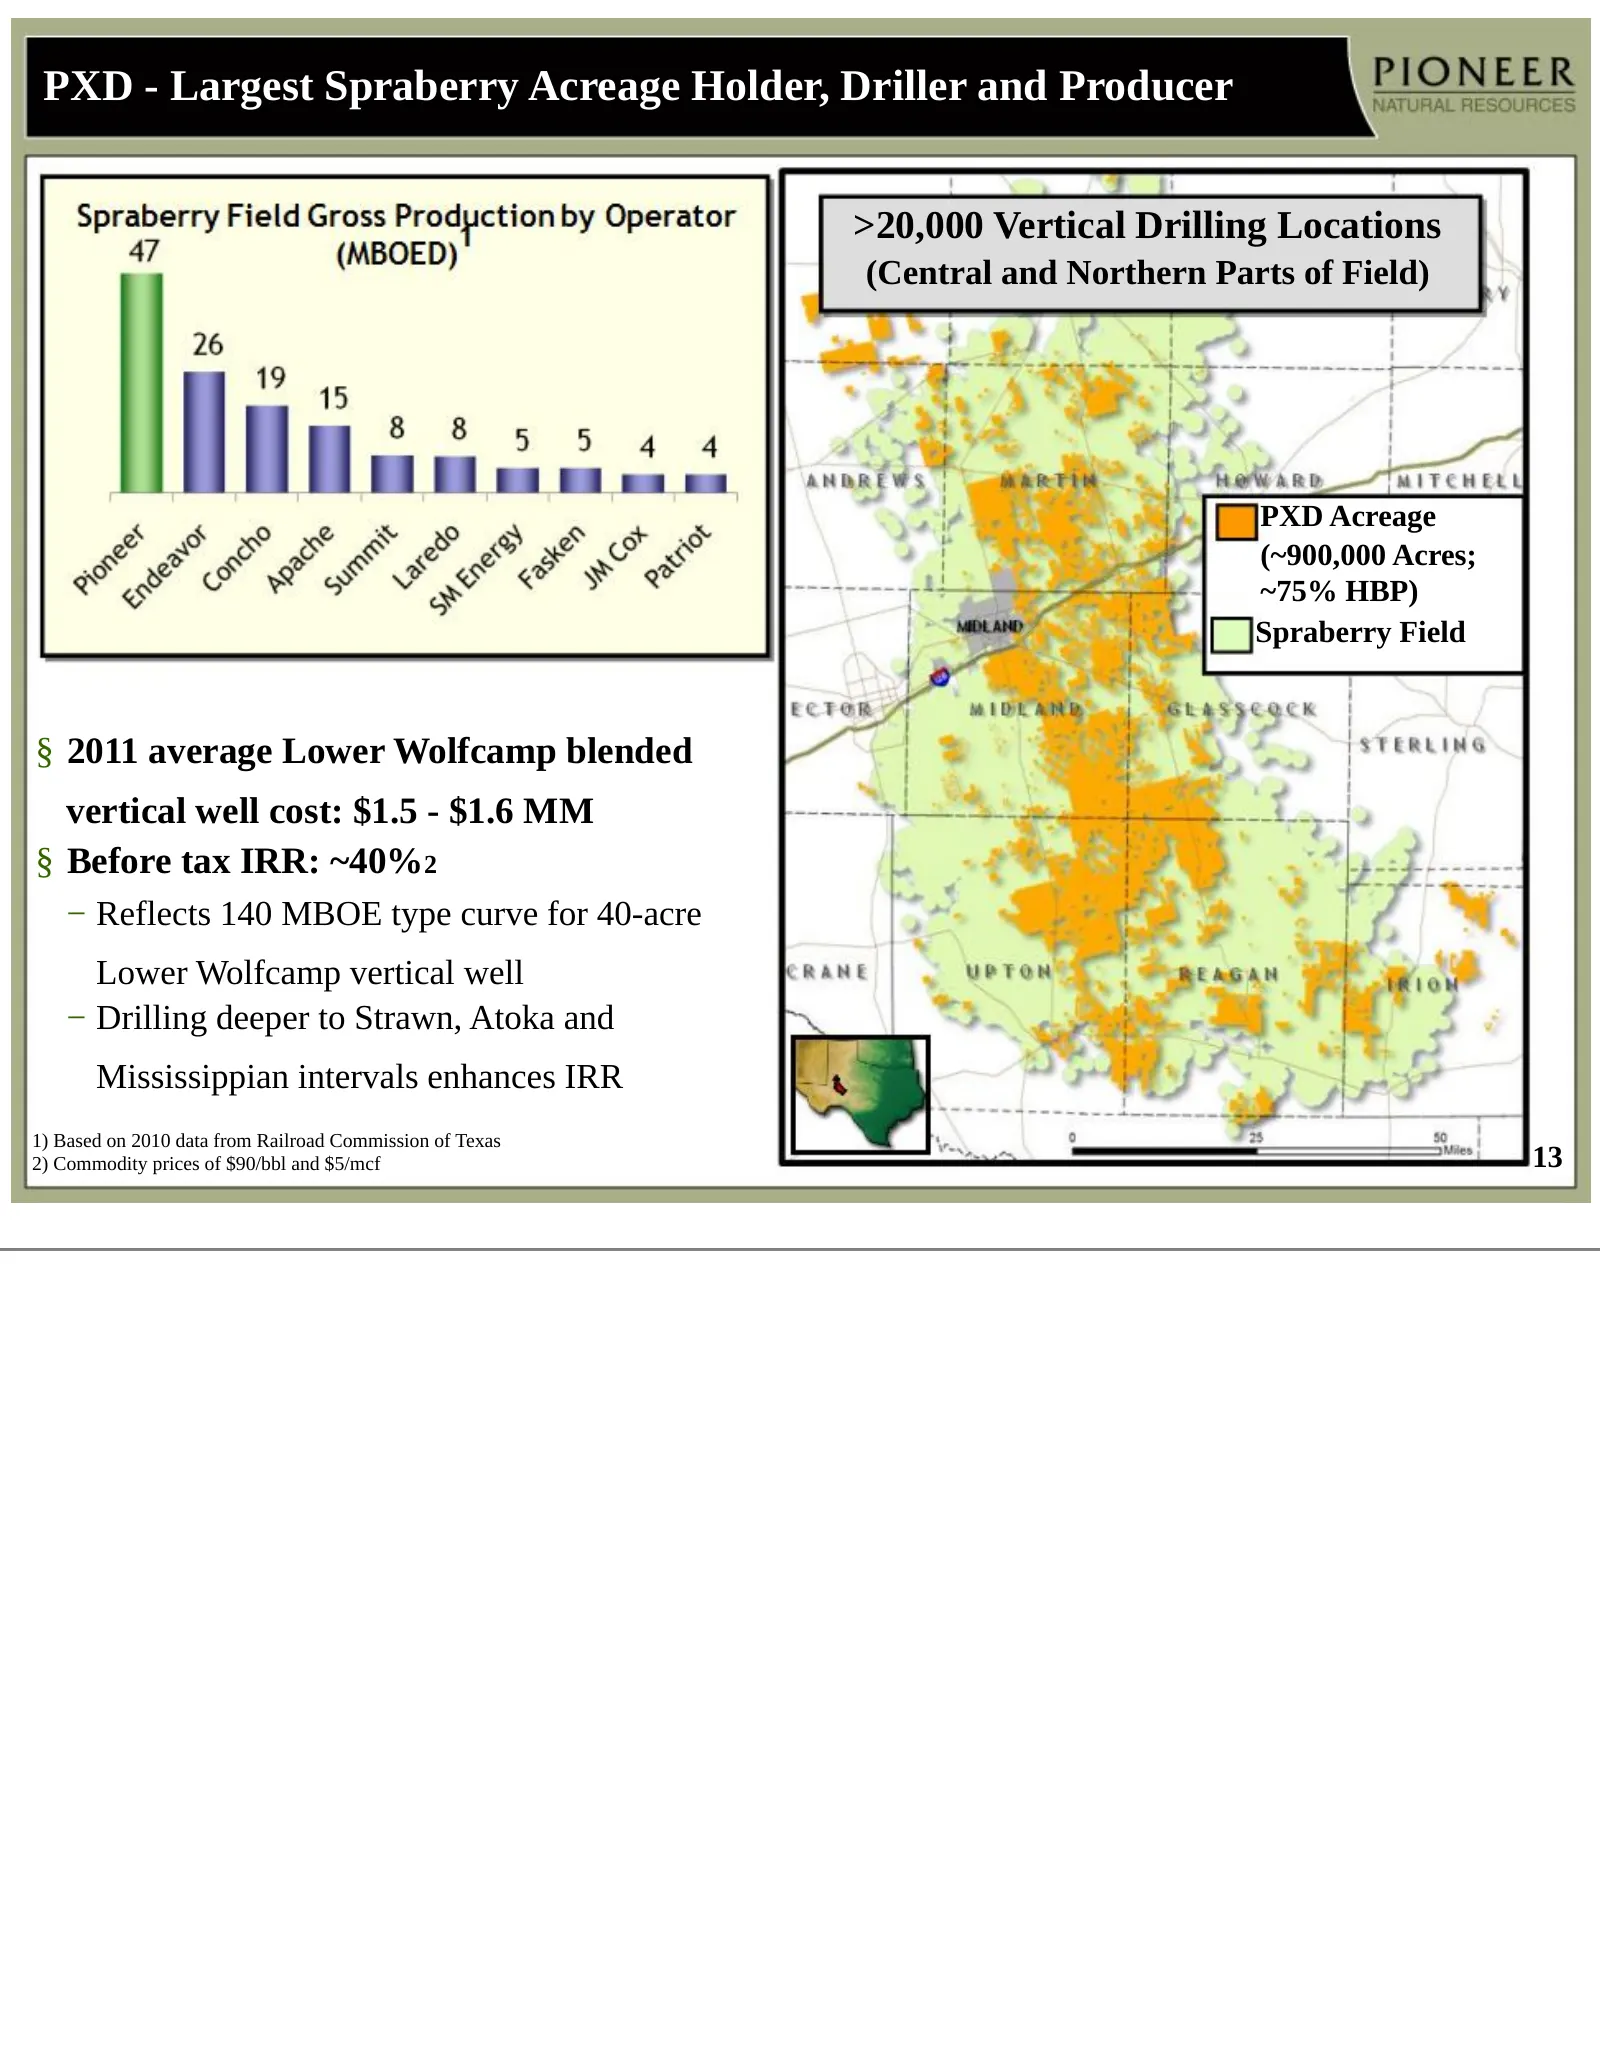
PXD - Largest Spraberry Acreage Holder, Driller and Producer >20,000 Vertical Drilling Locations (Central and Northern Parts of Field) PXD Acreage (~900,000 Acres; ~75% HBP) Spraberry Field § 2011 average Lower Wolfcamp blended vertical well cost: $1.5 - $1.6 MM § Before tax IRR: ~40%2 − Reflects 14
Slide 14: 140 MBOE Spraberry 40-Acre Vertical Well Type Curve
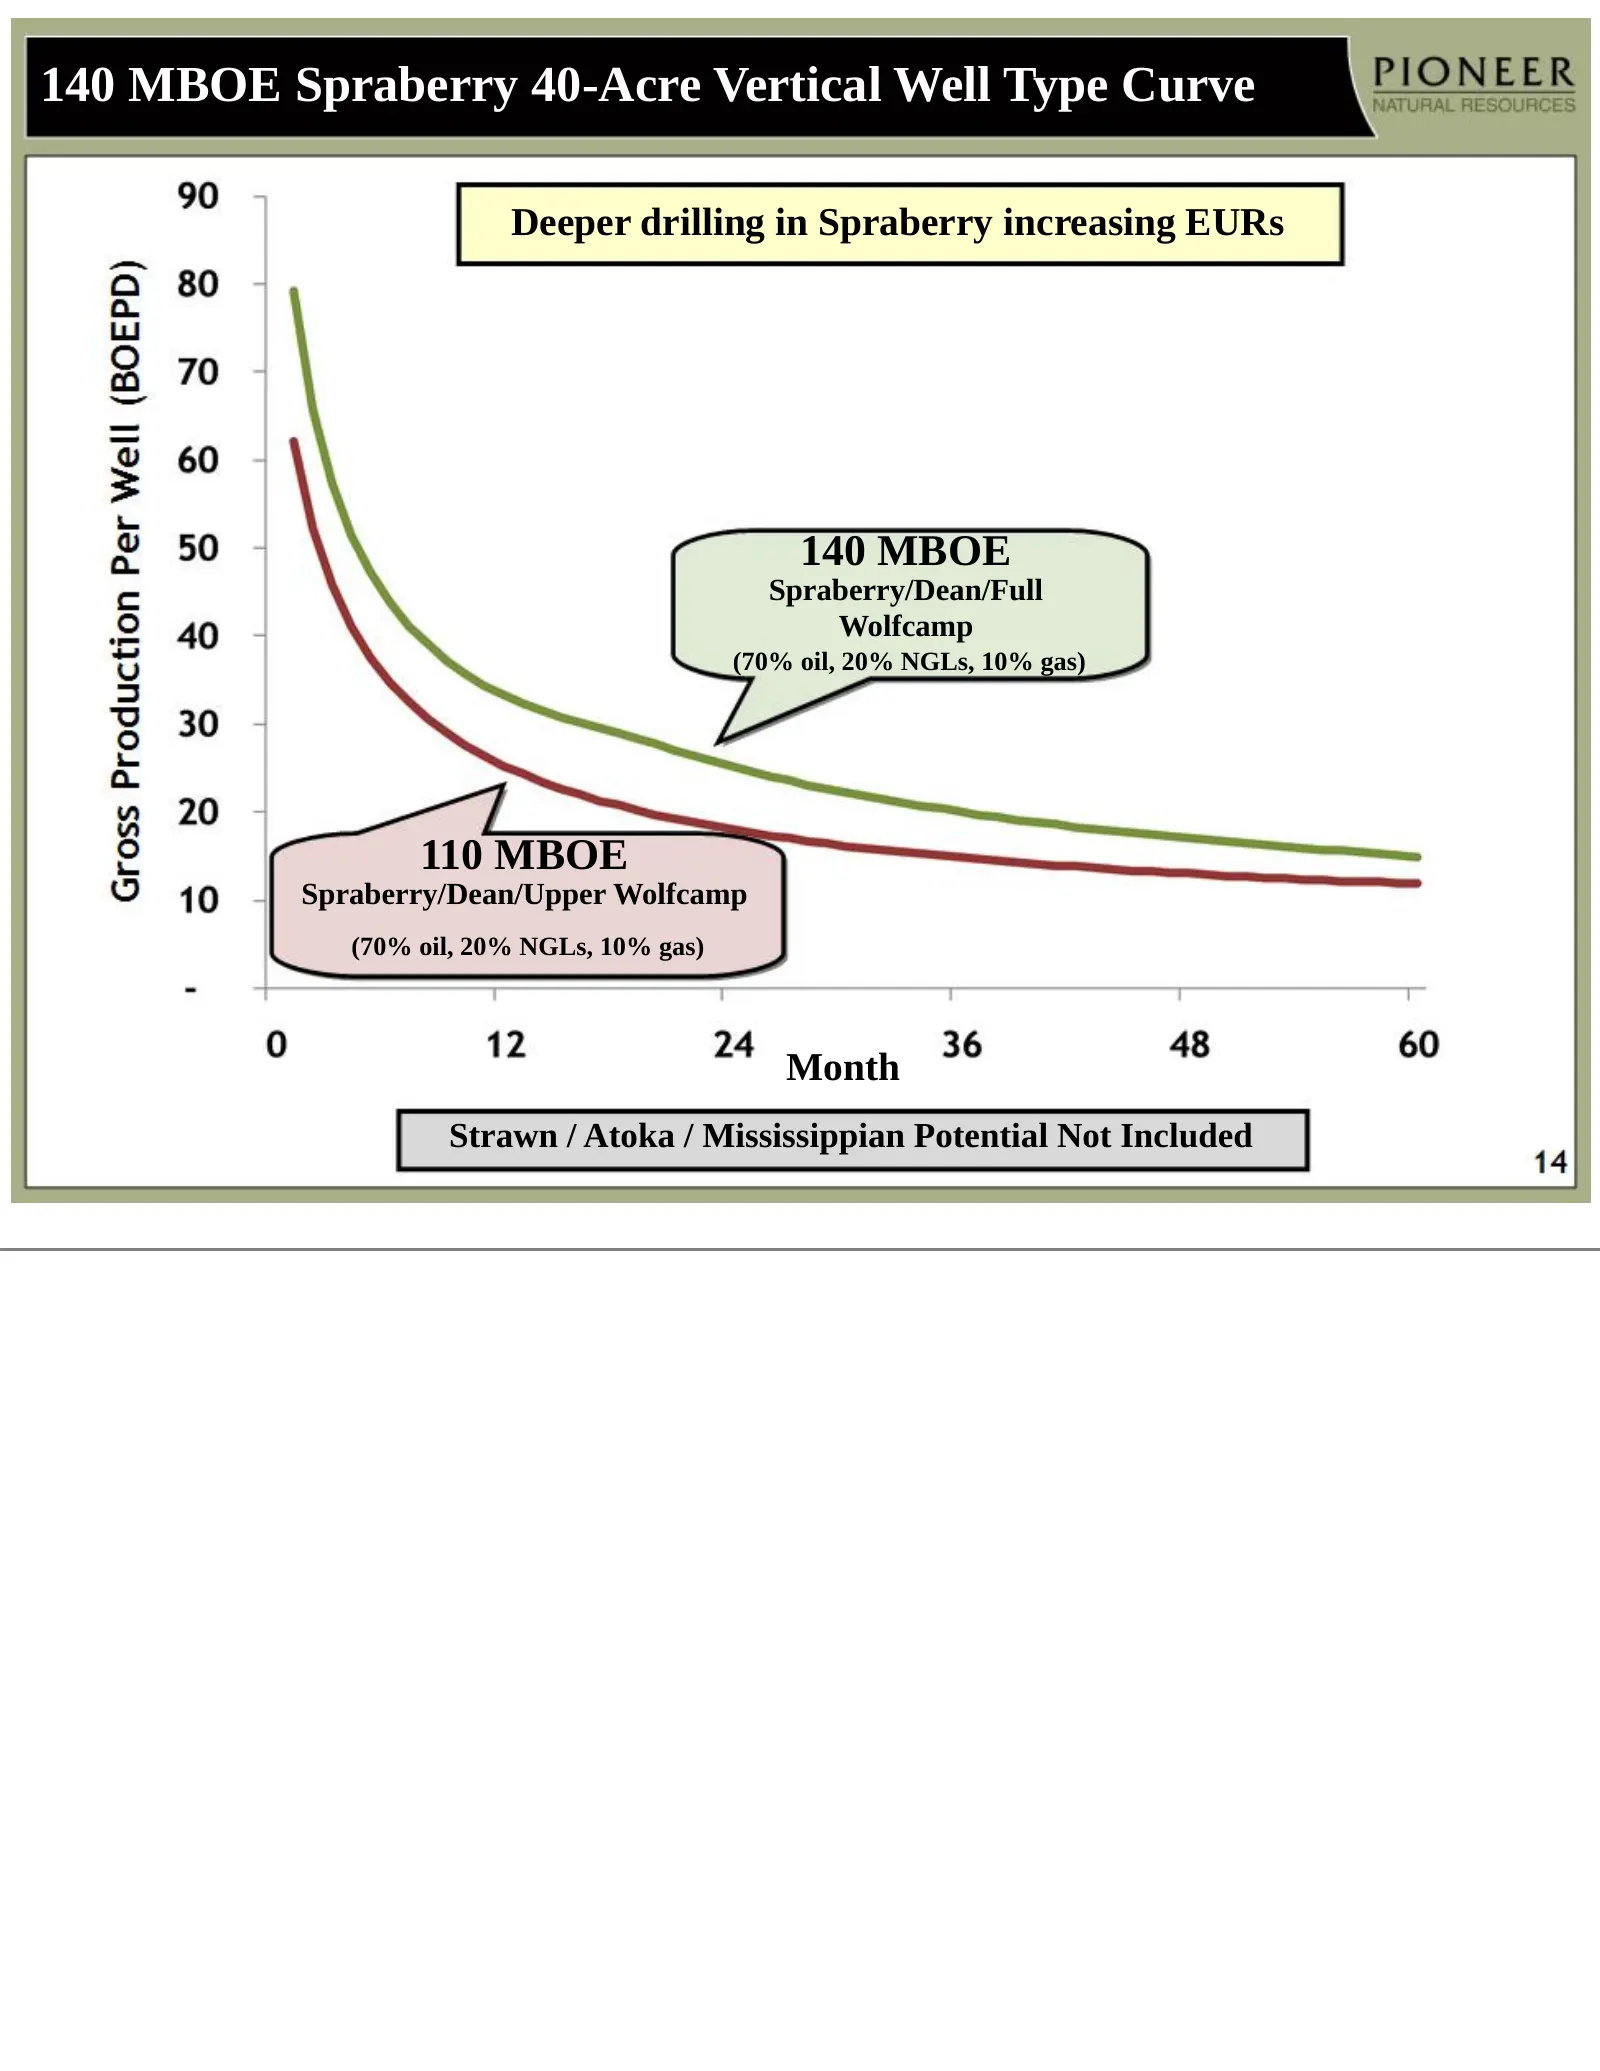
140 MBOE Spraberry 40-Acre Vertical Well Type Curve Deeper drilling in Spraberry increasing EURs 140 MBOE Spraberry/Dean/Full Wolfcamp (70% oil, 20% NGLs, 10% gas) 110 MBOE Spraberry/Dean/Upper Wolfcamp (70% oil, 20% NGLs, 10% gas) Month Strawn / Atoka / Mississippian Potential Not Included
Slide 15: Deeper Vertical Drilling in Spraberry Increasing EURs
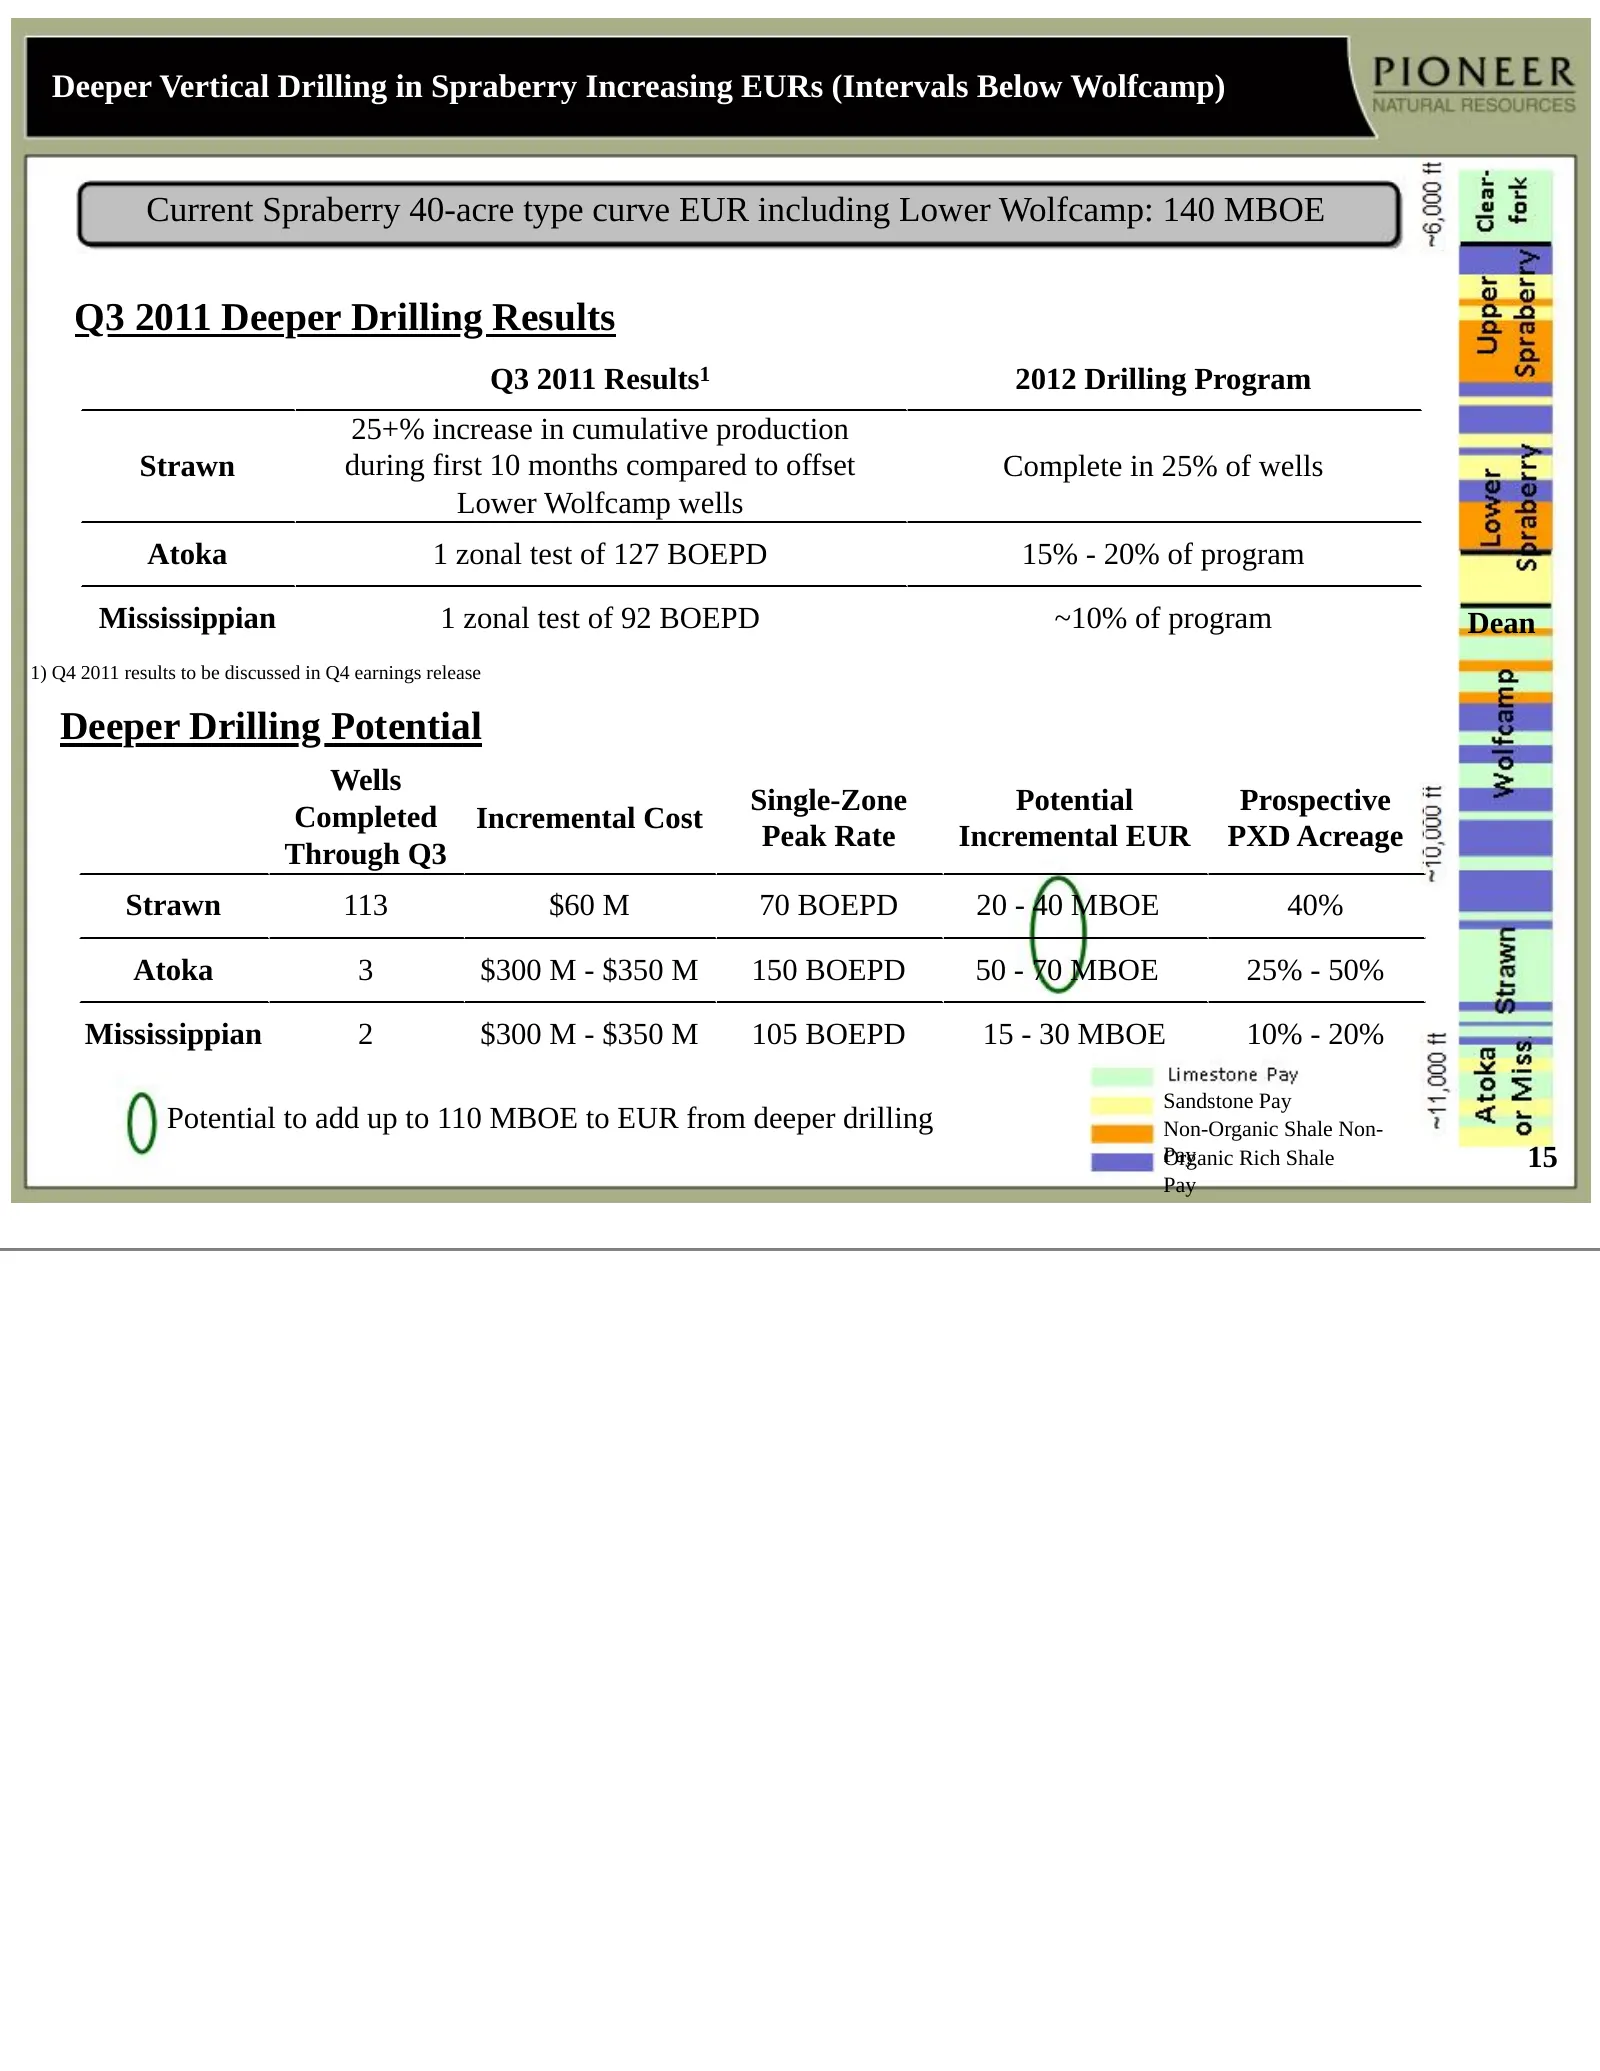
Deeper Vertical Drilling in Spraberry Increasing EURs (Intervals Below Wolfcamp) Current Spraberry 40-acre type curve EUR including Lower Wolfcamp: 140 MBOE Q3 2011 Deeper Drilling Results Q3 2011 Results1 2012 Drilling Program 25+% increase in cumulative production Strawn during first 10 months com
Slide 16: Early Results of Spraberry Waterflood Encouraging
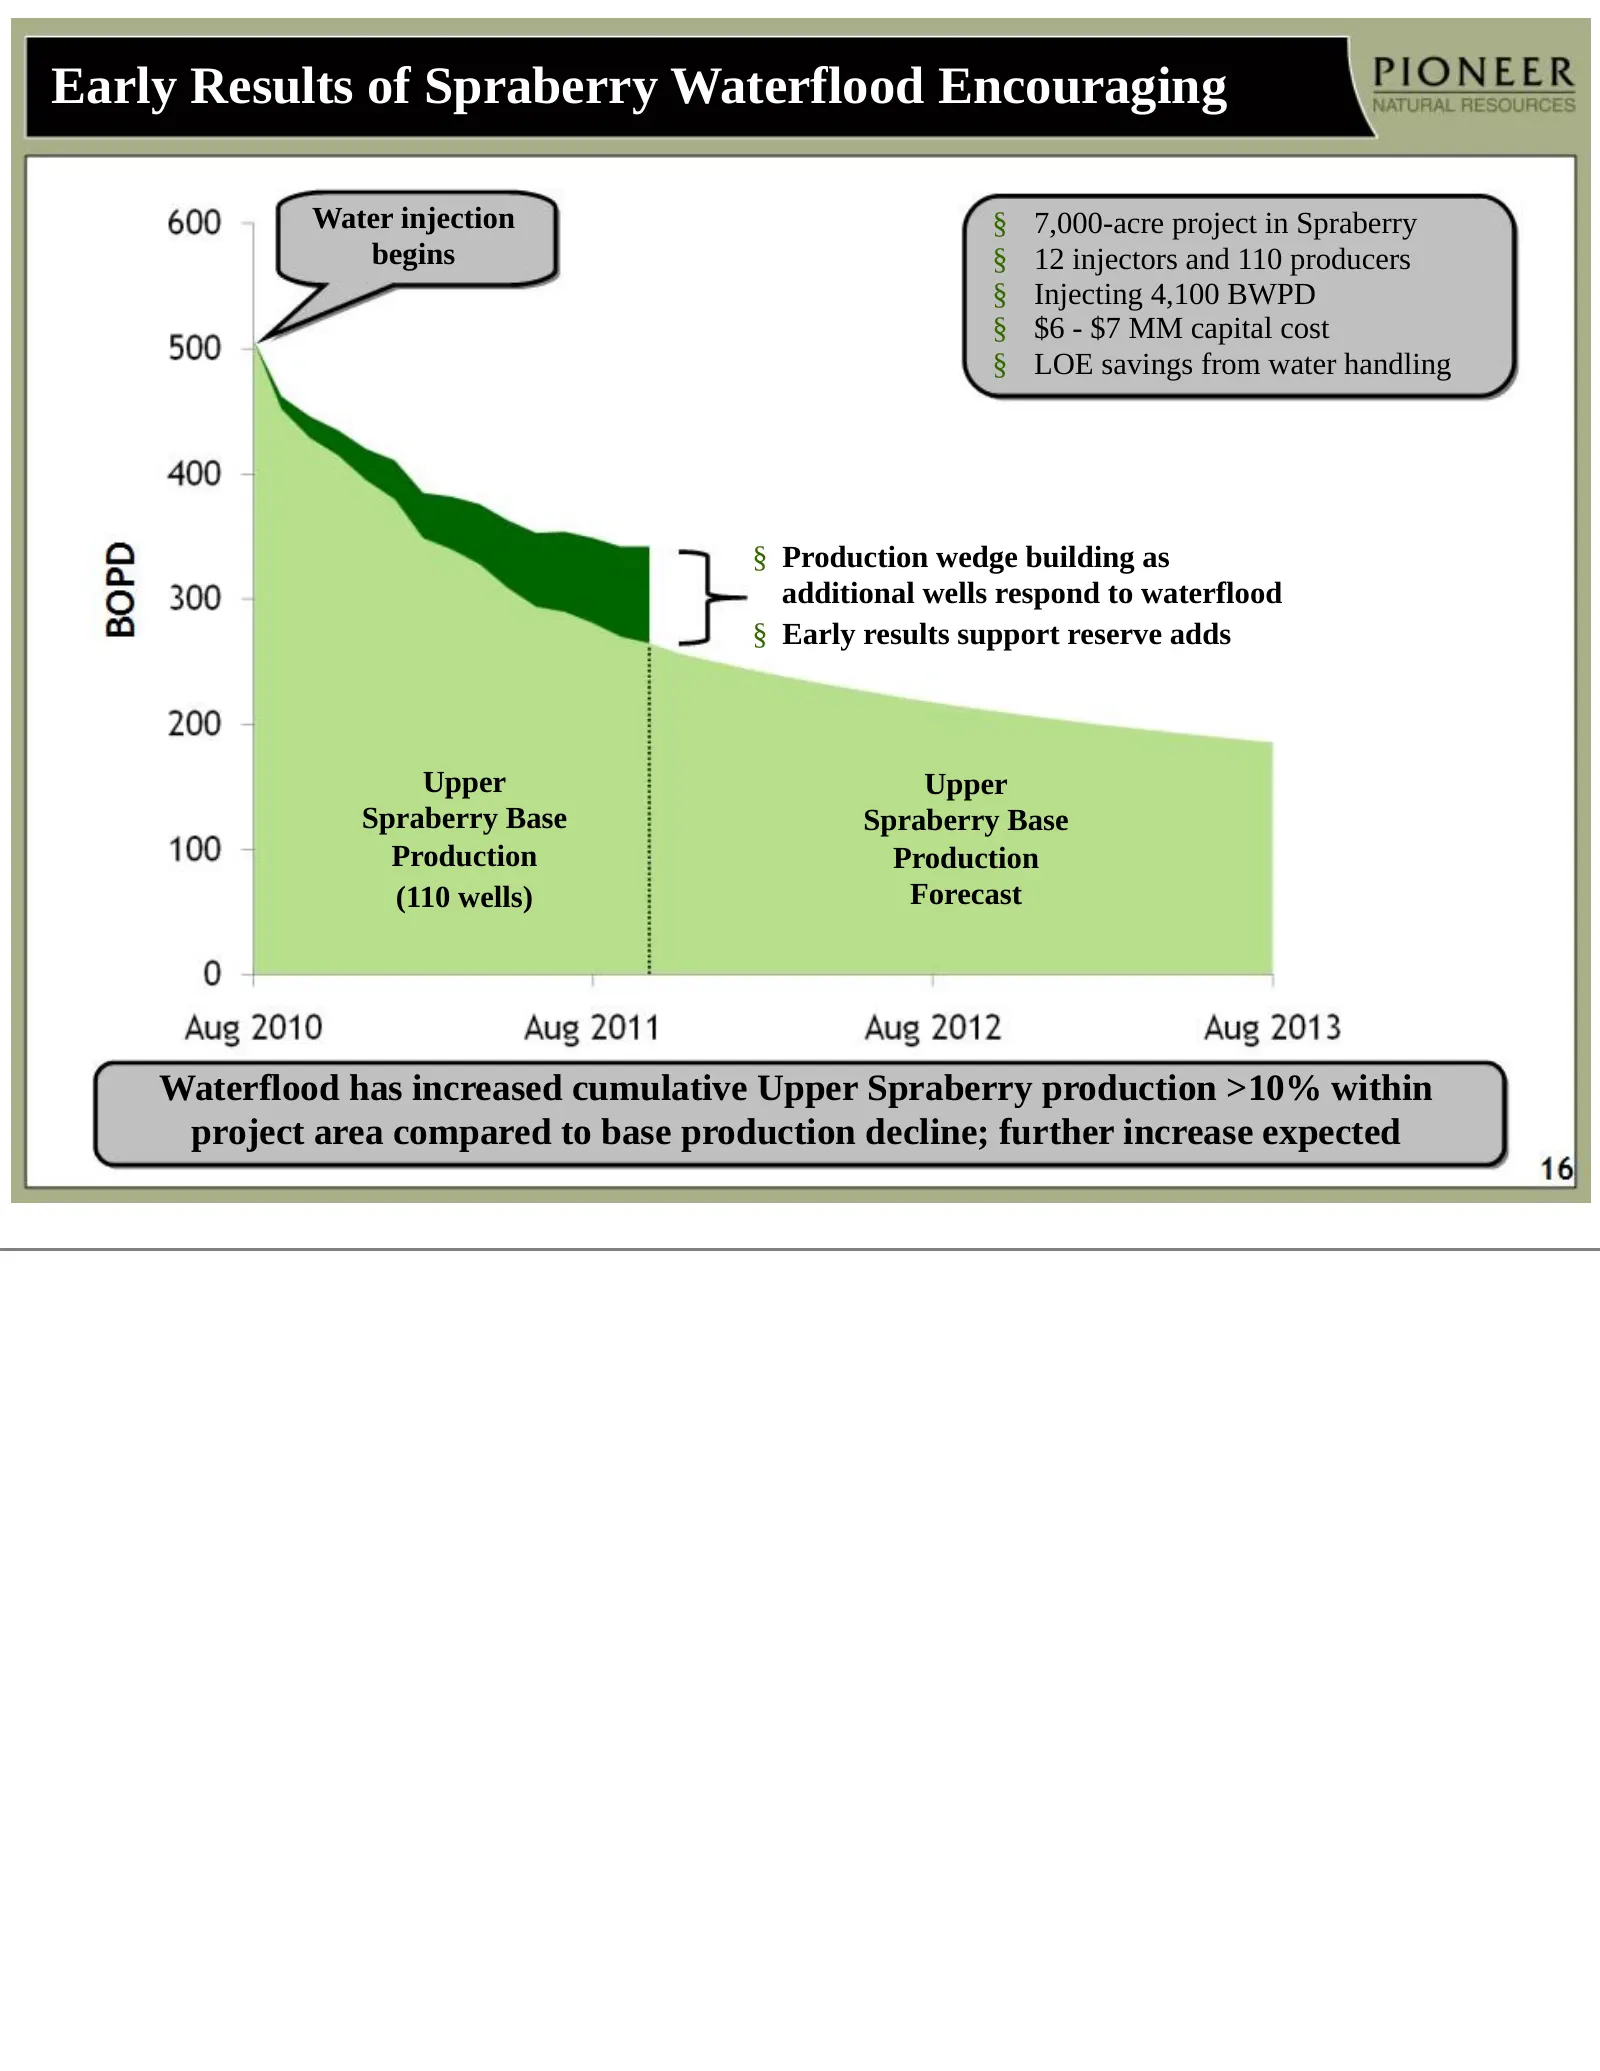
Early Results of Spraberry Waterflood Encouraging Water injection § 7,000-acre project in Spraberry begins § 12 injectors and 110 producers § Injecting 4,100 BWPD § $6 - $7 MM capital cost § LOE savings from water handling § Production wedge building as additional wells respond to waterflood § Early
Slide 17: Spraberry 20-Acre Vertical Well Update
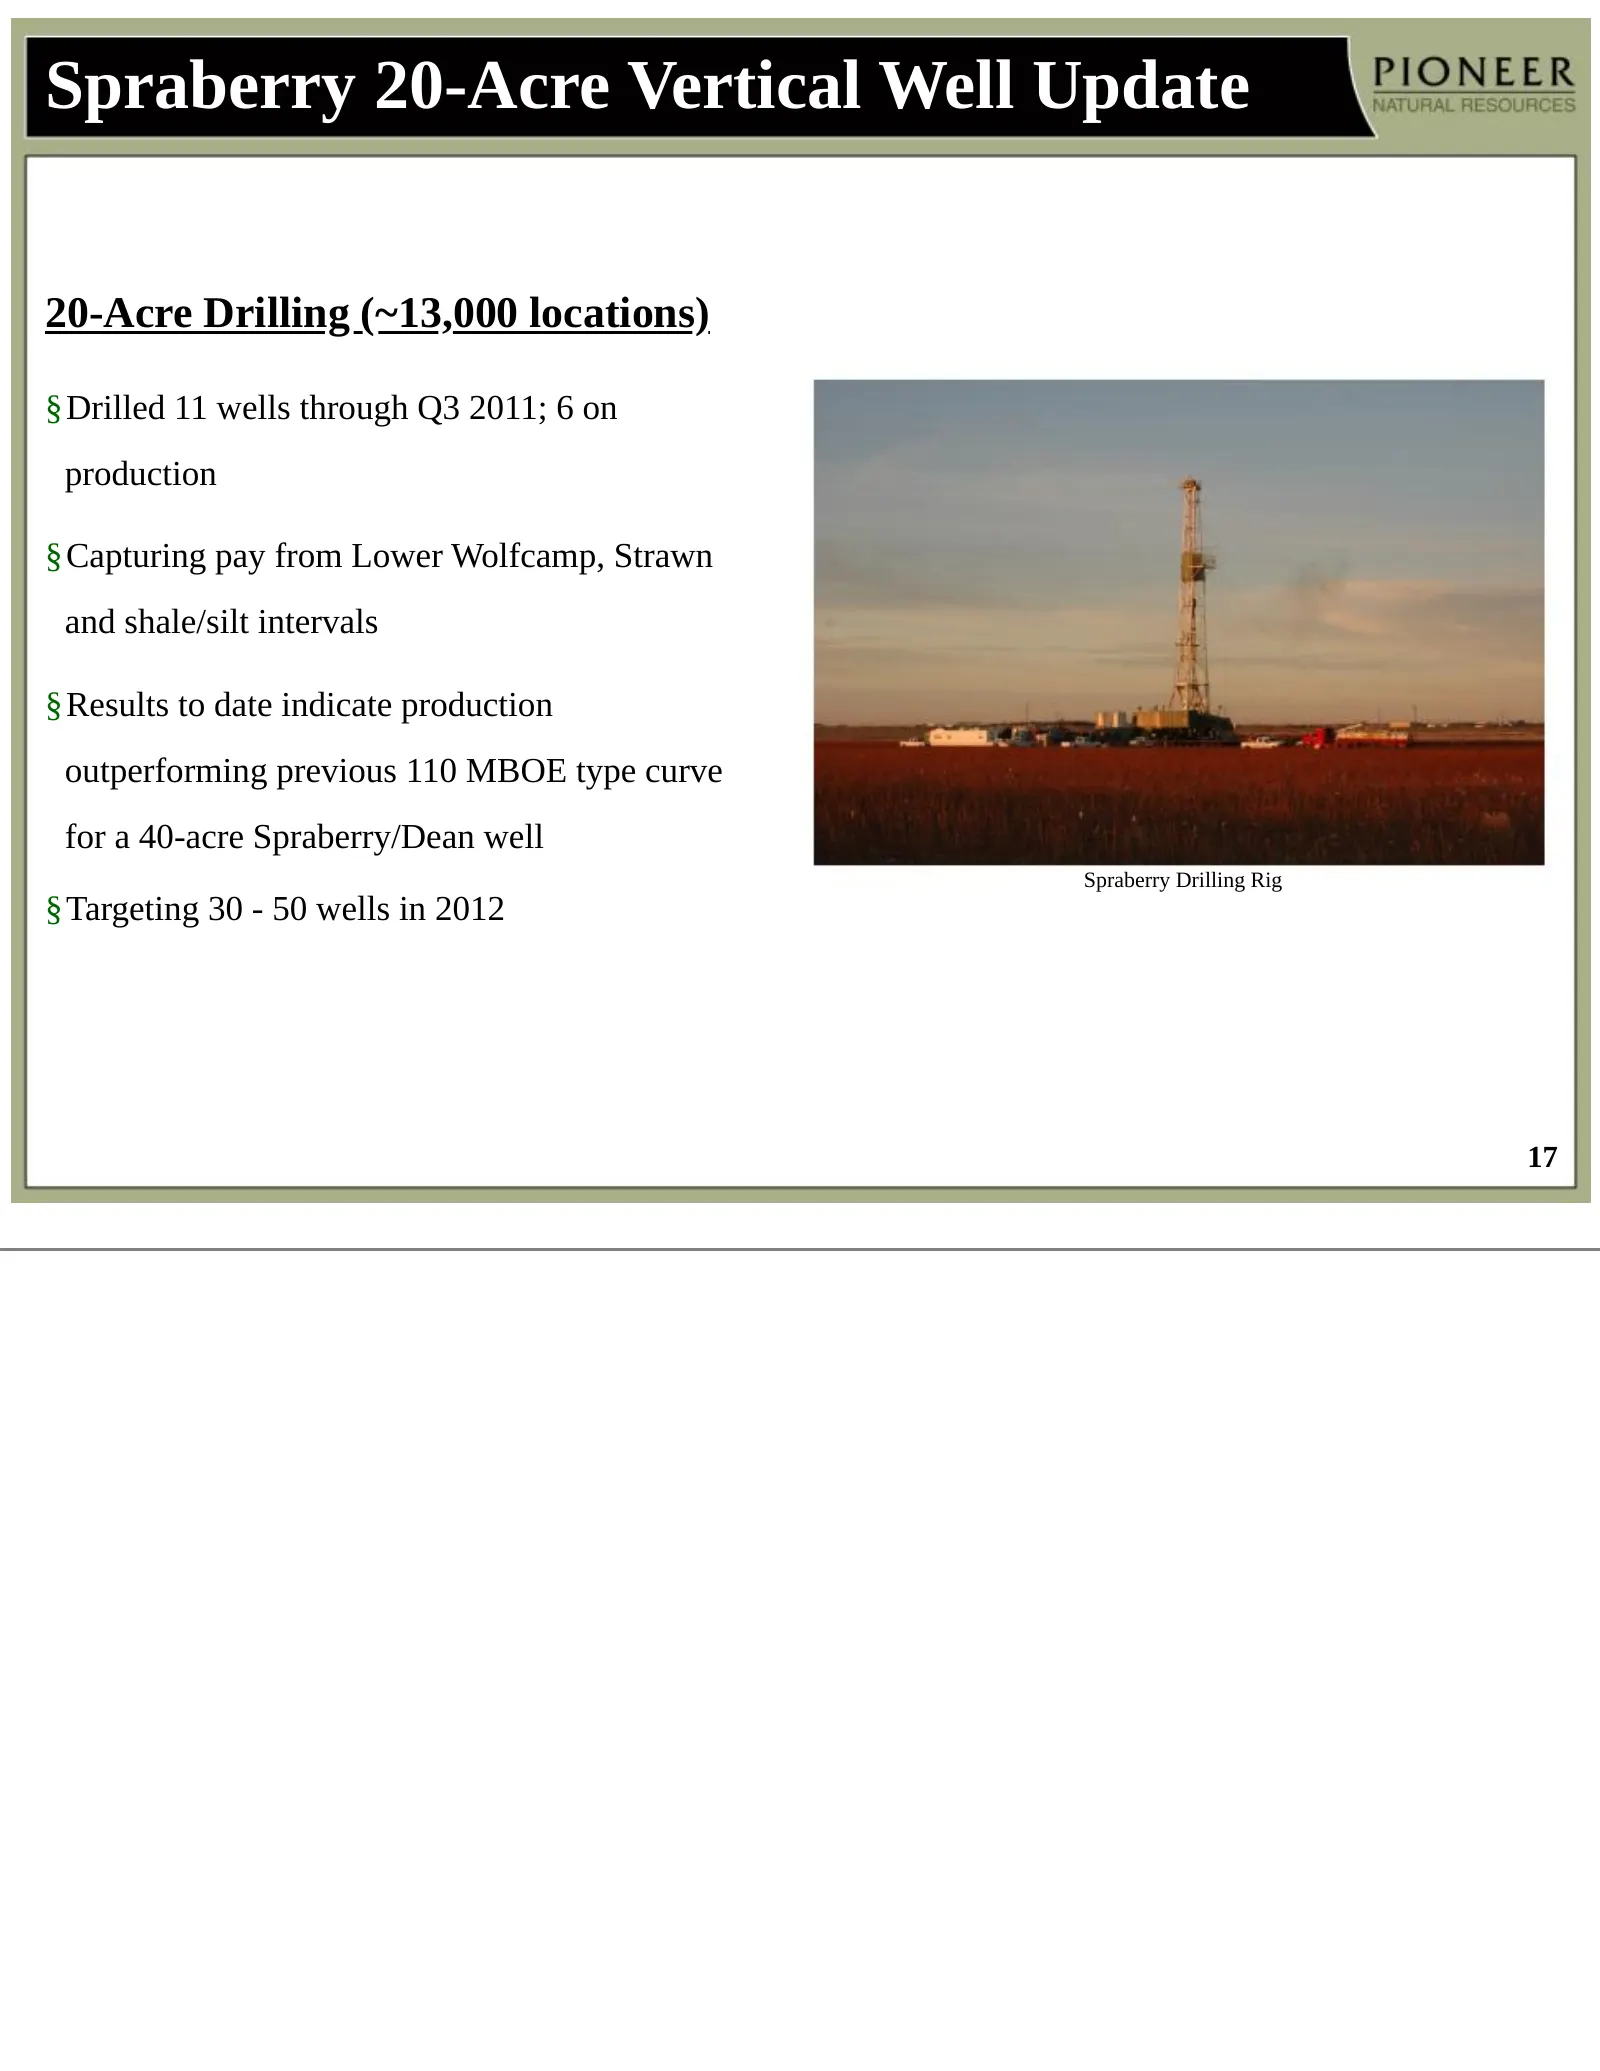
Spraberry 20-Acre Vertical Well Update 20-Acre Drilling (~13,000 locations) §Drilled 11 wells through Q3 2011; 6 on production §Capturing pay from Lower Wolfcamp, Strawn and shale/silt intervals §Results to date indicate production outperforming previous 110 MBOE type curve for a 40-acre Spraberry/D
Slide 18: Continuing to Successfully Grow Spraberry Production
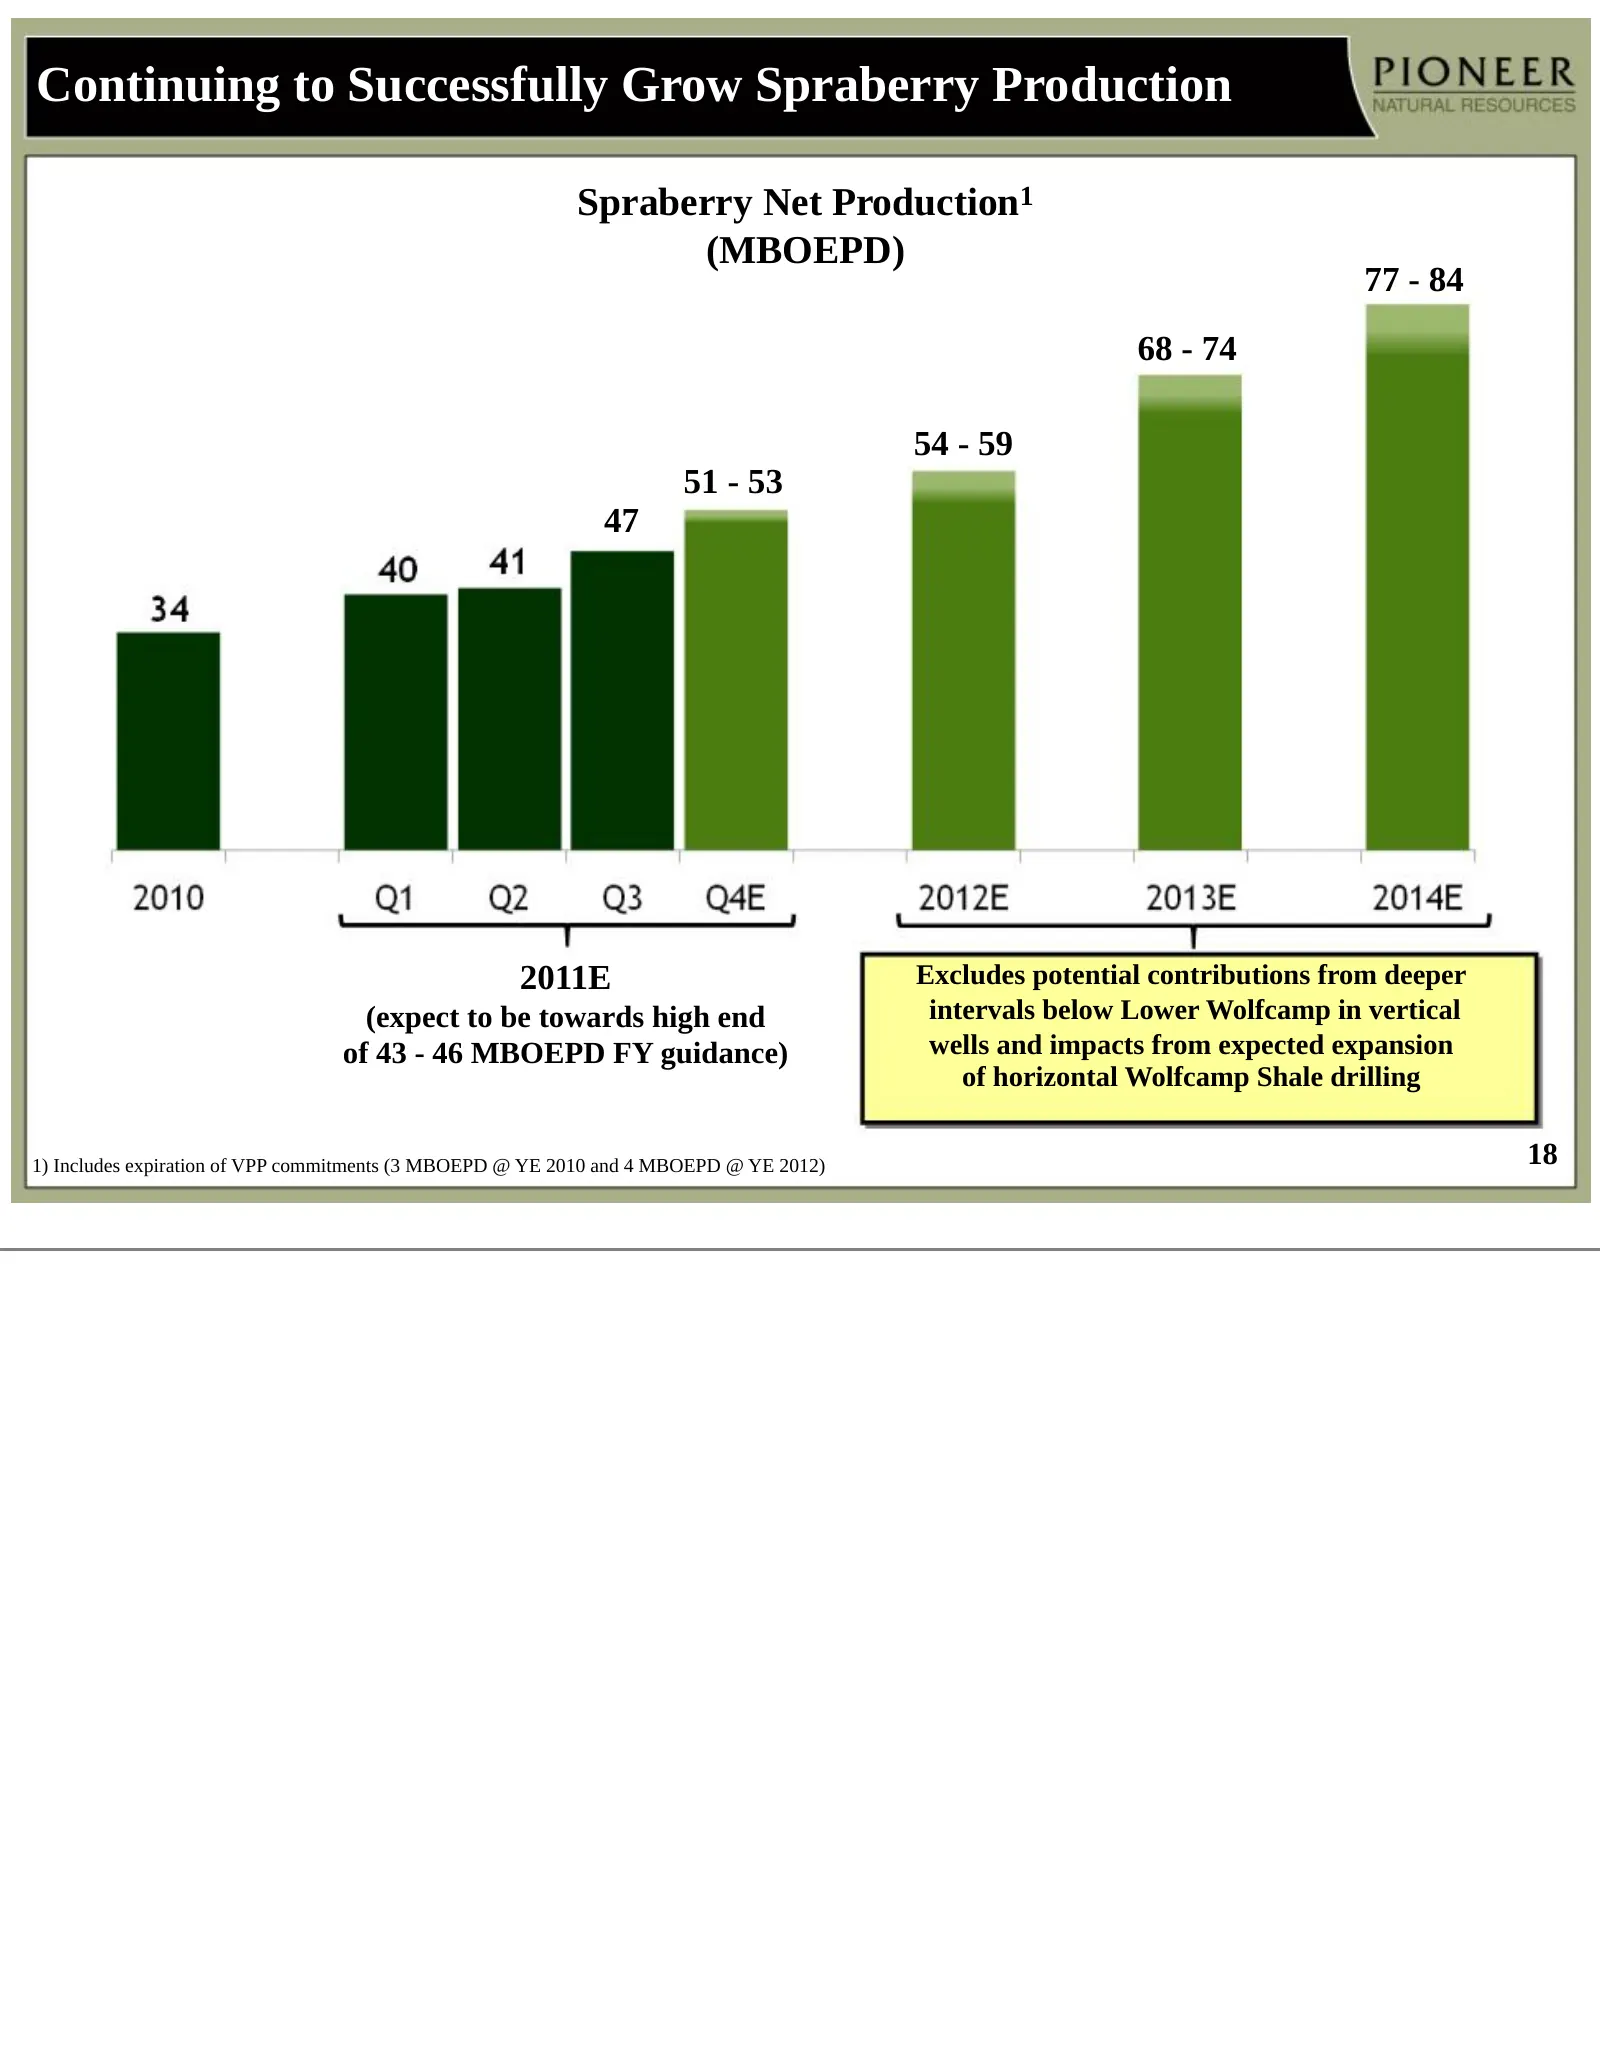
Continuing to Successfully Grow Spraberry Production Spraberry Net Production1 (MBOEPD) 77 - 84 68 - 74 54 - 59 51 - 53 47 2011E Excludes potential contributions from deeper (expect to be towards high end intervals below Lower Wolfcamp in vertical of 43 - 46 MBOEPD FY guidance) wells and impacts fro
Slide 19: Eagle Ford Shale: A Burgeoning Liquids-Rich Shale Play
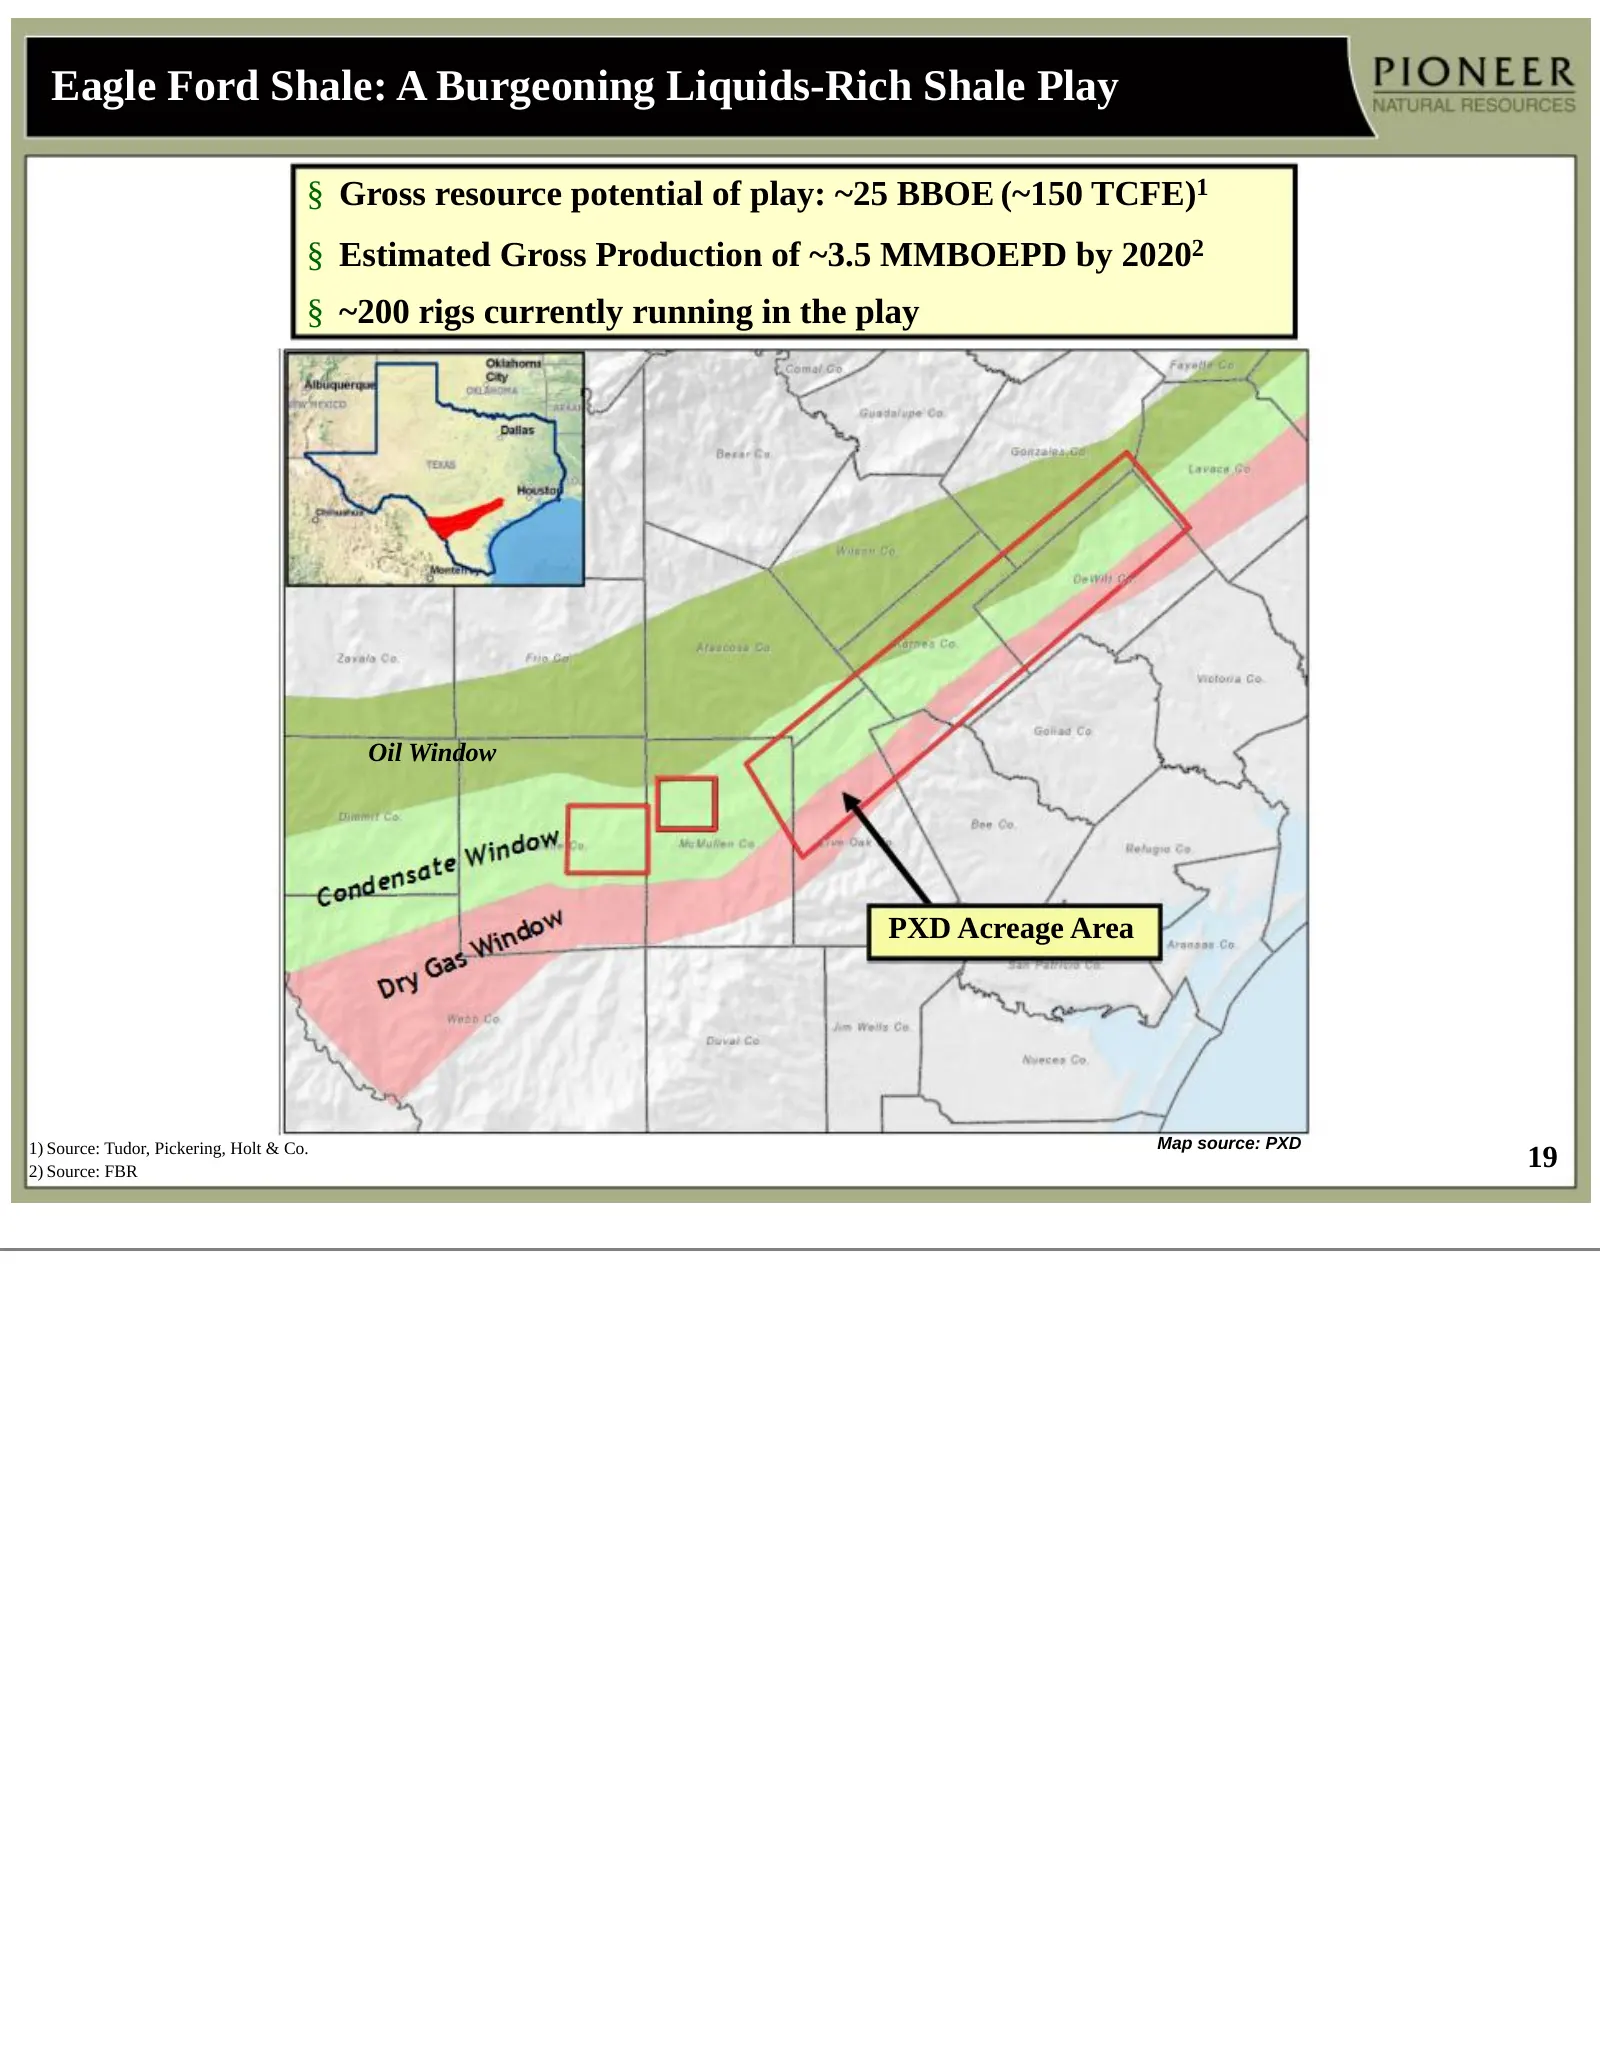
Eagle Ford Shale: A Burgeoning Liquids-Rich Shale Play § Gross resource potential of play: ~25 BBOE (~150 TCFE)1 § Estimated Gross Production of ~3.5 MMBOEPD by 20202 § ~200 rigs currently running in the play Oil Window PXD Acreage Area 1) Source: Tudor, Pickering, Holt & Co. Map source: PXD 2) Sour
Slide 20: Eagle Ford Shale Operational Update
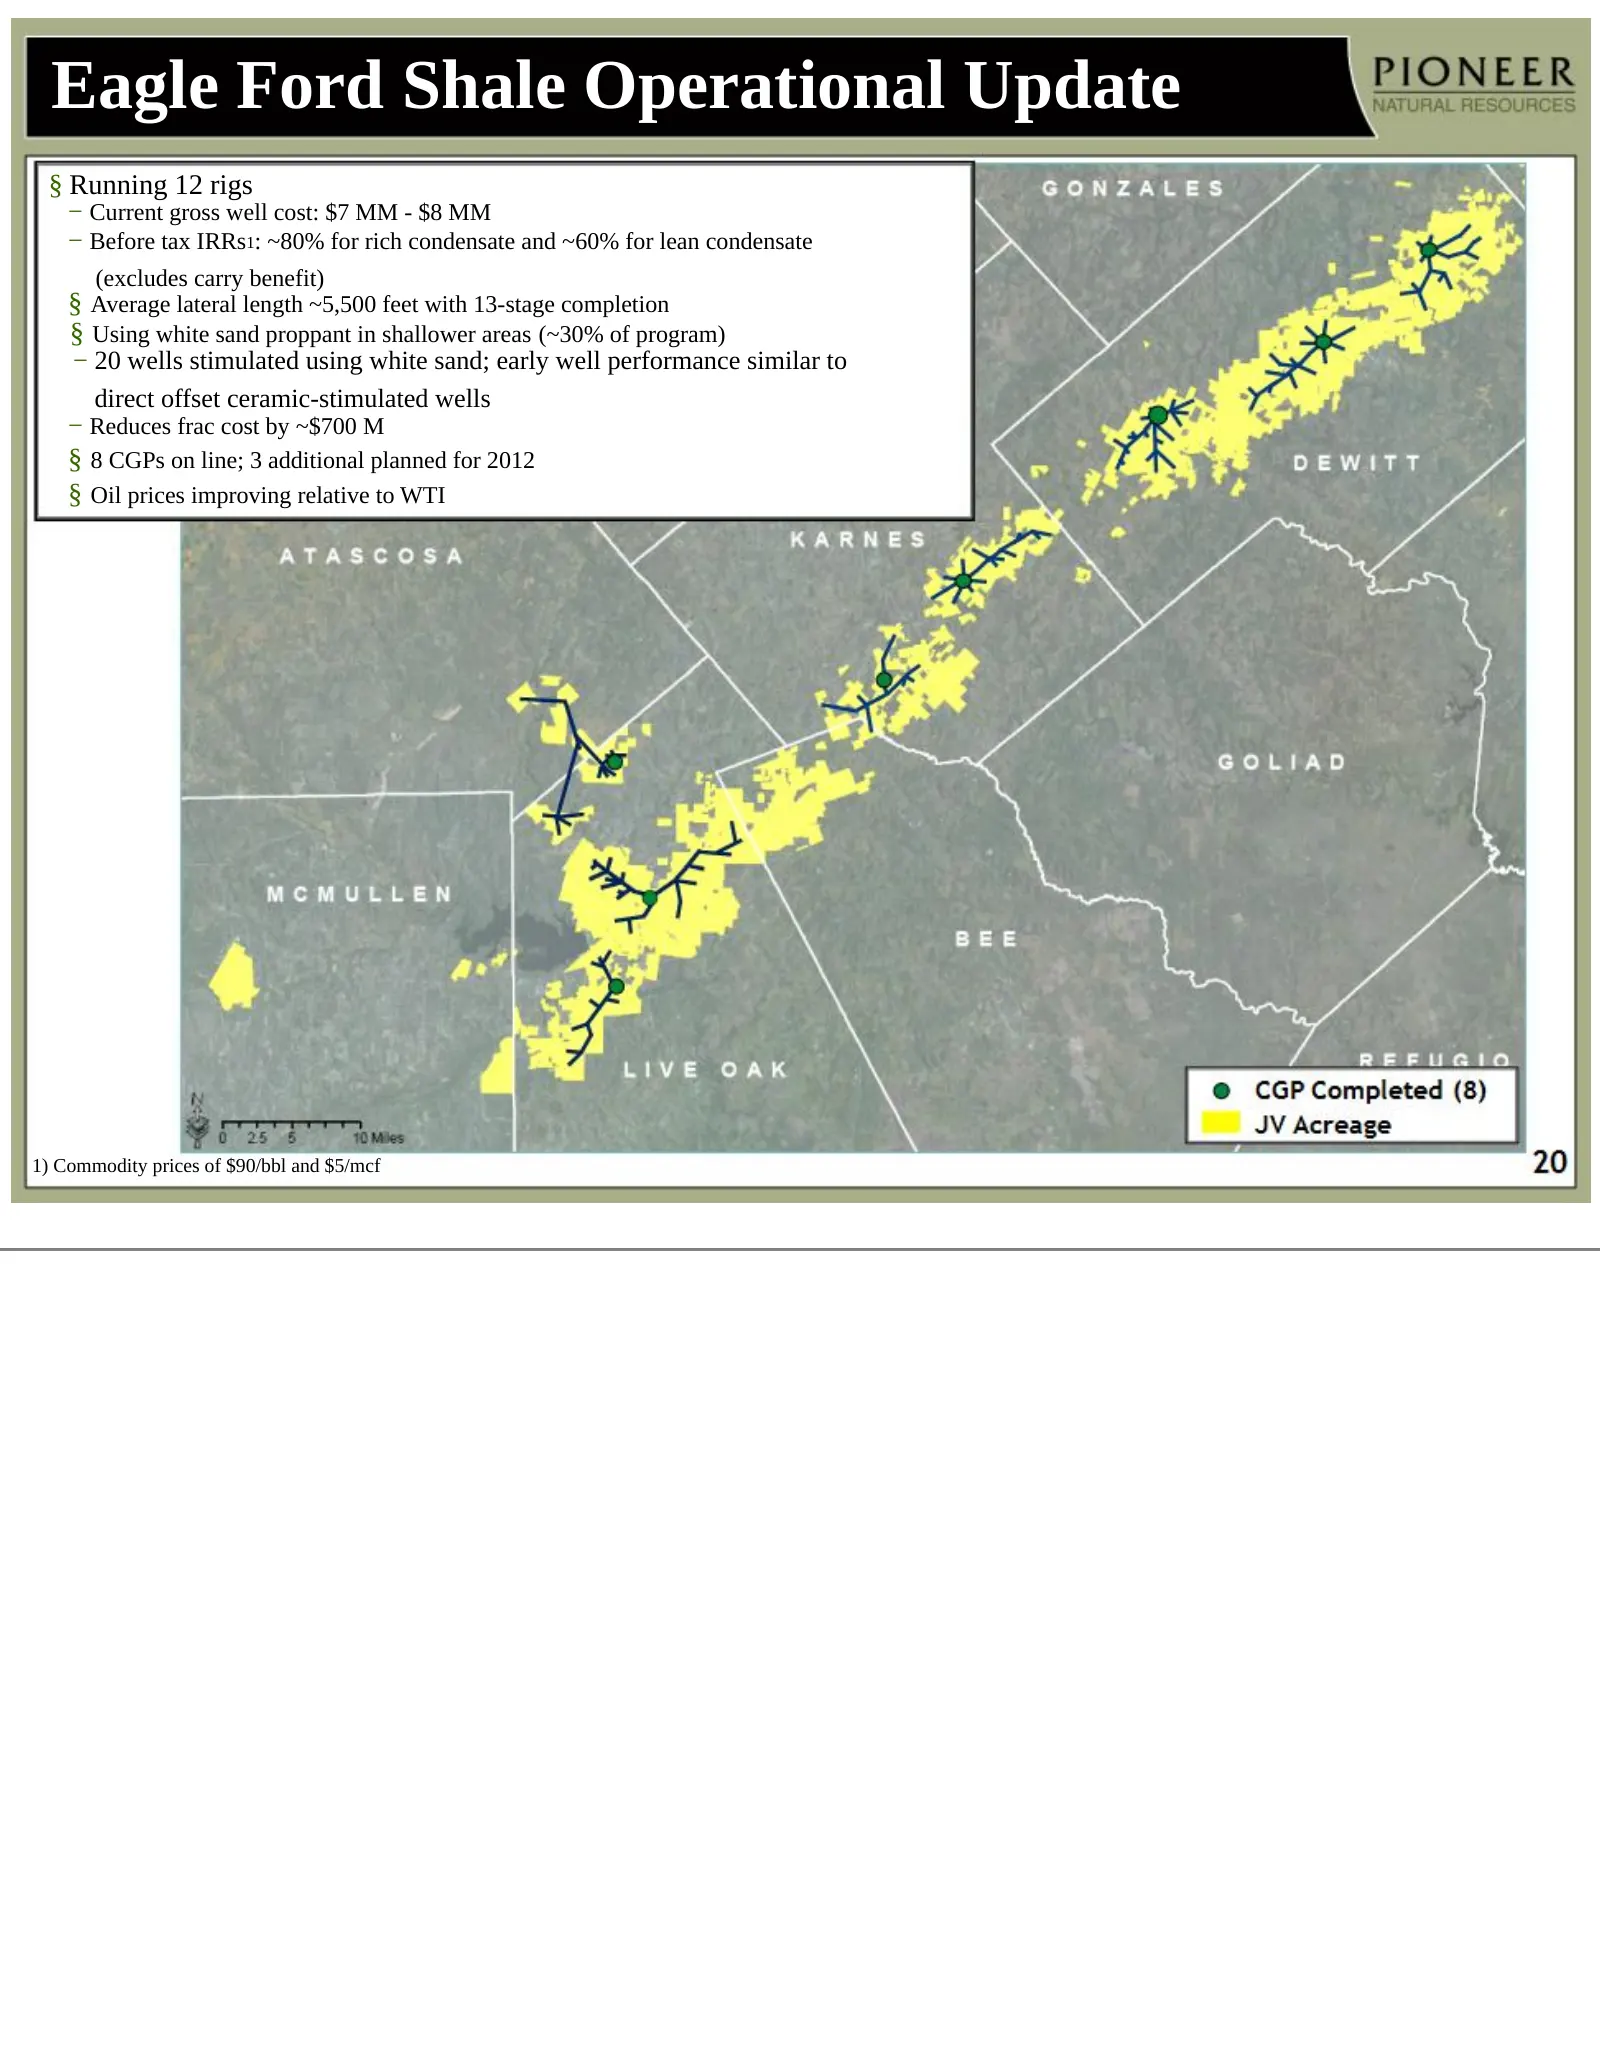
Eagle Ford Shale Operational Update § Running 12 rigs − Current gross well cost: $7 MM - $8 MM − Before tax IRRs1: ~80% for rich condensate and ~60% for lean condensate (excludes carry benefit) § Average lateral length ~5,500 feet with 13-stage completion § Using white sand proppant in shallower are
Slide 21: Eagle Ford well results: Karnes County and Live Oak County
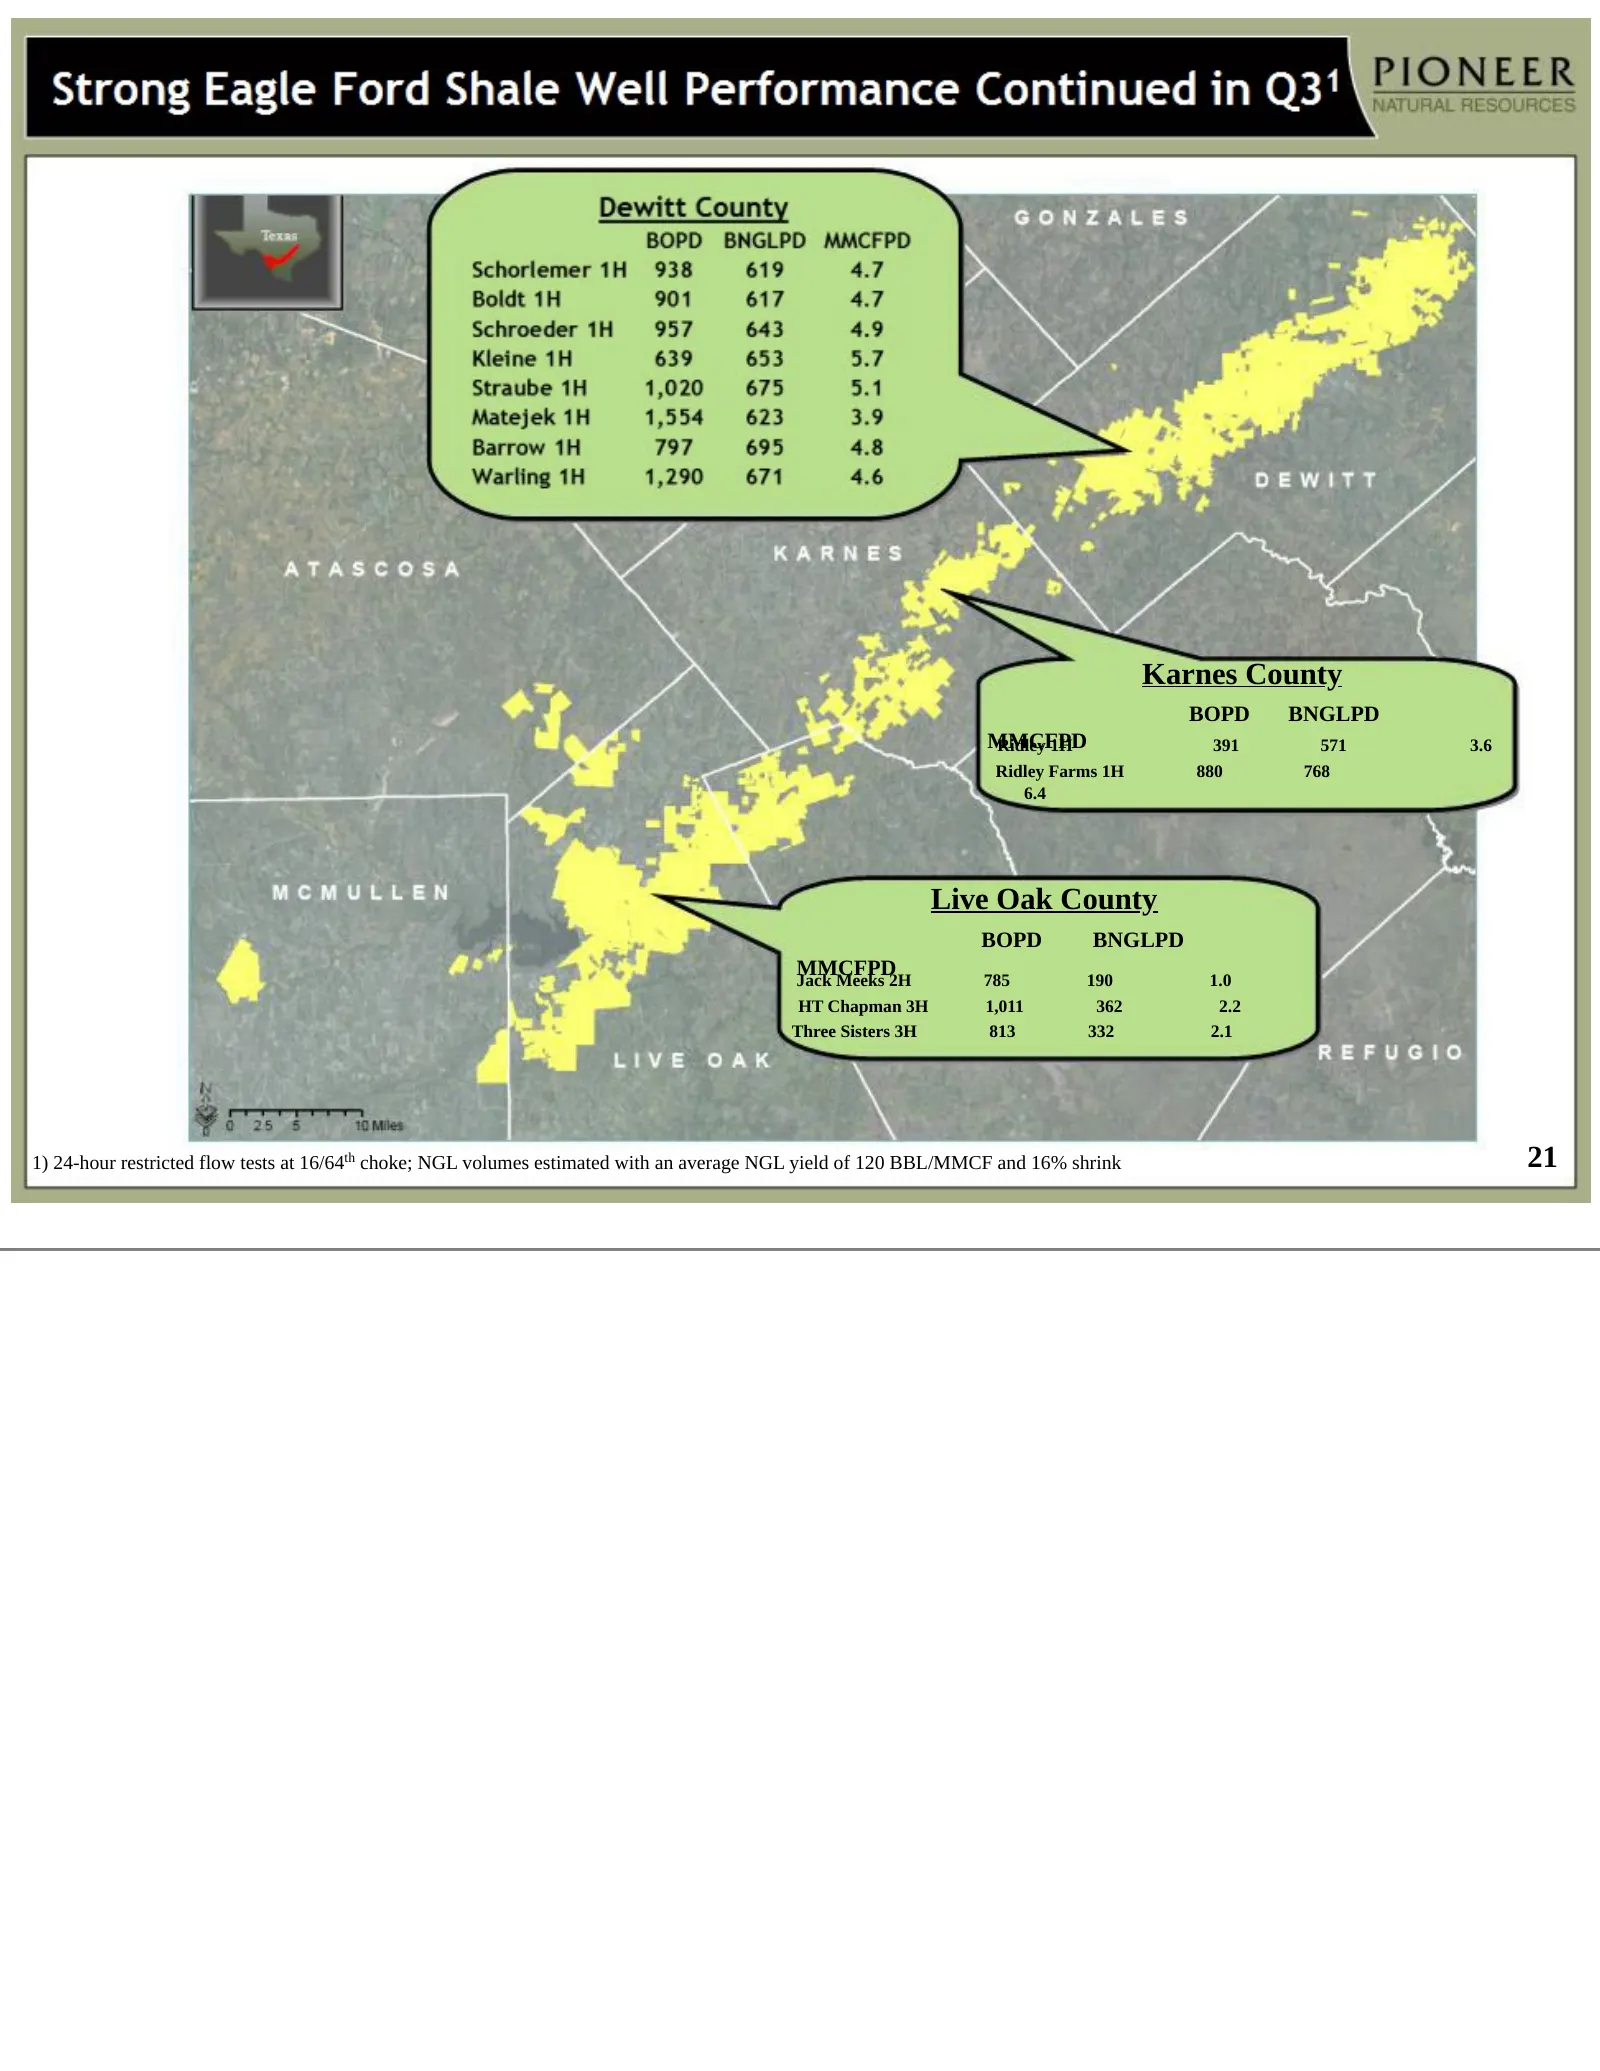
Karnes County BOPD BNGLPD MMCFPD Ridley 1H 391 571 3.6 Ridley Farms 1H 880 768 6.4 Live Oak County BOPD BNGLPD MMCFPD Jack Meeks 2H 785 190 1.0 HT Chapman 3H 1,011 362 2.2 Three Sisters 3H 813 332 2.1 1) 24-hour restricted flow tests at 16/64th choke; NGL volumes estimated with an average NGL yield
Slide 22: Eagle Ford Shale Resource Breakdown
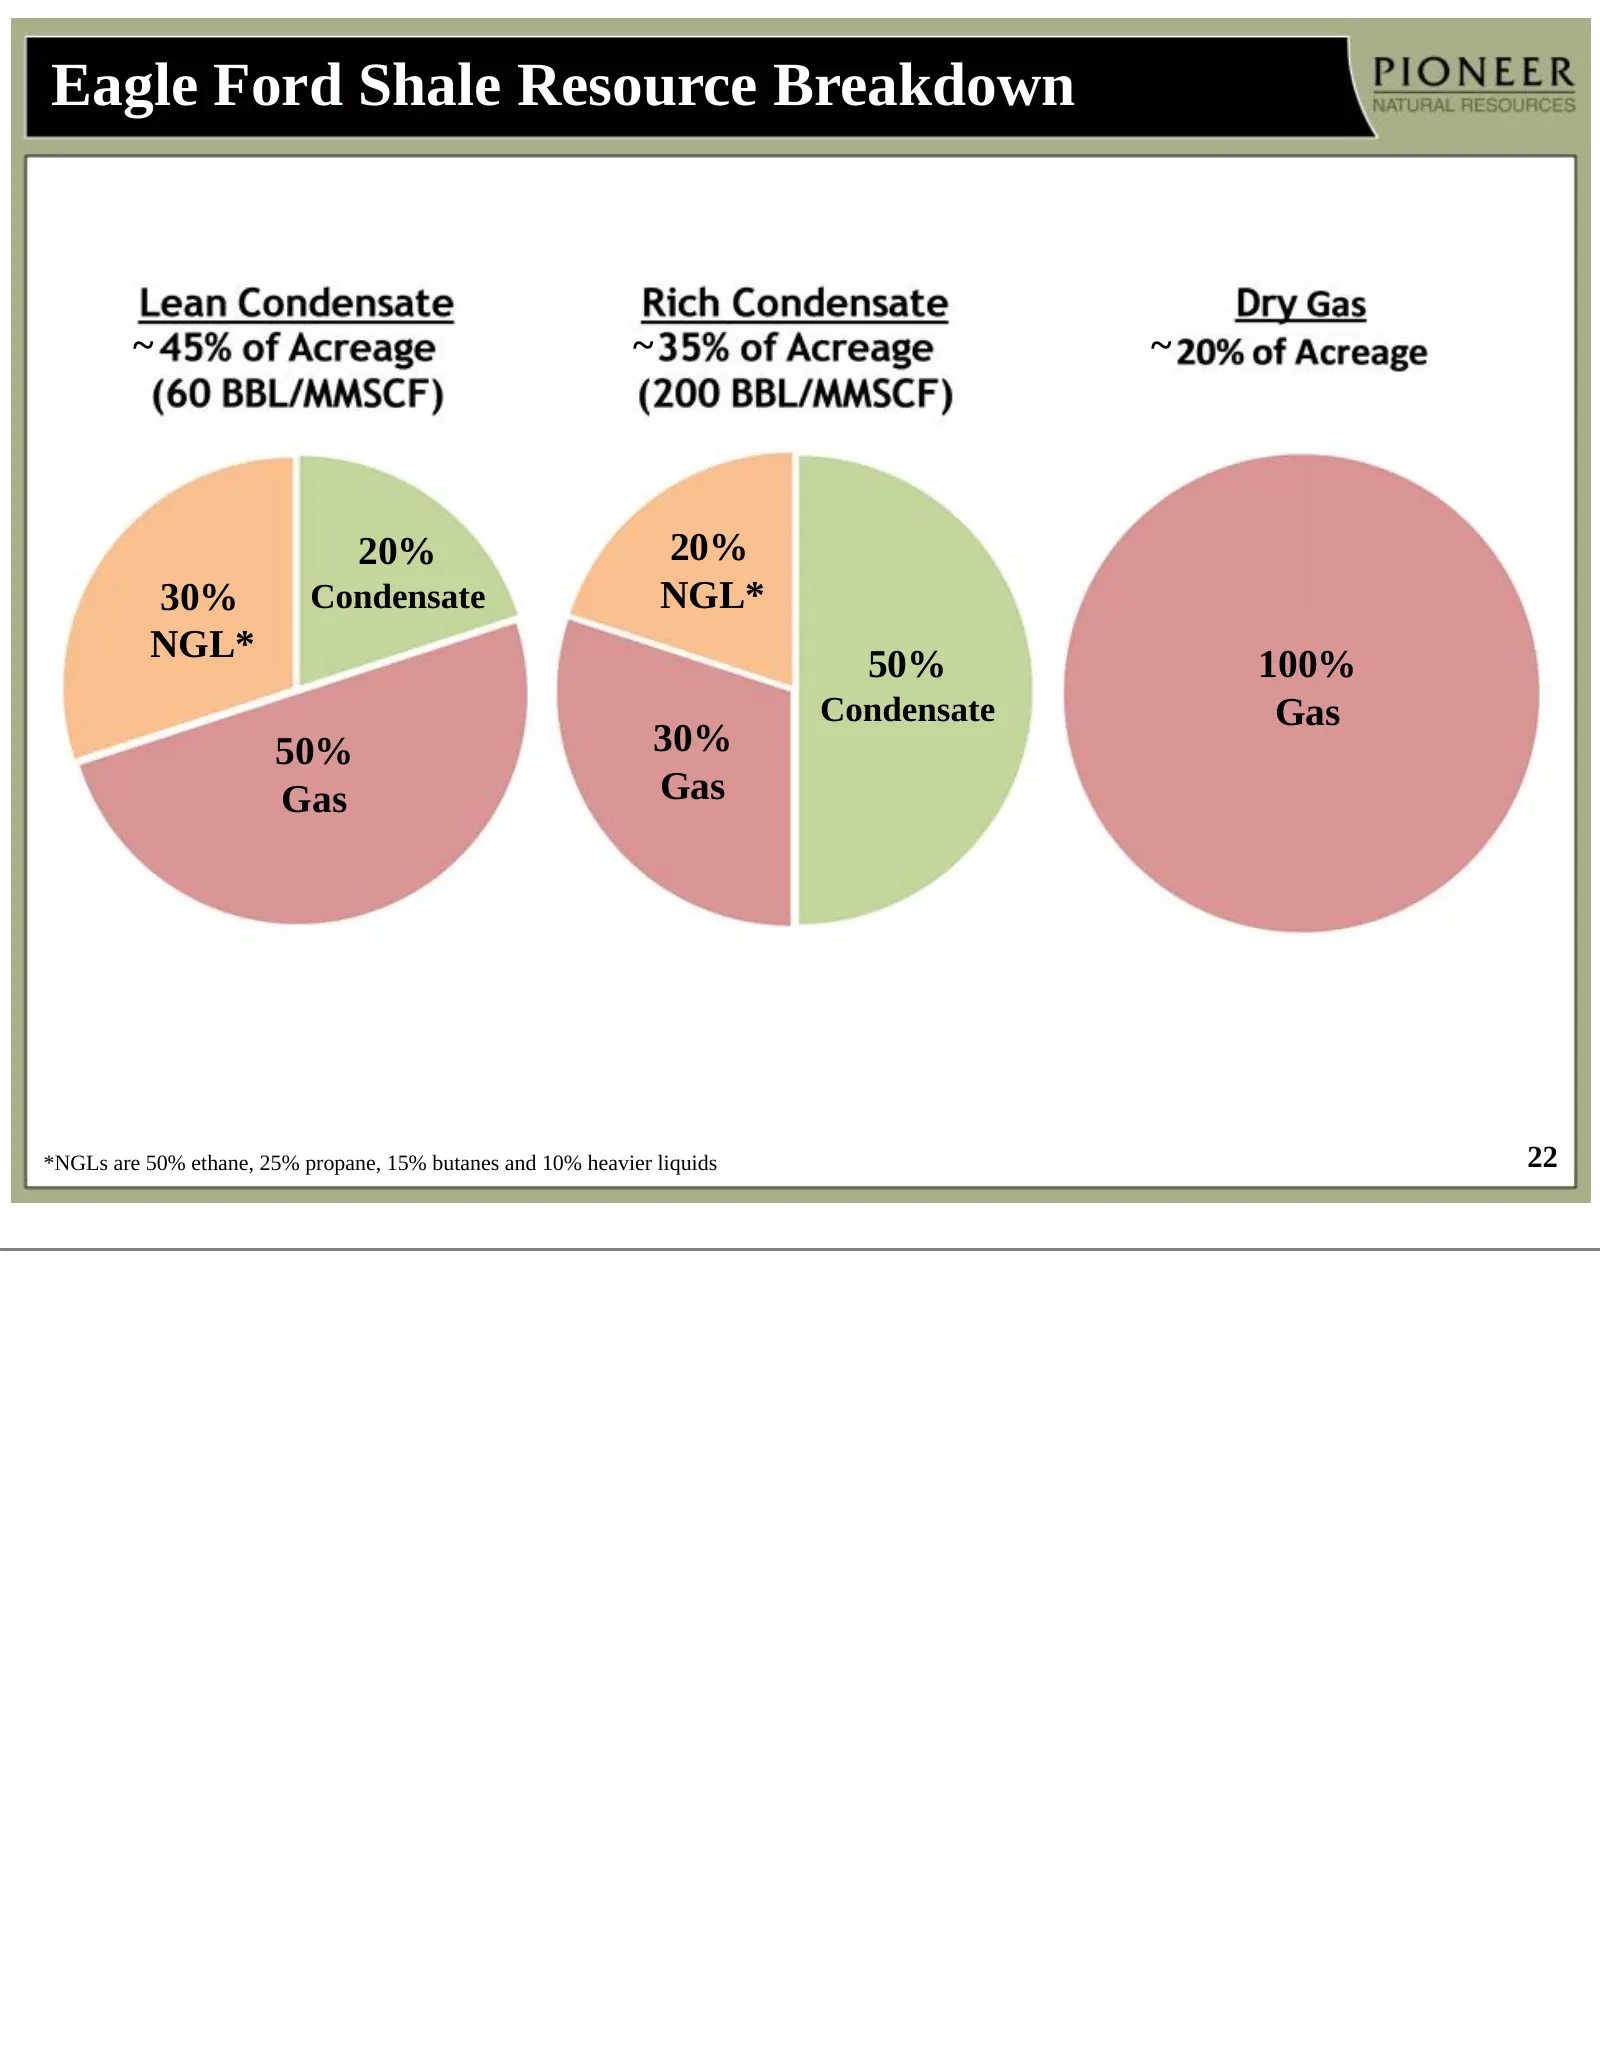
Eagle Ford Shale Resource Breakdown ~ ~ ~ 20% 20% 30% Condensate NGL* NGL* 50% 100% Condensate Gas 50% 30% Gas Gas *NGLs are 50% ethane, 25% propane, 15% butanes and 10% heavier liquids 22
Slide 23: Successfully Growing Eagle Ford Shale Production
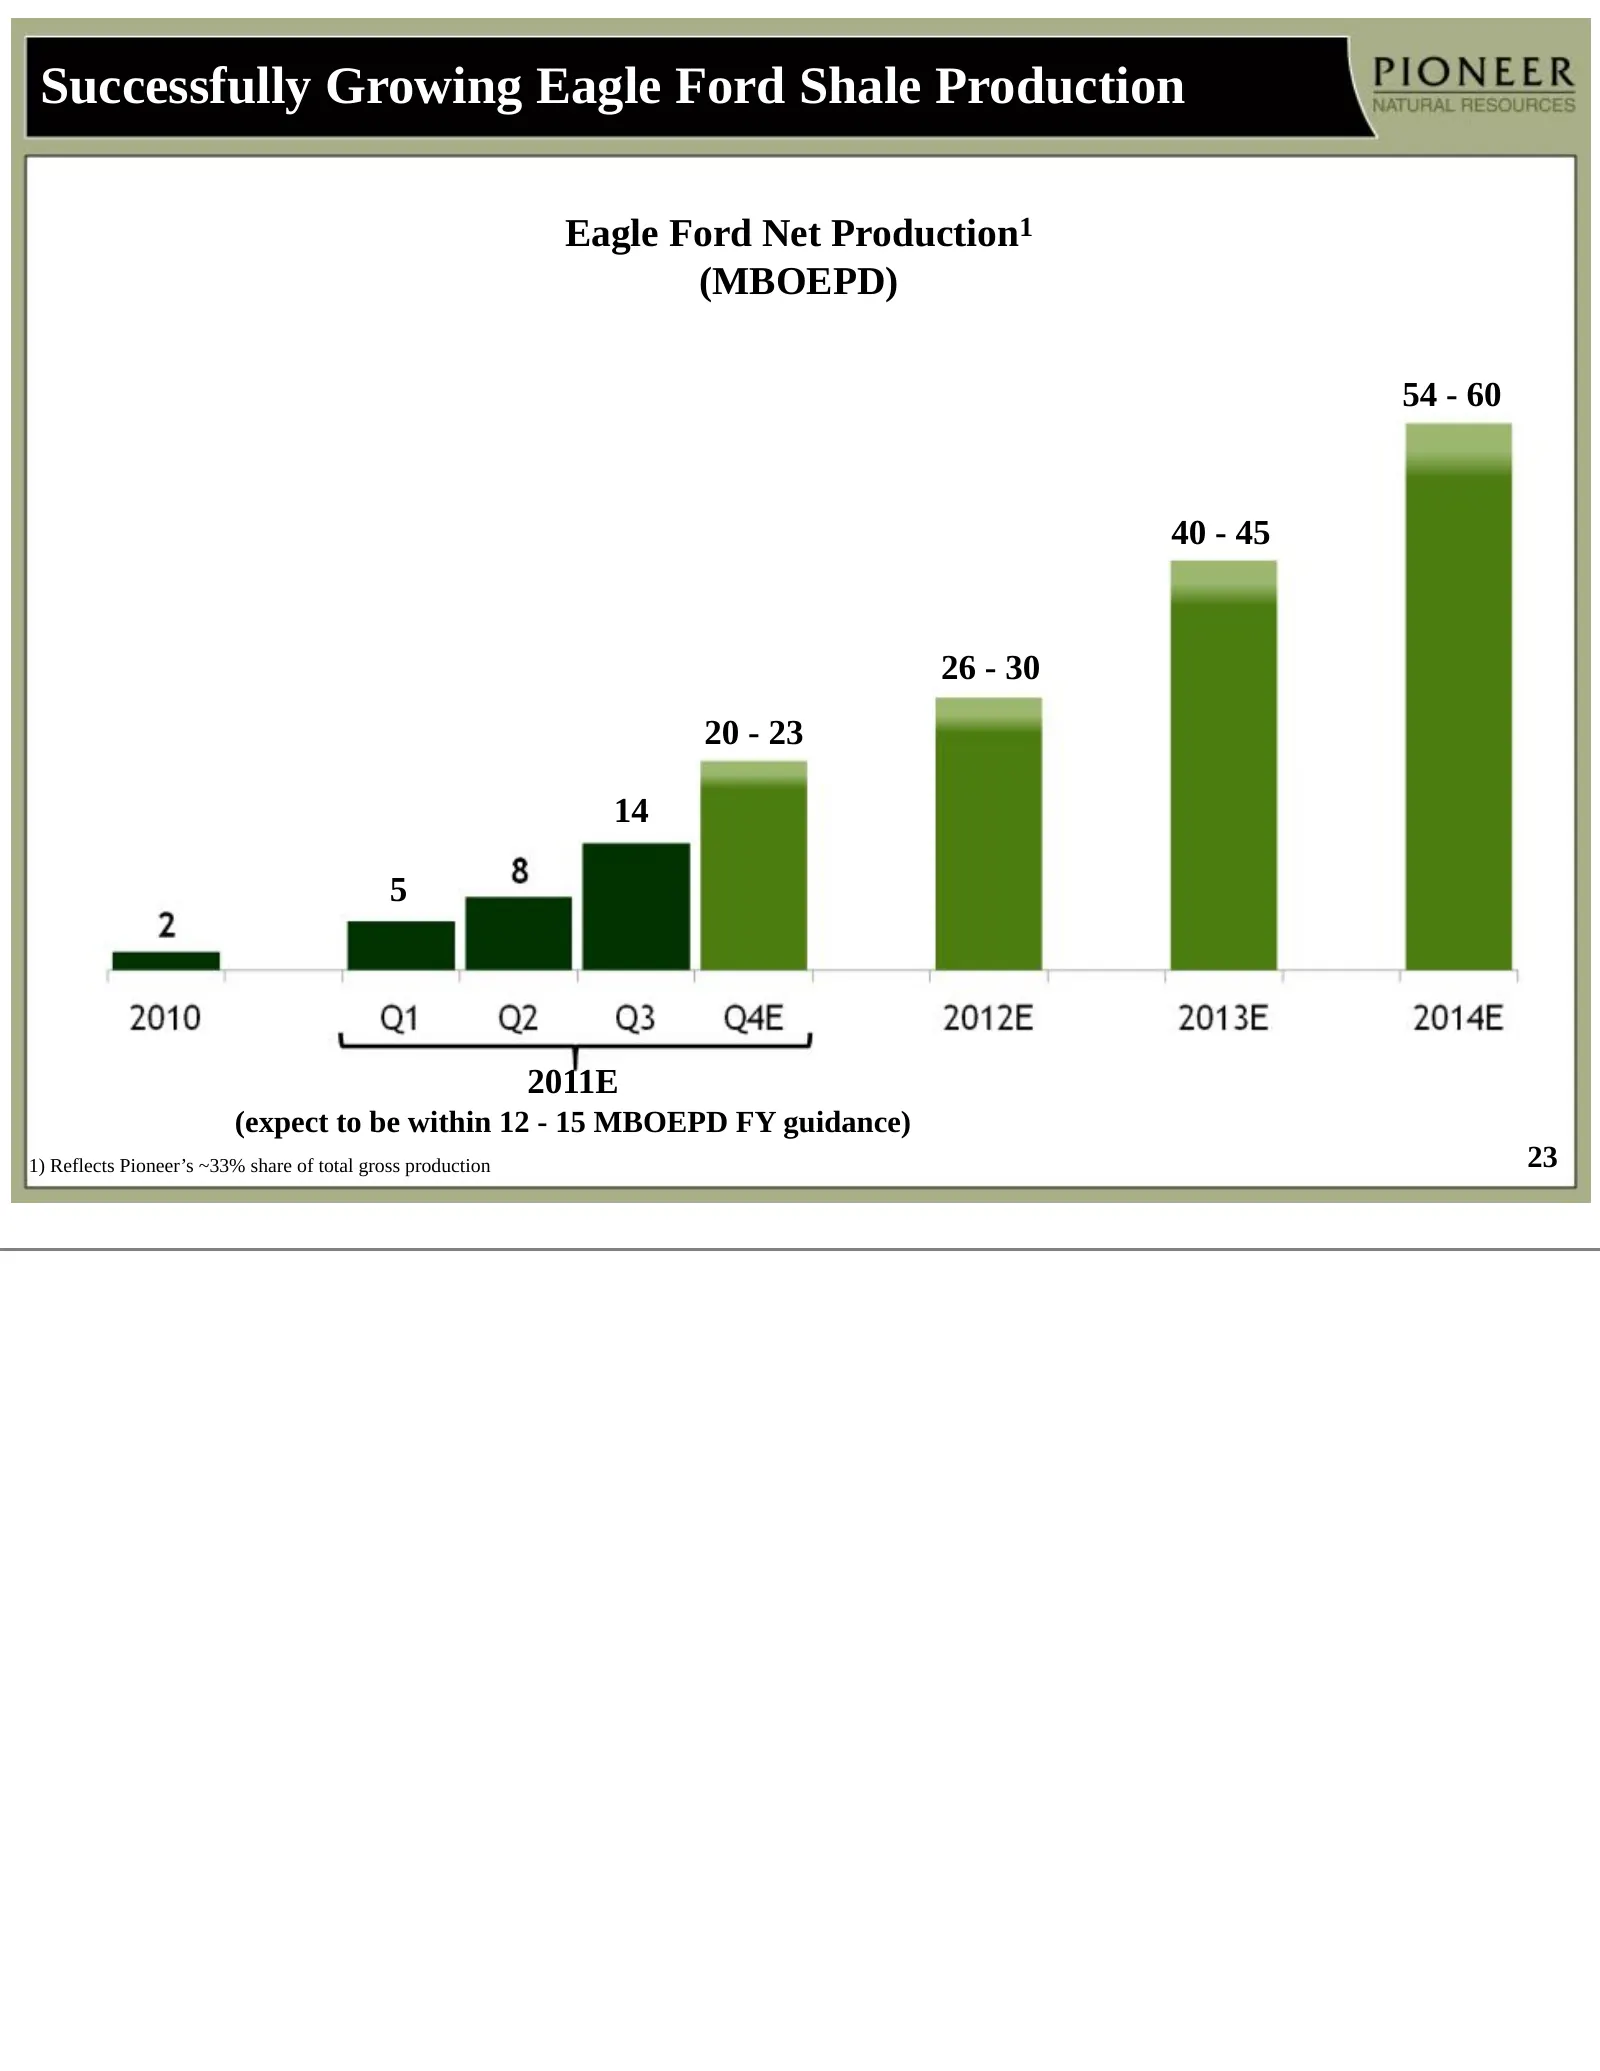
Successfully Growing Eagle Ford Shale Production Eagle Ford Net Production1 (MBOEPD) 54 - 60 40 - 45 26 - 30 20 - 23 14 5 2011E (expect to be within 12 - 15 MBOEPD FY guidance) 1) Reflects Pioneer’s ~33% share of total gross production 23
Slide 24: Strong Barnett Shale Combo Well Performance Continued in Q3
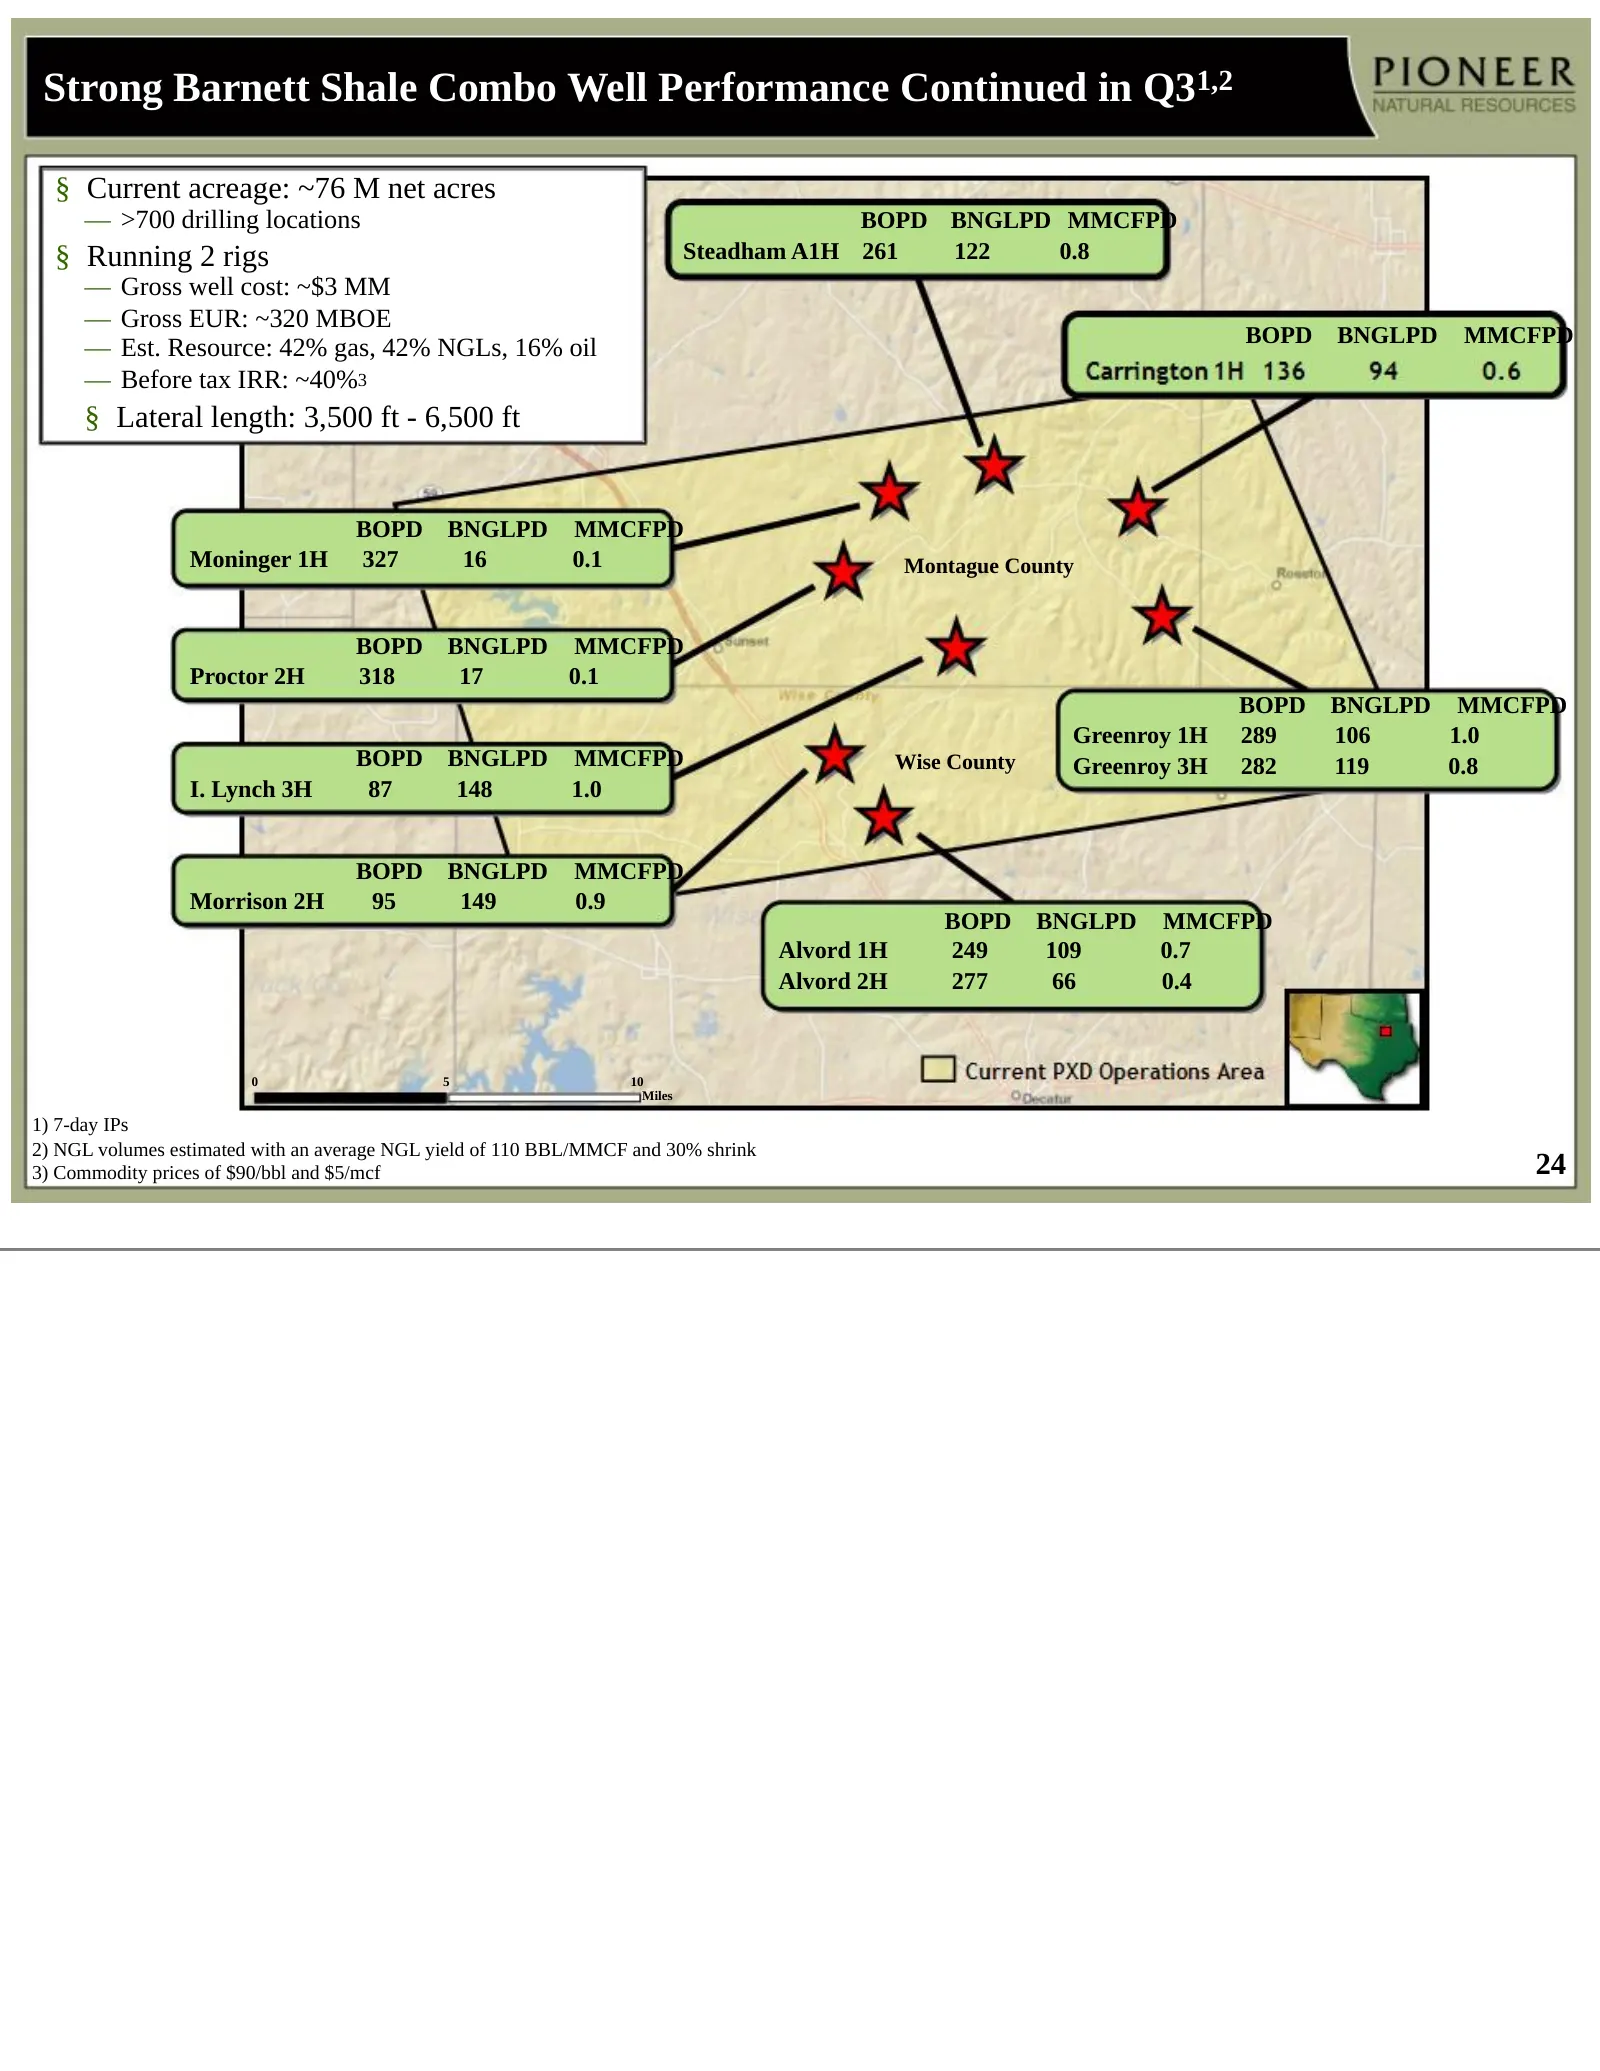
Strong Barnett Shale Combo Well Performance Continued in Q31,2 § Current acreage: ~76 M net acres — >700 drilling locations BOPD BNGLPD MMCFPD § Running 2 rigs Steadham A1H 261 122 0.8 — Gross well cost: ~$3 MM — Gross EUR: ~320 MBOE BOPD BNGLPD MMCFPD — Est. Resource: 42% gas, 42% NGLs, 16% oil — B
Slide 25: Successfully Growing Barnett Shale Combo Production
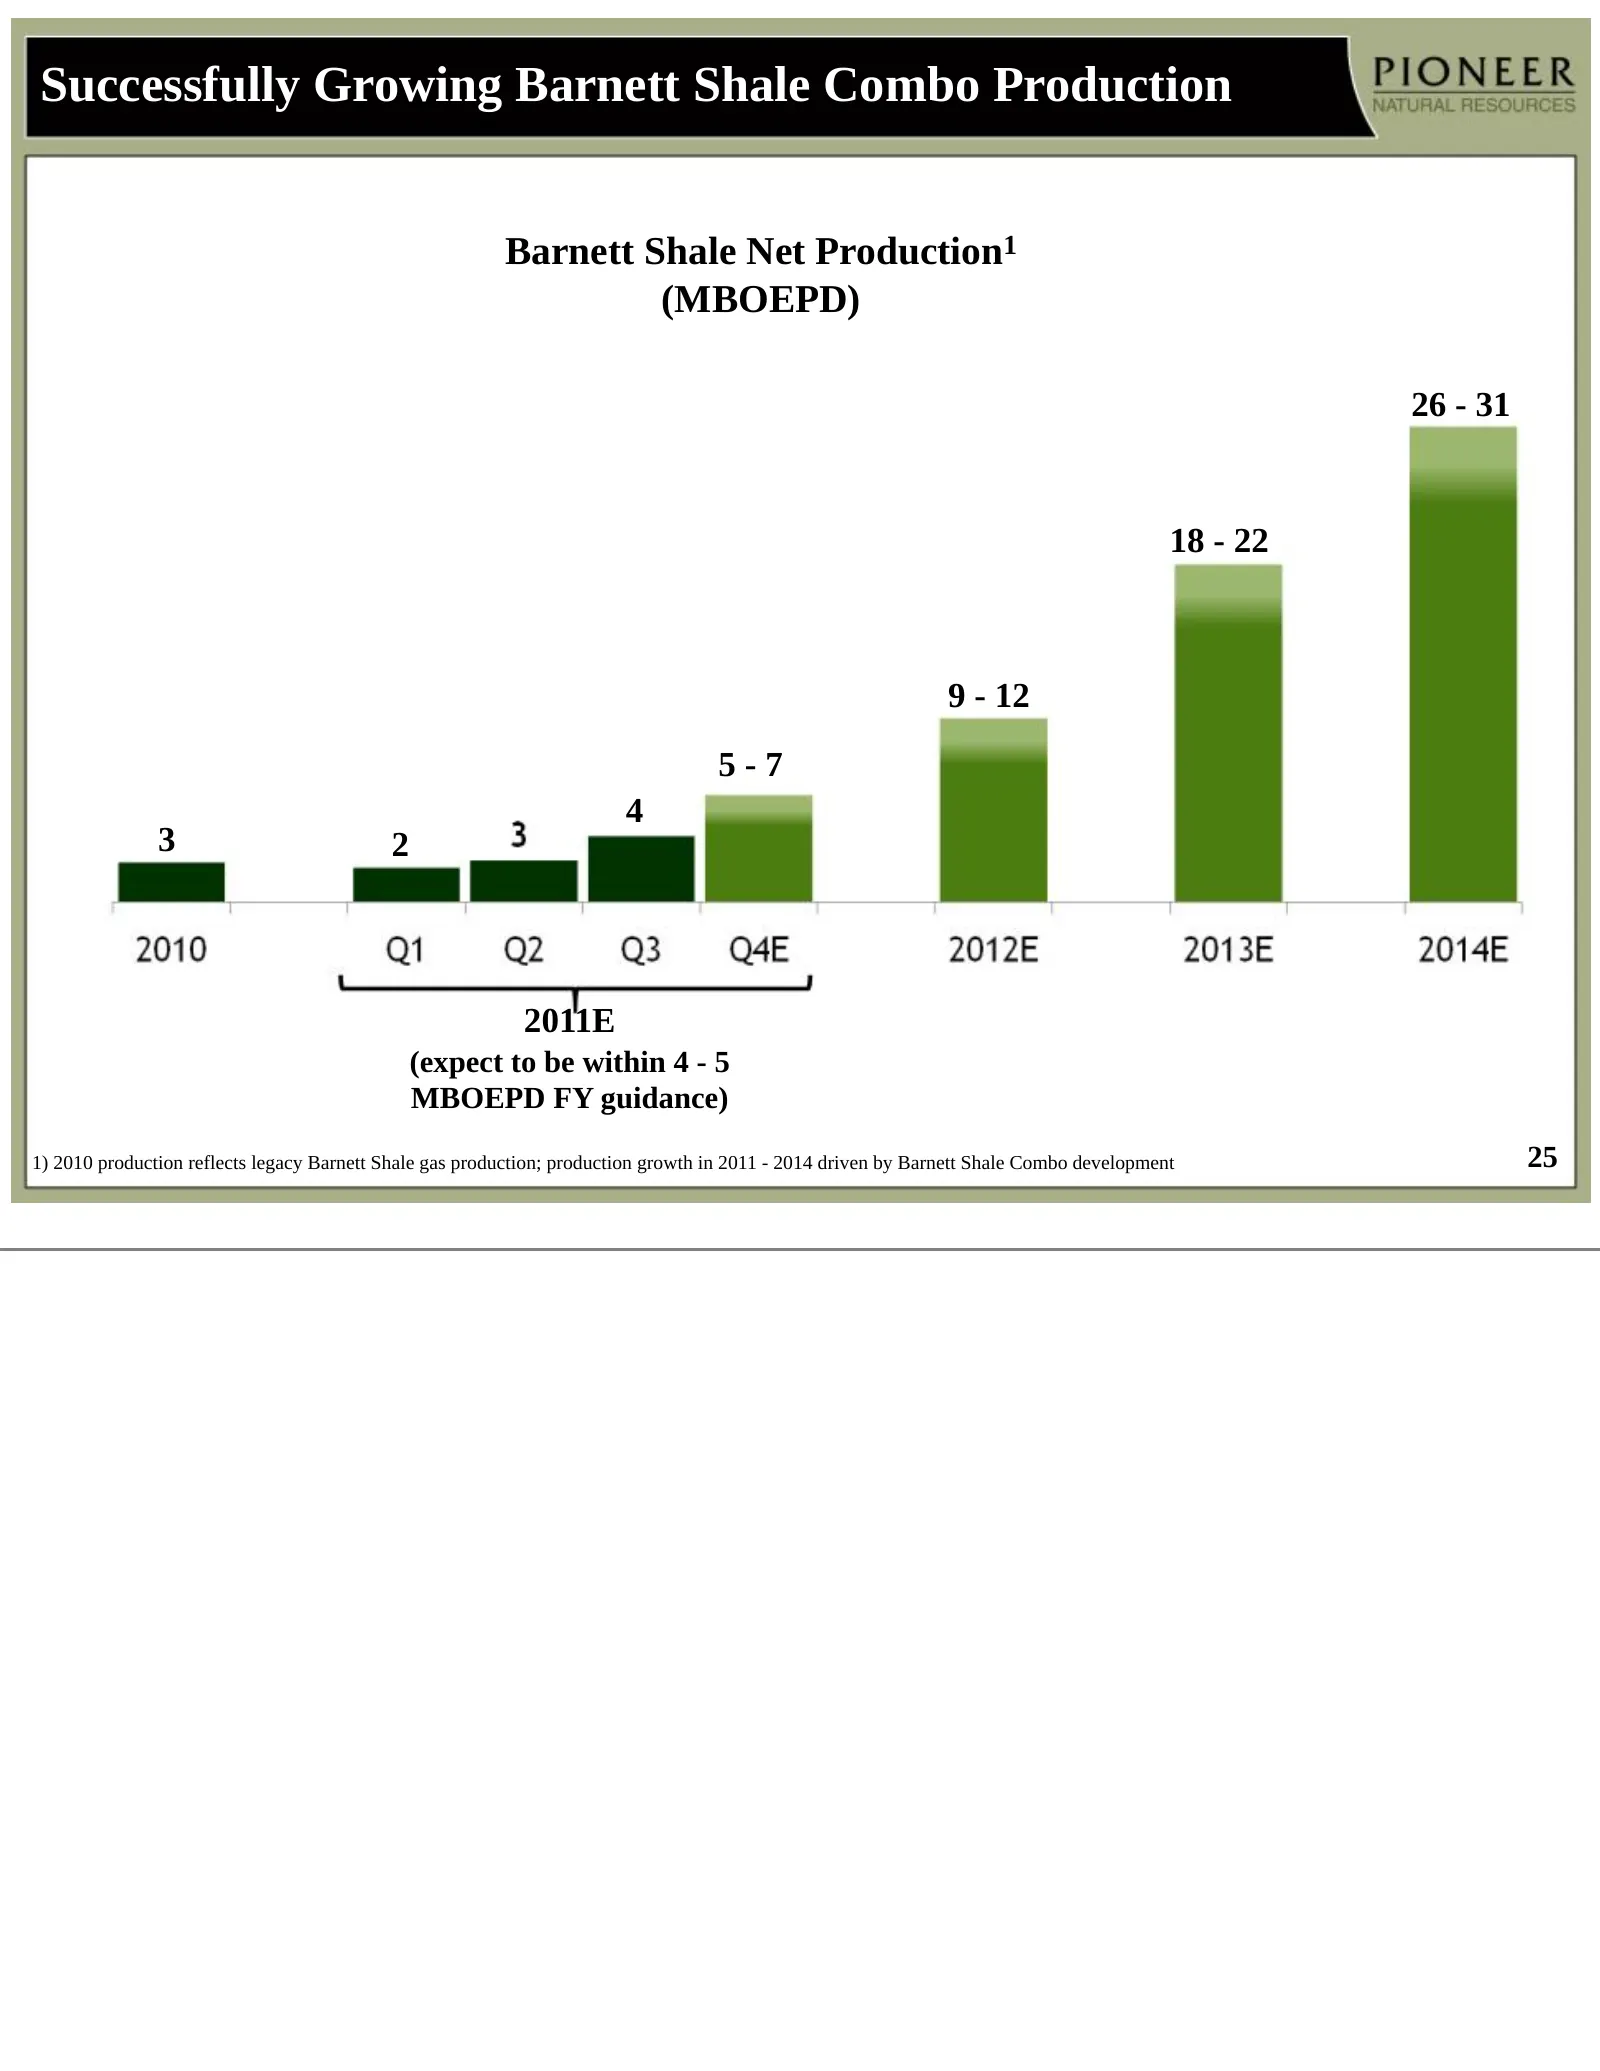
Successfully Growing Barnett Shale Combo Production Barnett Shale Net Production1 (MBOEPD) 26 - 31 18 - 22 9 - 12 5-7 4 3 2 2011E (expect to be within 4 - 5 MBOEPD FY guidance) 1) 2010 production reflects legacy Barnett Shale gas production; production growth in 2011 - 2014 driven by Barnett Shale C
Slide 26: Pioneer's Vertical Integration Improves Returns and Enhances Execution
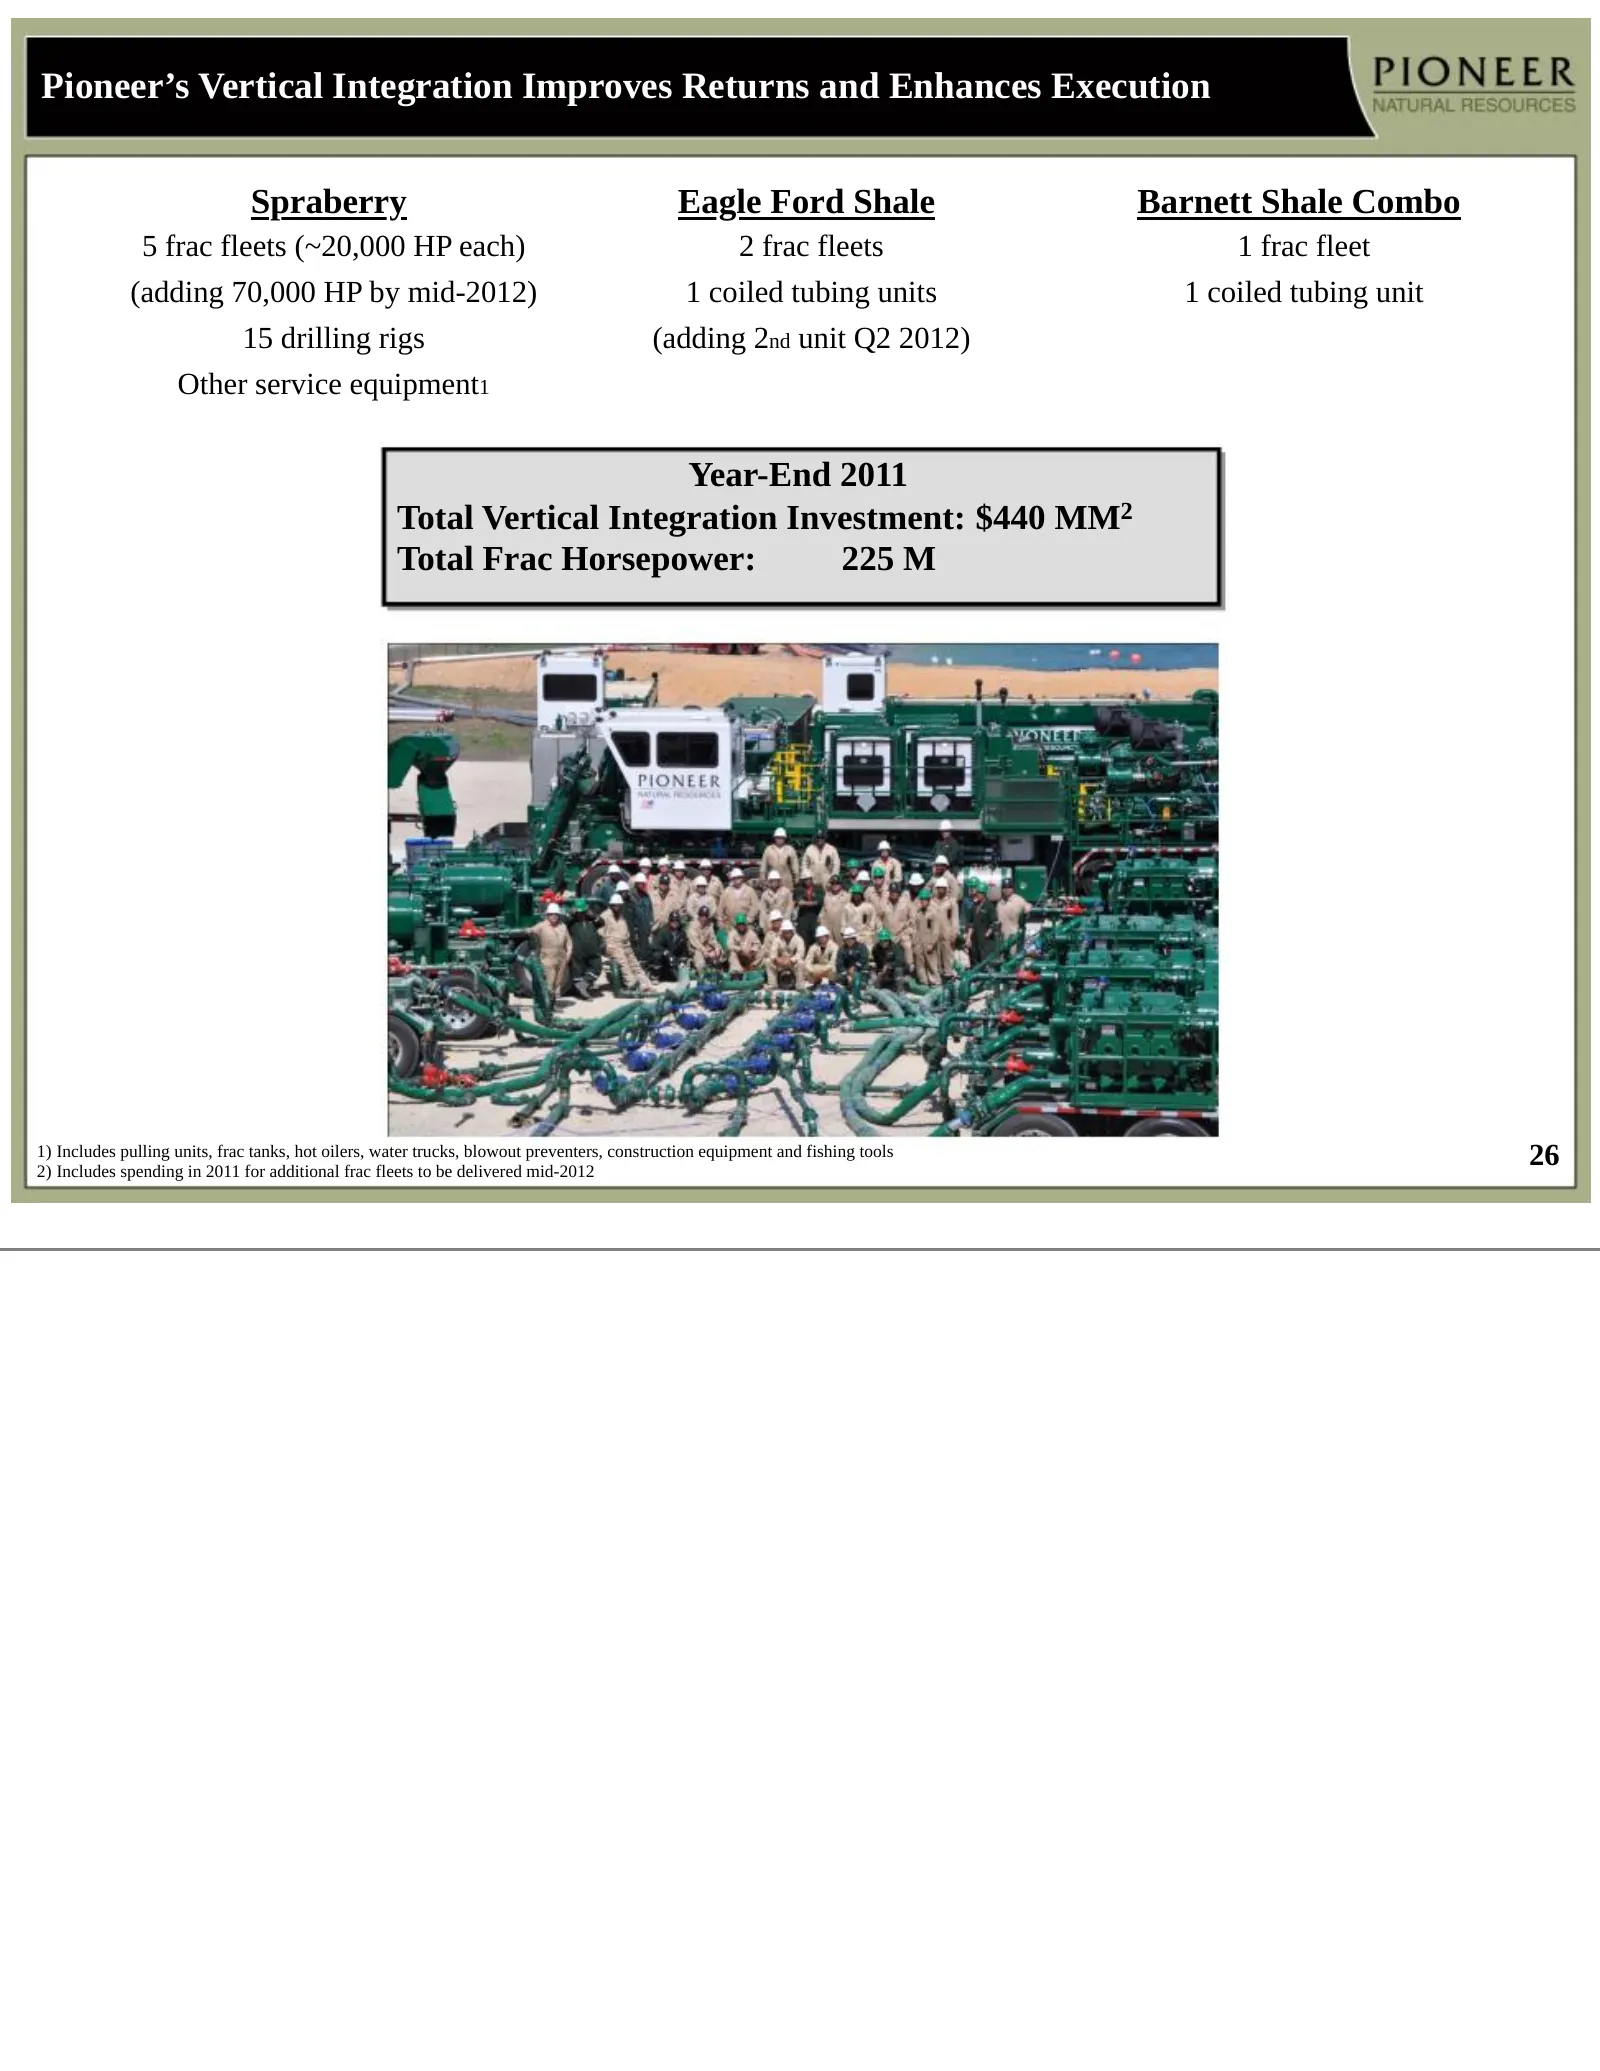
Pioneer’s Vertical Integration Improves Returns and Enhances Execution Spraberry Eagle Ford Shale Barnett Shale Combo 5 frac fleets (~20,000 HP each) 2 frac fleets 1 frac fleet (adding 70,000 HP by mid-2012) 1 coiled tubing units 1 coiled tubing unit 15 drilling rigs (adding 2nd unit Q2 2012) Other
Slide 27: Vertical Integration Significantly Reduces Well Costs
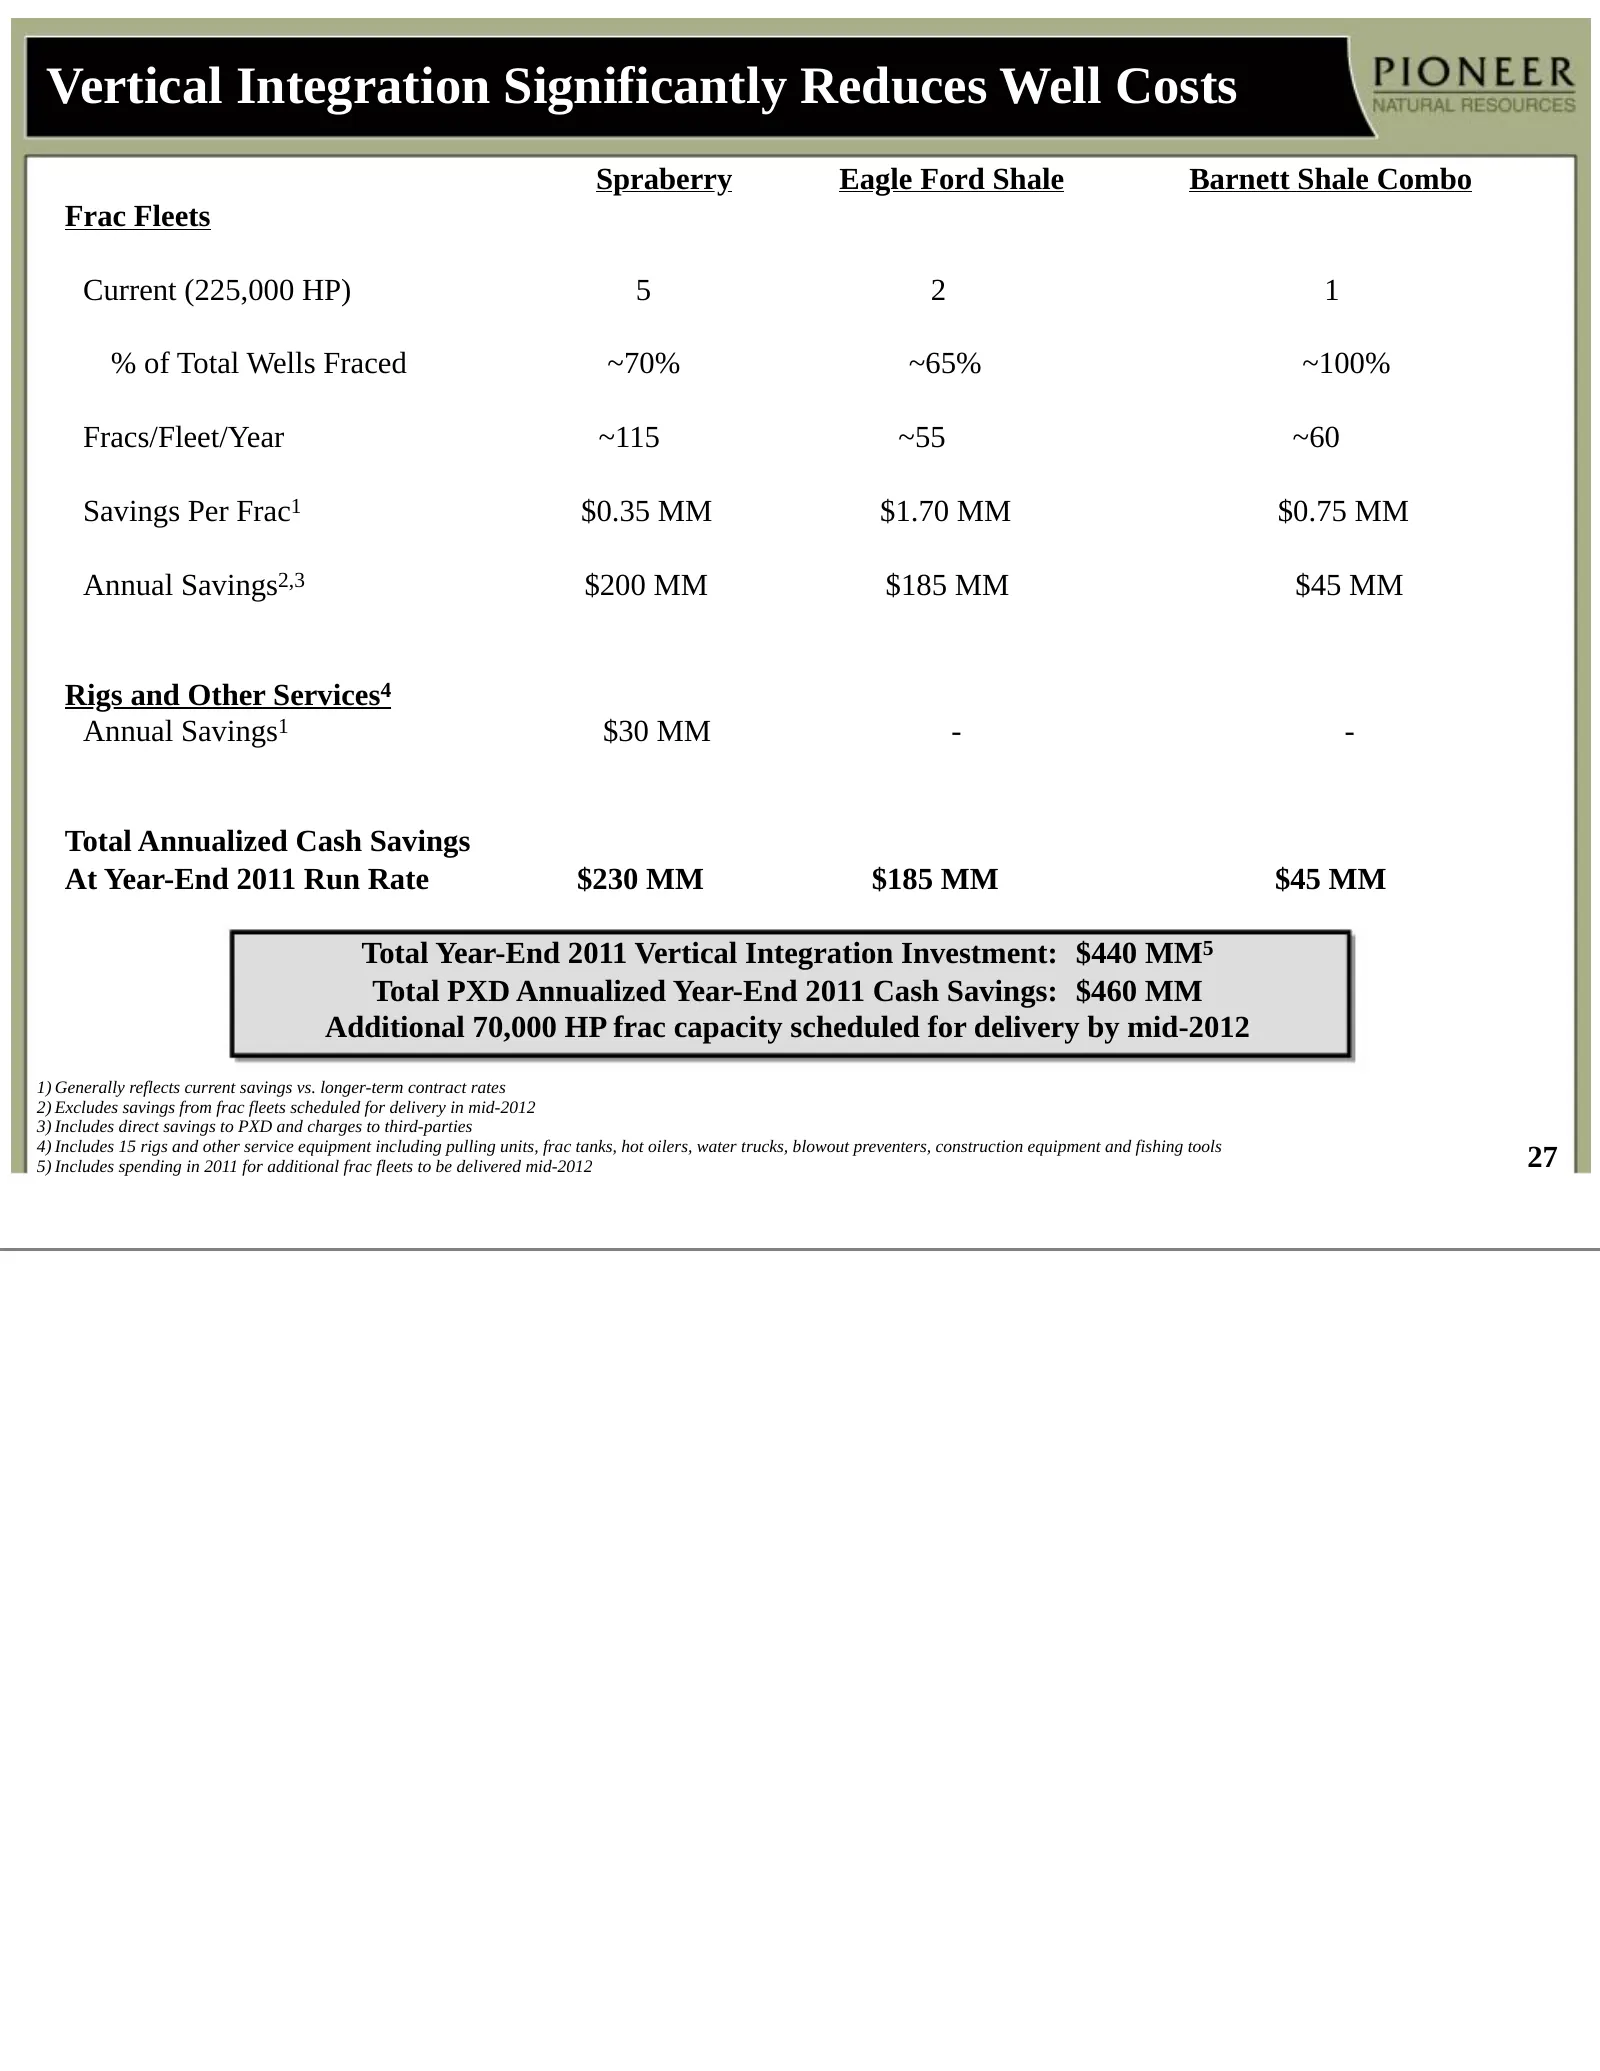
Vertical Integration Significantly Reduces Well Costs Spraberry Eagle Ford Shale Barnett Shale Combo Frac Fleets Current (225,000 HP) 5 2 1 % of Total Wells Fraced ~70% ~65% ~100% Fracs/Fleet/Year ~115 ~55 ~60 Savings Per Frac1 $0.35 MM $1.70 MM $0.75 MM Annual Savings2,3 $200 MM $185 MM $45 MM Rigs
Slide 28: Why Invest In PXD?
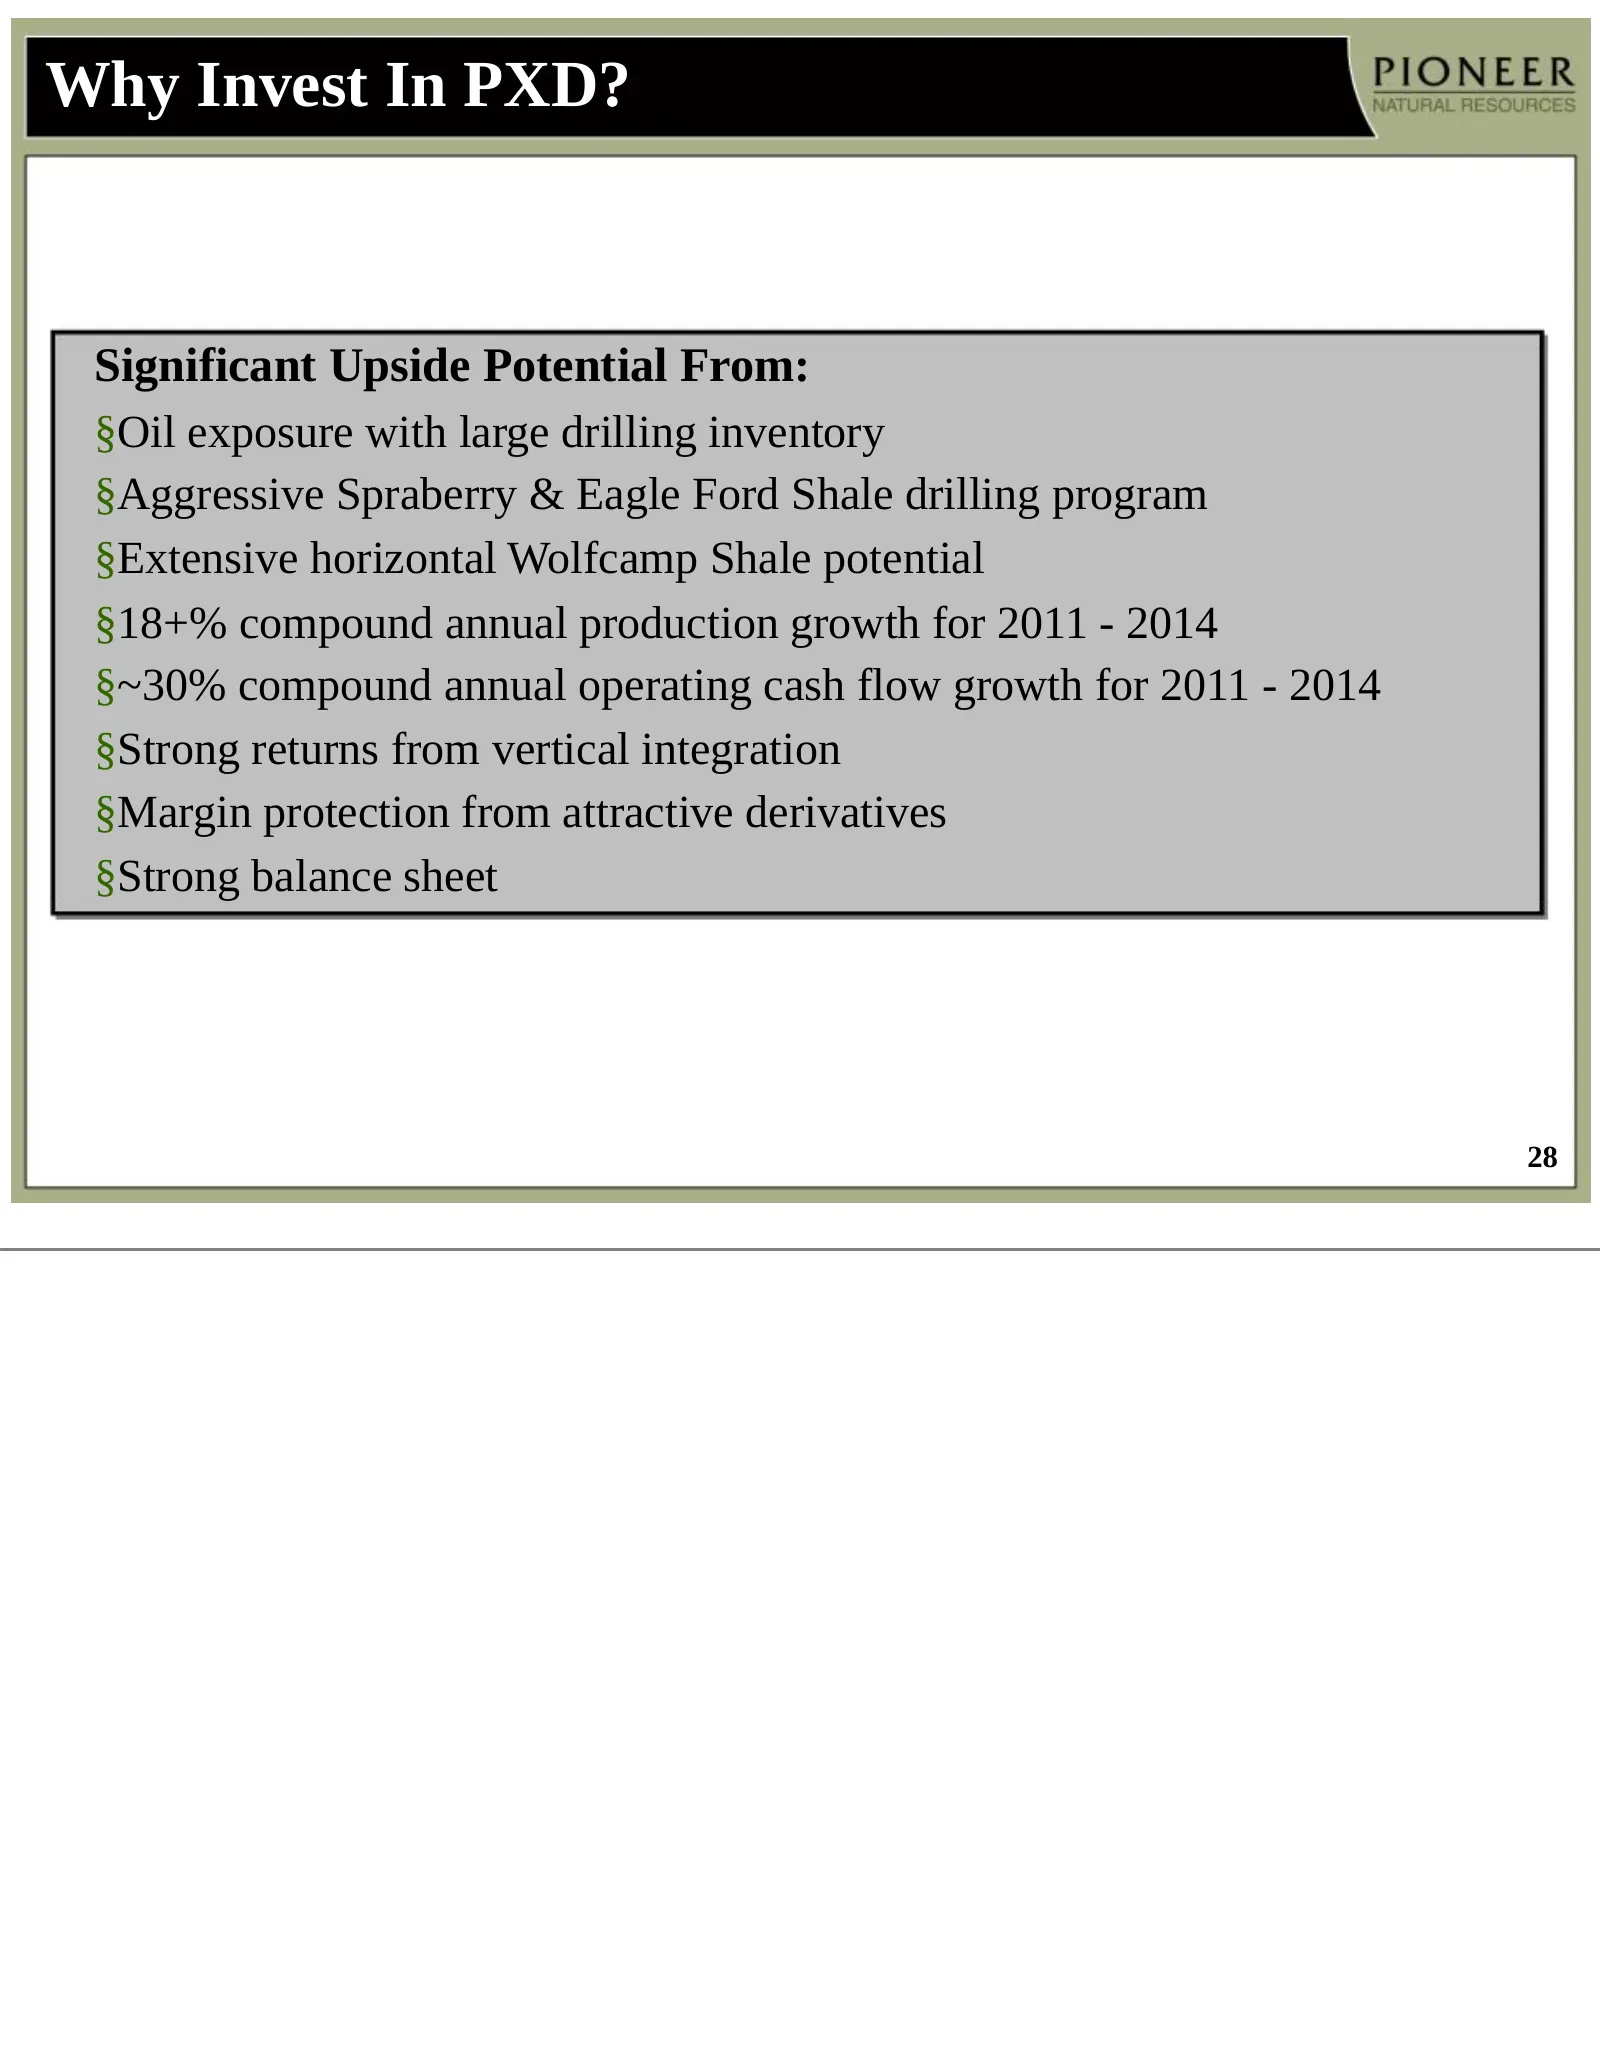
Why Invest In PXD? Significant Upside Potential From: §Oil exposure with large drilling inventory §Aggressive Spraberry & Eagle Ford Shale drilling program §Extensive horizontal Wolfcamp Shale potential §18+% compound annual production growth for 2011 - 2014 §~30% compound annual operating cash flow
Slide 29: Appendix
Appendix
Slide 30: Pioneer Operations
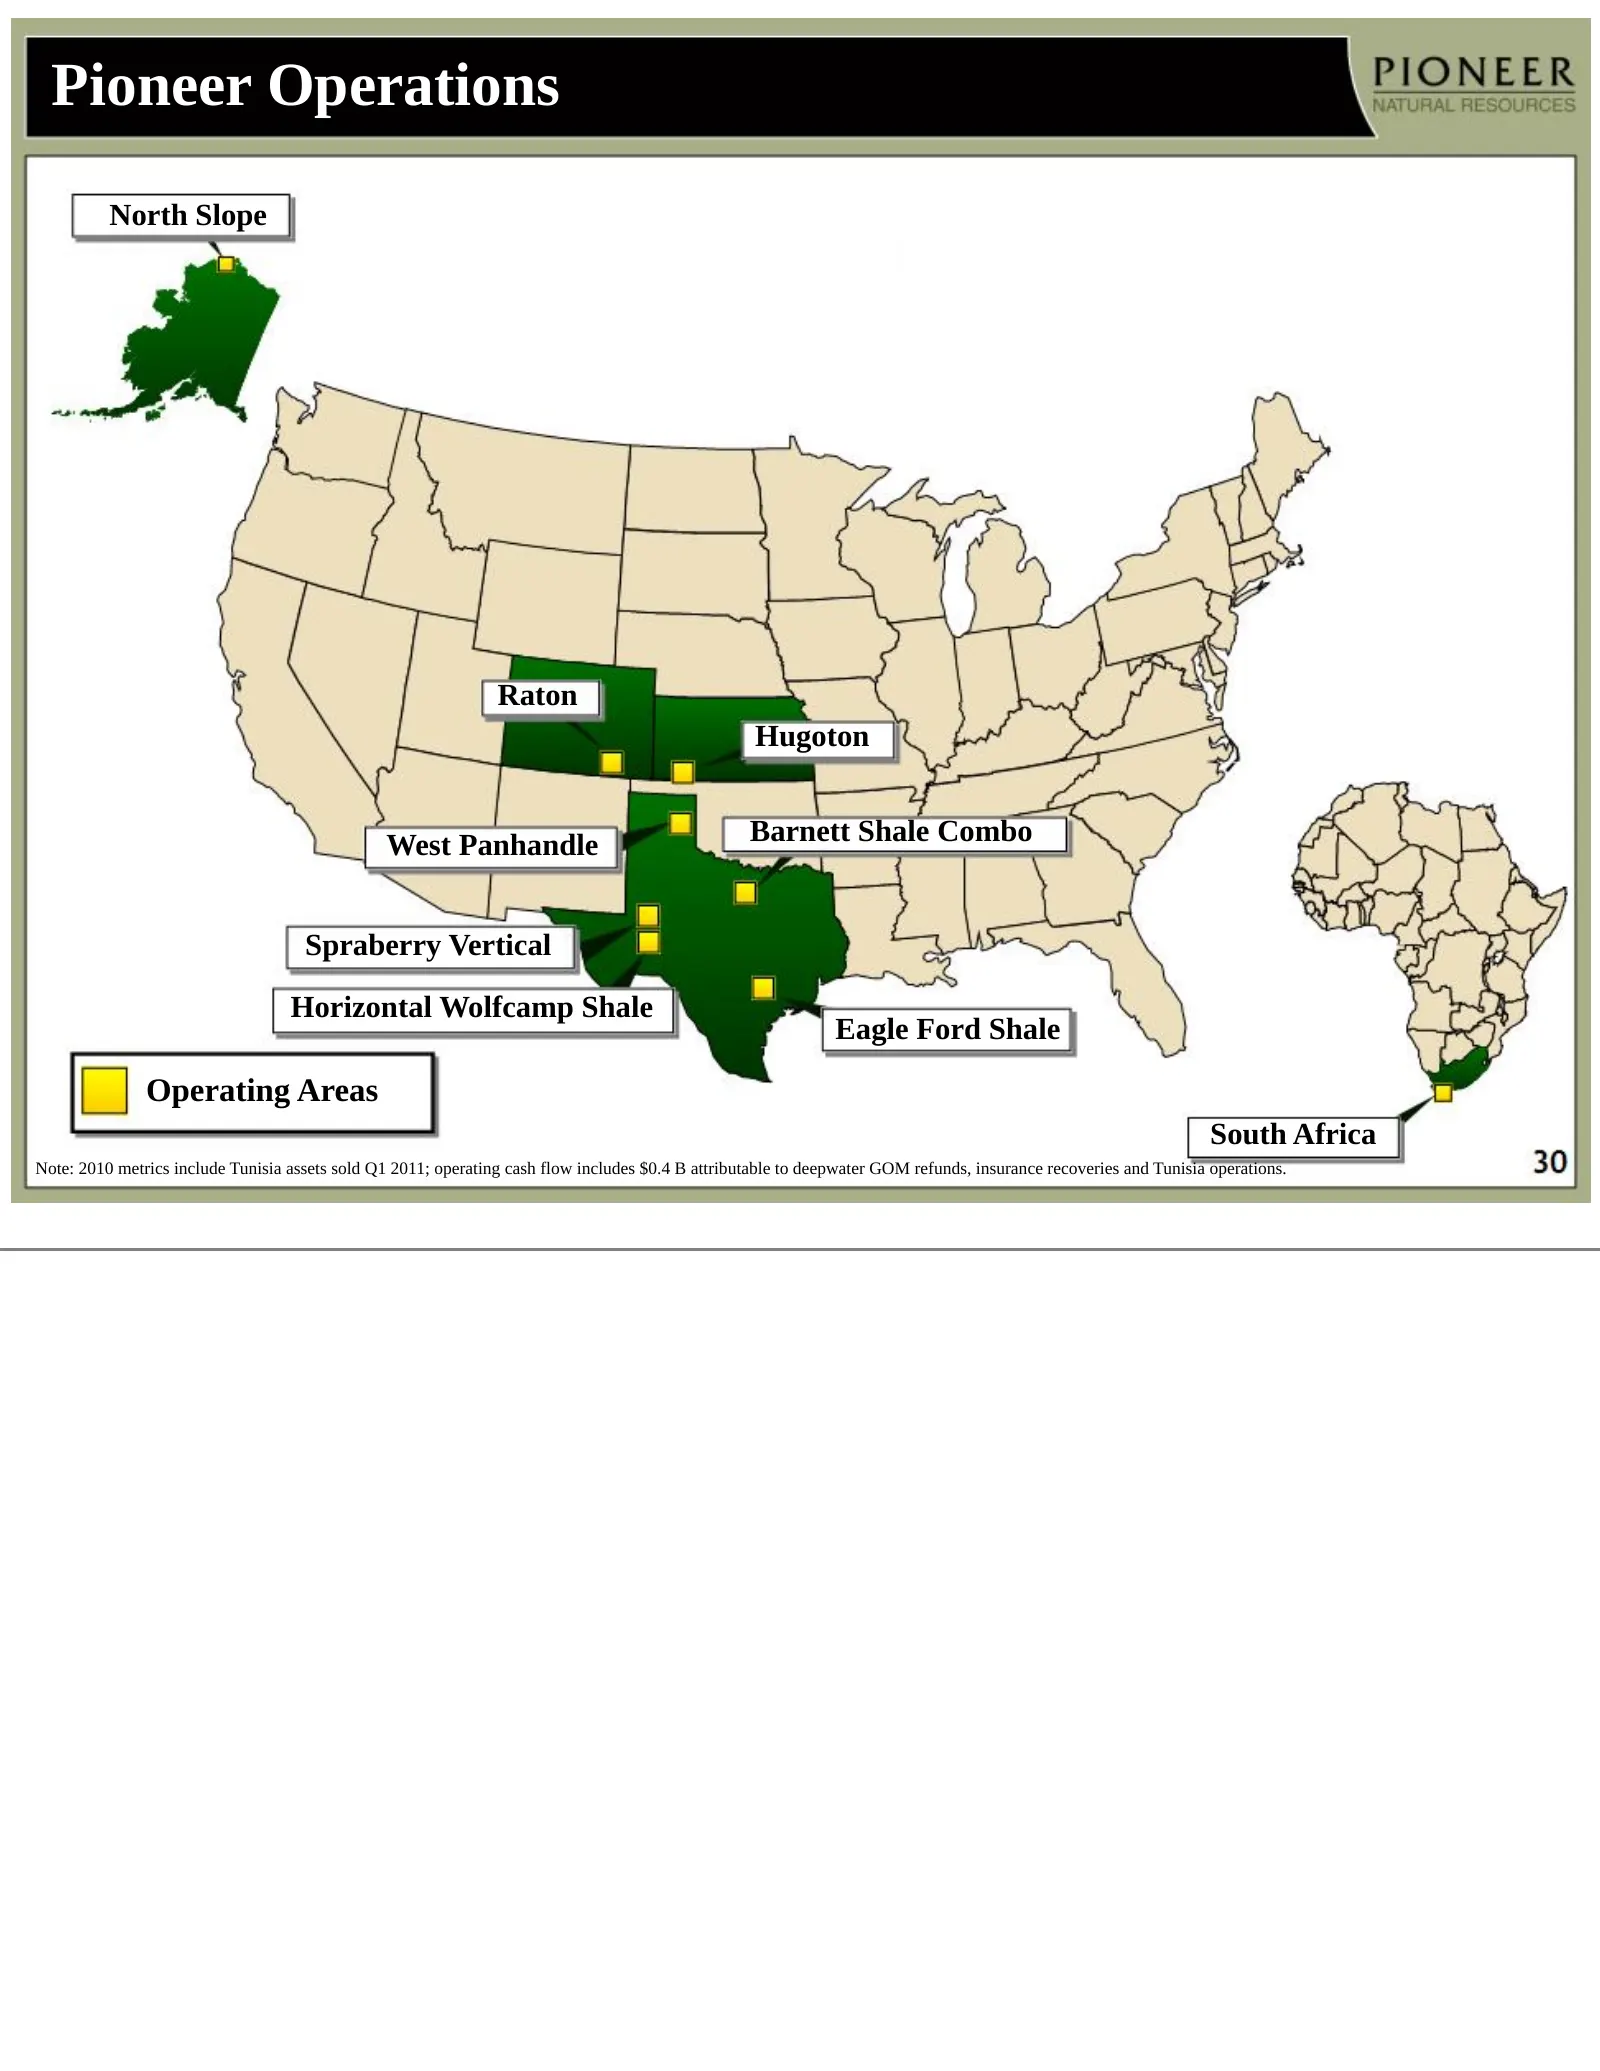
Pioneer Operations North Slope Raton Hugoton West Panhandle Barnett Shale Combo Spraberry Vertical Horizontal Wolfcamp Shale Eagle Ford Shale Operating Areas South Africa Note: 2010 metrics include Tunisia assets sold Q1 2011; operating cash flow includes $0.4 B attributable to deepwater GOM refunds
Slide 31: November Equity Offering Summary
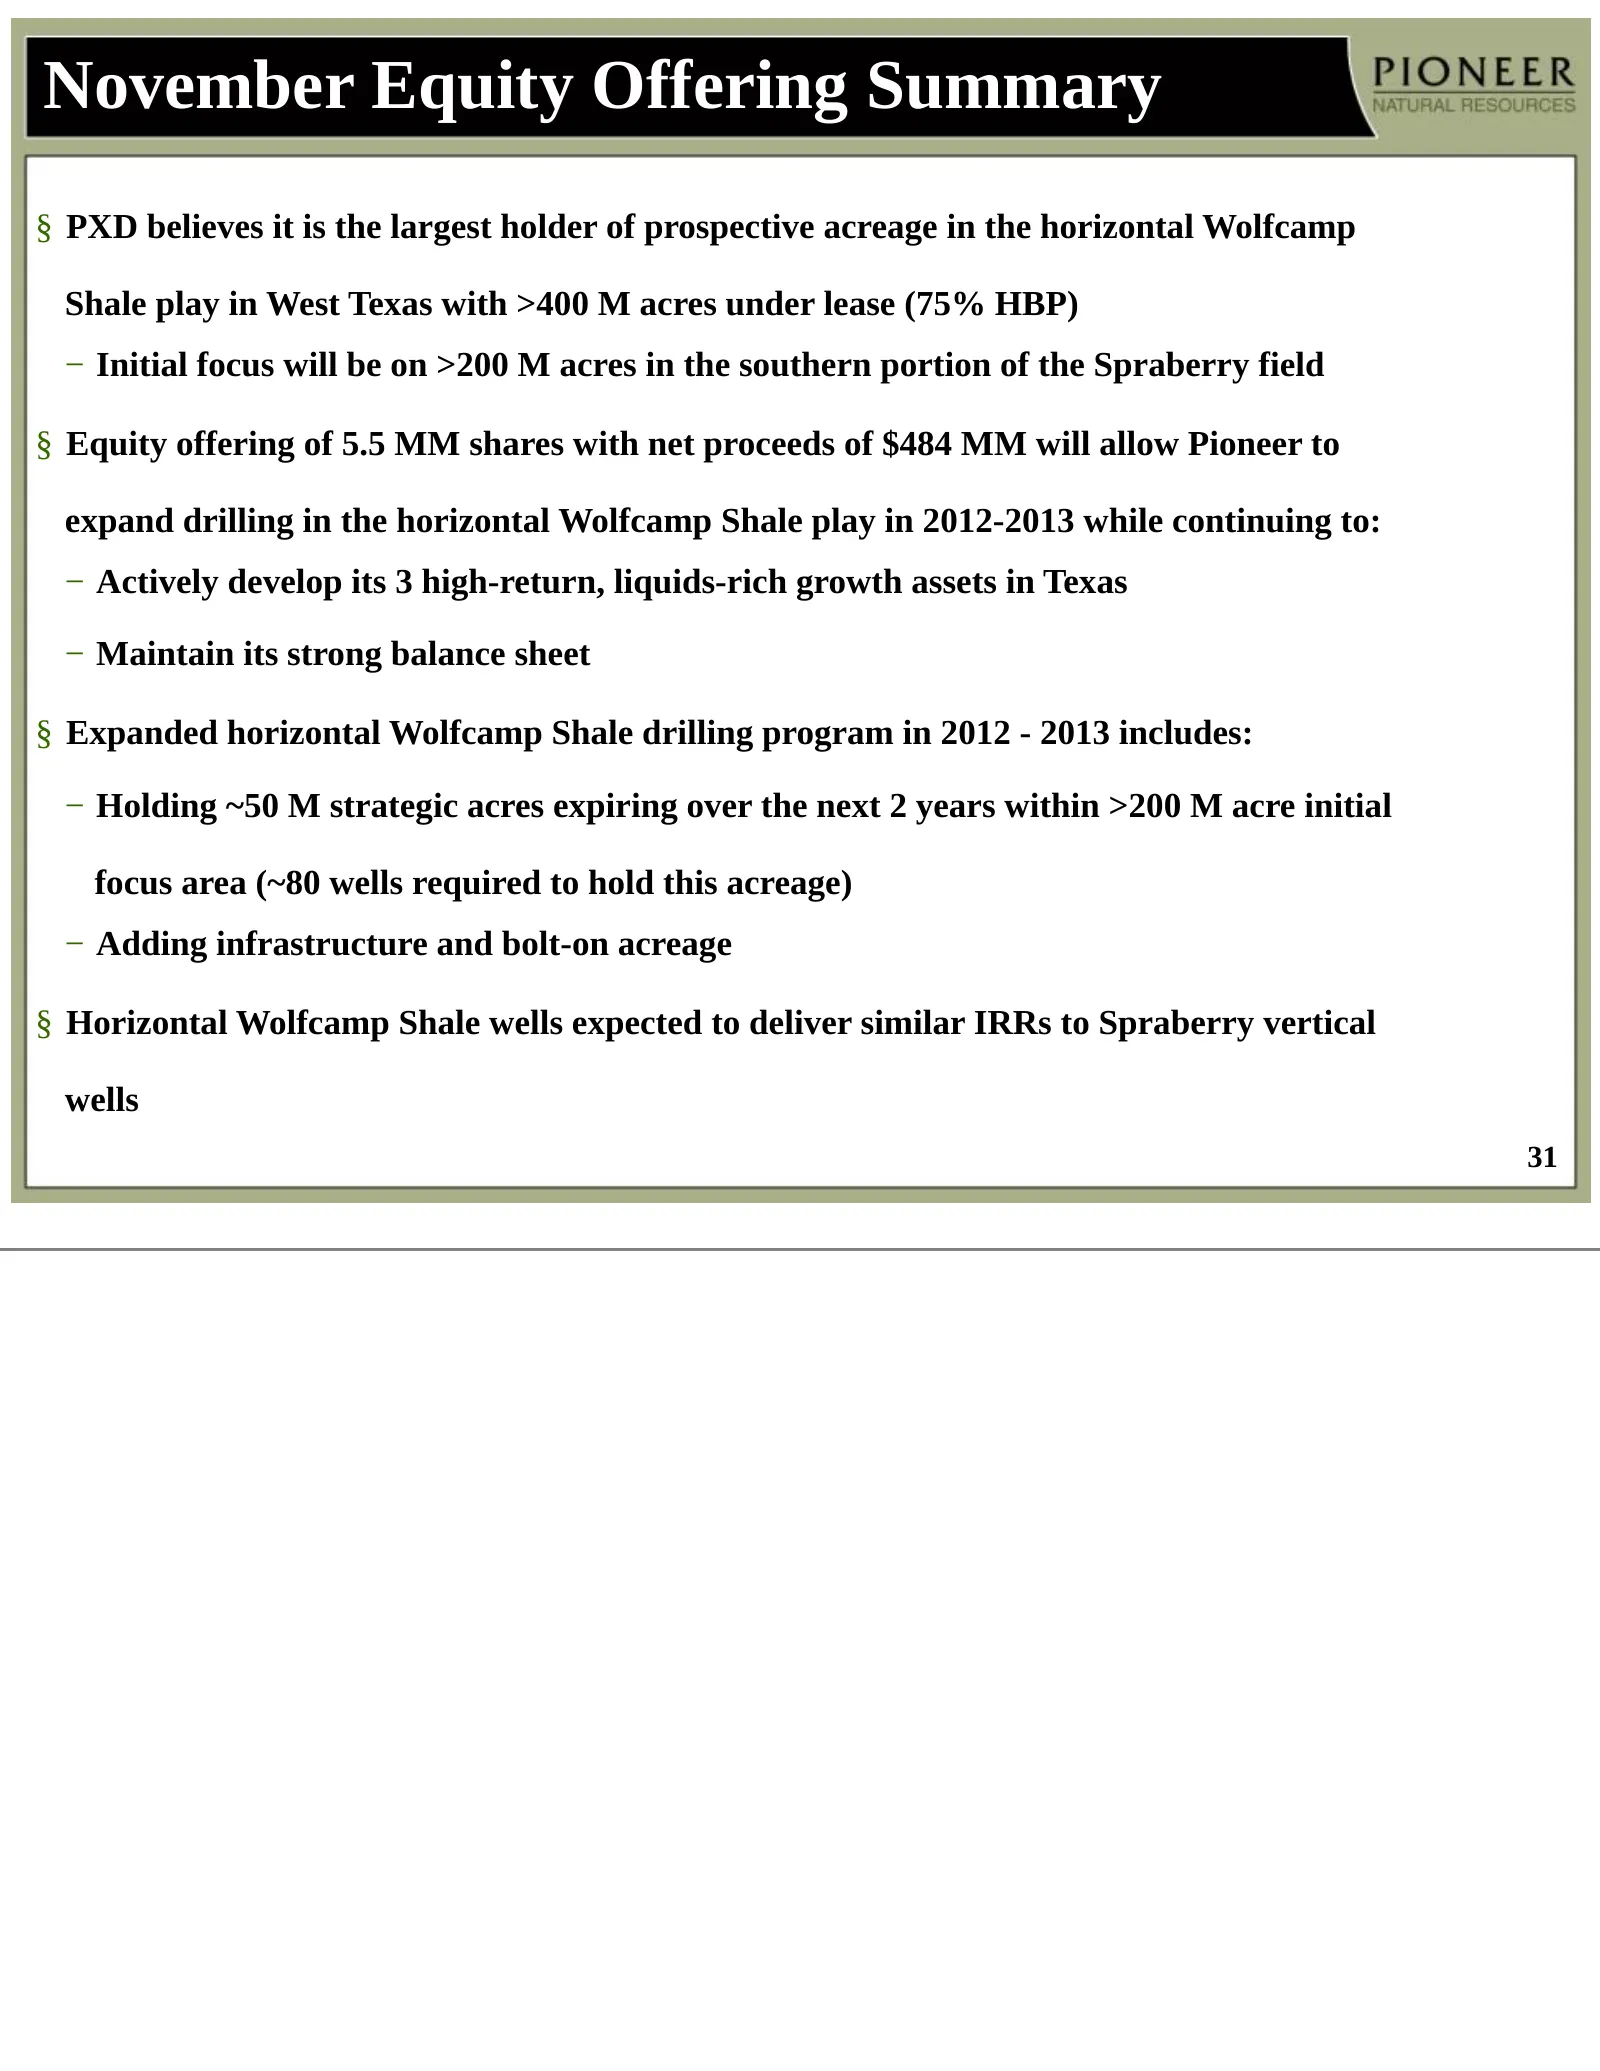
November Equity Offering Summary § PXD believes it is the largest holder of prospective acreage in the horizontal Wolfcamp Shale play in West Texas with >400 M acres under lease (75% HBP) − Initial focus will be on >200 M acres in the southern portion of the Spraberry field § Equity offering of 5.5
Slide 32: Alaska - Oooguruk
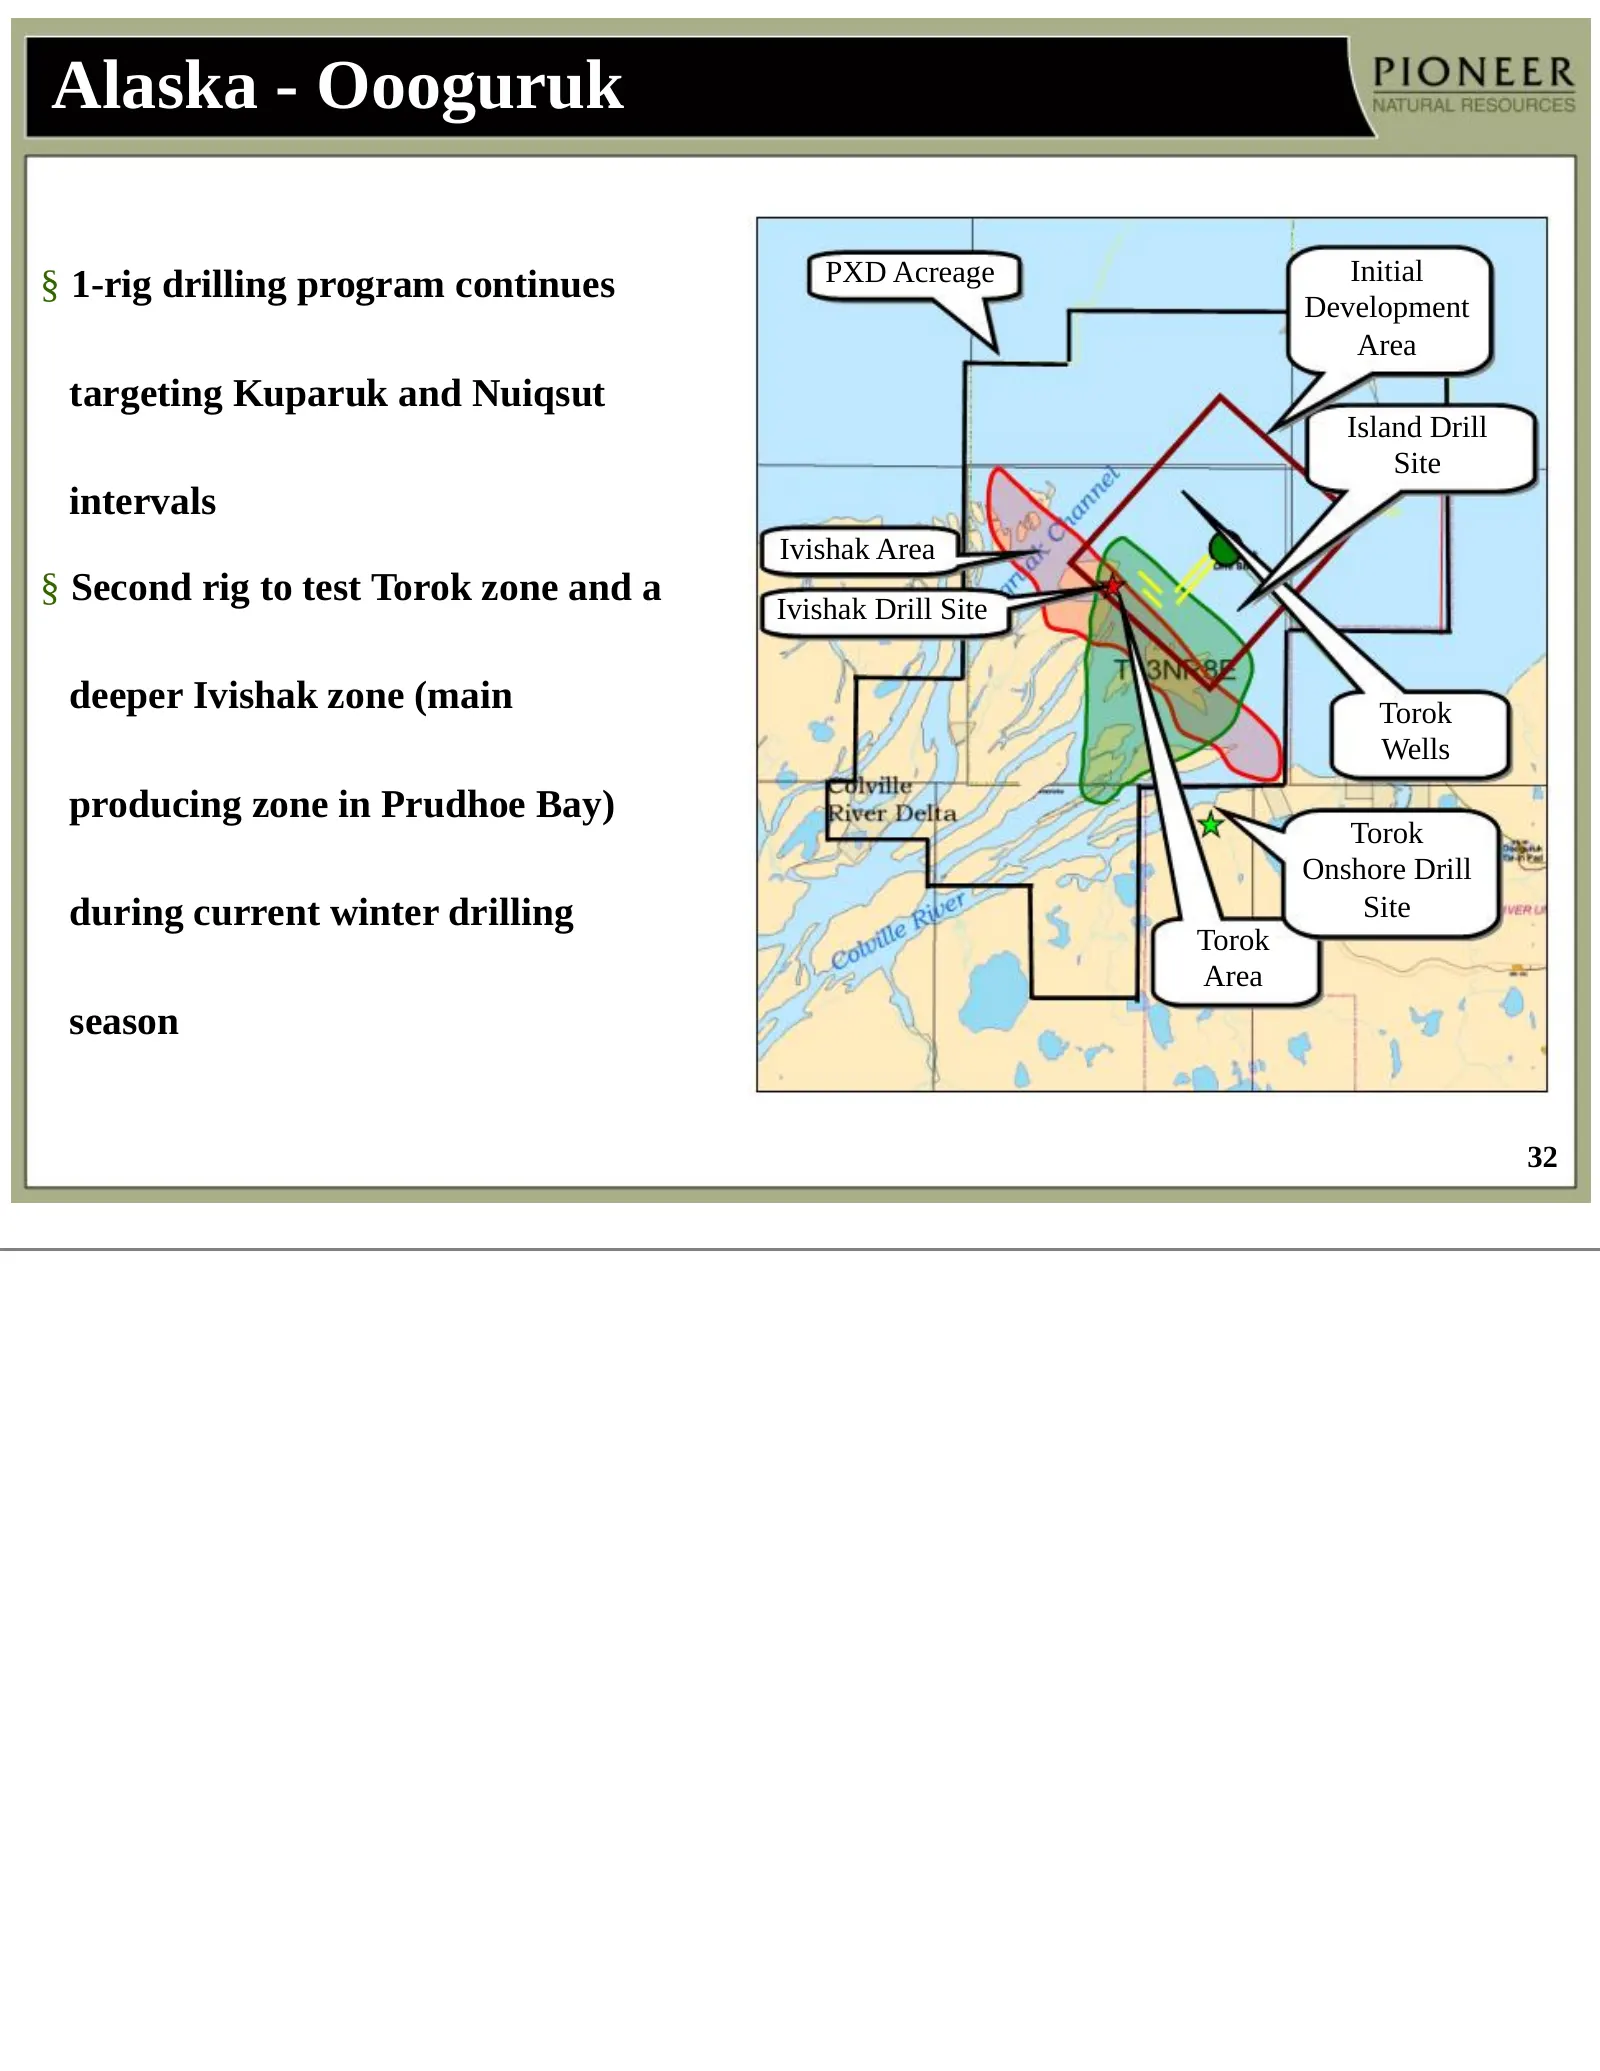
Alaska - Oooguruk PXD Acreage Initial § 1-rig drilling program continues Development Area targeting Kuparuk and Nuiqsut Island Drill Site intervals Ivishak Area § Second rig to test Torok zone and a Ivishak Drill Site deeper Ivishak zone (main Torok Wells producing zone in Prudhoe Bay) Torok Onshore
Slide 33: Production (MBOEPD)
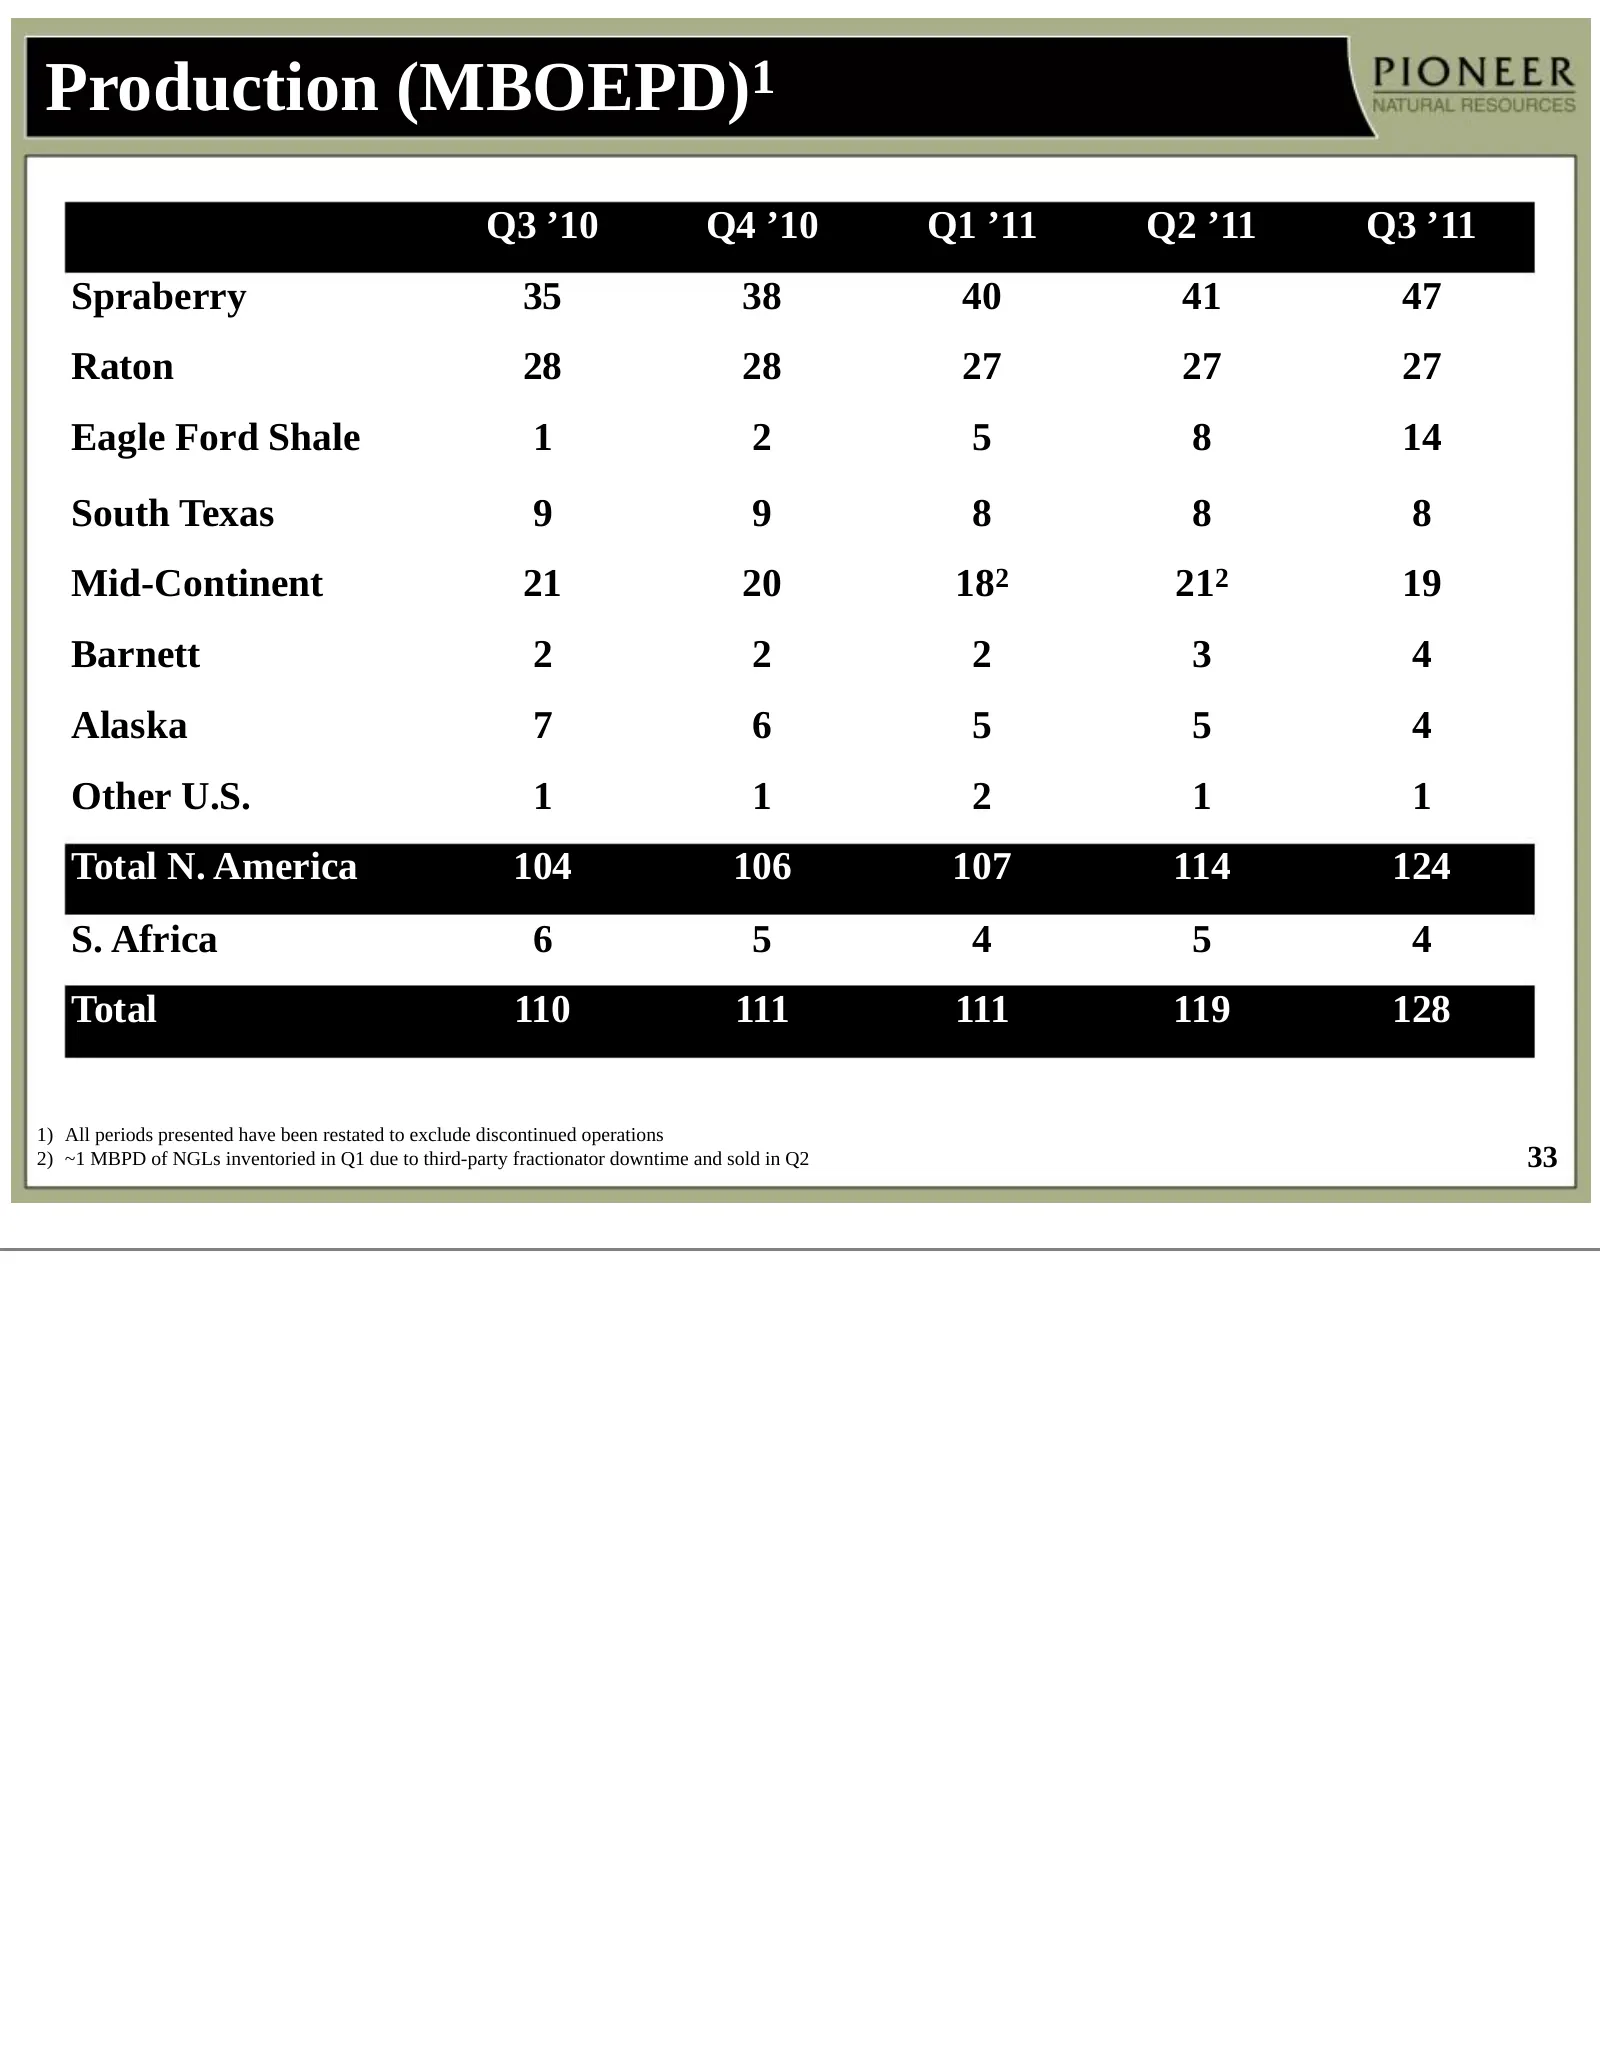
Production (MBOEPD)1 Q3 ’10 Q4 ’10 Q1 ’11 Q2 ’11 Q3 ’11 Spraberry 35 38 40 41 47 Raton 28 28 27 27 27 Eagle Ford Shale 1 2 5 8 14 South Texas 9 9 8 8 8 Mid-Continent 21 20 182 212 19 Barnett 2 2 2 3 4 Alaska 7 6 5 5 4 Other U.S. 1 1 2 1 1 Total N. America 104 106 107 114 124 S. Africa 6 5 4 5 4 Tota
Slide 34: Production (MBOEPD)
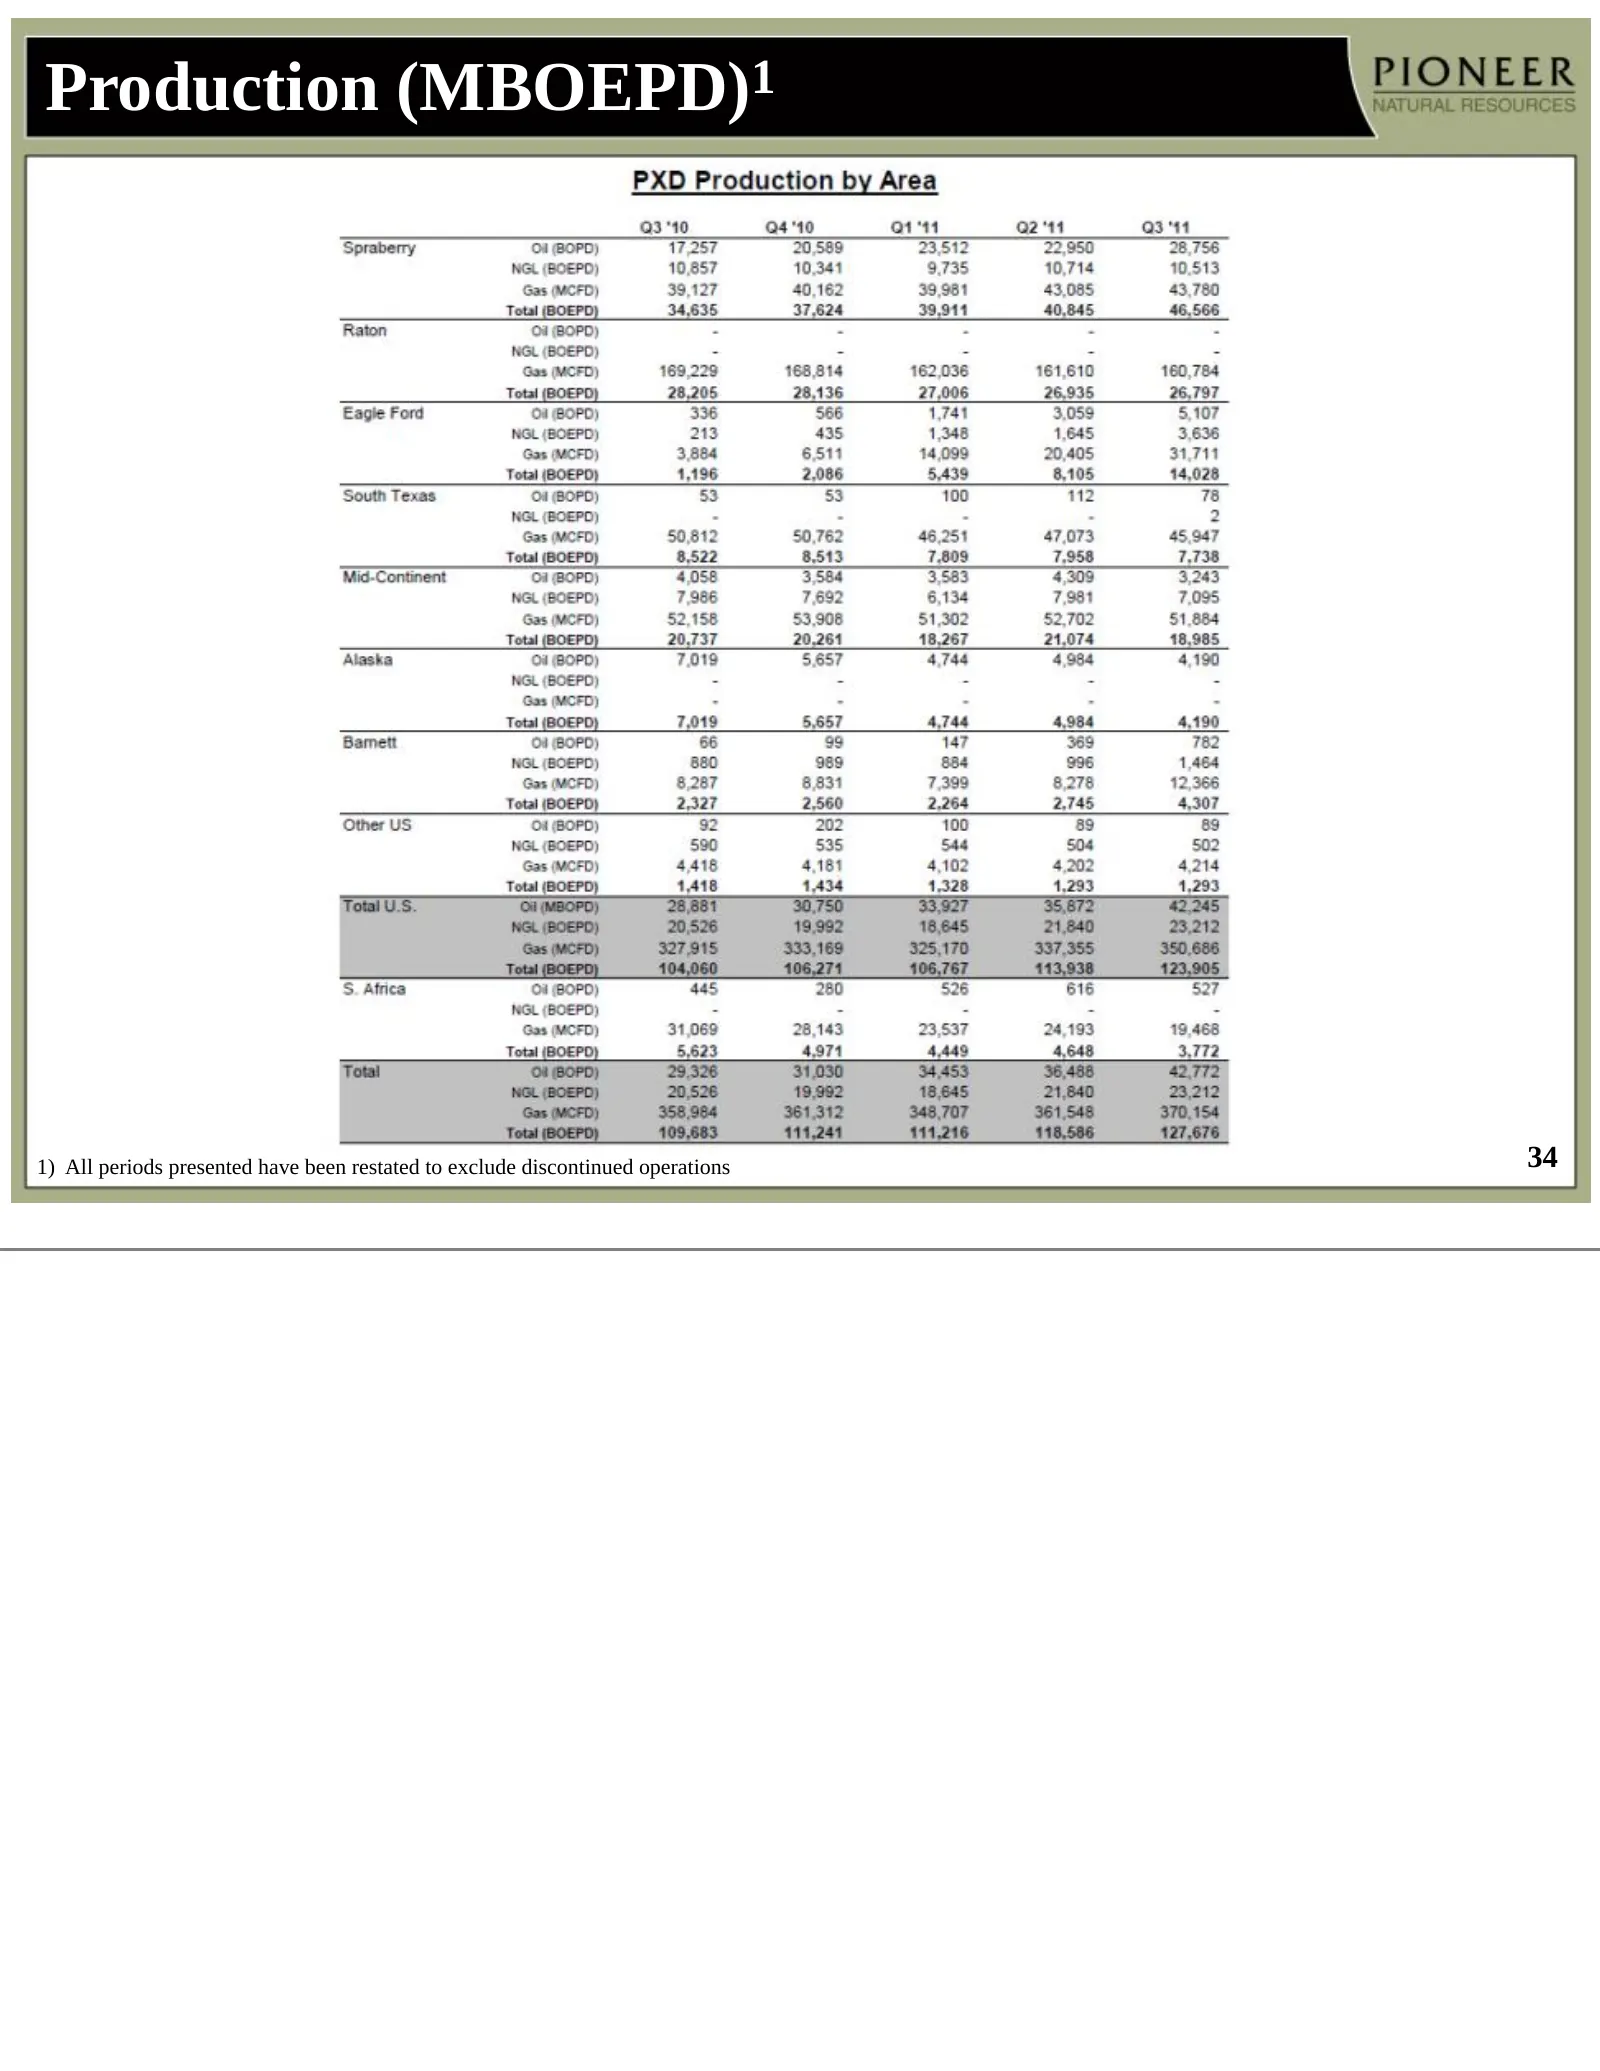
Production (MBOEPD)1 1) All periods presented have been restated to exclude discontinued operations 34
Slide 35: Production Costs (per BOE)
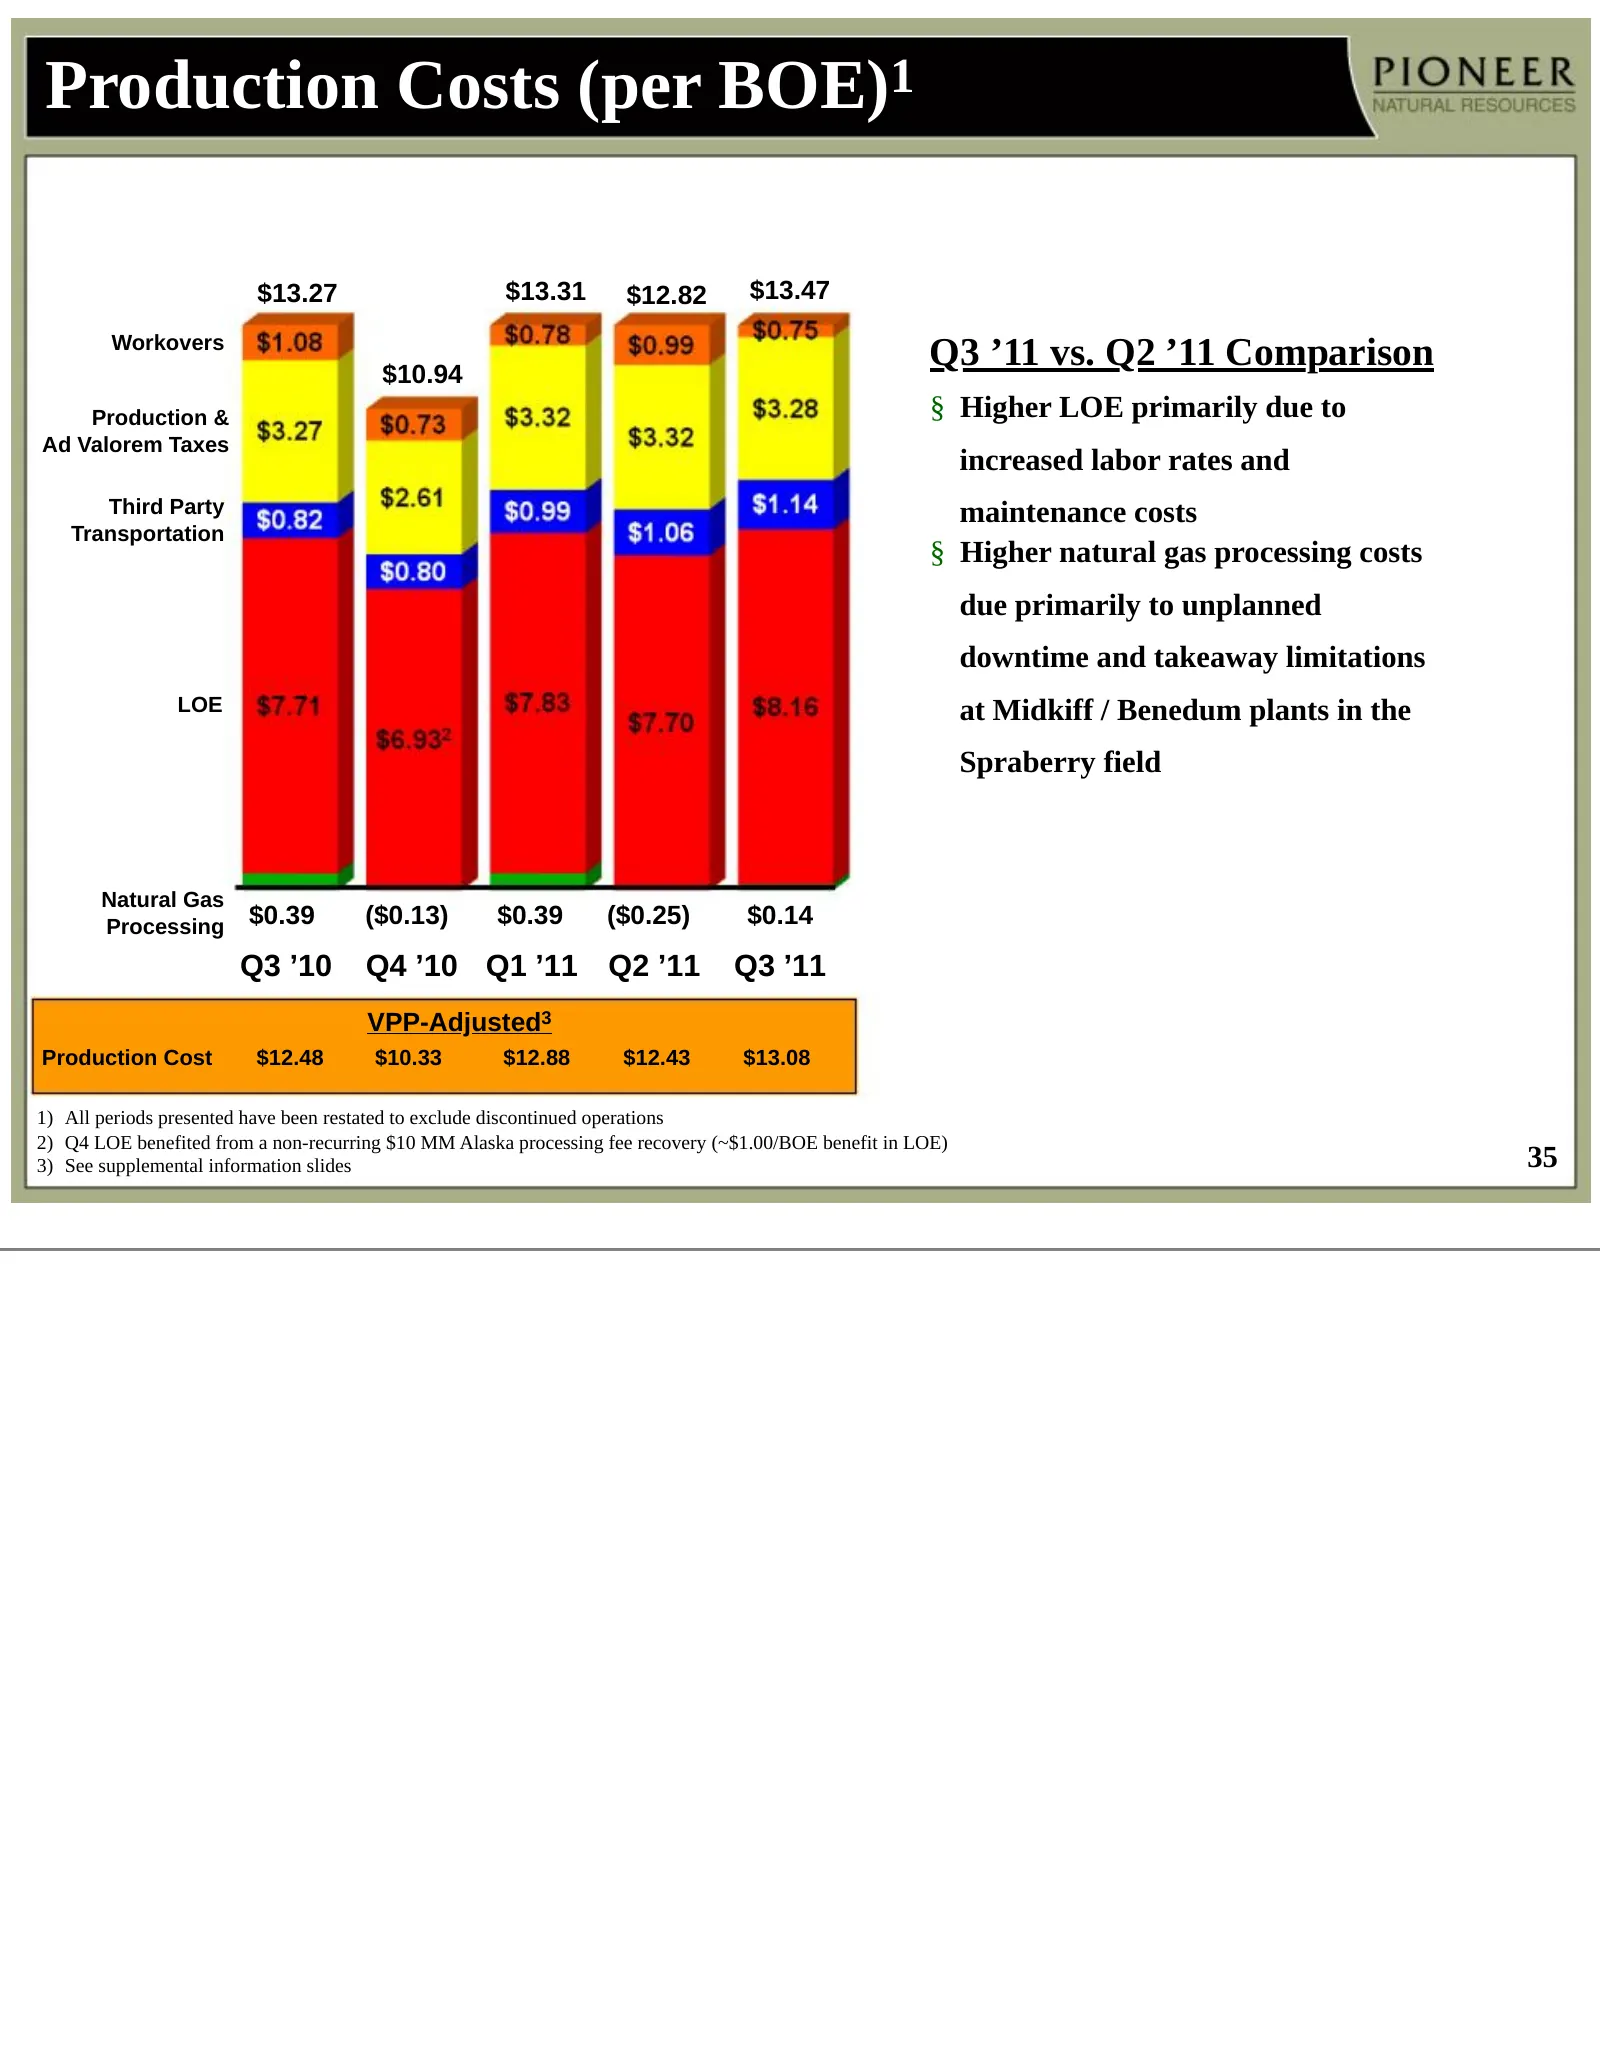
Production Costs (per BOE)1 $13.27 $13.31 $12.82 $13.47 Workovers $10.94 Q3 ’11 vs. Q2 ’11 Comparison Production & § Higher LOE primarily due to Ad Valorem Taxes increased labor rates and Third Party maintenance costs Transportation § Higher natural gas processing costs due primarily to unplanned do
Slide 36: VPP - Adjusted Production Costs
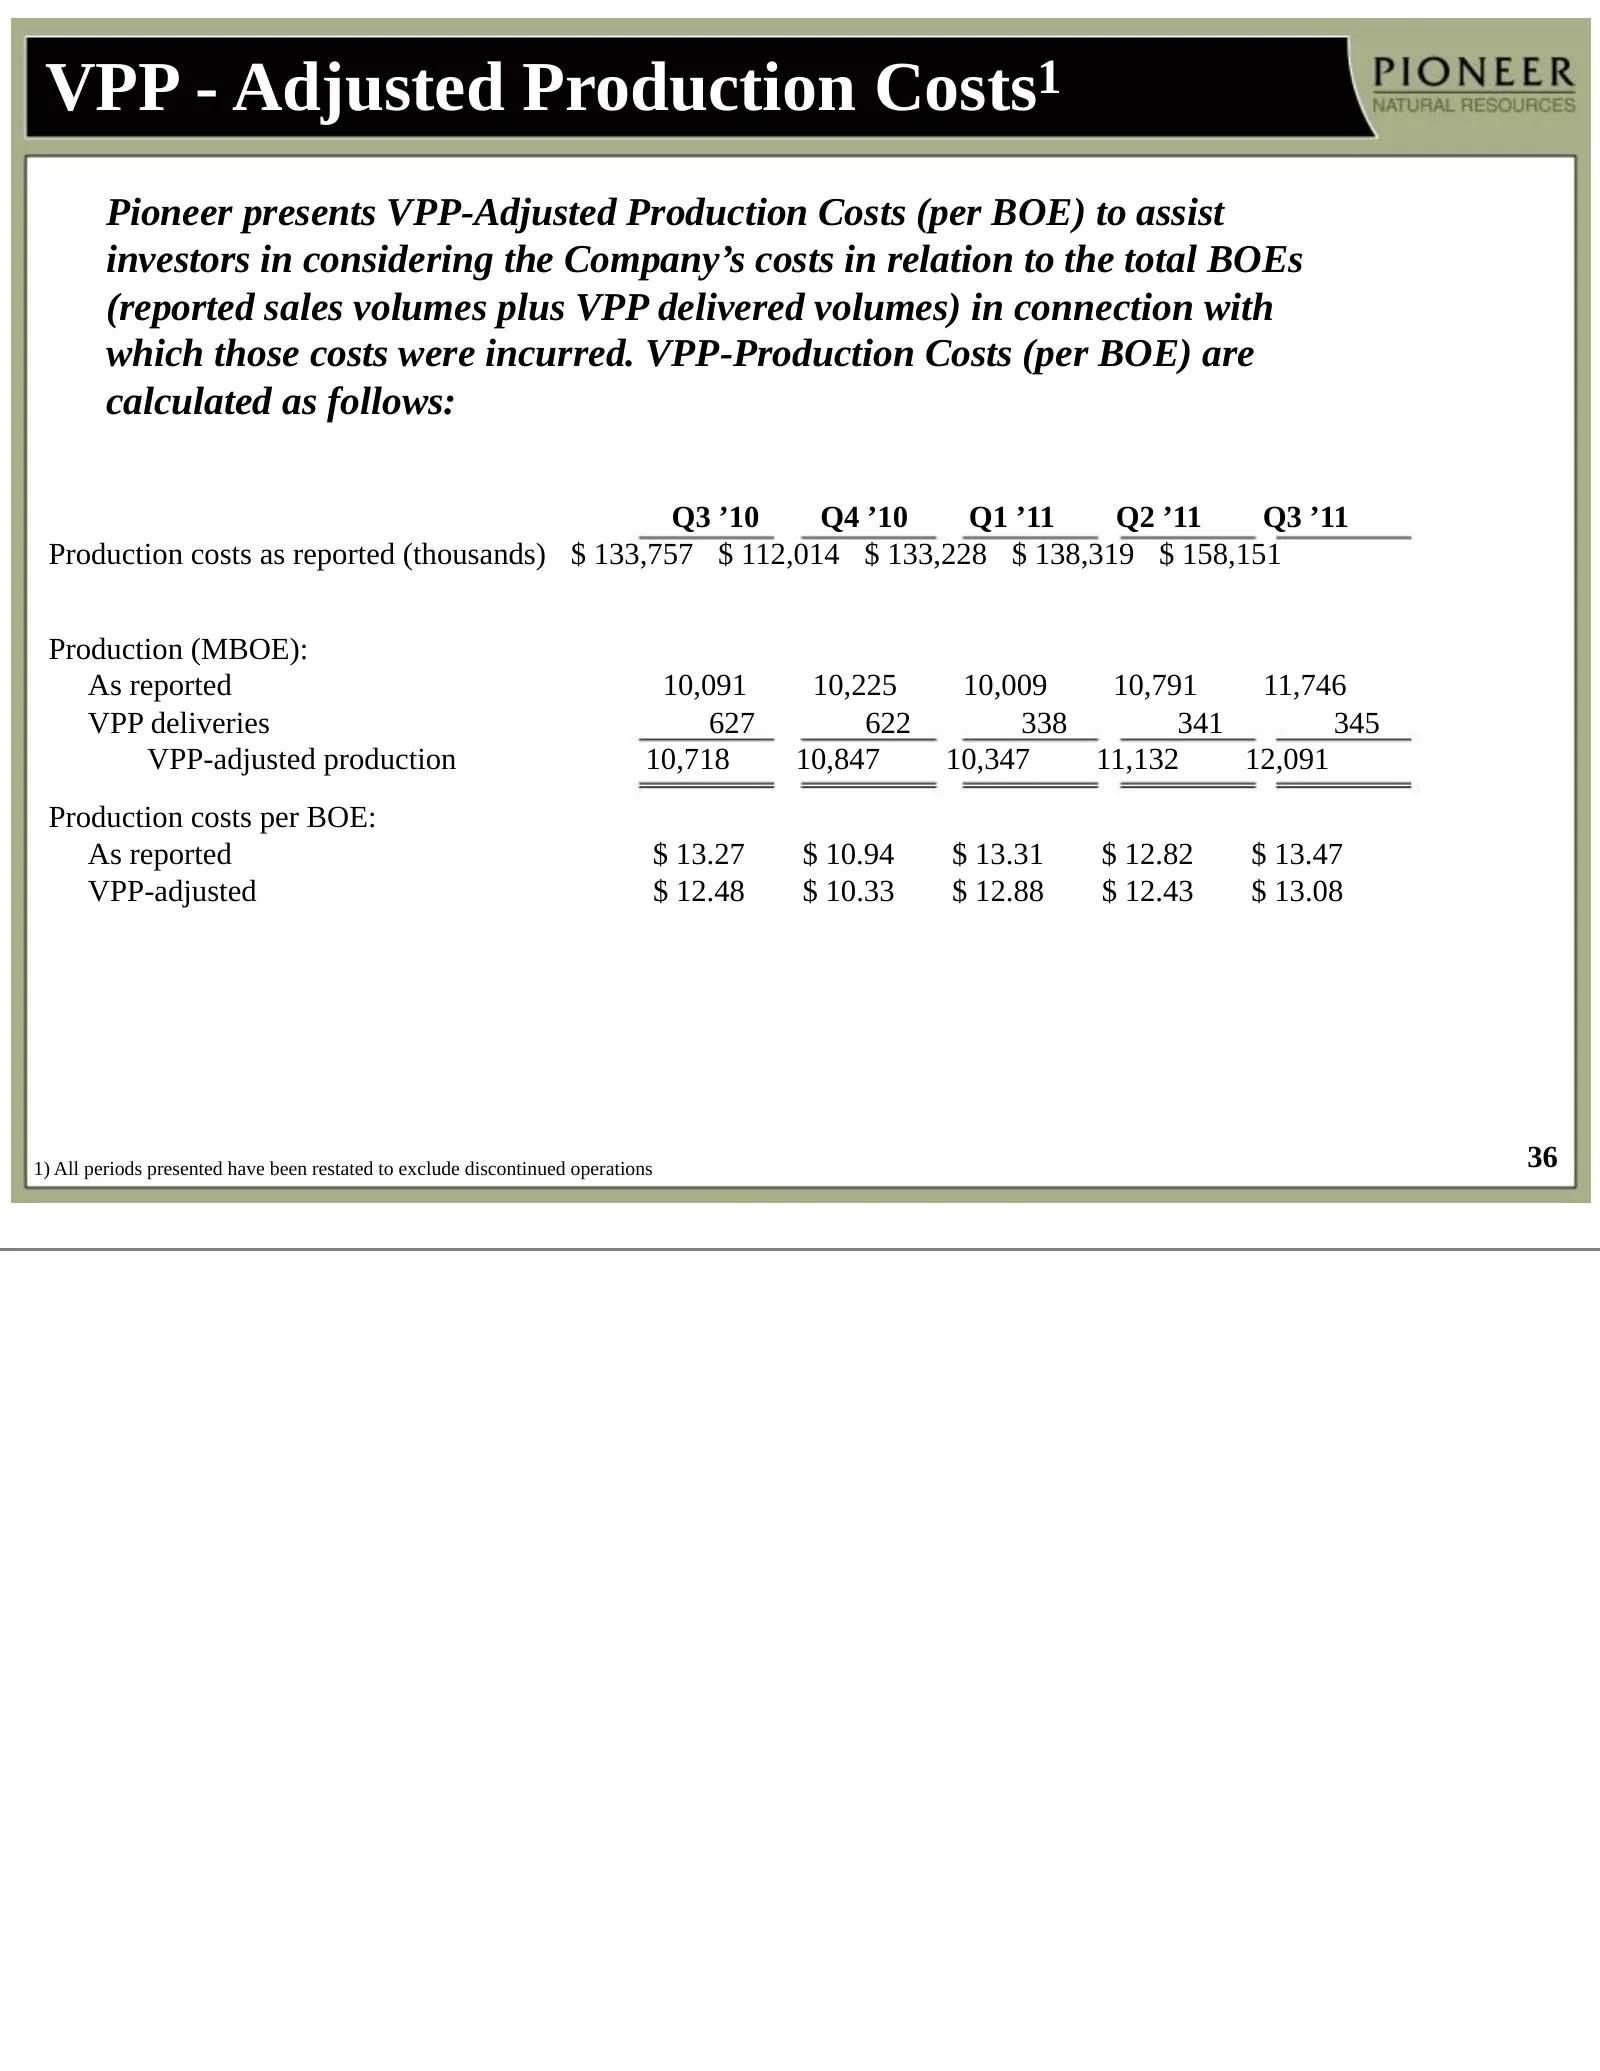
VPP - Adjusted Production Costs1 Pioneer presents VPP-Adjusted Production Costs (per BOE) to assist investors in considering the Company’s costs in relation to the total BOEs (reported sales volumes plus VPP delivered volumes) in connection with which those costs were incurred. VPP-Production Costs
Slide 37: PXD Cash Costs vs. Peers For First 9 Months of 2011
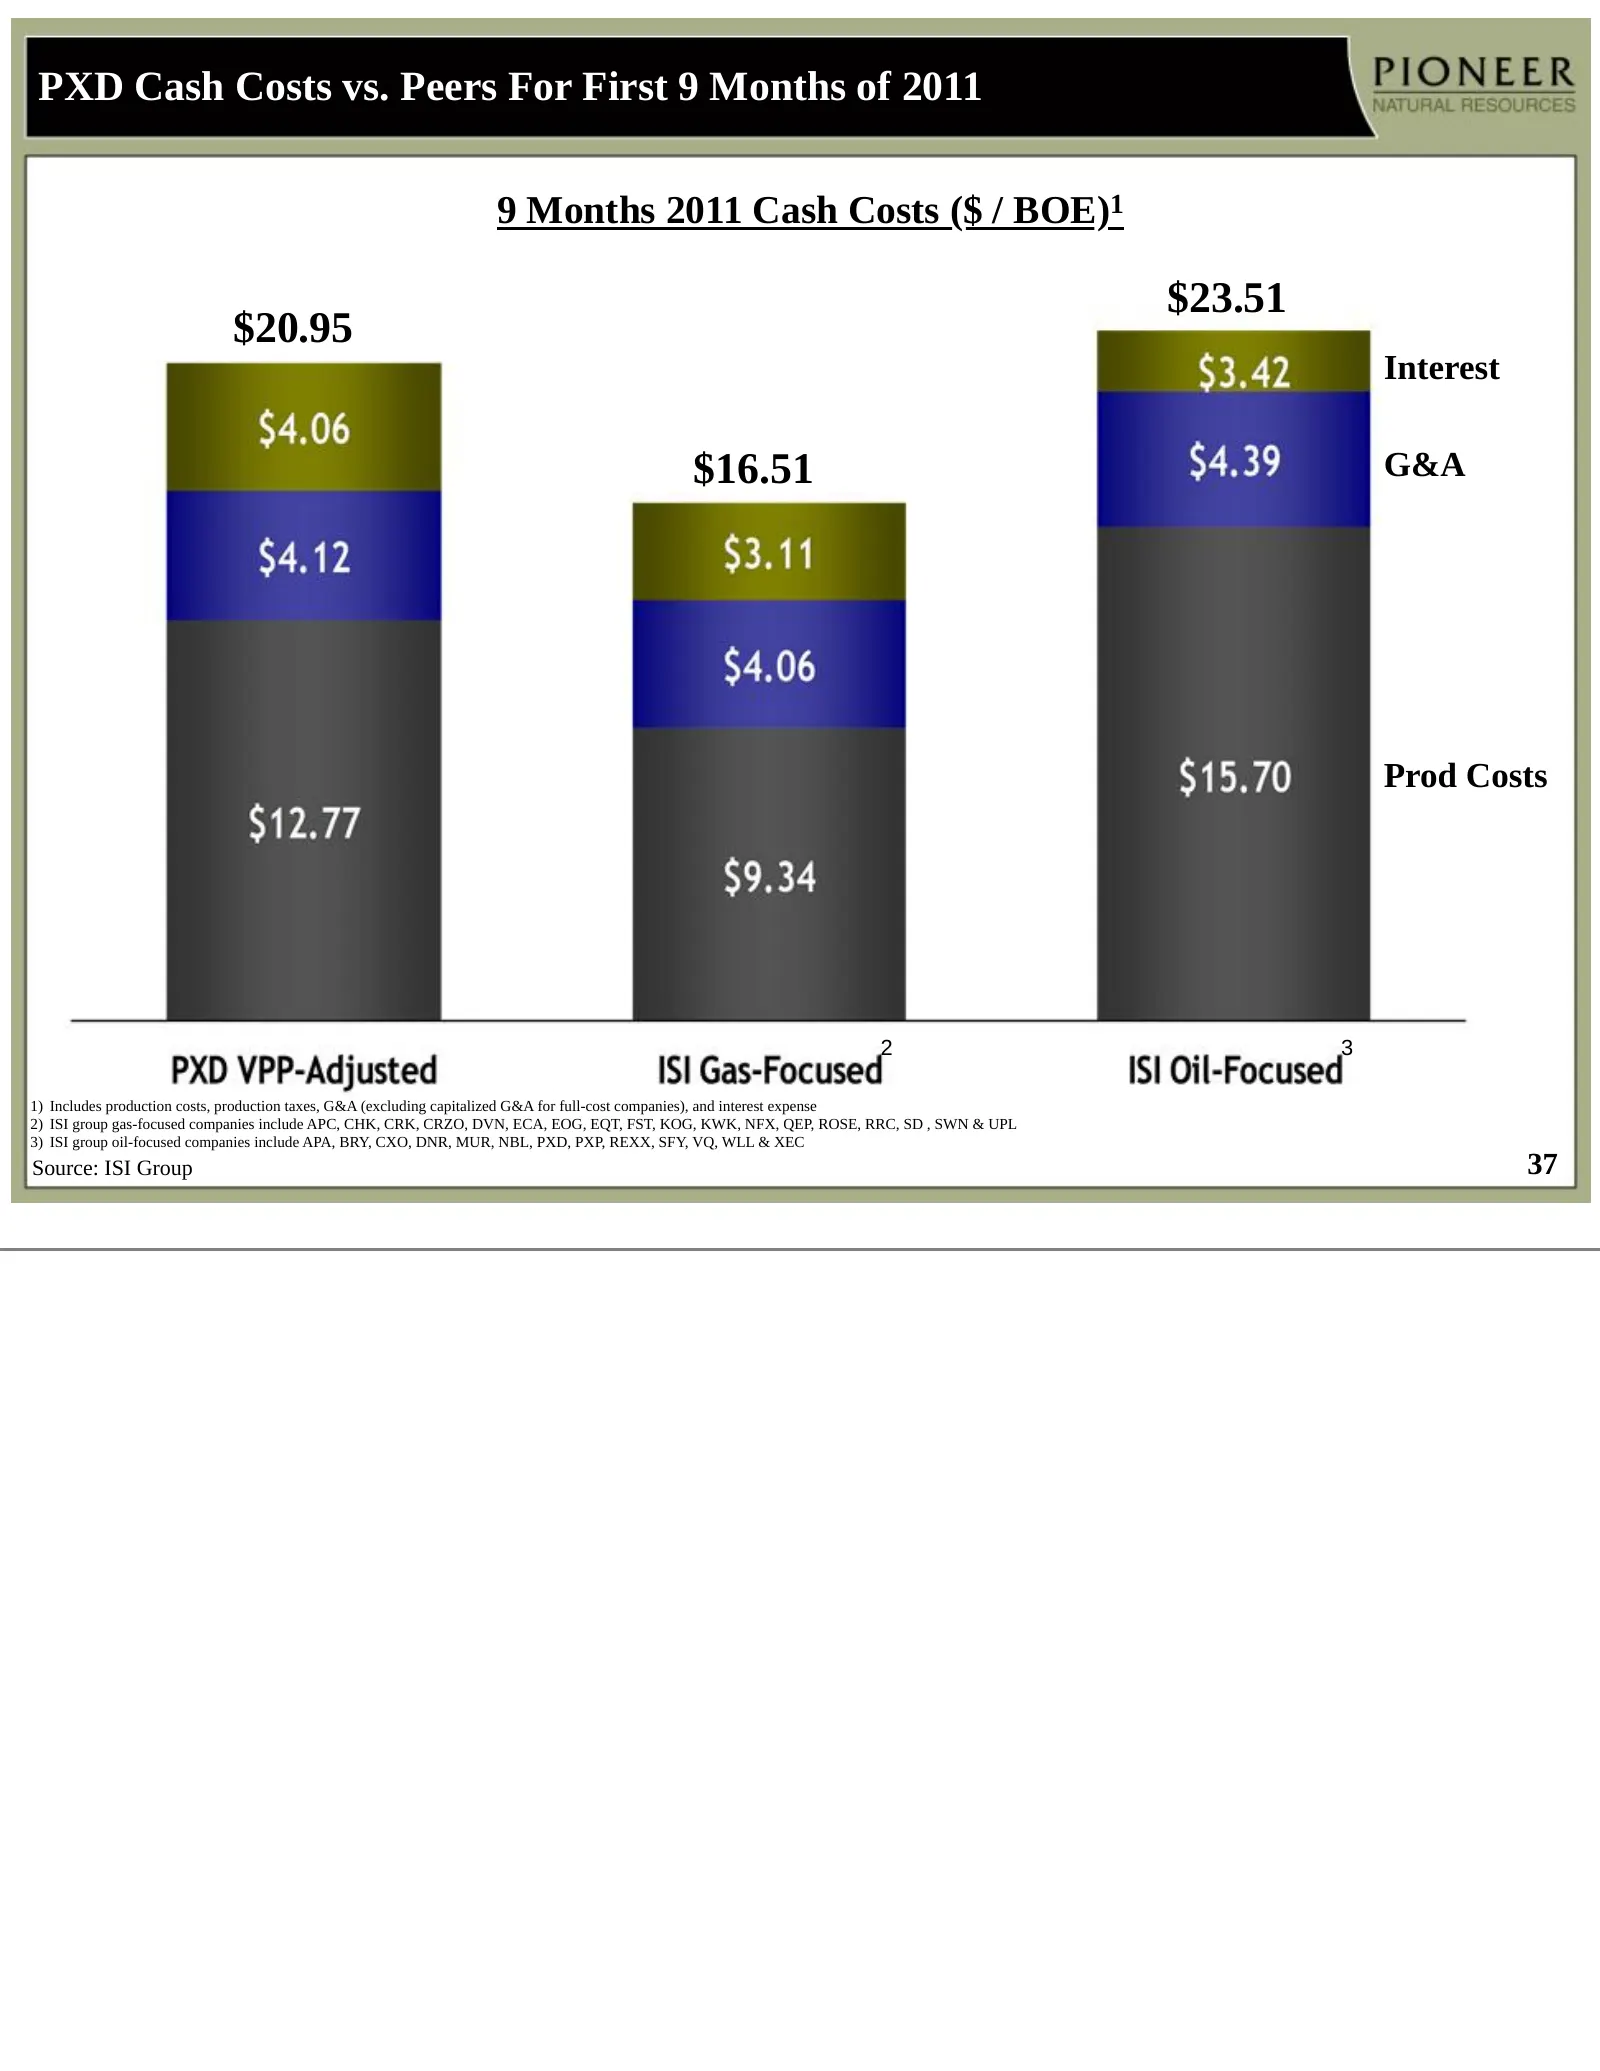
PXD Cash Costs vs. Peers For First 9 Months of 2011 9 Months 2011 Cash Costs ($ / BOE)1 $23.51 $20.95 Interest $16.51 G&A Prod Costs 2 3 1) Includes production costs, production taxes, G&A (excluding capitalized G&A for full-cost companies), and interest expense 2) ISI group gas-focused companies in
Slide 38: PSE Derivative Position as of 1/4/2012
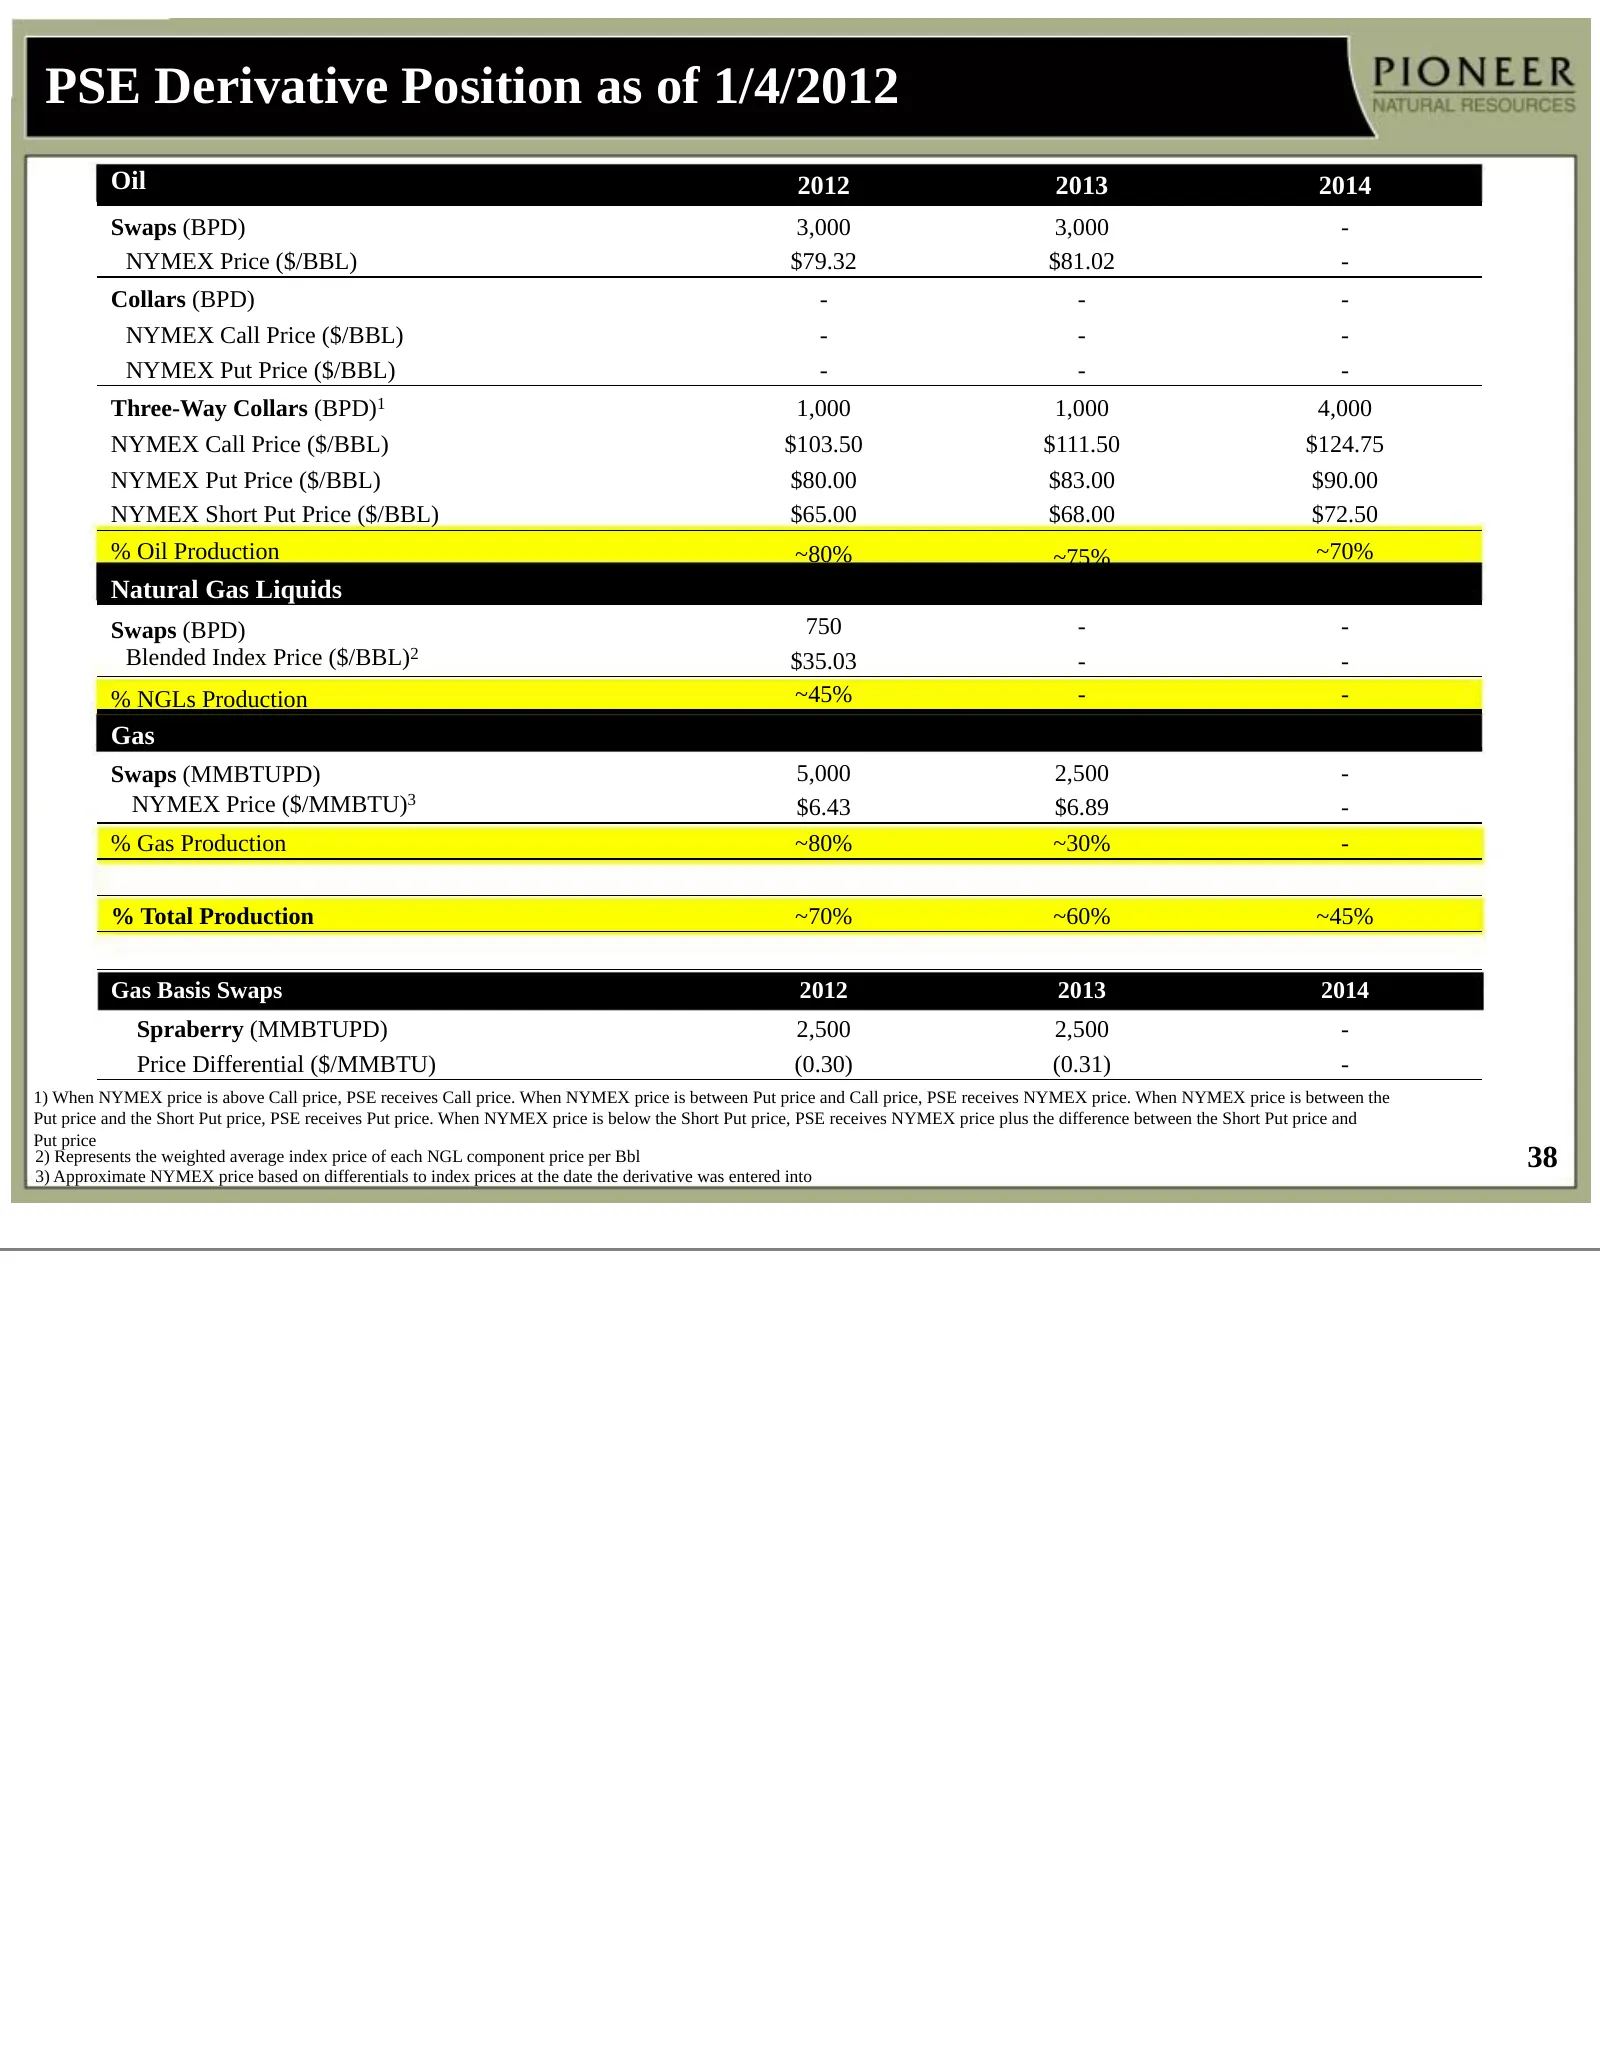
PSE Derivative Position as of 1/4/2012 Oil 2012 2013 2014 Swaps (BPD) 3,000 3,000 - NYMEX Price ($/BBL) $79.32 $81.02 - Collars (BPD) - - - NYMEX Call Price ($/BBL) - - - NYMEX Put Price ($/BBL) - - - Three-Way Collars (BPD)1 1,000 1,000 4,000 NYMEX Call Price ($/BBL) $103.50 $111.50 $124.75 NYMEX P
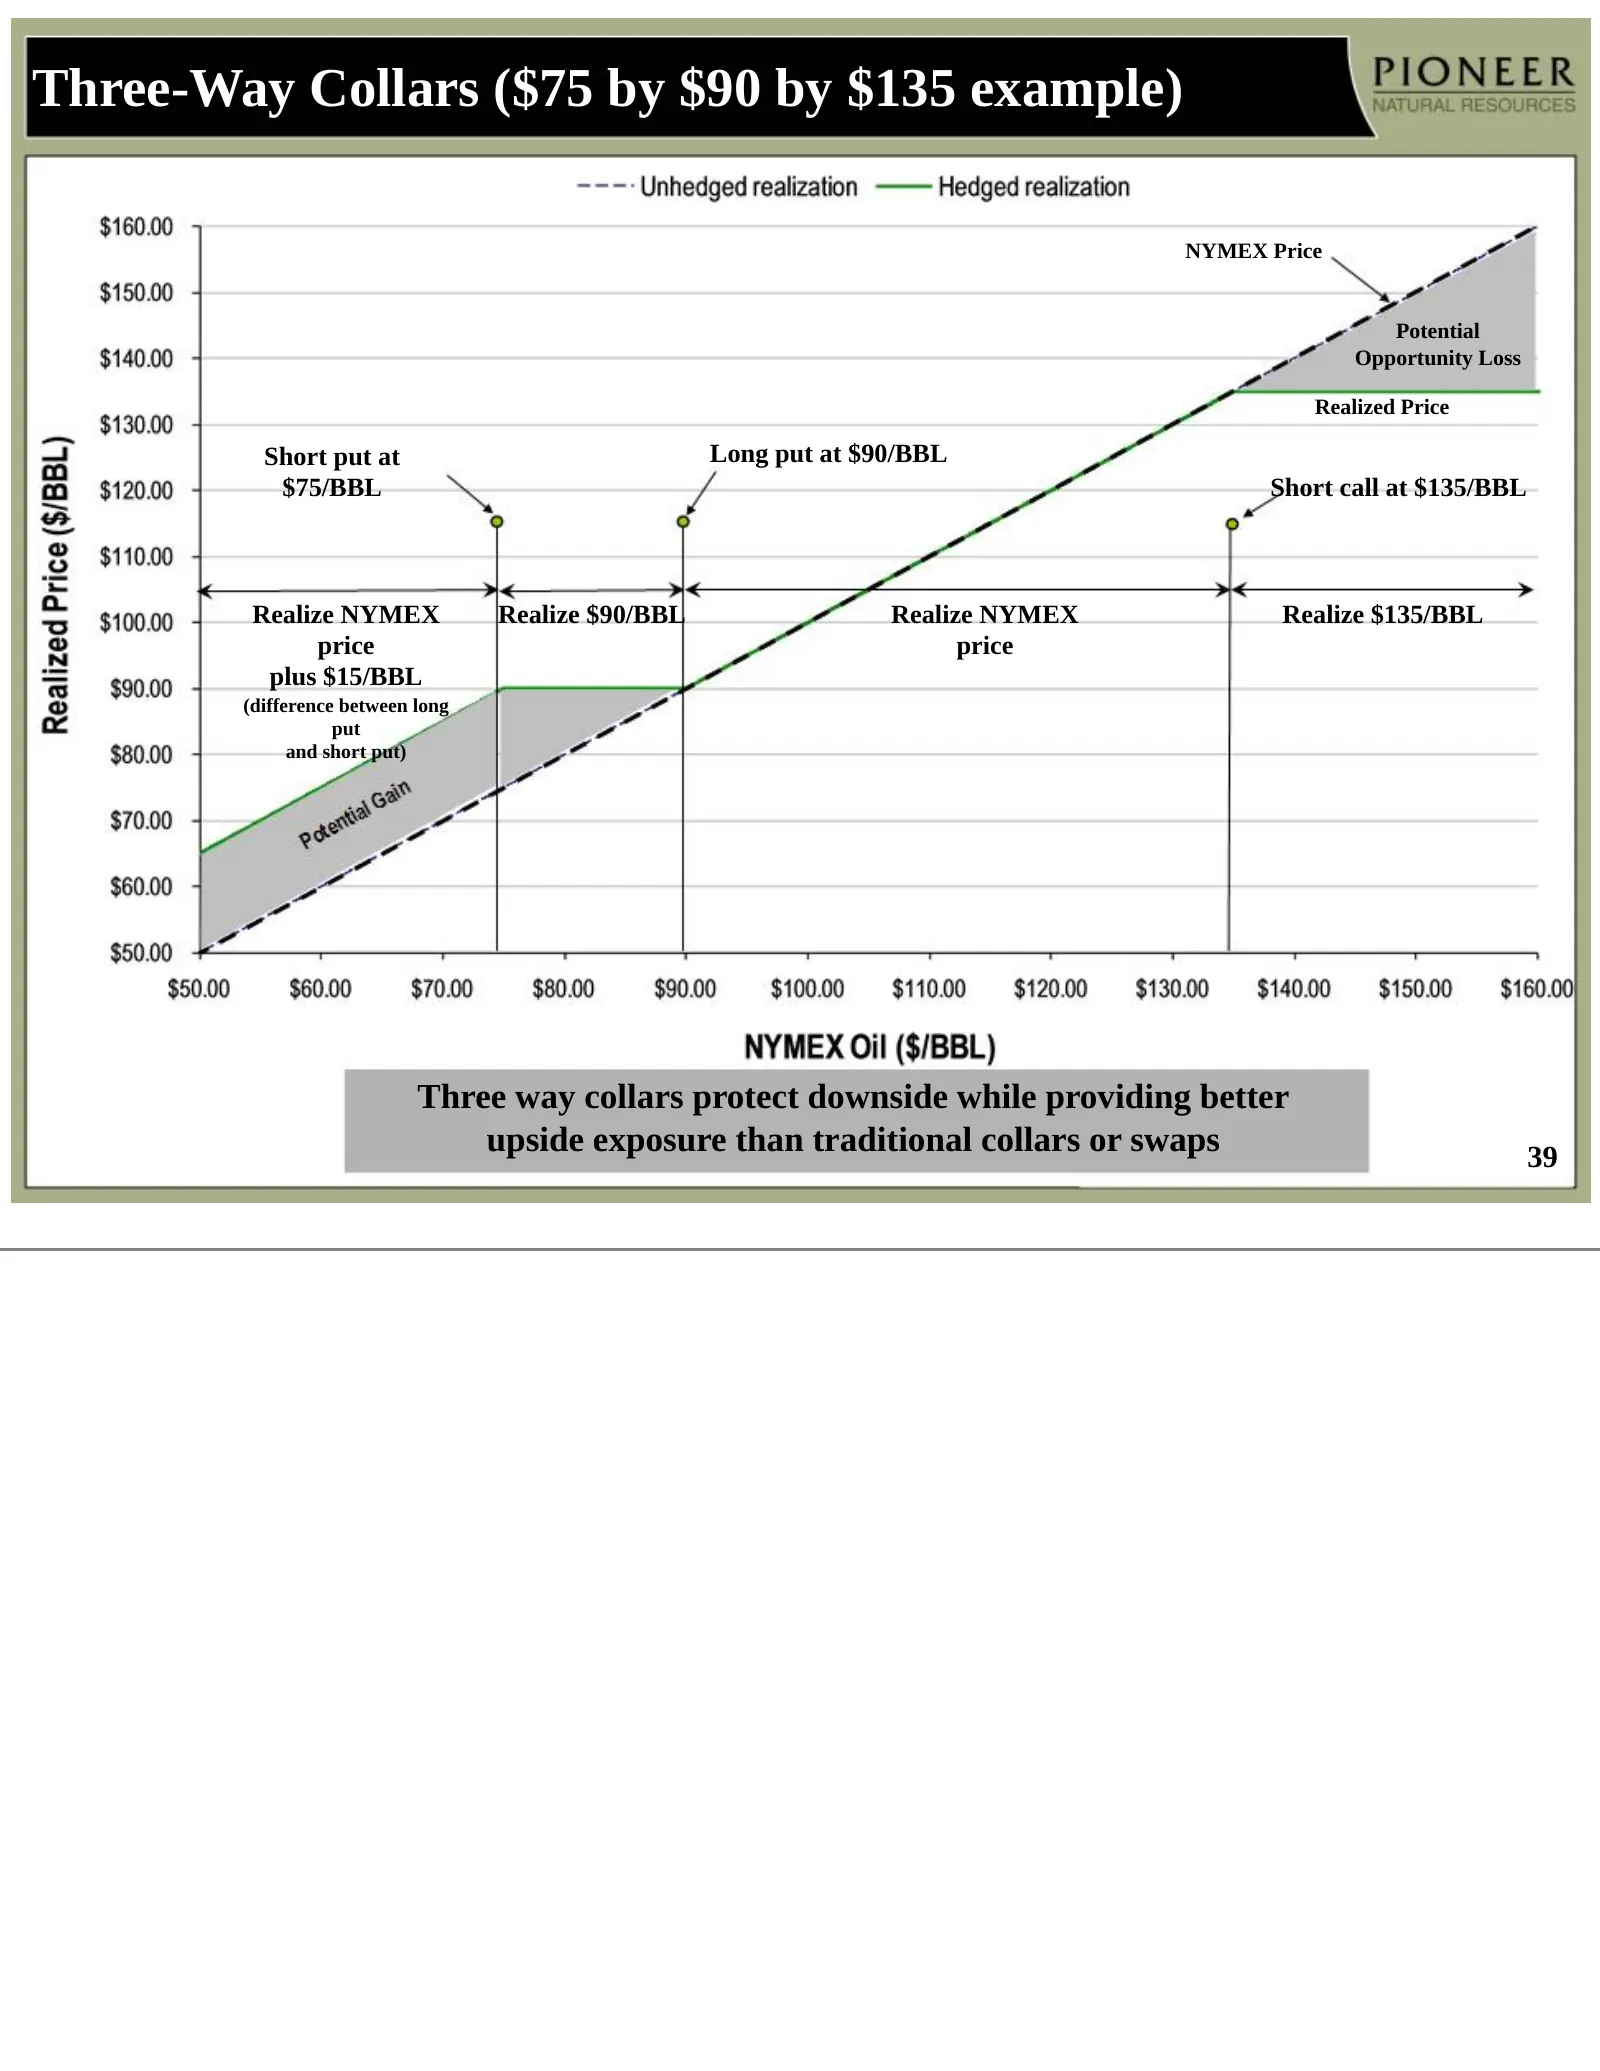
Slide 39: Three-Way Collars ($75 by $90 by $135 example)
Three-Way Collars ($75 by $90 by $135 example) NYMEX Price Potential Opportunity Loss Realized Price Short put at Long put at $90/BBL $75/BBL Short call at $135/BBL Realize NYMEX Realize $90/BBL Realize NYMEX Realize $135/BBL price price plus $15/BBL (difference between long put and short put) Three
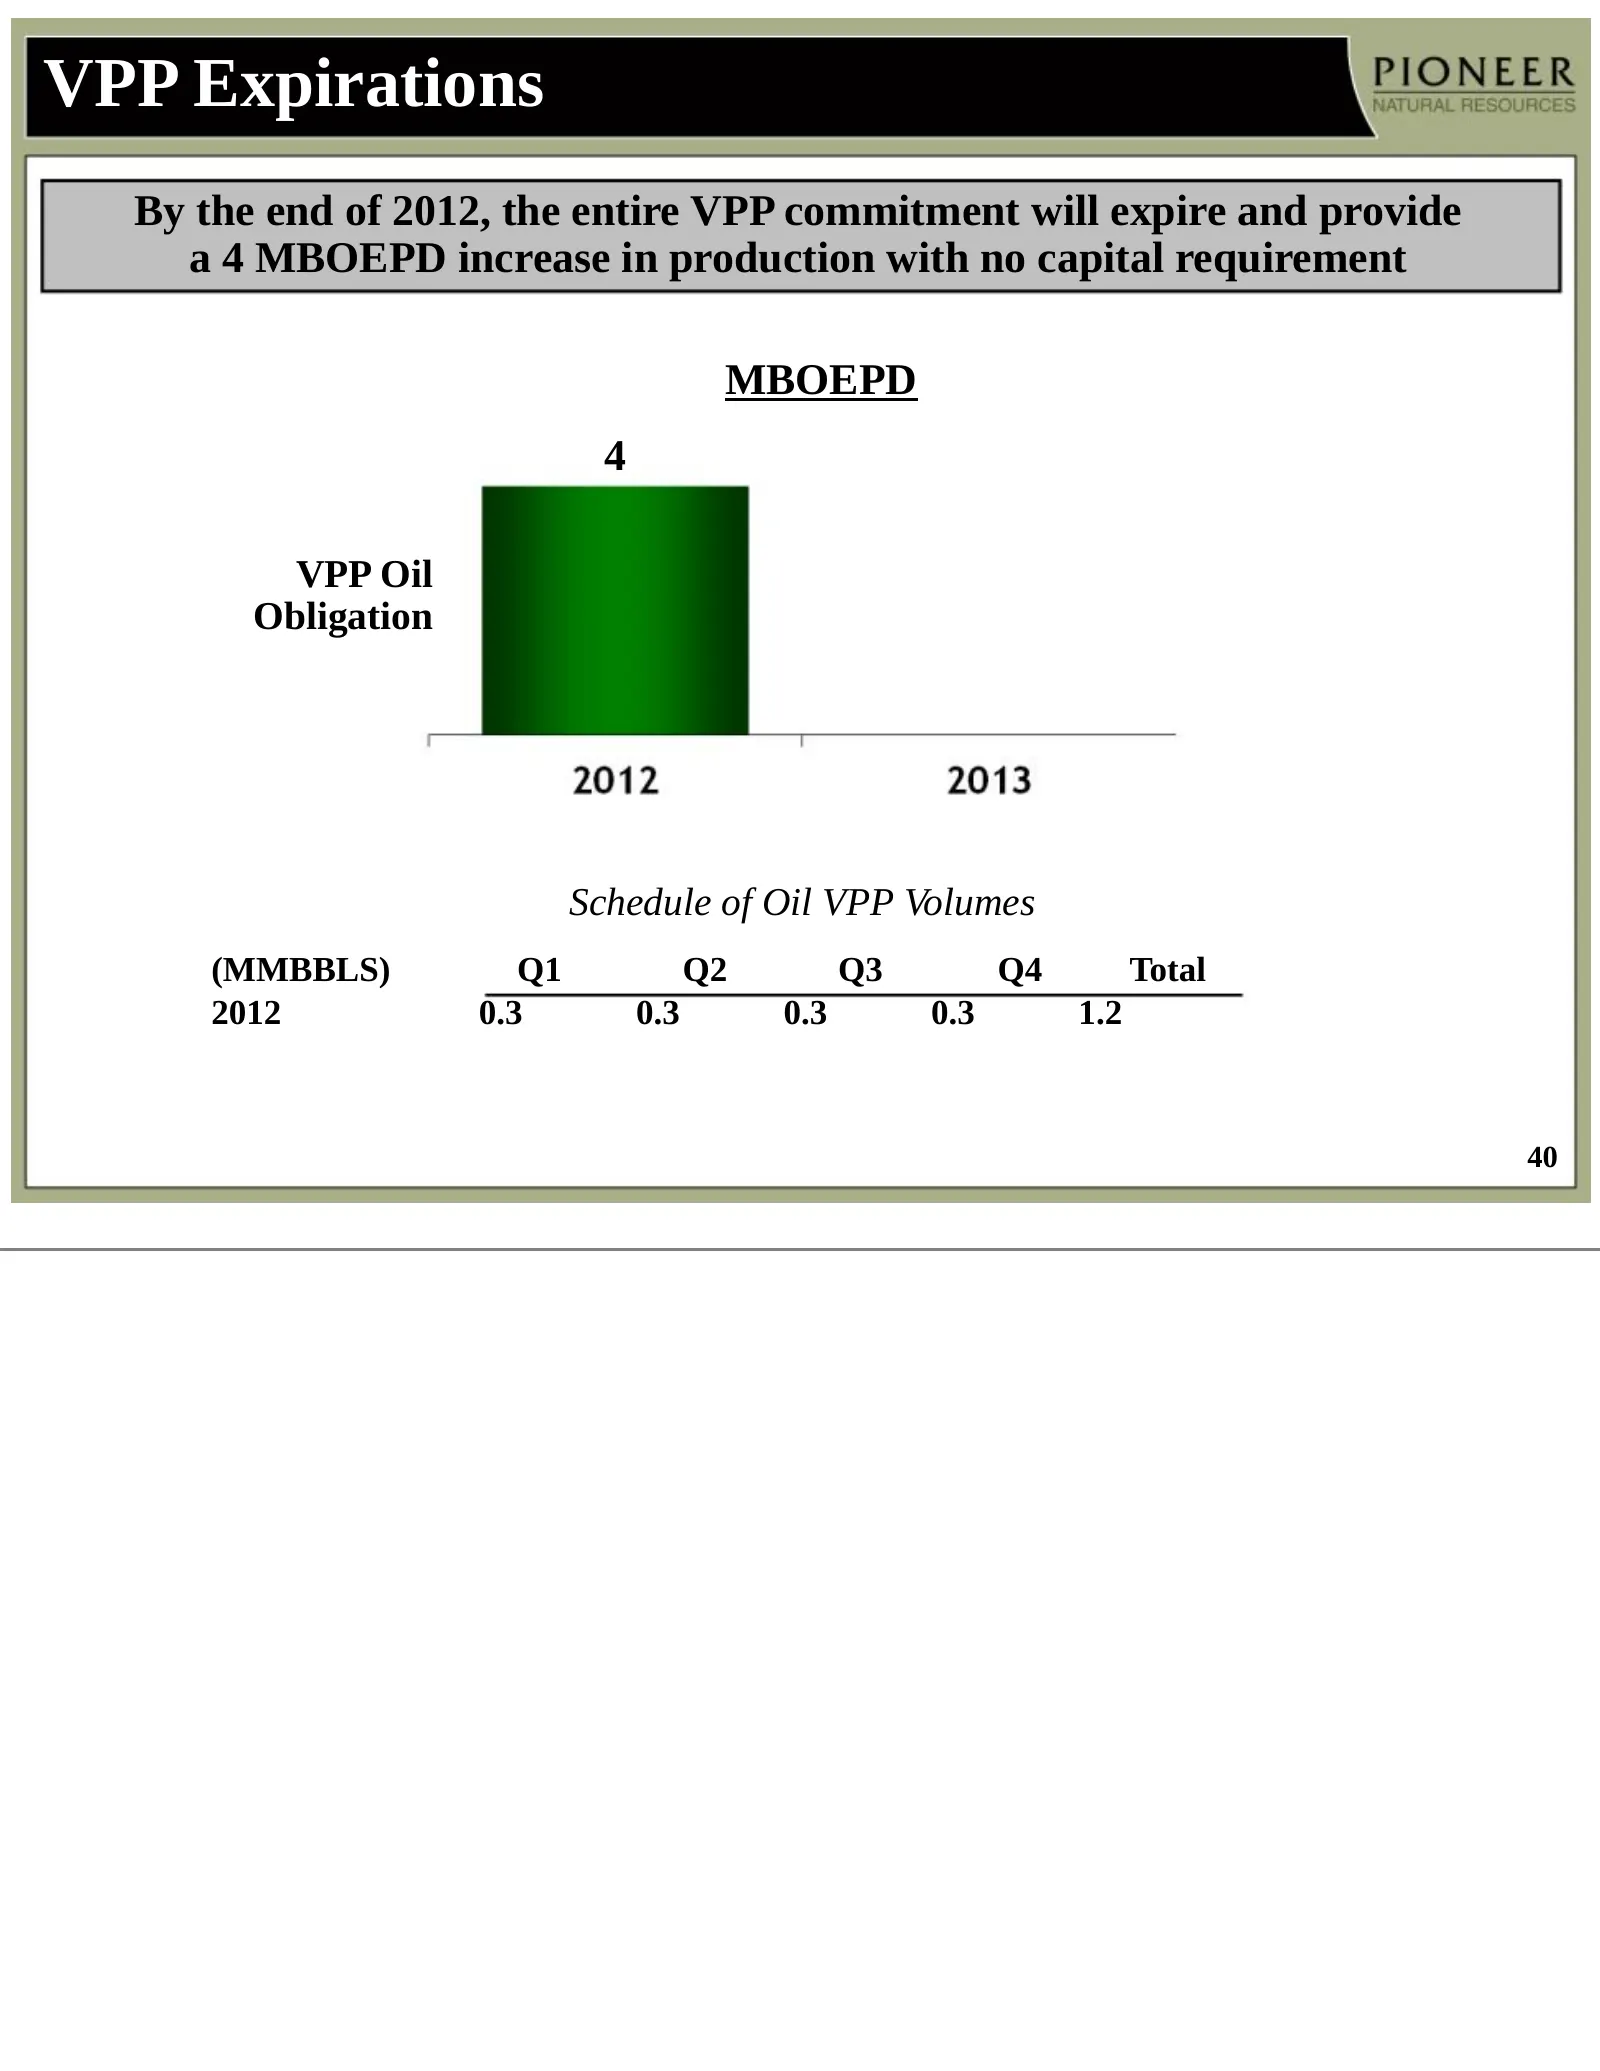
Slide 40: VPP Expirations
VPP Expirations By the end of 2012, the entire VPP commitment will expire and provide a 4 MBOEPD increase in production with no capital requirement MBOEPD 4 VPP Oil Obligation Schedule of Oil VPP Volumes (MMBBLS) Q1 Q2 Q3 Q4 Total 2012 0.3 0.3 0.3 0.3 1.2 40
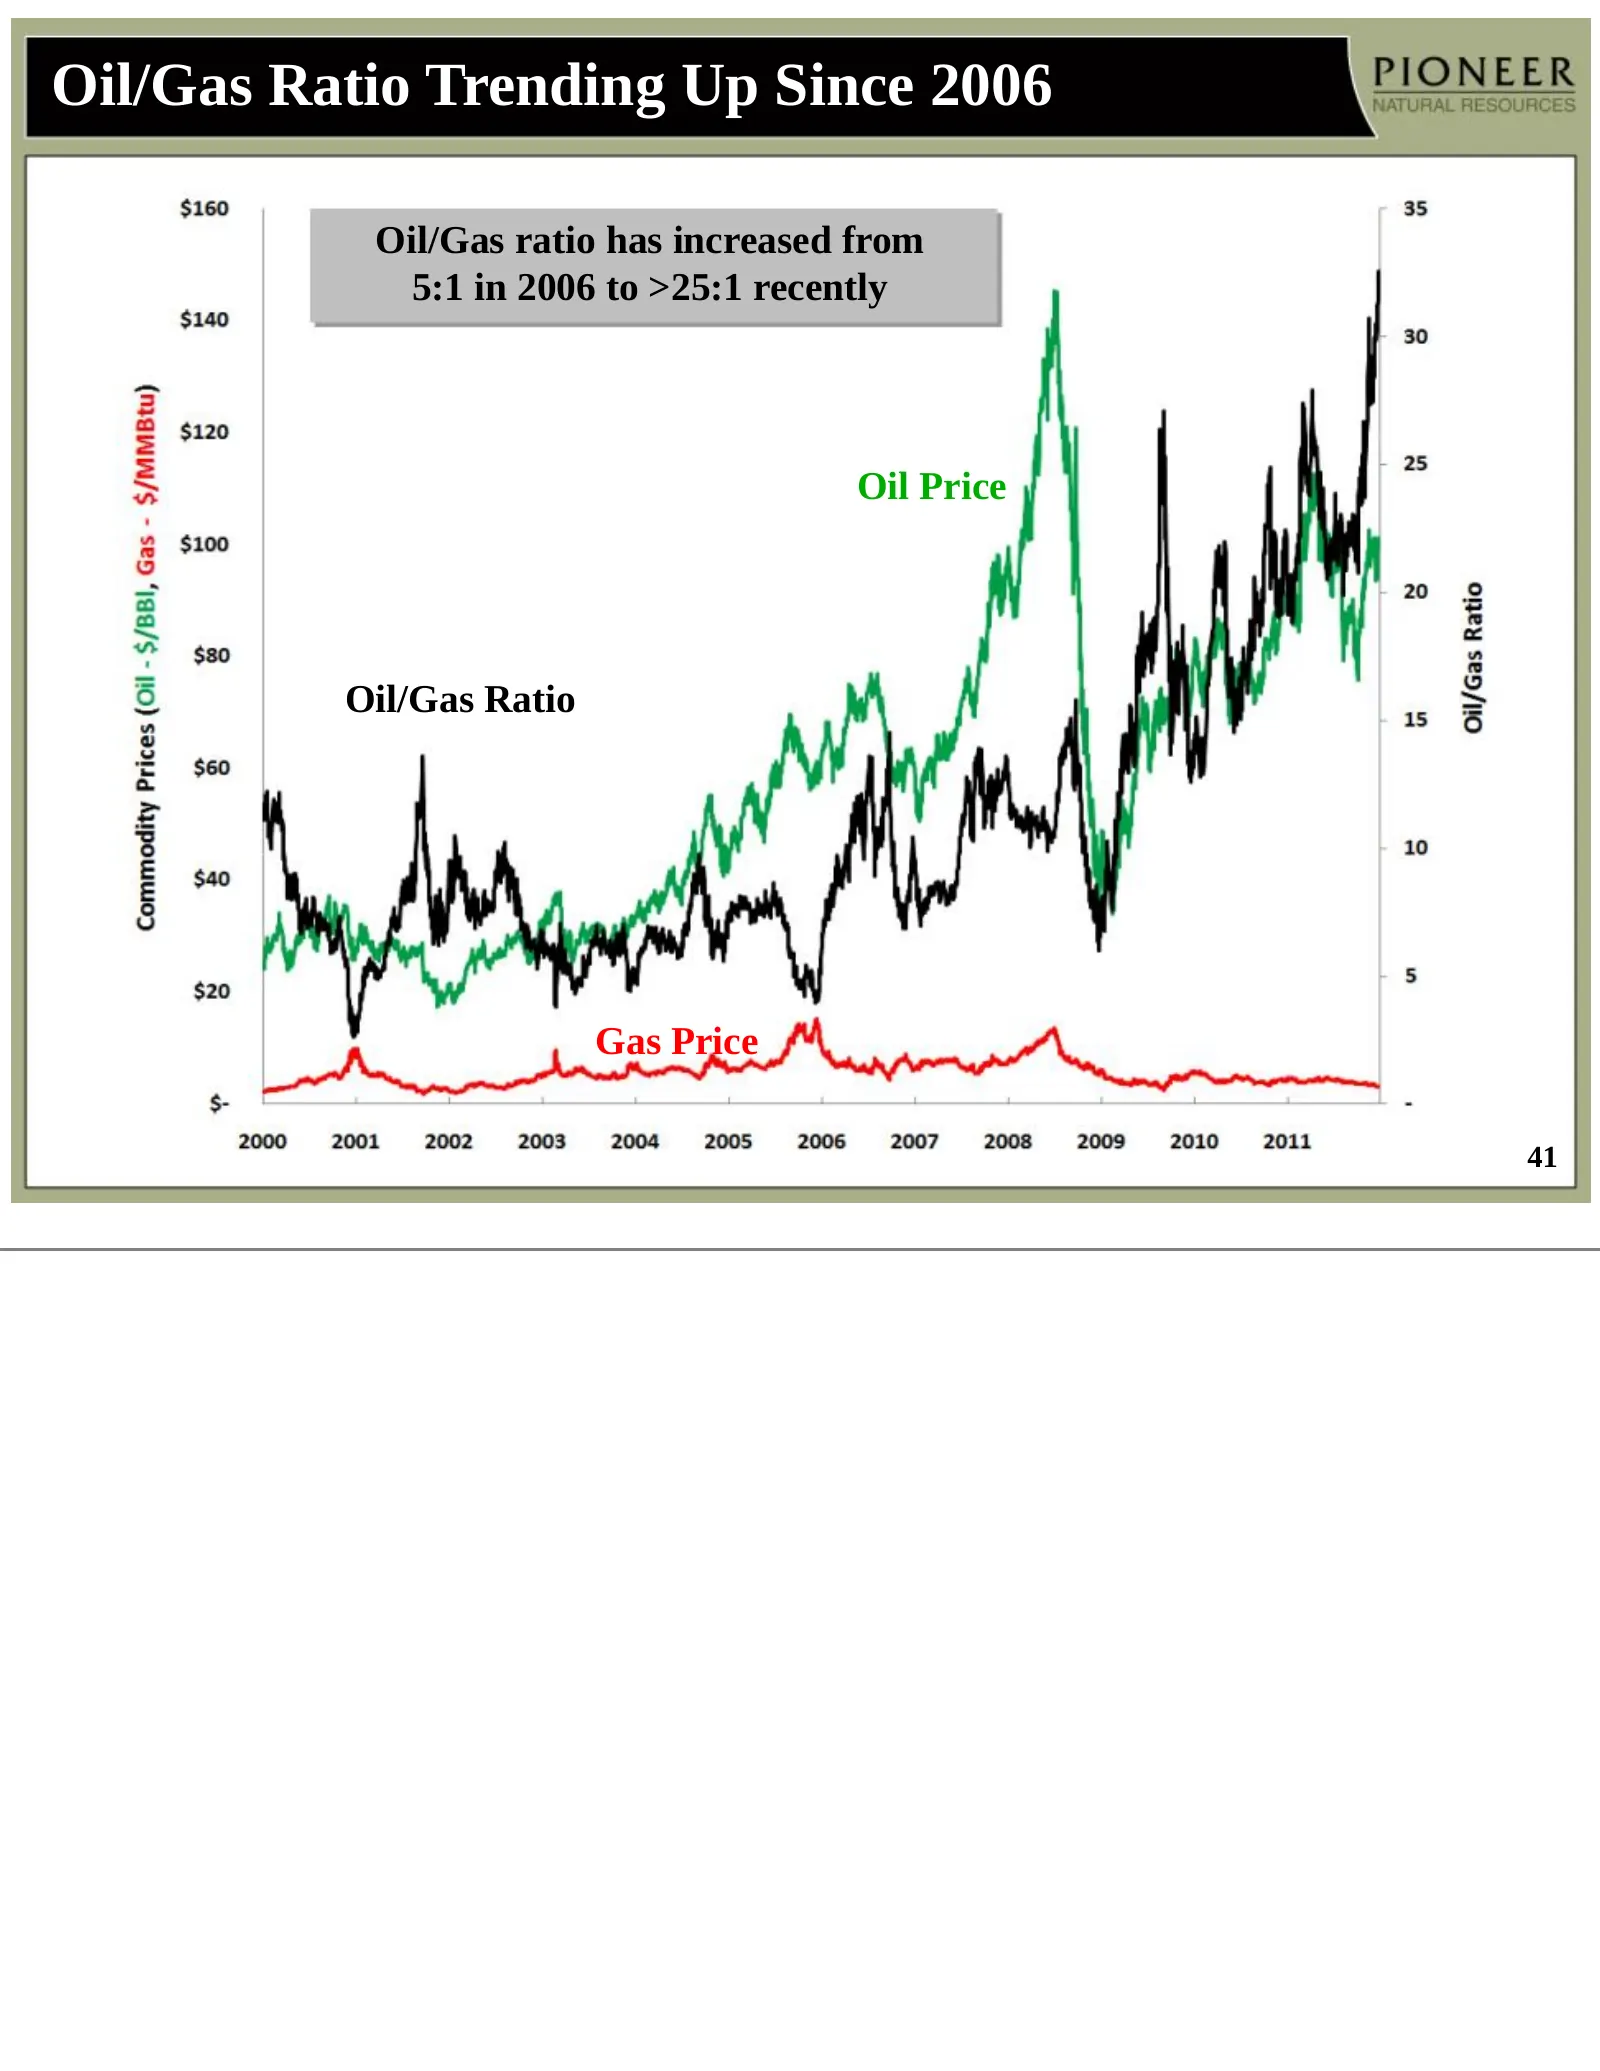
Slide 41: Oil/Gas Ratio Trending Up Since 2006
Oil/Gas Ratio Trending Up Since 2006 Oil/Gas ratio has increased from 5:1 in 2006 to >25:1 recently Oil Price Oil/Gas Ratio Gas Price 41
Slide 42: Certain Reserve Information
Certain Reserve Information Cautionary Note to U.S. Investors --The U.S. Securities and Exchange Commission (the "SEC") prohibits oil and gas companies, in their filings with the SEC, from disclosing estimates of oil or gas resources other than “reserves,” as that term is defined by the SEC. In this

Slide 43
Source: SEC EDGAR · 8-K filed Jan 9, 2012
More decks from Pioneer Natural Resources Co
 Merger or Acquisition (October 2023)15 slides · Oct 11, 2023
 Q3 2020 Earnings Presentation30 slides · Nov 4, 2020
 Merger or Acquisition (October 2020)18 slides · Oct 20, 2020
 IPAA Oil & Gas Investment Symposium 201846 slides · Apr 9, 2018
 Investor Presentation (January 2014)80 slides · Jan 6, 2014
 Q4 2012 Earnings Presentation48 slides · Feb 13, 2013