Pirelli & C. S.p.A. · MIL:PIRC
Pirelli & C — Investor Presentation (November 2019)
163 slides from Pirelli & C's investor presentation, Nov 7, 2019

Slide 1: Pirelli, Global High Value – Company Presentation November 2019
C O M PA N Y P R E S E N TAT I O N – N O V E M B E R 2 0 1 9 PIRELLI, GLOBAL HIGH VALUE Company Presentation – November 2019

Slide 2: Pirelli, Global High Value
PIRELLI, GLOBAL HIGH VALUE Company Presentation – November 2019
Slide 3: Disclaimer (1/2)
DISCLAIMER (1/2) ▬ In General. This document (the “Presentation”) has been prepared by Pirelli & C. S.p.A. (“Pirelli” or the “Company” and, together with its subsidiary the “Group”) and is being furnished for information purposes only in order to generally present the Group and its business. This pr
Slide 4: Disclaimer (2/2)
DISCLAIMER (2/2) Non-IFRS and Other Performance Measures This Presentation contains certain items as part of the financial disclosure which are not defined under IFRS. Accordingly, these items do not have standardized meanings and may not be directly comparable to similarly-titled items adopted by o
Slide 5: Agenda
AGENDA 1. PIRELLI AT A GLANCE 2. BUSINESS MODEL 3. KEY INVESTMENT HIGHLIGHTS 4. MARKET AND COMPETITION 5. 9M 2019 FINANCIAL RESULTS AND 2019 OUTLOOK 6. FY 2018 FINANCIAL RESULTS AND 2019 OUTLOOK 7. GOVERNANCE 8. SUSTAINABILITY 9. APPENDIX PIRELLI, GLOBAL HIGH VALUE 5 Company Presentation – November
Slide 6: Pirelli at a Glance (2019E)
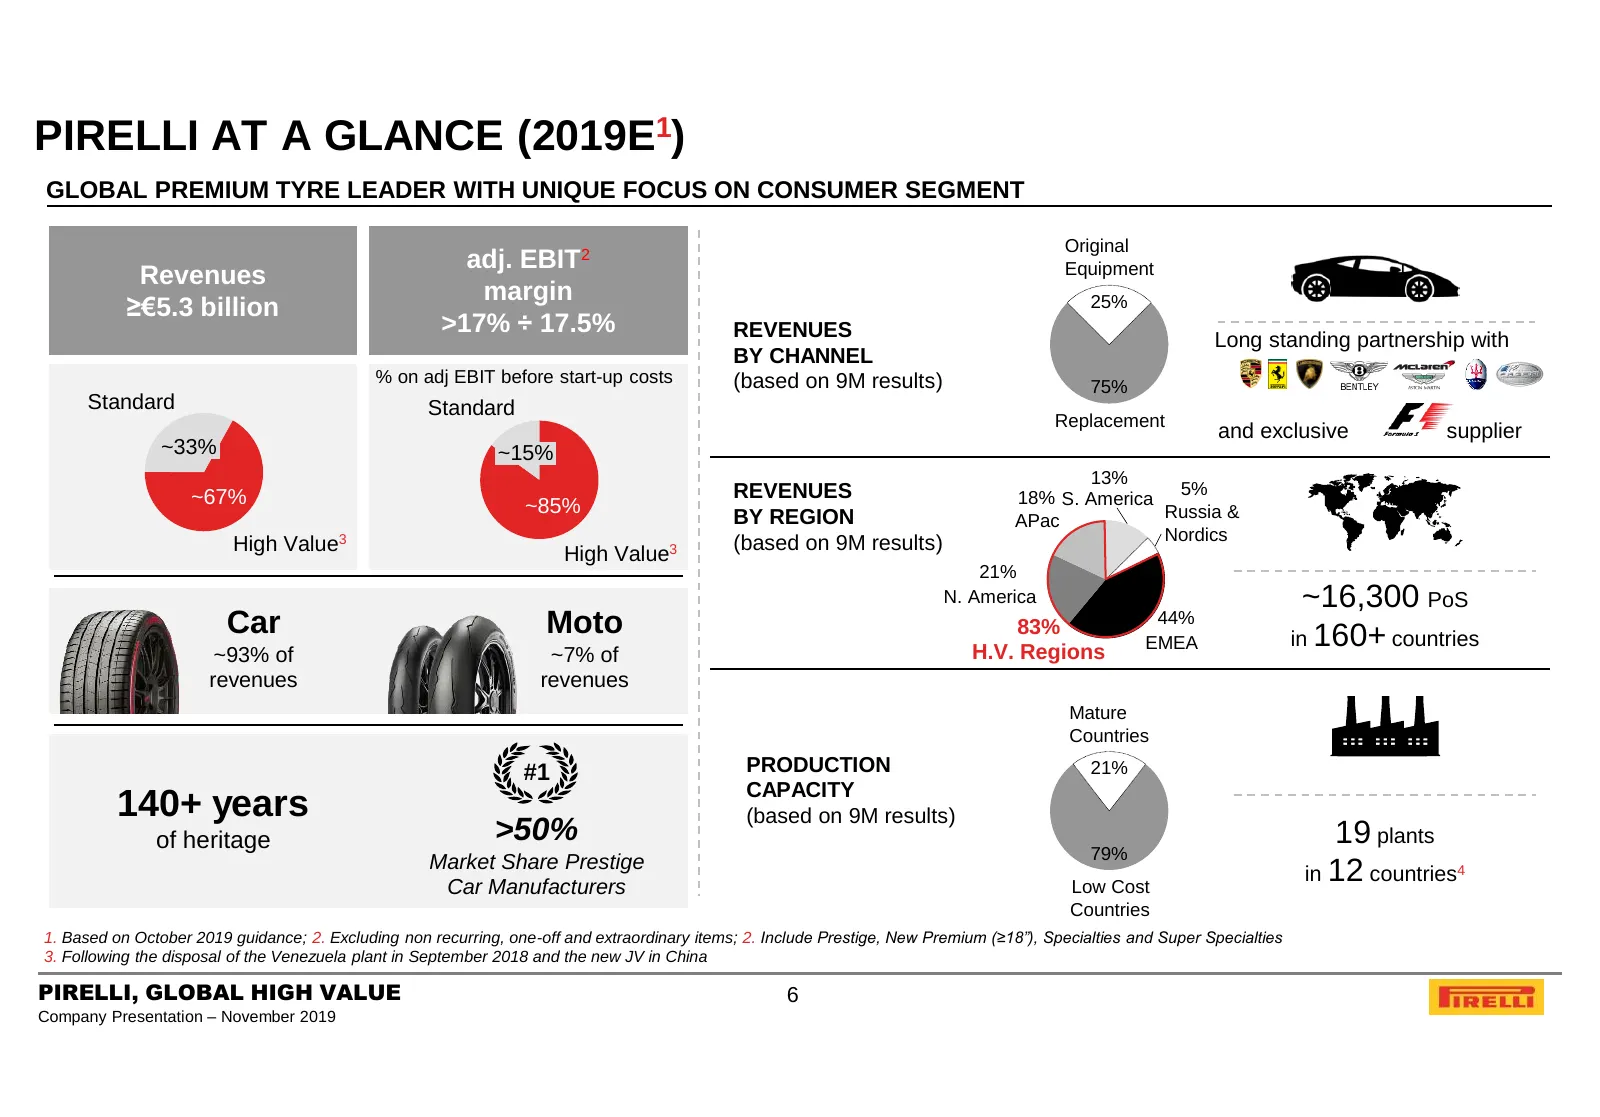
PIRELLI AT A GLANCE (2019E1) GLOBAL PREMIUM TYRE LEADER WITH UNIQUE FOCUS ON CONSUMER SEGMENT Original adj. EBIT2 Equipment Revenues margin ≥€5.3 billion 25% >17% ÷ 17.5% REVENUES Long standing partnership with BY CHANNEL % on adj EBIT before start-up costs (based on 9M results) 75% Standard Standar
Slide 7: High Value Products Portfolio
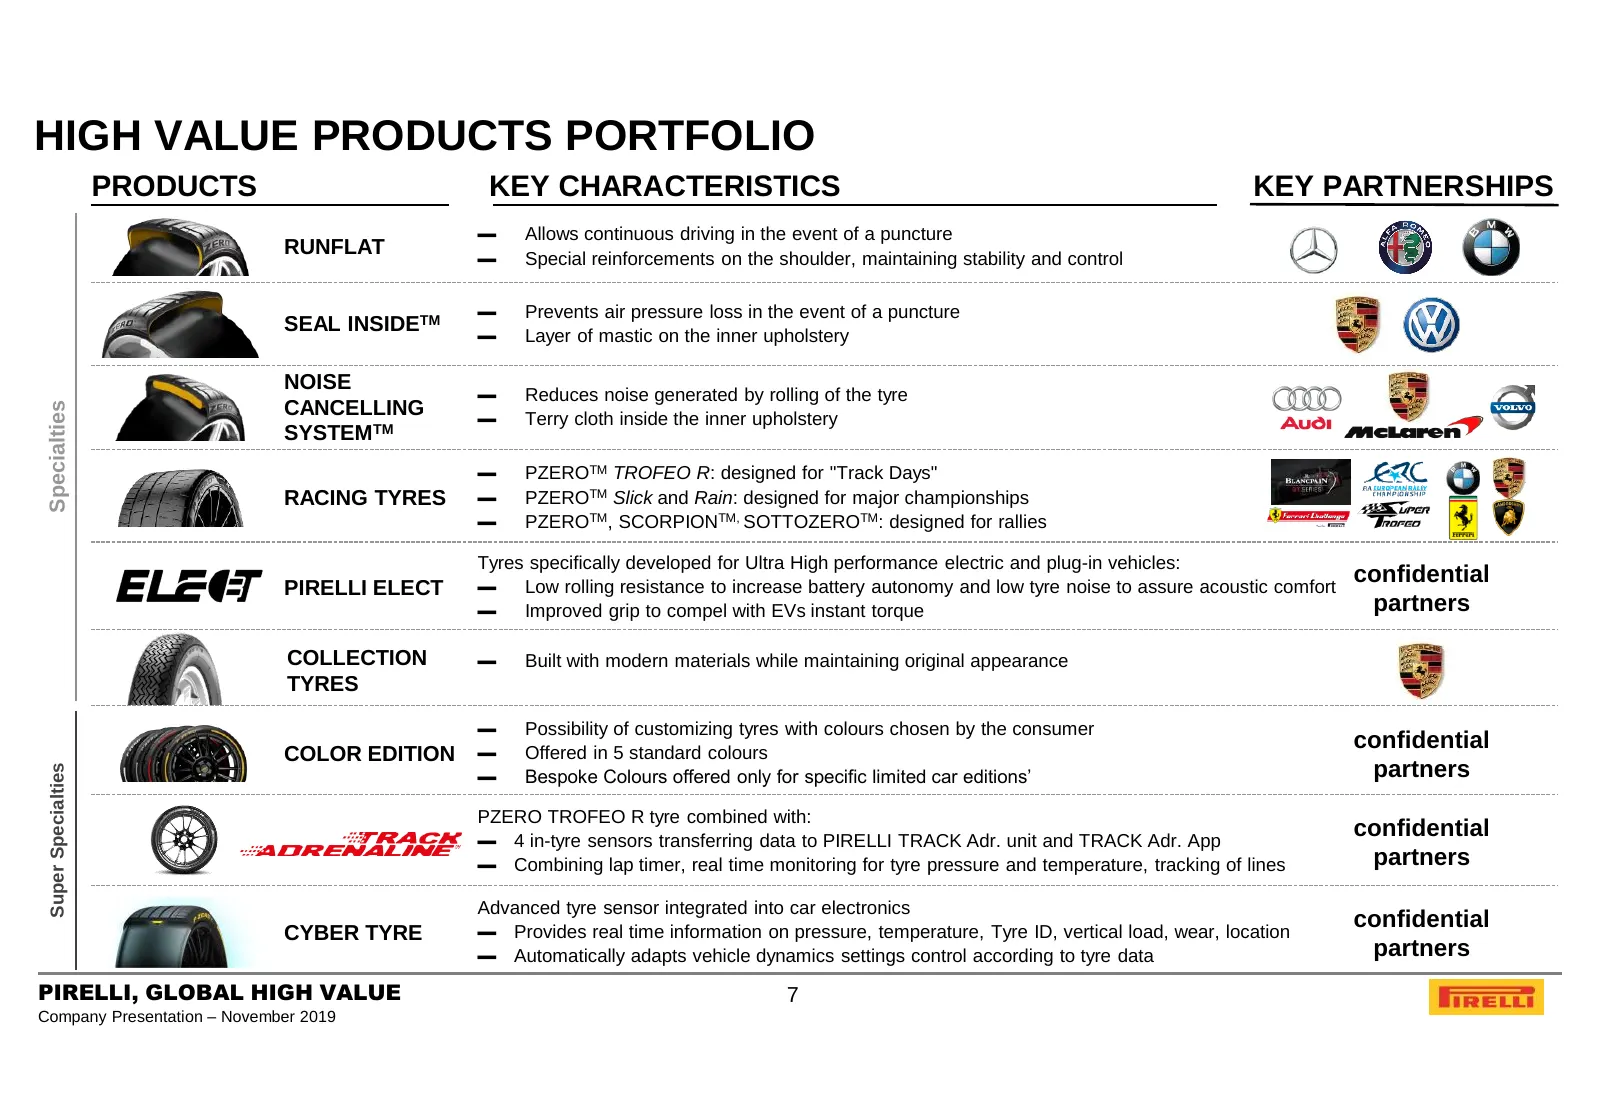
HIGH VALUE PRODUCTS PORTFOLIO PRODUCTS KEY CHARACTERISTICS KEY PARTNERSHIPS ▬ Allows continuous driving in the event of a puncture RUNFLAT ▬ Special reinforcements on the shoulder, maintaining stability and control ▬ Prevents air pressure loss in the event of a puncture SEAL INSIDETM ▬ Layer of mast
Slide 8: Agenda
AGENDA 1. PIRELLI AT A GLANCE 2. BUSINESS MODEL 3. KEY INVESTMENT HIGHLIGHTS 4. MARKET AND COMPETITION 5. 9M 2019 FINANCIAL RESULTS AND 2019 OUTLOOK 6. FY 2018 FINANCIAL RESULTS AND 2019 OUTLOOK 7. GOVERNANCE 8. SUSTAINABILITY 9. APPENDIX PIRELLI, GLOBAL HIGH VALUE 8 Company Presentation – November
Slide 9: Premium & Prestige Car Parc Expansion
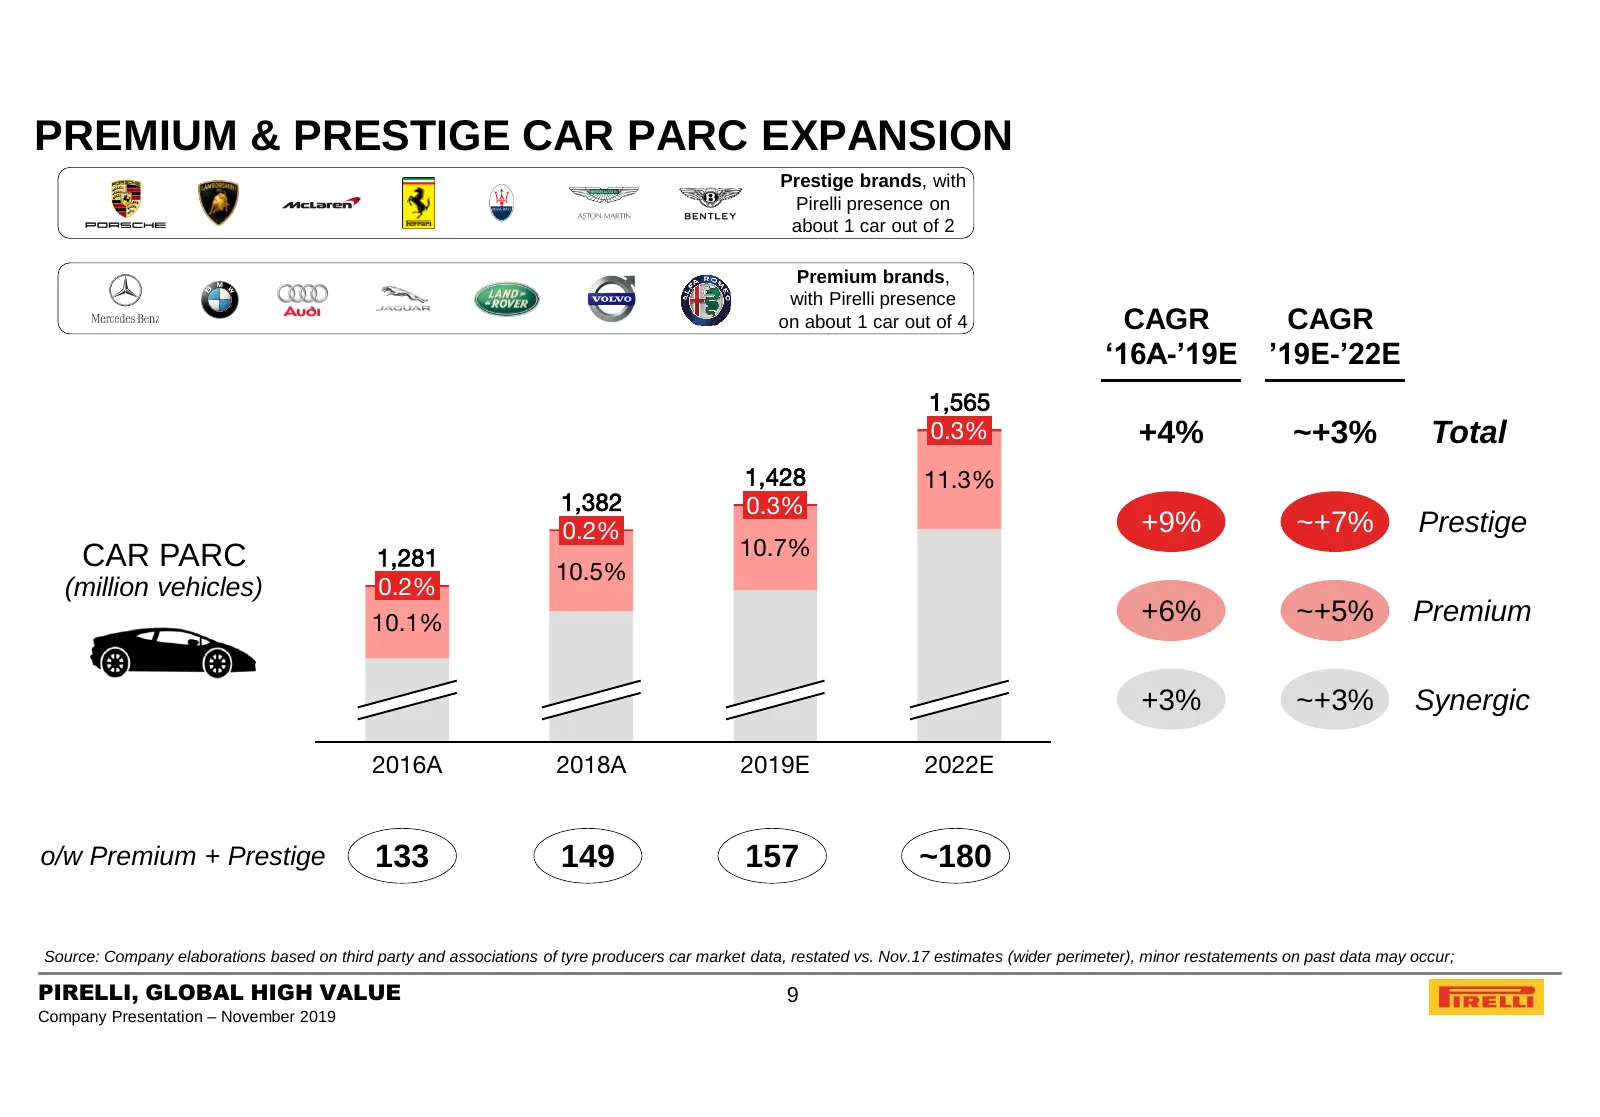
PREMIUM & PRESTIGE CAR PARC EXPANSION Prestige brands, with Pirelli presence on about 1 car out of 2 Premium brands, with Pirelli presence on about 1 car out of 4 CAGR CAGR ‘16A-’19E ’19E-’22E 1,565 0.3% +4% ~+3% Total 1,428 11.3% 1,382 0.3% 0.2% +9% ~+7% Prestige CAR PARC 1,281 10.7% 10.5% (million
Slide 10: Complexity Lever 1: Increasing Number of Car Models per Brand
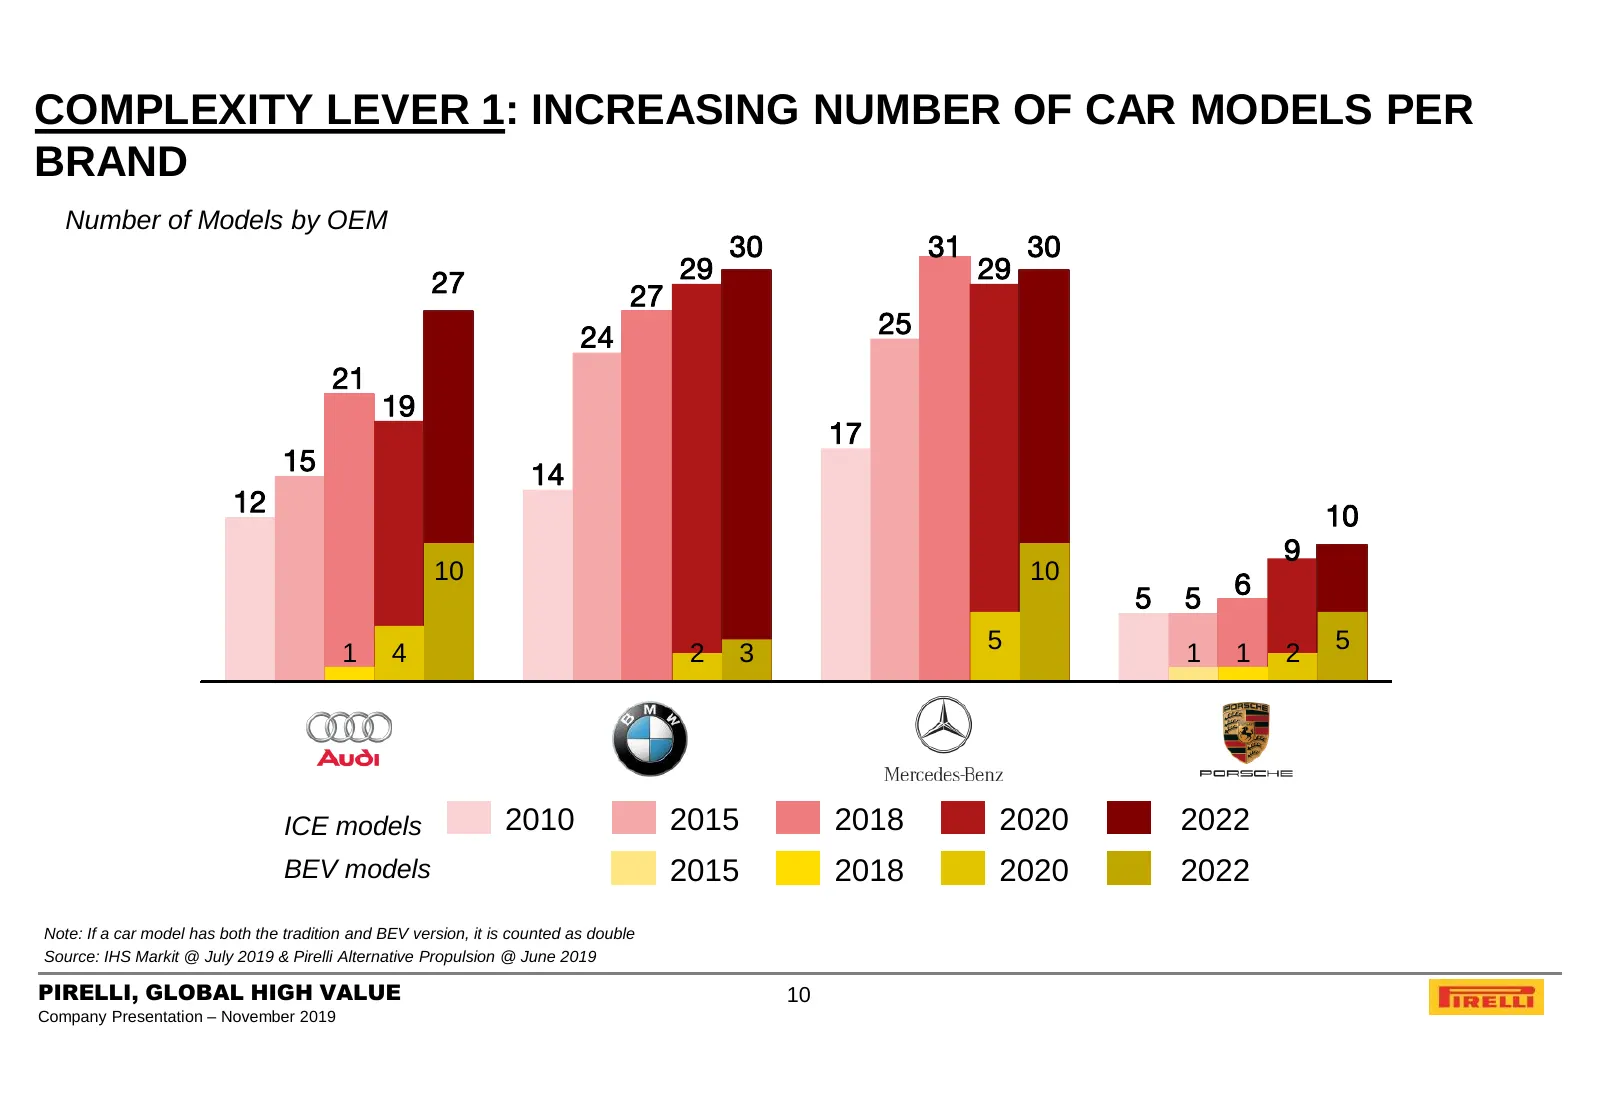
COMPLEXITY LEVER 1: INCREASING NUMBER OF CAR MODELS PER BRAND Number of Models by OEM 30 31 30 27 29 29 27 24 25 21 19 17 15 14 12 10 9 10 10 5 5 6 5 5 1 4 2 3 1 1 2 ICE models 2010 2015 2018 2020 2022 BEV models 2010 2015 2018 2020 2022 Note: If a car model has both the tradition and BEV version, i
Slide 11: Complexity Lever 2: Higher Number of Fitments per Model
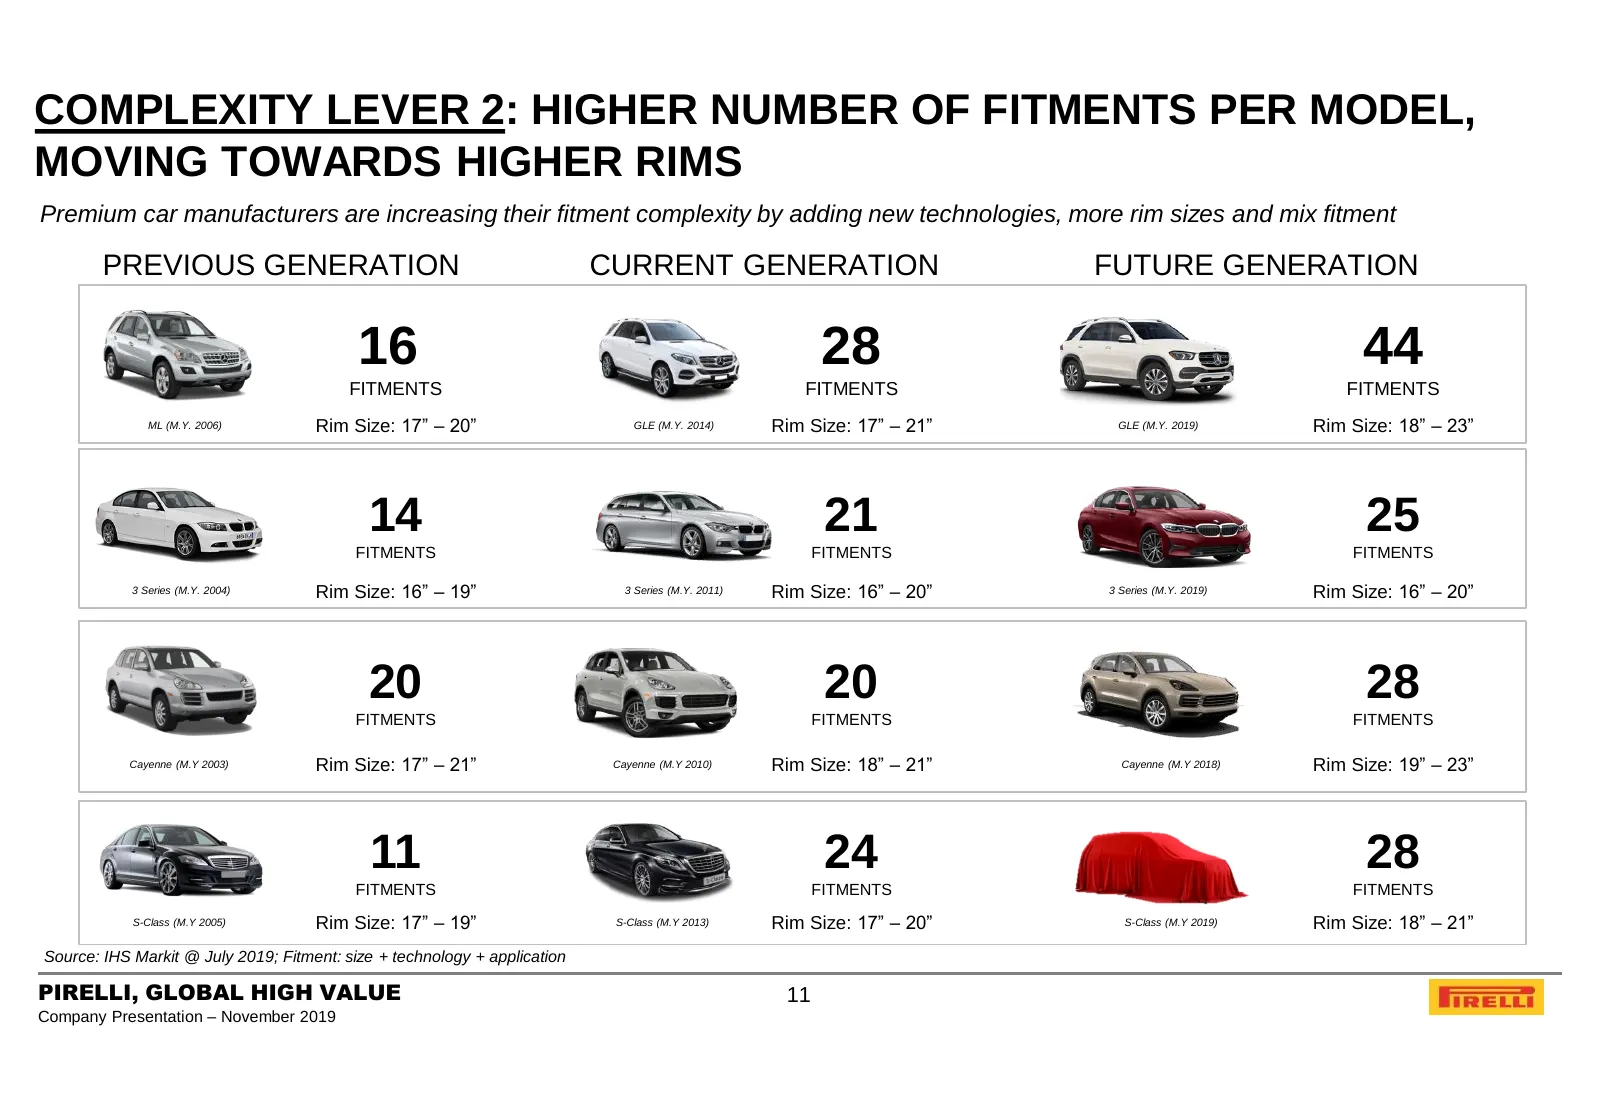
COMPLEXITY LEVER 2: HIGHER NUMBER OF FITMENTS PER MODEL, MOVING TOWARDS HIGHER RIMS Premium car manufacturers are increasing their fitment complexity by adding new technologies, more rim sizes and mix fitment PREVIOUS GENERATION CURRENT GENERATION FUTURE GENERATION 16 28 44 FITMENTS FITMENTS FITMENT
Slide 12: Complexity Lever 3: OEM Requirements More Sophisticated
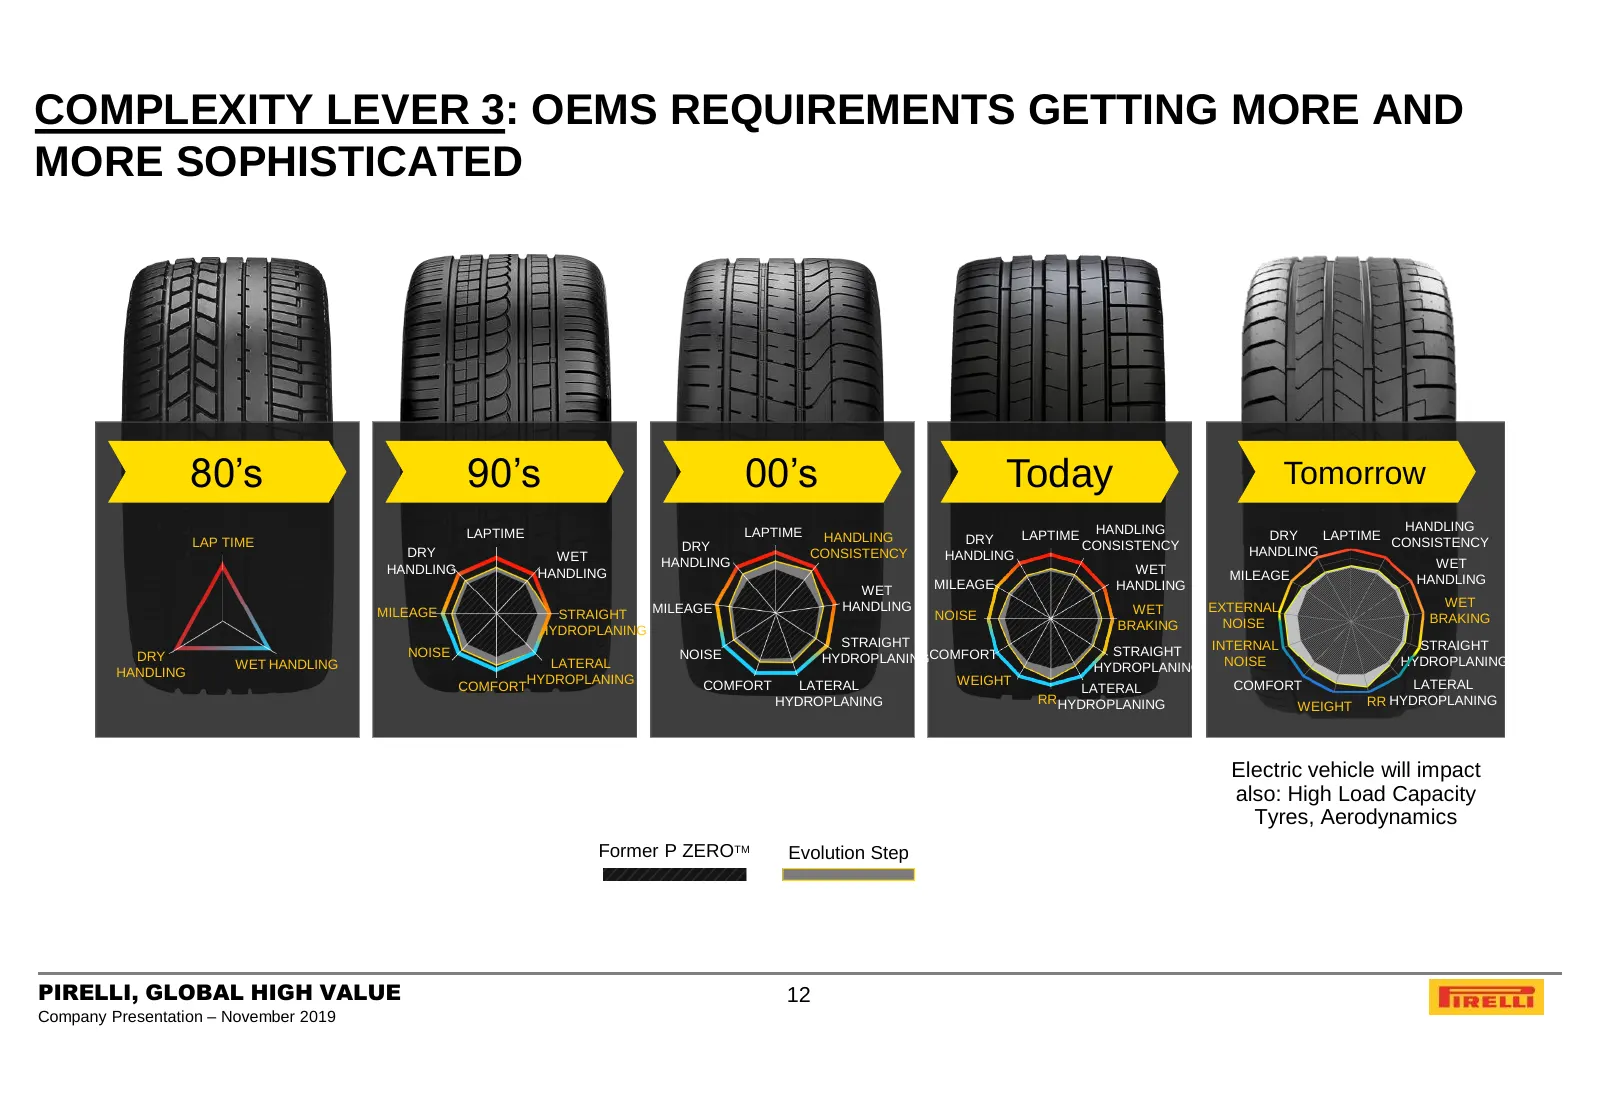
COMPLEXITY LEVER 3: OEMS REQUIREMENTS GETTING MORE AND MORE SOPHISTICATED 80’s 90’s 00’s Today Tomorrow HANDLING LAP TIME LAPTIME LAPTIME HANDLING DRY LAPTIME HANDLING DRY LAPTIME CONSISTENCY DRY CONSISTENCY HANDLING DRY WET CONSISTENCY HANDLING HANDLING HANDLING WET WET HANDLING MILEAGE HANDLING WE
Slide 13: Pirelli Leader in OE-Marked Portfolio
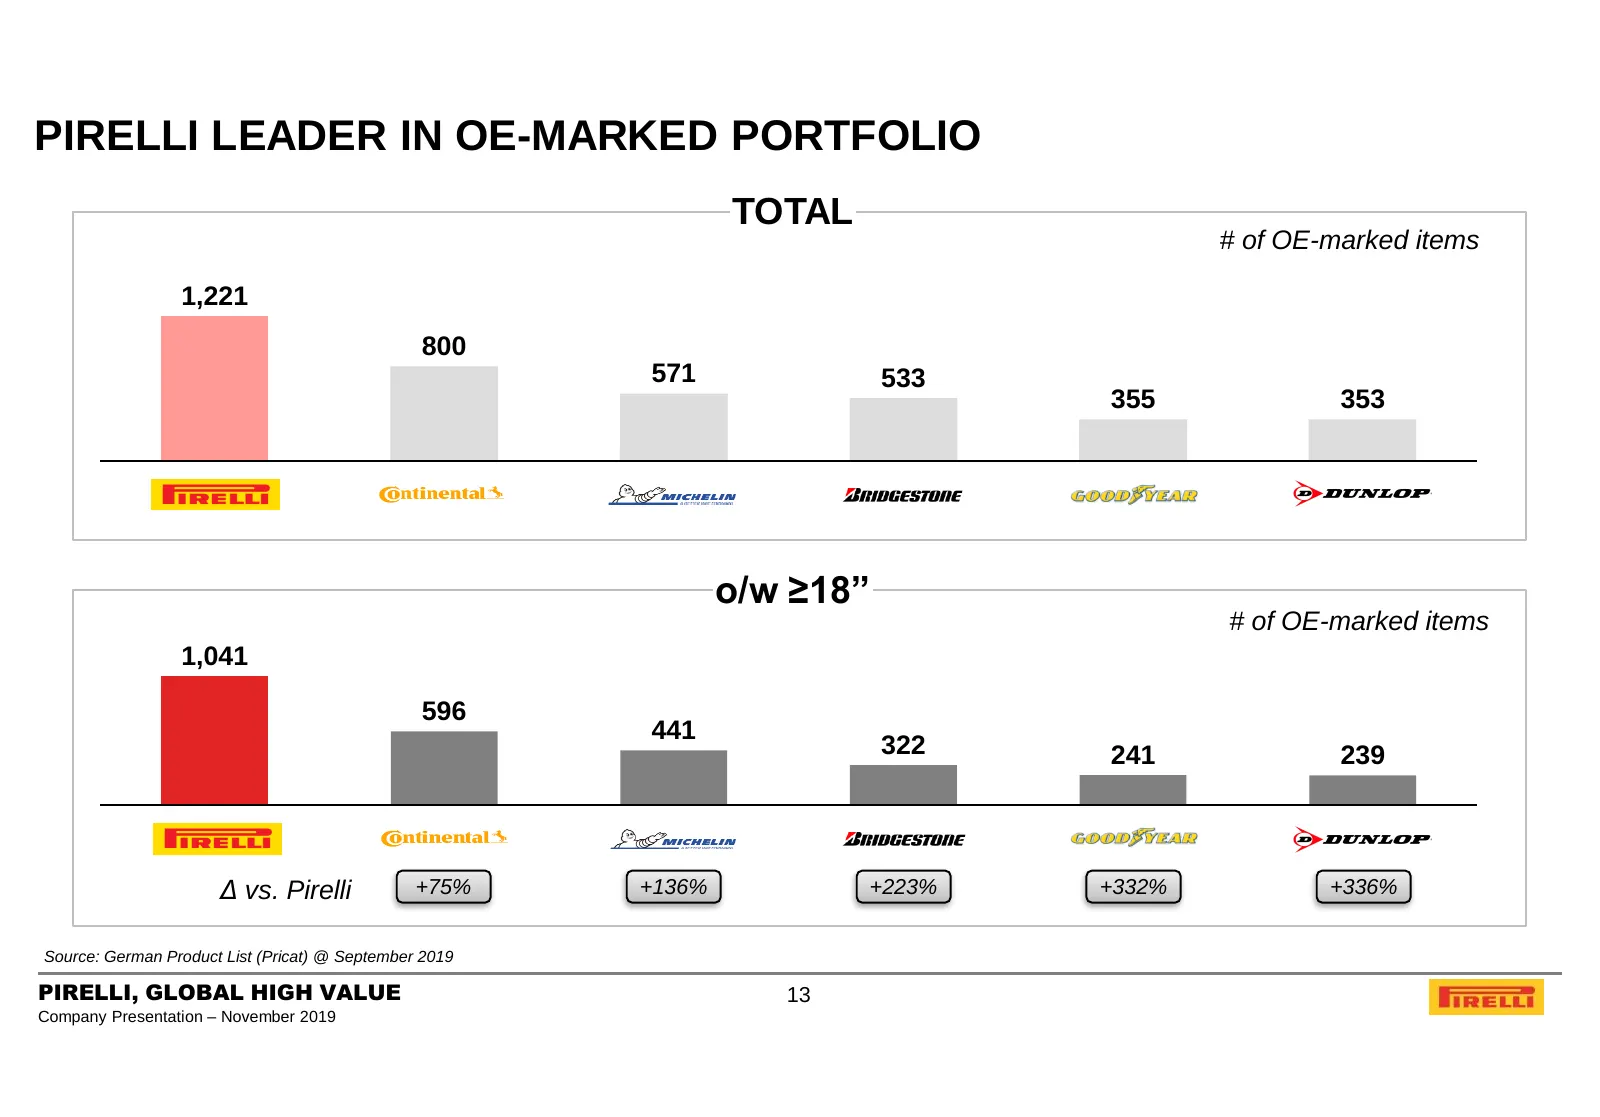
PIRELLI LEADER IN OE-MARKED PORTFOLIO TOTAL # of OE-marked items 1,221 800 571 533 355 353 o/w ≥18” # of OE-marked items 1,041 596 441 322 241 239 Δ vs. Pirelli +75% +136% +223% +332% +336% Source: German Product List (Pricat) @ September 2019 PIRELLI, GLOBAL HIGH VALUE 13 Company Presentation – Nov
Slide 14: Growing Number of OE-Marked Items
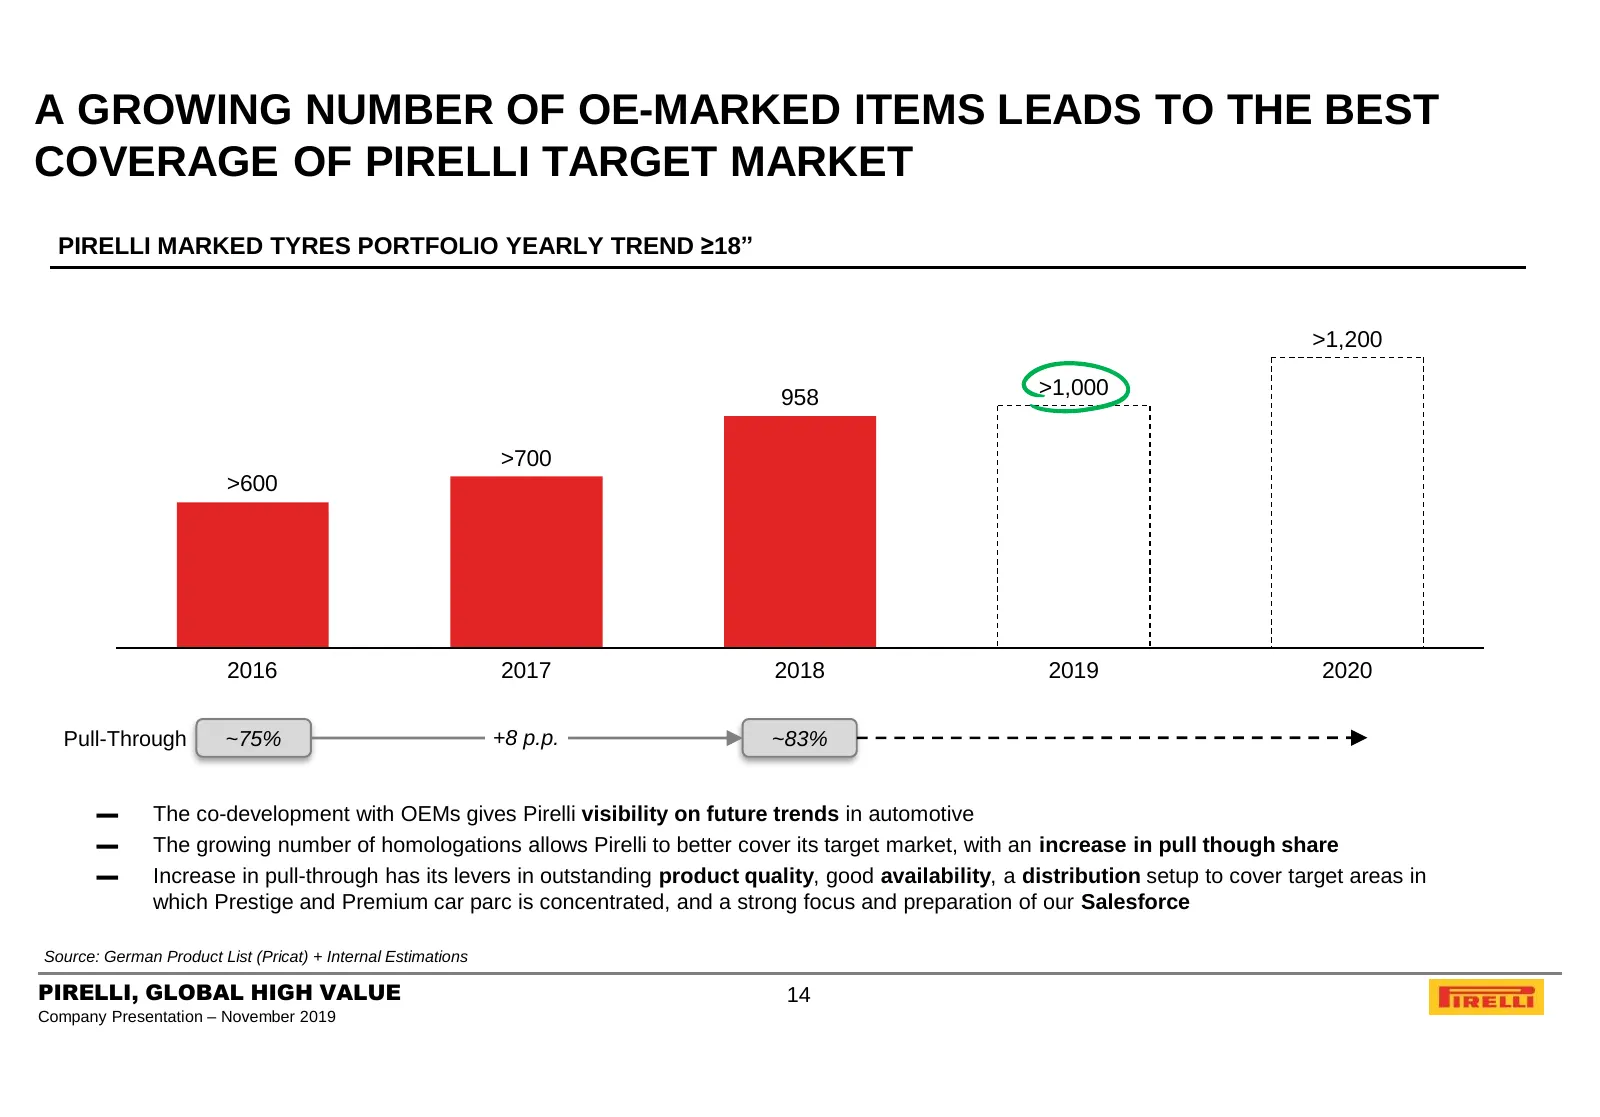
A GROWING NUMBER OF OE-MARKED ITEMS LEADS TO THE BEST COVERAGE OF PIRELLI TARGET MARKET PIRELLI MARKED TYRES PORTFOLIO YEARLY TREND ≥18” >1,200 958 >1,000 >700 >600 2016 2017 2018 2019 2020 Pull-Through ~75% +8 p.p. ~83% ▬ The co-development with OEMs gives Pirelli visibility on future trends in aut
Slide 15: Working Closely with Premium & Prestige OEMs Provides Visibility
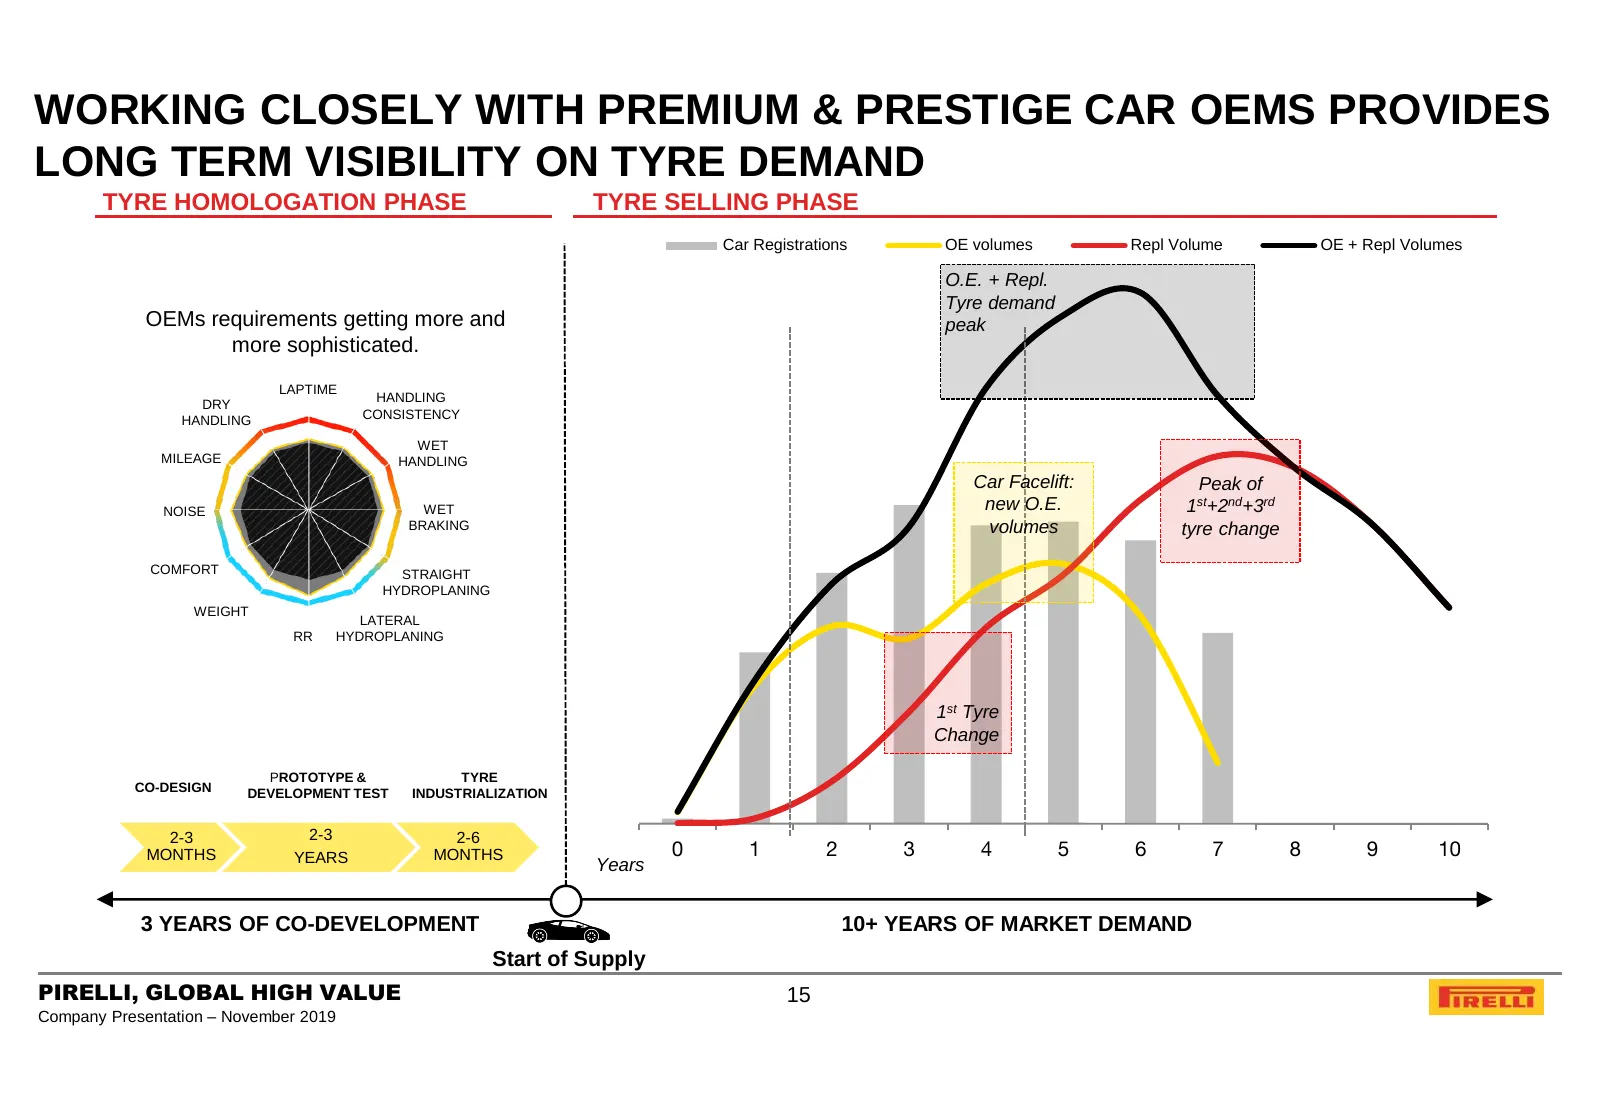
WORKING CLOSELY WITH PREMIUM & PRESTIGE CAR OEMS PROVIDES LONG TERM VISIBILITY ON TYRE DEMAND TYRE HOMOLOGATION PHASE TYRE SELLING PHASE Car Registrations OE volumes Repl Volume OE + Repl Volumes O.E. + Repl. Tyre demand OEMs requirements getting more and peak more sophisticated. LAPTIME DRY HANDLIN
Slide 16: Growth Scored in ≥18” O.E. Sales
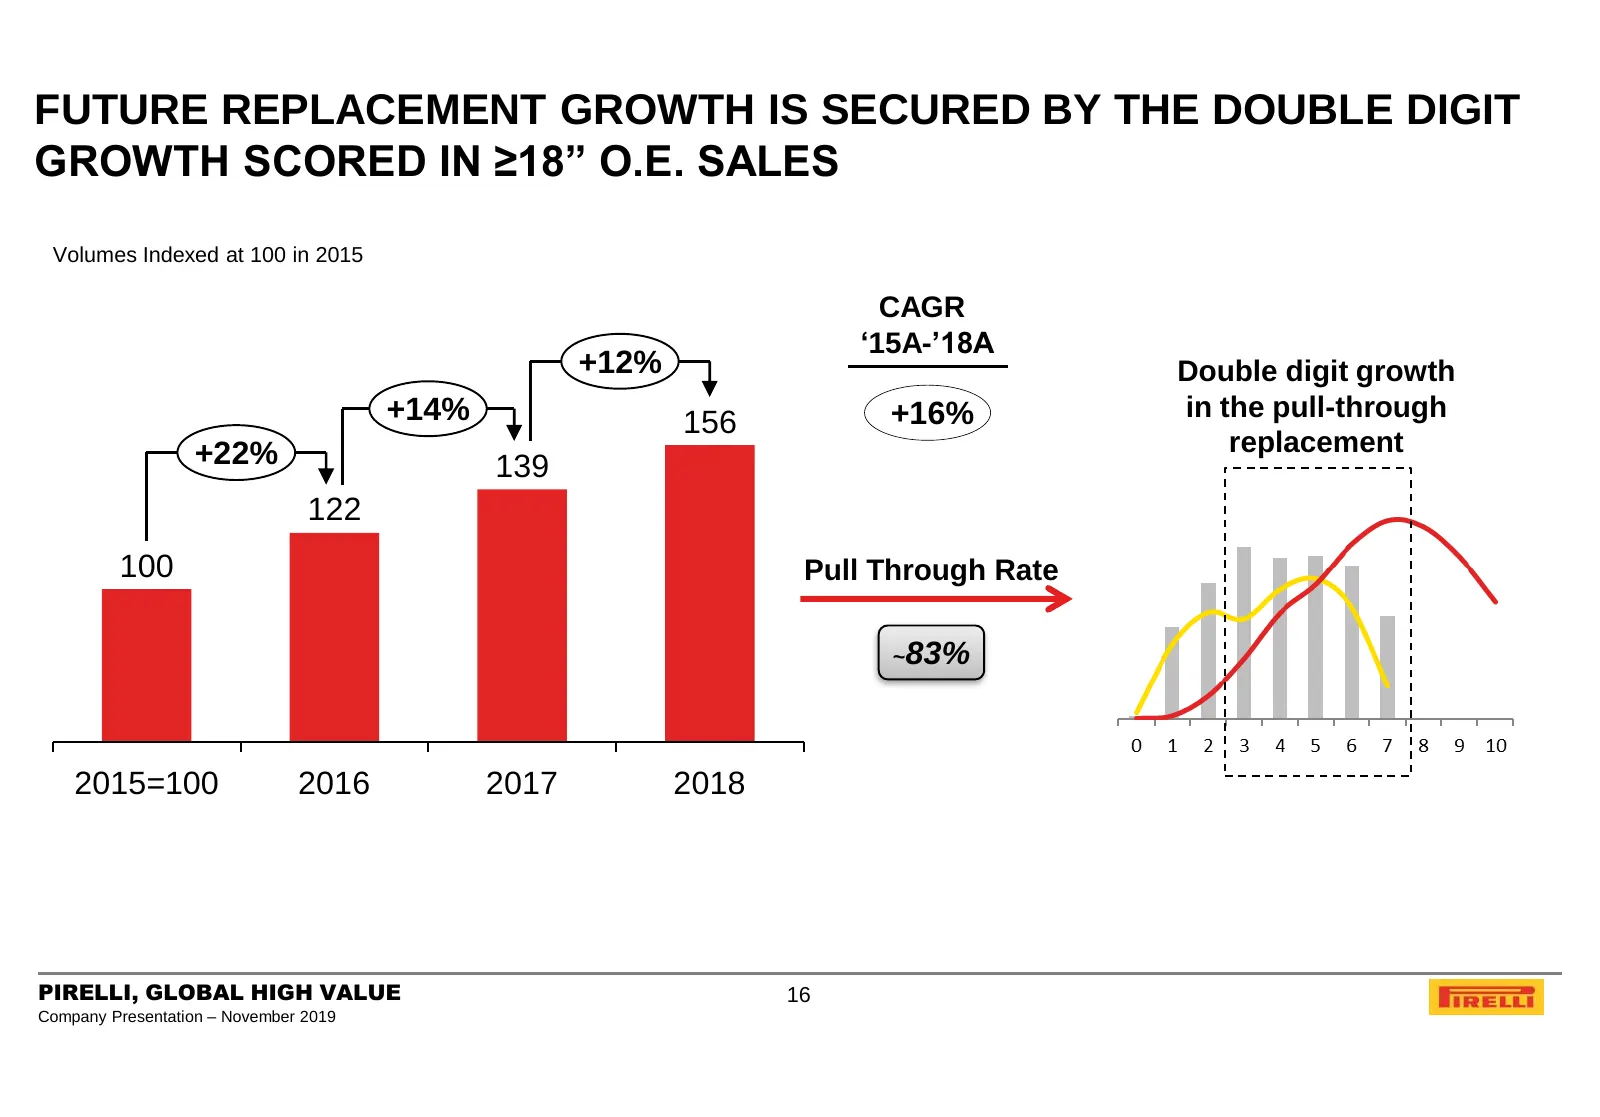
FUTURE REPLACEMENT GROWTH IS SECURED BY THE DOUBLE DIGIT GROWTH SCORED IN ≥18” O.E. SALES Volumes Indexed at 100 in 2015 CAGR ‘15A-’18A +12% Double digit growth +14% +16% in the pull-through 156 +22% replacement 139 122 100 Pull Through Rate ~83% 2015=100 2016 2017 2018 PIRELLI, GLOBAL HIGH VALUE 16
Slide 17: Our Business Model Will Manage Growing Variety
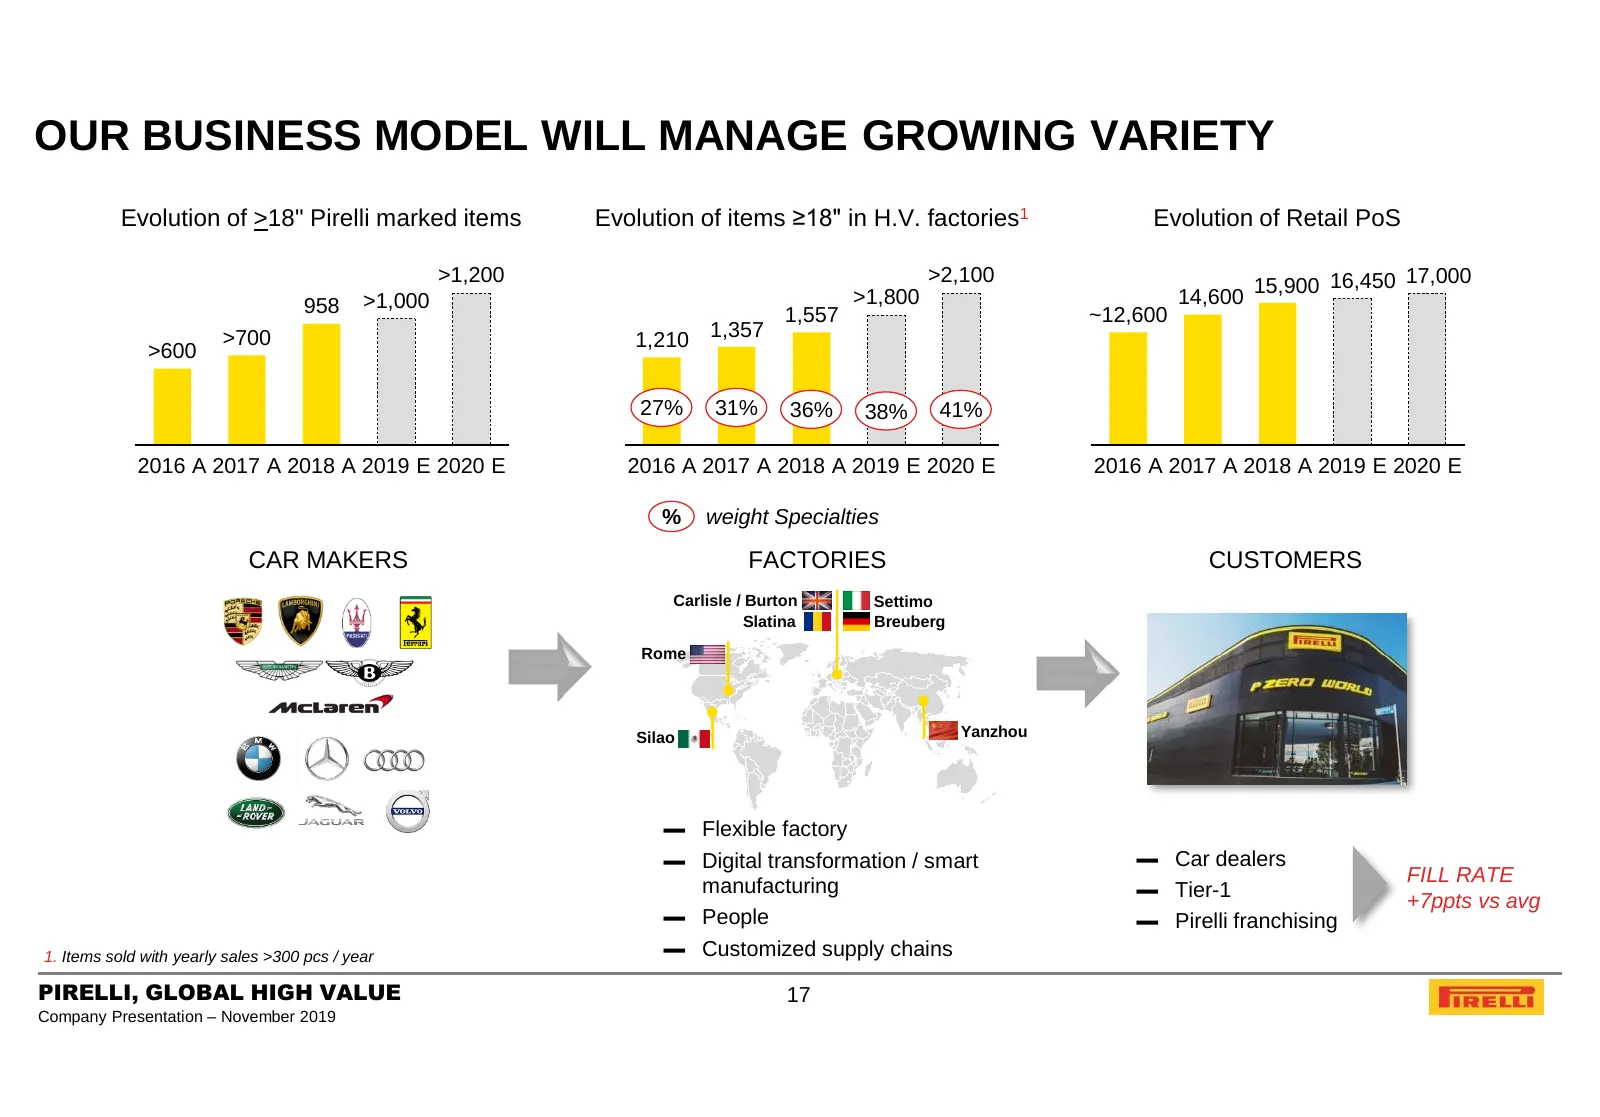
OUR BUSINESS MODEL WILL MANAGE GROWING VARIETY Evolution of >18" Pirelli marked items Evolution of items ≥18" in H.V. factories1 Evolution of Retail PoS >1,200 >2,100 15,900 16,450 17,000 958 >1,000 >1,800 14,600 1,557 ~12,600 >700 1,210 1,357 >600 27% 31% 36% 38% 41% 2016 A 2017 A 2018 A 2019 E 202
Slide 18: More Control Over Last Mile
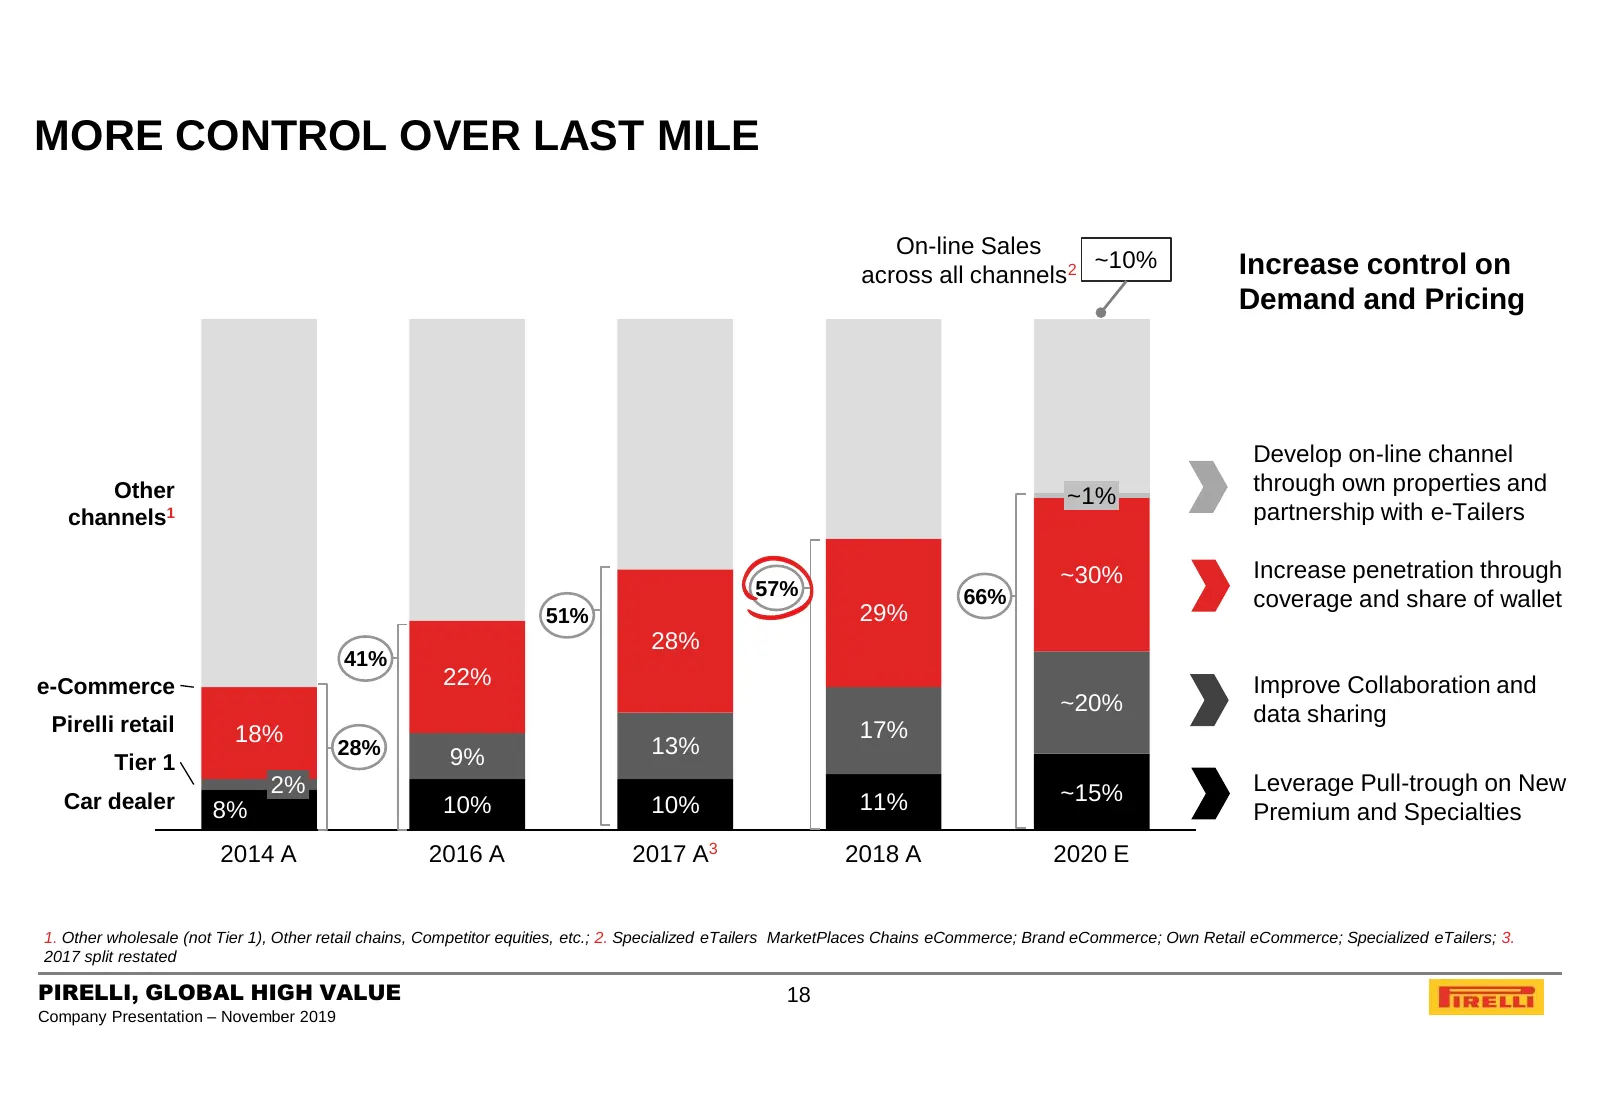
MORE CONTROL OVER LAST MILE On-line Sales ~10% Increase control on across all channels2 Demand and Pricing Develop on-line channel Other through own properties and ~1% channels1 partnership with e-Tailers ~30% Increase penetration through 57% 66% coverage and share of wallet 51% 29% 28% 41% e-Commer
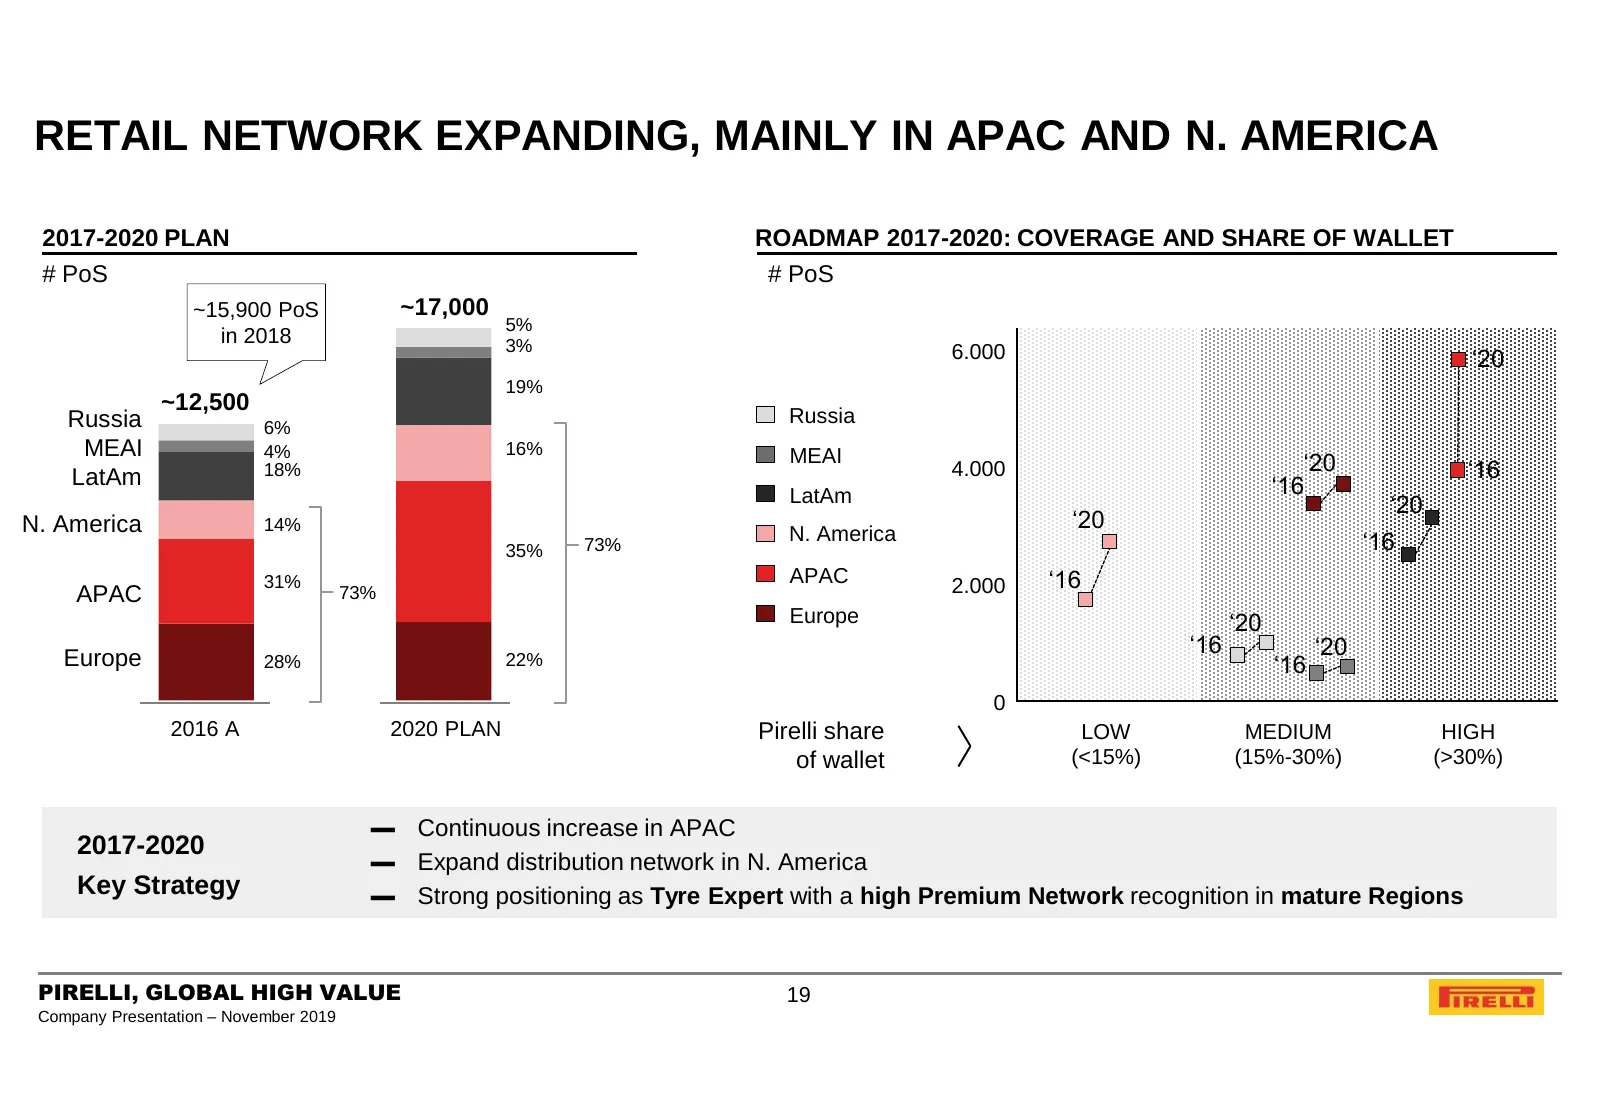
Slide 19: Retail Network Expanding, Mainly in APAC and N. America
RETAIL NETWORK EXPANDING, MAINLY IN APAC AND N. AMERICA 2017-2020 PLAN ROADMAP 2017-2020: COVERAGE AND SHARE OF WALLET # PoS # PoS ~15,900 PoS ~17,000 5% in 2018 3% 6.000 ‘20 19% ~12,500 Russia Russia 6% MEAI 4% 16% MEAI 18% 4.000 ‘20 ‘16 LatAm ‘16 LatAm ‘20 N. America 14% ‘20 73% N. America ‘16 35%
Slide 20: Agenda
AGENDA 1. PIRELLI AT A GLANCE 2. BUSINESS MODEL 3. KEY INVESTMENT HIGHLIGHTS 4. MARKET AND COMPETITION 5. 9M 2019 FINANCIAL RESULTS AND 2019 OUTLOOK 6. FY 2018 FINANCIAL RESULTS AND 2019 OUTLOOK 7. GOVERNANCE 8. SUSTAINABILITY 9. APPENDIX PIRELLI, GLOBAL HIGH VALUE 20 Company Presentation – November
Slide 21: Key Investment Highlights
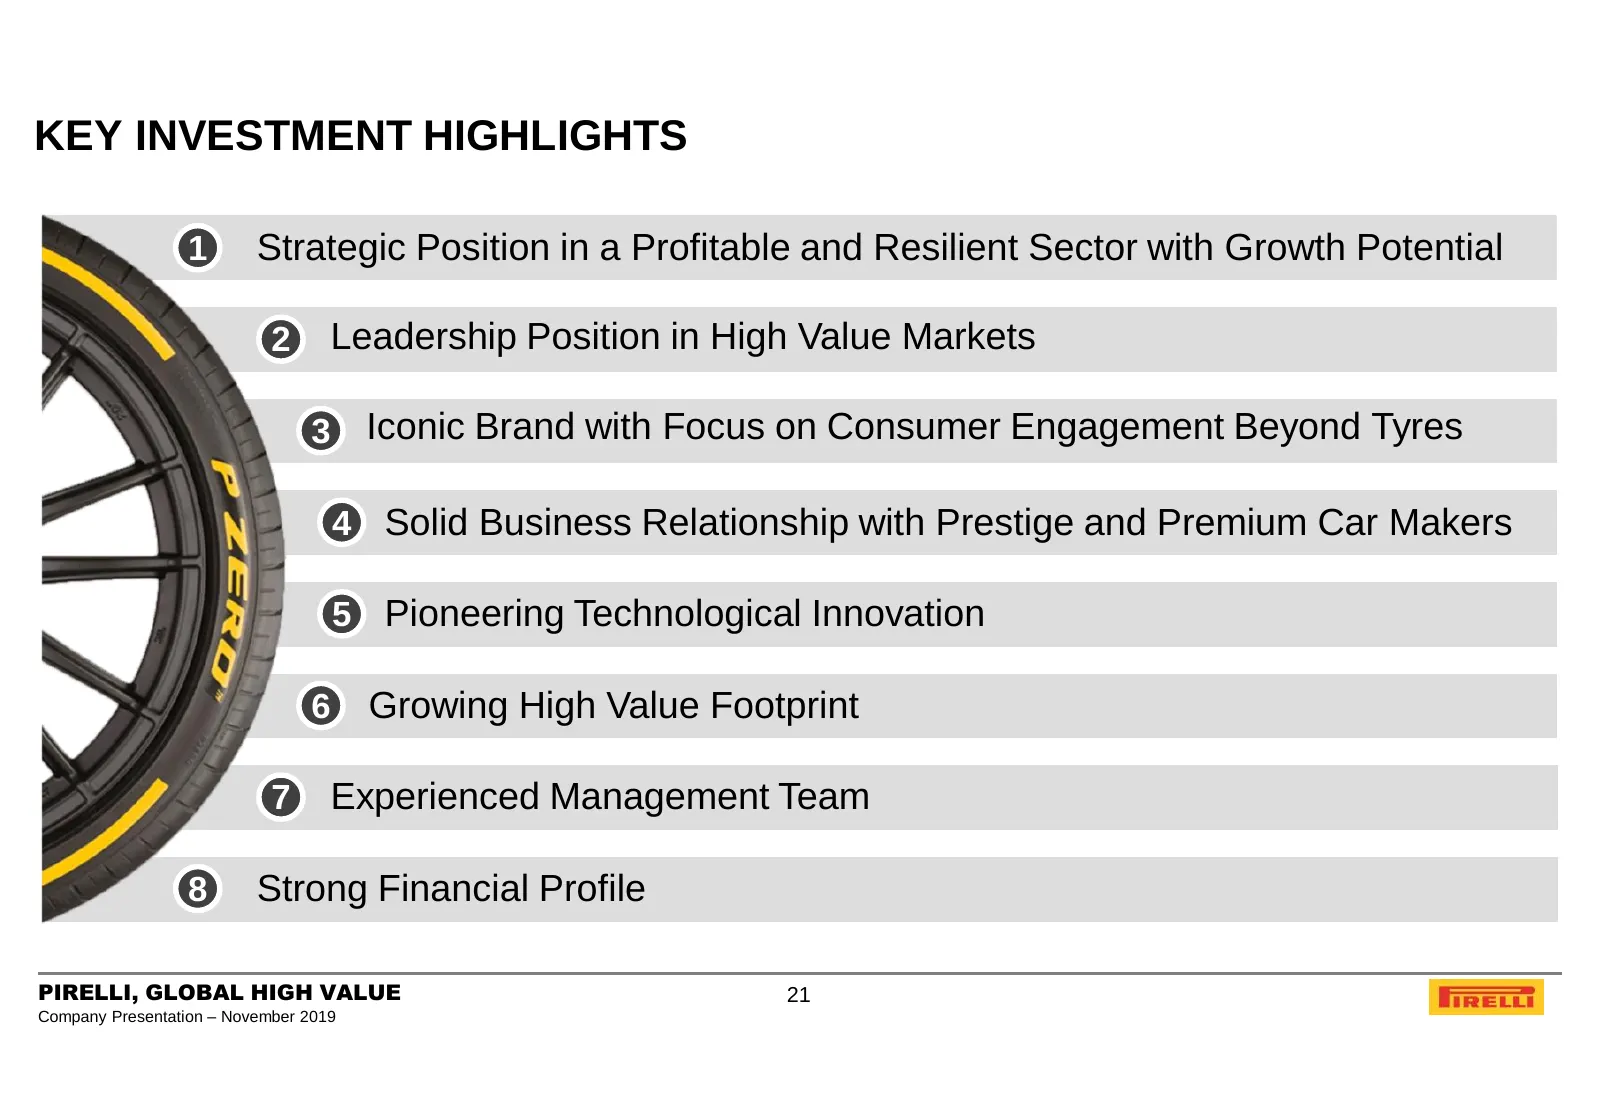
KEY INVESTMENT HIGHLIGHTS 1 Strategic Position in a Profitable and Resilient Sector with Growth Potential 2 Leadership Position in High Value Markets 3 Iconic Brand with Focus on Consumer Engagement Beyond Tyres 4 Solid Business Relationship with Prestige and Premium Car Makers 5 Pioneering Technolo
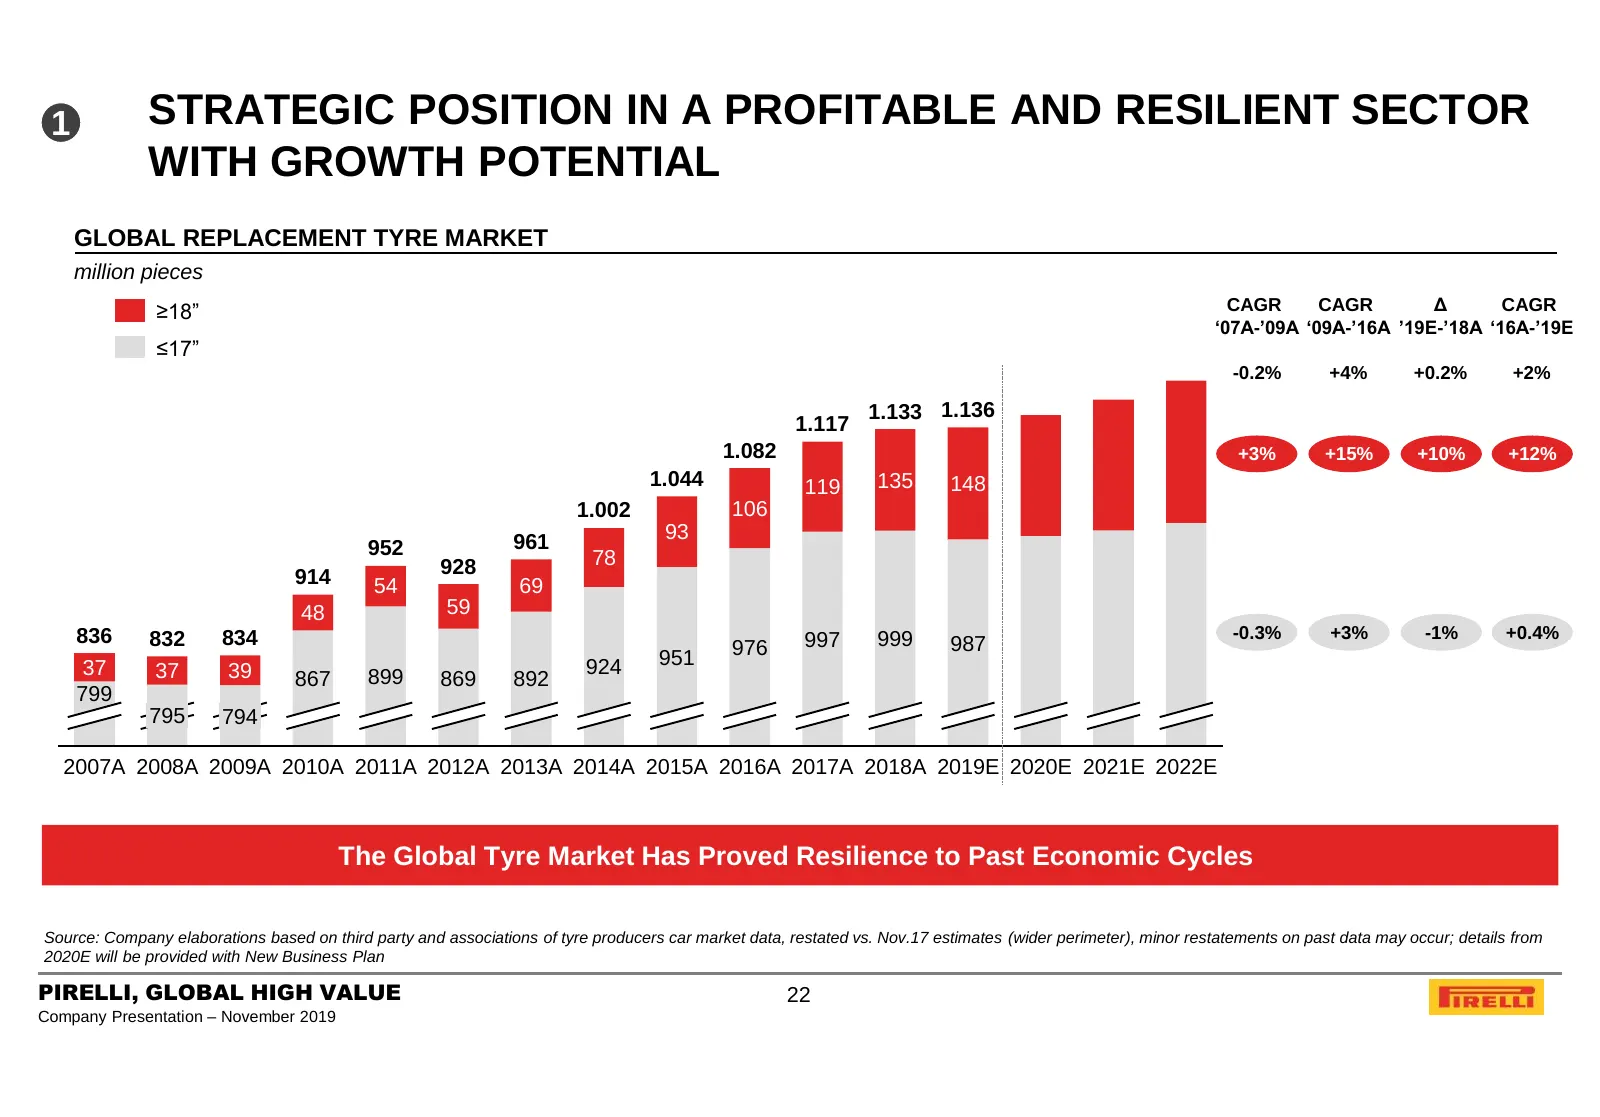
Slide 22: Strategic Position in a Profitable and Resilient Sector
1 STRATEGIC POSITION IN A PROFITABLE AND RESILIENT SECTOR WITH GROWTH POTENTIAL GLOBAL REPLACEMENT TYRE MARKET million pieces ≥18” CAGR CAGR Δ CAGR ‘07A-’09A ‘09A-’16A ’19E-’18A ‘16A-’19E ≤17” -0.2% +4% +0.2% +2% 1.133 1.136 1.117 1.082 +3% +15% +10% +12% 1.044 119 135 148 1.002 106 961 93 952 78 91
Slide 23: Strong Focus on Prestige & Premium Geographies
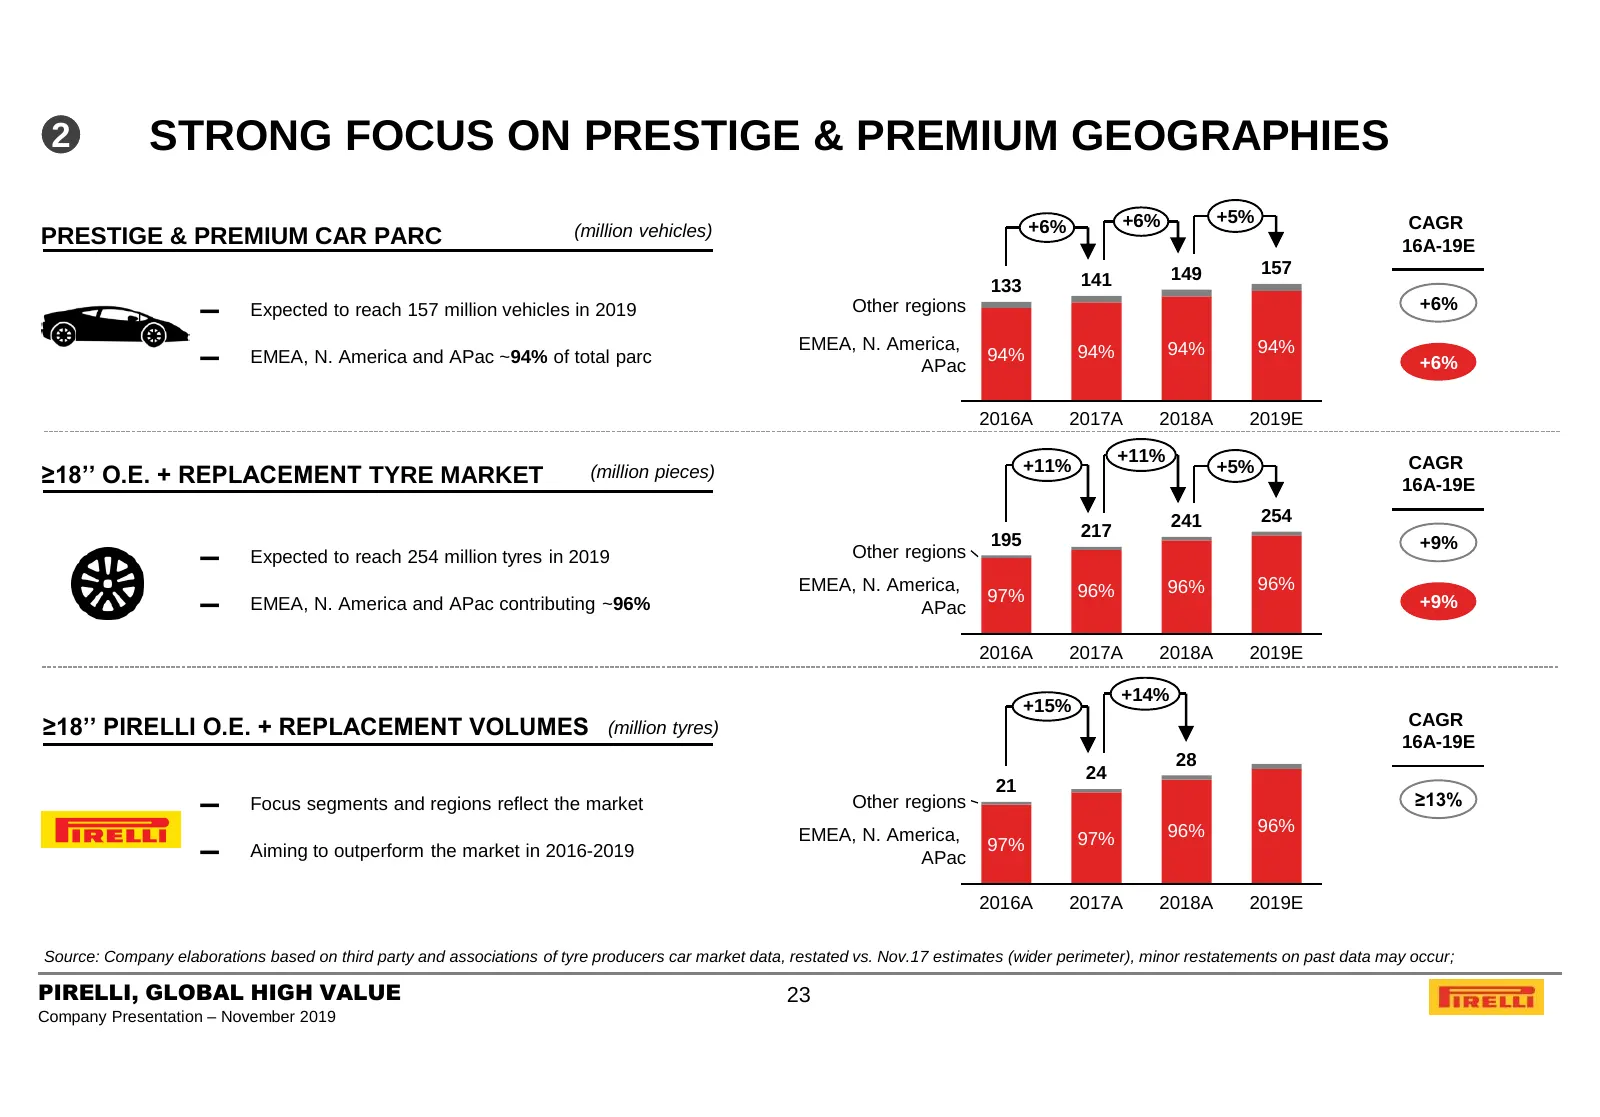
2 STRONG FOCUS ON PRESTIGE & PREMIUM GEOGRAPHIES +6% +5% CAGR (million vehicles) +6% PRESTIGE & PREMIUM CAR PARC 16A-19E 149 157 133 141 ▬ Expected to reach 157 million vehicles in 2019 Other regions +6% EMEA, N. America, 94% 94% 94% ▬ EMEA, N. America and APac ~94% of total parc APac 94% +6% 2016A
Slide 24: Leadership Position in High Value Markets
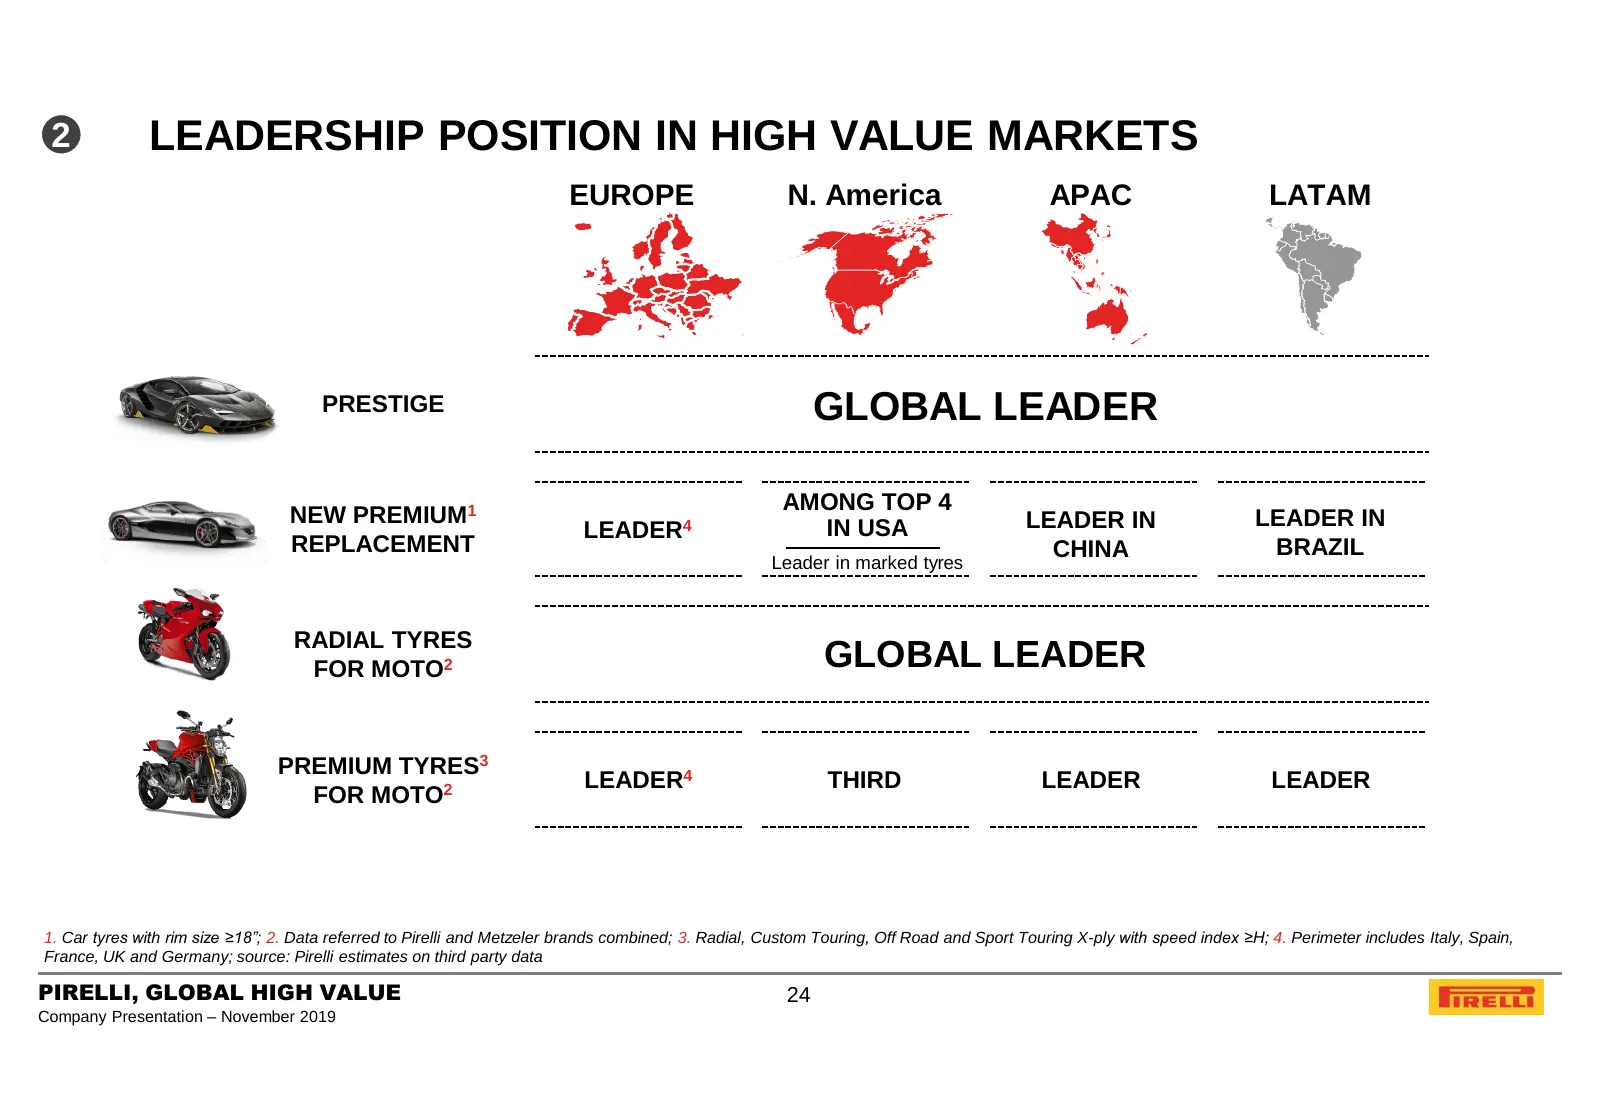
2 LEADERSHIP POSITION IN HIGH VALUE MARKETS EUROPE N. America APAC LATAM PRESTIGE GLOBAL LEADER AMONG TOP 4 NEW PREMIUM1 LEADER IN LEADER 1 IN LEADER4 IN USA 3 REPLACEMENT CHINA BRAZIL Leader in marked tyres RADIAL TYRES FOR MOTO2 GLOBAL LEADER PREMIUM TYRES3 LEADER4 THIRD LEADER LEADER FOR MOTO2 1.
Slide 25: Iconic Brand Globally Recognised
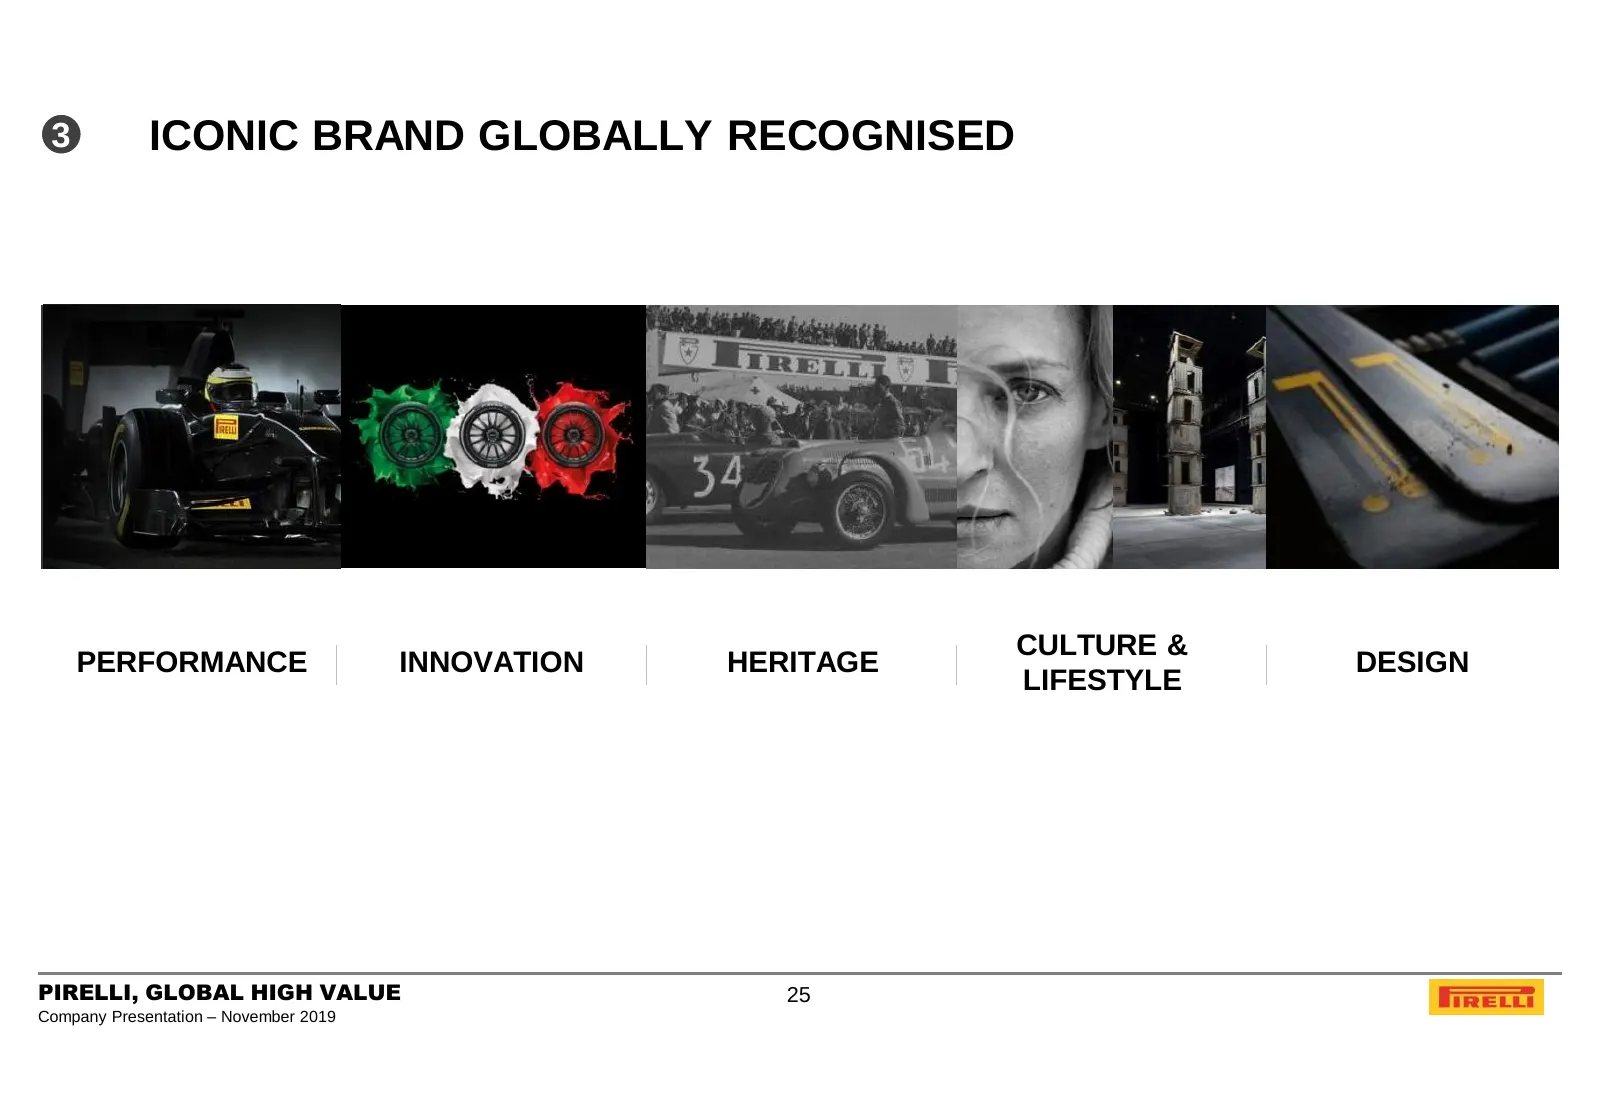
3 ICONIC BRAND GLOBALLY RECOGNISED CULTURE & PERFORMANCE INNOVATION HERITAGE DESIGN LIFESTYLE PIRELLI, GLOBAL HIGH VALUE 25 Company Presentation – November 2019
Slide 26: Iconic Brand Globally Recognised
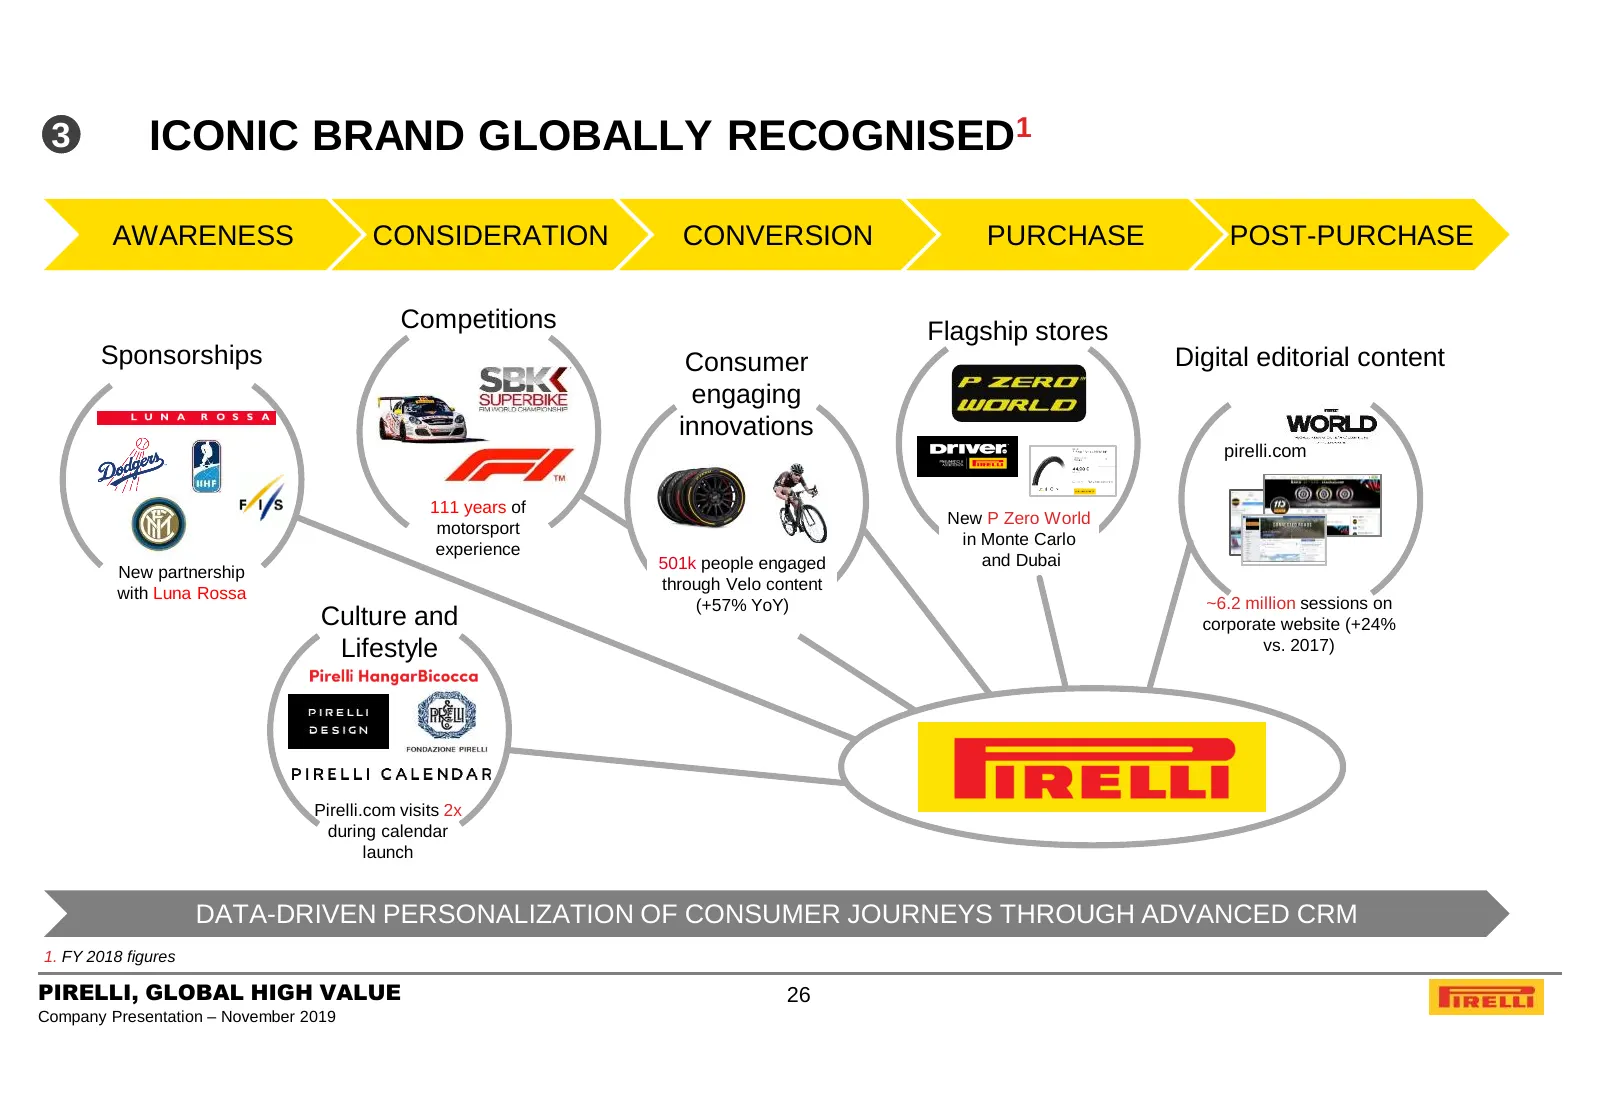
3 ICONIC BRAND GLOBALLY RECOGNISED1 AWARENESS AWARENESS CONSIDERATION CONSIDERATION CONVERSION CONVERSION PURCHASE PURCHASE POST-PURCHASE Competitions Flagship stores Sponsorships Consumer Digital editorial content engaging innovations pirelli.com 111 years of New P Zero World motorsport in Monte Ca
Slide 27: Solid Business Relationship with Prestige and Premium Car Makers
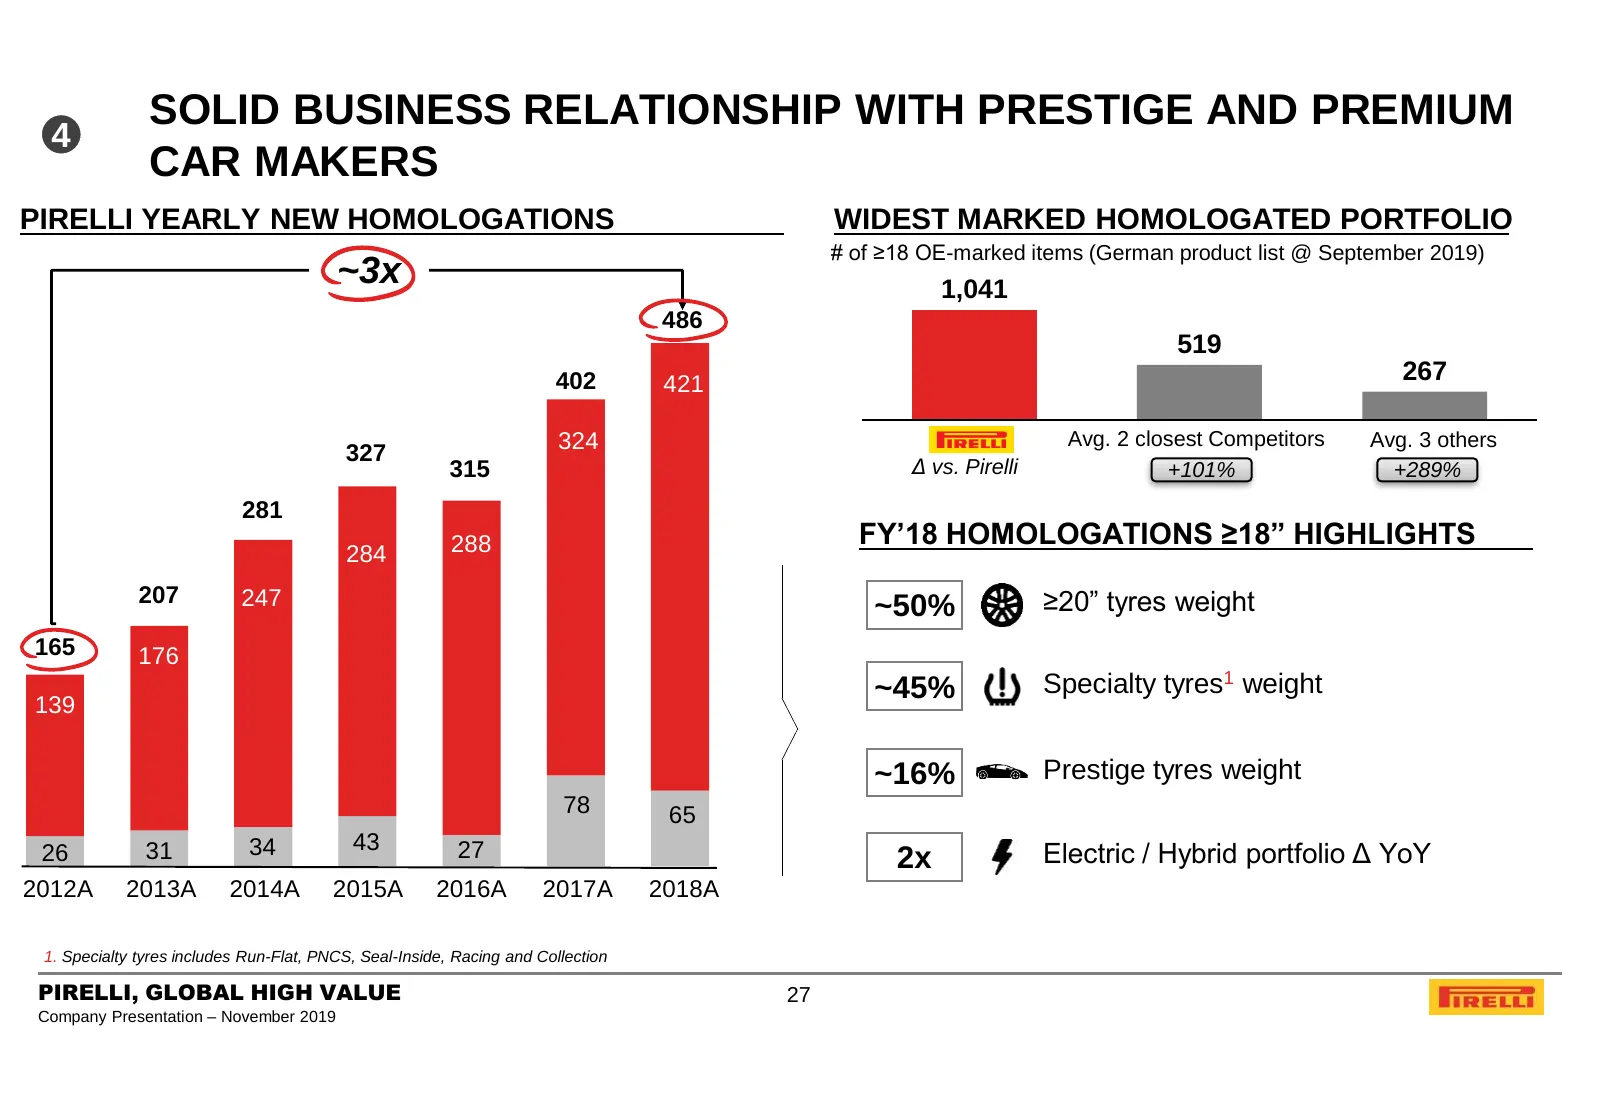
SOLID BUSINESS RELATIONSHIP WITH PRESTIGE AND PREMIUM 4 CAR MAKERS PIRELLI YEARLY NEW HOMOLOGATIONS WIDEST MARKED HOMOLOGATED PORTFOLIO # of ≥18 OE-marked items (German product list @ September 2019) ~3x 1,041 486 519 402 421 267 324 Avg. 2 closest Competitors Avg. 3 others 327 315 Δ vs. Pirelli +10
Slide 28: Best-in-Class R&D Platform
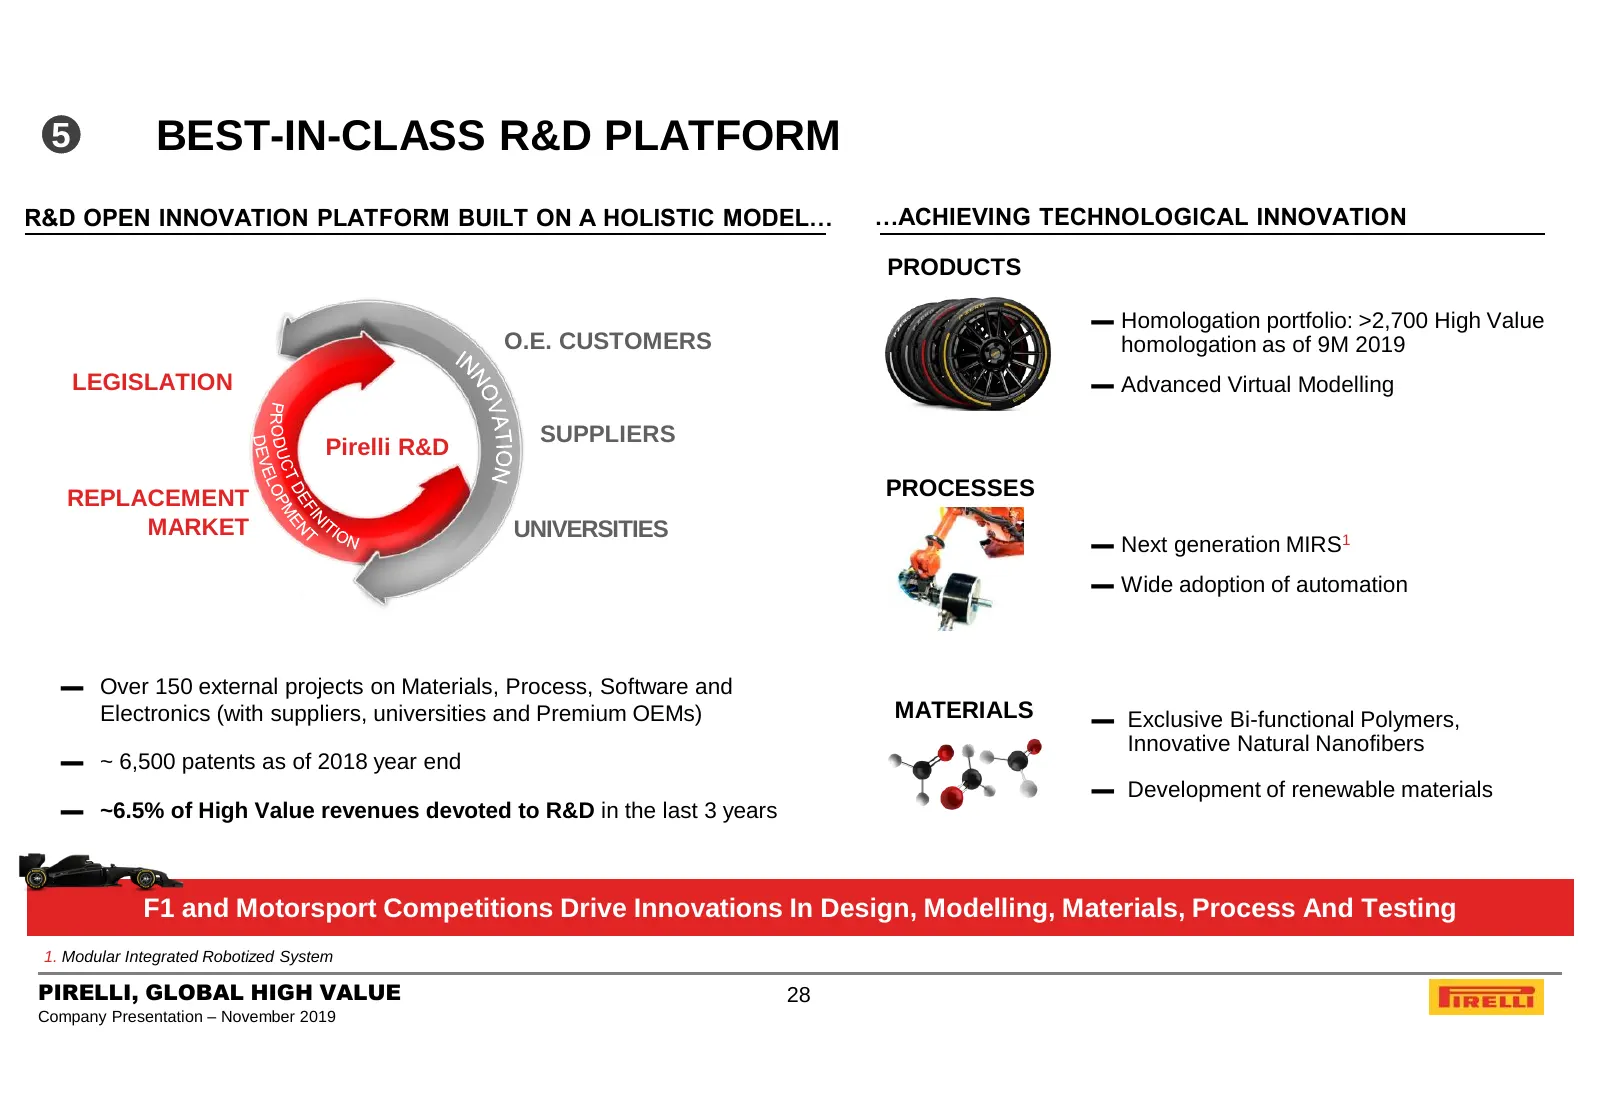
5 BEST-IN-CLASS R&D PLATFORM R&D OPEN INNOVATION PLATFORM BUILT ON A HOLISTIC MODEL… …ACHIEVING TECHNOLOGICAL INNOVATION PRODUCTS ▬ Homologation portfolio: >2,700 High Value O.E. CUSTOMERS homologation as of 9M 2019 LEGISLATION ▬ Advanced Virtual Modelling SUPPLIERS Pirelli R&D REPLACEMENT PROCESSES
Slide 29: Growing High Value Manufacturing & Retail Footprint
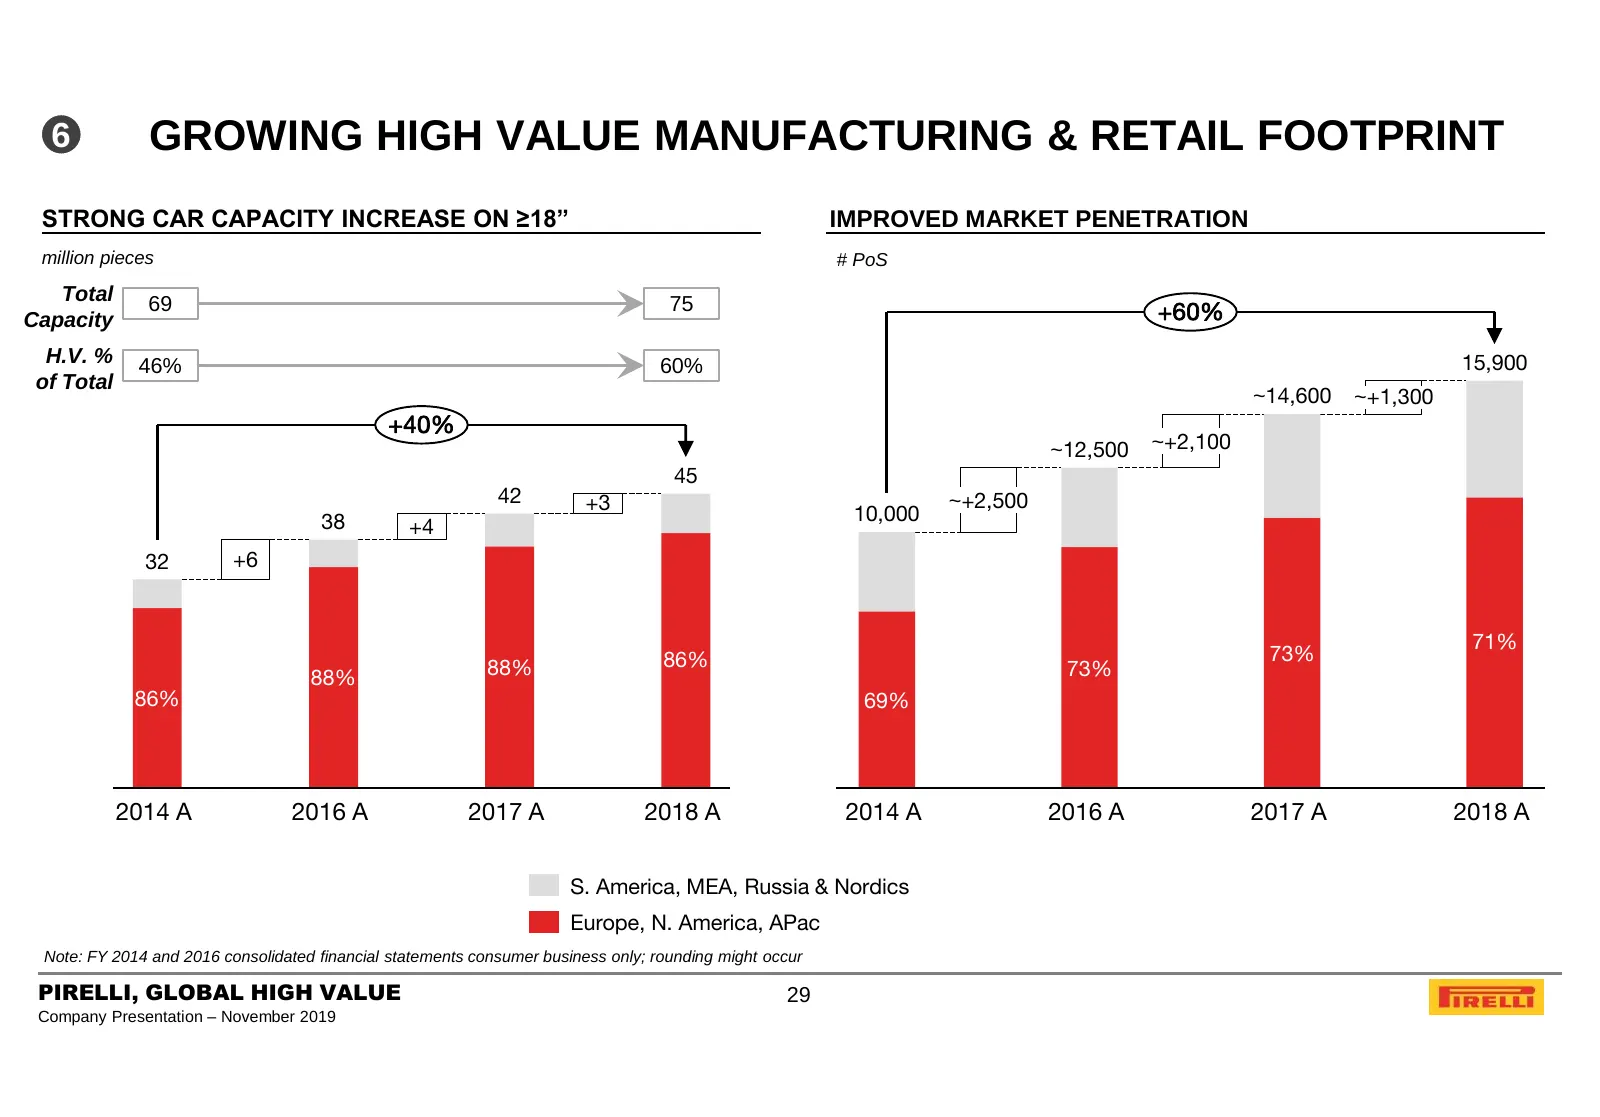
6 GROWING HIGH VALUE MANUFACTURING & RETAIL FOOTPRINT STRONG CAR CAPACITY INCREASE ON ≥18” IMPROVED MARKET PENETRATION million pieces # PoS Total 69 75 Capacity +60% H.V. % 46% 60% 15,900 of Total ~14,600 ~+1,300 +40% ~12,500 ~+2,100 45 42 +3 ~+2,500 38 10,000 +4 32 +6 71% 86% 73% 88% 88% 73% 86% 69
Slide 30: Experienced Management Team
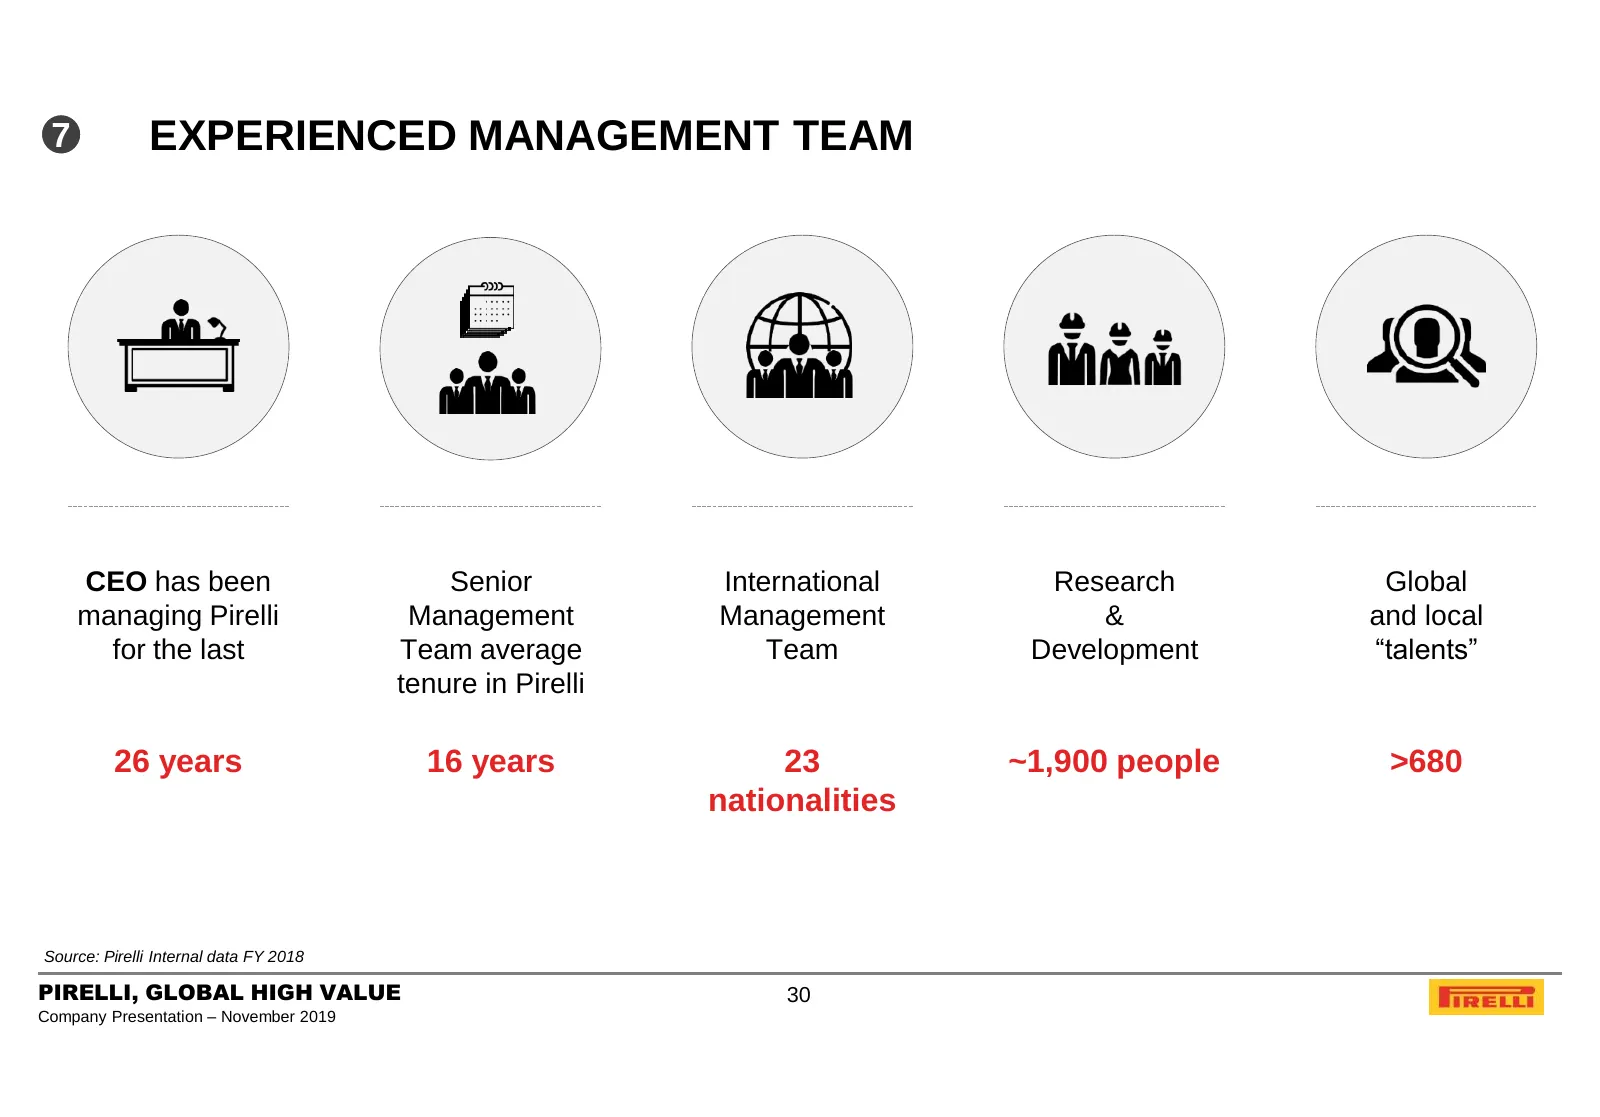
7 EXPERIENCED MANAGEMENT TEAM CEO has been Senior International Research Global managing Pirelli Management Management & and local for the last Team average Team Development “talents” tenure in Pirelli 26 years 16 years 23 ~1,900 people >680 nationalities Source: Pirelli Internal data FY 2018 PIRELL
Slide 31: Organizational Structure
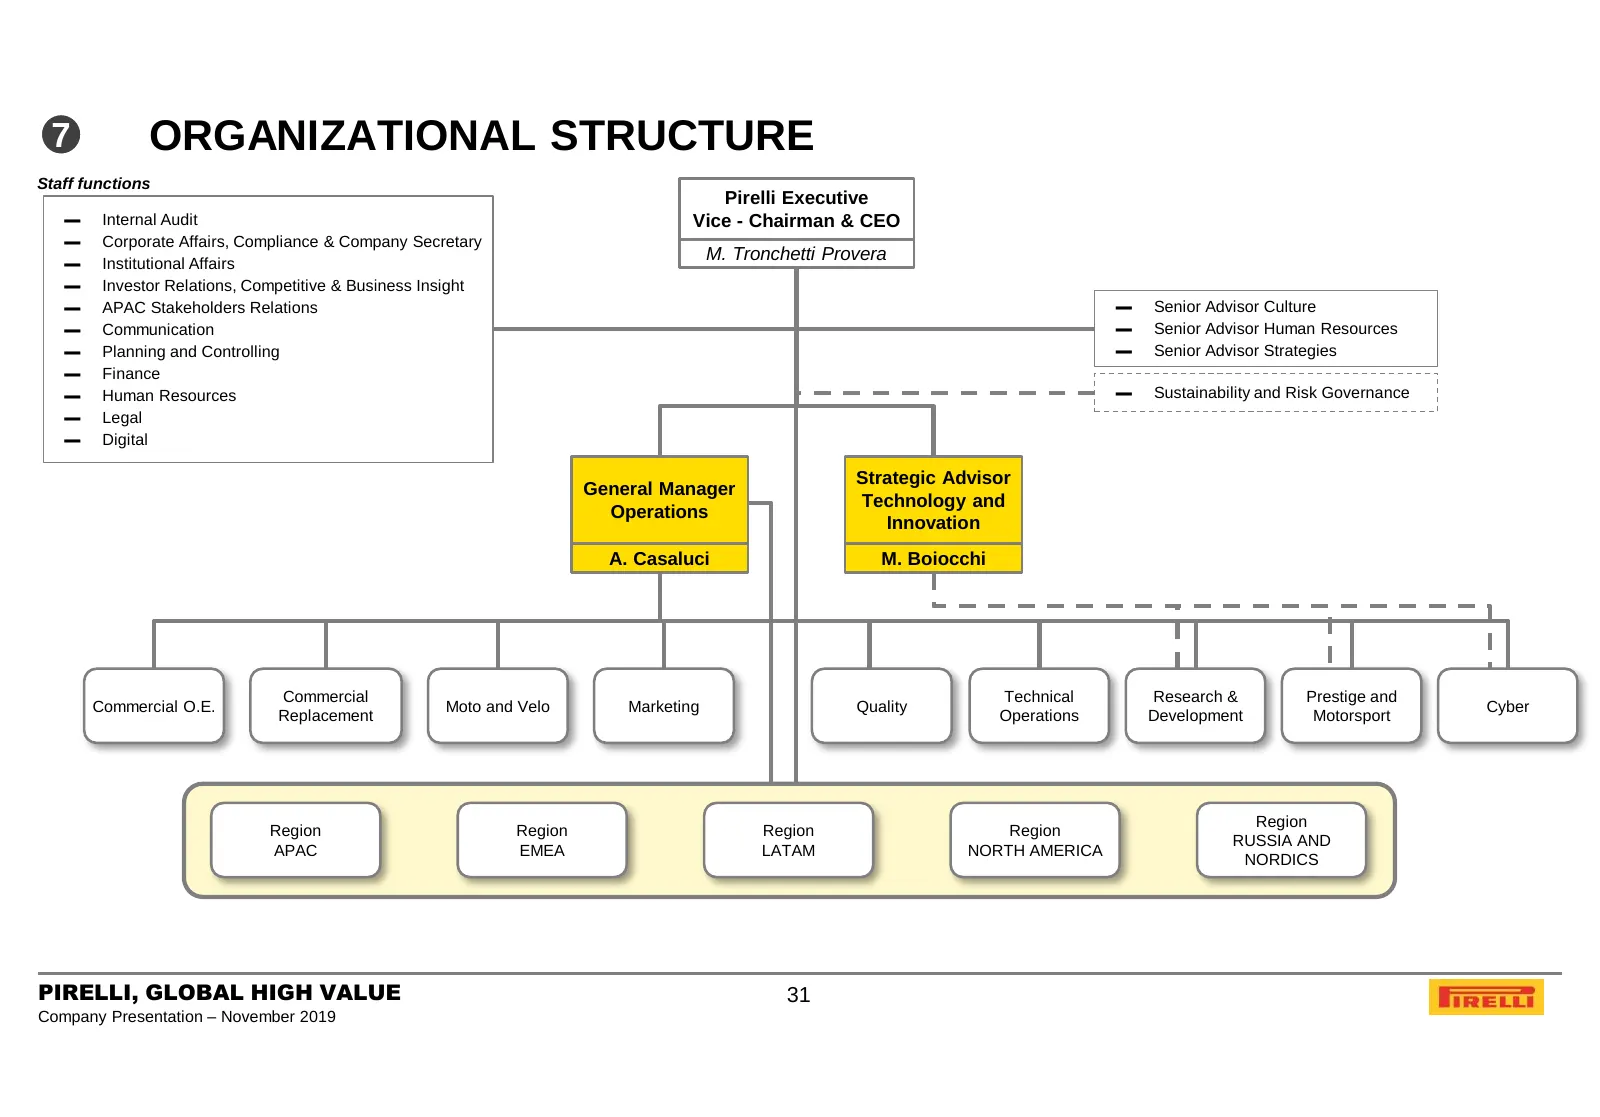
7 ORGANIZATIONAL STRUCTURE Staff functions Pirelli Executive ▬ Internal Audit Vice - Chairman & CEO ▬ Corporate Affairs, Compliance & Company Secretary ▬ Institutional Affairs M. Tronchetti Provera ▬ Investor Relations, Competitive & Business Insight ▬ APAC Stakeholders Relations ▬ Senior Advisor Cu
Slide 32: Strong Financial Profile
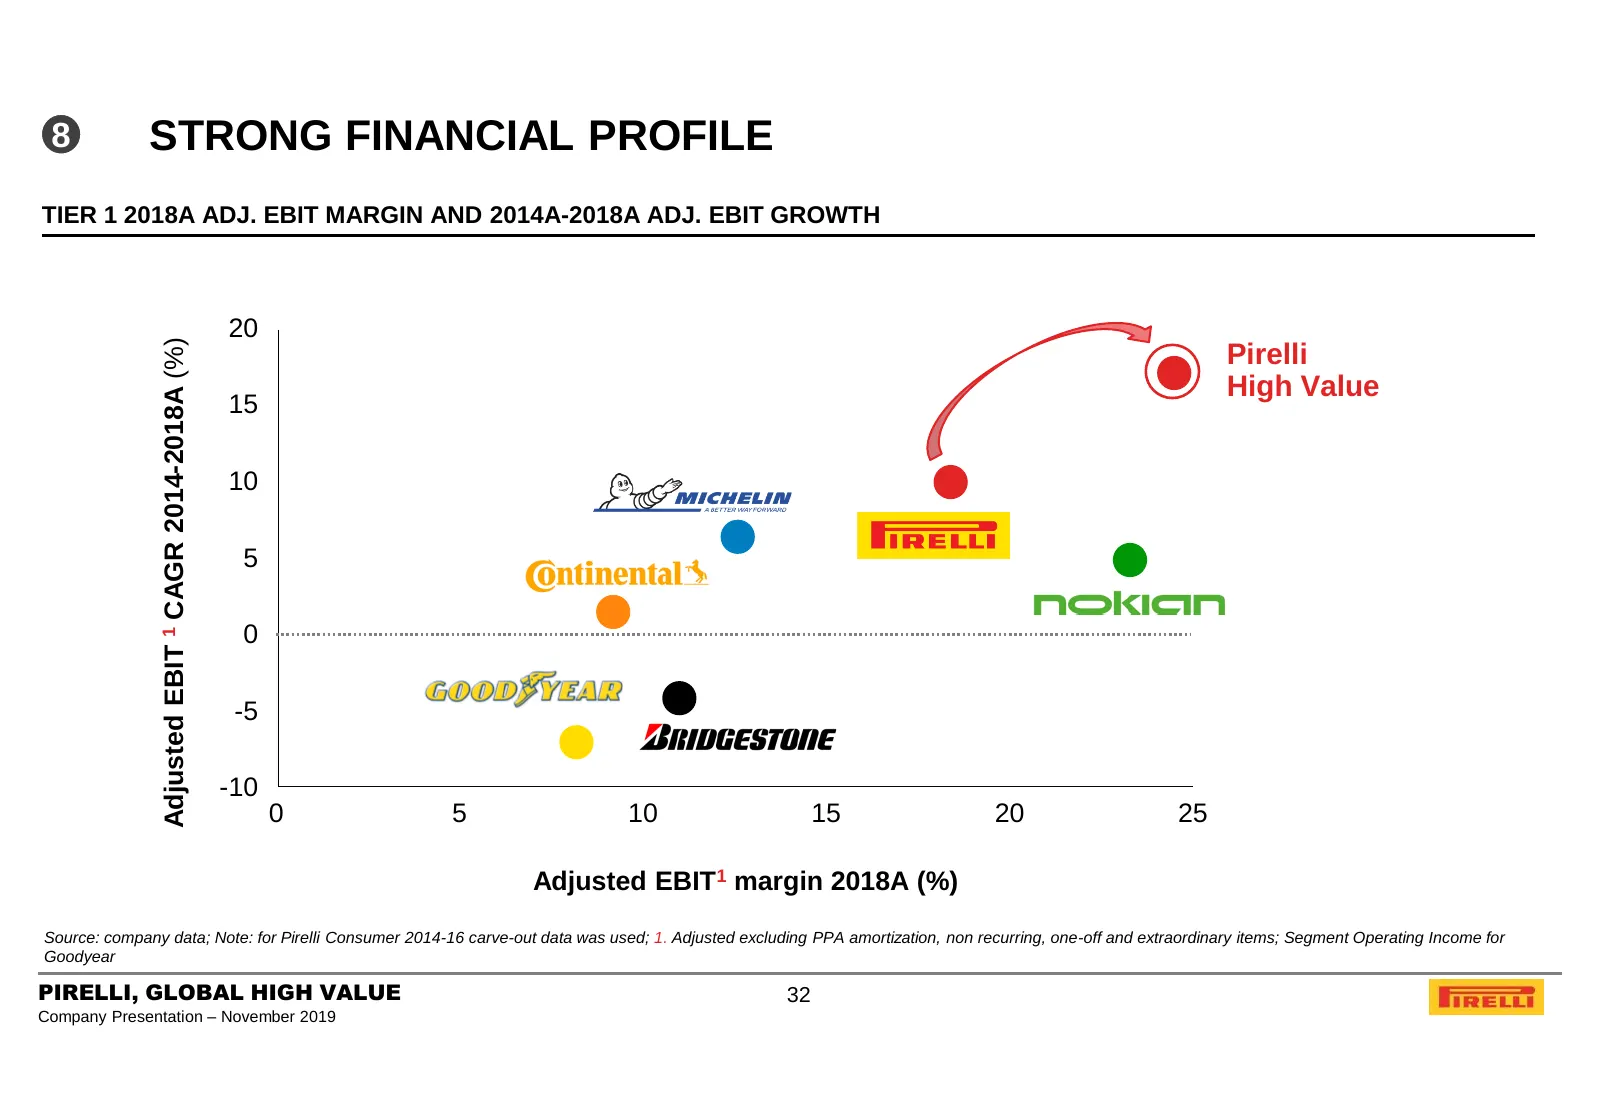
8 STRONG FINANCIAL PROFILE TIER 1 2018A ADJ. EBIT MARGIN AND 2014A-2018A ADJ. EBIT GROWTH 20 Adjusted EBIT 1 CAGR 2014-2018A (%) Pirelli High Value 15 10 5 0 -5 -10 0 5 10 15 20 25 Adjusted EBIT1 margin 2018A (%) Source: company data; Note: for Pirelli Consumer 2014-16 carve-out data was used; 1. Ad
Slide 33: Agenda
AGENDA 1. PIRELLI AT A GLANCE 2. BUSINESS MODEL 3. KEY INVESTMENT HIGHLIGHTS 4. MARKET AND COMPETITION 5. 9M 2019 FINANCIAL RESULTS AND 2019 OUTLOOK 6. FY 2018 FINANCIAL RESULTS AND 2019 OUTLOOK 7. GOVERNANCE 8. SUSTAINABILITY 9. APPENDIX PIRELLI, GLOBAL HIGH VALUE 33 Company Presentation – November
Slide 34: Tyre Market Shifting Towards Higher Rims
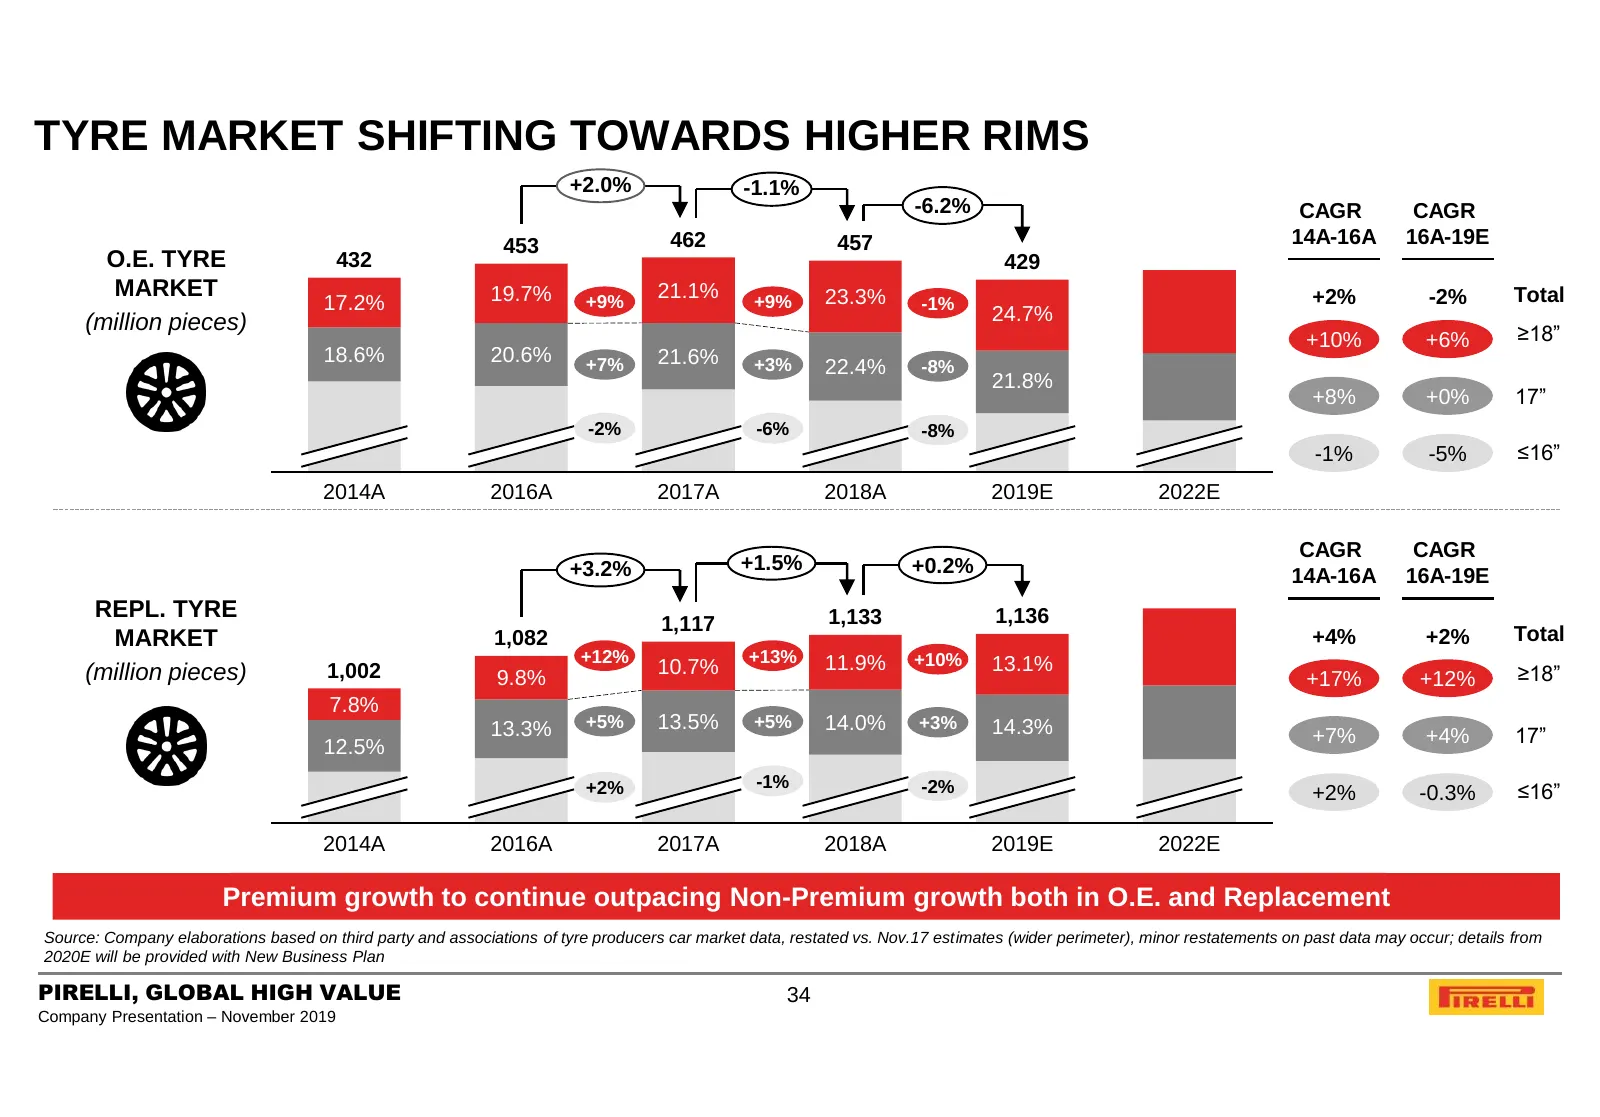
TYRE MARKET SHIFTING TOWARDS HIGHER RIMS +2.0% -1.1% -6.2% CAGR CAGR 453 462 457 14A-16A 16A-19E O.E. TYRE 432 429 MARKET 19.7% 21.1% 23.3% +2% -2% Total 17.2% +9% +9% -1% (million pieces) 24.7% +10% +6% ≥18” 18.6% 20.6% +7% 21.6% +3% 22.4% -8% 21.8% +8% +0% 17” -2% -6% -8% -1% -5% ≤16” 2014A 2016A
Slide 35: Key Drivers of Global High Value Tyre Market Growth
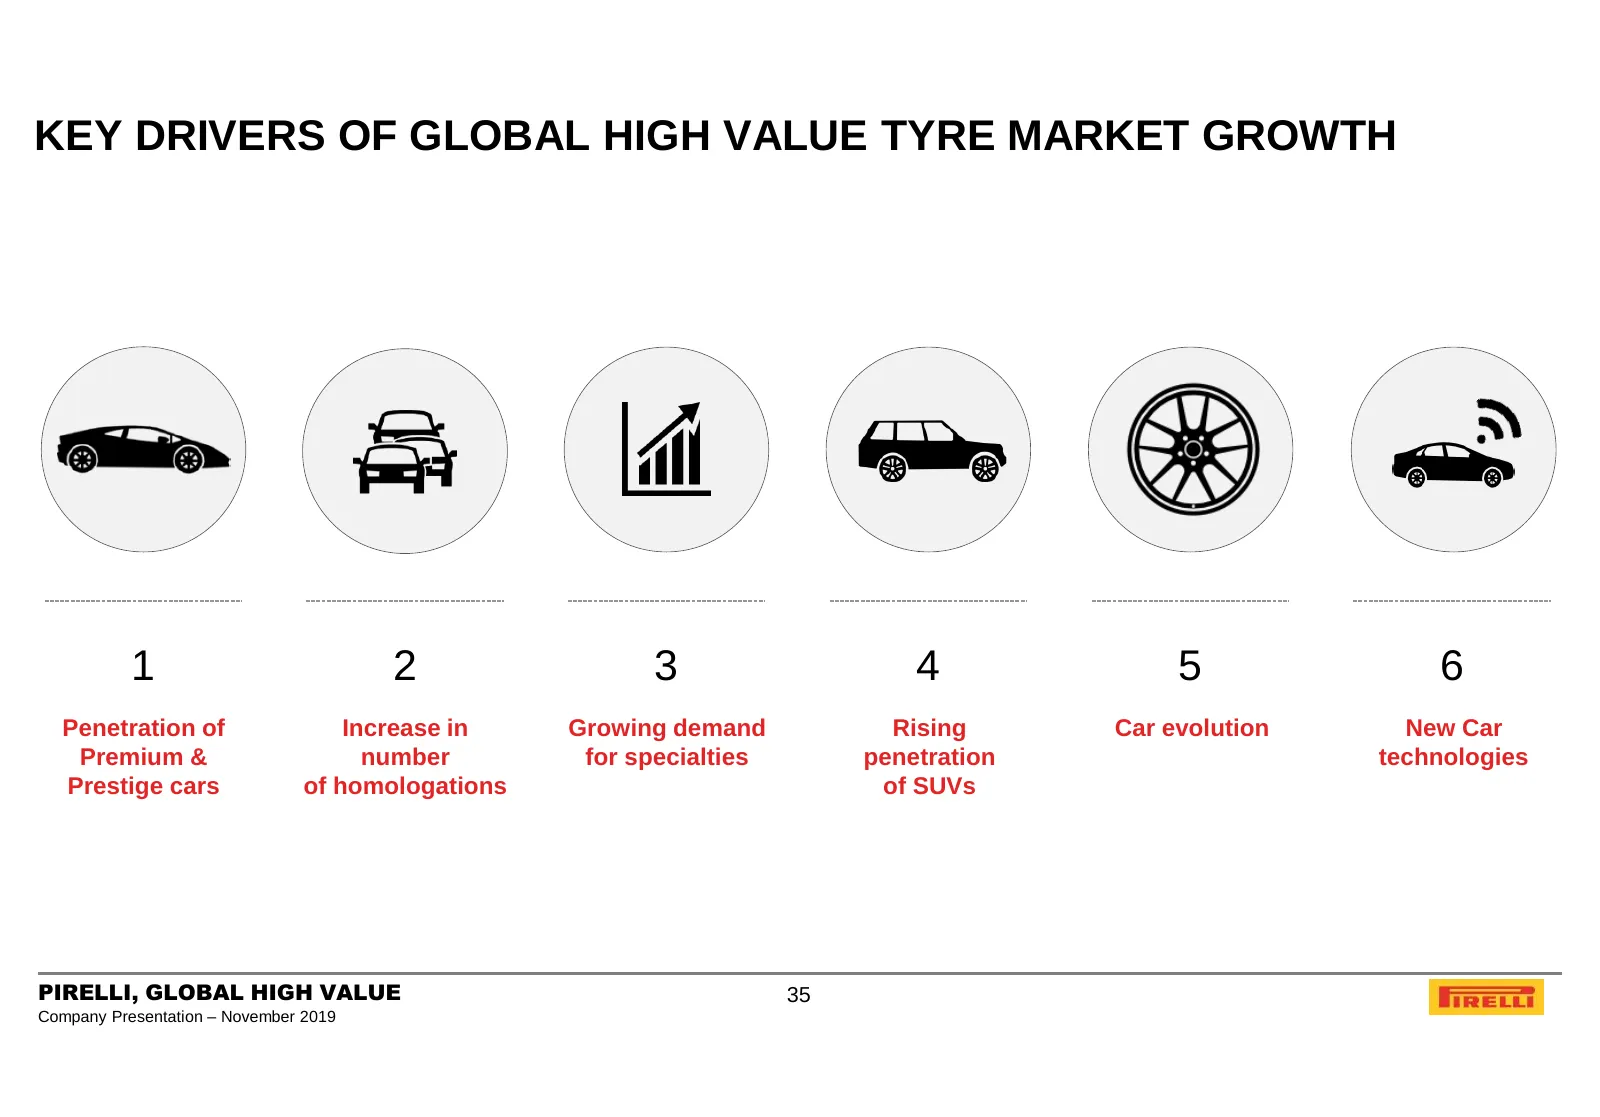
KEY DRIVERS OF GLOBAL HIGH VALUE TYRE MARKET GROWTH 1 2 3 4 5 6 Penetration of Increase in Growing demand Rising Car evolution New Car Premium & number for specialties penetration technologies Prestige cars of homologations of SUVs PIRELLI, GLOBAL HIGH VALUE 35 Company Presentation – November 2019
Slide 36: Driver 1: Rising Penetration of Premium & Prestige Cars
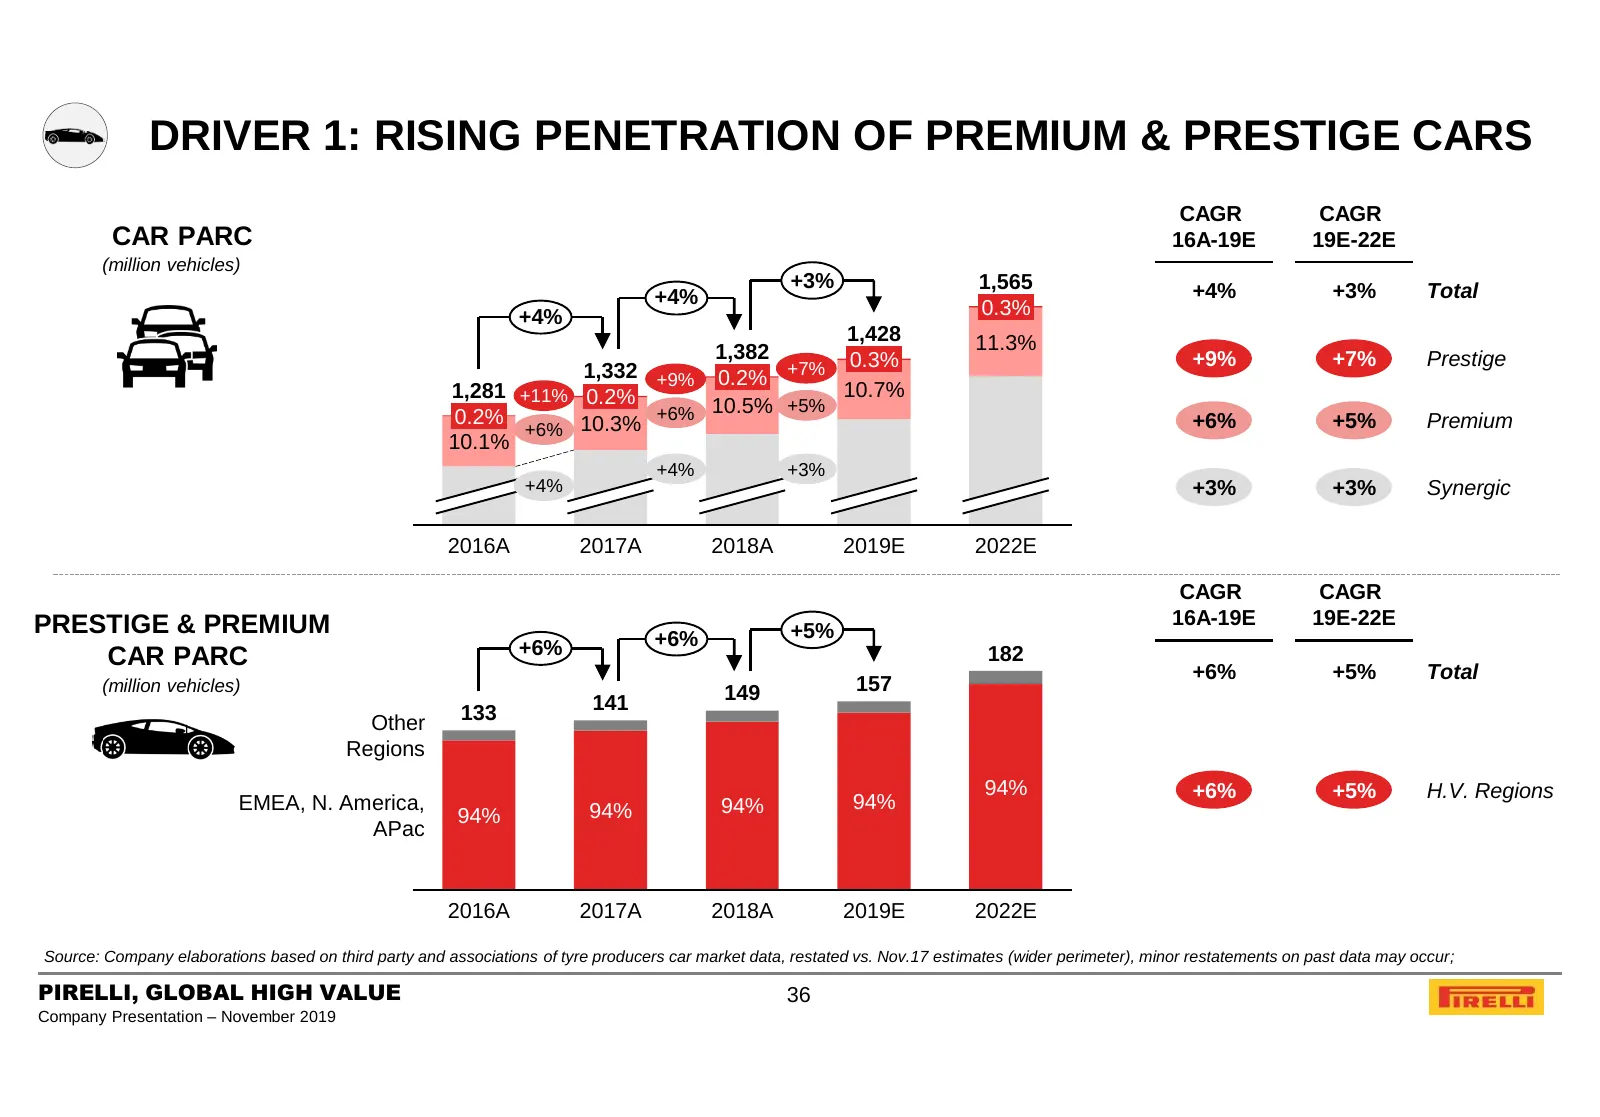
DRIVER 1: RISING PENETRATION OF PREMIUM & PRESTIGE CARS CAGR CAGR CAR PARC 16A-19E 19E-22E (million vehicles) +3% 1,565 +4% +3% Total +4% 0.3% +4% 1,428 11.3% 1,382 0.3% +9% +7% Prestige 1,332 +9% 0.2% +7% 1,281 +11% 0.2% 10.7% 0.2% +6% 10.5% +5% +6% +5% Premium +6% 10.3% 10.1% +4% +3% +4% +3% +3% S
Slide 37: Driver 2: Increase in Number of Homologations
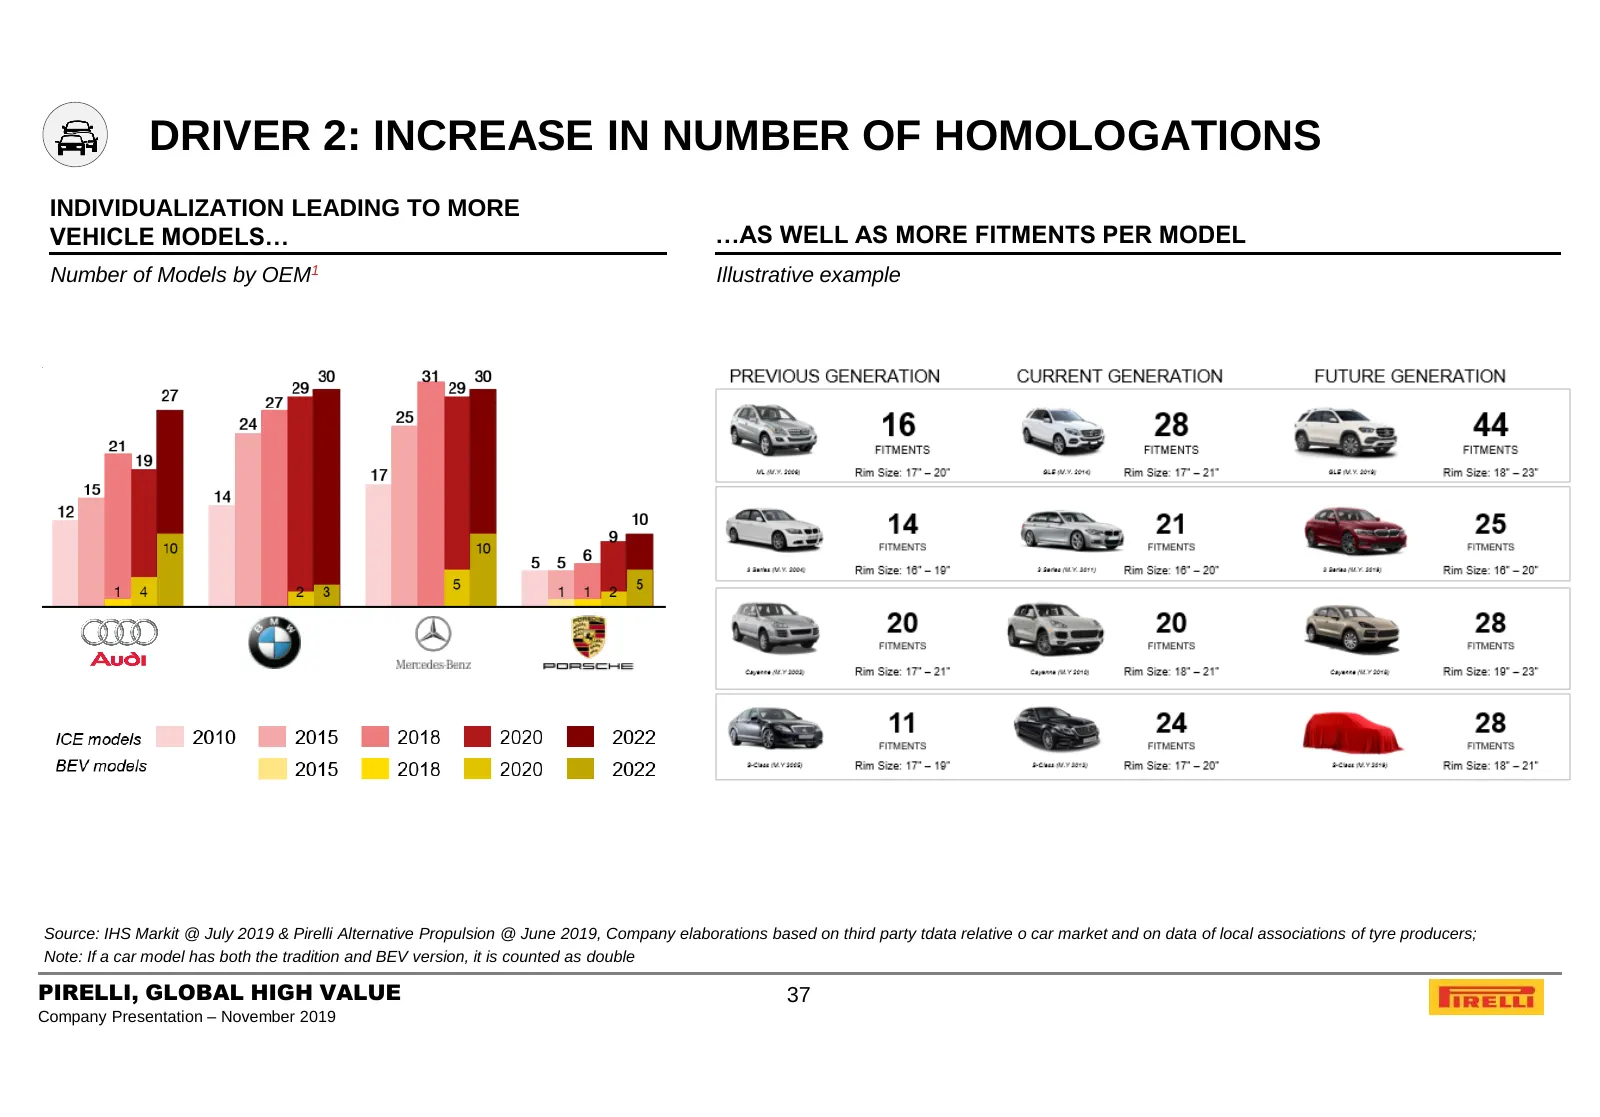
DRIVER 2: INCREASE IN NUMBER OF HOMOLOGATIONS INDIVIDUALIZATION LEADING TO MORE VEHICLE MODELS… …AS WELL AS MORE FITMENTS PER MODEL Number of Models by OEM1 Illustrative example Source: IHS Markit @ July 2019 & Pirelli Alternative Propulsion @ June 2019, Company elaborations based on third party tda
Slide 38: Driver 3: Growing Demand for Specialties
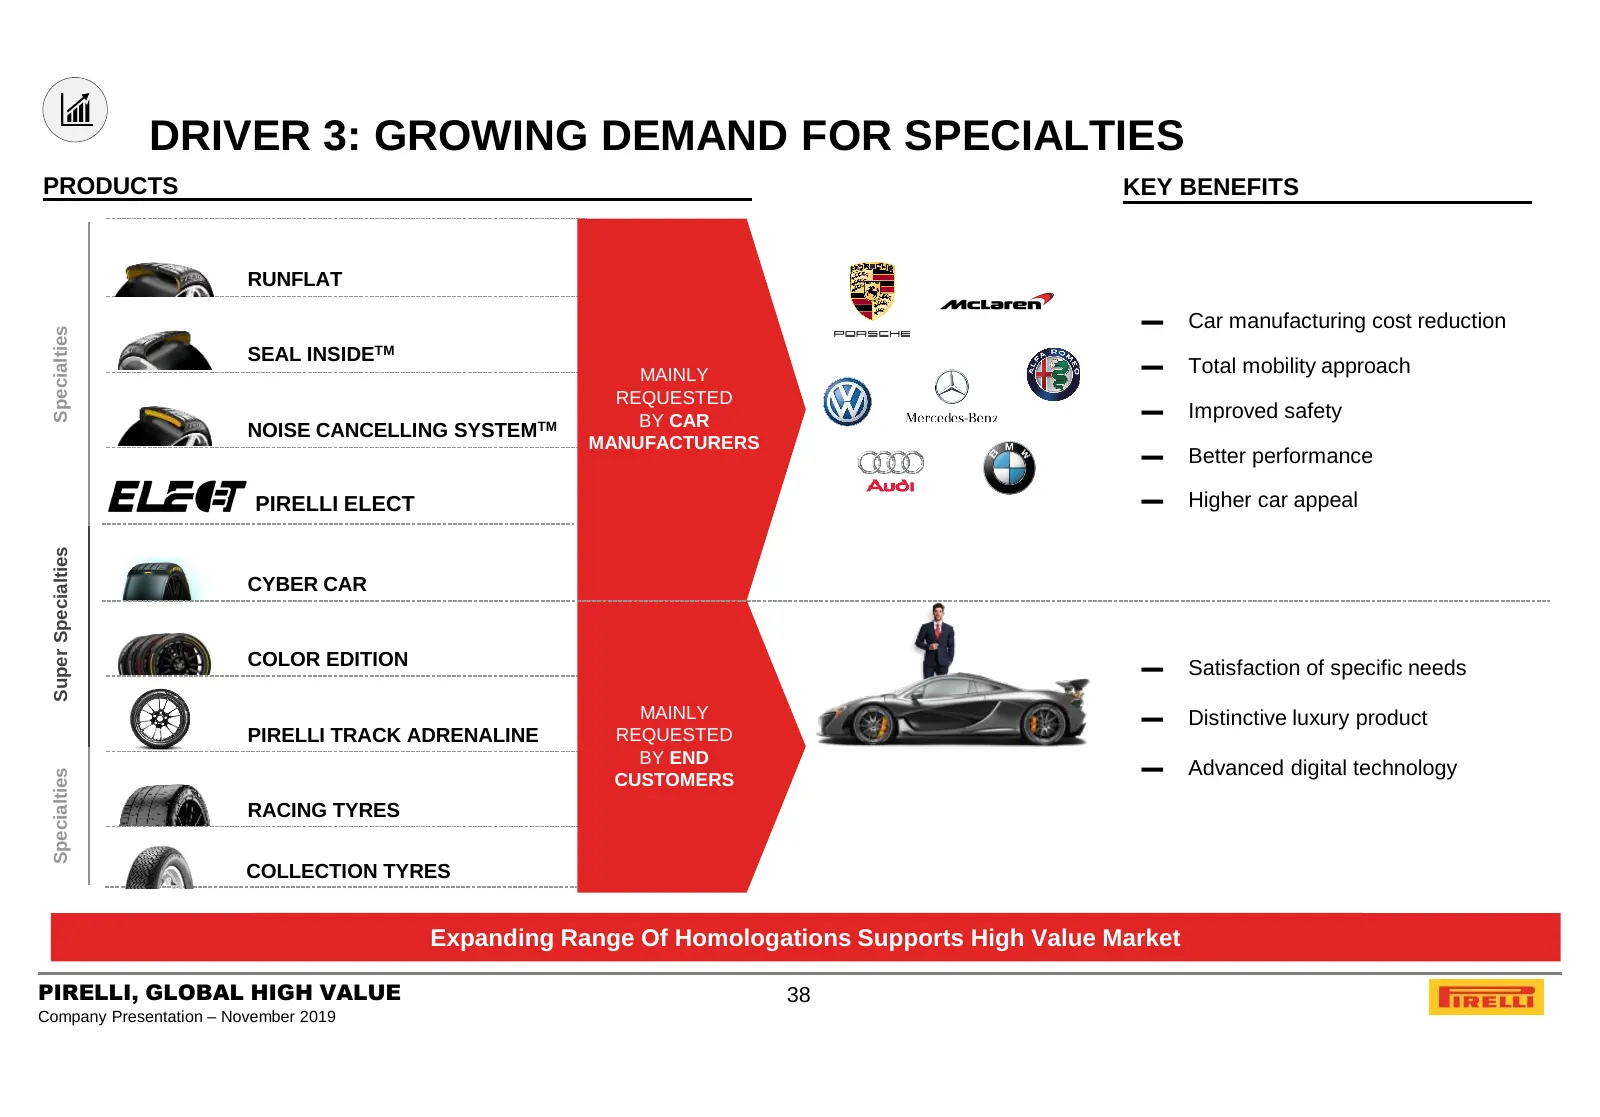
DRIVER 3: GROWING DEMAND FOR SPECIALTIES PRODUCTS KEY BENEFITS RUNFLAT ▬ Car manufacturing cost reduction Specialties SEAL INSIDETM MAINLY ▬ Total mobility approach REQUESTED BY CAR ▬ Improved safety NOISE CANCELLING SYSTEMTM MANUFACTURERS ▬ Better performance PIRELLI ELECT ▬ Higher car appeal Super
Slide 39: Driver 4 & 5: Rising SUV Penetration and Higher Rims
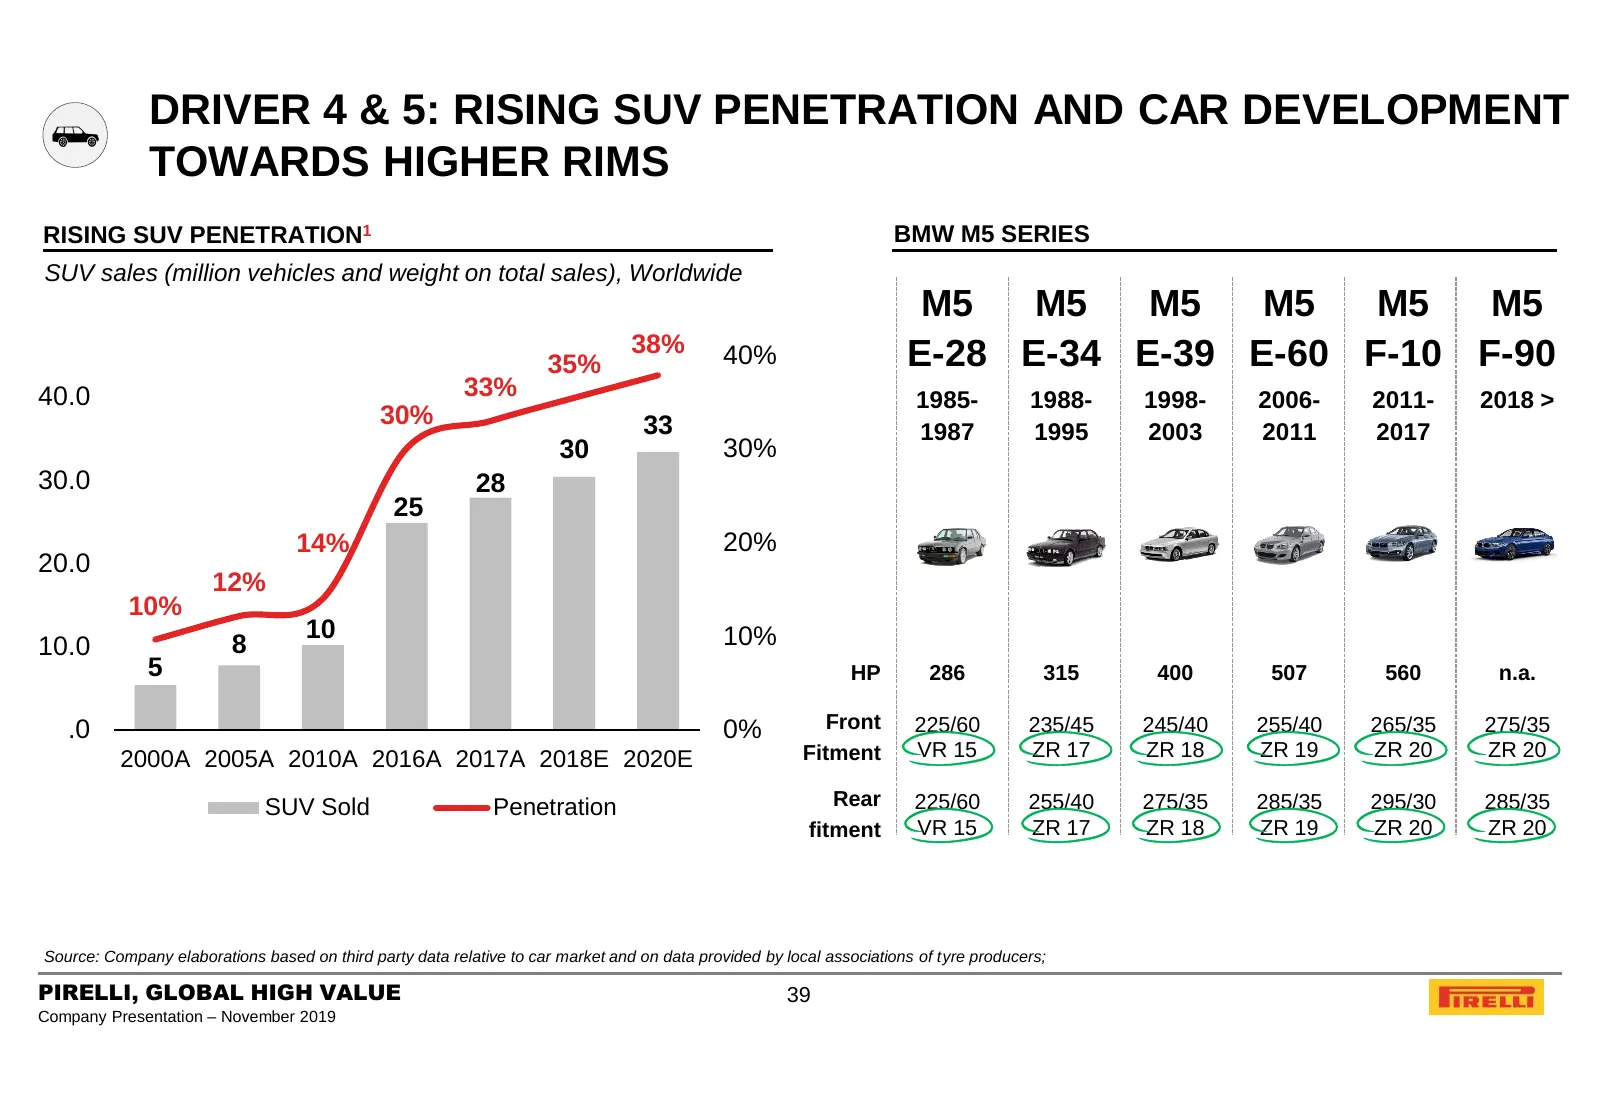
DRIVER 4 & 5: RISING SUV PENETRATION AND CAR DEVELOPMENT TOWARDS HIGHER RIMS RISING SUV PENETRATION1 BMW M5 SERIES SUV sales (million vehicles and weight on total sales), Worldwide M5 M5 M5 M5 M5 M5 38% 40% E-28 E-34 E-39 E-60 F-10 F-90 35% 40.0 33% 1985- 1988- 1998- 2006- 2011- 2018 > 30% 33 1987 1
Slide 40: Driver 6: New Car Technologies
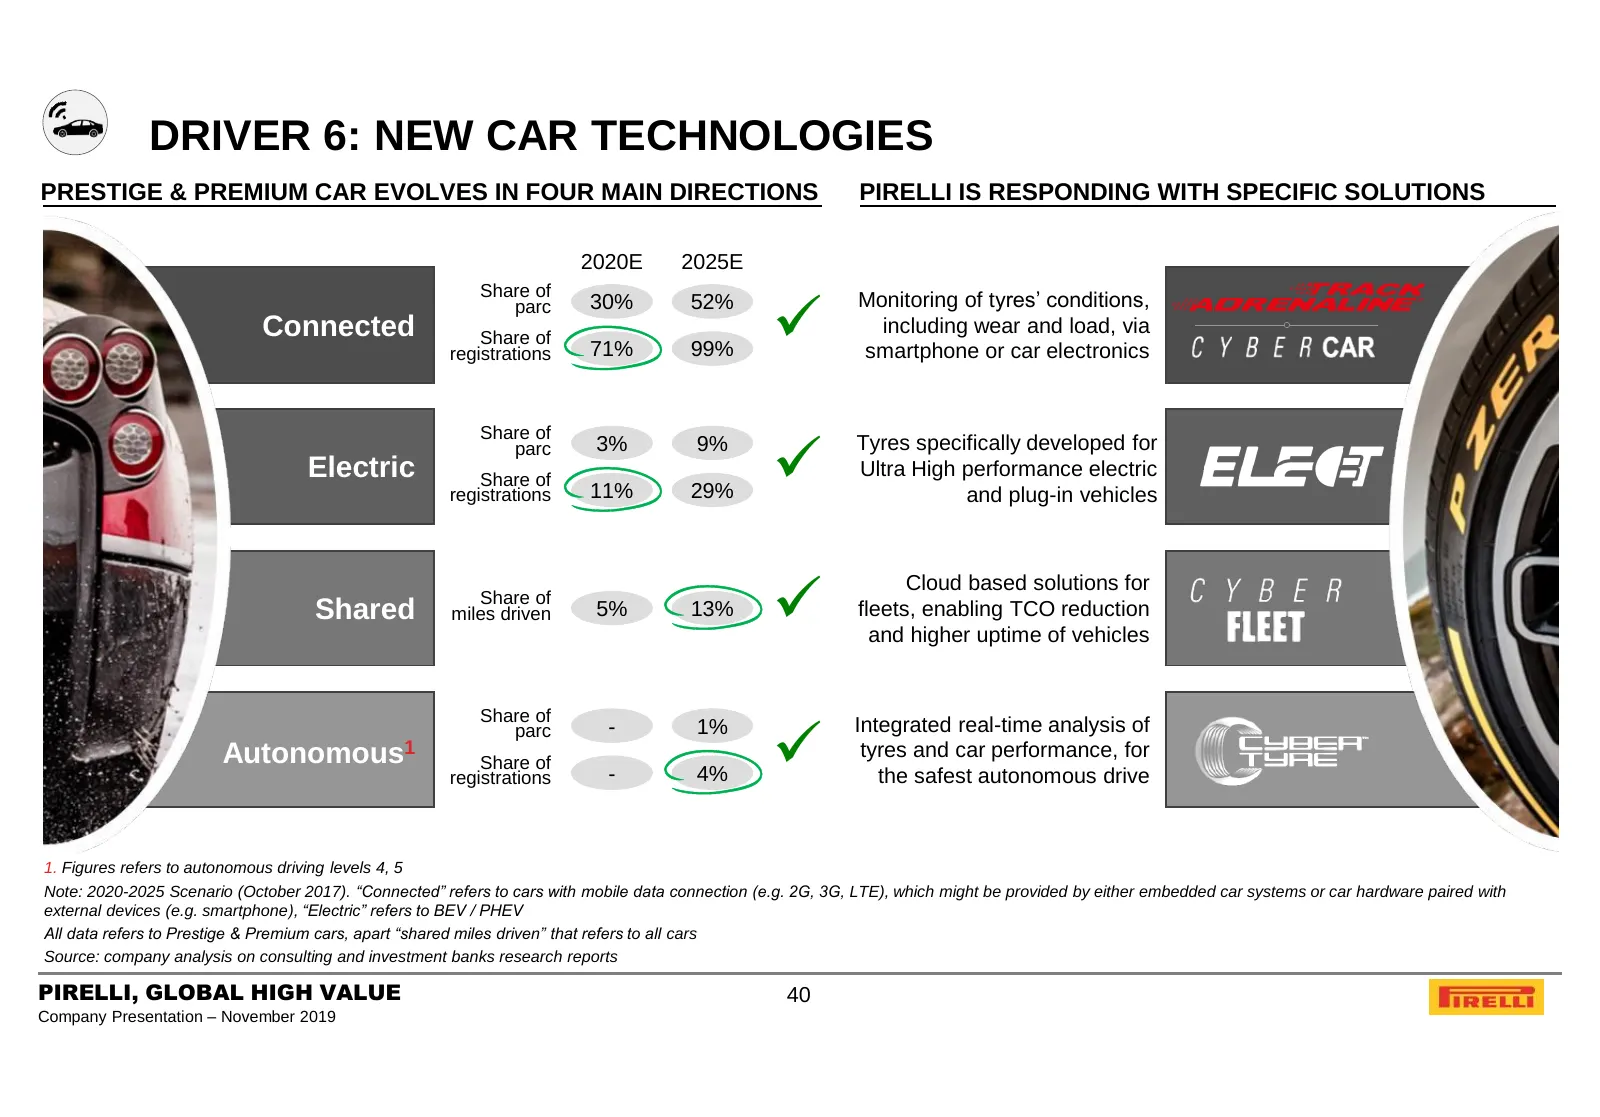
DRIVER 6: NEW CAR TECHNOLOGIES PRESTIGE & PREMIUM CAR EVOLVES IN FOUR MAIN DIRECTIONS PIRELLI IS RESPONDING WITH SPECIFIC SOLUTIONS 2020E 2025E Share of parc 30% 52% Monitoring of tyres’ conditions, Connected Share of including wear and load, via registrations 71% 99% smartphone or car electronics
Slide 41: Driver 6: Connected Prestige & Premium Car
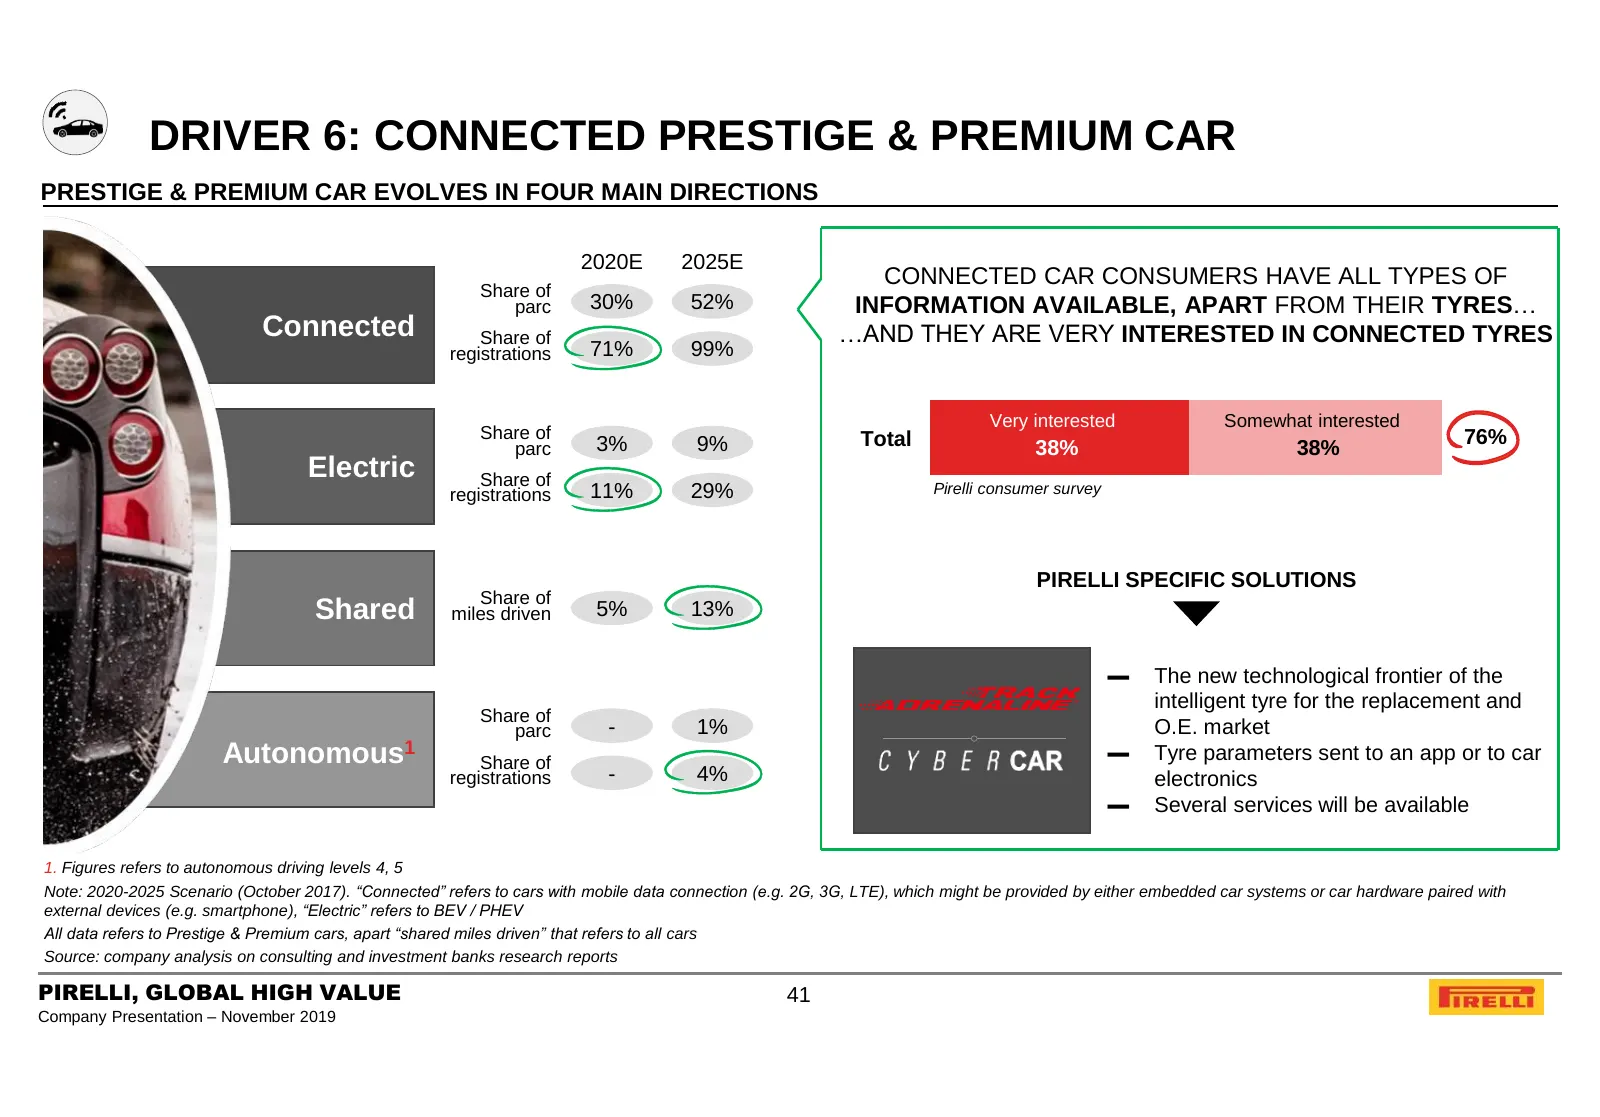
DRIVER 6: CONNECTED PRESTIGE & PREMIUM CAR PRESTIGE & PREMIUM CAR EVOLVES IN FOUR MAIN DIRECTIONS 2020E 2025E CONNECTED CAR CONSUMERS HAVE ALL TYPES OF Share of parc 30% 52% INFORMATION AVAILABLE, APART FROM THEIR TYRES… Connected Share of …AND THEY ARE VERY INTERESTED IN CONNECTED TYRES registratio
Slide 42: Driver 6: Electric Prestige & Premium Car
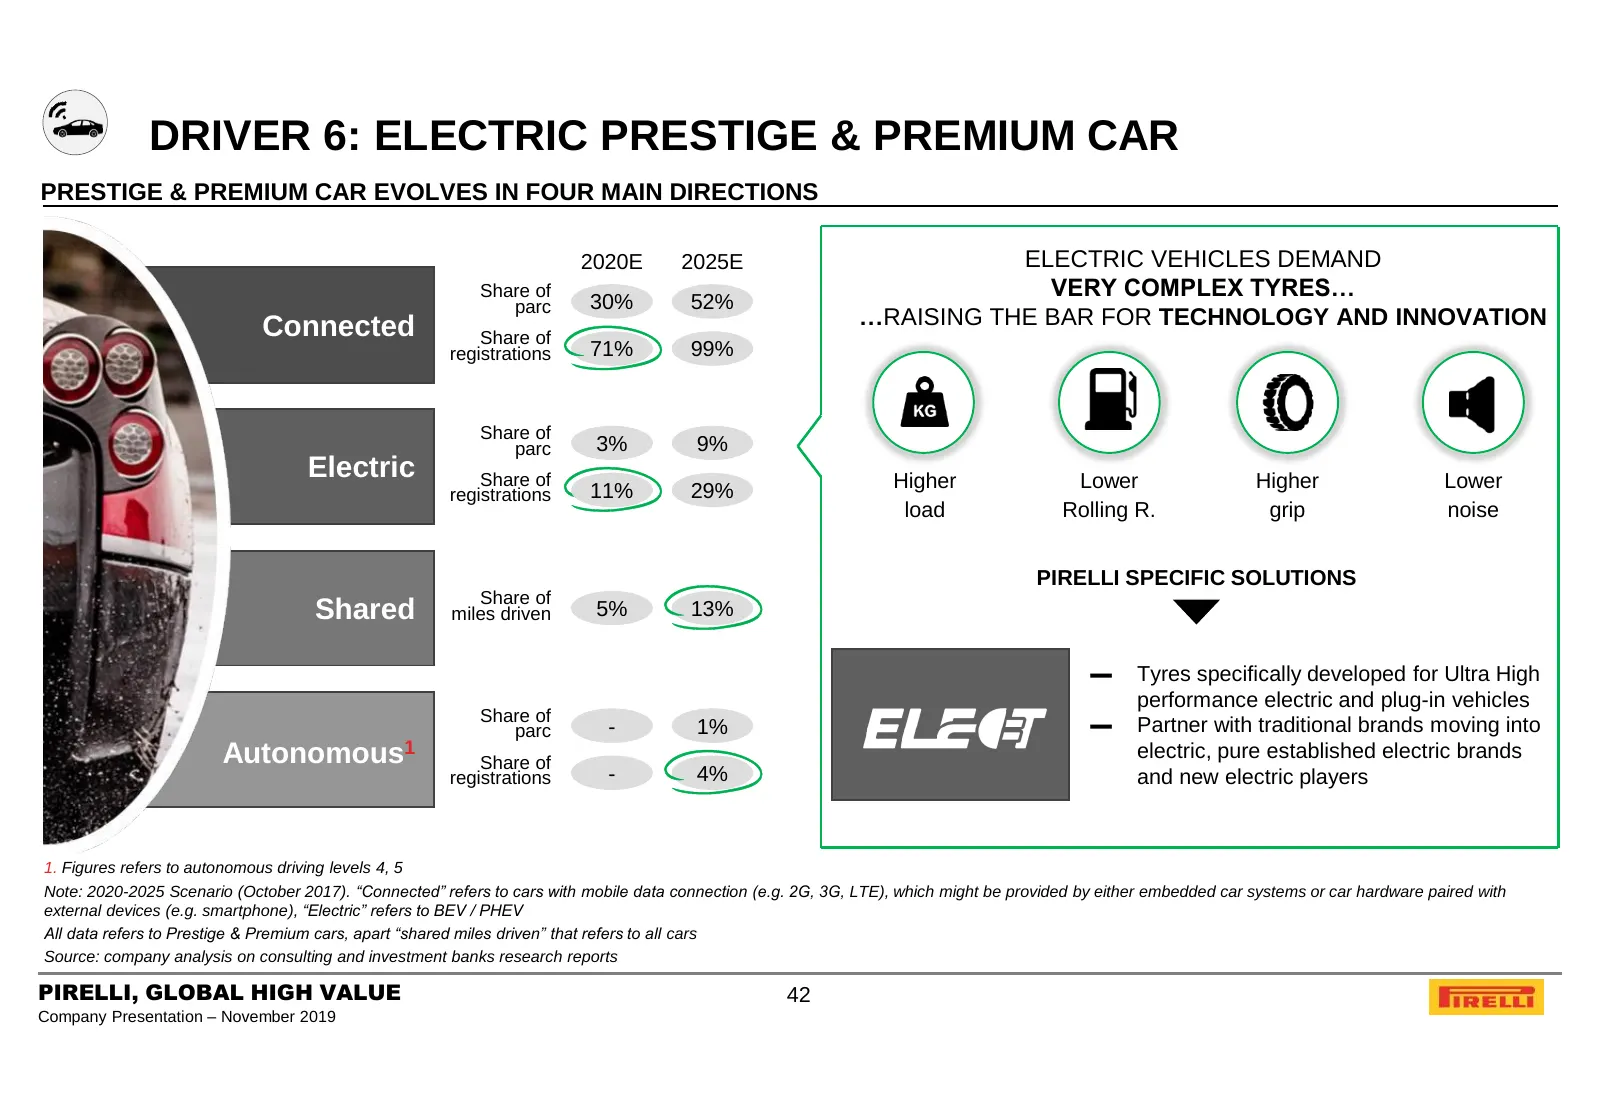
DRIVER 6: ELECTRIC PRESTIGE & PREMIUM CAR PRESTIGE & PREMIUM CAR EVOLVES IN FOUR MAIN DIRECTIONS 2020E 2025E ELECTRIC VEHICLES DEMAND Share of VERY COMPLEX TYRES… parc 30% 52% Connected …RAISING THE BAR FOR TECHNOLOGY AND INNOVATION Share of registrations 71% 99% Share of parc 3% 9% Electric Share o
Slide 43: Driver 6: Shared Prestige & Premium Car
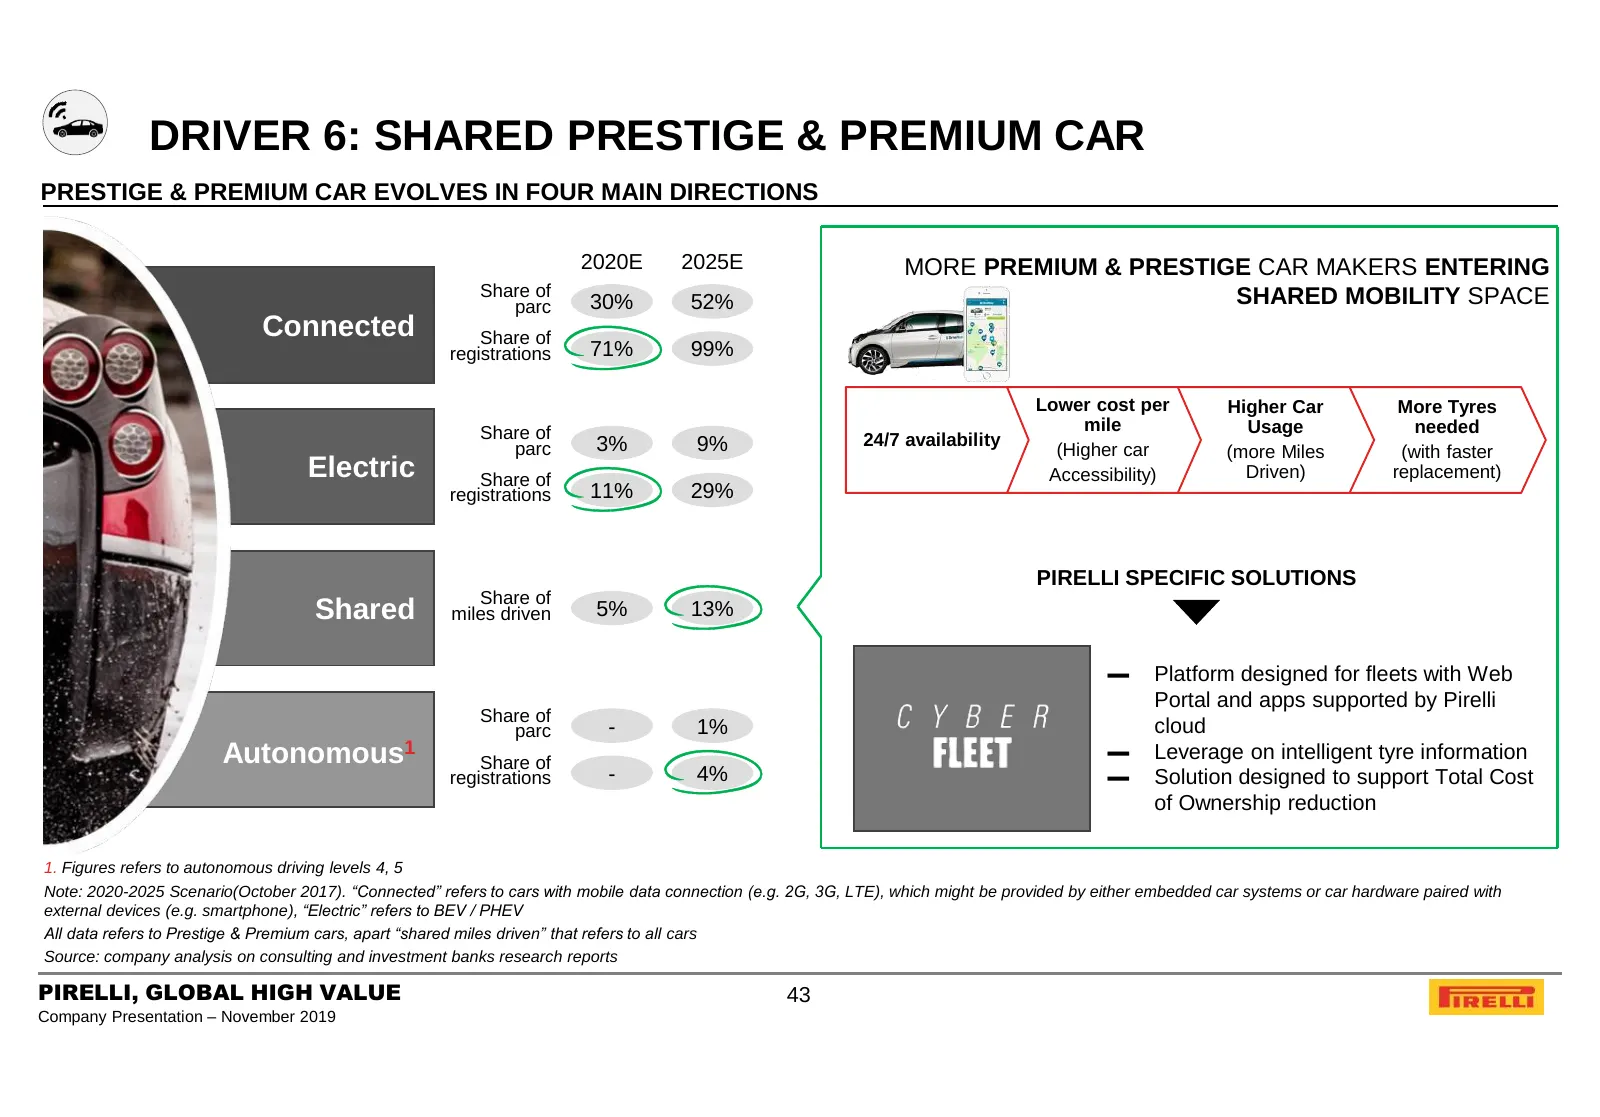
DRIVER 6: SHARED PRESTIGE & PREMIUM CAR PRESTIGE & PREMIUM CAR EVOLVES IN FOUR MAIN DIRECTIONS 2020E 2025E MORE PREMIUM & PRESTIGE CAR MAKERS ENTERING Share of SHARED MOBILITY SPACE parc 30% 52% Connected Share of registrations 71% 99% Lower cost per Higher Car More Tyres Share of mile Usage needed
Slide 44: Driver 6: Autonomous Prestige & Premium Car
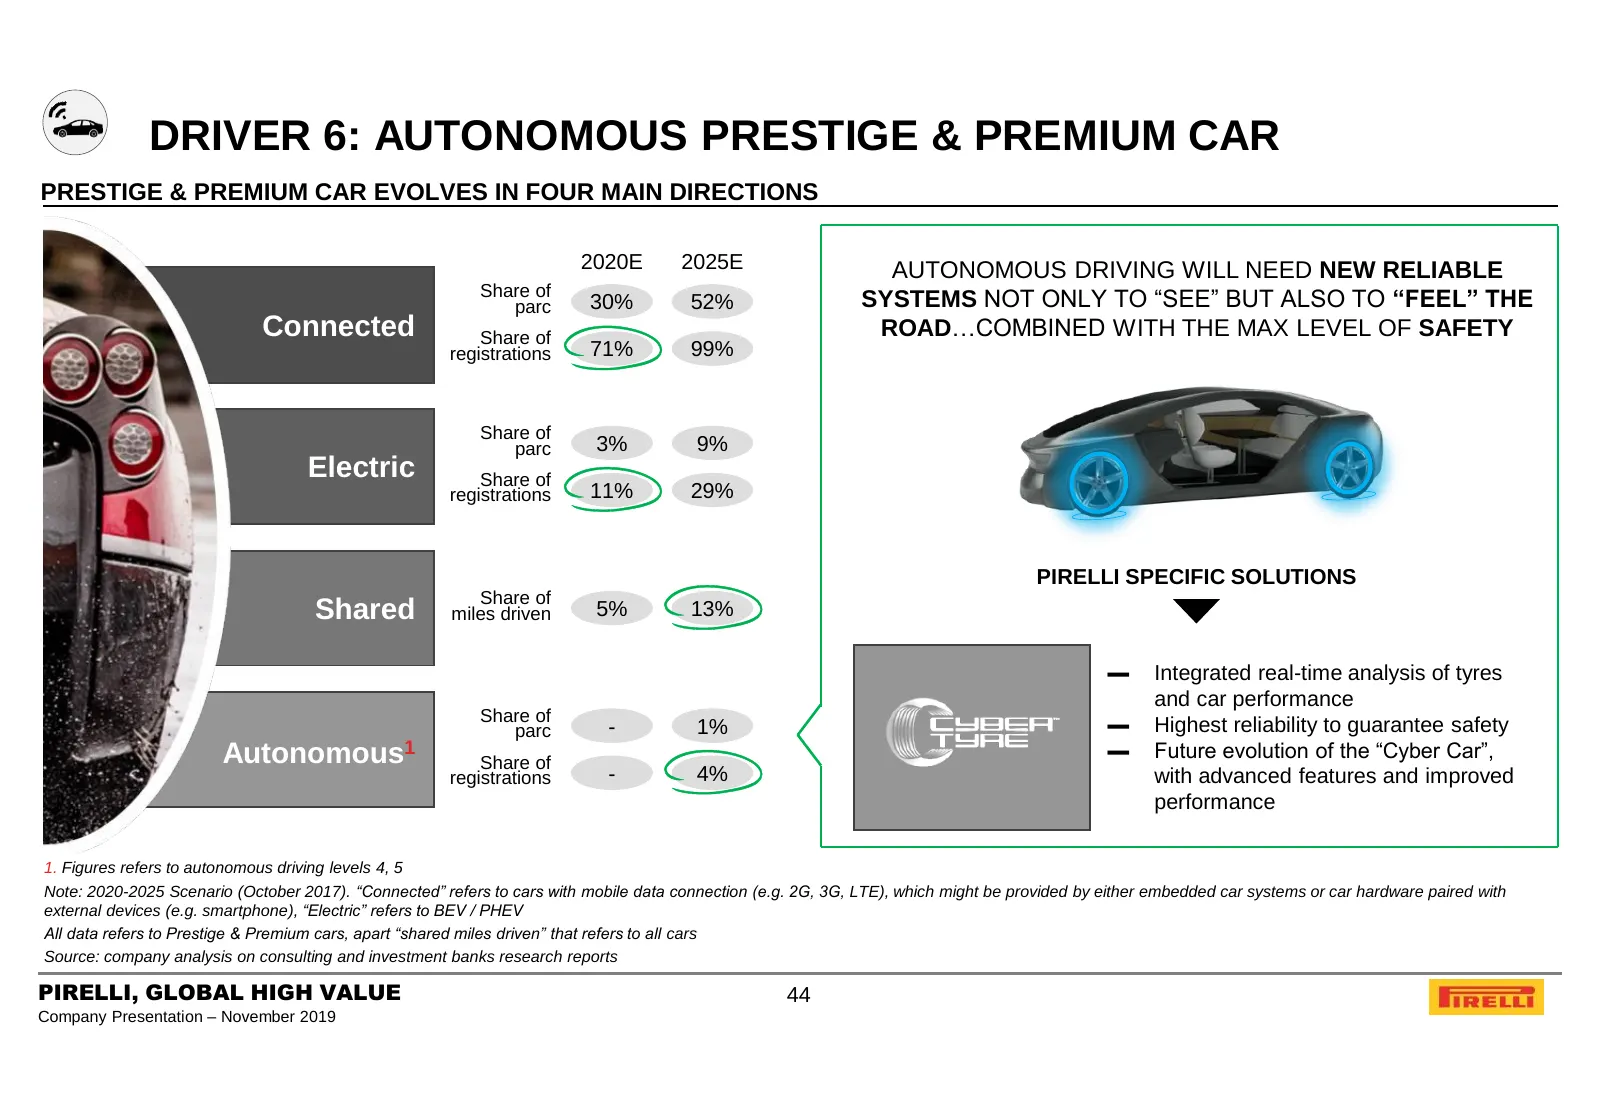
DRIVER 6: AUTONOMOUS PRESTIGE & PREMIUM CAR PRESTIGE & PREMIUM CAR EVOLVES IN FOUR MAIN DIRECTIONS 2020E 2025E AUTONOMOUS DRIVING WILL NEED NEW RELIABLE Share of parc 30% 52% SYSTEMS NOT ONLY TO “SEE” BUT ALSO TO “FEEL” THE Connected Share of ROAD…COMBINED WITH THE MAX LEVEL OF SAFETY registrations
Slide 45: Tyre Competitive Arena: Tier 1 Players
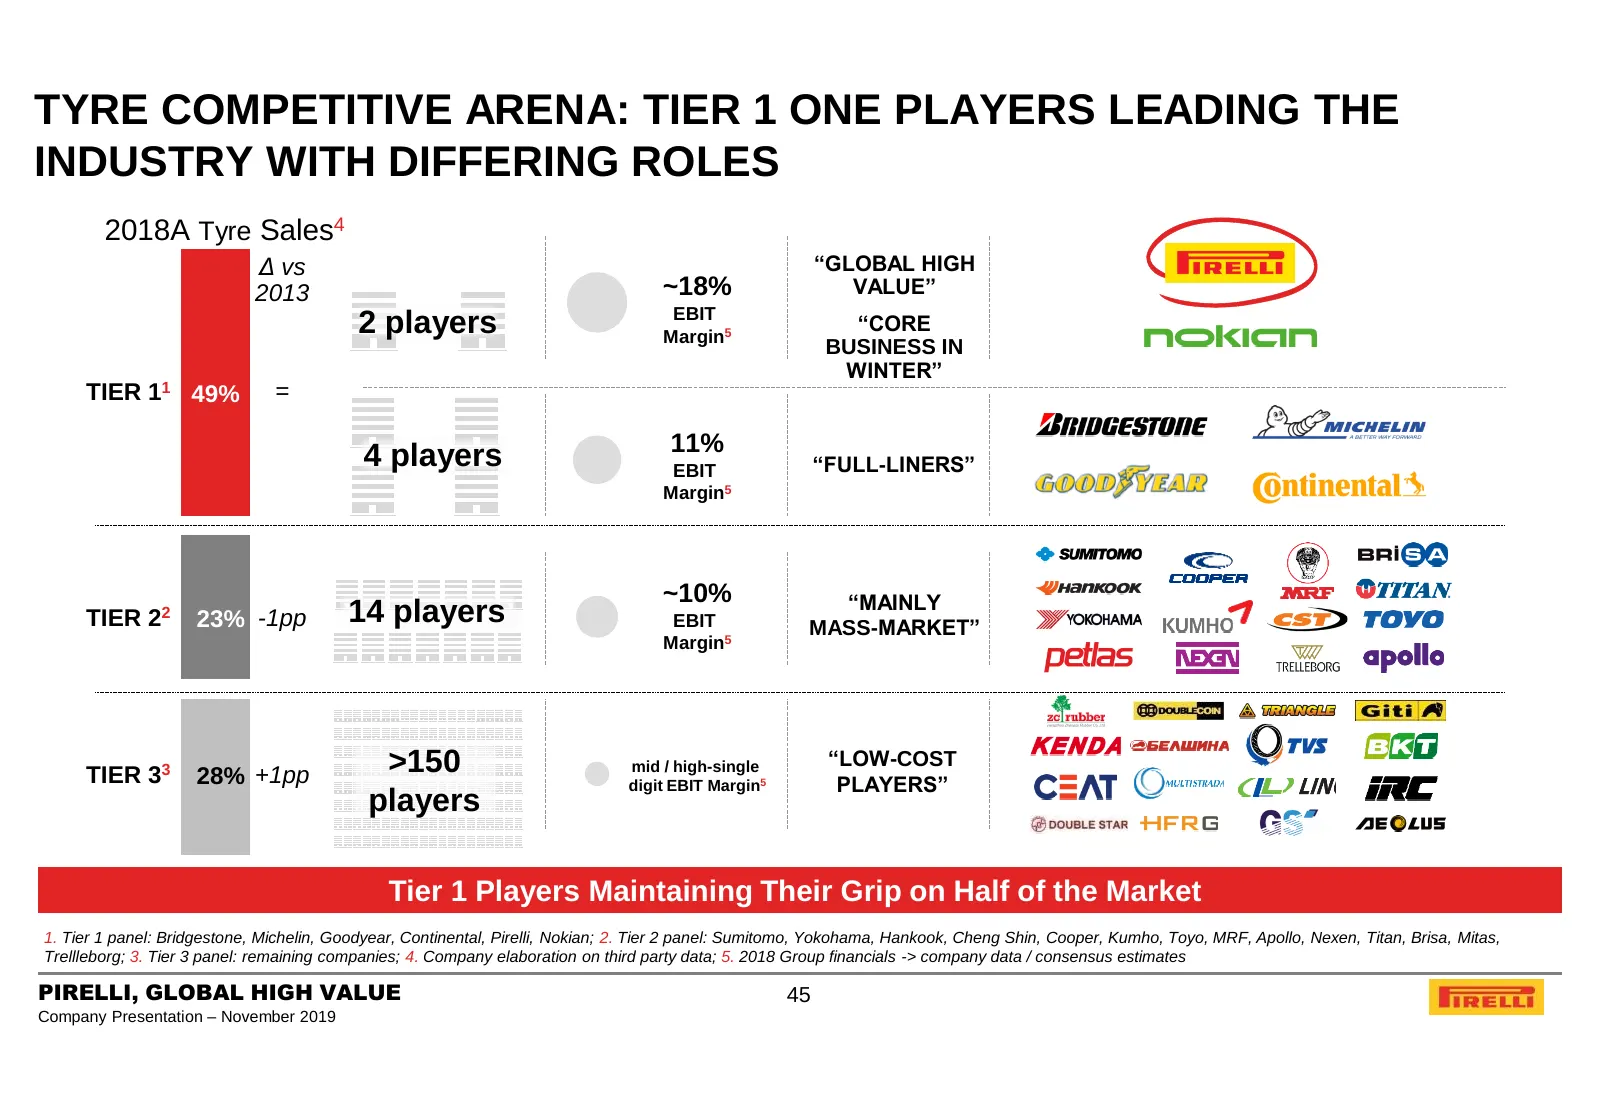
TYRE COMPETITIVE ARENA: TIER 1 ONE PLAYERS LEADING THE INDUSTRY WITH DIFFERING ROLES 2018A Tyre Sales4 Δ vs “GLOBAL HIGH 2013 ~18% VALUE” EBIT 2 players Margin5 “CORE BUSINESS IN WINTER” TIER 11 49% = 11% 4 players EBIT “FULL-LINERS” Margin5 ~10% “MAINLY TIER 22 23% -1pp 14 players EBIT MASS-MARKET”
Slide 46: Tier Comparison vs. European Full-Liners
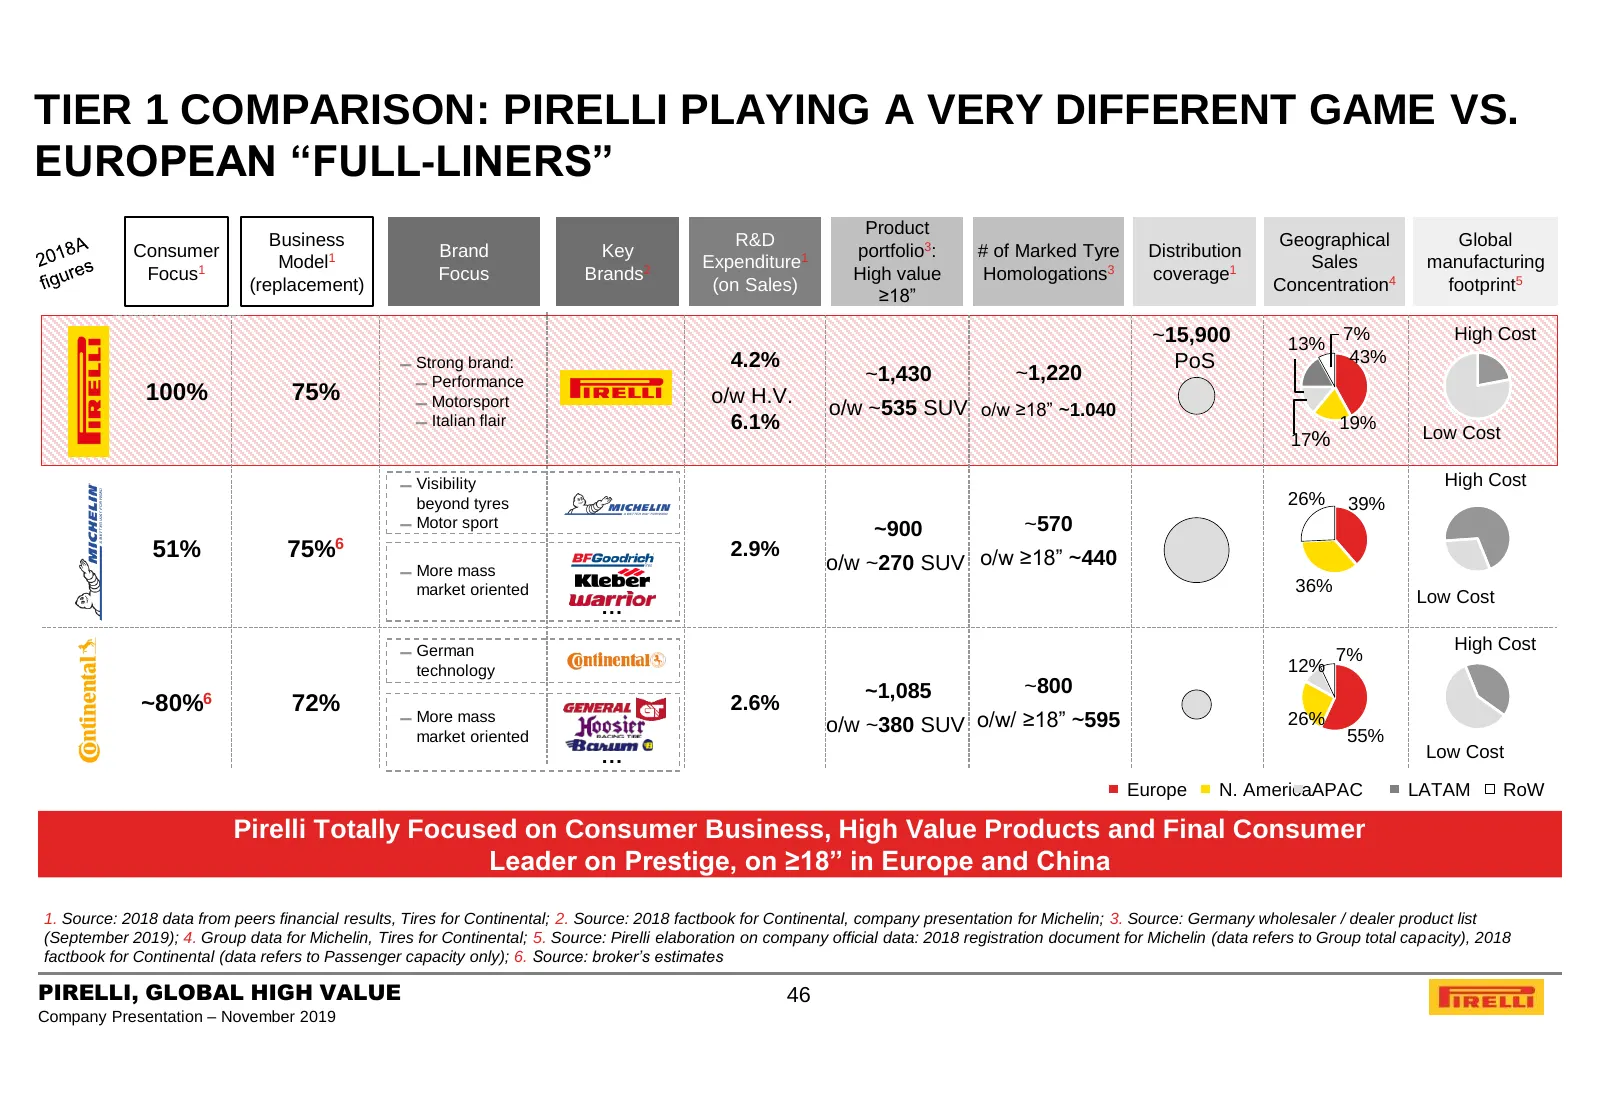
TIER 1 COMPARISON: PIRELLI PLAYING A VERY DIFFERENT GAME VS. EUROPEAN “FULL-LINERS” Product Business R&D Geographical Global Consumer Brand Key portfolio3: # of Marked Tyre Distribution Model1 Expenditure1 Sales manufacturing Focus1 Focus Brands2 High value Homologations3 coverage1 (replacement) (on
Slide 47: Tier 1 Comparison vs. Nokian
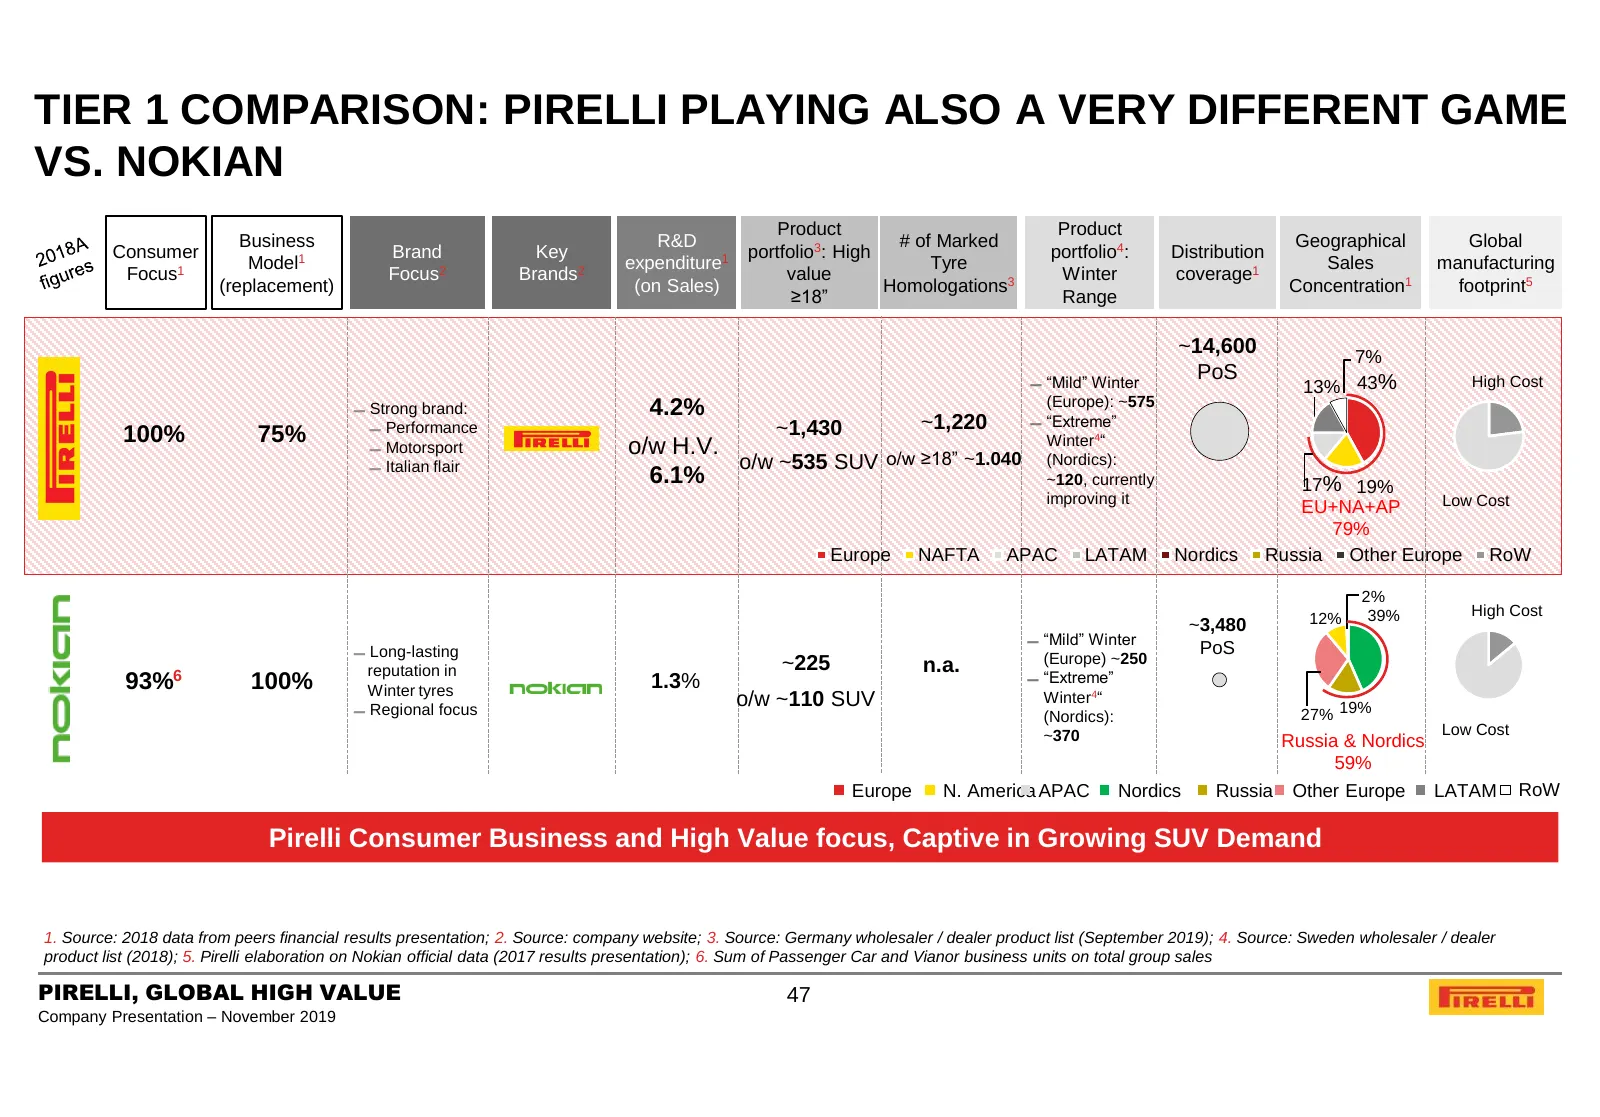
TIER 1 COMPARISON: PIRELLI PLAYING ALSO A VERY DIFFERENT GAME VS. NOKIAN Product Product Business R&D # of Marked Geographical Global Consumer Brand Key portfolio3: High portfolio4: Distribution Model1 expenditure1 Tyre Sales manufacturing Focus1 Focus2 Brands2 value Winter coverage1 (replacement) (
Slide 48: Agenda
AGENDA 1. PIRELLI AT A GLANCE 2. BUSINESS MODEL 3. KEY INVESTMENT HIGHLIGHTS 4. MARKET AND COMPETITION 5. 9M 2019 FINANCIAL RESULTS AND 2019 OUTLOOK 6. FY 2018 FINANCIAL RESULTS AND 2019 OUTLOOK 7. GOVERNANCE 8. SUSTAINABILITY 9. APPENDIX PIRELLI, GLOBAL HIGH VALUE 48 Company Presentation – November
Slide 49: Key Messages
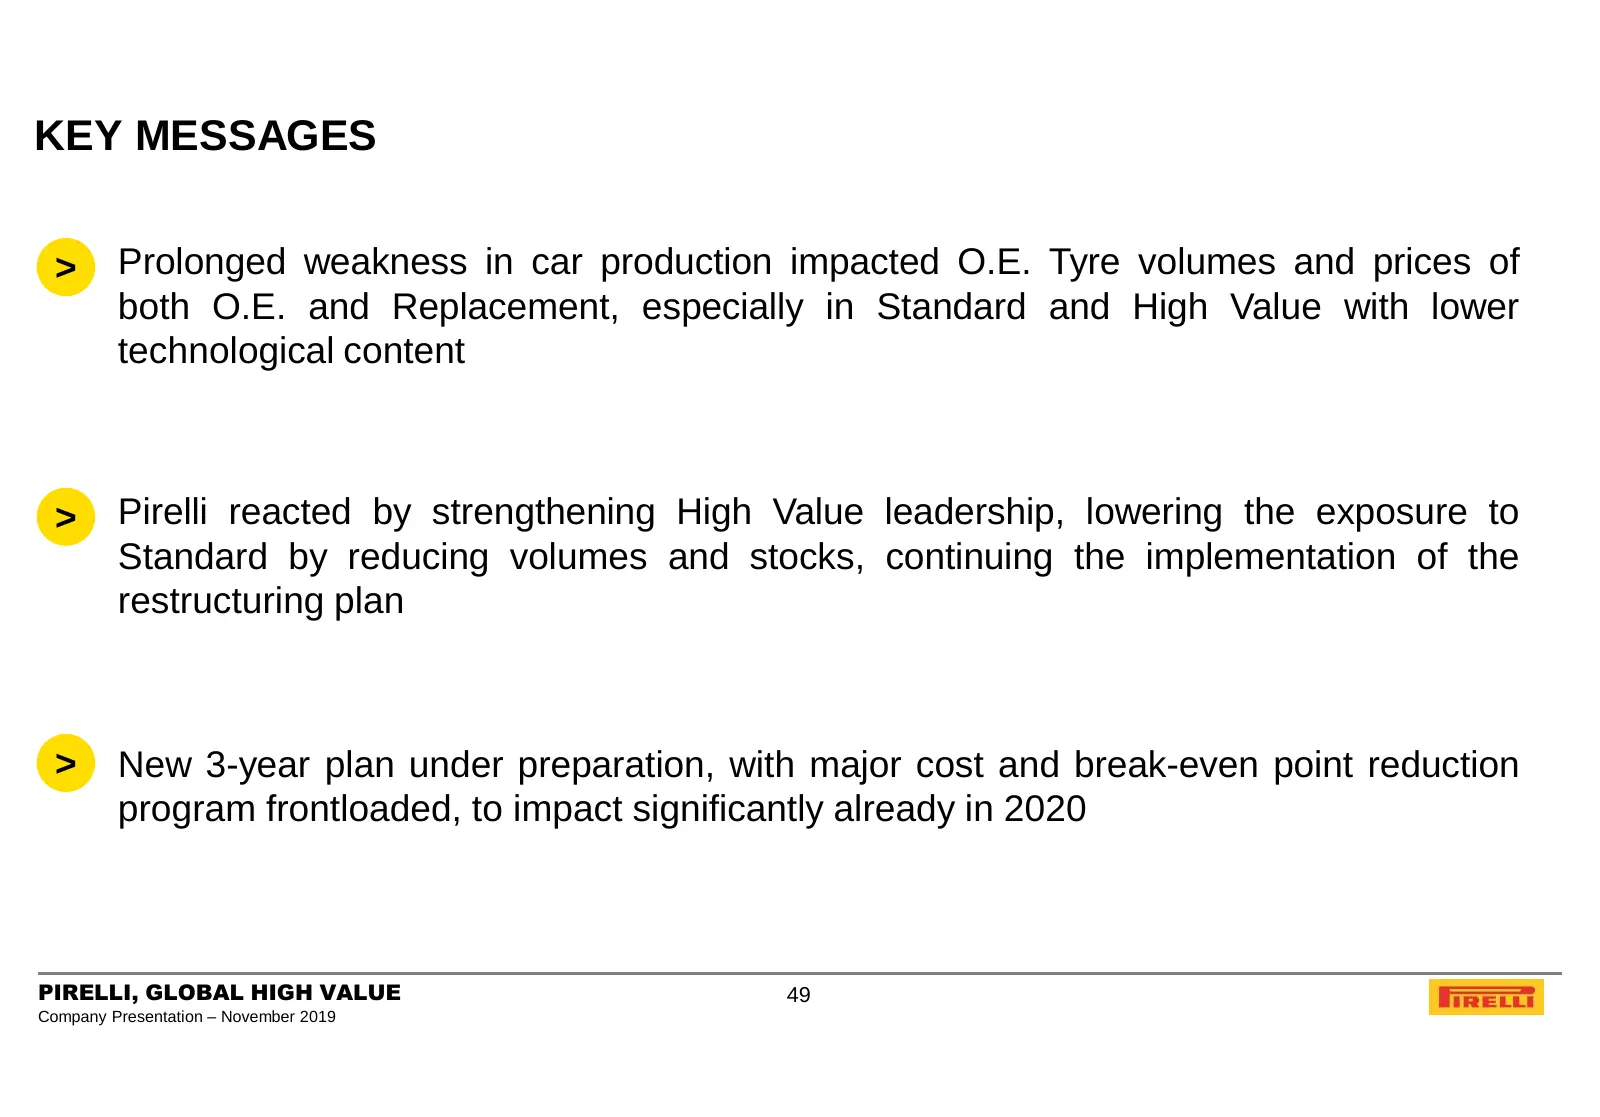
KEY MESSAGES > Prolonged weakness in car production impacted O.E. Tyre volumes and prices of both O.E. and Replacement, especially in Standard and High Value with lower technological content > Pirelli reacted by strengthening High Value leadership, lowering the exposure to Standard by reducing volum
Slide 50: Agenda
AGENDA 1. PIRELLI AT A GLANCE 2. BUSINESS MODEL 3. KEY INVESTMENT HIGHLIGHTS 4. MARKET AND COMPETITION 5. 9M 2019 FINANCIAL RESULTS AND 2019 OUTLOOK 5.a. CURRENT SCENARIO, 9M ‘19 RESULTS & FY ‘19 GUIDANCE 5.b. MEDIUM-TERM SCENARIO & STRATEGIC GUIDELINES FOR ‘20-’22 PLAN 5.c. REVIEW OF 9M ‘19 RESULTS
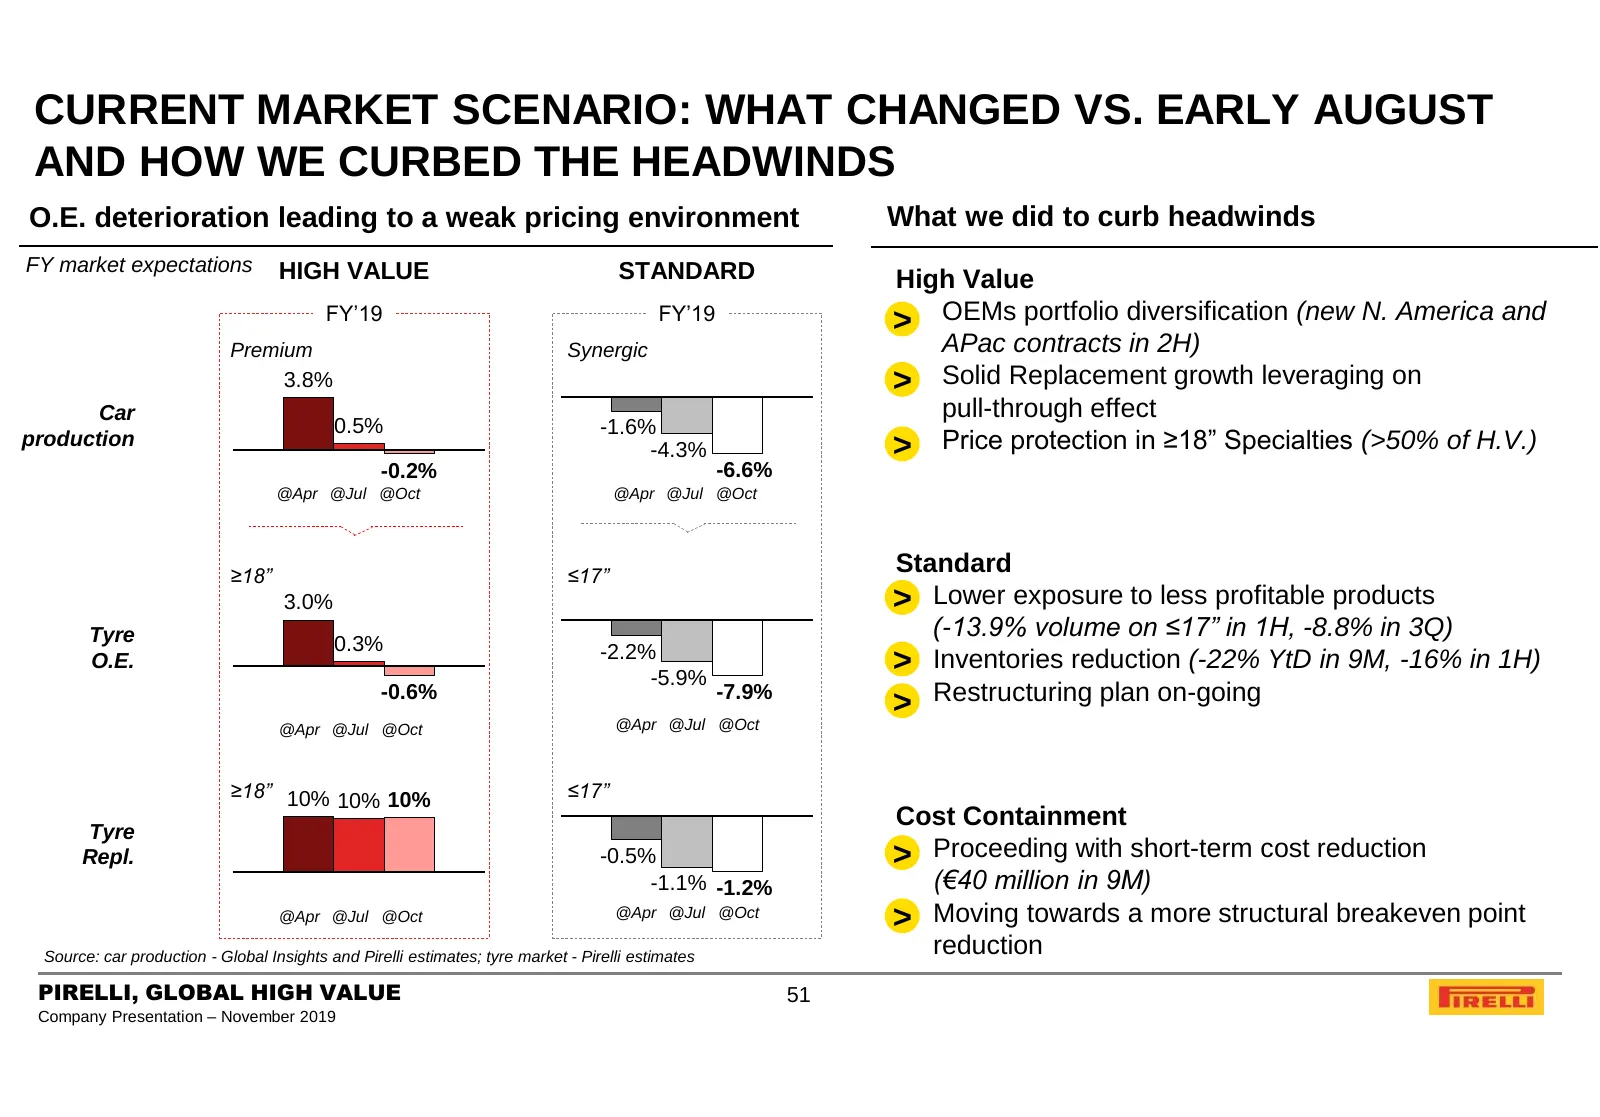
Slide 51: Current Market Scenario and How We Curbed Headwinds
CURRENT MARKET SCENARIO: WHAT CHANGED VS. EARLY AUGUST AND HOW WE CURBED THE HEADWINDS O.E. deterioration leading to a weak pricing environment What we did to curb headwinds FY market expectations HIGH VALUE STANDARD High Value FY’19 FY’19 >• OEMs portfolio diversification (new N. America and Premiu
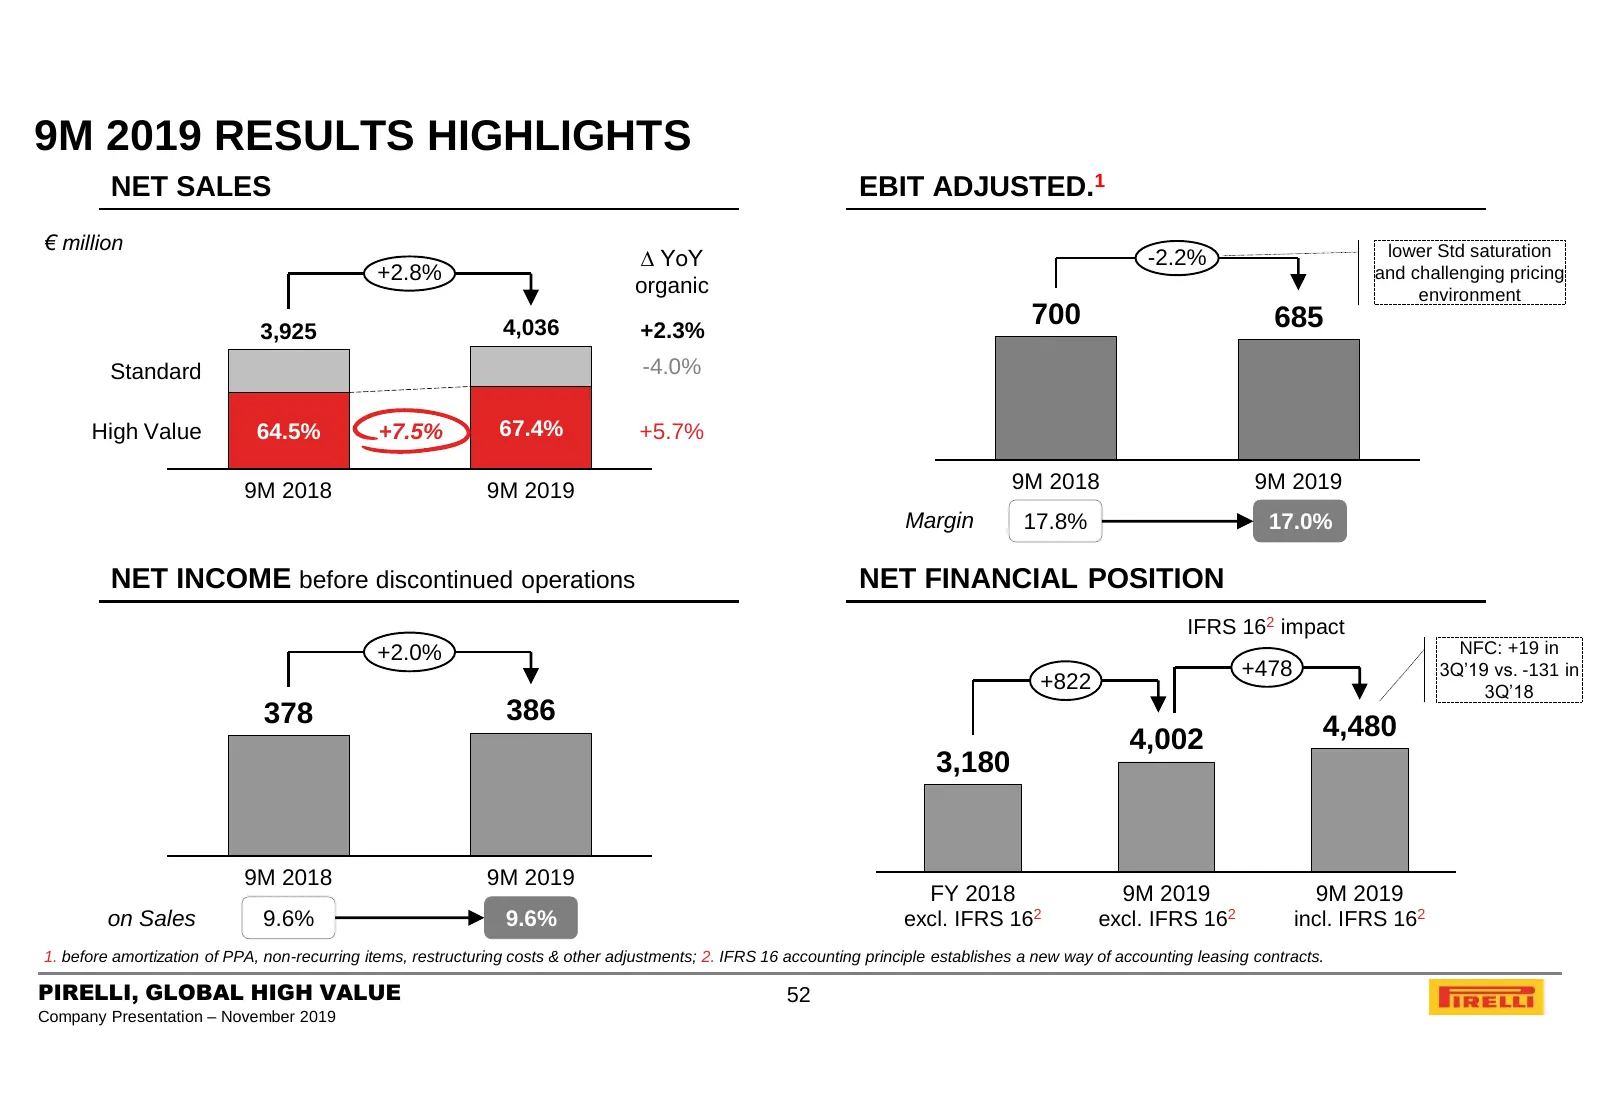
Slide 52: 9M 2019 Results Highlights
9M 2019 RESULTS HIGHLIGHTS NET SALES EBIT ADJUSTED.1 € million lower Std saturation ∆ YoY -2.2% +2.8% and challenging pricing organic environment 4,036 +2.3% 700 685 3,925 Standard -4.0% High Value 64.5% +7.5% 67.4% +5.7% 9M 2018 9M 2019 9M 2018 9M 2019 Margin 17.8% 17.0% NET INCOME before discontin
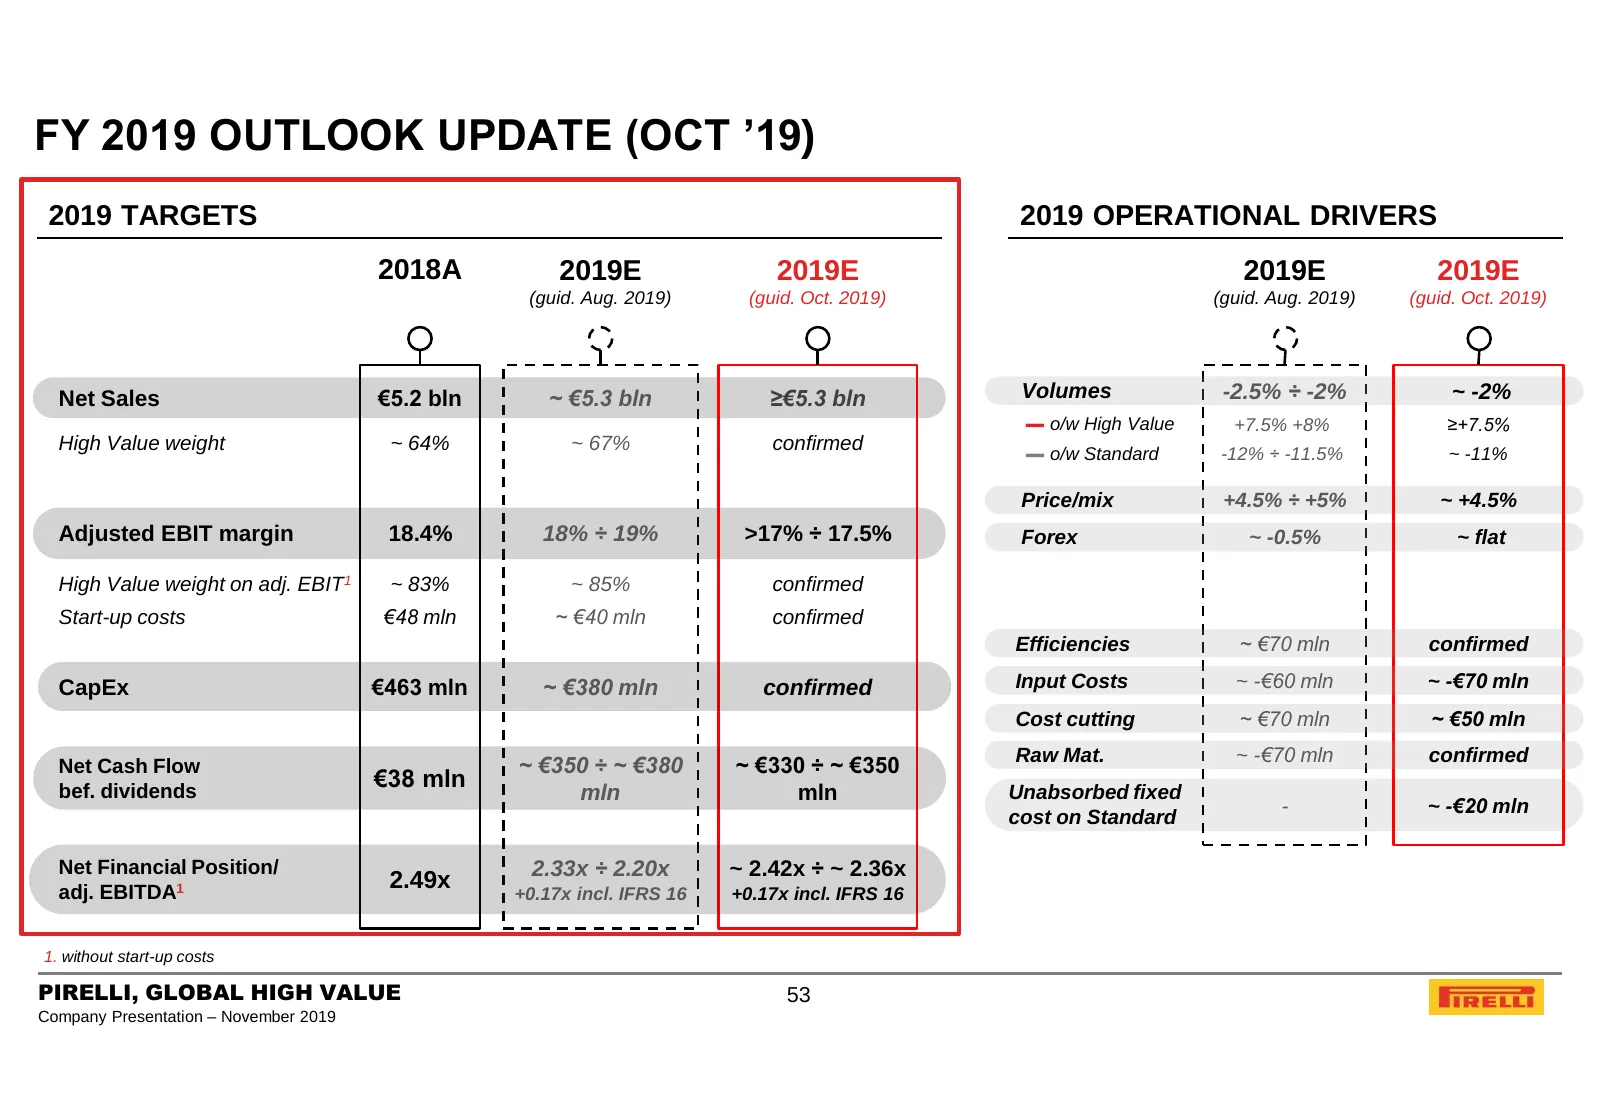
Slide 53: FY 2019 Outlook Update (Oct '19)
FY 2019 OUTLOOK UPDATE (OCT ’19) 2019 TARGETS 2019 OPERATIONAL DRIVERS 2018A 2019E 2019E 2019E 2019E (guid. Aug. 2019) (guid. Oct. 2019) (guid. Aug. 2019) (guid. Oct. 2019) Net Sales €5.2 bln ~ €5.3 bln ≥€5.3 bln Volumes -2.5% ÷ -2% ~ -2% ▬ o/w High Value +7.5% +8% ≥+7.5% High Value weight ~ 64% ~ 6
Slide 54: Agenda
AGENDA 1. PIRELLI AT A GLANCE 2. BUSINESS MODEL 3. KEY INVESTMENT HIGHLIGHTS 4. MARKET AND COMPETITION 5. 9M 2019 FINANCIAL RESULTS AND 2019 OUTLOOK 5.a. CURRENT SCENARIO, 9M ‘19 RESULTS & FY ‘19 GUIDANCE 5.b. MEDIUM-TERM SCENARIO & STRATEGIC GUIDELINES FOR ‘20-’22 PLAN 5.c. REVIEW OF 9M ‘19 RESULTS
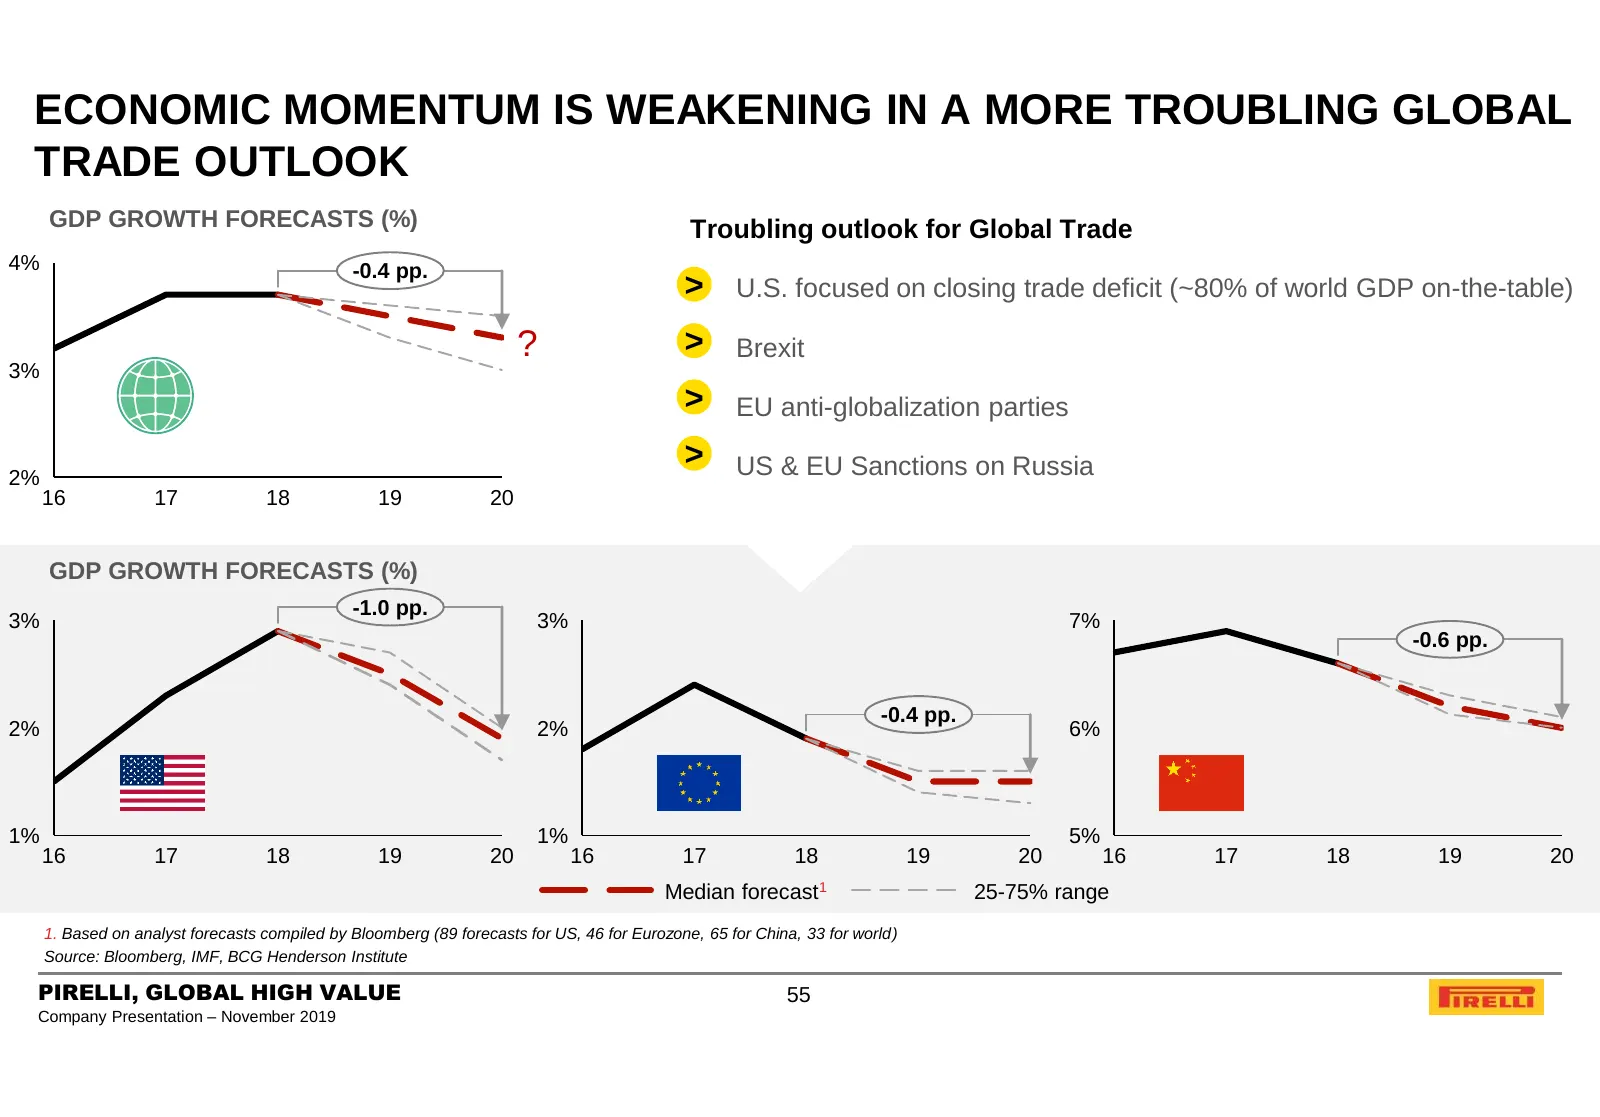
Slide 55: Economic Momentum Weakening in Troubling Global Trade Outlook
ECONOMIC MOMENTUM IS WEAKENING IN A MORE TROUBLING GLOBAL TRADE OUTLOOK GDP GROWTH FORECASTS (%) Troubling outlook for Global Trade 4% -0.4 pp. >• U.S. focused on closing trade deficit (~80% of world GDP on-the-table) ? >• Brexit 3% >• EU anti-globalization parties >• US & EU Sanctions on Russia 2%
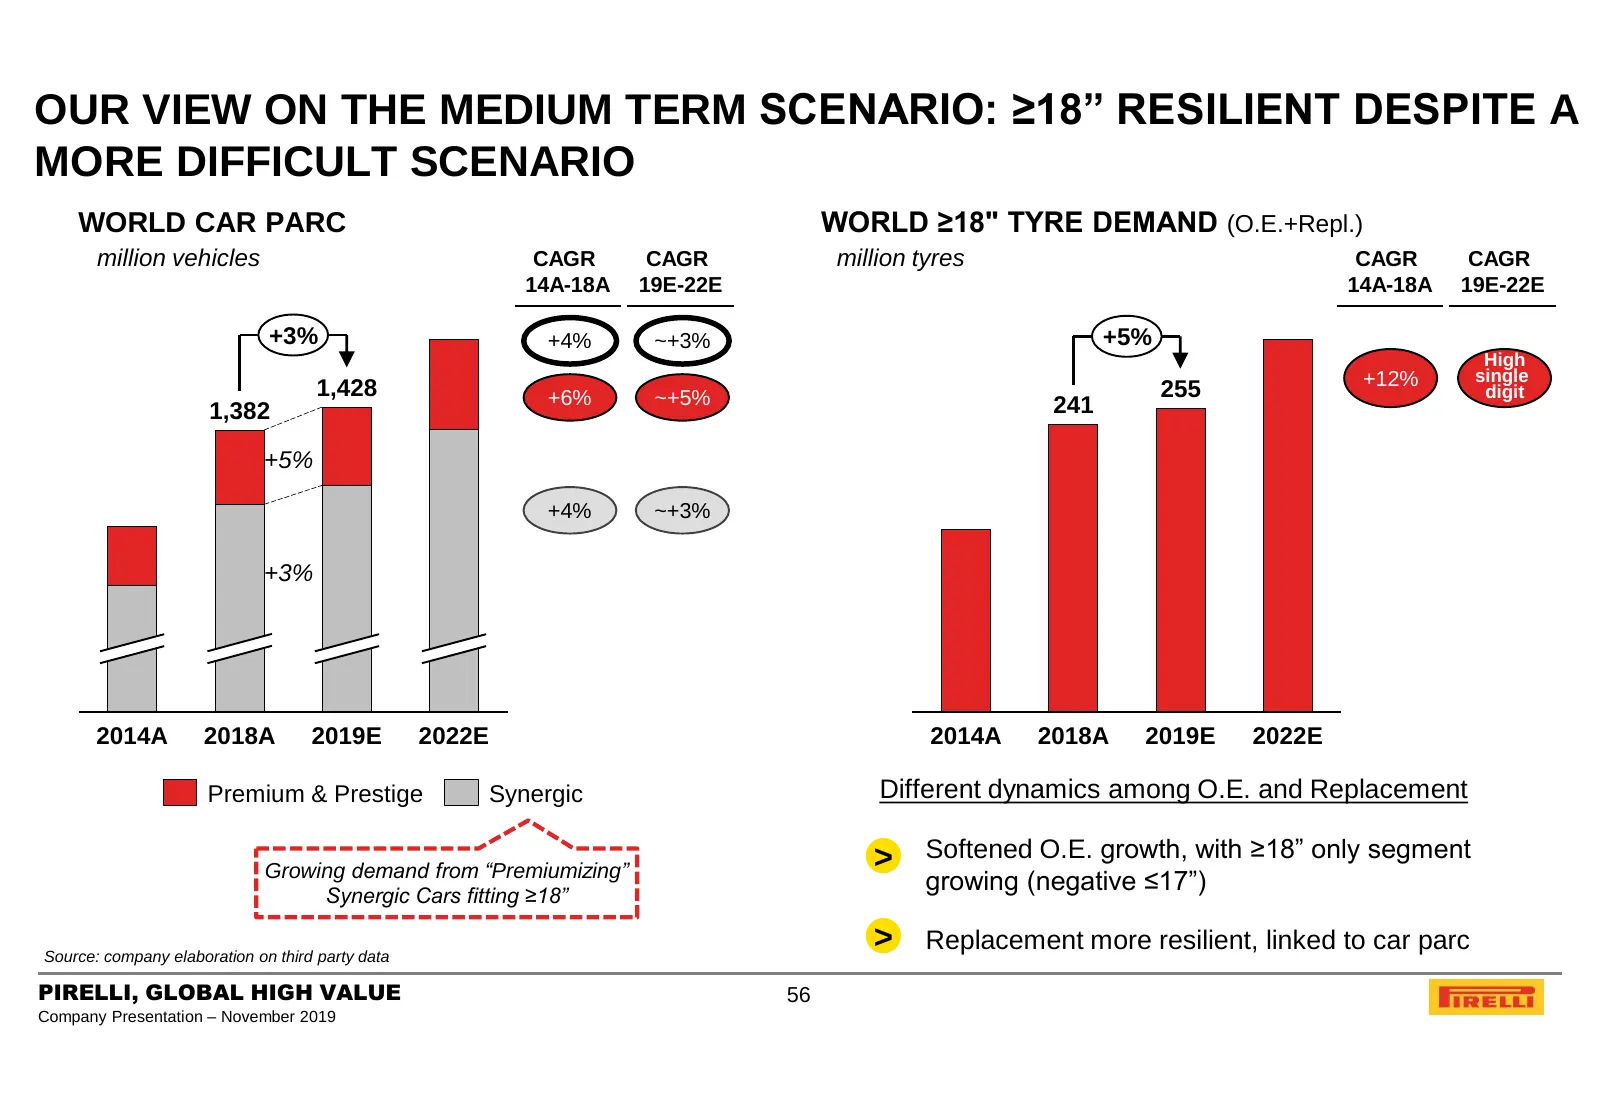
Slide 56: Medium Term Scenario: ≥18” Resilient
OUR VIEW ON THE MEDIUM TERM SCENARIO: ≥18” RESILIENT DESPITE A MORE DIFFICULT SCENARIO WORLD CAR PARC WORLD ≥18" TYRE DEMAND (O.E.+Repl.) million vehicles CAGR CAGR million tyres CAGR CAGR 14A-18A 19E-22E 14A-18A 19E-22E +3% +4% ~+3% +5% High +12% single 1,428 +6% ~+5% 255 digit 1,382 241 +5% +4% ~+
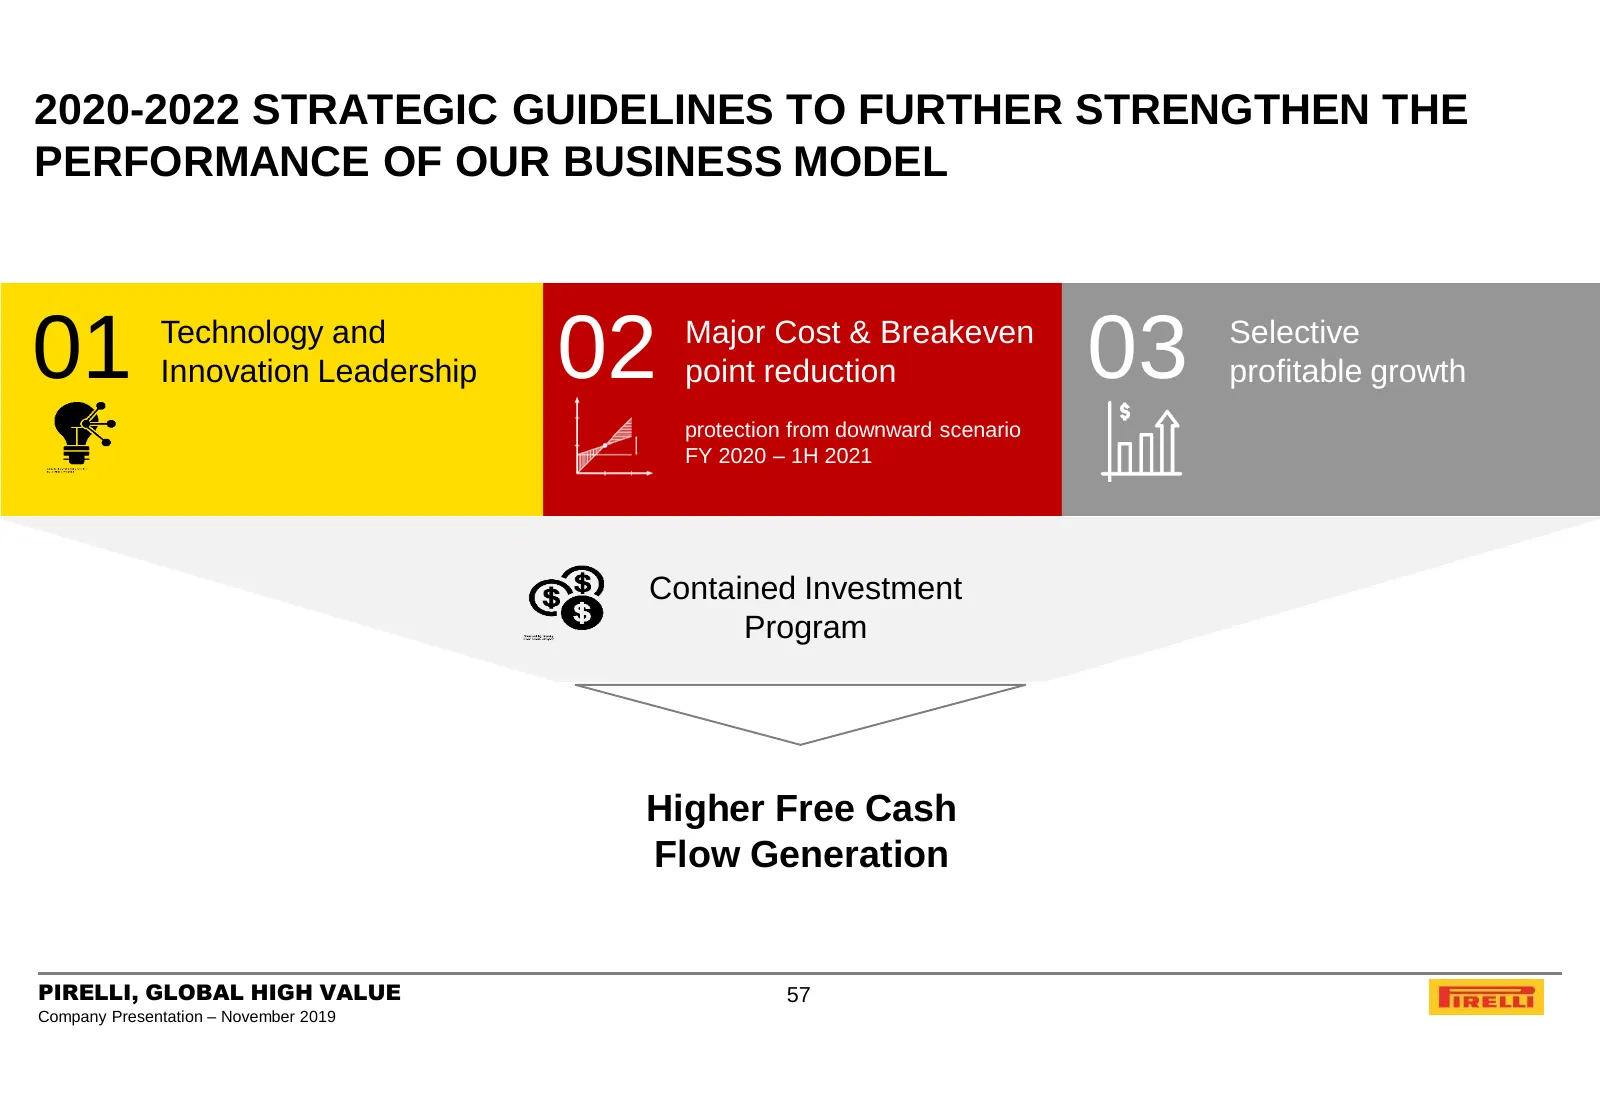
Slide 57: 2020-2022 Strategic Guidelines
2020-2022 STRATEGIC GUIDELINES TO FURTHER STRENGTHEN THE PERFORMANCE OF OUR BUSINESS MODEL 01 Technology and Innovation Leadership 02 Major Cost & Breakeven point reduction 03 Selective profitable growth protection from downward scenario FY 2020 – 1H 2021 Contained Investment Program Higher Free Cas
Slide 58: Agenda
AGENDA 1. PIRELLI AT A GLANCE 2. BUSINESS MODEL 3. KEY INVESTMENT HIGHLIGHTS 4. MARKET AND COMPETITION 5. 9M 2019 FINANCIAL RESULTS AND 2019 OUTLOOK 5.a. CURRENT SCENARIO, 9M ‘19 RESULTS & FY ‘19 GUIDANCE 5.b. MEDIUM-TERM SCENARIO & STRATEGIC GUIDELINES FOR ‘20-’22 PLAN 5.c. REVIEW OF 9M ‘19 RESULTS
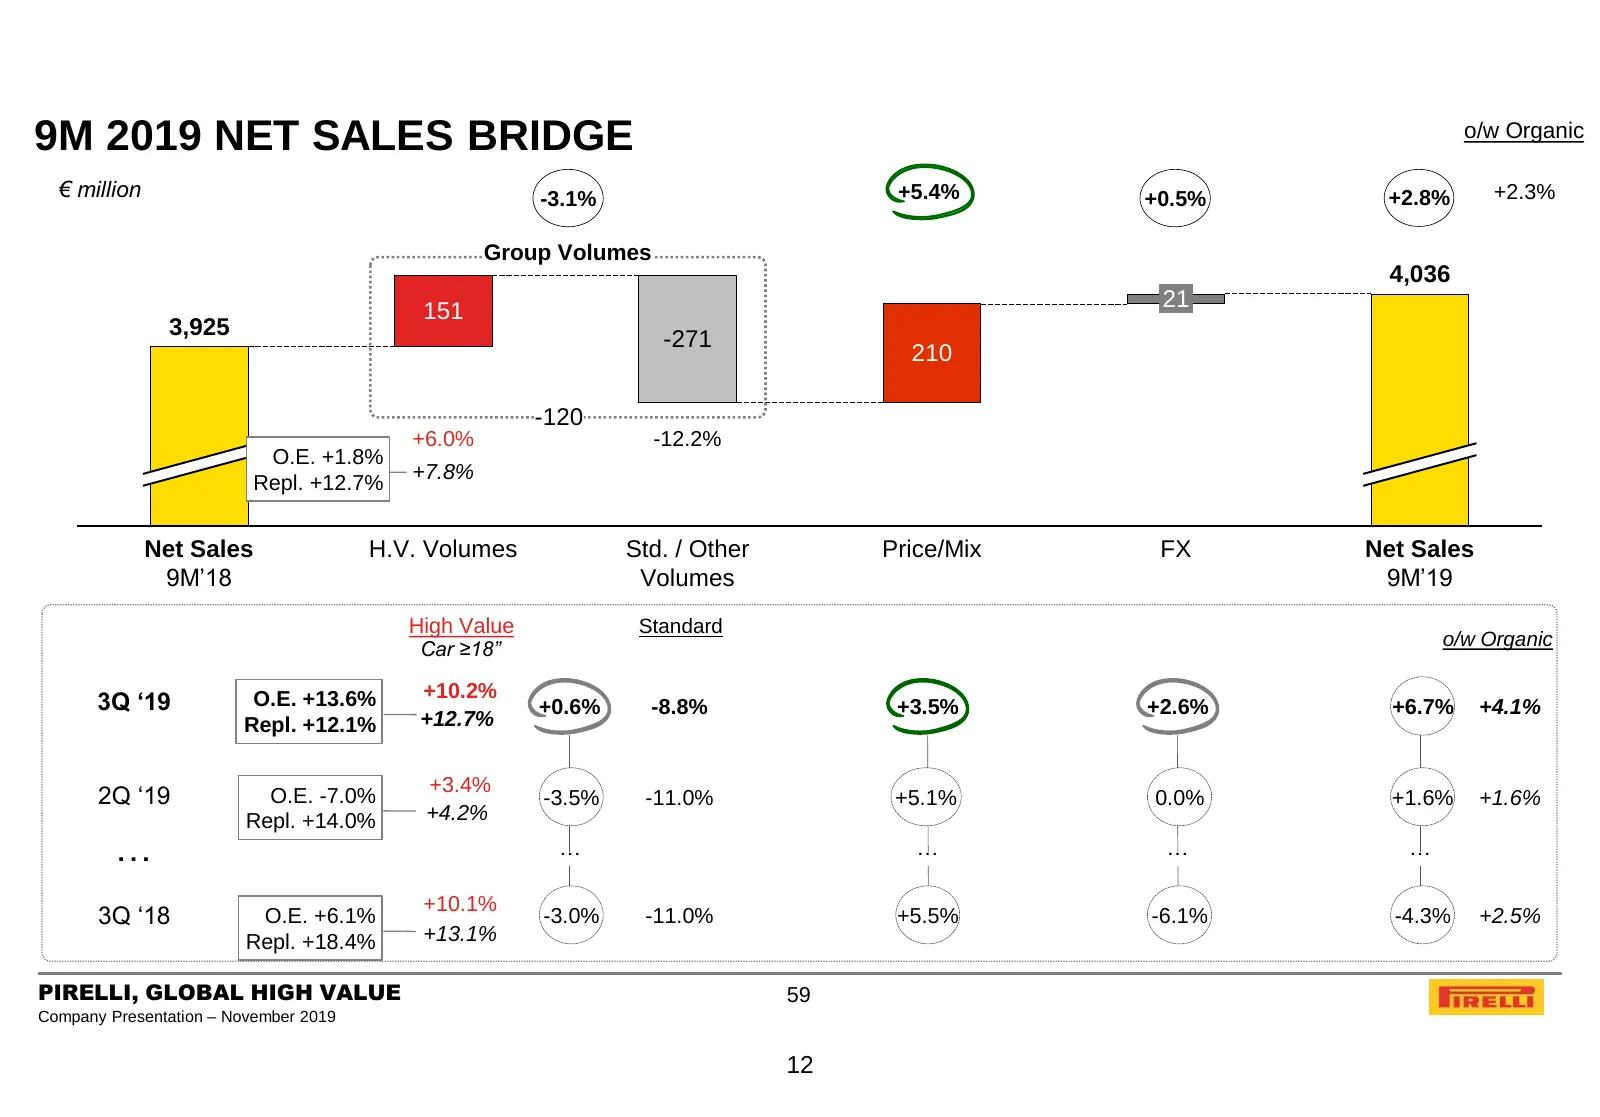
Slide 59: 9M 2019 Net Sales Bridge
9M 2019 NET SALES BRIDGE o/w Organic € million -3.1% +5.4% +0.5% +2.8% +2.3% Group Volumes 4,036 151 21 3,925 -271 210 -120 +6.0% -12.2% O.E. +1.8% +7.8% Repl. +12.7% Net Sales H.V. Volumes Std. / Other Price/Mix FX Net Sales 9M’18 Volumes 9M’19 High Value Standard o/w Organic Car ≥18” +10.2% 3Q ‘19
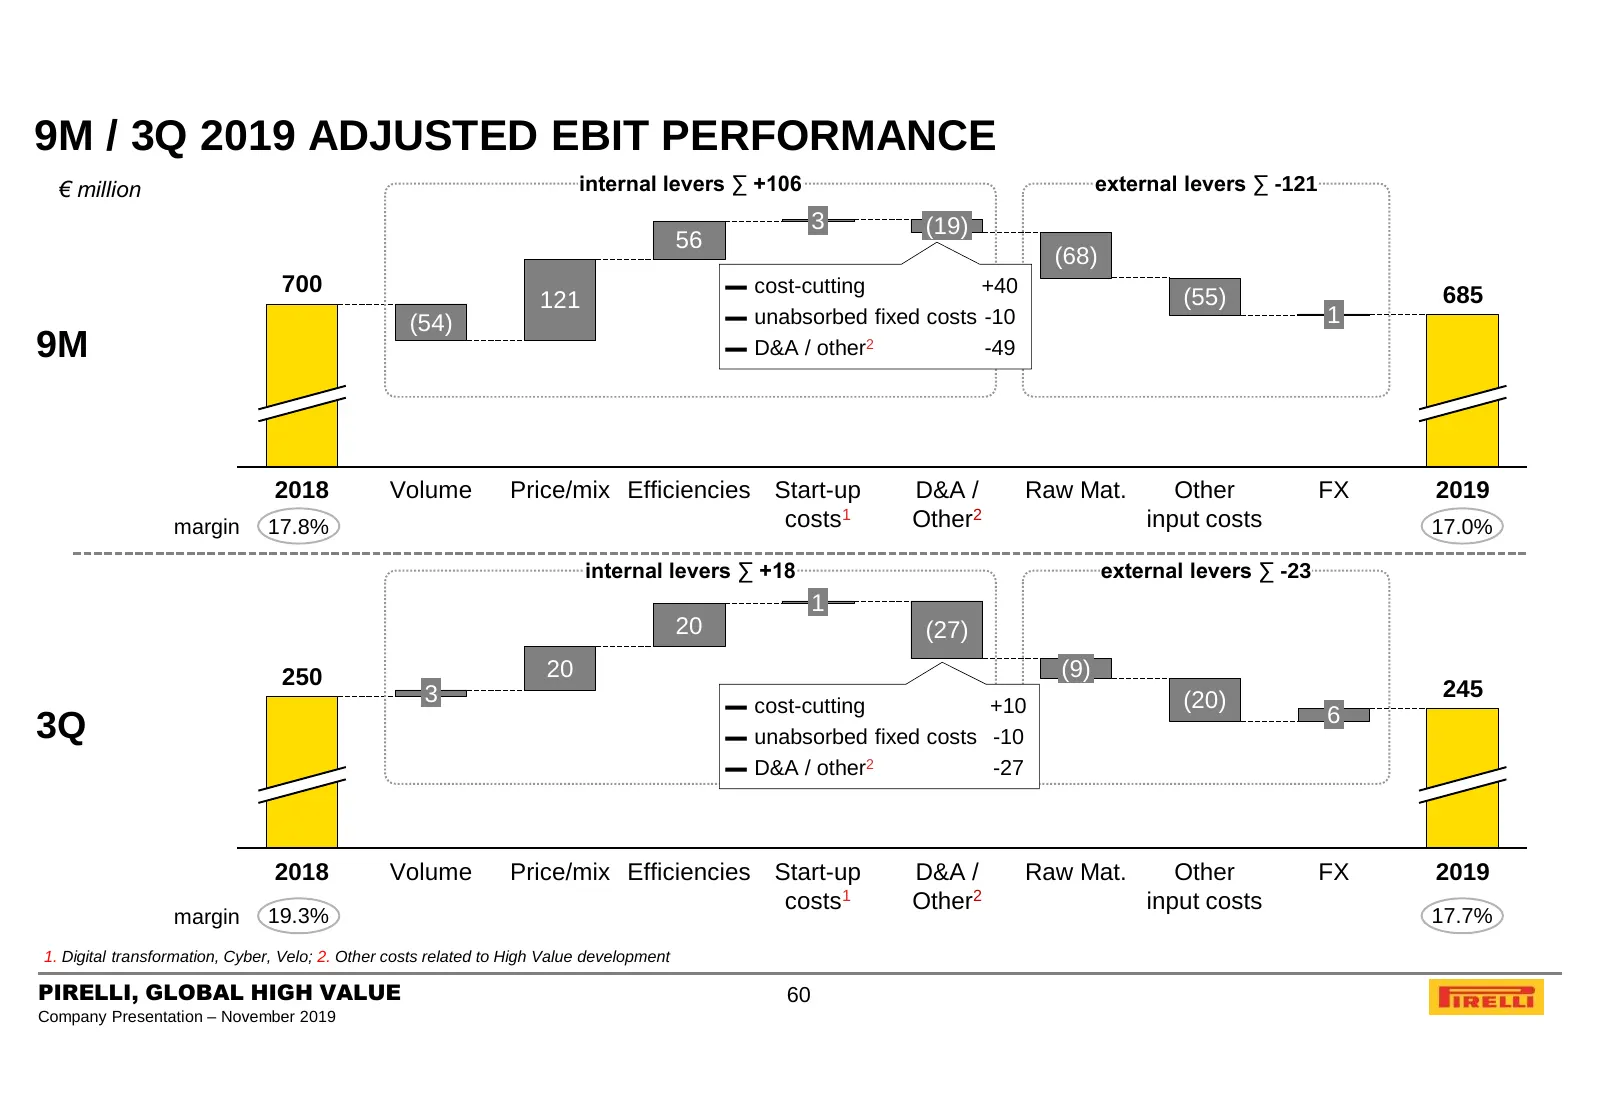
Slide 60: 9M / 3Q 2019 Adjusted EBIT Performance
9M / 3Q 2019 ADJUSTED EBIT PERFORMANCE € million internal levers ∑ +106 external levers ∑ -121 3 (19) 56 (68) 700 ▬ cost-cutting +40 685 121 (55) (54) ▬ unabsorbed fixed costs -10 1 9M ▬ D&A / other2 -49 2018 Volume Price/mix Efficiencies Start-up D&A / Raw Mat. Other FX 2019 margin 17.8% costs1 Oth
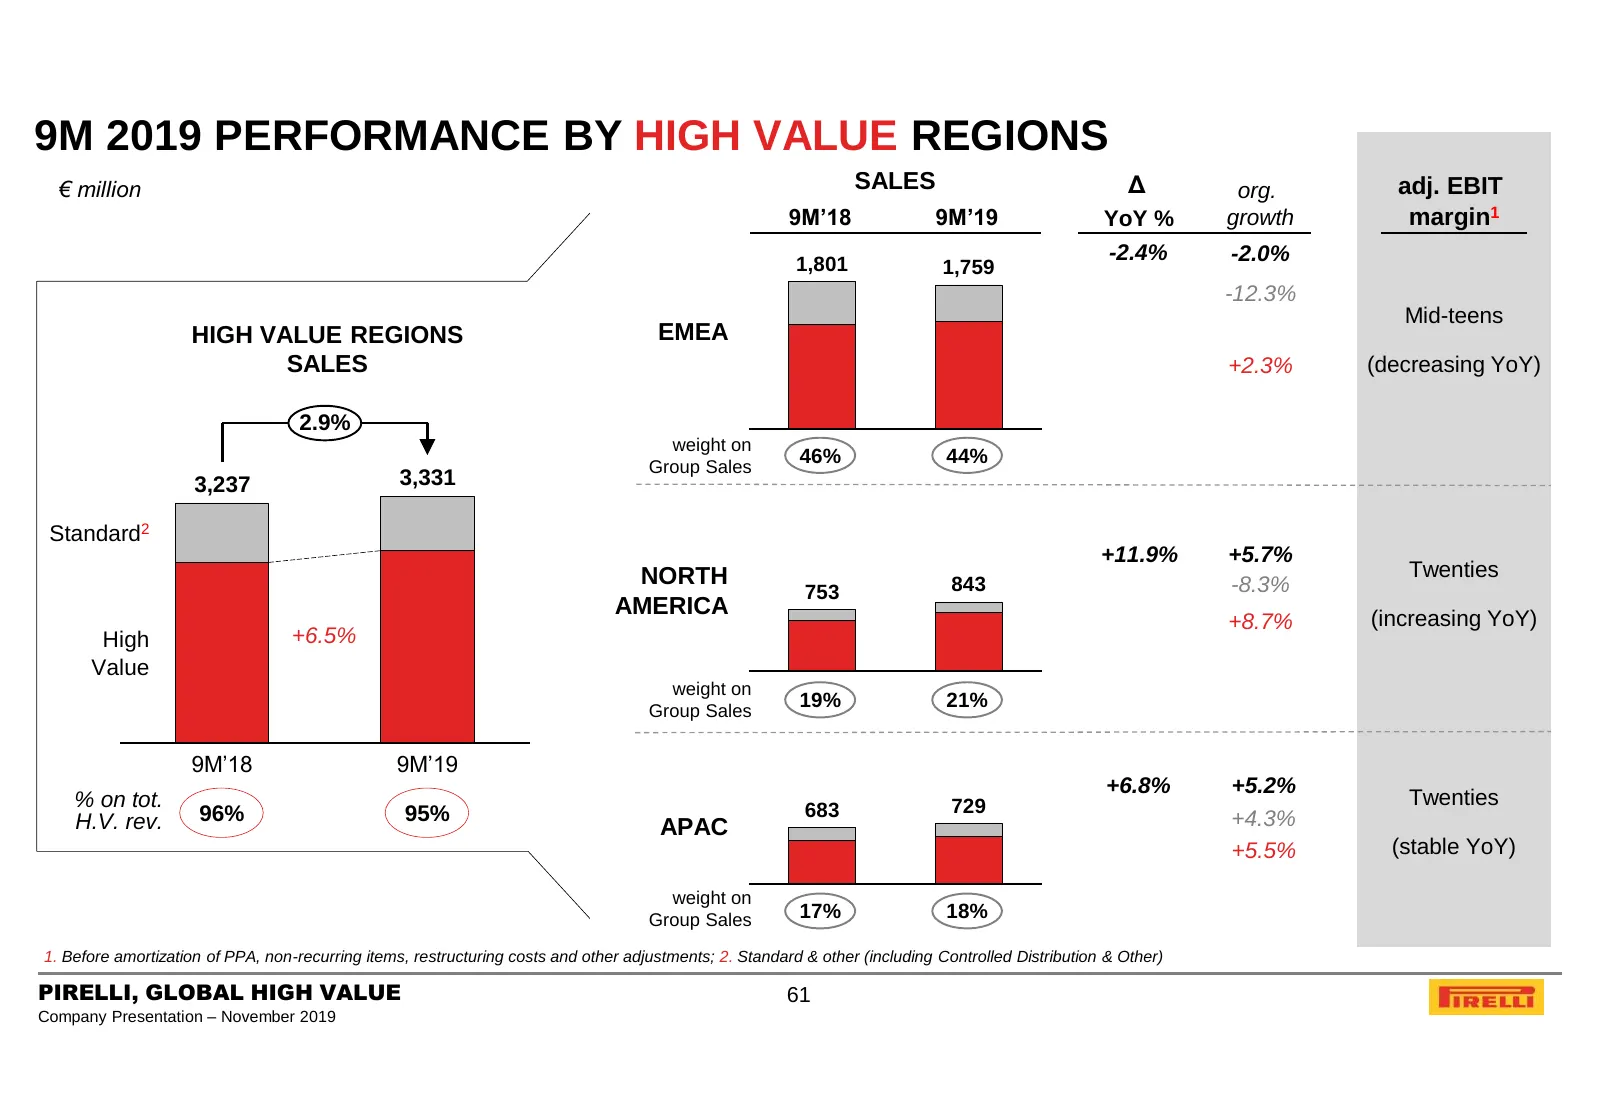
Slide 61: 9M 2019 Performance by High Value Regions
9M 2019 PERFORMANCE BY HIGH VALUE REGIONS € million SALES Δ org. adj. EBIT 9M’18 9M’19 YoY % growth margin1 1,801 -2.4% -2.0% 1,759 -12.3% Mid-teens HIGH VALUE REGIONS EMEA SALES +2.3% (decreasing YoY) 2.9% weight on Group Sales 46% 44% 3,237 3,331 Standard2 +11.9% +5.7% NORTH Twenties 753 843 -8.3%
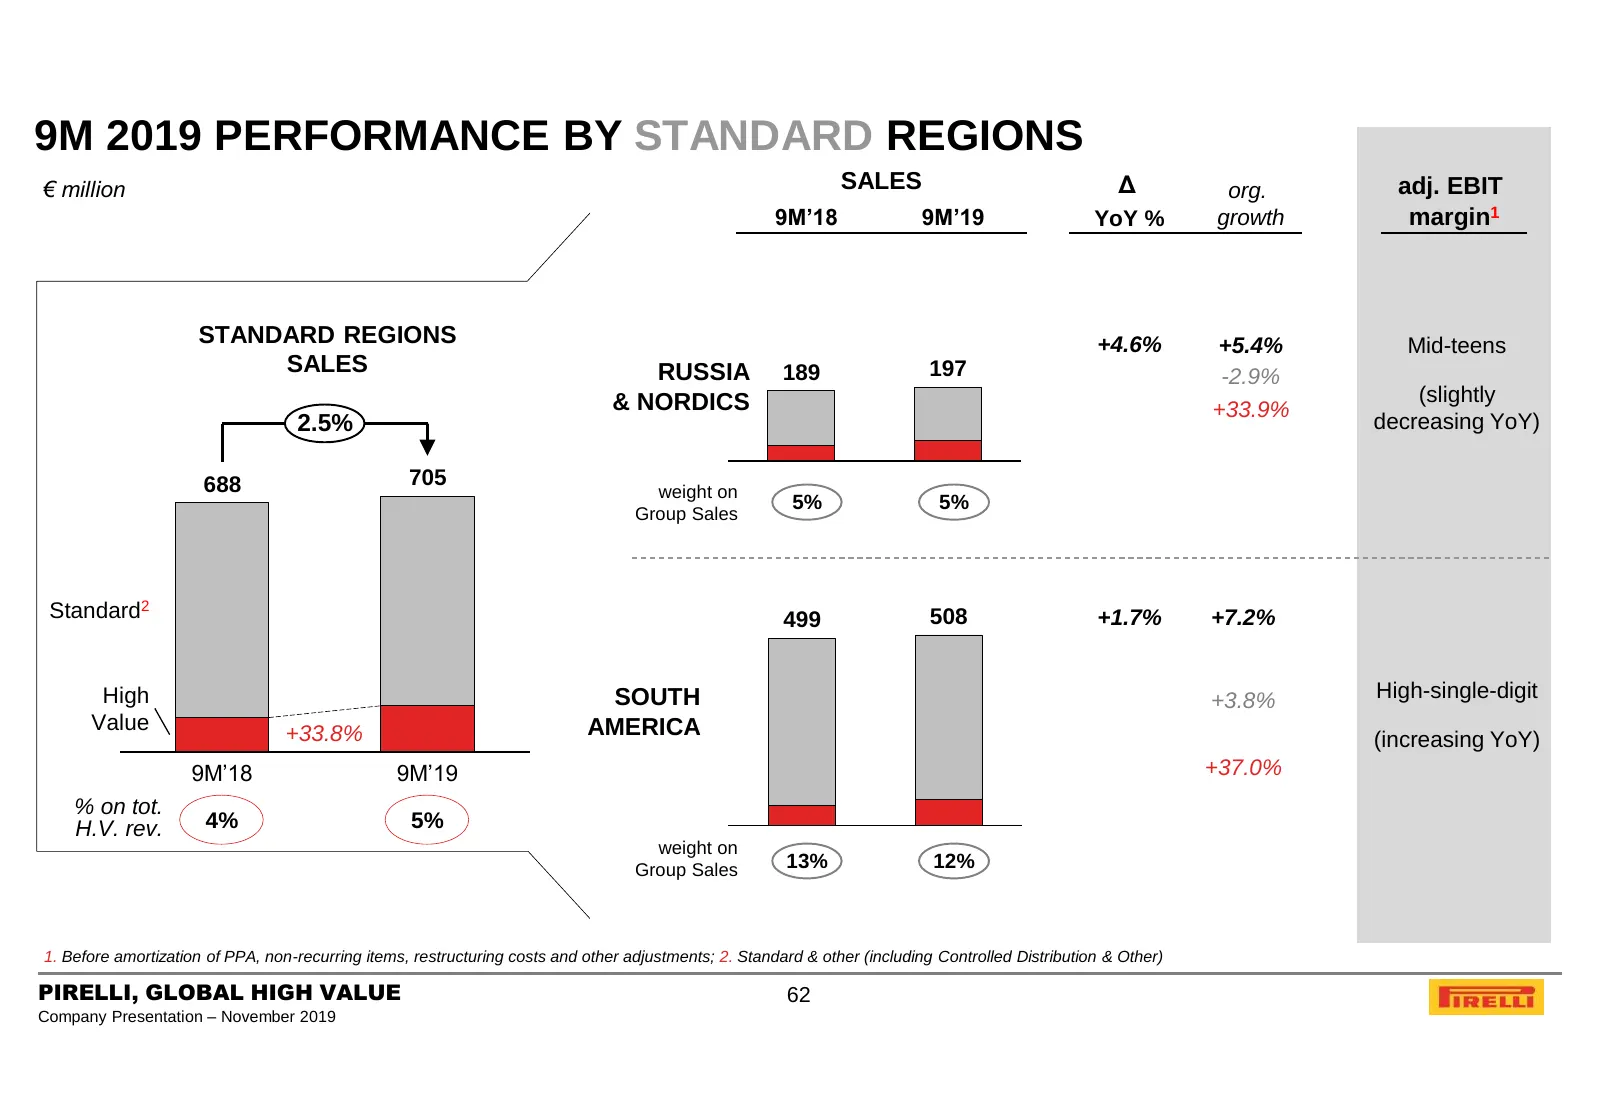
Slide 62: 9M 2019 Performance by Standard Regions
9M 2019 PERFORMANCE BY STANDARD REGIONS € million SALES Δ org. adj. EBIT 9M’18 9M’19 YoY % growth margin1 STANDARD REGIONS +4.6% +5.4% Mid-teens SALES RUSSIA 189 197 -2.9% & NORDICS (slightly +33.9% 2.5% decreasing YoY) 688 705 weight on Group Sales 5% 5% Standard2 499 508 +1.7% +7.2% High SOUTH +3.
Slide 63: FY 2019 Outlook Update (Oct '19)
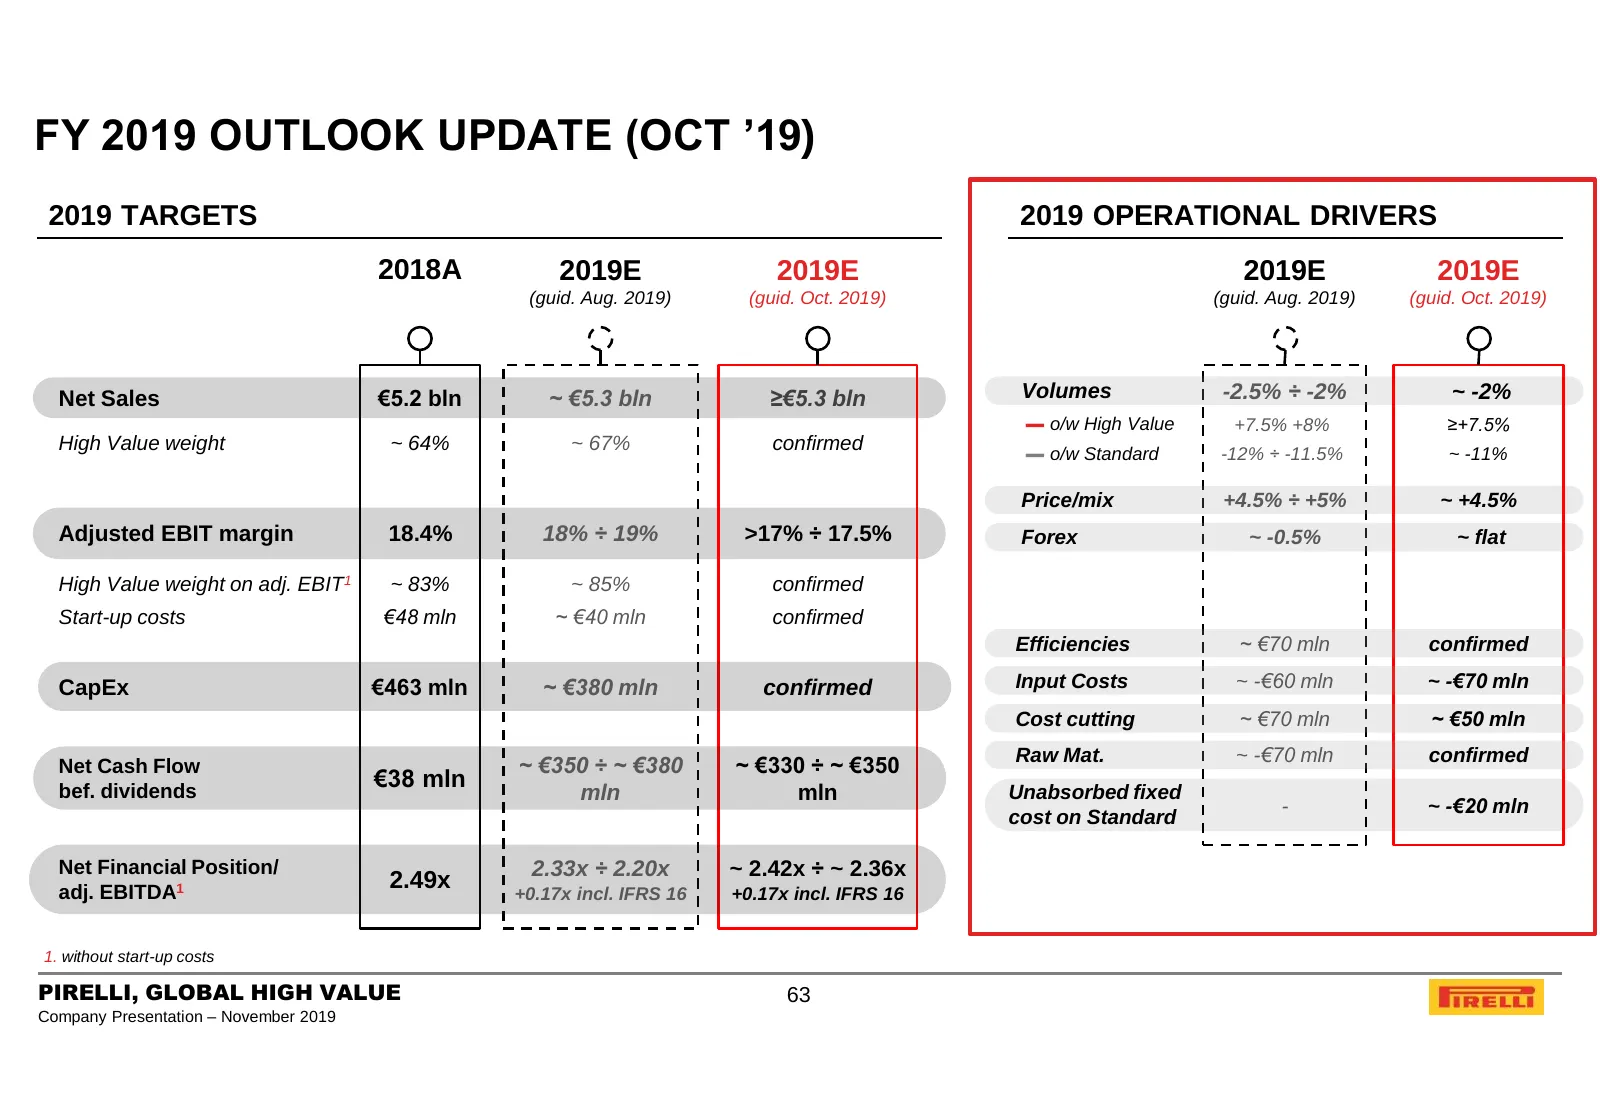
FY 2019 OUTLOOK UPDATE (OCT ’19) 2019 TARGETS 2019 OPERATIONAL DRIVERS 2018A 2019E 2019E 2019E 2019E (guid. Aug. 2019) (guid. Oct. 2019) (guid. Aug. 2019) (guid. Oct. 2019) Net Sales €5.2 bln ~ €5.3 bln ≥€5.3 bln Volumes -2.5% ÷ -2% ~ -2% ▬ o/w High Value +7.5% +8% ≥+7.5% High Value weight ~ 64% ~ 6
Slide 64: 9M 2019 Net Income Bridge
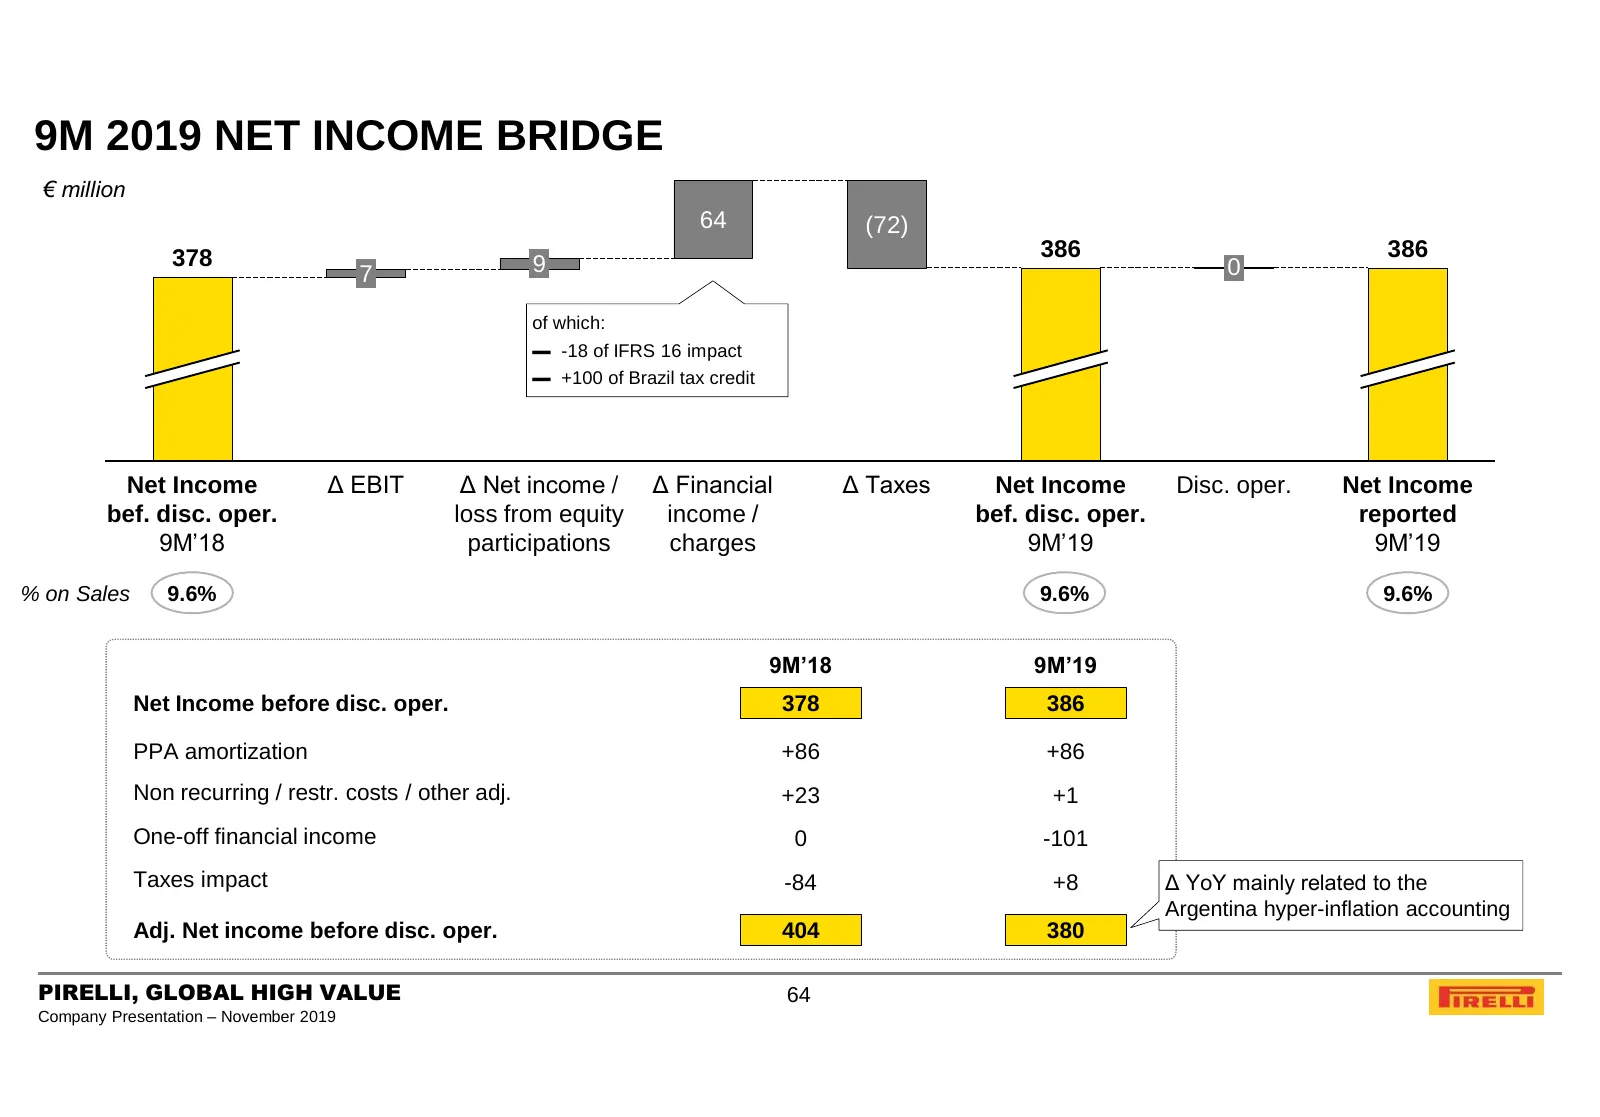
9M 2019 NET INCOME BRIDGE € million 64 (72) 378 386 386 7 9 0 of which: ▬ -18 of IFRS 16 impact ▬ +100 of Brazil tax credit Net Income Δ EBIT Δ Net income / Δ Financial Δ Taxes Net Income Disc. oper. Net Income bef. disc. oper. loss from equity income / bef. disc. oper. reported 9M’18 participations
Slide 65: 9M 2019 Cash Flow and Net Financial Position
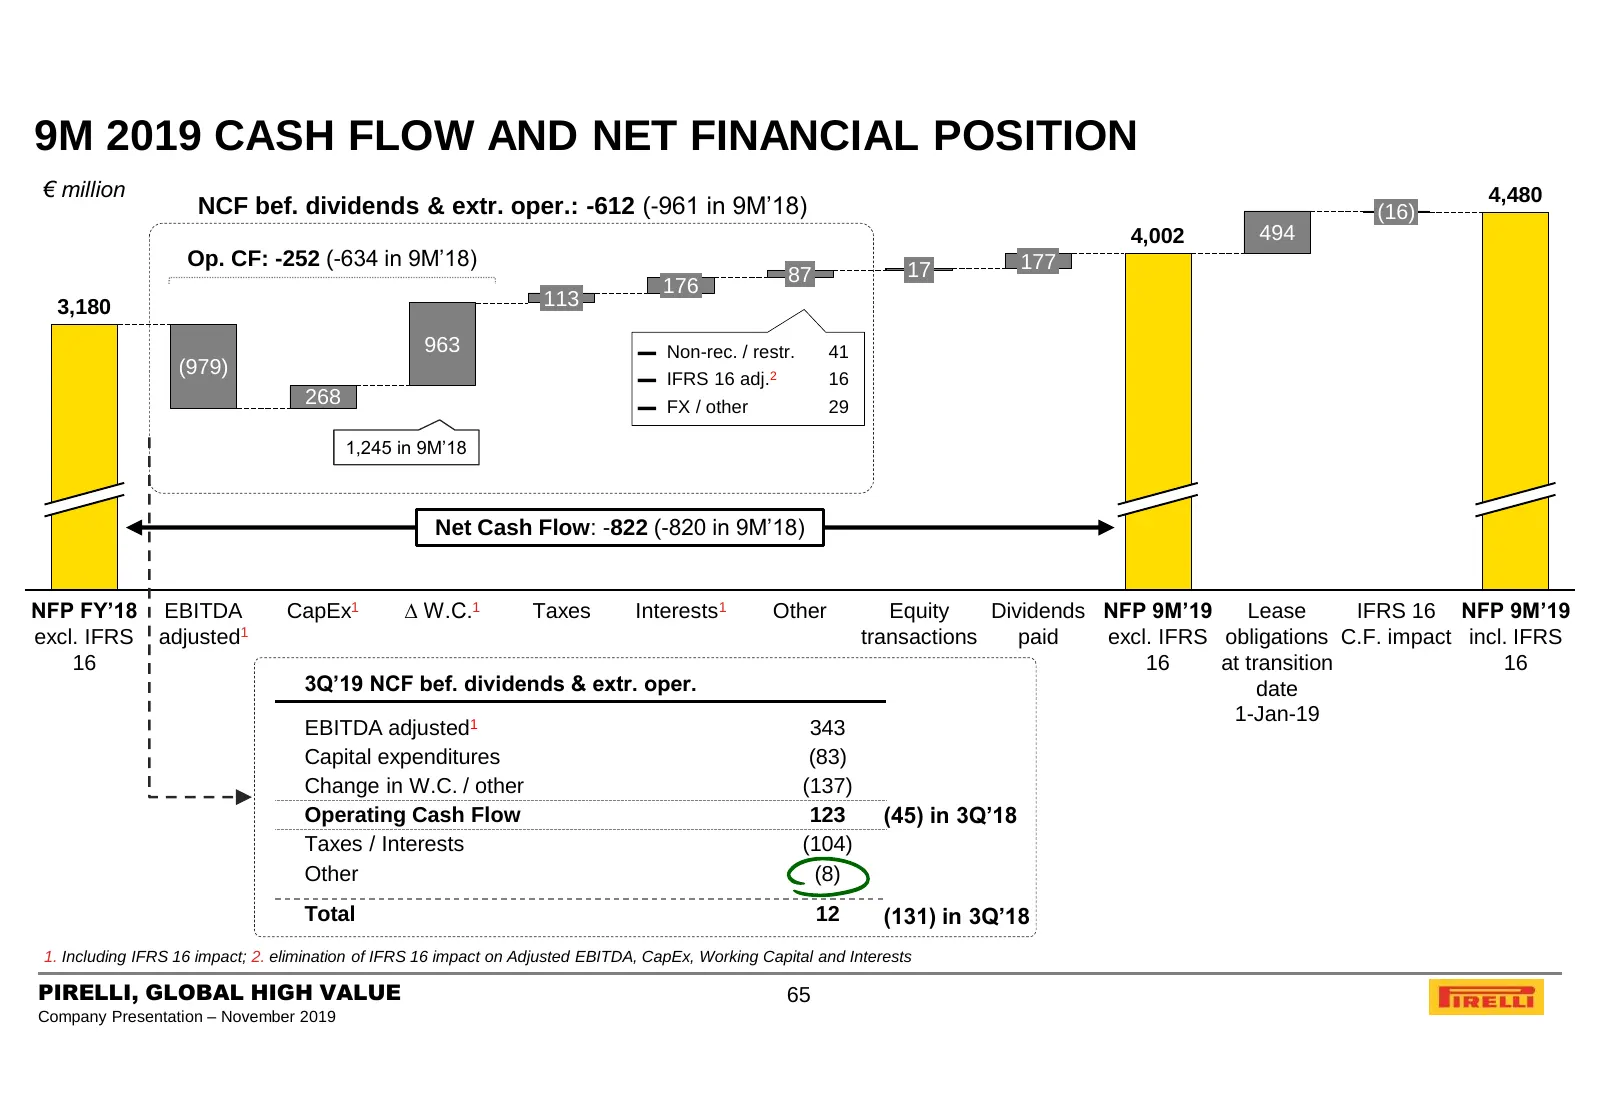
9M 2019 CASH FLOW AND NET FINANCIAL POSITION € million 4,480 NCF bef. dividends & extr. oper.: -612 (-961 in 9M’18) (16) 4,002 494 Op. CF: -252 (-634 in 9M’18) 17 177 87 176 3,180 113 963 ▬ Non-rec. / restr. 41 (979) ▬ IFRS 16 adj.2 16 268 ▬ FX / other 29 1,245 in 9M’18 Net Cash Flow: -822 (-820 in
Slide 66: Current Capital Structure (September 2019)
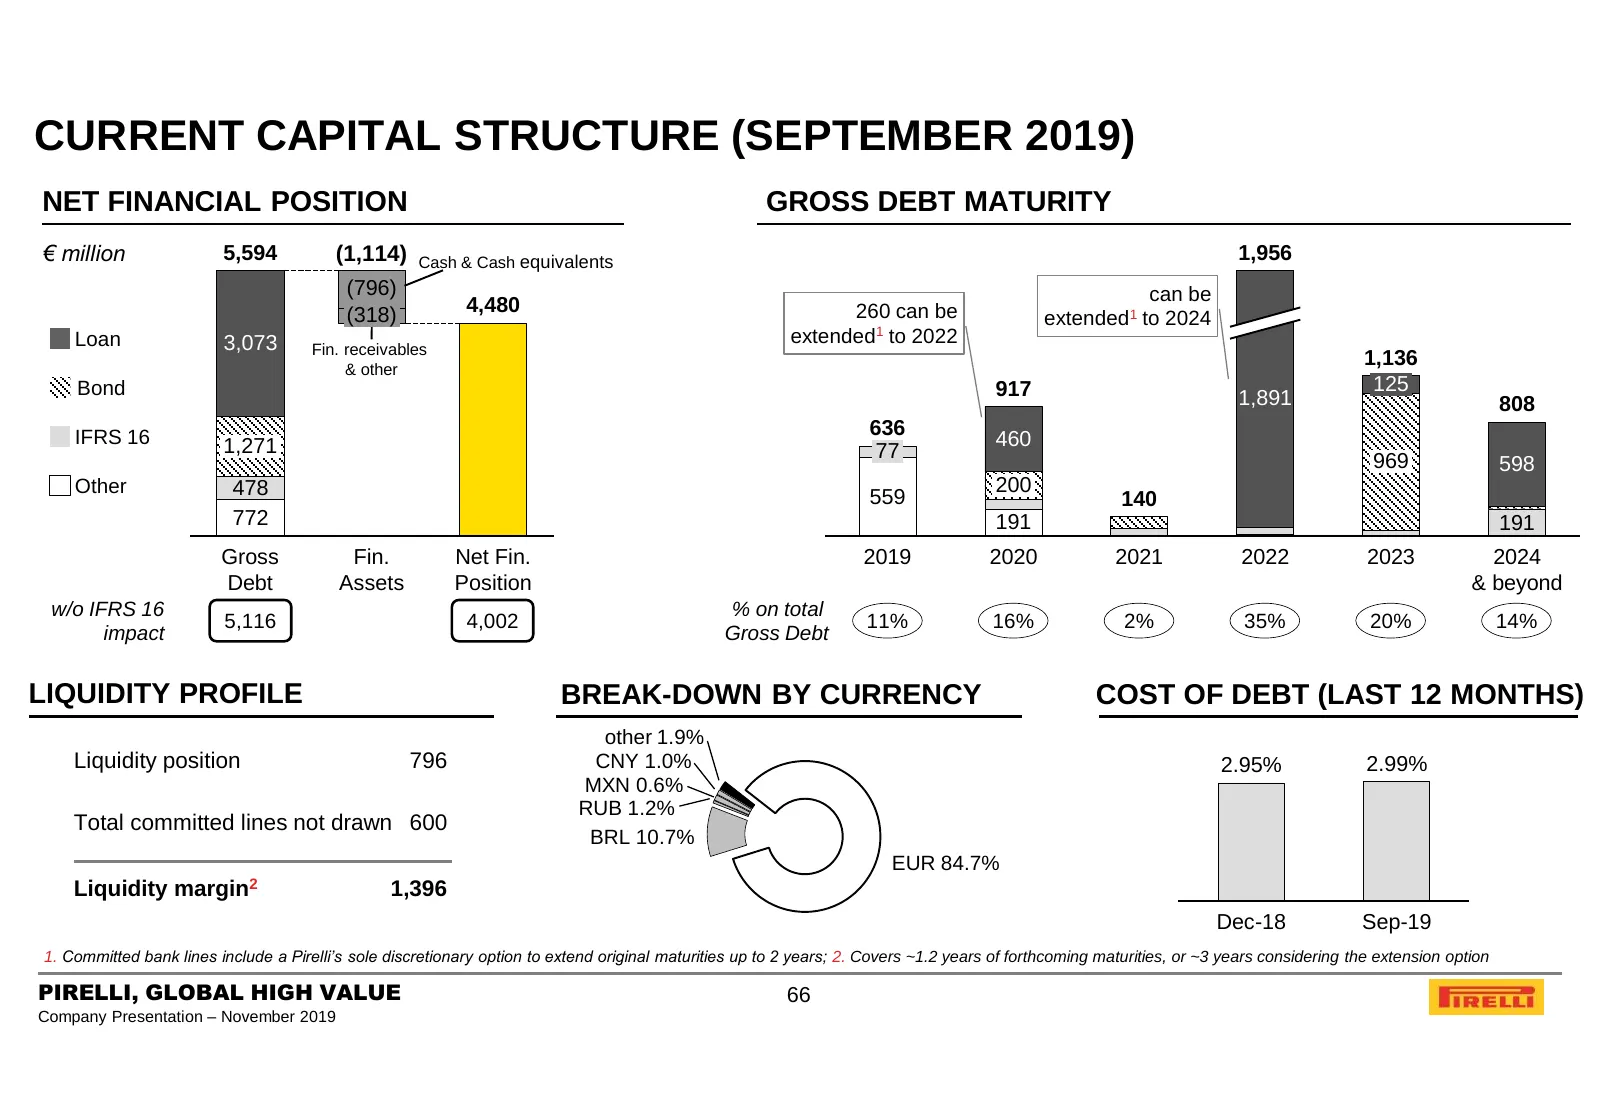
CURRENT CAPITAL STRUCTURE (SEPTEMBER 2019) NET FINANCIAL POSITION GROSS DEBT MATURITY € million 5,594 (1,114) Cash & Cash equivalents 1,956 (796) can be (318) 4,480 260 can be extended1 to 2024 Loan 3,073 extended1 to 2022 Fin. receivables & other 1,136 Bond 917 125 1,891 808 IFRS 16 636 1,271 460 7
Slide 67: Agenda
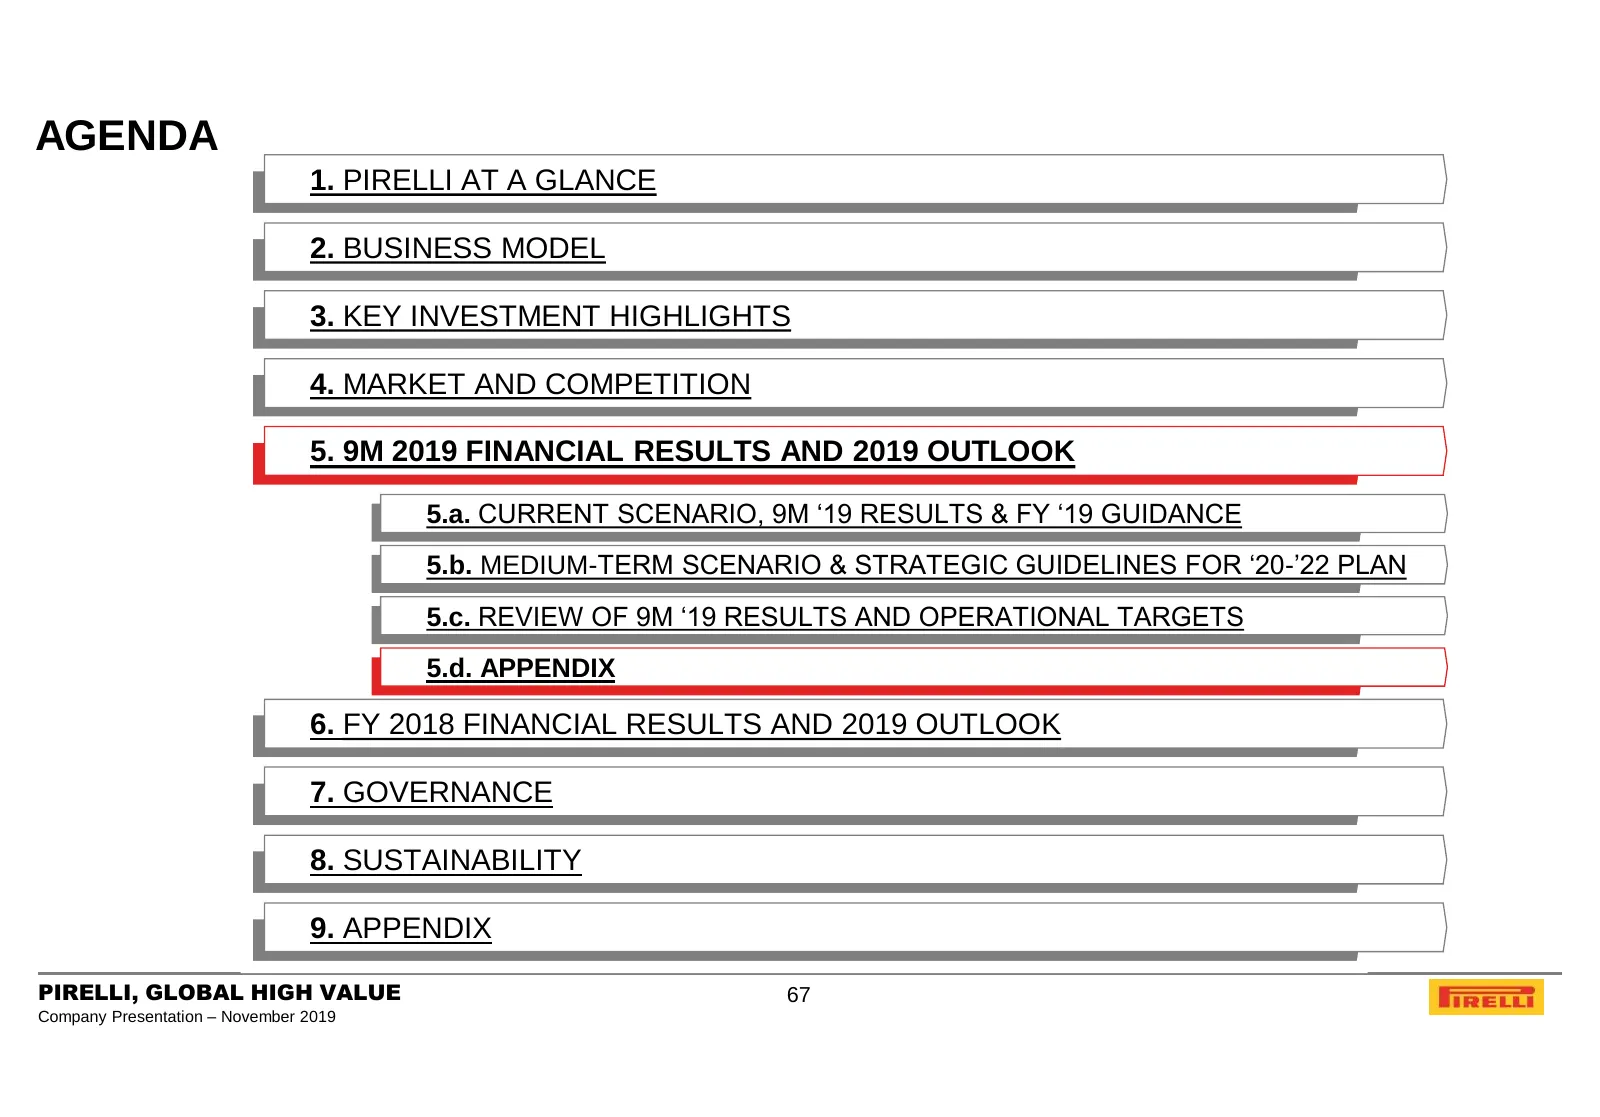
AGENDA 1. PIRELLI AT A GLANCE 2. BUSINESS MODEL 3. KEY INVESTMENT HIGHLIGHTS 4. MARKET AND COMPETITION 5. 9M 2019 FINANCIAL RESULTS AND 2019 OUTLOOK 5.a. CURRENT SCENARIO, 9M ‘19 RESULTS & FY ‘19 GUIDANCE 5.b. MEDIUM-TERM SCENARIO & STRATEGIC GUIDELINES FOR ‘20-’22 PLAN 5.c. REVIEW OF 9M ‘19 RESULTS
Slide 68: 3Q / 9M 2019 Results Highlights
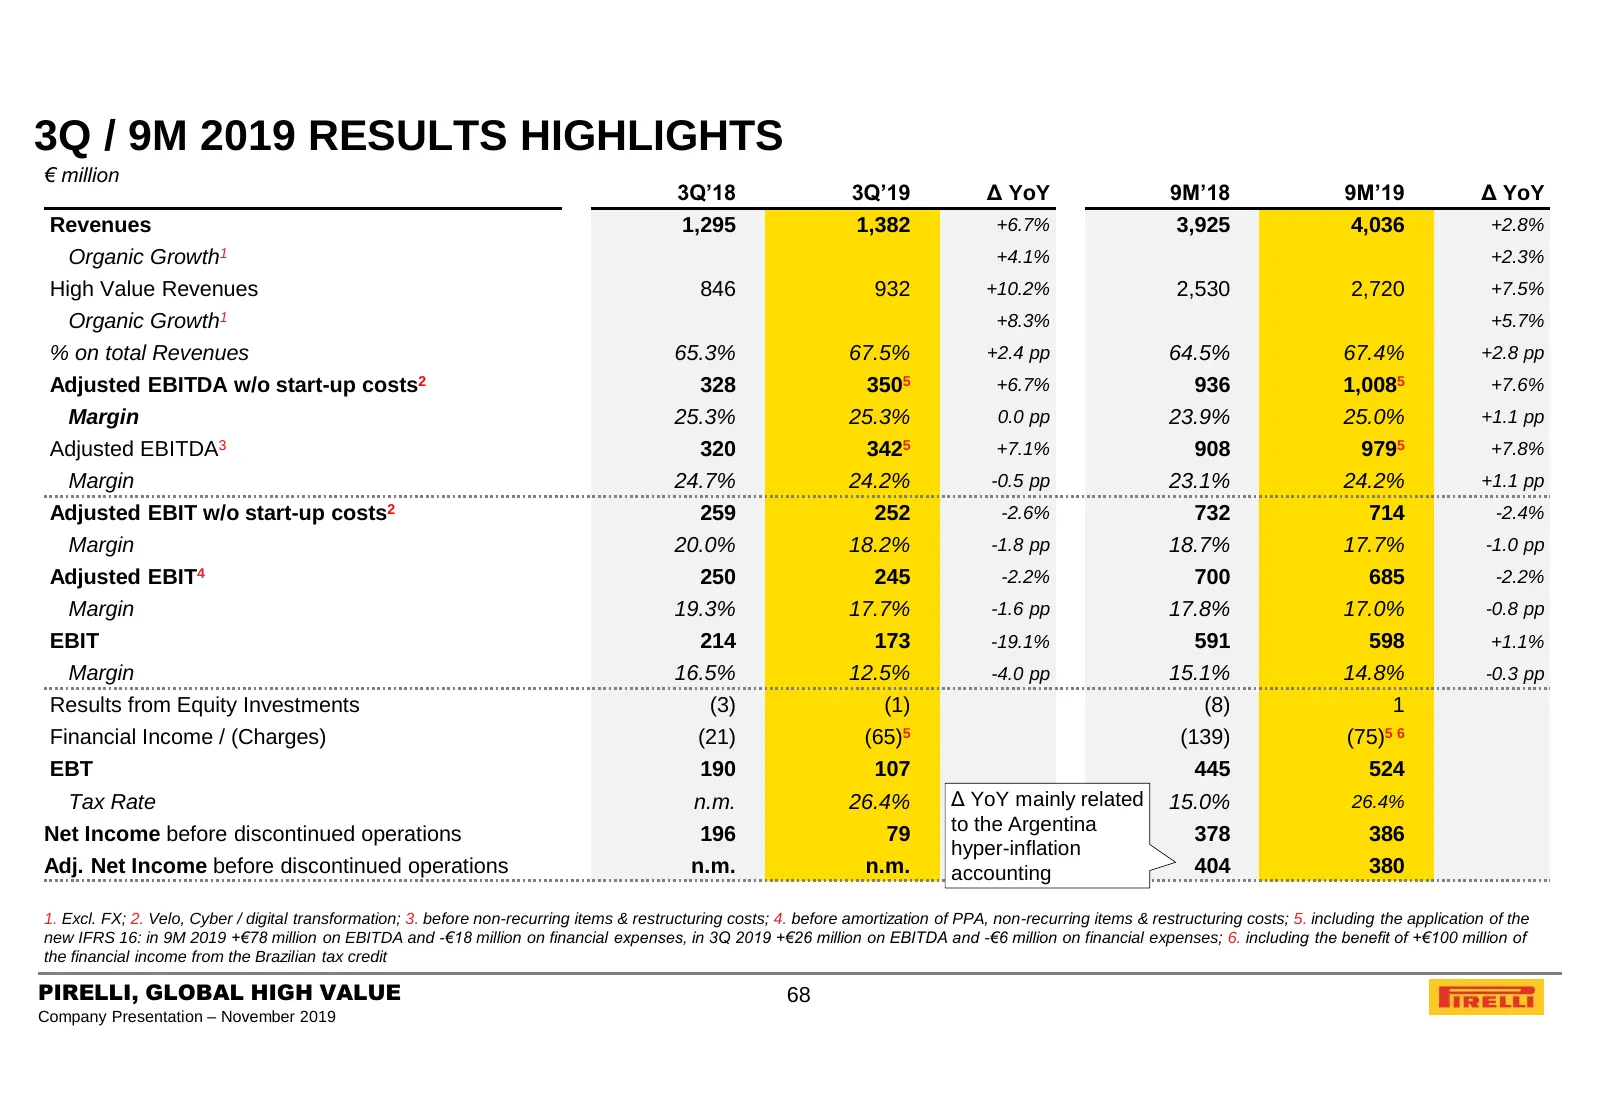
3Q / 9M 2019 RESULTS HIGHLIGHTS € million 3Q’18 3Q’19 Δ YoY 9M’18 9M’19 Δ YoY Revenues 1,295 1,382 +6.7% 3,925 4,036 +2.8% Organic Growth1 +4.1% +2.3% High Value Revenues 846 932 +10.2% 2,530 2,720 +7.5% Organic Growth1 +8.3% +5.7% % on total Revenues 65.3% 67.5% +2.4 pp 64.5% 67.4% +2.8 pp Adjusted
Slide 69: 9M 2019 Balance Sheet
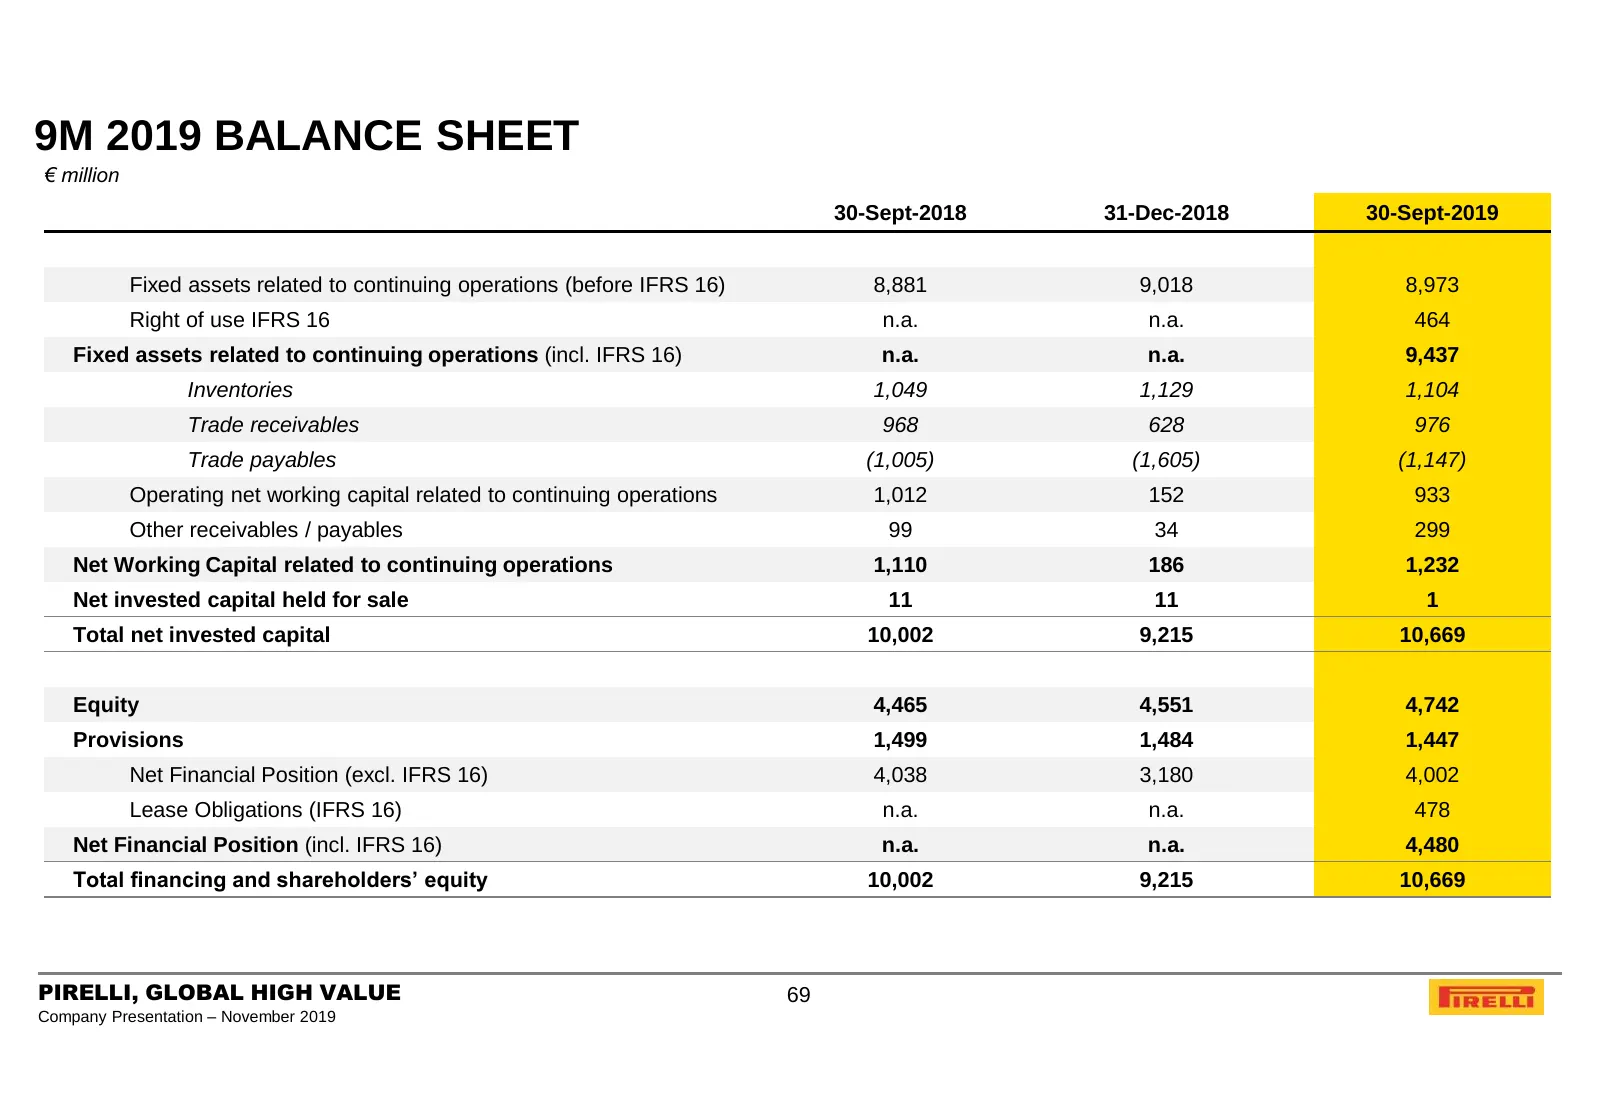
9M 2019 BALANCE SHEET € million 30-Sept-2018 31-Dec-2018 30-Sept-2019 Fixed assets related to continuing operations (before IFRS 16) 8,881 9,018 8,973 Right of use IFRS 16 n.a. n.a. 464 Fixed assets related to continuing operations (incl. IFRS 16) n.a. n.a. 9,437 Inventories 1,049 1,129 1,104 Trade
Slide 70: 9M 2019 Cash Flow
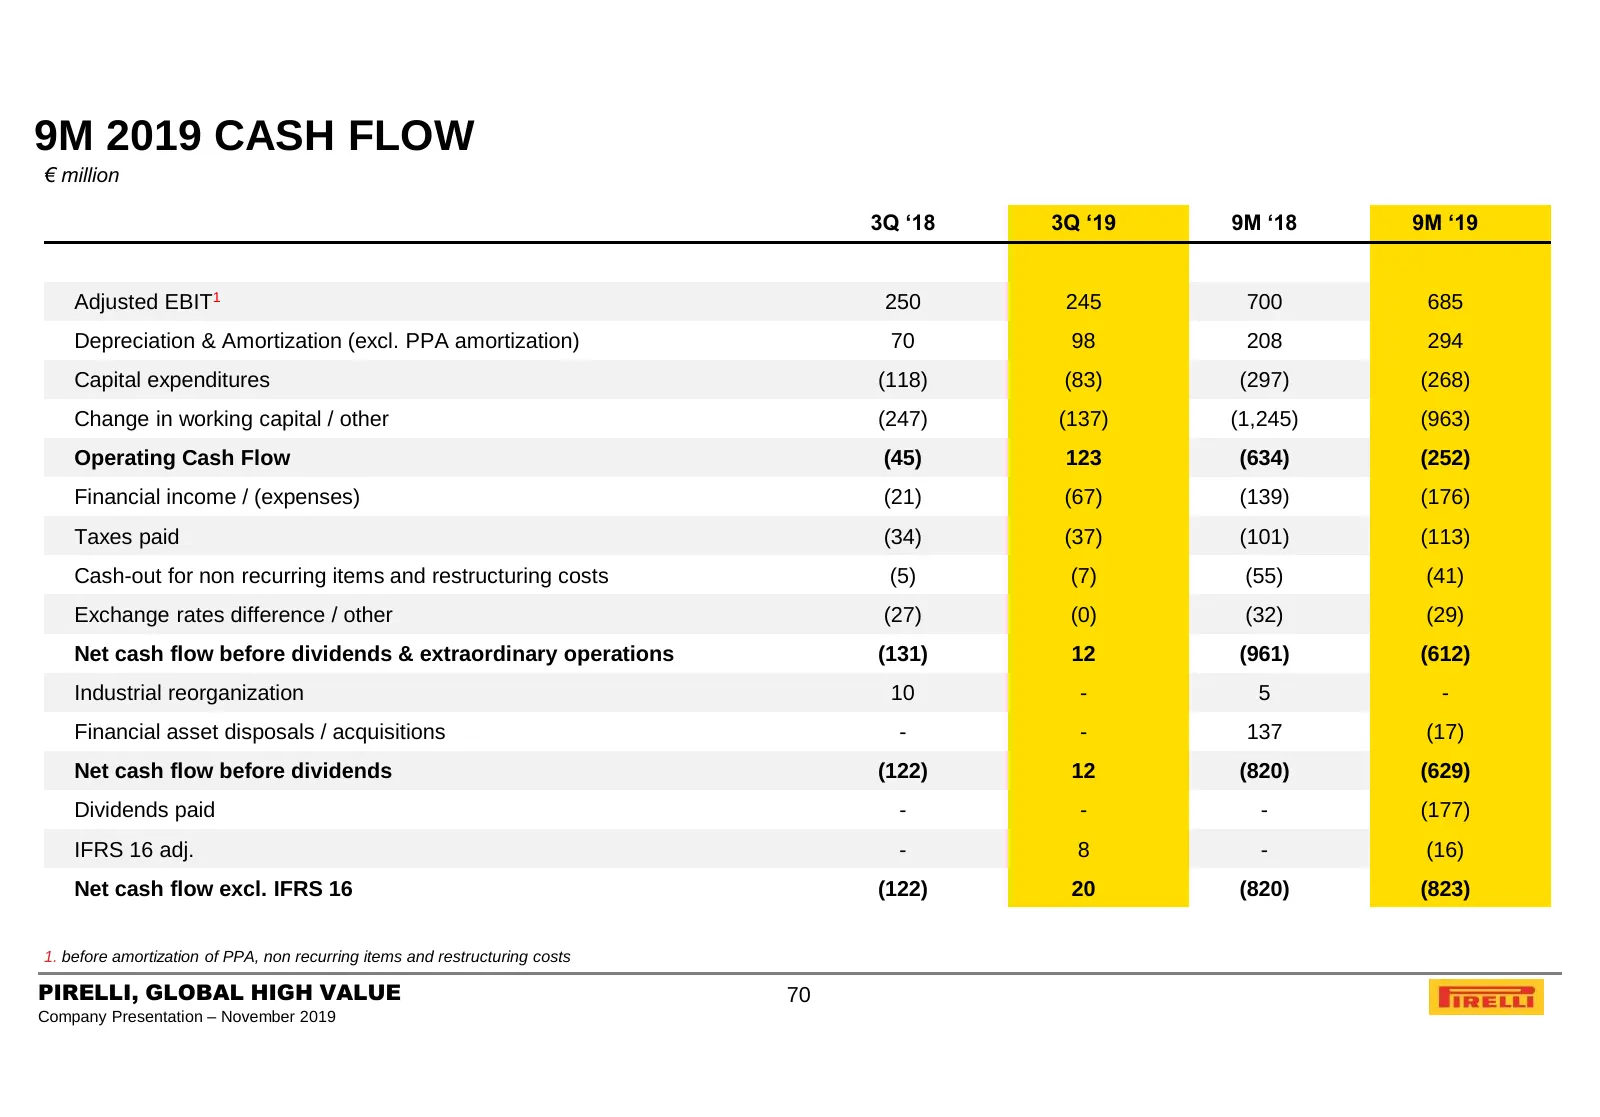
9M 2019 CASH FLOW € million 3Q ‘18 3Q ‘19 9M ‘18 9M ‘19 Adjusted EBIT1 250 245 700 685 Depreciation & Amortization (excl. PPA amortization) 70 98 208 294 Capital expenditures (118) (83) (297) (268) Change in working capital / other (247) (137) (1,245) (963) Operating Cash Flow (45) 123 (634) (252) F
Slide 71: 2019E Raw Material Guidance
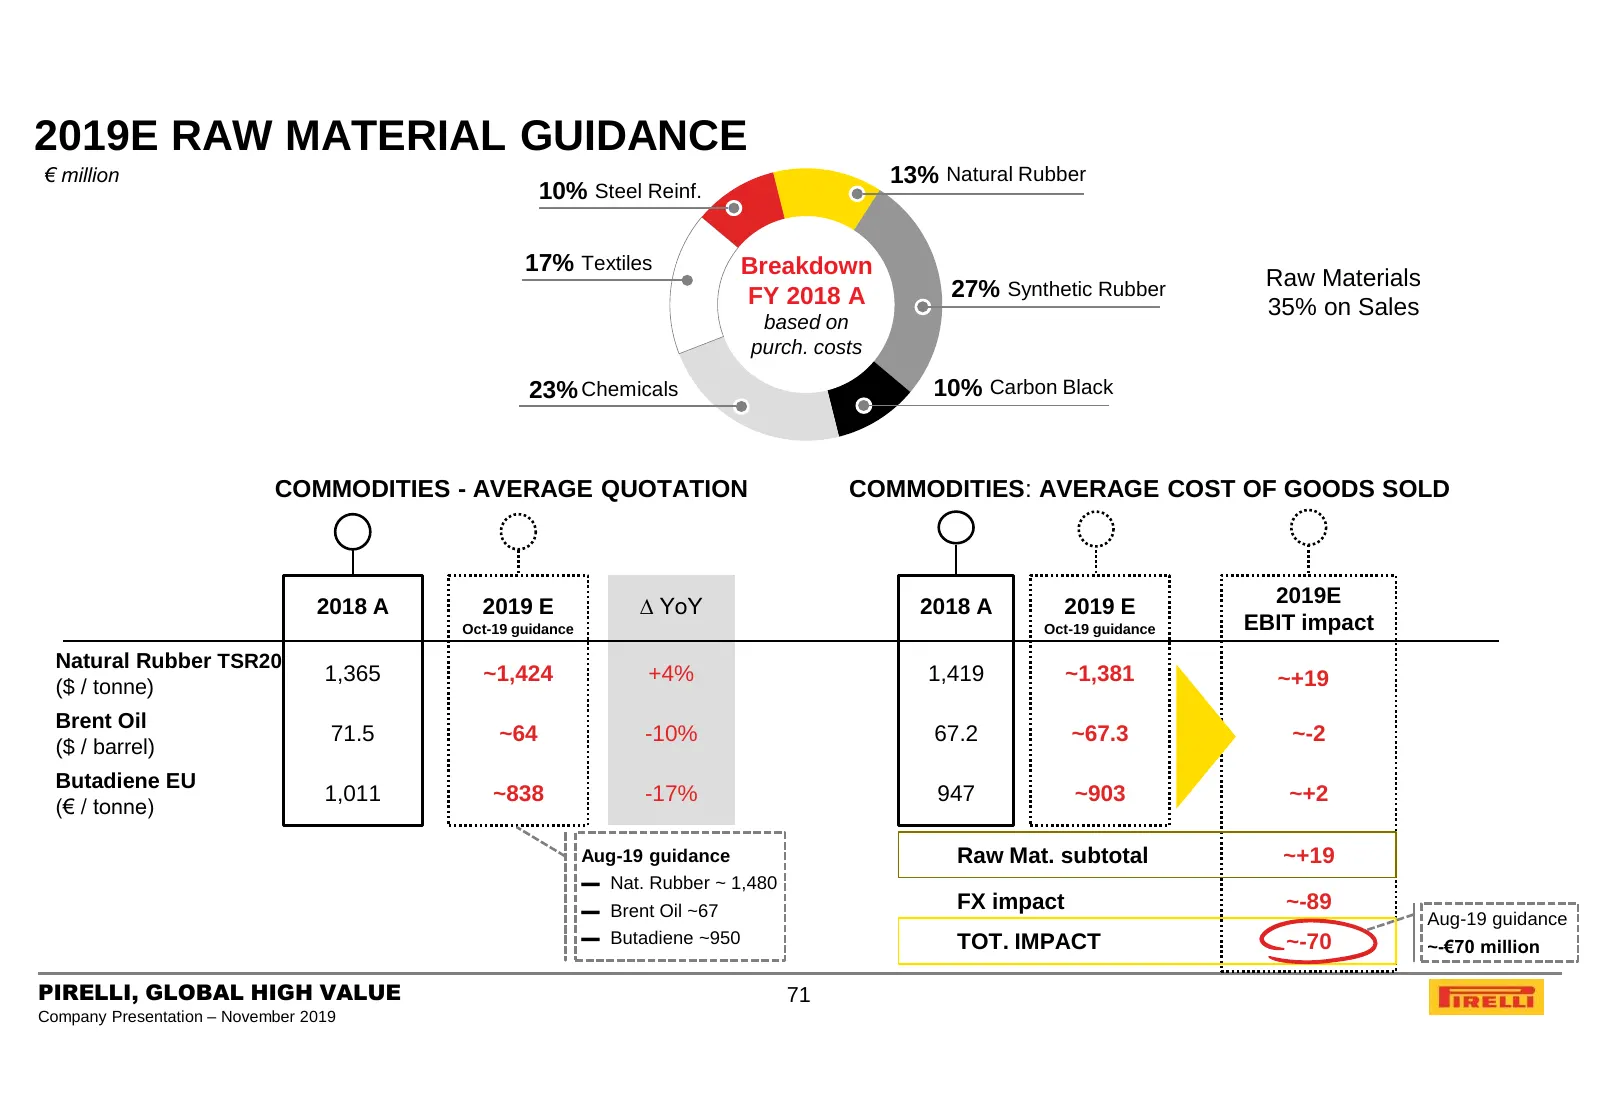
2019E RAW MATERIAL GUIDANCE € million 13% Natural Rubber 10% Steel Reinf. 17% Textiles Breakdown 27% Synthetic Rubber Raw Materials FY 2018 A 35% on Sales based on purch. costs 23% Chemicals 10% Carbon Black COMMODITIES - AVERAGE QUOTATION COMMODITIES: AVERAGE COST OF GOODS SOLD 2019E 2018 A 2019 E
Slide 72: 2019E Forex Guidance
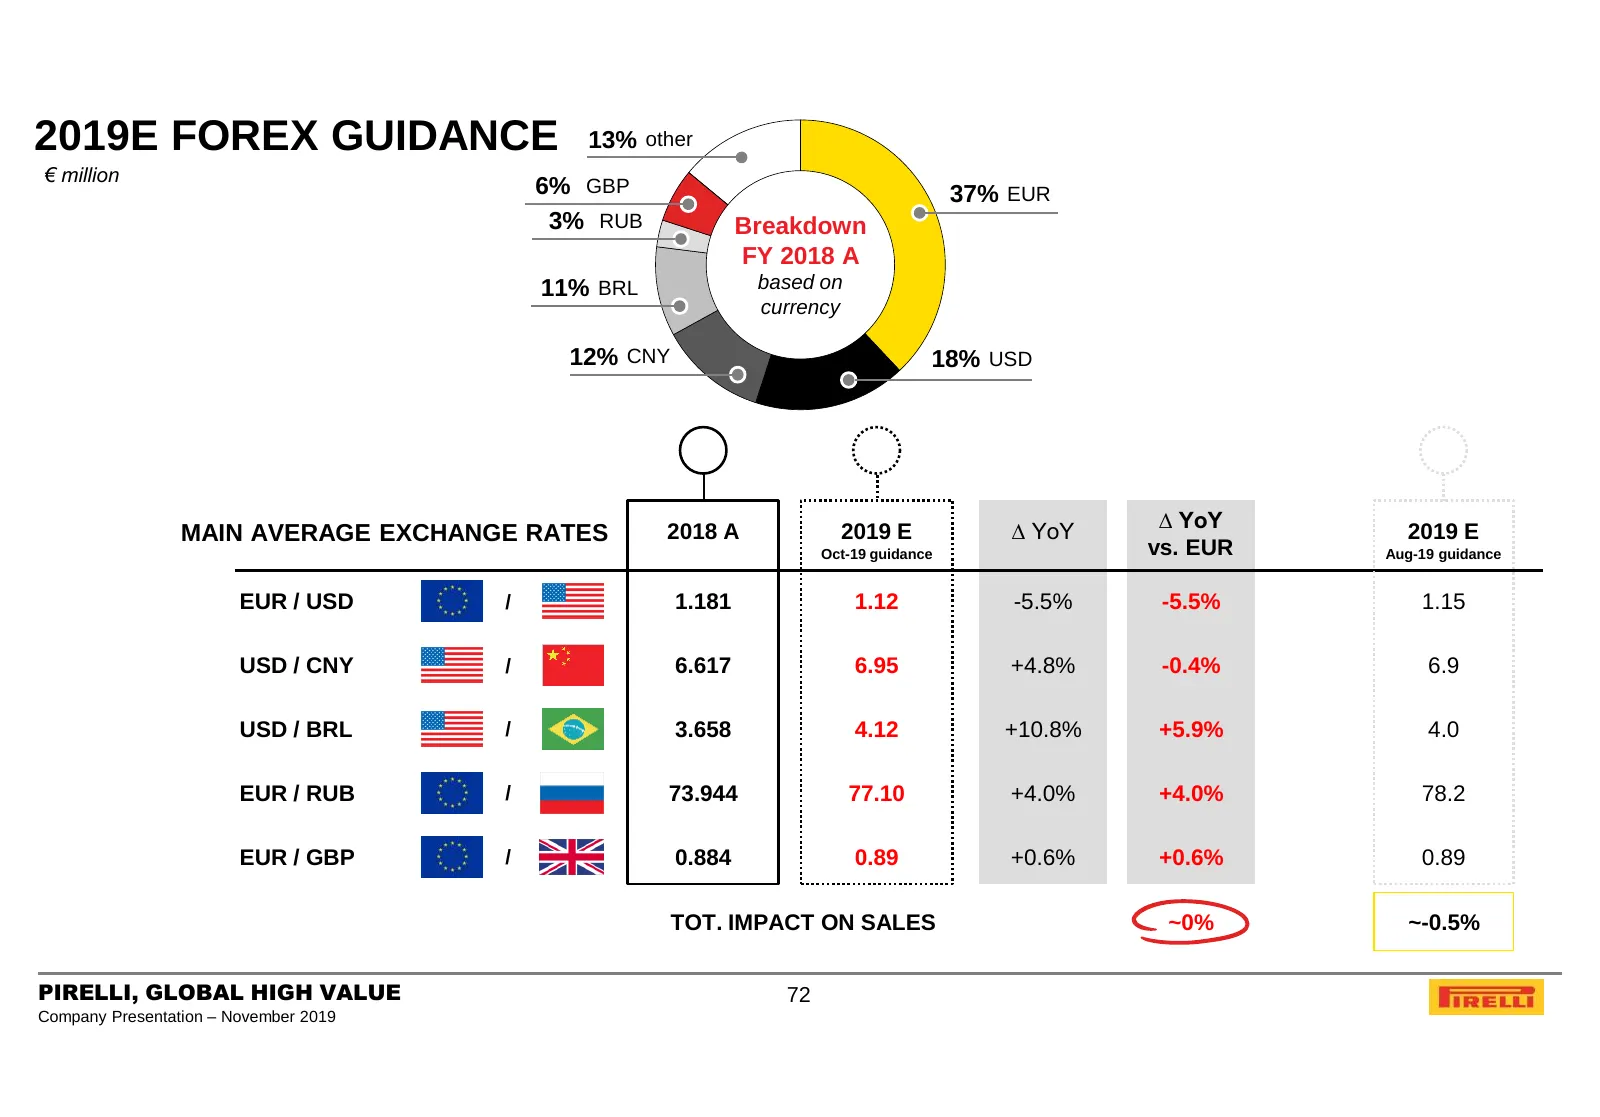
2019E FOREX GUIDANCE 13% other € million 6% GBP 37% EUR 3% RUB Breakdown FY 2018 A 11% BRL based on currency 12% CNY 18% USD ∆ YoY MAIN AVERAGE EXCHANGE RATES 2018 A 2019 E ∆ YoY 2019 E Oct-19 guidance vs. EUR Aug-19 guidance EUR / USD / 1.181 1.12 -5.5% -5.5% 1.15 USD / CNY / 6.617 6.95 +4.8% -0.4%
Slide 73: Key Car Market Trends: EMEA
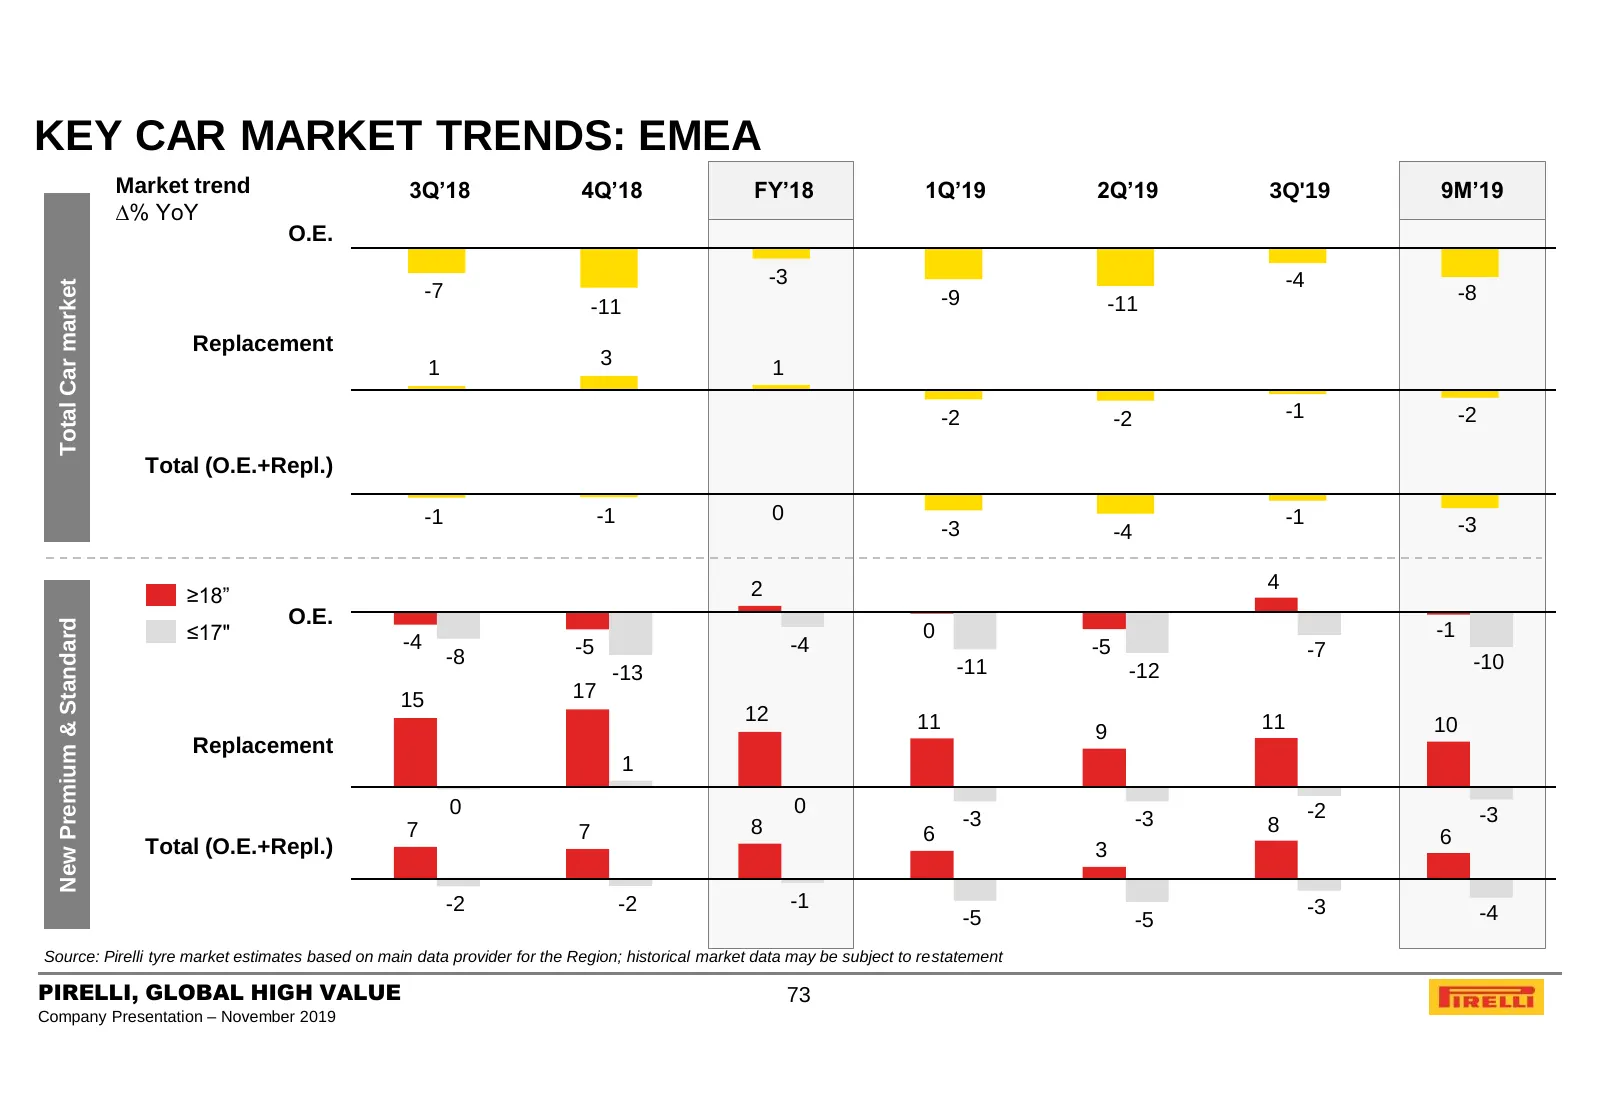
KEY CAR MARKET TRENDS: EMEA Market trend 3Q’18 4Q’18 FY’18 1Q’19 2Q’19 3Q'19 9M’19 ∆% YoY O.E. -3 -4 Total Car market -7 -9 -8 -11 -11 Replacement 1 3 1 -2 -2 -1 -2 Total (O.E.+Repl.) -1 -1 0 -1 -3 -4 -3 2 4 ≥18” O.E. New Premium & Standard ≤17" -4 0 -1 -5 -4 -5 -7 -8 -11 -10 -13 -12 15 17 12 11 11
Slide 74: Key Car Market Trends: North America
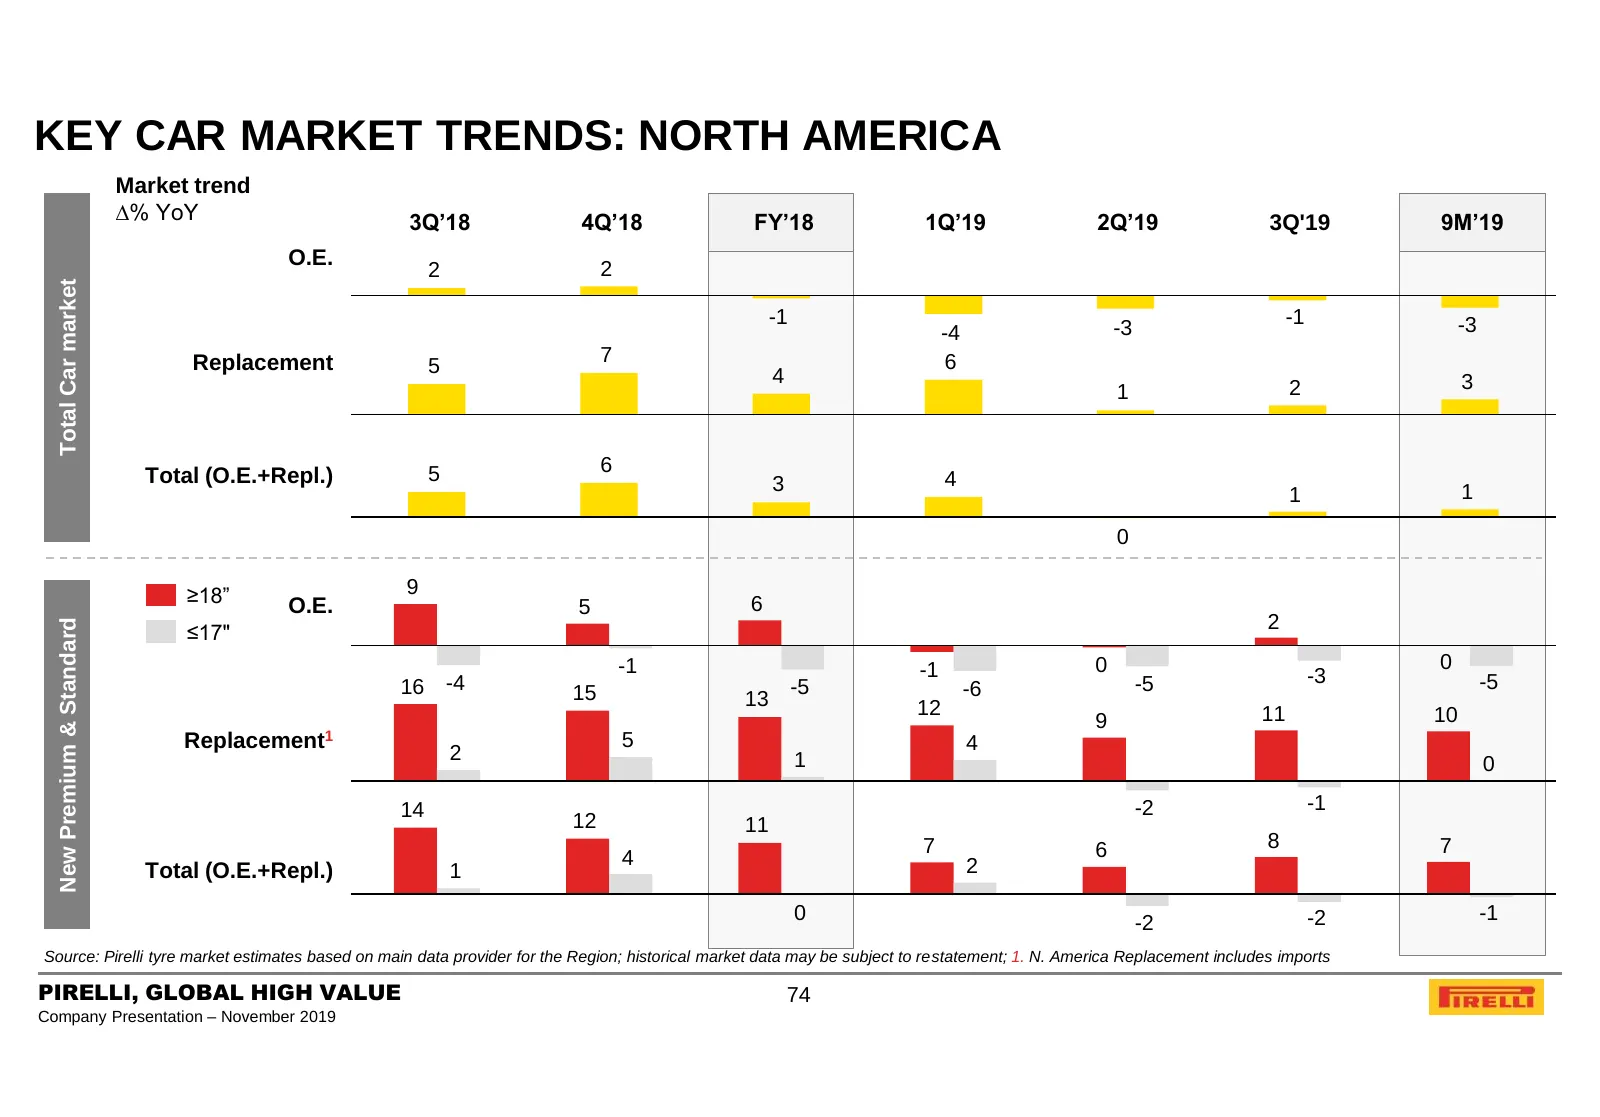
KEY CAR MARKET TRENDS: NORTH AMERICA Market trend ∆% YoY 3Q’18 4Q’18 FY’18 1Q’19 2Q’19 3Q'19 9M’19 O.E. 2 2 Total Car market -1 -3 -1 -3 -4 Replacement 5 7 6 4 3 1 2 5 6 Total (O.E.+Repl.) 3 4 1 1 0 ≥18” 9 O.E. 5 6 2 New Premium & Standard ≤17" -1 -1 0 0 16 -4 -5 -5 -3 -5 15 13 -6 12 11 10 9 Replace
Slide 75: Key Car Market Trends: Asia Pacific
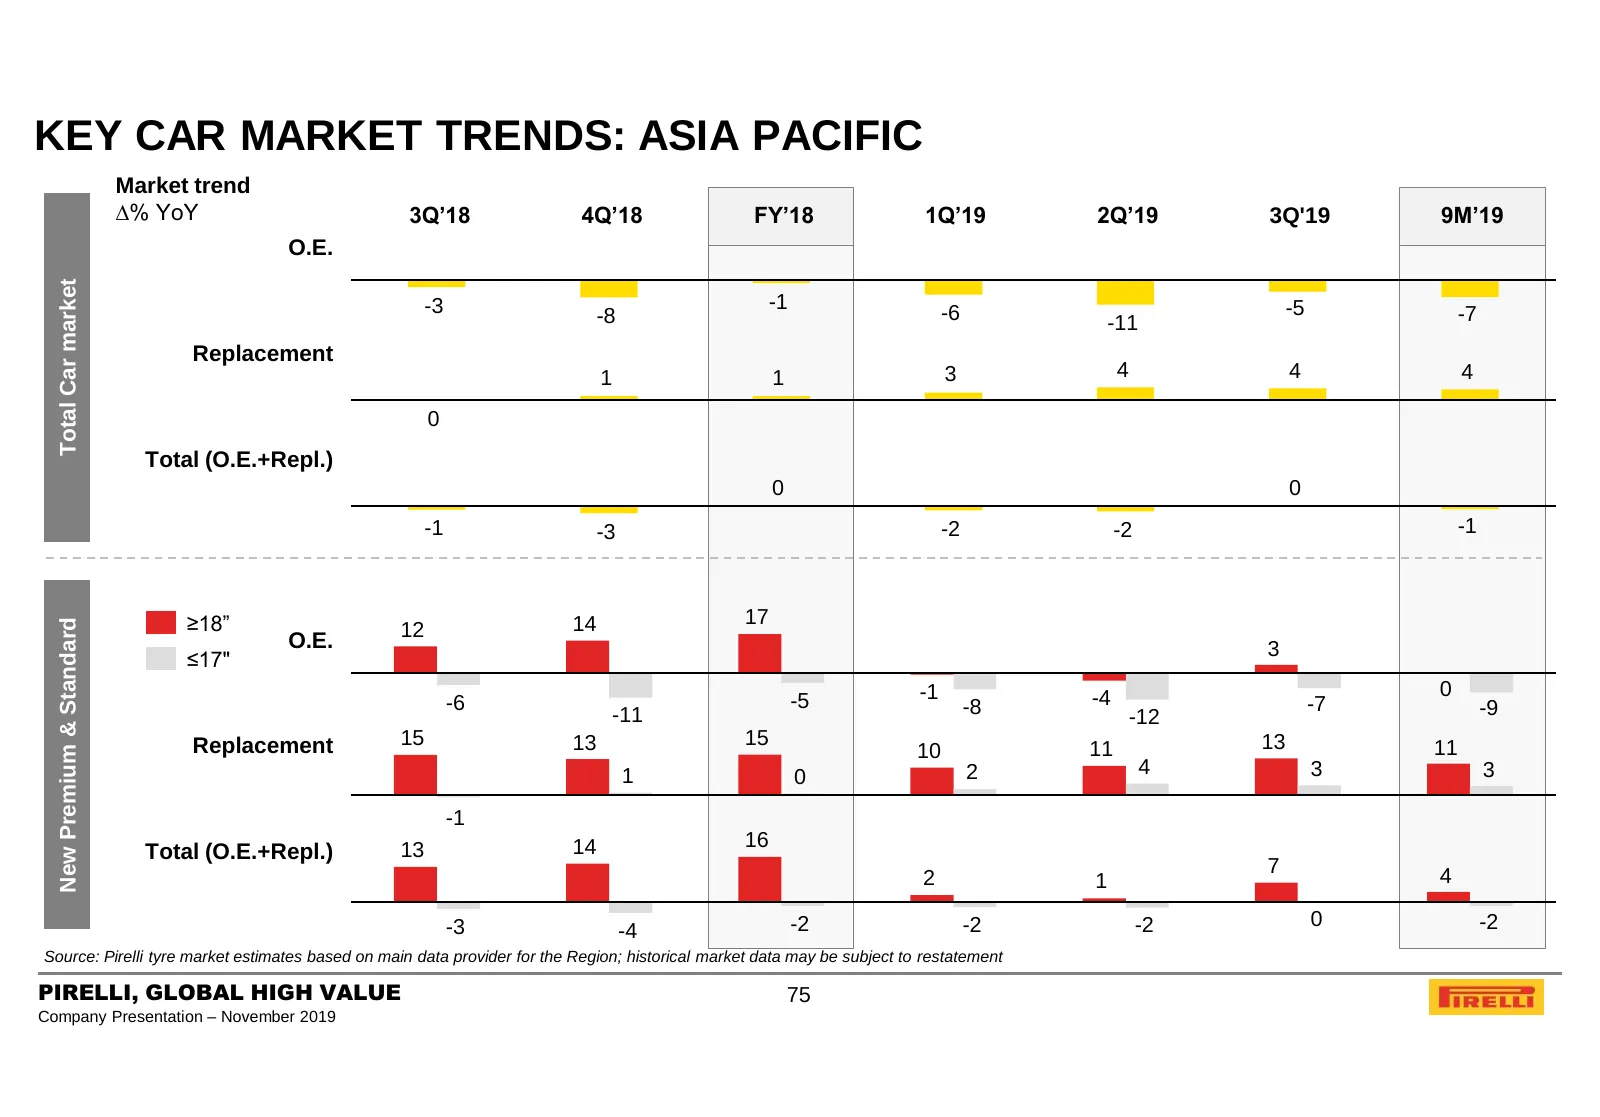
KEY CAR MARKET TRENDS: ASIA PACIFIC Market trend ∆% YoY 3Q’18 4Q’18 FY’18 1Q’19 2Q’19 3Q'19 9M’19 O.E. Total Car market -3 -1 -5 -8 -6 -11 -7 Replacement 1 1 3 4 4 4 0 Total (O.E.+Repl.) 0 0 -1 -3 -2 -2 -1 ≥18” 14 17 New Premium & Standard 12 O.E. 3 ≤17" -1 -4 0 -6 -5 -8 -7 -9 -11 -12 Replacement 15
Slide 76: Key Market Trends: Russia & Nordics / South America
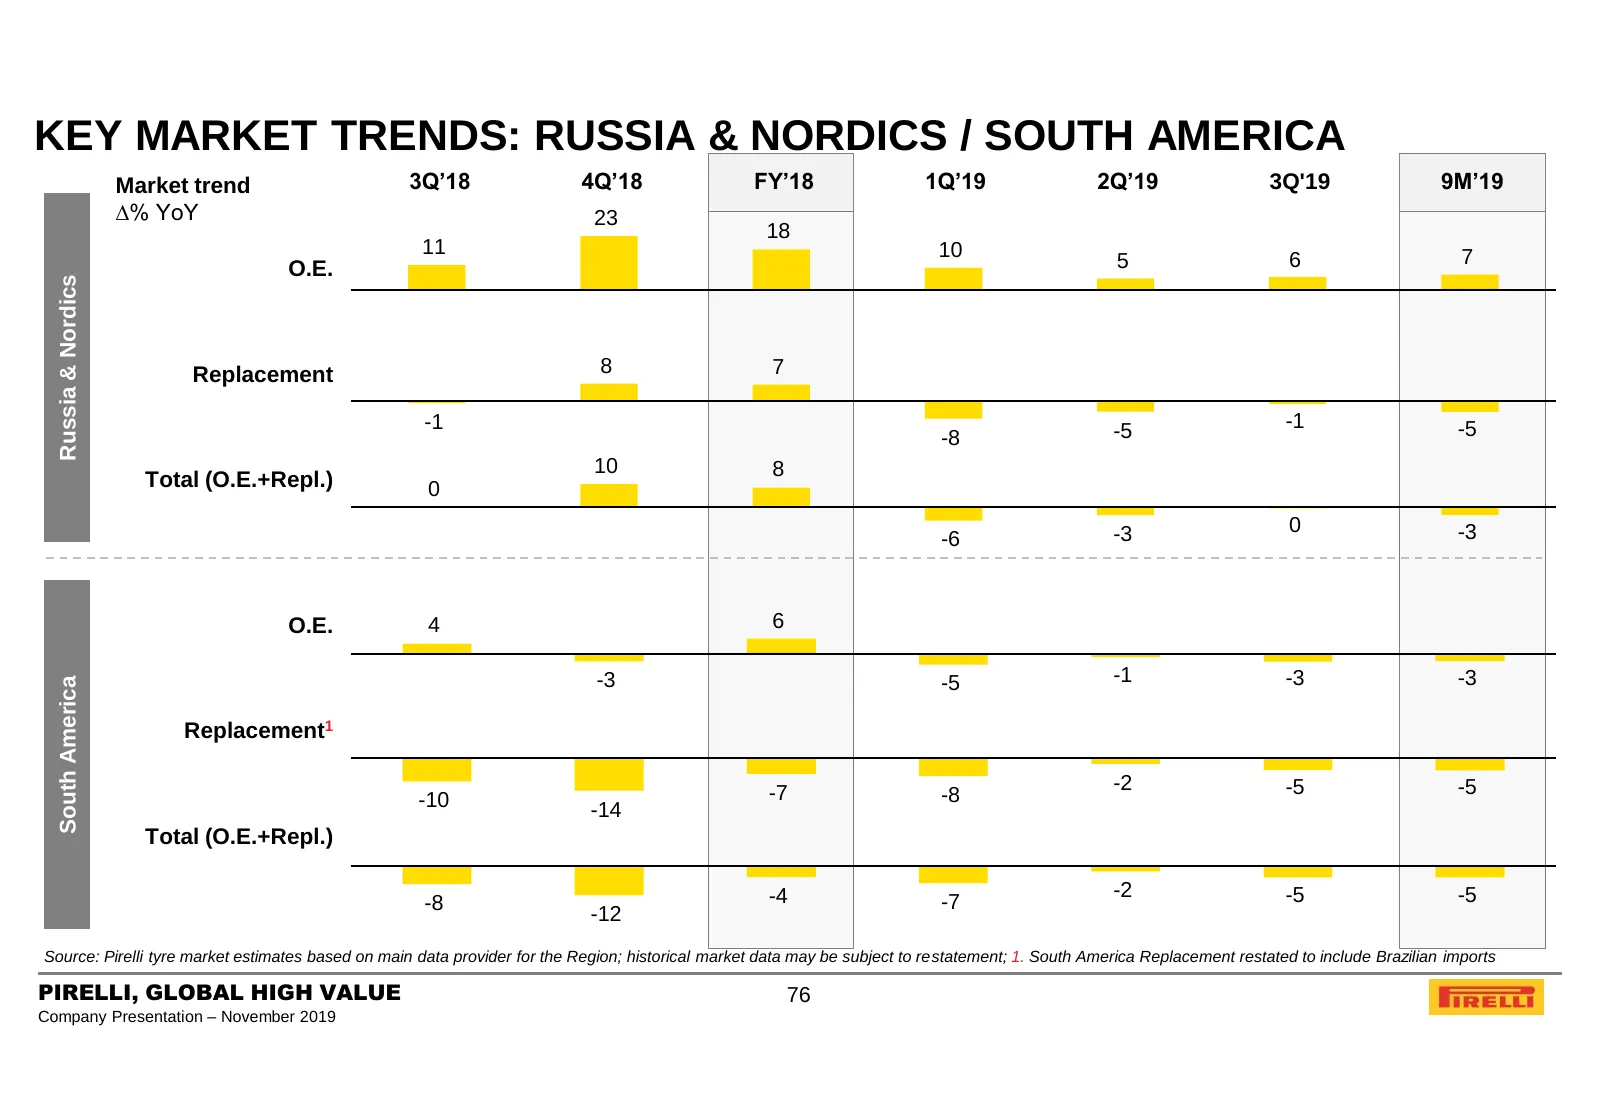
KEY MARKET TRENDS: RUSSIA & NORDICS / SOUTH AMERICA Market trend 3Q’18 4Q’18 FY’18 1Q’19 2Q’19 3Q'19 9M’19 ∆% YoY 23 18 11 10 7 O.E. 5 6 Russia & Nordics Replacement 8 7 -1 -5 -1 -5 -8 10 8 Total (O.E.+Repl.) 0 -3 0 -3 -6 O.E. 4 6 -3 -5 -1 -3 -3 South America Replacement1 -7 -2 -5 -5 -10 -8 -14 Tota
Slide 77: Raw Material Costs Trend and Mix
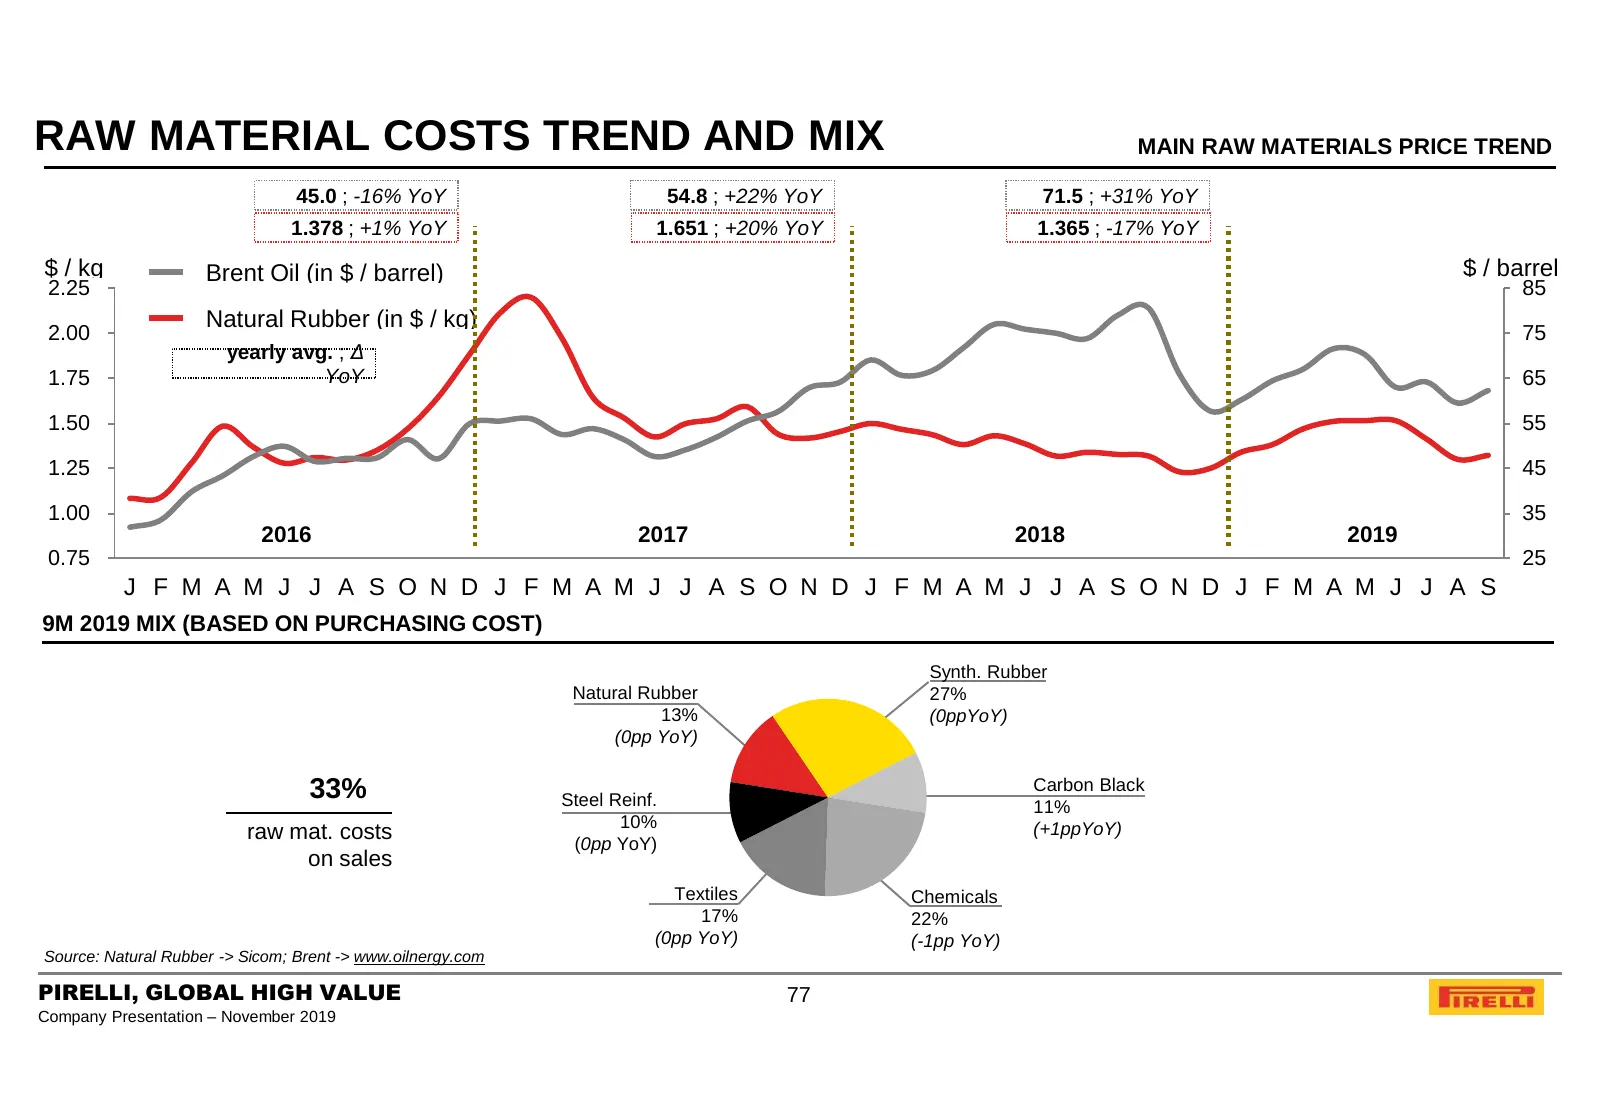
RAW MATERIAL COSTS TREND AND MIX MAIN RAW MATERIALS PRICE TREND 45.0 ; -16% YoY 54.8 ; +22% YoY 71.5 ; +31% YoY 1.378 ; +1% YoY 1.651 ; +20% YoY 1.365 ; -17% YoY $ / kg Brent Oil (in $ / barrel) $ / barrel 2.25 85 Natural Rubber (in $ / kg) 2.00 75 yearly avg. ; Δ 1.75 YoY 65 1.50 55 1.25 45 1.00 35
Slide 78: Manufacturing Footprint as of September 30th, 2019
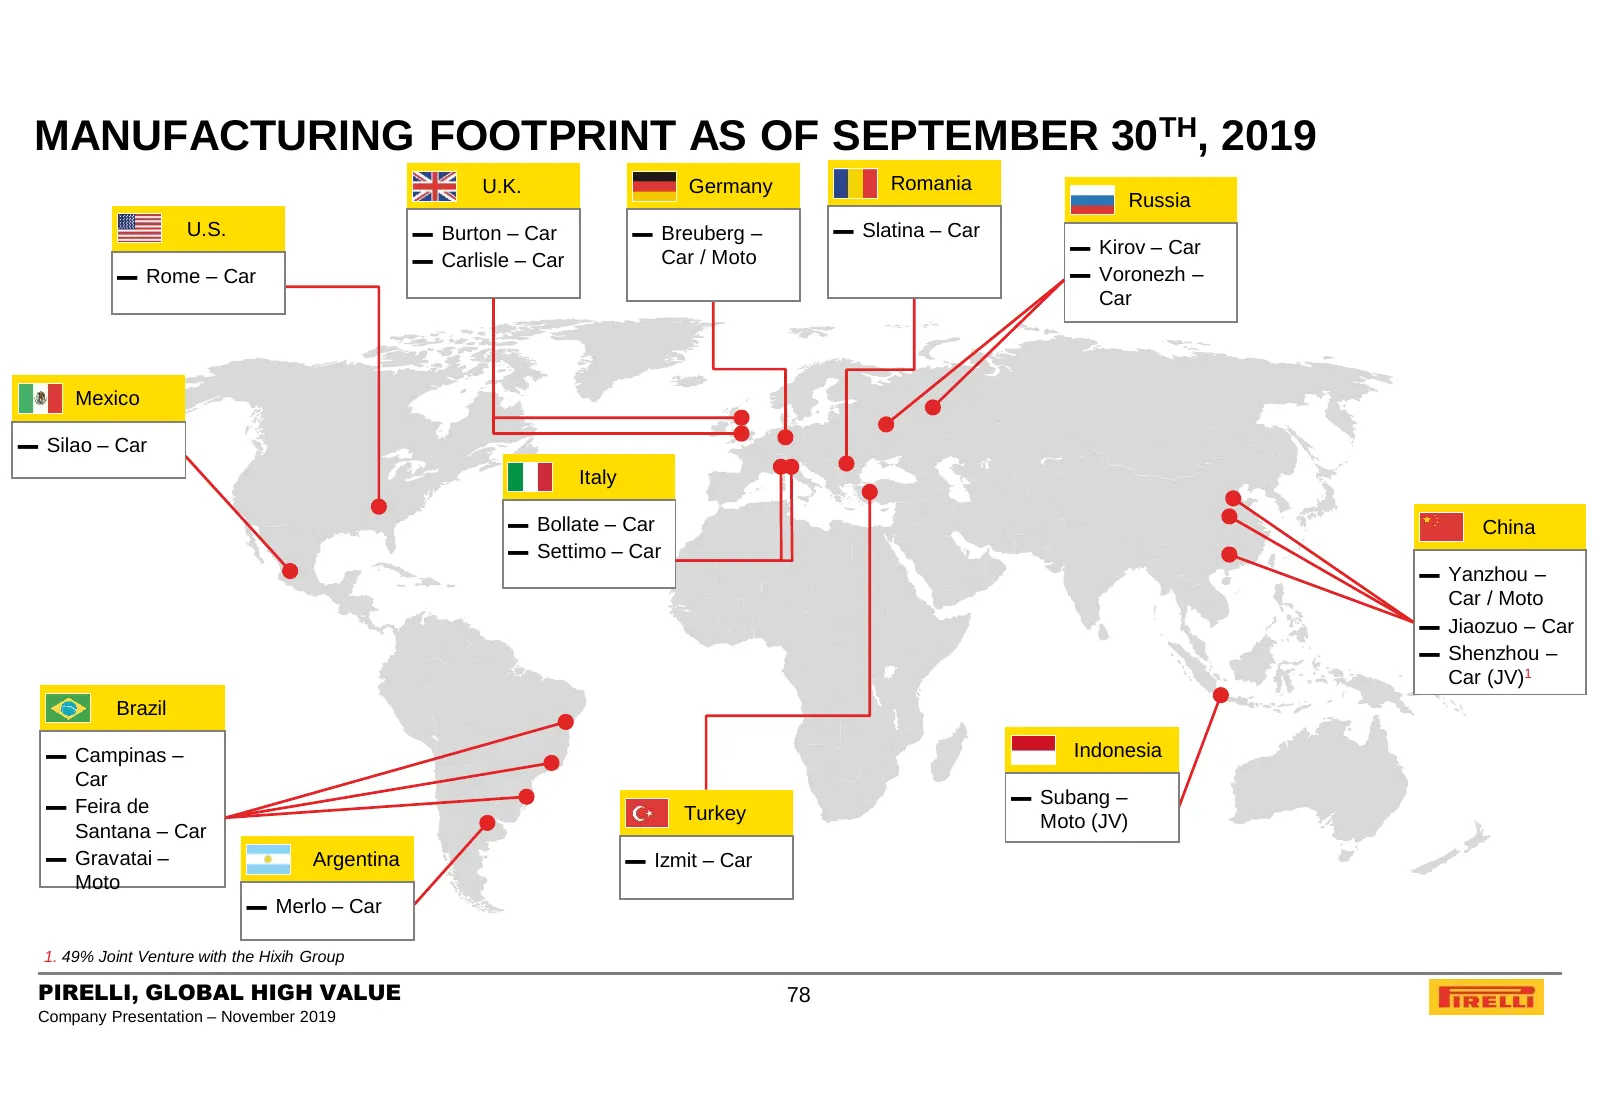
MANUFACTURING FOOTPRINT AS OF SEPTEMBER 30TH, 2019 U.K. Germany Romania Russia U.S. ▬ Burton – Car ▬ Breuberg – ▬ Slatina – Car ▬ Kirov – Car ▬ Carlisle – Car Car / Moto ▬ Rome – Car ▬ Voronezh – Car Mexico ▬ Silao – Car Italy ▬ Bollate – Car China ▬ Settimo – Car ▬ Yanzhou – Car / Moto ▬ Jiaozuo –
Slide 79: Agenda
AGENDA 1. PIRELLI AT A GLANCE 2. BUSINESS MODEL 3. KEY INVESTMENT HIGHLIGHTS 4. MARKET AND COMPETITION 5. 9M 2019 FINANCIAL RESULTS AND 2019 OUTLOOK 6. FY 2018 FINANCIAL RESULTS AND 2019 OUTLOOK 7. GOVERNANCE 8. SUSTAINABILITY 9. APPENDIX PIRELLI, GLOBAL HIGH VALUE 79 Company Presentation – November
Slide 80: Where We Are
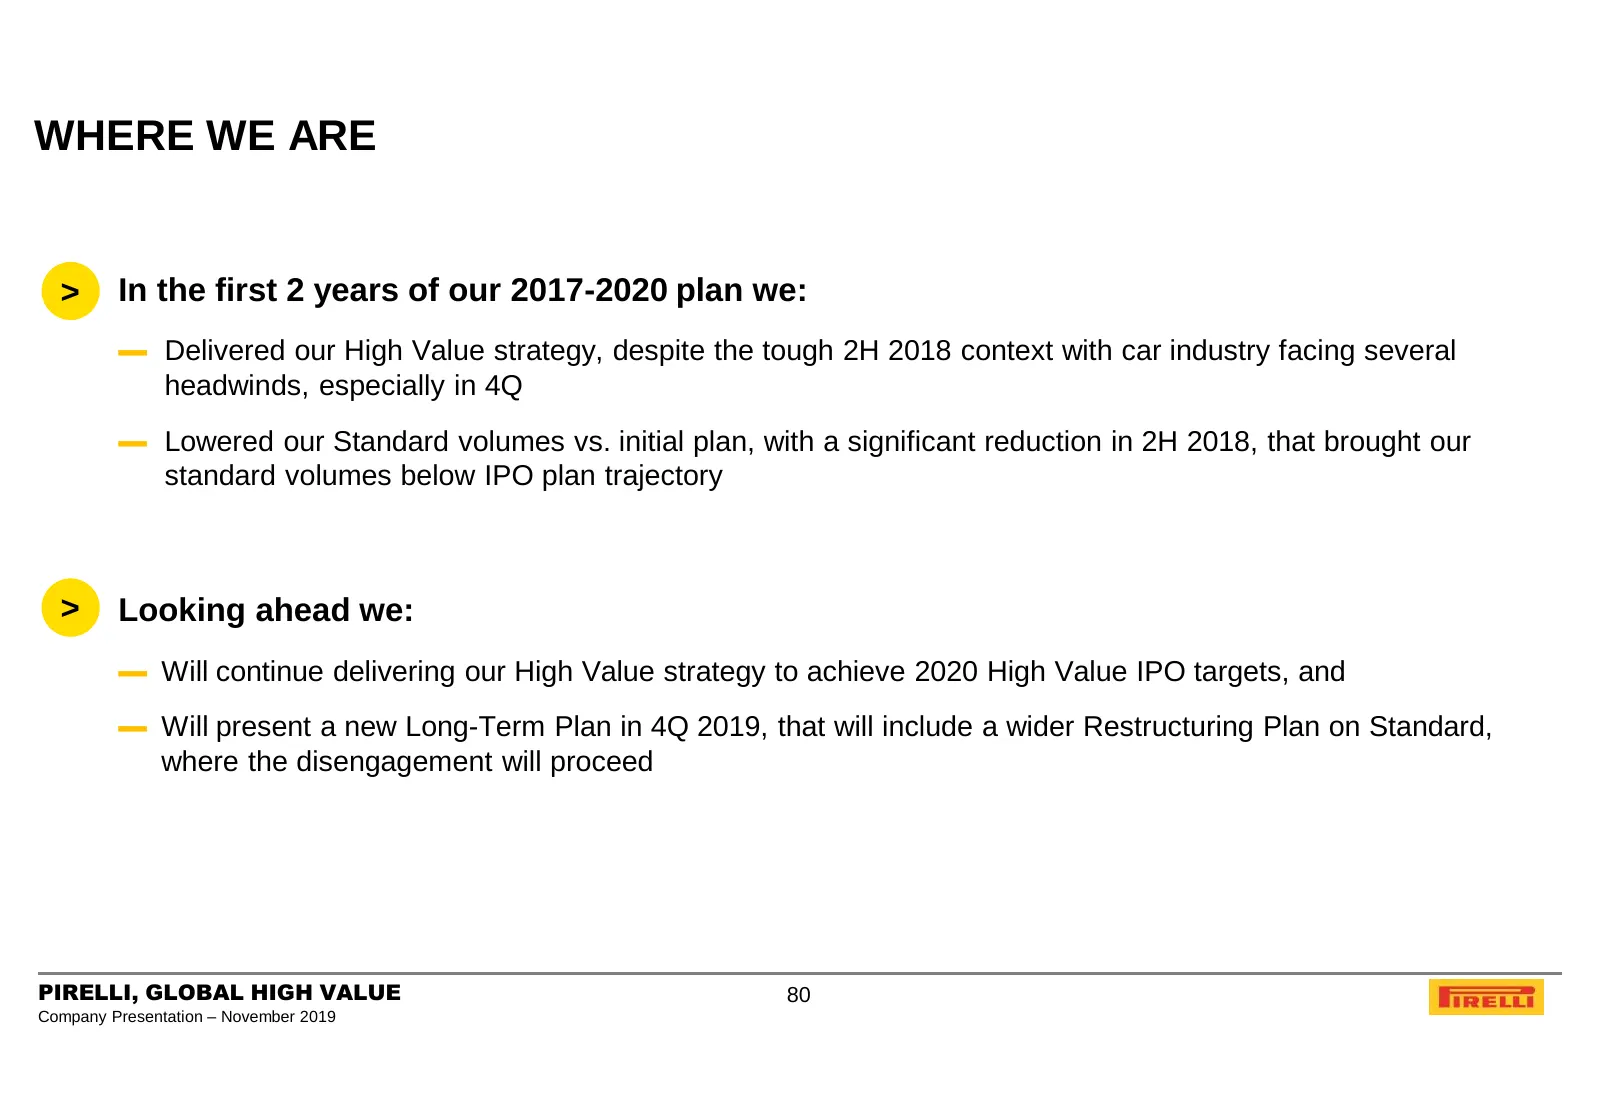
WHERE WE ARE > In the first 2 years of our 2017-2020 plan we: ▬ Delivered our High Value strategy, despite the tough 2H 2018 context with car industry facing several headwinds, especially in 4Q ▬ Lowered our Standard volumes vs. initial plan, with a significant reduction in 2H 2018, that brought our
Slide 81: Agenda
AGENDA 1. PIRELLI AT A GLANCE 2. BUSINESS MODEL 3. KEY INVESTMENT HIGHLIGHTS 4. MARKET AND COMPETITION 5. 9M 2019 FINANCIAL RESULTS AND 2019 OUTLOOK 6. FY 2018 FINANCIAL RESULTS AND 2019 OUTLOOK 6.a. 2018 DELIVERY AND 2019 OUTLOOK 6.b. REVIEW OF 2018 RESULTS 6.c. APPENDIX 7. GOVERNANCE 8. SUSTAINABI
Slide 82: 2018 Results
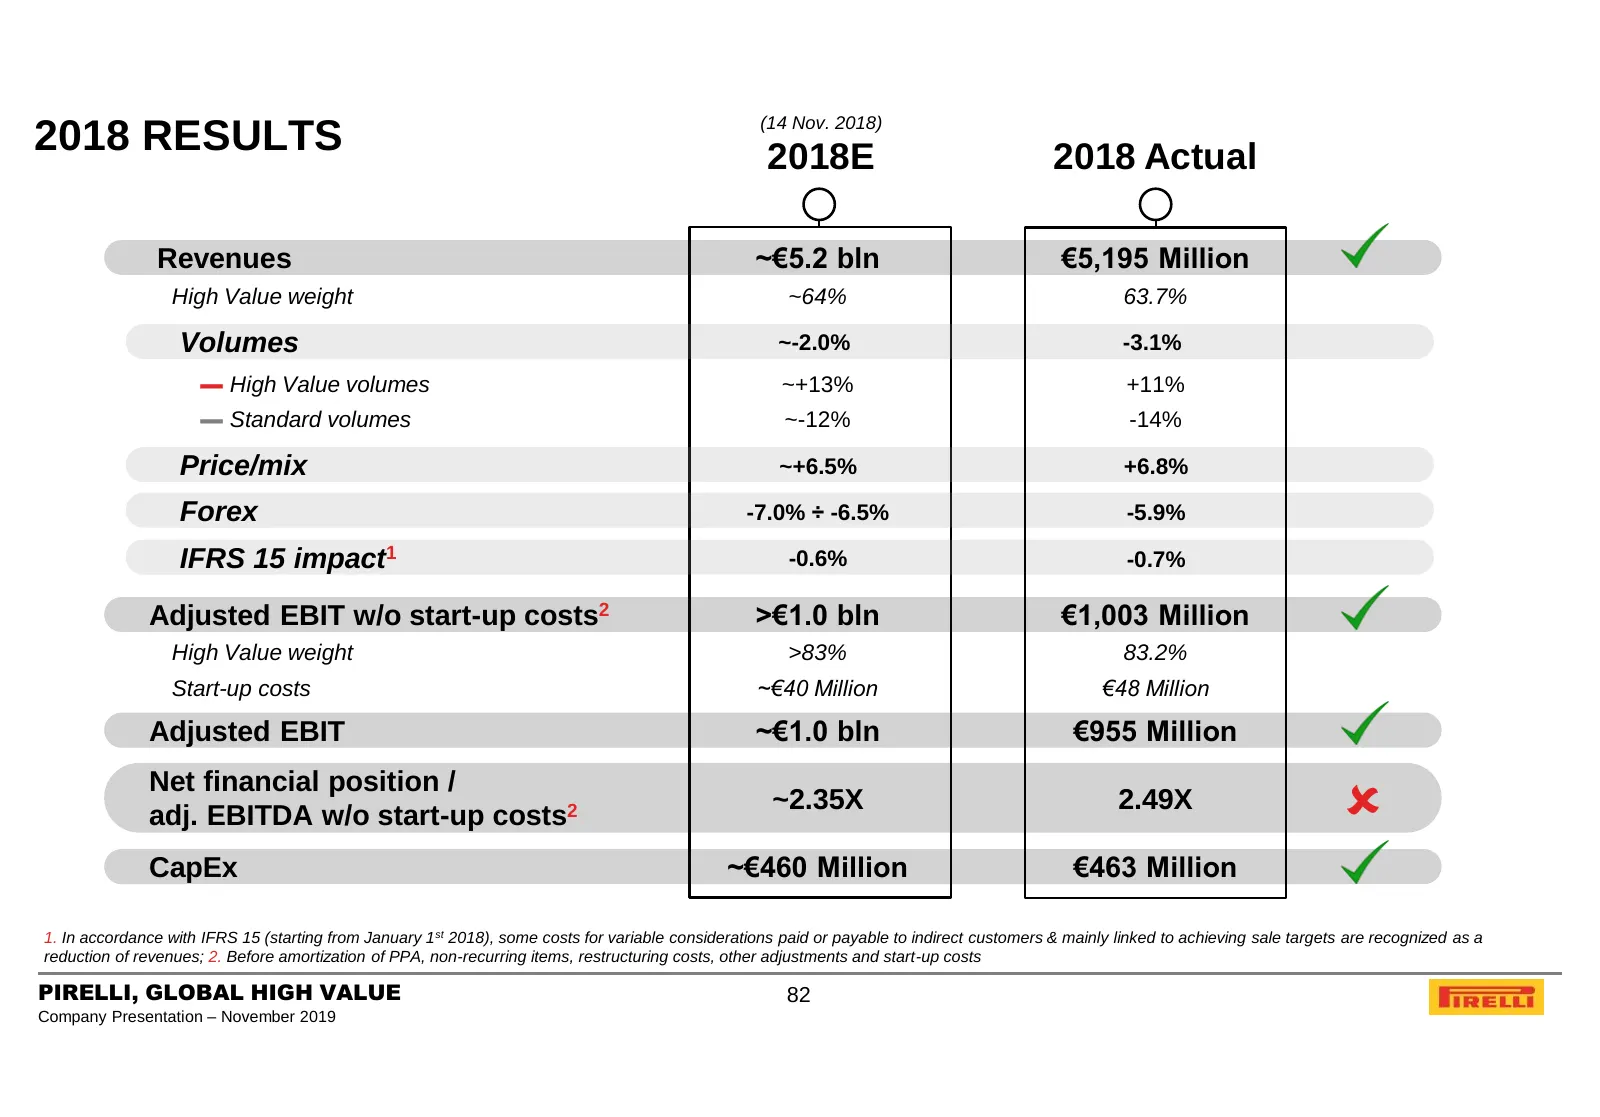
(14 Nov. 2018) 2018 RESULTS 2018E 2018 Actual Revenues ~€5.2 bln €5,195 Million High Value weight ~64% 63.7% Volumes ~-2.0% -3.1% ▬ High Value volumes ~+13% +11% ▬ Standard volumes ~-12% -14% Price/mix ~+6.5% +6.8% Forex -7.0% ÷ -6.5% -5.9% IFRS 15 impact1 -0.6% -0.7% Adjusted EBIT w/o start-up cost
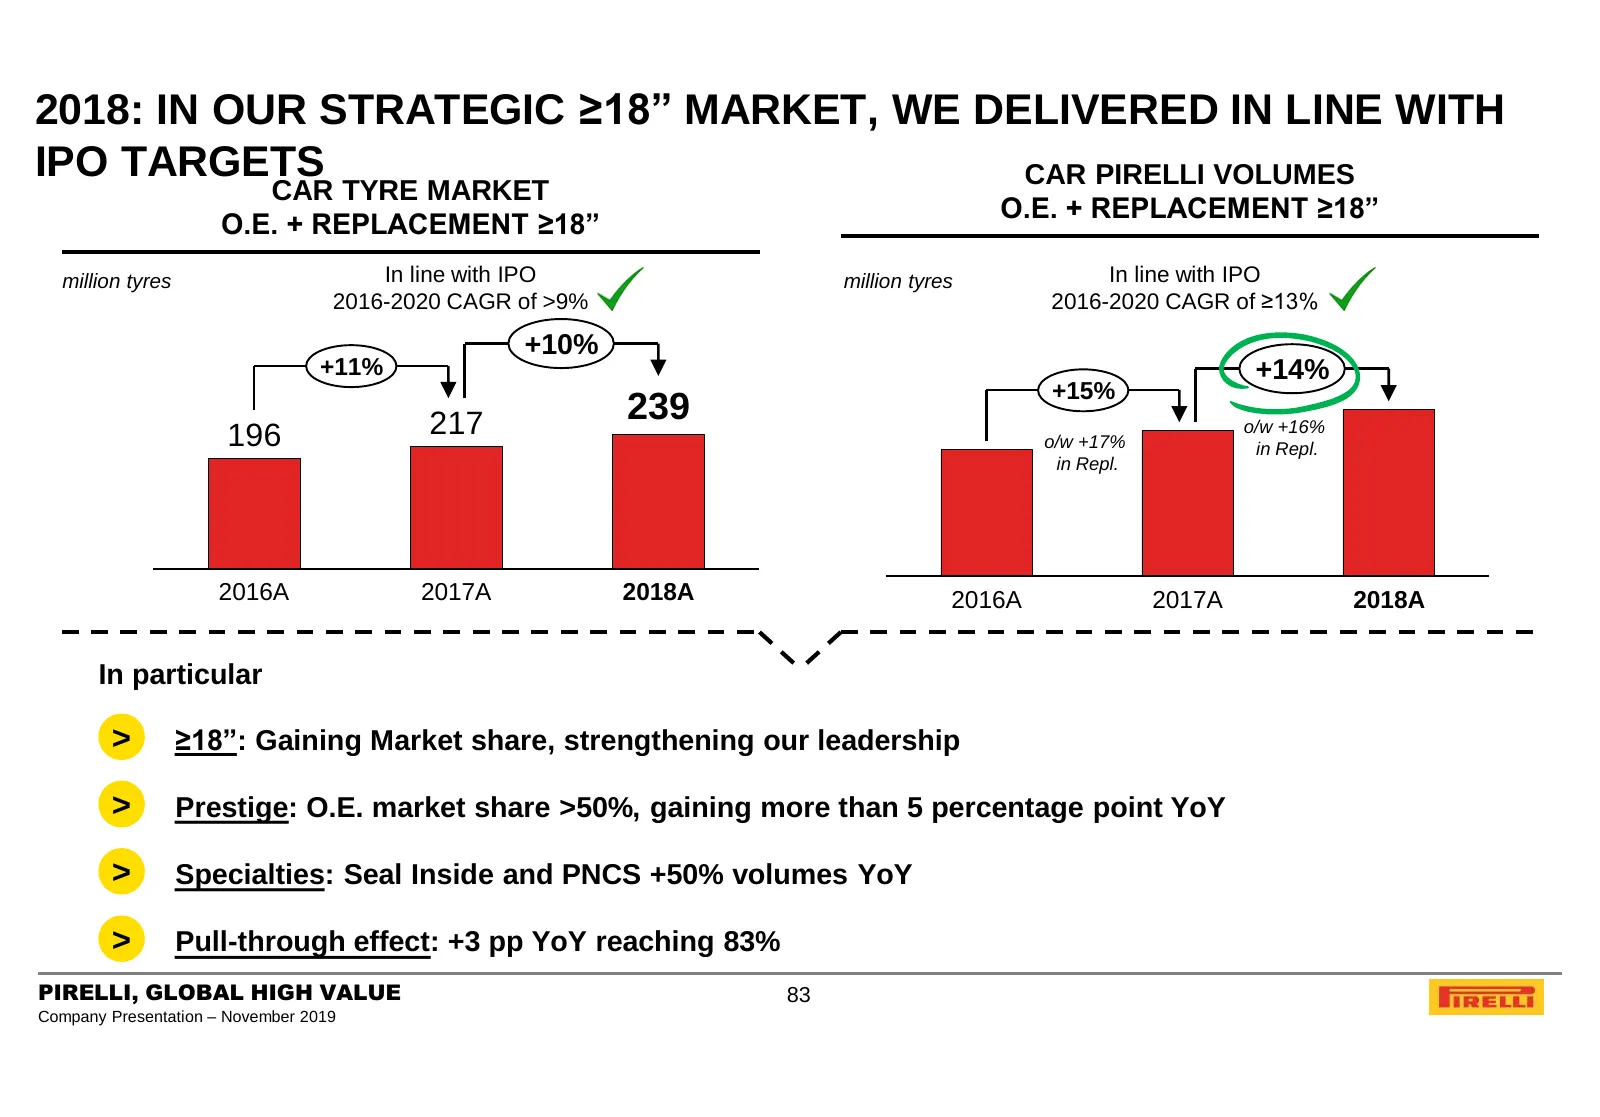
Slide 83: 2018: ≥18” Market Delivered in Line with IPO Targets
2018: IN OUR STRATEGIC ≥18” MARKET, WE DELIVERED IN LINE WITH IPO TARGETS CAR PIRELLI VOLUMES CAR TYRE MARKET O.E. + REPLACEMENT ≥18” O.E. + REPLACEMENT ≥18” million tyres In line with IPO million tyres In line with IPO 2016-2020 CAGR of >9% 2016-2020 CAGR of ≥13% +10% +11% +14% +15% 217 239 o/w +16
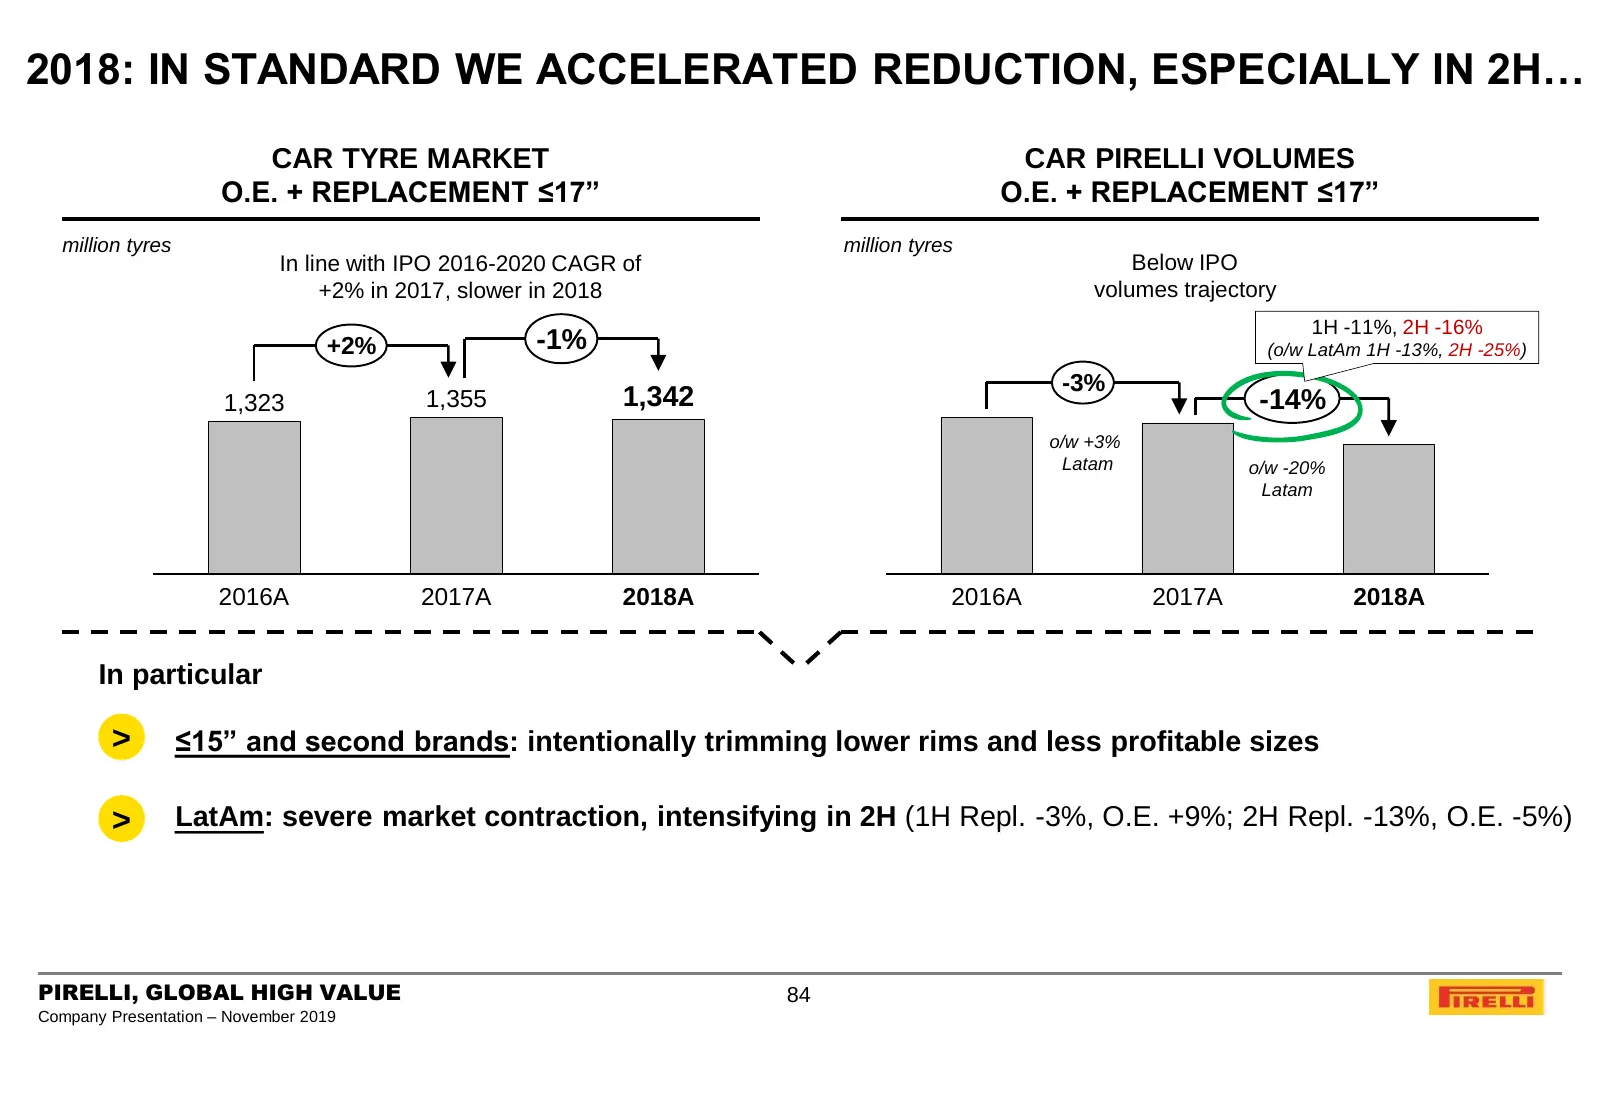
Slide 84: 2018: Standard Reduction Accelerated
2018: IN STANDARD WE ACCELERATED REDUCTION, ESPECIALLY IN 2H… CAR TYRE MARKET CAR PIRELLI VOLUMES O.E. + REPLACEMENT ≤17” O.E. + REPLACEMENT ≤17” million tyres million tyres In line with IPO 2016-2020 CAGR of Below IPO +2% in 2017, slower in 2018 volumes trajectory 1H -11%, 2H -16% +2% -1% (o/w LatA
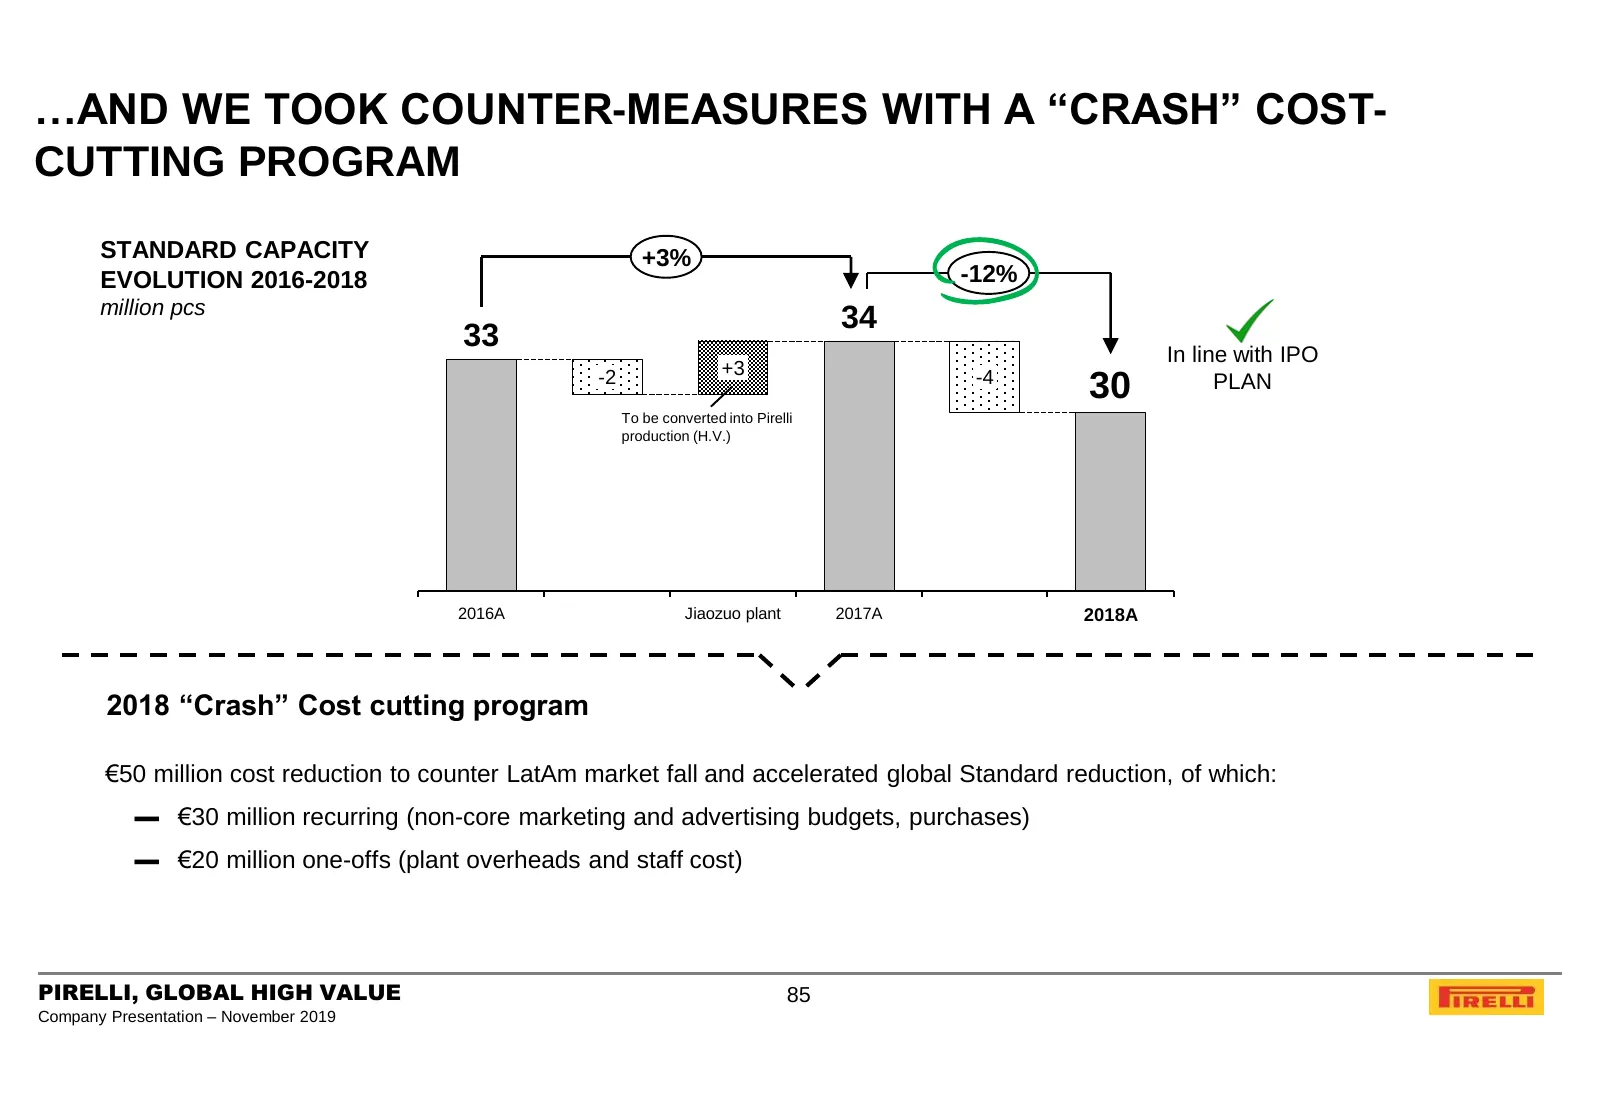
Slide 85: Counter-Measures with Crash Cost-Cutting Program
…AND WE TOOK COUNTER-MEASURES WITH A “CRASH” COST- CUTTING PROGRAM STANDARD CAPACITY +3% EVOLUTION 2016-2018 -12% million pcs 34 33 In line with IPO -2 +3 -4 30 PLAN To be converted into Pirelli production (H.V.) 2016A Jiaozuo plant 2017A 2018A 2018 “Crash” Cost cutting program €50 million cost redu
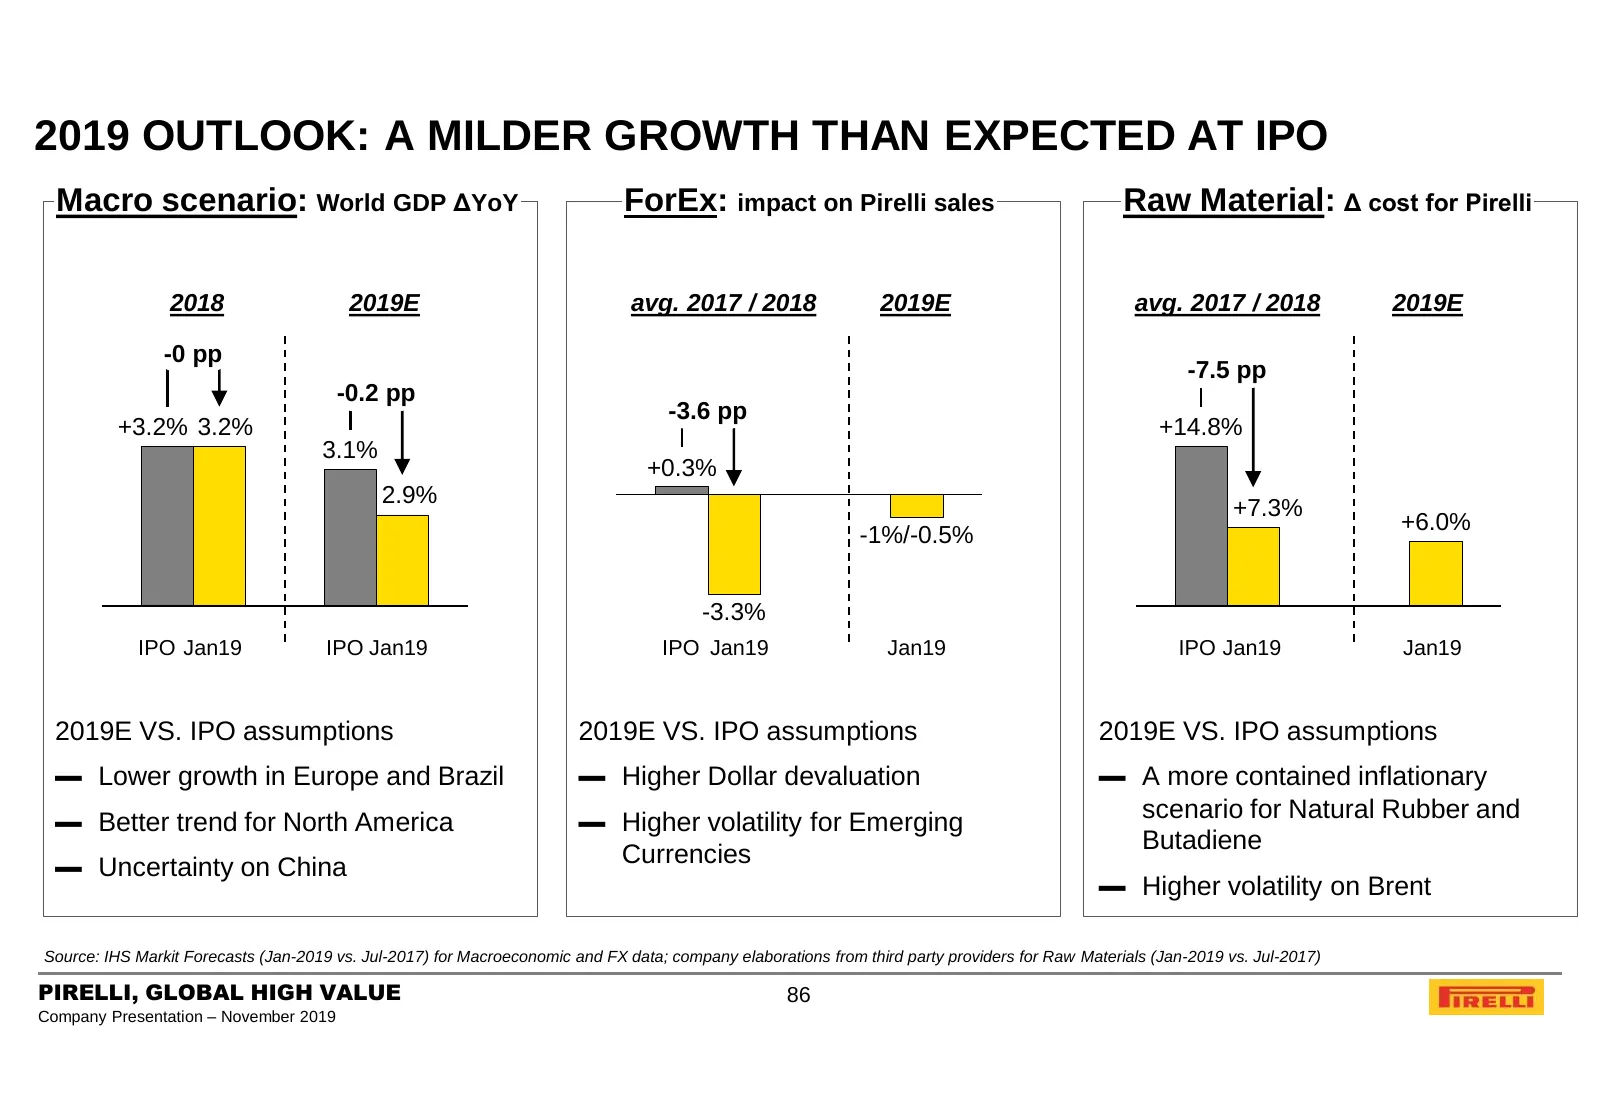
Slide 86: 2019 Outlook: Milder Growth Than Expected at IPO
2019 OUTLOOK: A MILDER GROWTH THAN EXPECTED AT IPO Macro scenario: World GDP ΔYoY ForEx: impact on Pirelli sales Raw Material: Δ cost for Pirelli 2018 2019E avg. 2017 / 2018 2019E avg. 2017 / 2018 2019E -0 pp -7.5 pp -0.2 pp -3.6 pp +3.2% 3.2% +14.8% 3.1% +0.3% 2.9% +7.3% +6.0% -1%/-0.5% -3.3% IPO J
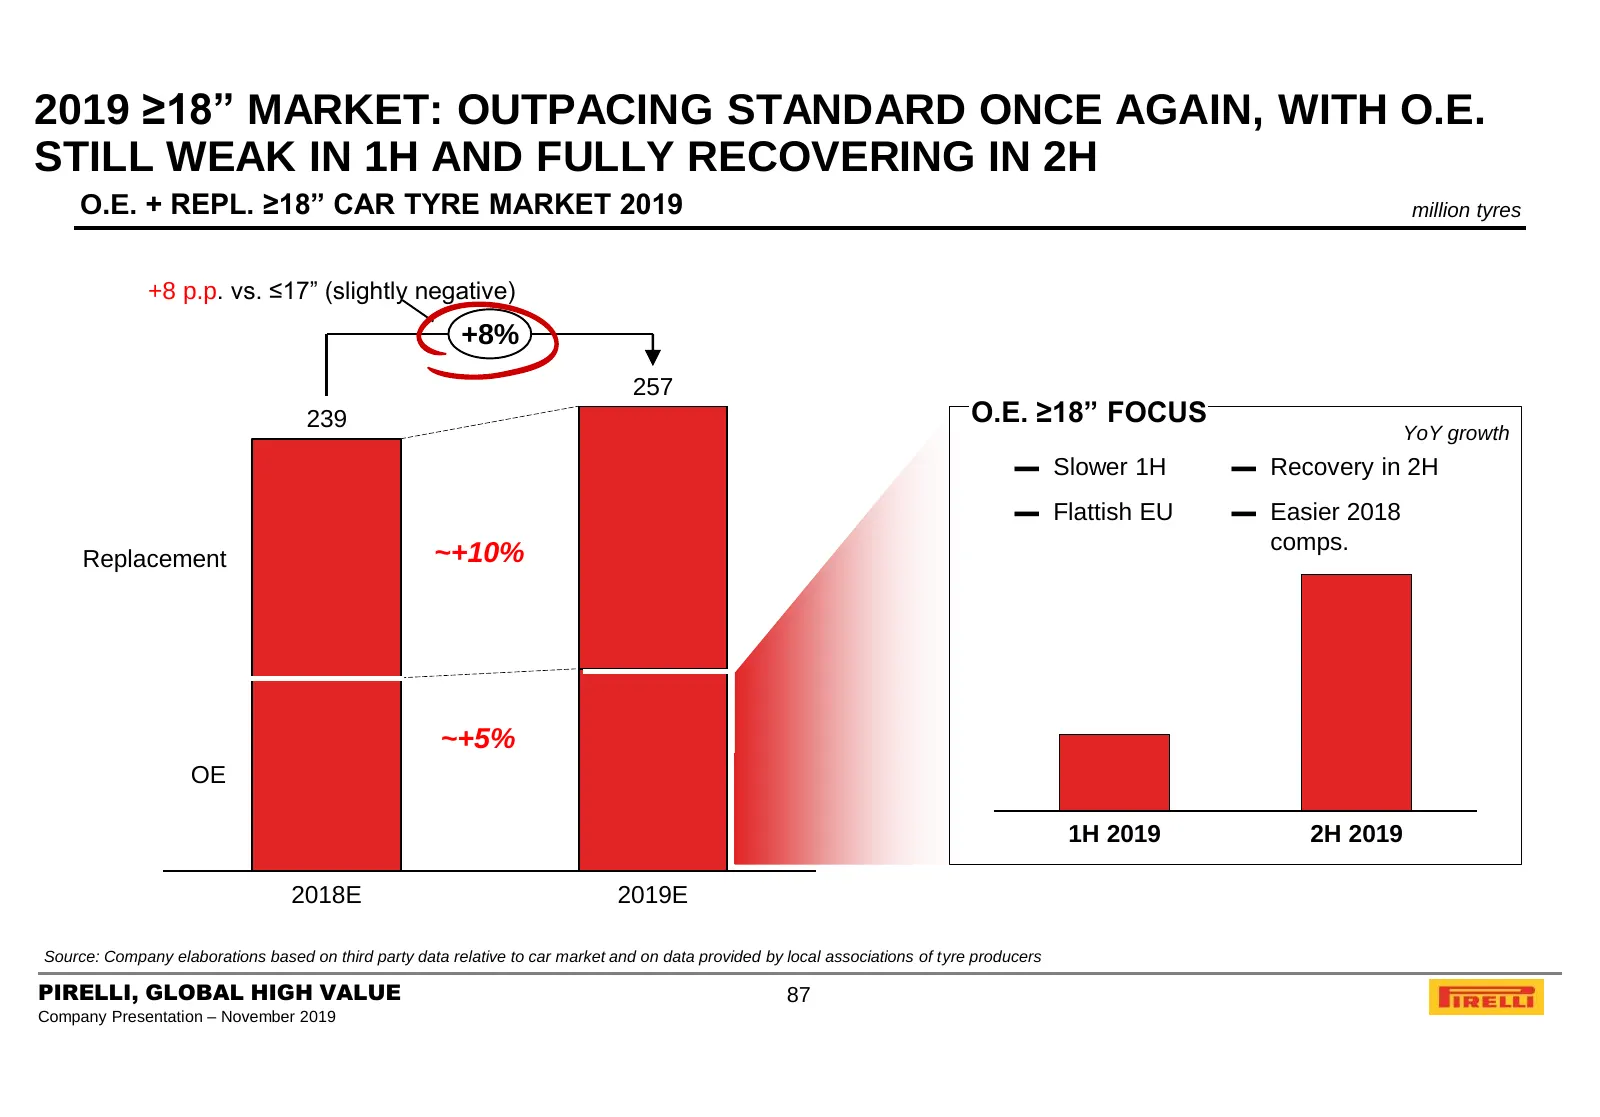
Slide 87: 2019 ≥18” Market Outpacing Standard
2019 ≥18” MARKET: OUTPACING STANDARD ONCE AGAIN, WITH O.E. STILL WEAK IN 1H AND FULLY RECOVERING IN 2H O.E. + REPL. ≥18” CAR TYRE MARKET 2019 million tyres +8 p.p. vs. ≤17” (slightly negative) +8% 257 239 O.E. ≥18” FOCUS YoY growth ▬ Slower 1H ▬ Recovery in 2H ▬ Flattish EU ▬ Easier 2018 ~+10% comps
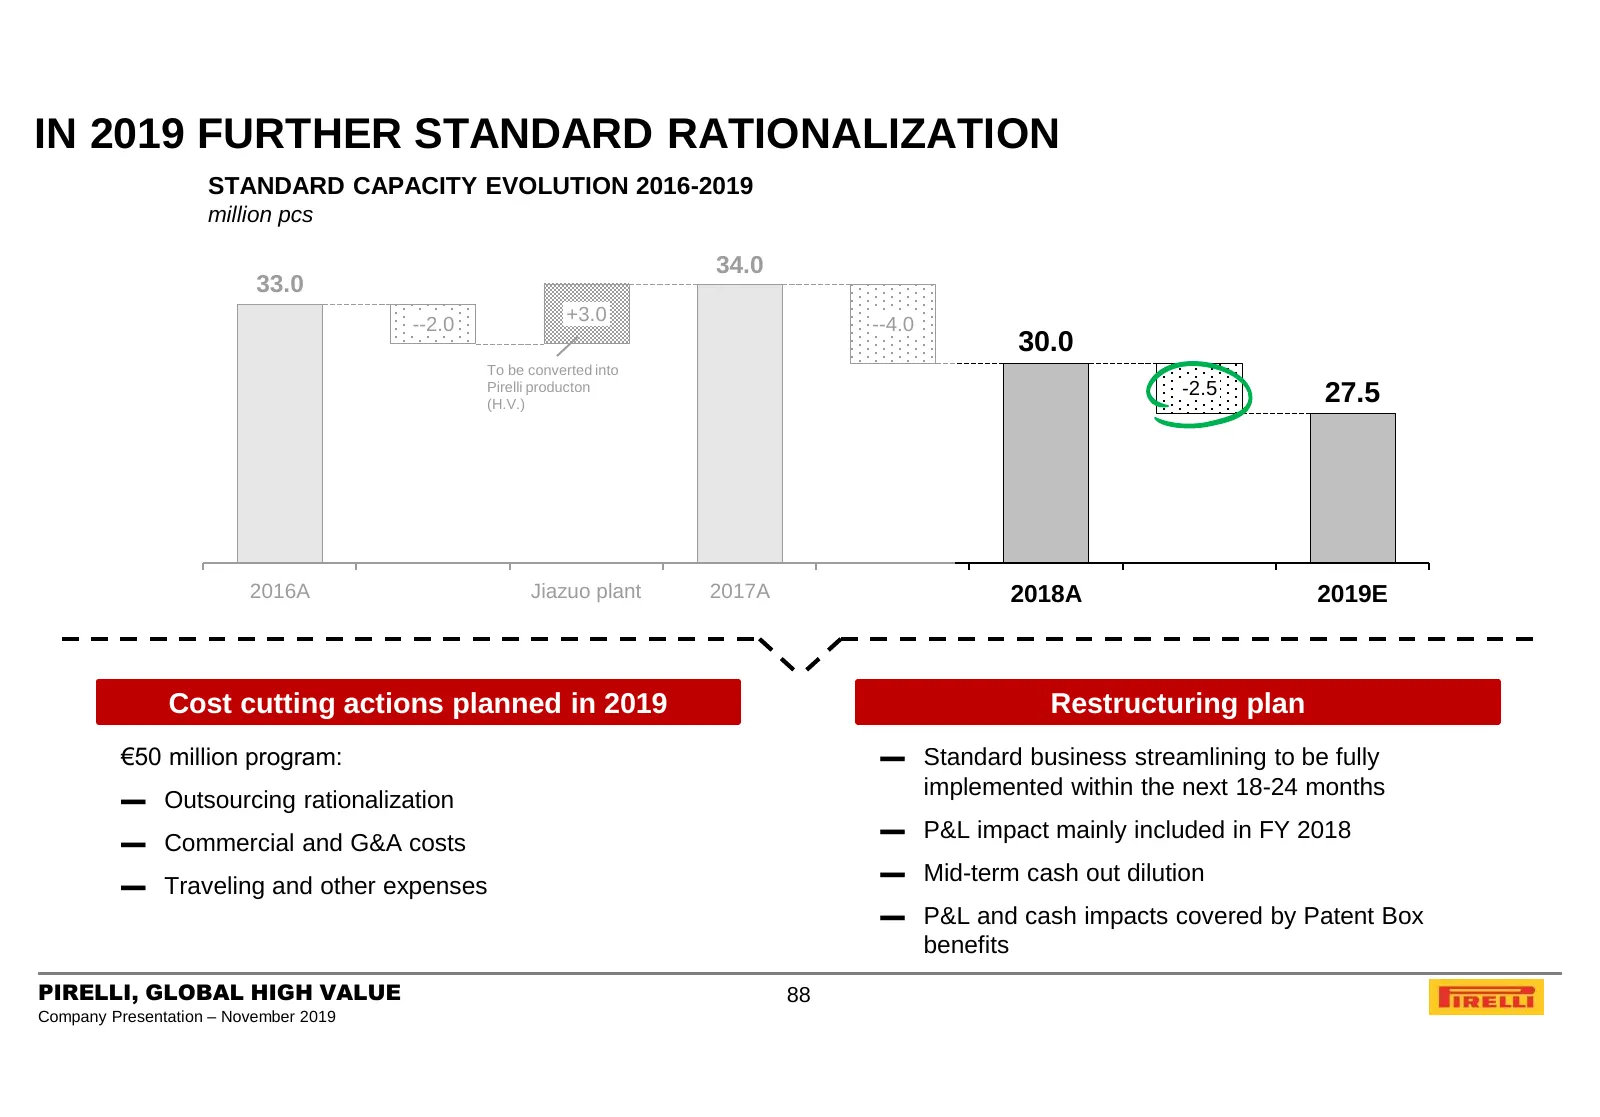
Slide 88: In 2019 Further Standard Rationalization
IN 2019 FURTHER STANDARD RATIONALIZATION STANDARD CAPACITY EVOLUTION 2016-2019 million pcs 34.0 33.0 --2.0 +3.0 --4.0 30.0 To be converted into Pirelli producton -2.5 27.5 (H.V.) 2016A Jiazuo plant 2017A 2018A 2019E Cost cutting actions planned in 2019 Restructuring plan €50 million program: ▬ Stand
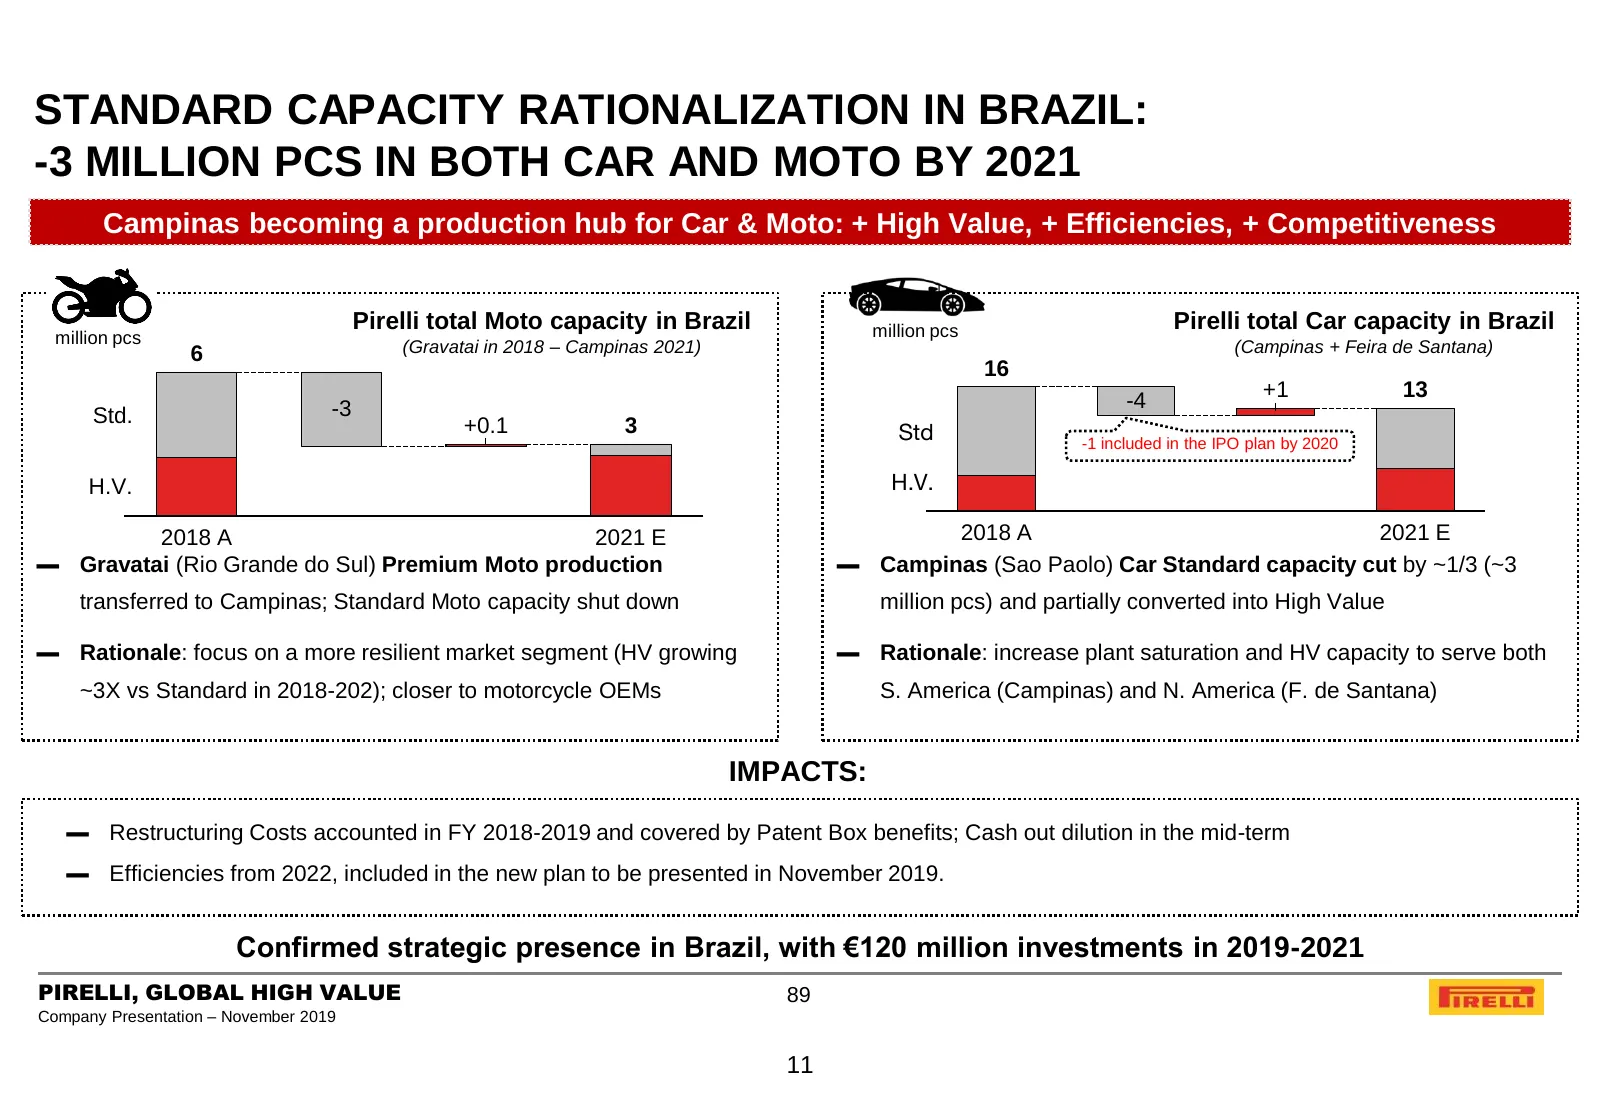
Slide 89: Standard Capacity Rationalization in Brazil
STANDARD CAPACITY RATIONALIZATION IN BRAZIL: -3 MILLION PCS IN BOTH CAR AND MOTO BY 2021 Campinas becoming a production hub for Car & Moto: + High Value, + Efficiencies, + Competitiveness Pirelli total Moto capacity in Brazil million pcs Pirelli total Car capacity in Brazil million pcs (Gravatai in
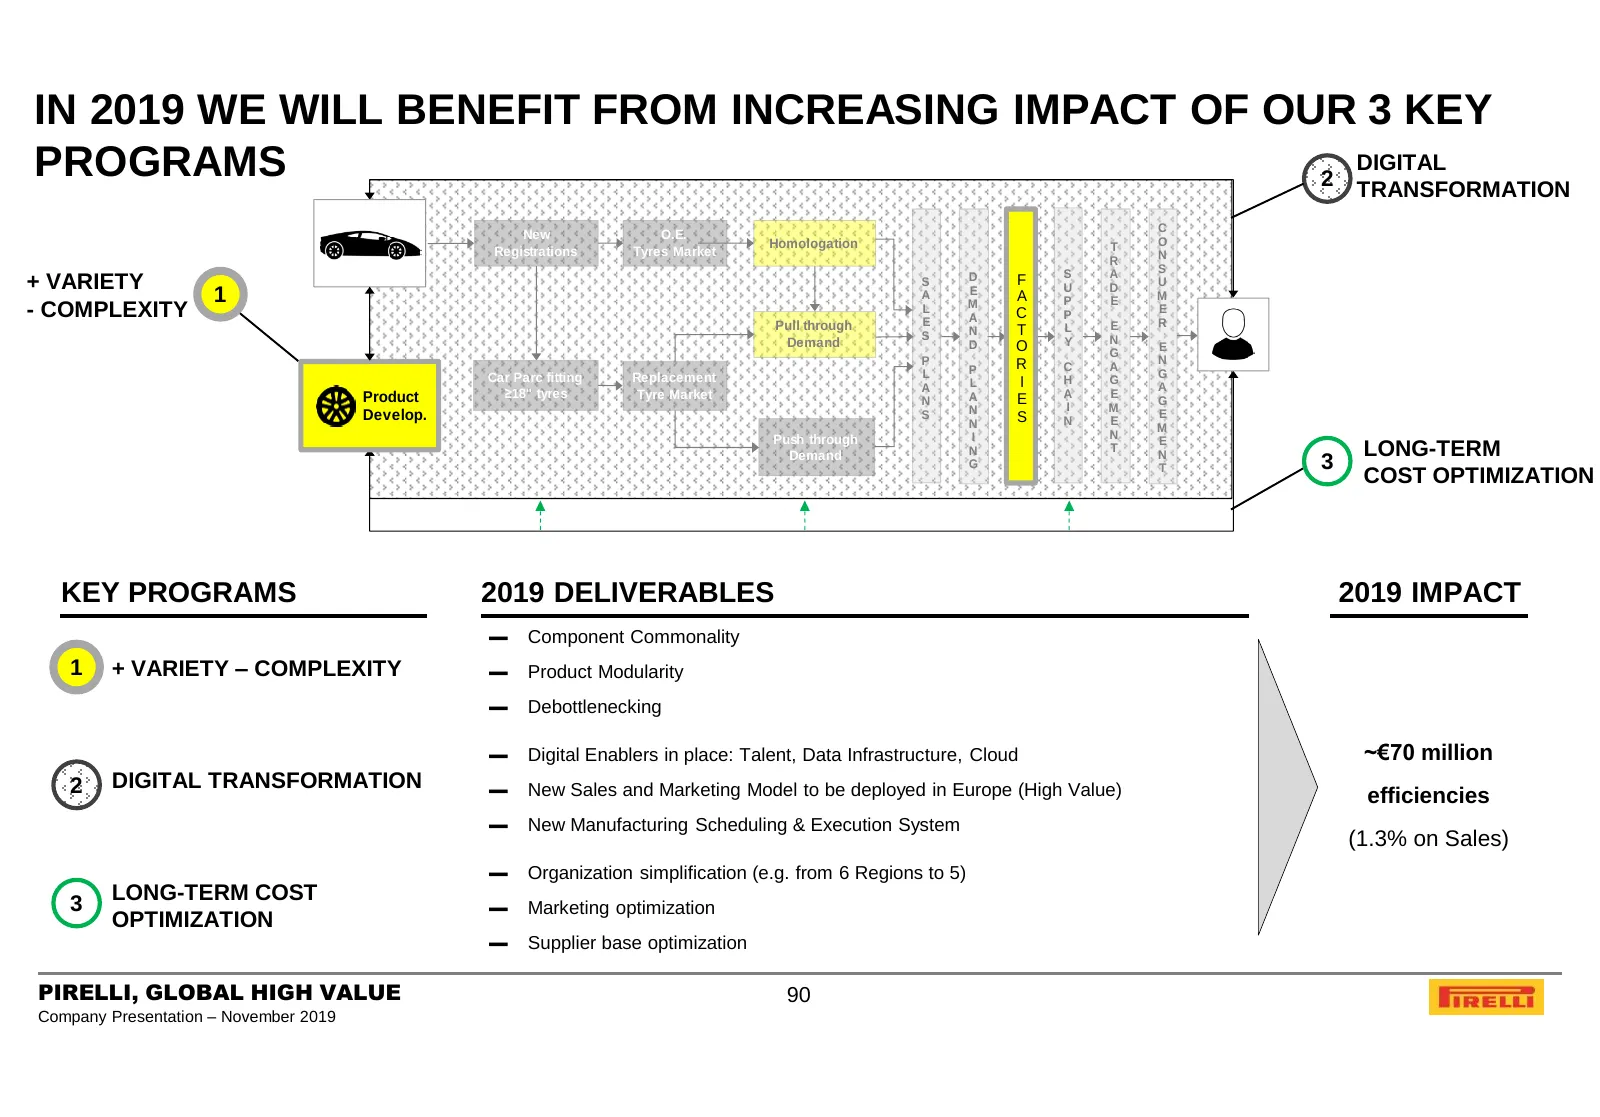
Slide 90: 2019 Impact of 3 Key Programs
IN 2019 WE WILL BENEFIT FROM INCREASING IMPACT OF OUR 3 KEY PROGRAMS DIGITAL 2 TRANSFORMATION C New O.E. O Homologation T Registrations Tyres Market N R S A S D + VARIETY S E F U D U 1 A M A P E M - COMPLEXITY L E A C P E R Pull through N T L E S Y N Demand D O E G P R N P C A Car Parc fitting Repla
Slide 91: FY 2019 Outlook
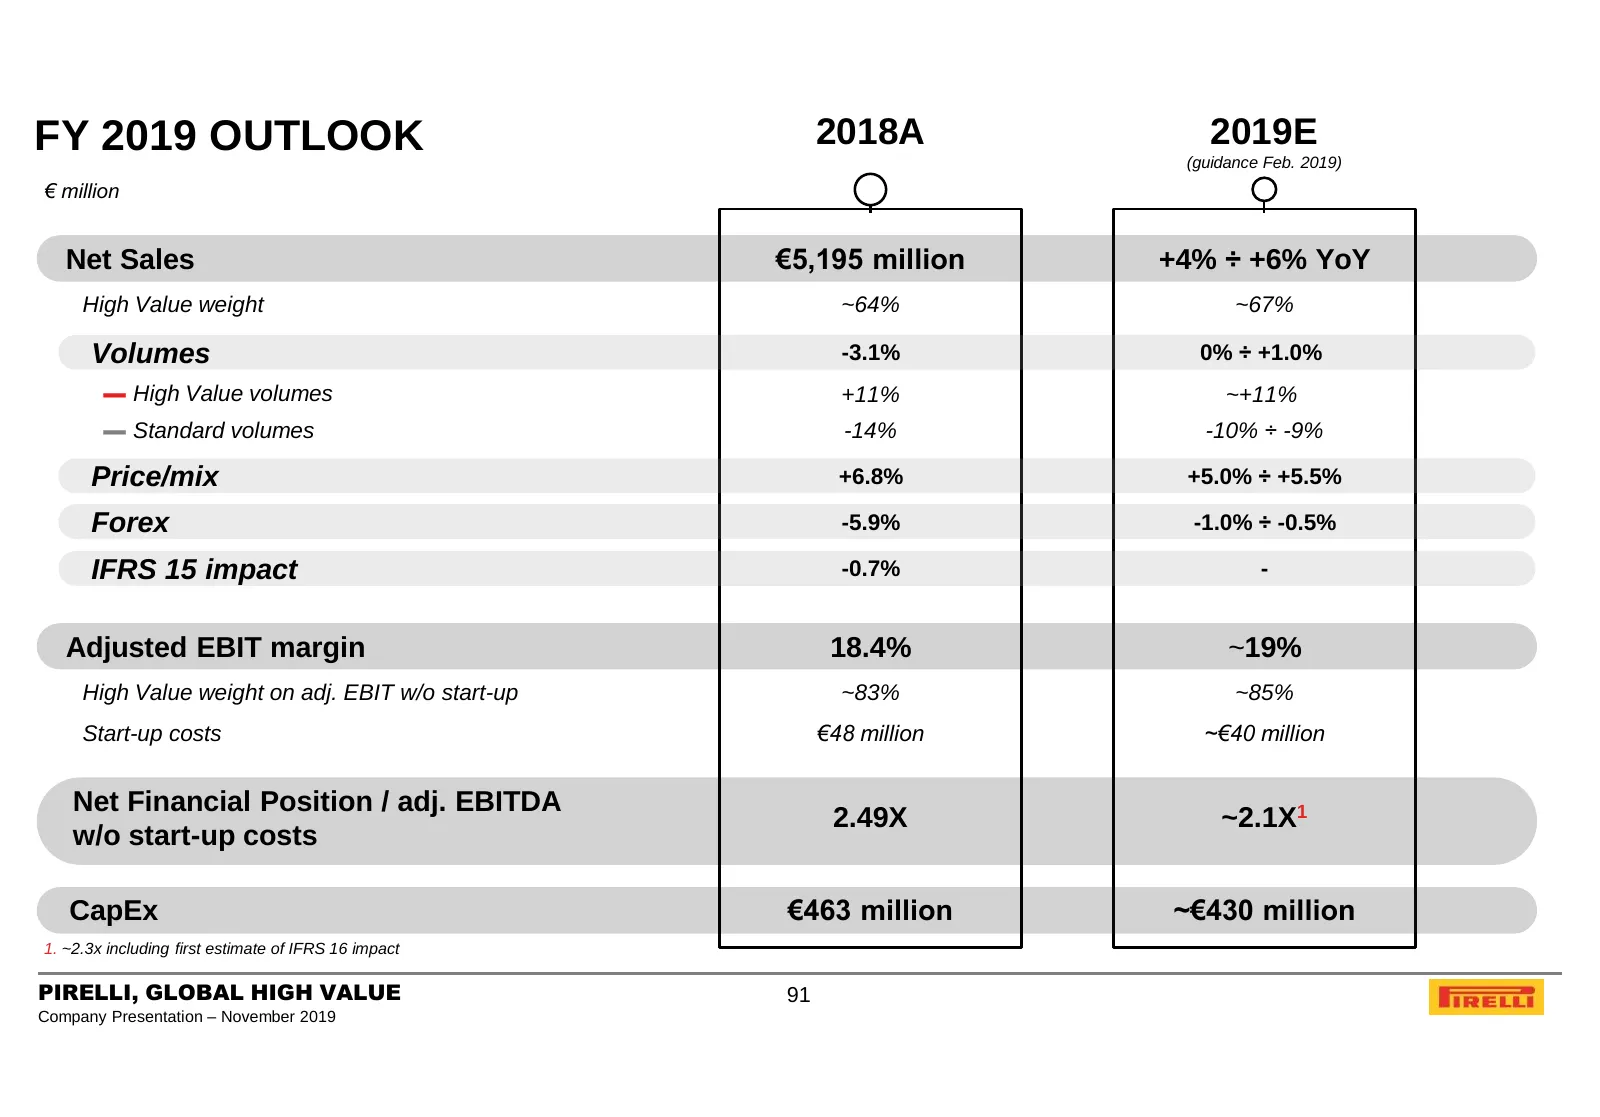
FY 2019 OUTLOOK 2018A 2019E (guidance Feb. 2019) € million Net Sales €5,195 million +4% ÷ +6% YoY High Value weight ~64% ~67% Volumes -3.1% 0% ÷ +1.0% ▬ High Value volumes +11% ~+11% ▬ Standard volumes -14% -10% ÷ -9% Price/mix +6.8% +5.0% ÷ +5.5% Forex -5.9% -1.0% ÷ -0.5% IFRS 15 impact -0.7% - Adj
Slide 92: 2019: New Scenario and New Long Term Plan
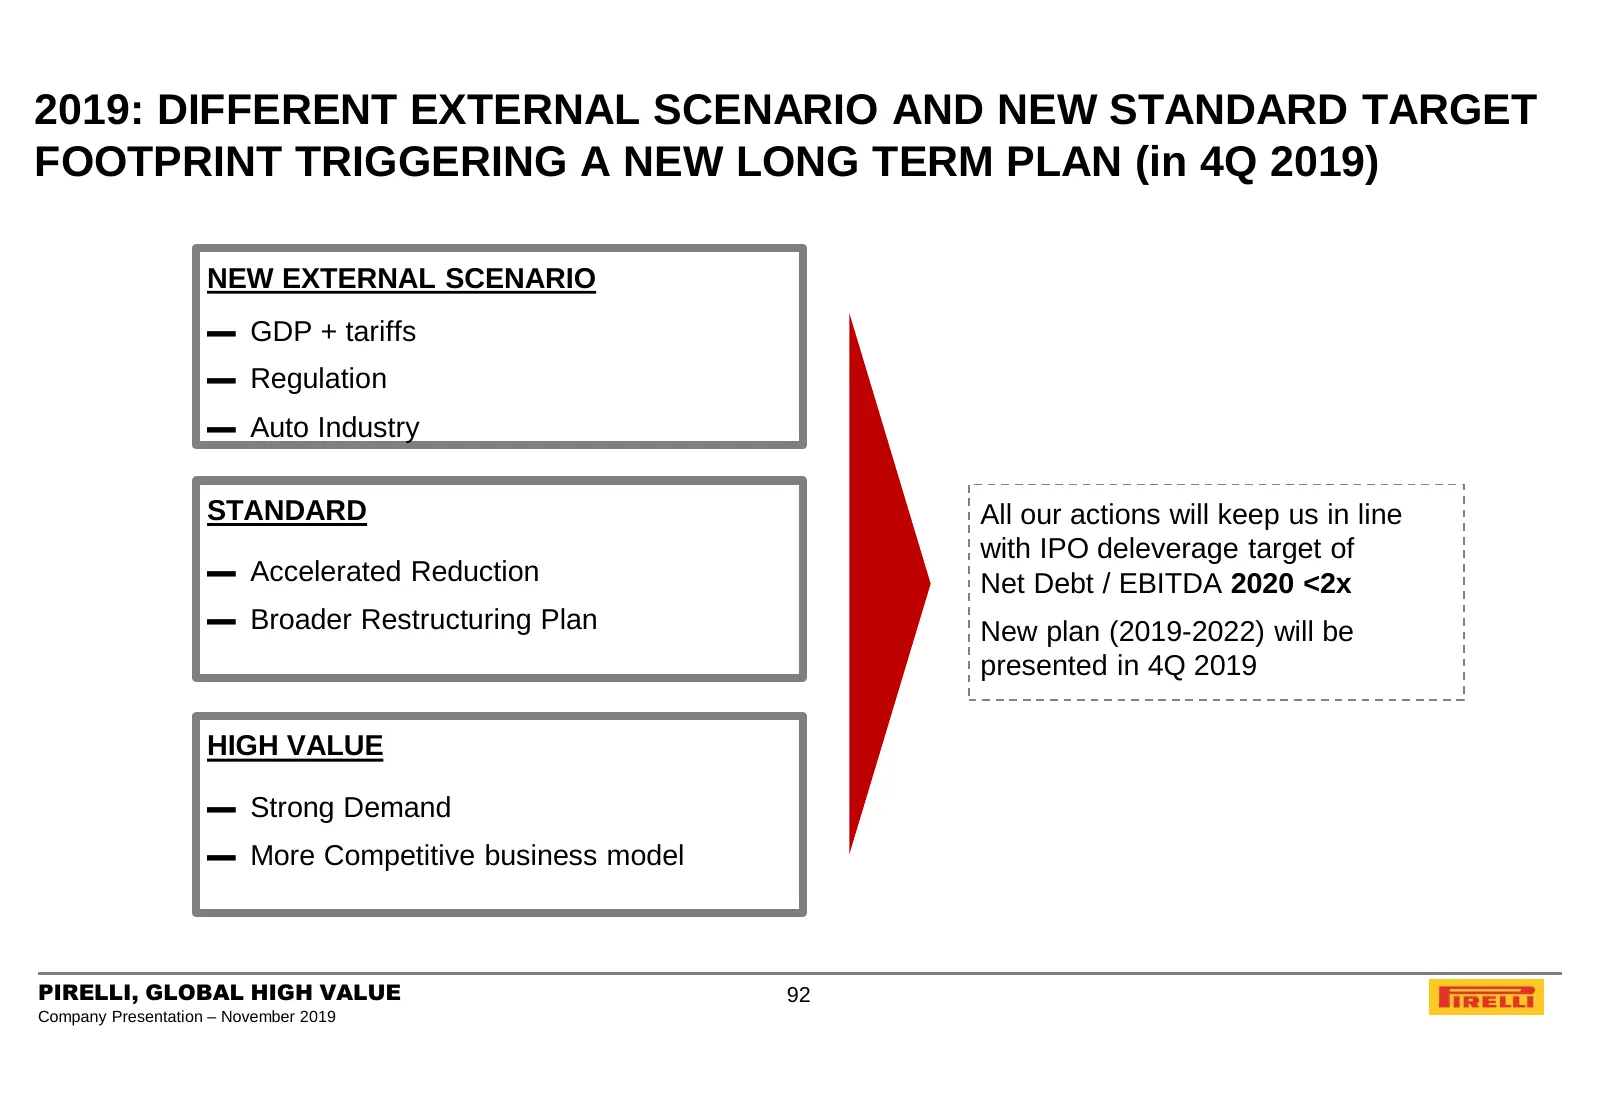
2019: DIFFERENT EXTERNAL SCENARIO AND NEW STANDARD TARGET FOOTPRINT TRIGGERING A NEW LONG TERM PLAN (in 4Q 2019) NEW EXTERNAL SCENARIO ▬ GDP + tariffs ▬ Regulation ▬ Auto Industry STANDARD All our actions will keep us in line with IPO deleverage target of ▬ Accelerated Reduction Net Debt / EBITDA 20
Slide 93: Agenda
AGENDA 1. PIRELLI AT A GLANCE 2. BUSINESS MODEL 3. KEY INVESTMENT HIGHLIGHTS 4. MARKET AND COMPETITION 5. 9M 2019 FINANCIAL RESULTS AND 2019 OUTLOOK 6. FY 2018 FINANCIAL RESULTS AND 2019 OUTLOOK 6.a. 2018 DELIVERY AND 2019 OUTLOOK 6.b. REVIEW OF 2018 RESULTS 6.c. APPENDIX 7. GOVERNANCE 8. SUSTAINABI
Slide 94: FY 2018 Performance by High Value Regions
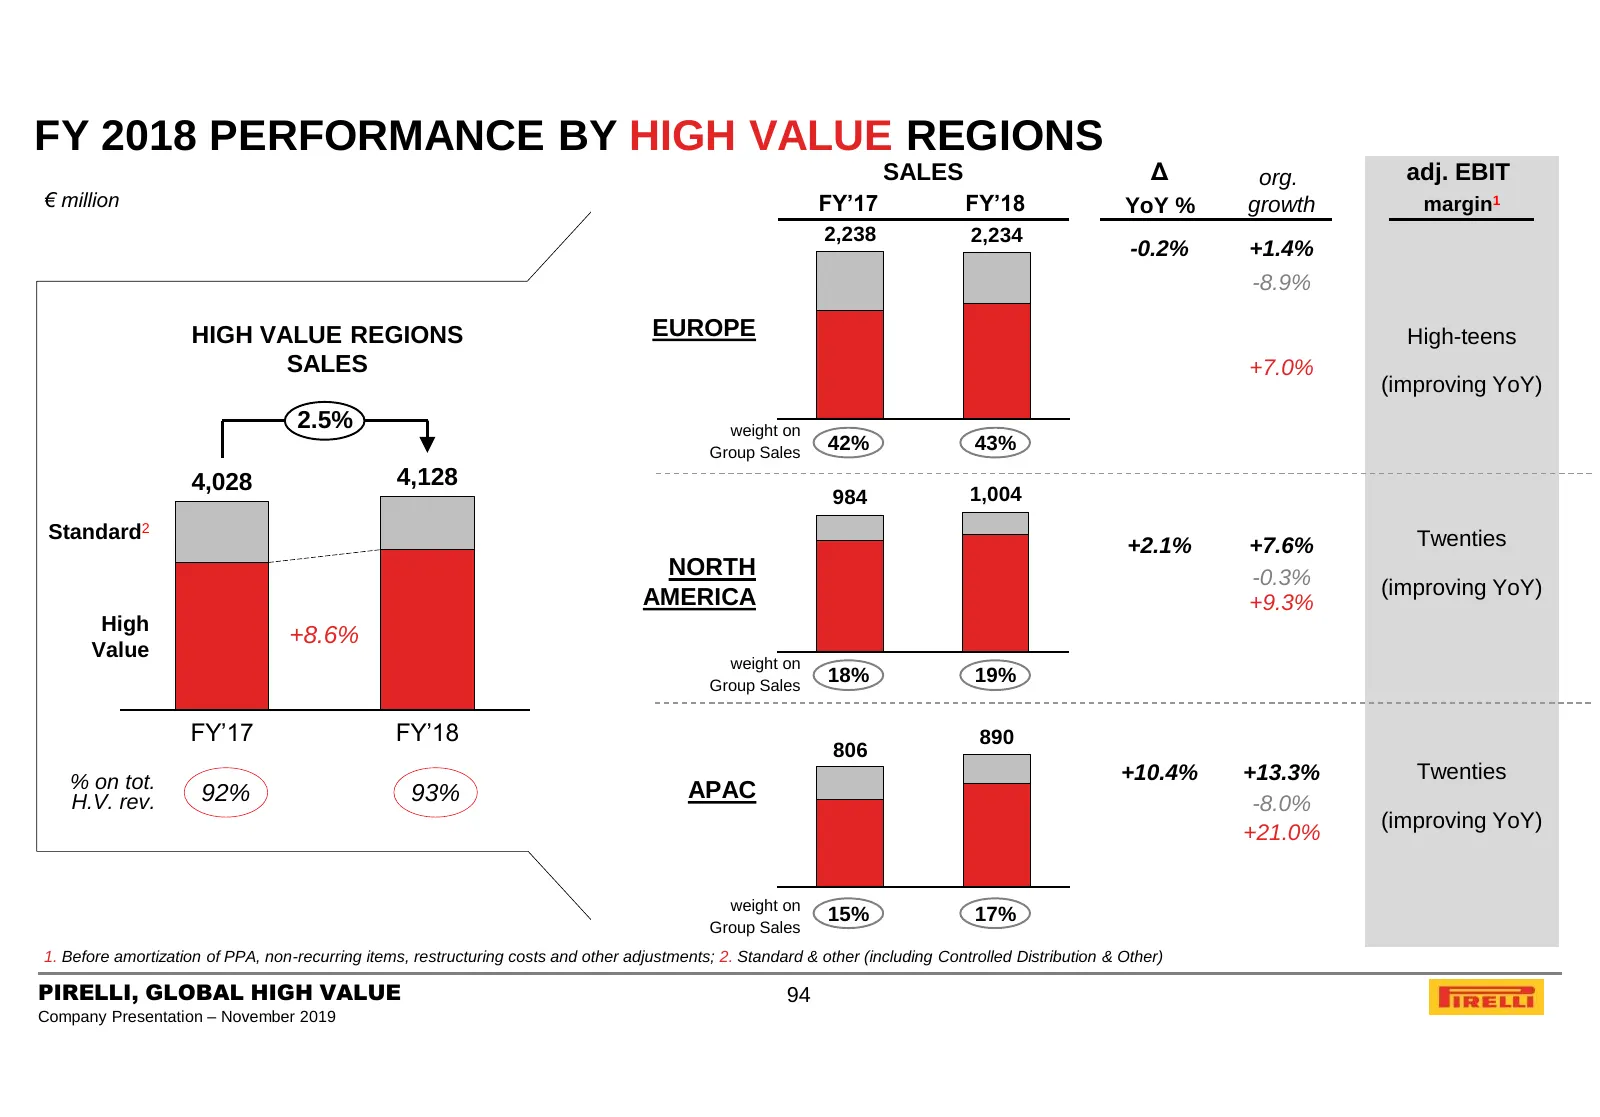
FY 2018 PERFORMANCE BY HIGH VALUE REGIONS SALES Δ org. adj. EBIT € million FY’17 FY’18 YoY % growth margin1 2,238 2,234 -0.2% +1.4% -8.9% HIGH VALUE REGIONS EUROPE High-teens SALES +7.0% (improving YoY) 2.5% weight on Group Sales 42% 43% 4,028 4,128 984 1,004 Standard2 Twenties +2.1% +7.6% NORTH -0.
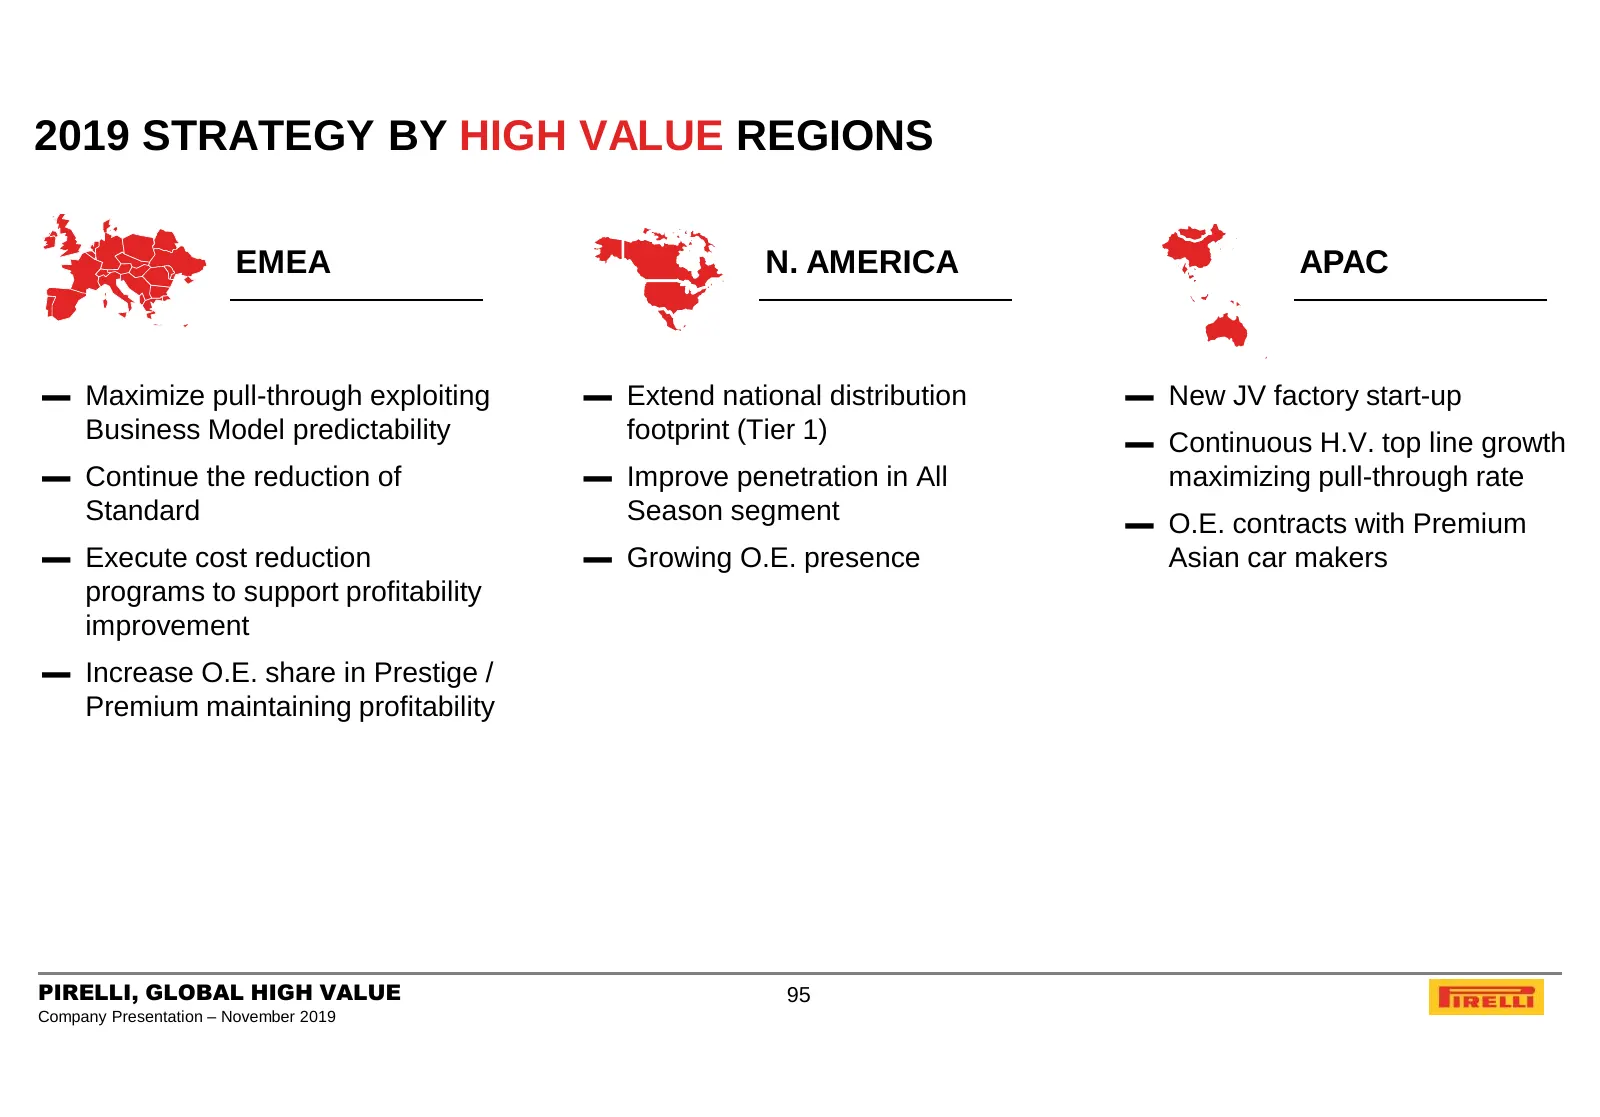
Slide 95: 2019 Strategy by High Value Regions
2019 STRATEGY BY HIGH VALUE REGIONS EMEA N. AMERICA APAC ▬ Maximize pull-through exploiting ▬ Extend national distribution ▬ New JV factory start-up Business Model predictability footprint (Tier 1) ▬ Continuous H.V. top line growth ▬ Continue the reduction of ▬ Improve penetration in All maximizing
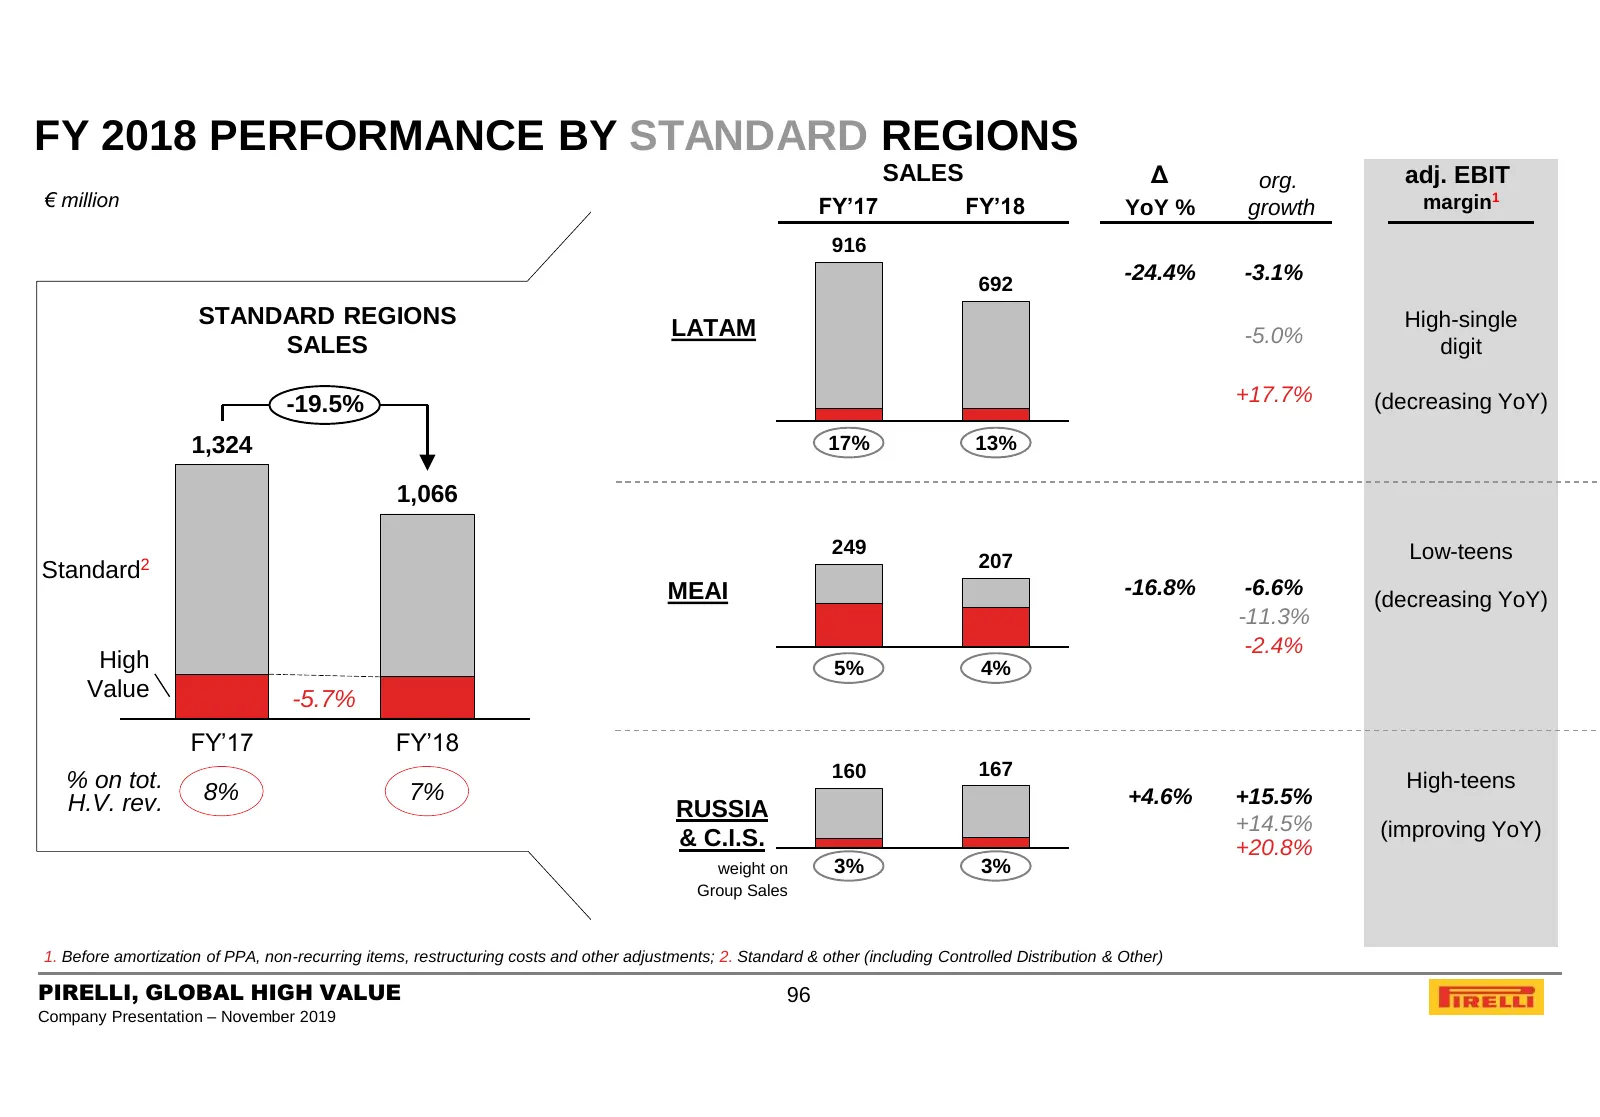
Slide 96: FY 2018 Performance by Standard Regions
FY 2018 PERFORMANCE BY STANDARD REGIONS SALES Δ org. adj. EBIT € million FY’17 FY’18 YoY % growth margin1 916 692 -24.4% -3.1% STANDARD REGIONS LATAM High-single SALES -5.0% digit -19.5% +17.7% (decreasing YoY) 1,324 17% 13% 1,066 249 Low-teens Standard2 207 MEAI -16.8% -6.6% (decreasing YoY) -11.3%
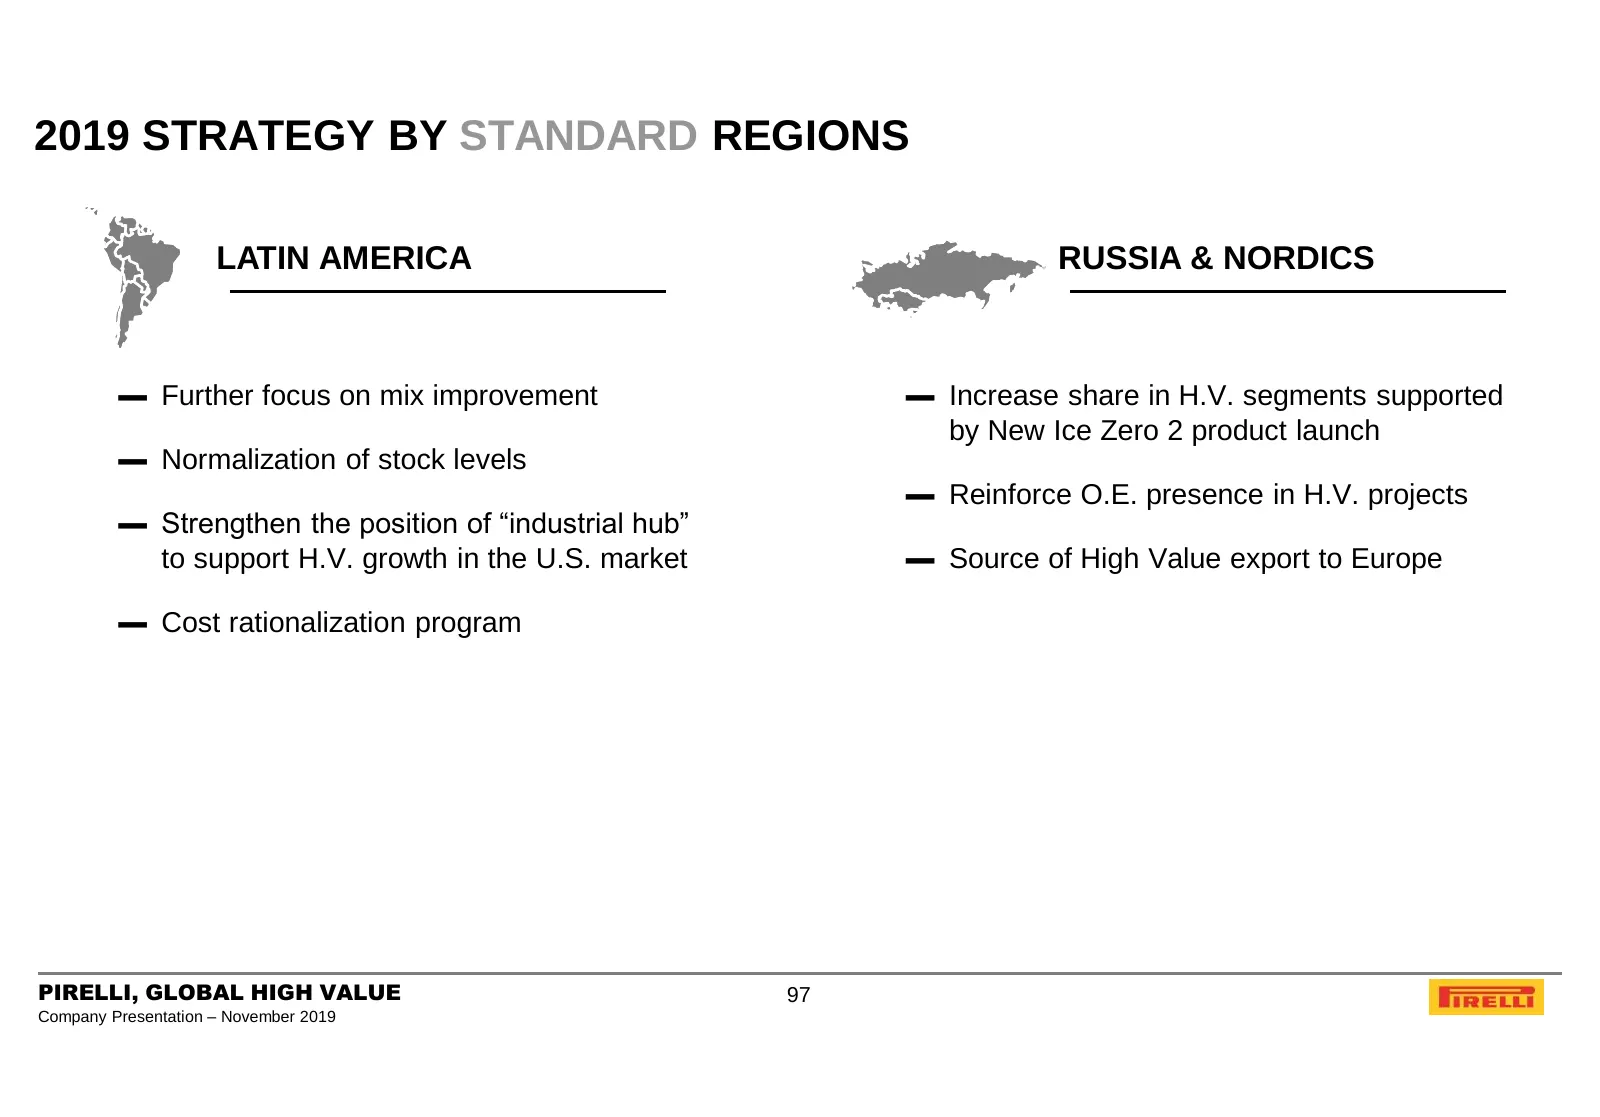
Slide 97: 2019 Strategy by Standard Regions
2019 STRATEGY BY STANDARD REGIONS LATIN AMERICA RUSSIA & NORDICS ▬ Further focus on mix improvement ▬ Increase share in H.V. segments supported by New Ice Zero 2 product launch ▬ Normalization of stock levels ▬ Reinforce O.E. presence in H.V. projects ▬ Strengthen the position of “industrial hub” to
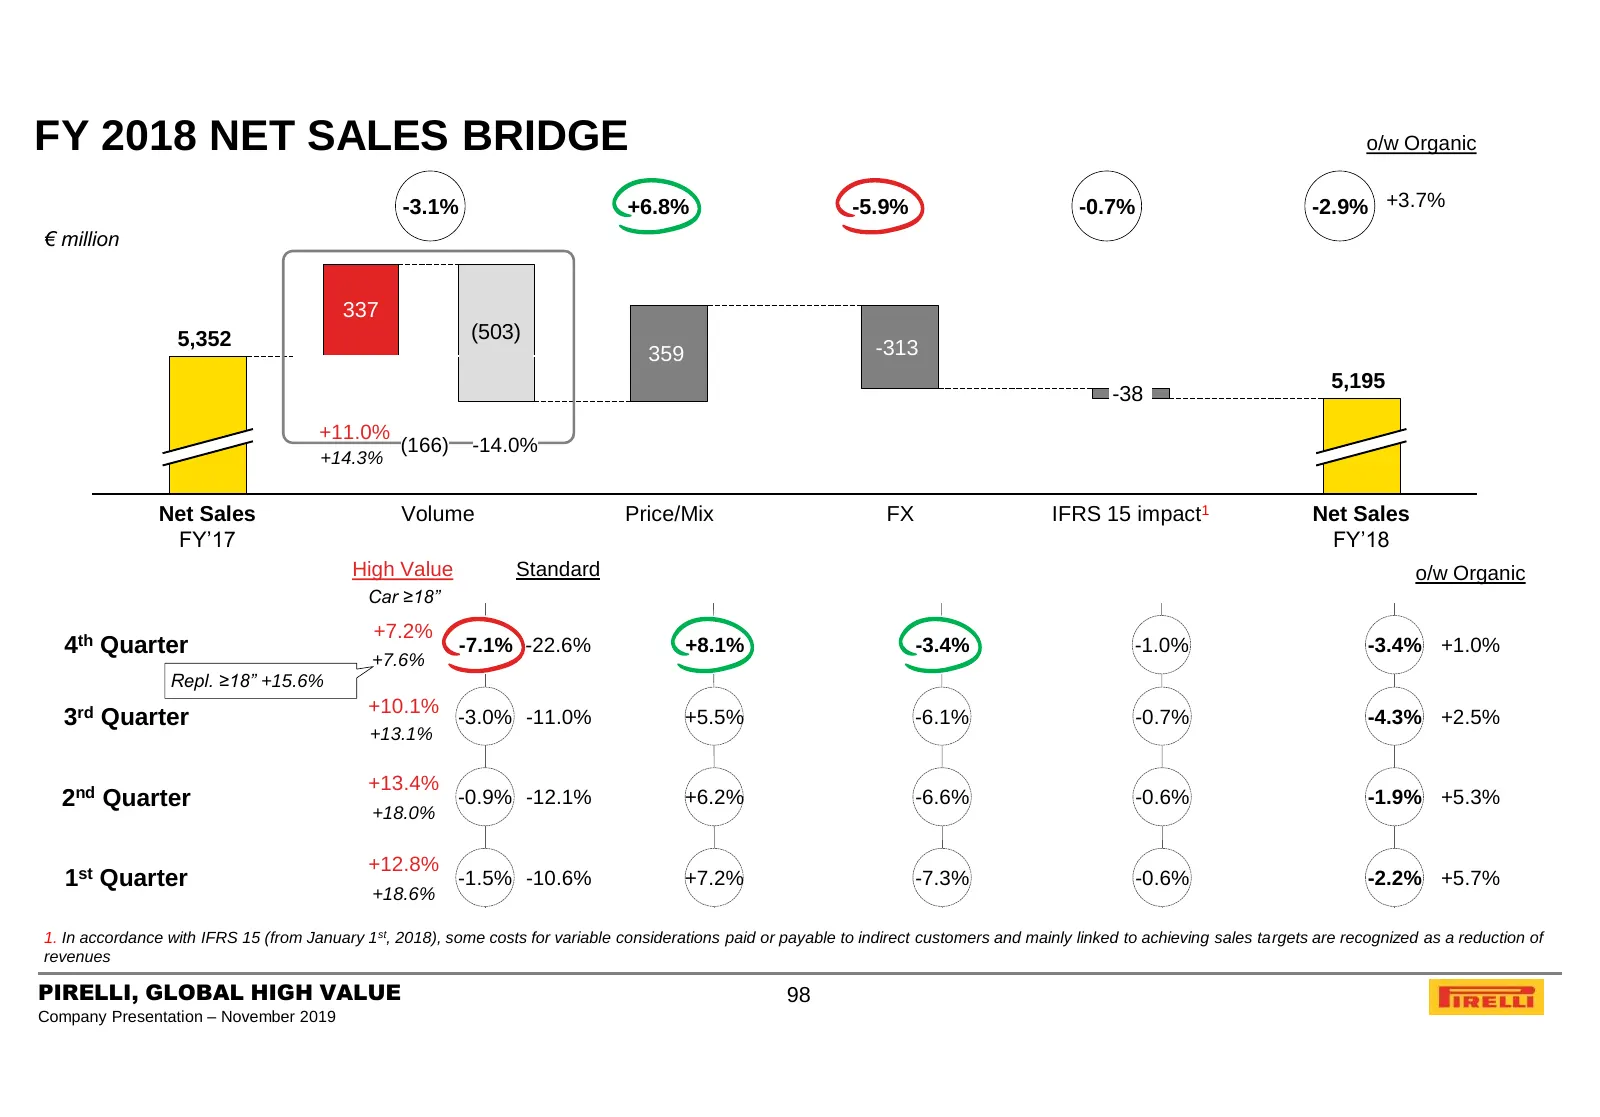
Slide 98: FY 2018 Net Sales Bridge
FY 2018 NET SALES BRIDGE o/w Organic -3.1% +6.8% -5.9% -0.7% -2.9% +3.7% € million 337 5,352 (503) 359 -313 5,195 -38 +11.0% (166) -14.0% +14.3% Net Sales Volume Price/Mix FX IFRS 15 impact1 Net Sales FY’17 FY’18 High Value Standard o/w Organic Car ≥18” +7.2% 4th Quarter -7.1% -22.6% +8.1% -3.4% -1.
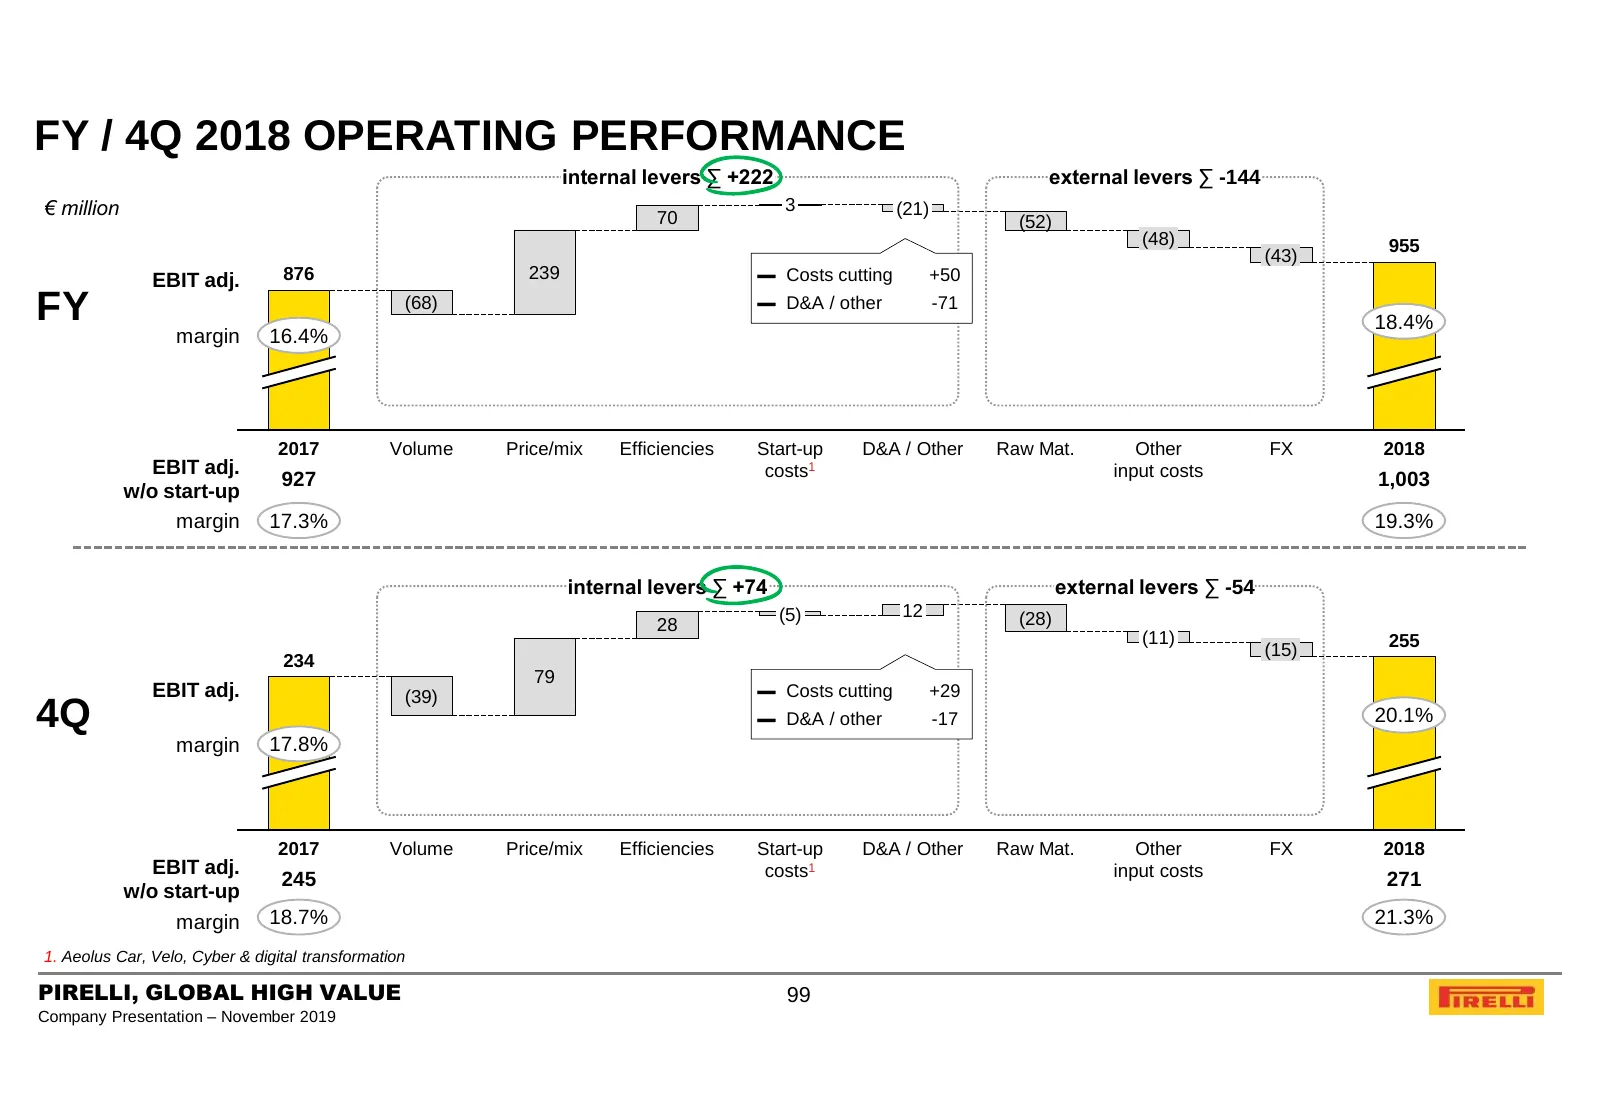
Slide 99: FY / 4Q 2018 Operating Performance
FY / 4Q 2018 OPERATING PERFORMANCE internal levers ∑ +222 external levers ∑ -144 € million 70 3 (21) (52) (48) 955 (43) EBIT adj. 876 239 ▬ Costs cutting +50 FY (68) ▬ D&A / other -71 18.4% margin 16.4% 2017 Volume Price/mix Efficiencies Start-up D&A / Other Raw Mat. Other FX 2018 EBIT adj. costs1 i
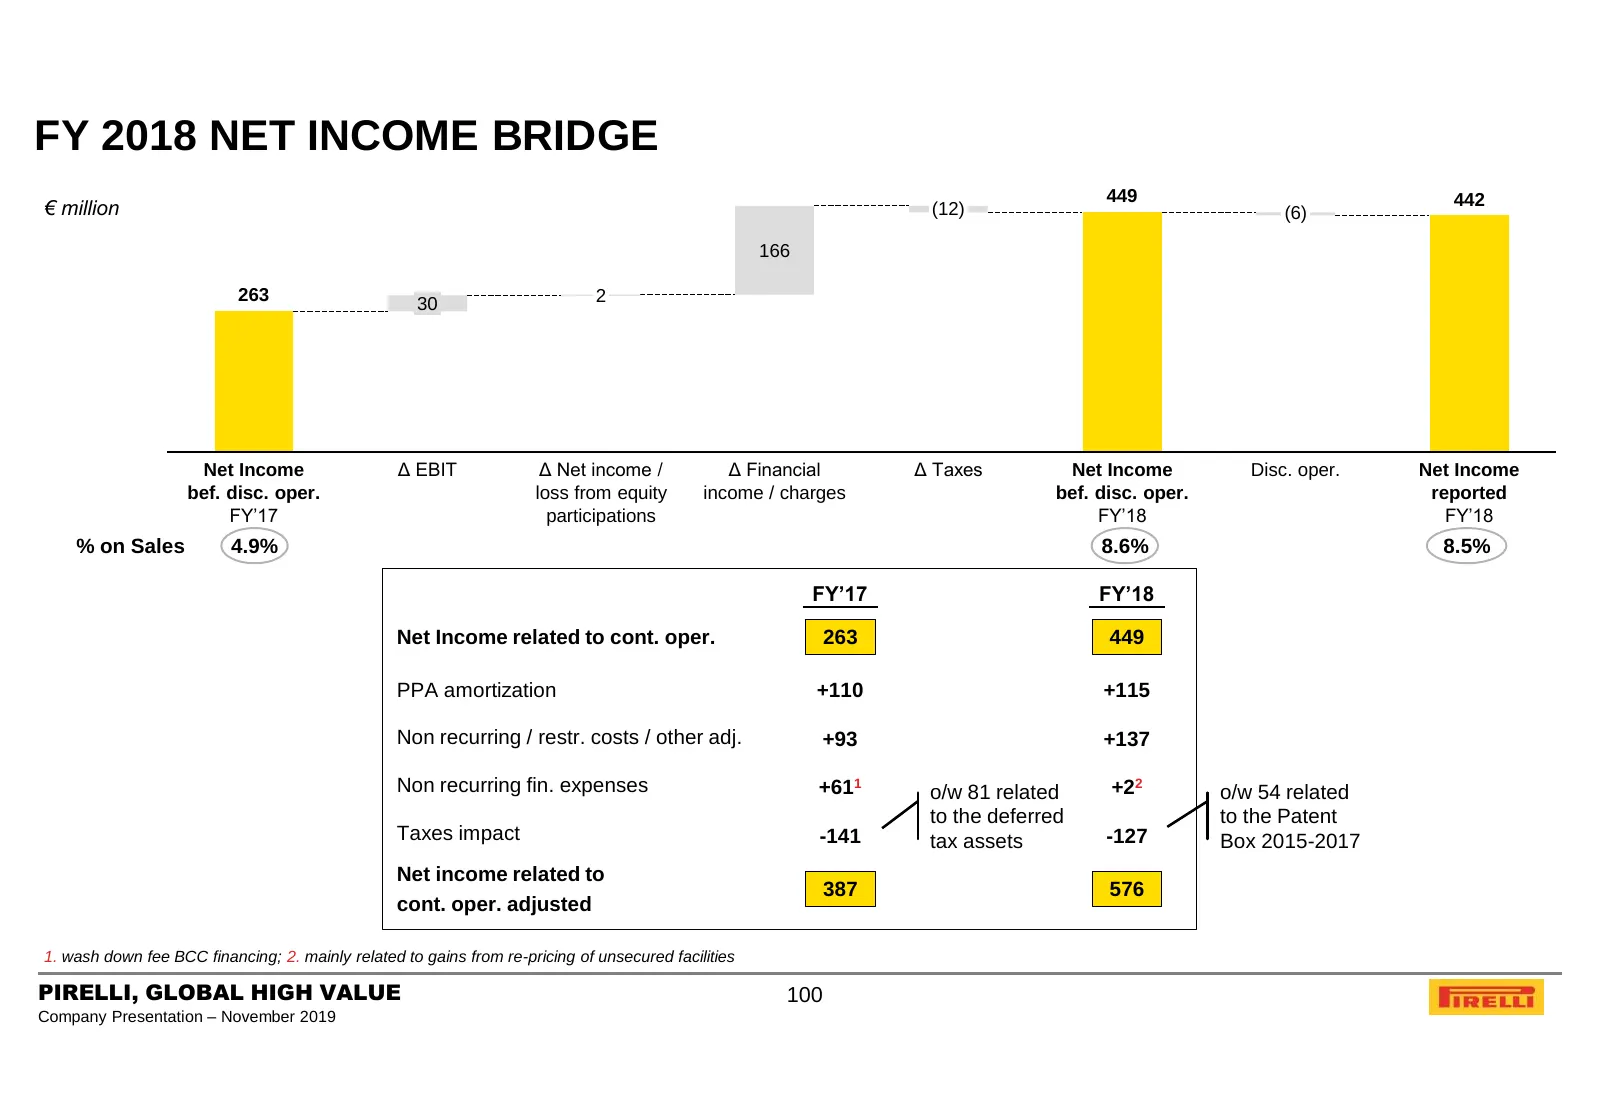
Slide 100: FY 2018 Net Income Bridge
FY 2018 NET INCOME BRIDGE 449 442 € million (12) (6) 166 263 30 2 Net Income Δ EBIT Δ Net income / Δ Financial Δ Taxes Net Income Disc. oper. Net Income bef. disc. oper. loss from equity income / charges bef. disc. oper. reported FY’17 participations FY’18 FY’18 % on Sales 4.9% 8.6% 8.5% FY’17 FY’18
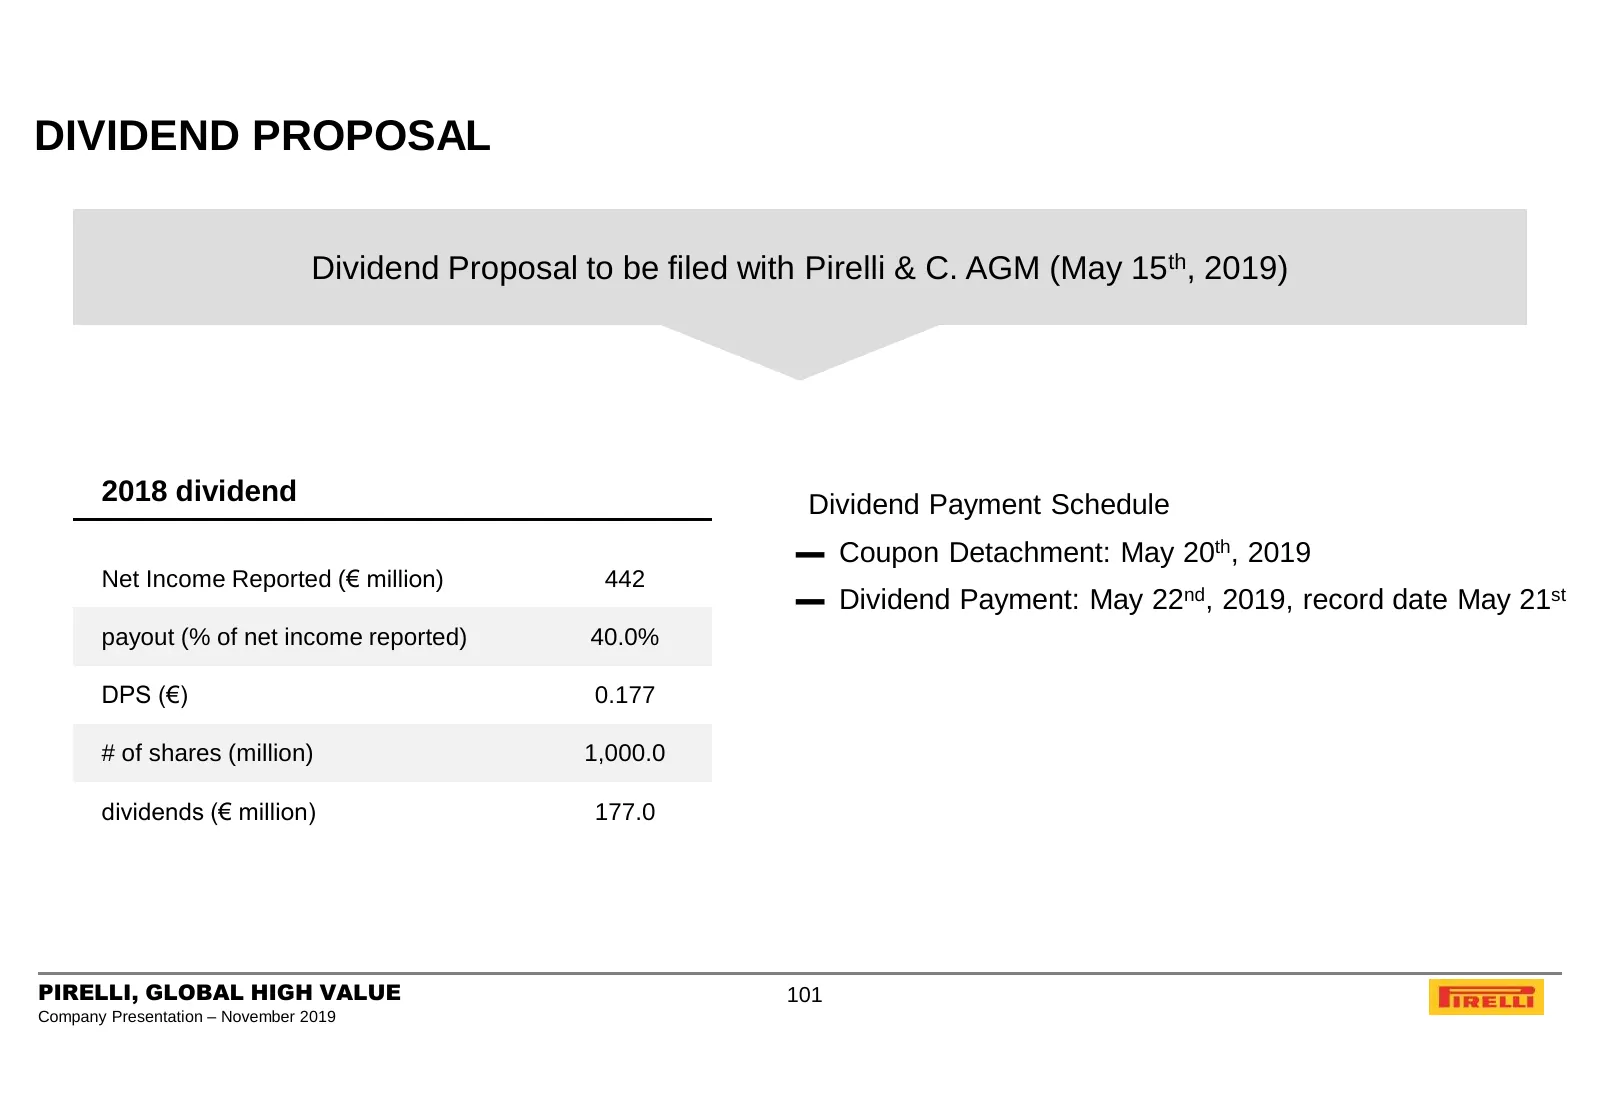
Slide 101: Dividend Proposal
DIVIDEND PROPOSAL Dividend Proposal to be filed with Pirelli & C. AGM (May 15th, 2019) 2018 dividend Dividend Payment Schedule ▬ Coupon Detachment: May 20th, 2019 Net Income Reported (€ million) 442 ▬ Dividend Payment: May 22nd, 2019, record date May 21st payout (% of net income reported) 40.0% DPS
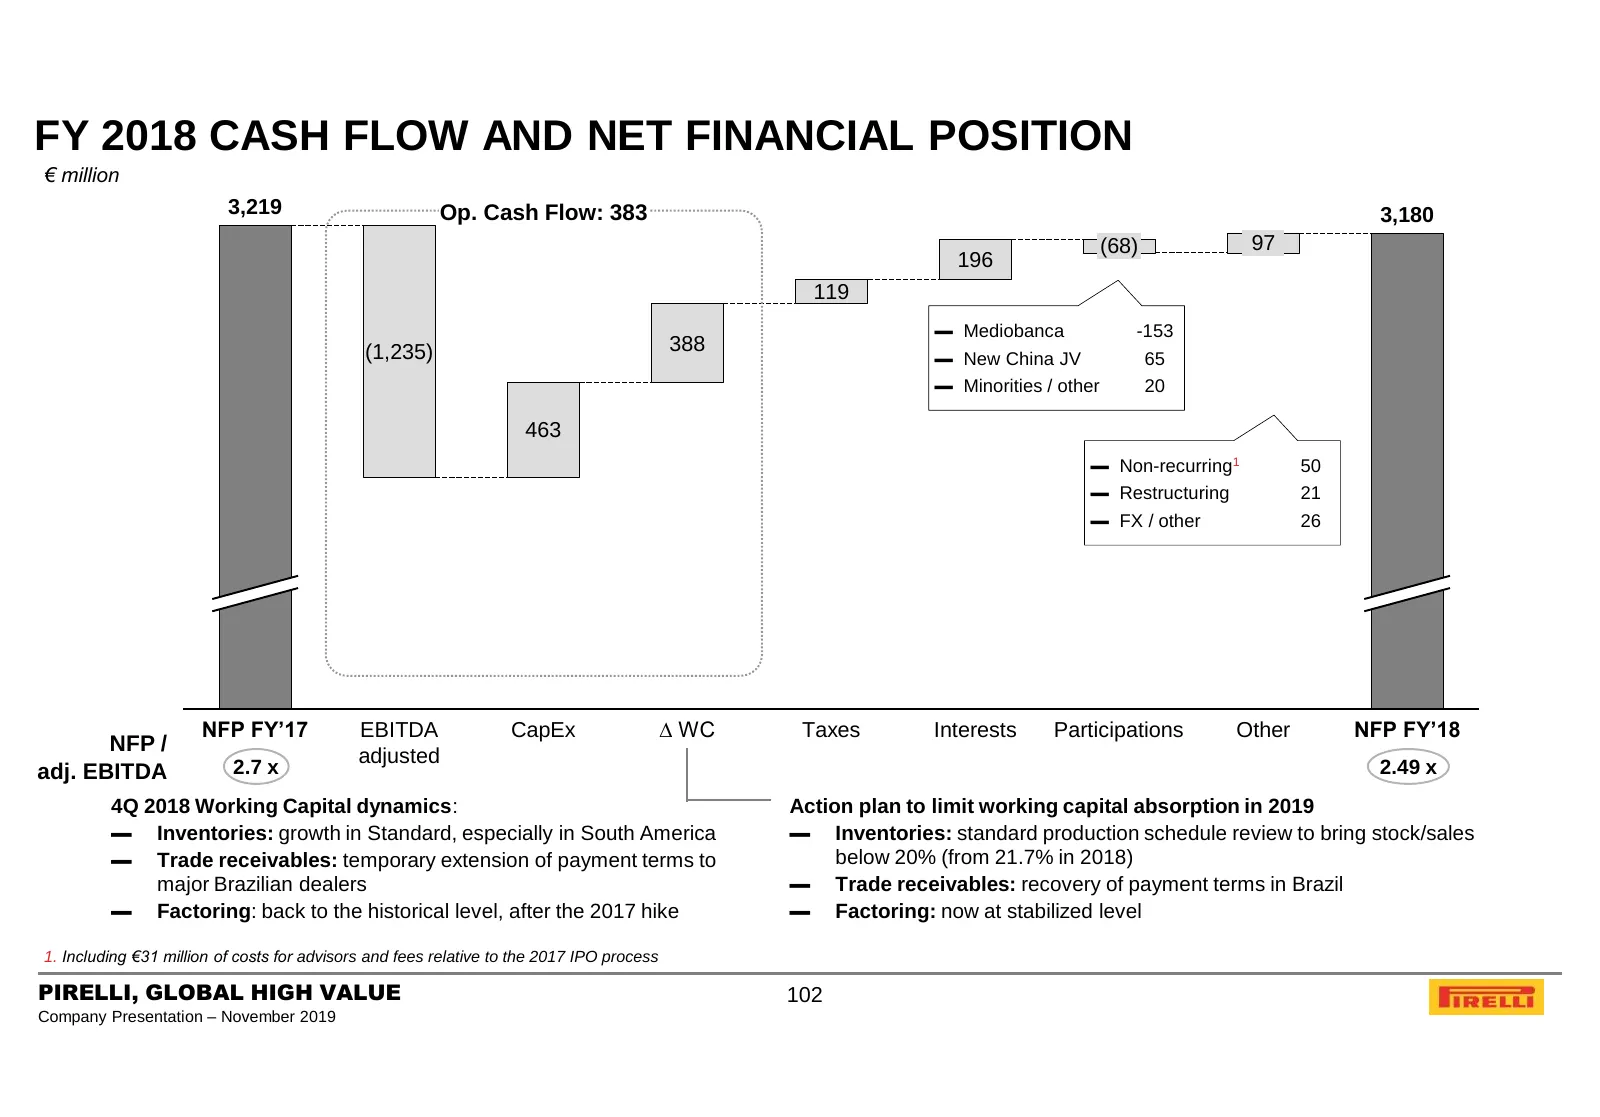
Slide 102: FY 2018 Cash Flow and Net Financial Position
FY 2018 CASH FLOW AND NET FINANCIAL POSITION € million 3,219 Op. Cash Flow: 383 3,180 (68) 97 196 119 ▬ Mediobanca -153 (1,235) 388 ▬ New China JV 65 ▬ Minorities / other 20 463 ▬ Non-recurring1 50 ▬ Restructuring 21 ▬ FX / other 26 NFP FY’17 EBITDA CapEx ∆ WC Taxes Interests Participations Other NF
Slide 103: Current Capital Structure (December 2018)
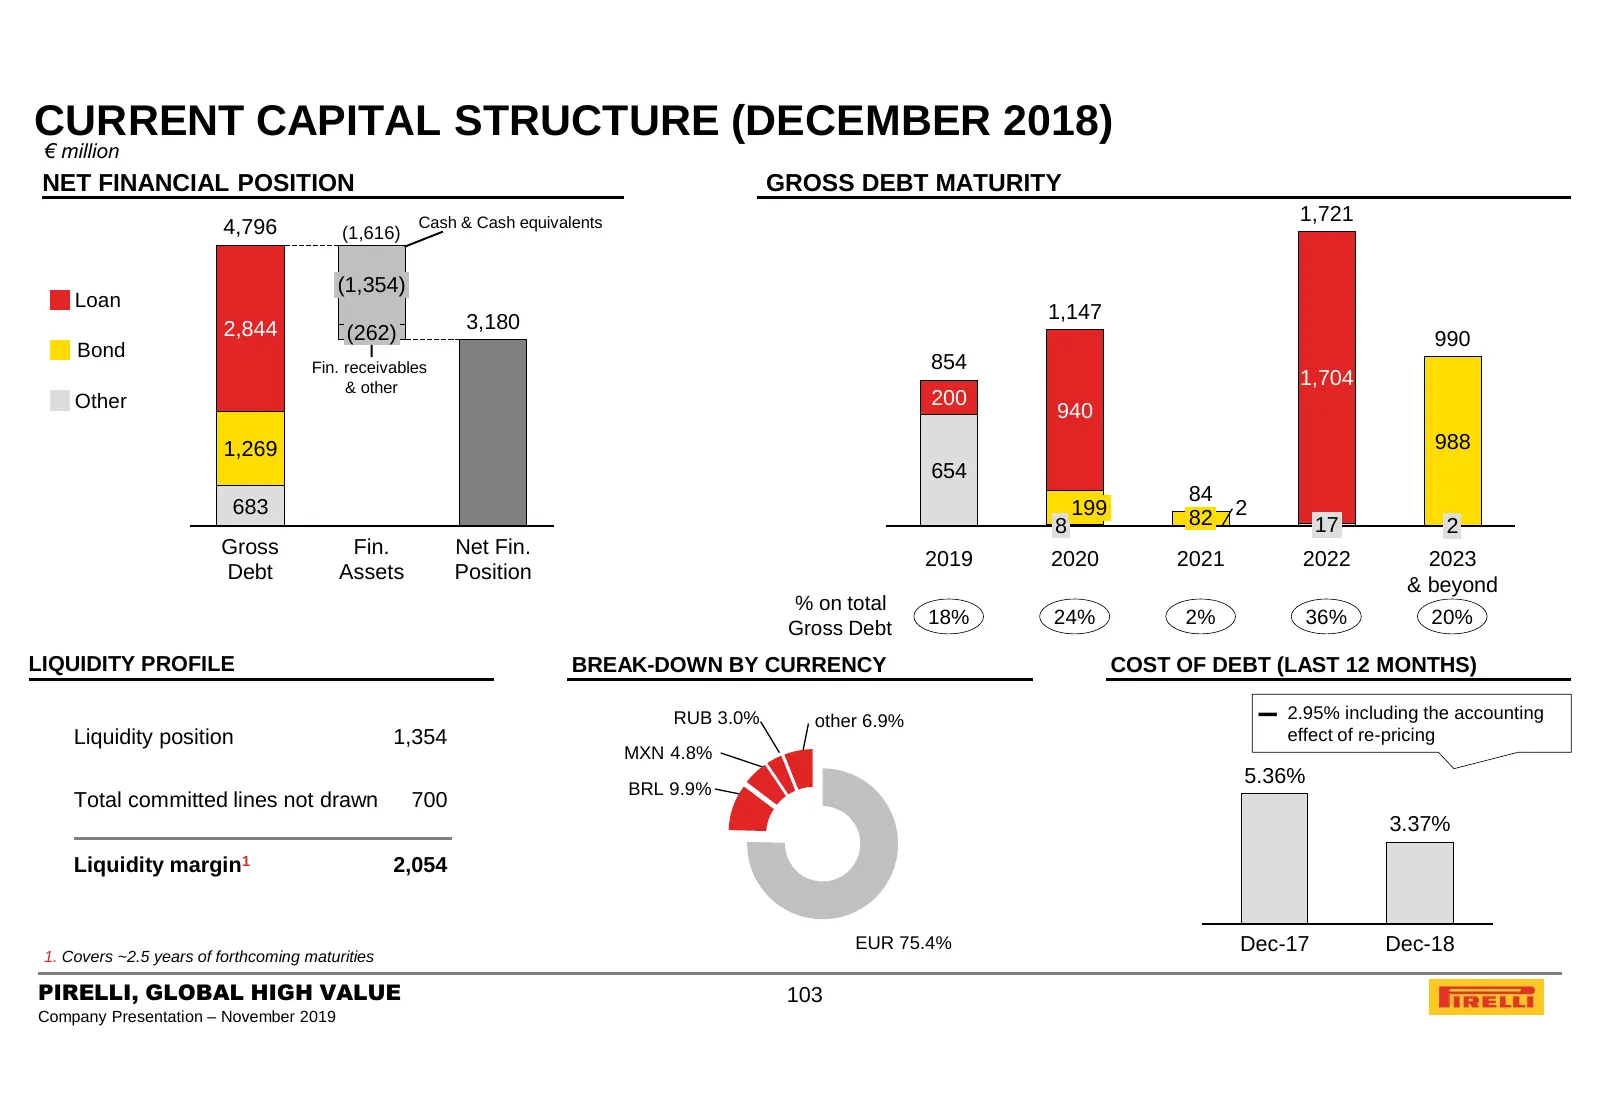
CURRENT CAPITAL STRUCTURE (DECEMBER 2018) € million NET FINANCIAL POSITION GROSS DEBT MATURITY Cash & Cash equivalents 1,721 4,796 (1,616) (1,354) Loan 3,180 1,147 2,844 (262) 990 Bond Fin. receivables 854 & other 1,704 Other 200 940 1,269 988 654 84 683 199 2 8 82 17 2 Gross Fin. Net Fin. 2019 2020
Slide 104: 2018 Delivery in Sustainability
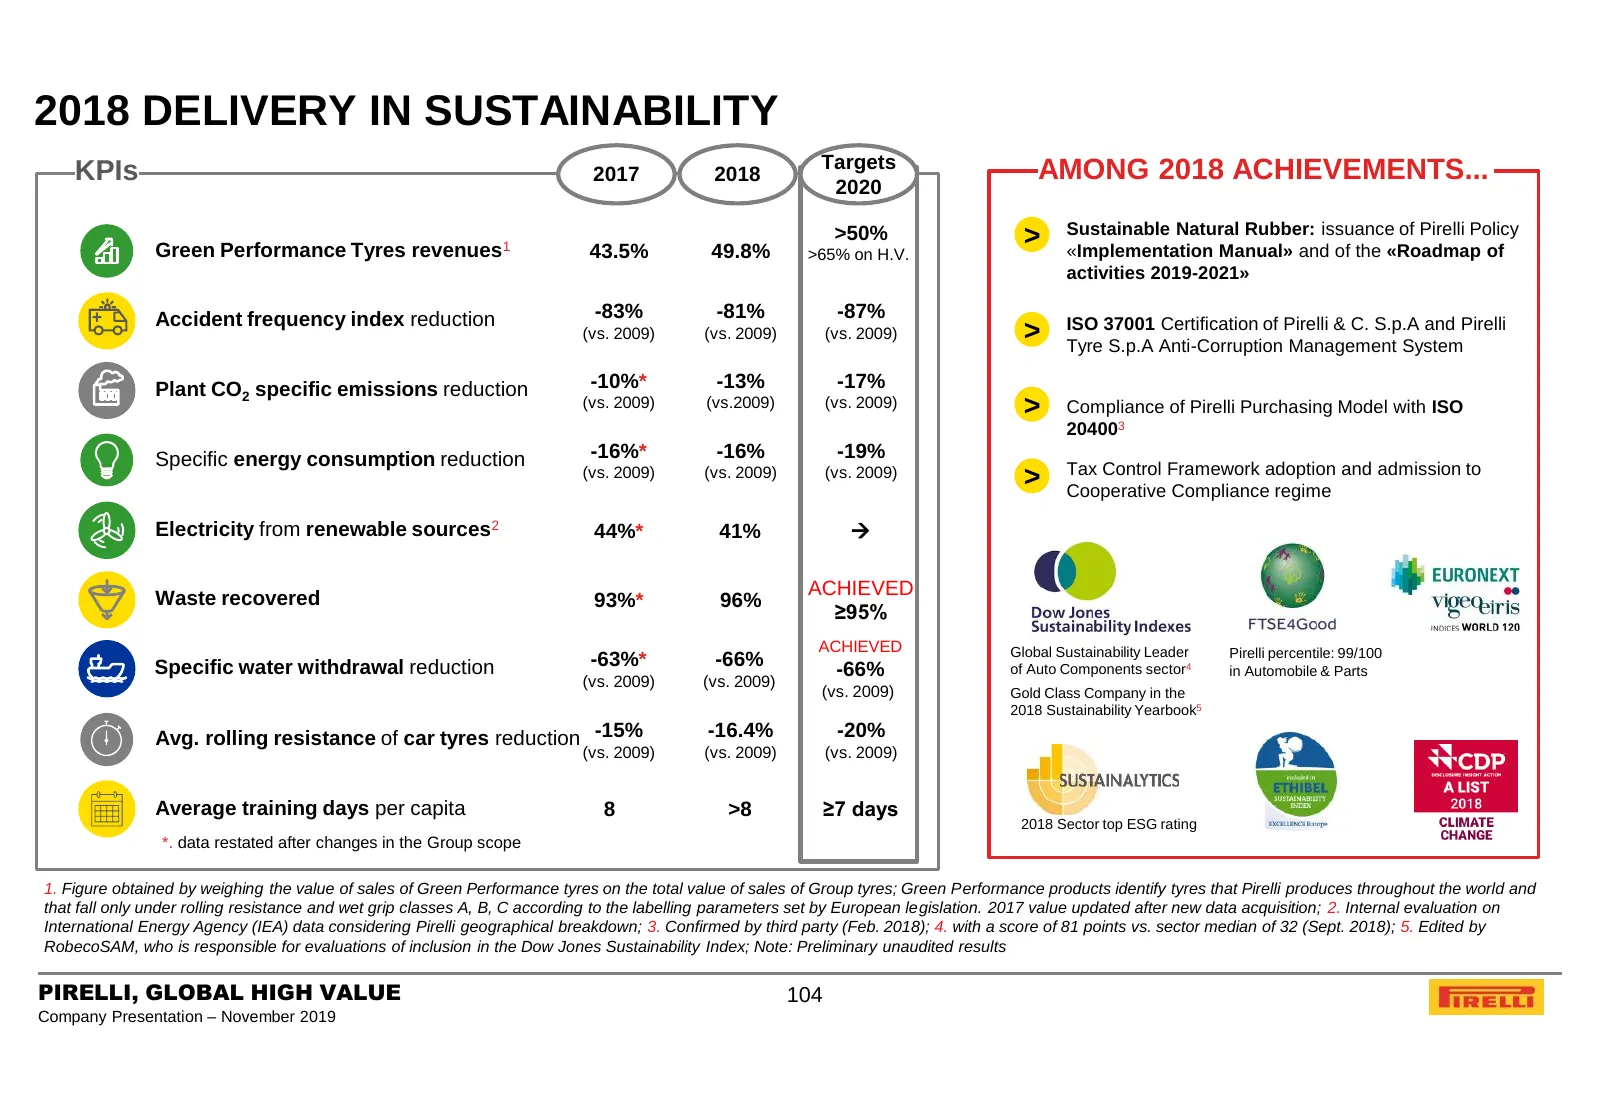
2018 DELIVERY IN SUSTAINABILITY Targets AMONG 2018 ACHIEVEMENTS... KPIs 2017 2018 2020 Sustainable Natural Rubber: issuance of Pirelli Policy Green Performance Tyres revenues1 43.5% 49.8% >50% > «Implementation Manual» and of the «Roadmap of >65% on H.V. activities 2019-2021» Accident frequency inde
Slide 105: Agenda
AGENDA 1. PIRELLI AT A GLANCE 2. BUSINESS MODEL 3. KEY INVESTMENT HIGHLIGHTS 4. MARKET AND COMPETITION 5. 9M 2019 FINANCIAL RESULTS AND 2019 OUTLOOK 6. FY 2018 FINANCIAL RESULTS AND 2019 OUTLOOK 6.a. 2018 DELIVERY AND 2019 OUTLOOK 6.b. REVIEW OF 2018 RESULTS 6.c. APPENDIX 7. GOVERNANCE 8. SUSTAINABI
Slide 106: 4Q / FY 2018 Results Highlights
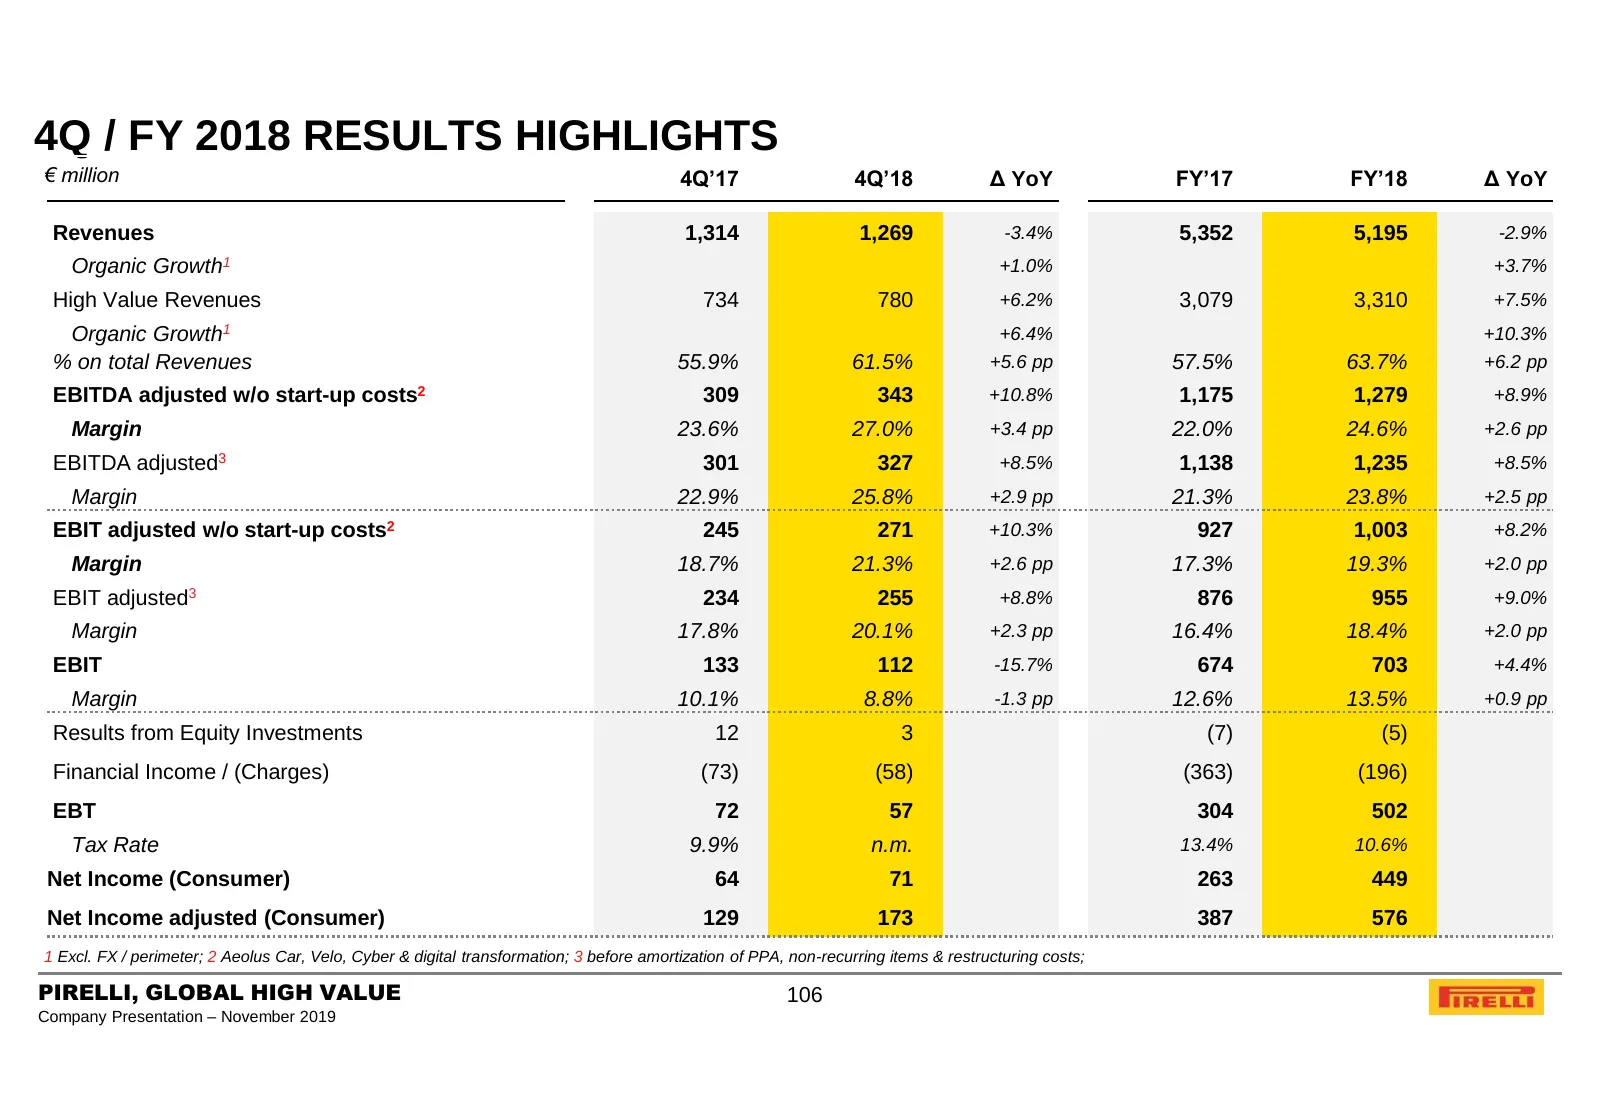
4Q / FY 2018 RESULTS HIGHLIGHTS € million 4Q’17 4Q’18 Δ YoY FY’17 FY’18 Δ YoY Revenues 1,314 1,269 -3.4% 5,352 5,195 -2.9% Organic Growth1 +1.0% +3.7% High Value Revenues 734 780 +6.2% 3,079 3,310 +7.5% Organic Growth1 +6.4% +10.3% % on total Revenues 55.9% 61.5% +5.6 pp 57.5% 63.7% +6.2 pp EBITDA a
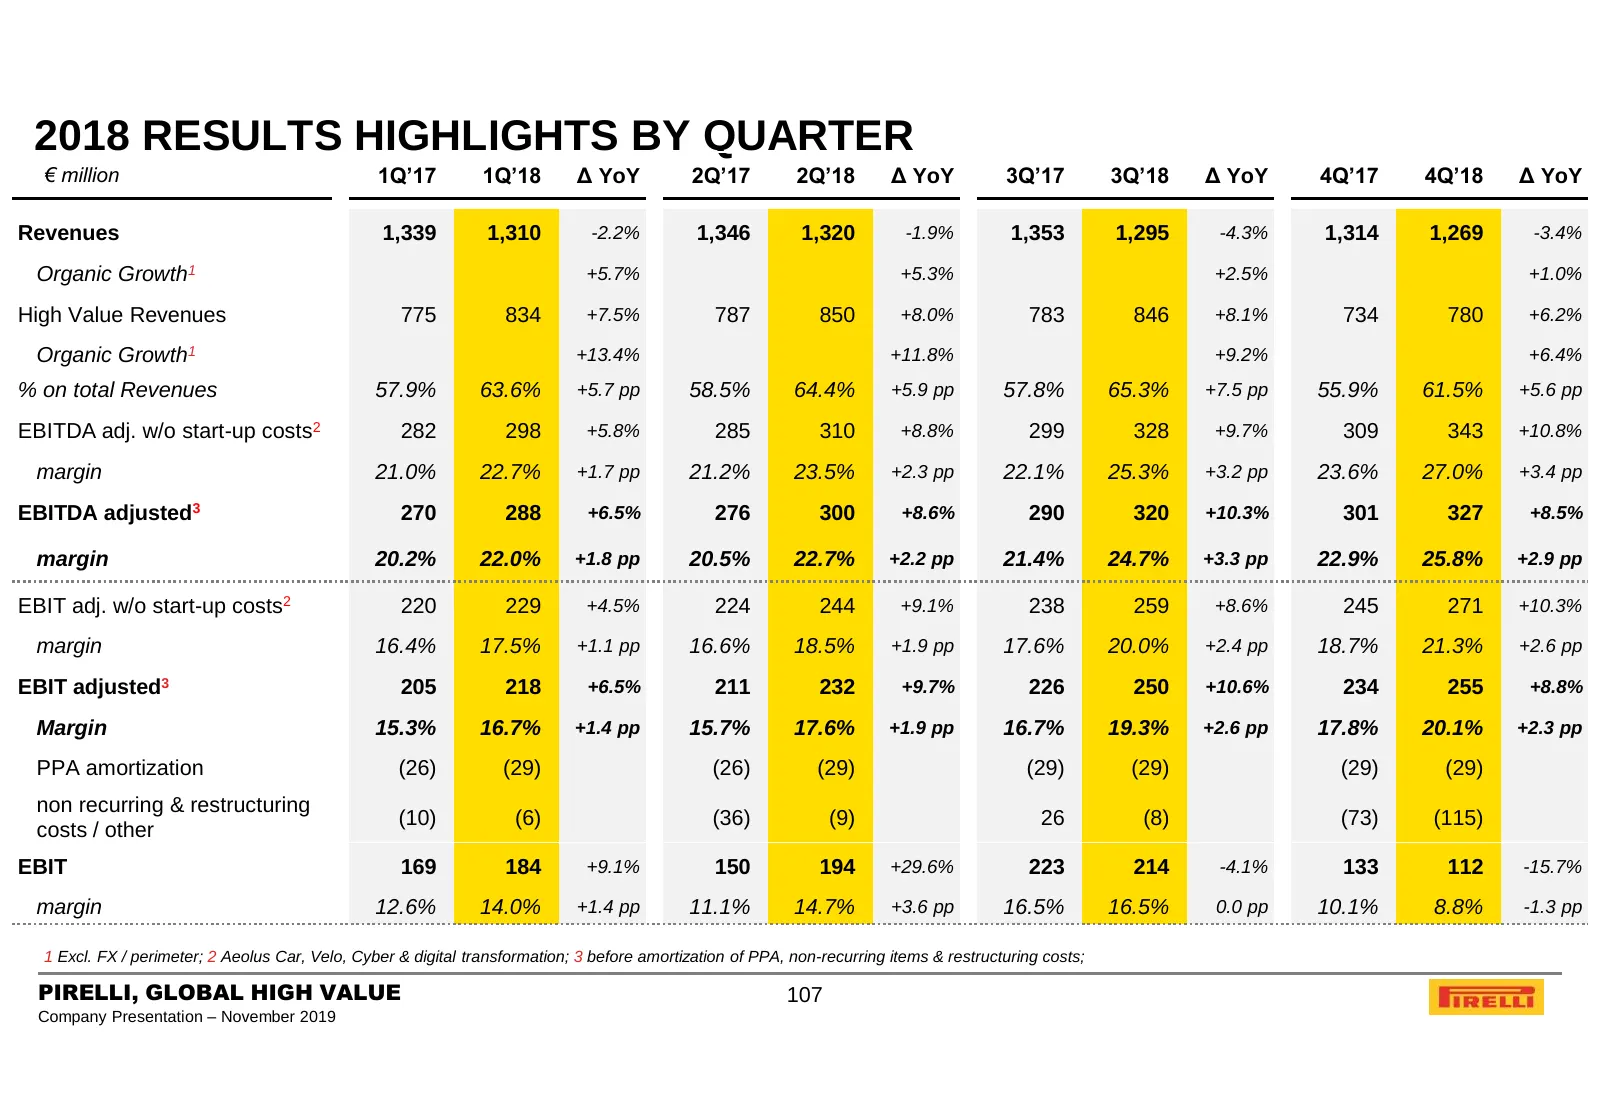
Slide 107: 2018 Results Highlights by Quarter
2018 RESULTS HIGHLIGHTS BY QUARTER € million 1Q’17 1Q’18 Δ YoY 2Q’17 2Q’18 Δ YoY 3Q’17 3Q’18 Δ YoY 4Q’17 4Q’18 Δ YoY Revenues 1,339 1,310 -2.2% 1,346 1,320 -1.9% 1,353 1,295 -4.3% 1,314 1,269 -3.4% Organic Growth1 +5.7% +5.3% +2.5% +1.0% High Value Revenues 775 834 +7.5% 787 850 +8.0% 783 846 +8.1%
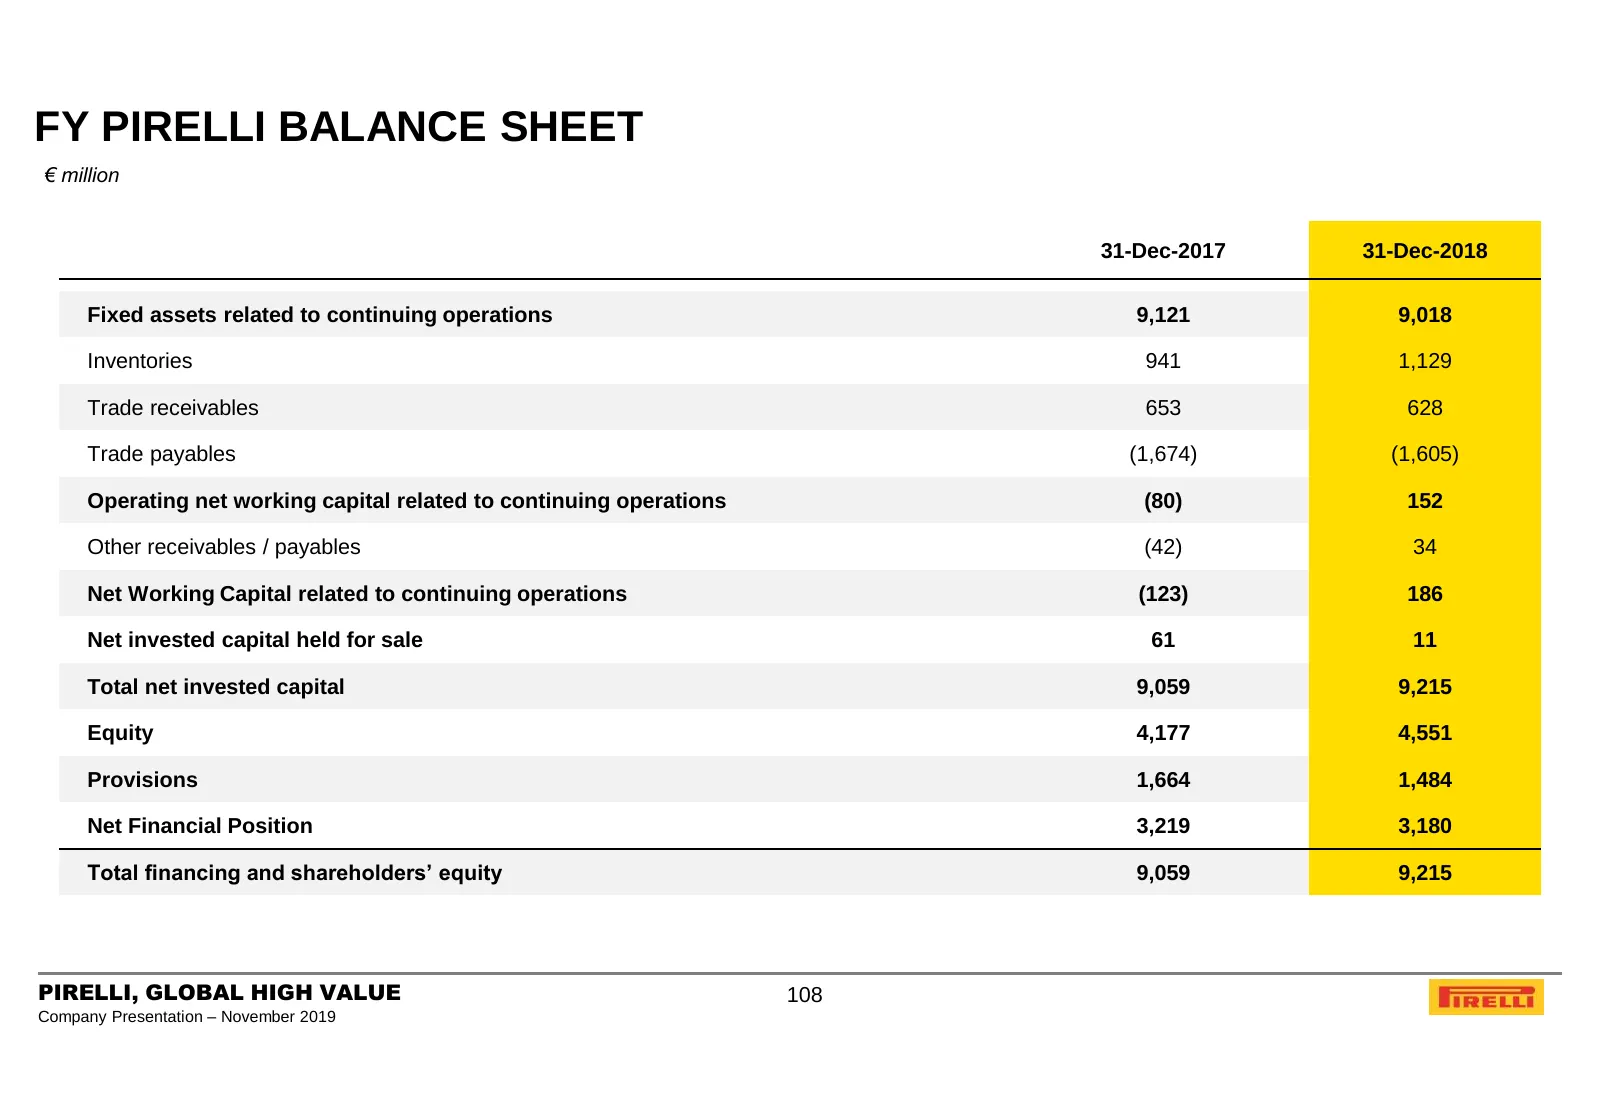
Slide 108: FY Pirelli Balance Sheet
FY PIRELLI BALANCE SHEET € million 31-Dec-2017 31-Dec-2018 Fixed assets related to continuing operations 9,121 9,018 Inventories 941 1,129 Trade receivables 653 628 Trade payables (1,674) (1,605) Operating net working capital related to continuing operations (80) 152 Other receivables / payables (42
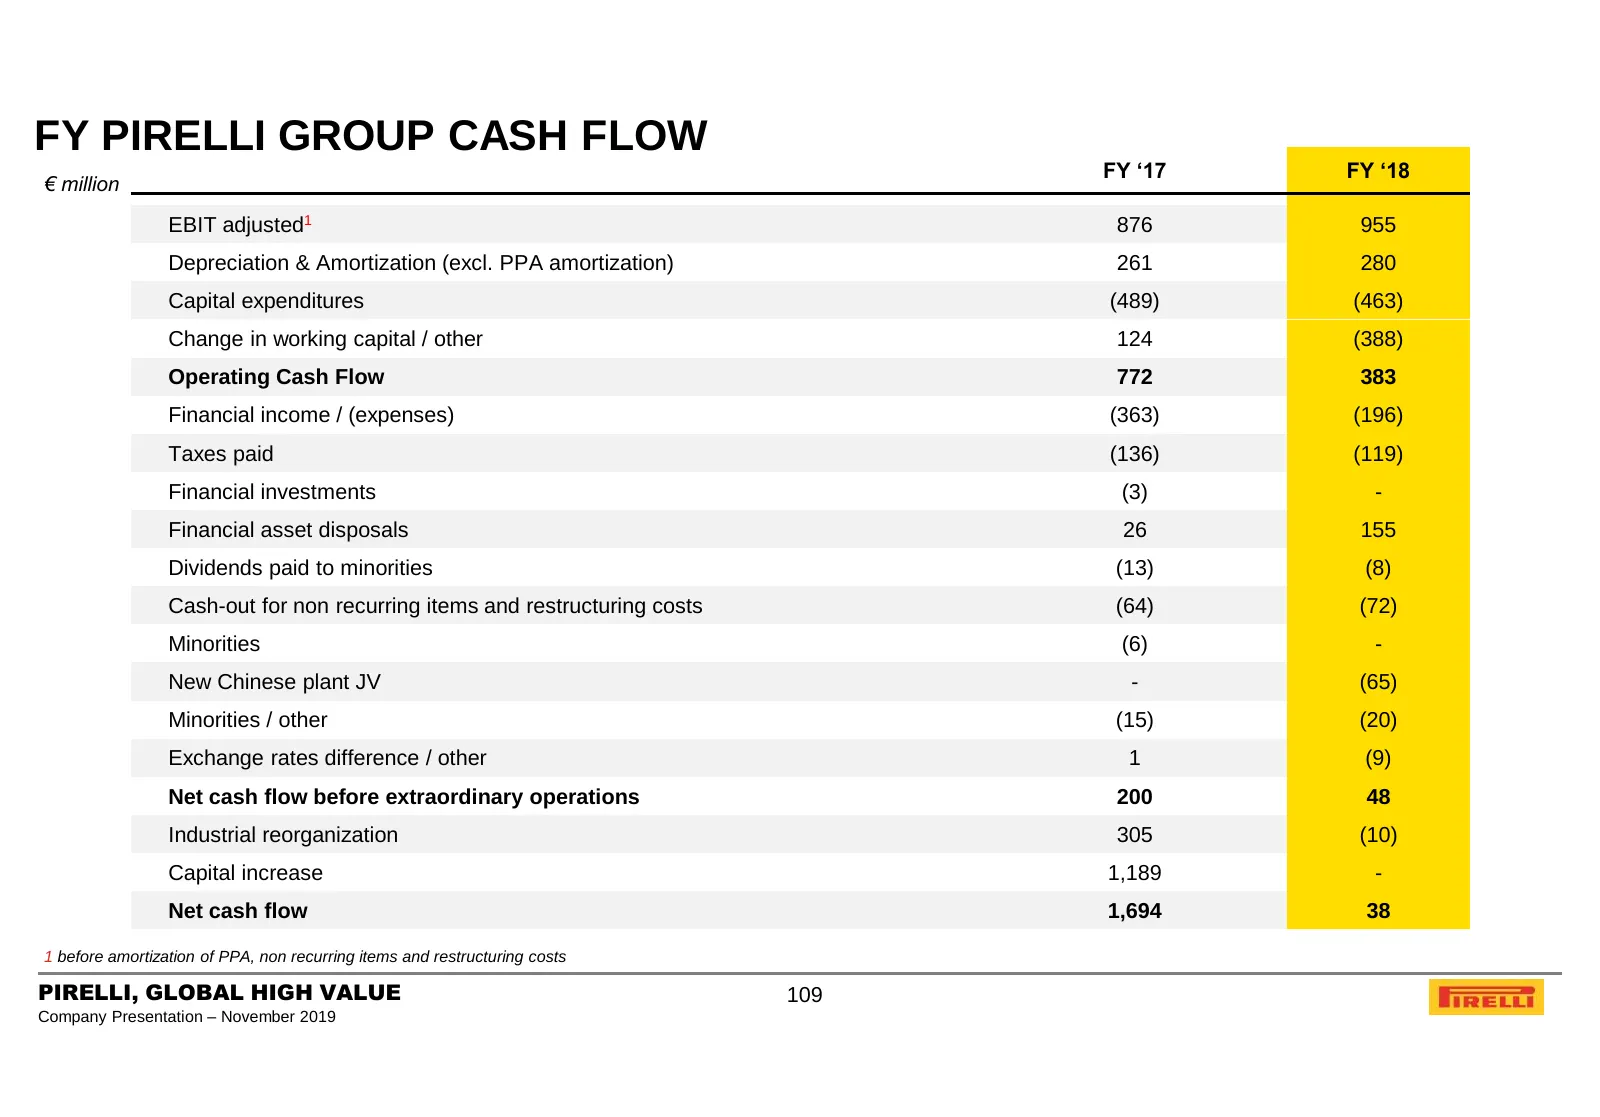
Slide 109: FY Pirelli Group Cash Flow
FY PIRELLI GROUP CASH FLOW FY ‘17 FY ‘18 € million EBIT adjusted1 876 955 Depreciation & Amortization (excl. PPA amortization) 261 280 Capital expenditures (489) (463) Change in working capital / other 124 (388) Operating Cash Flow 772 383 Financial income / (expenses) (363) (196) Taxes paid (136) (
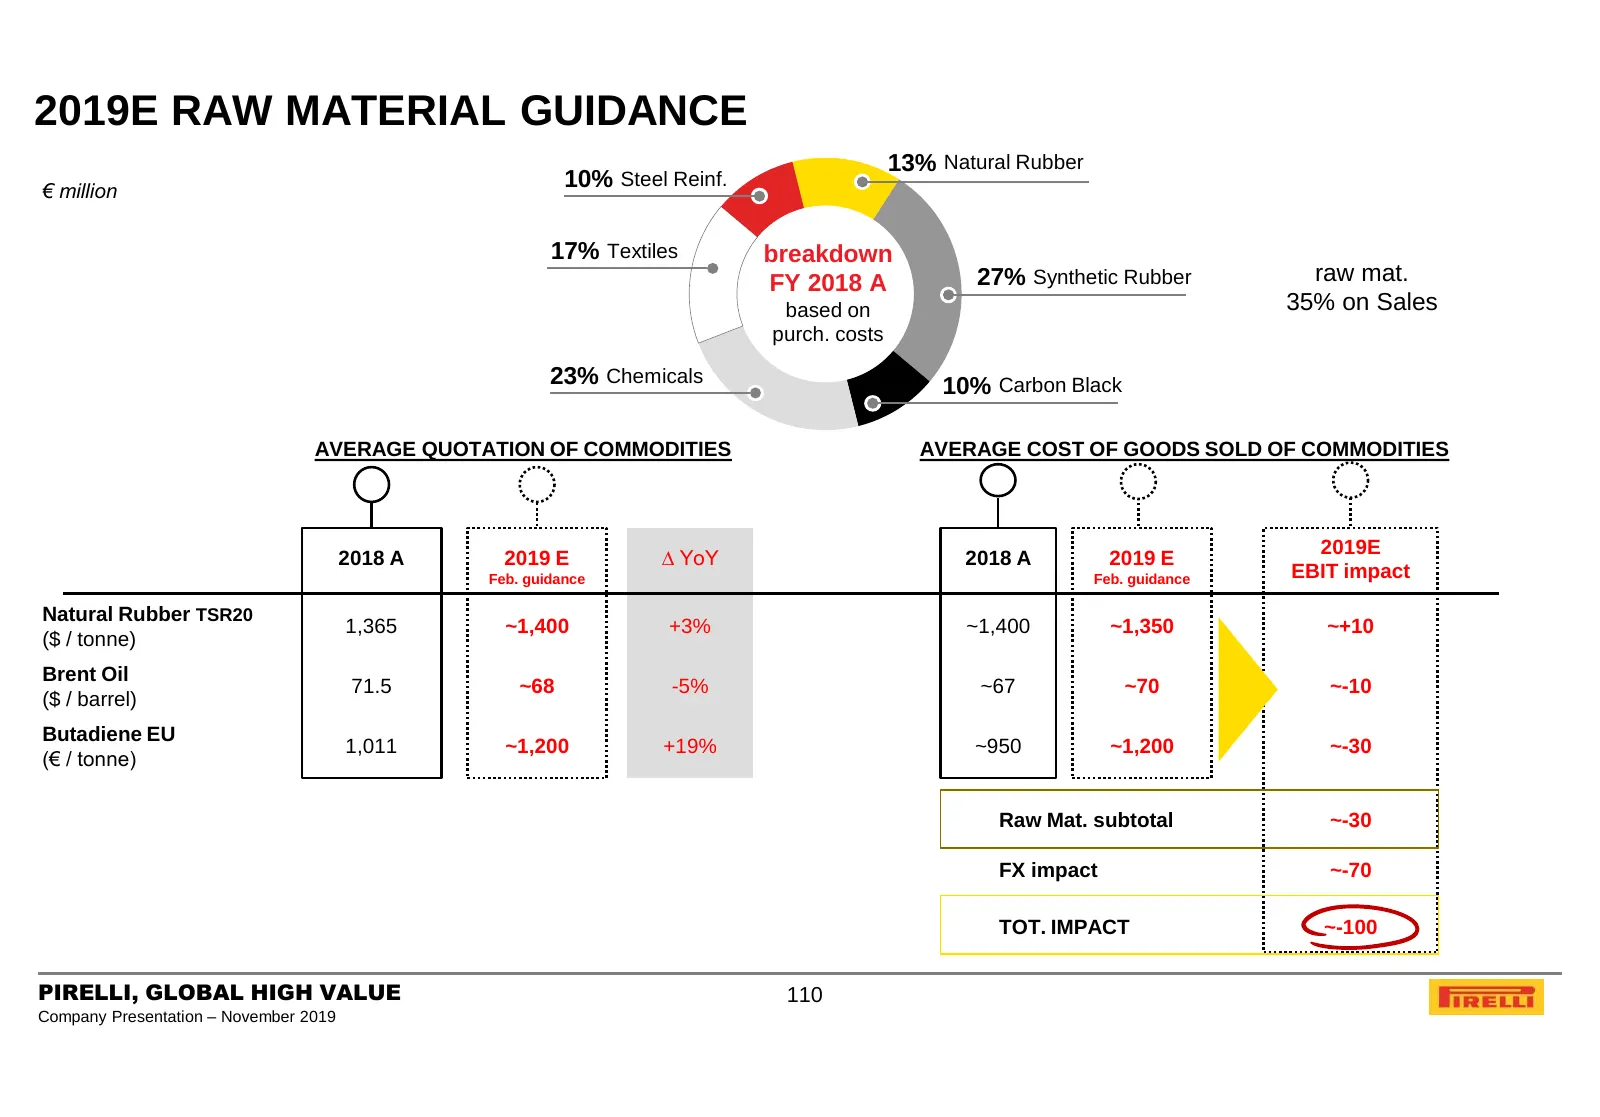
Slide 110: 2019E Raw Material Guidance
2019E RAW MATERIAL GUIDANCE 13% Natural Rubber € million 10% Steel Reinf. 17% Textiles breakdown FY 2018 A 27% Synthetic Rubber raw mat. based on 35% on Sales purch. costs 23% Chemicals 10% Carbon Black AVERAGE QUOTATION OF COMMODITIES AVERAGE COST OF GOODS SOLD OF COMMODITIES 2019E 2018 A 2019 E ∆
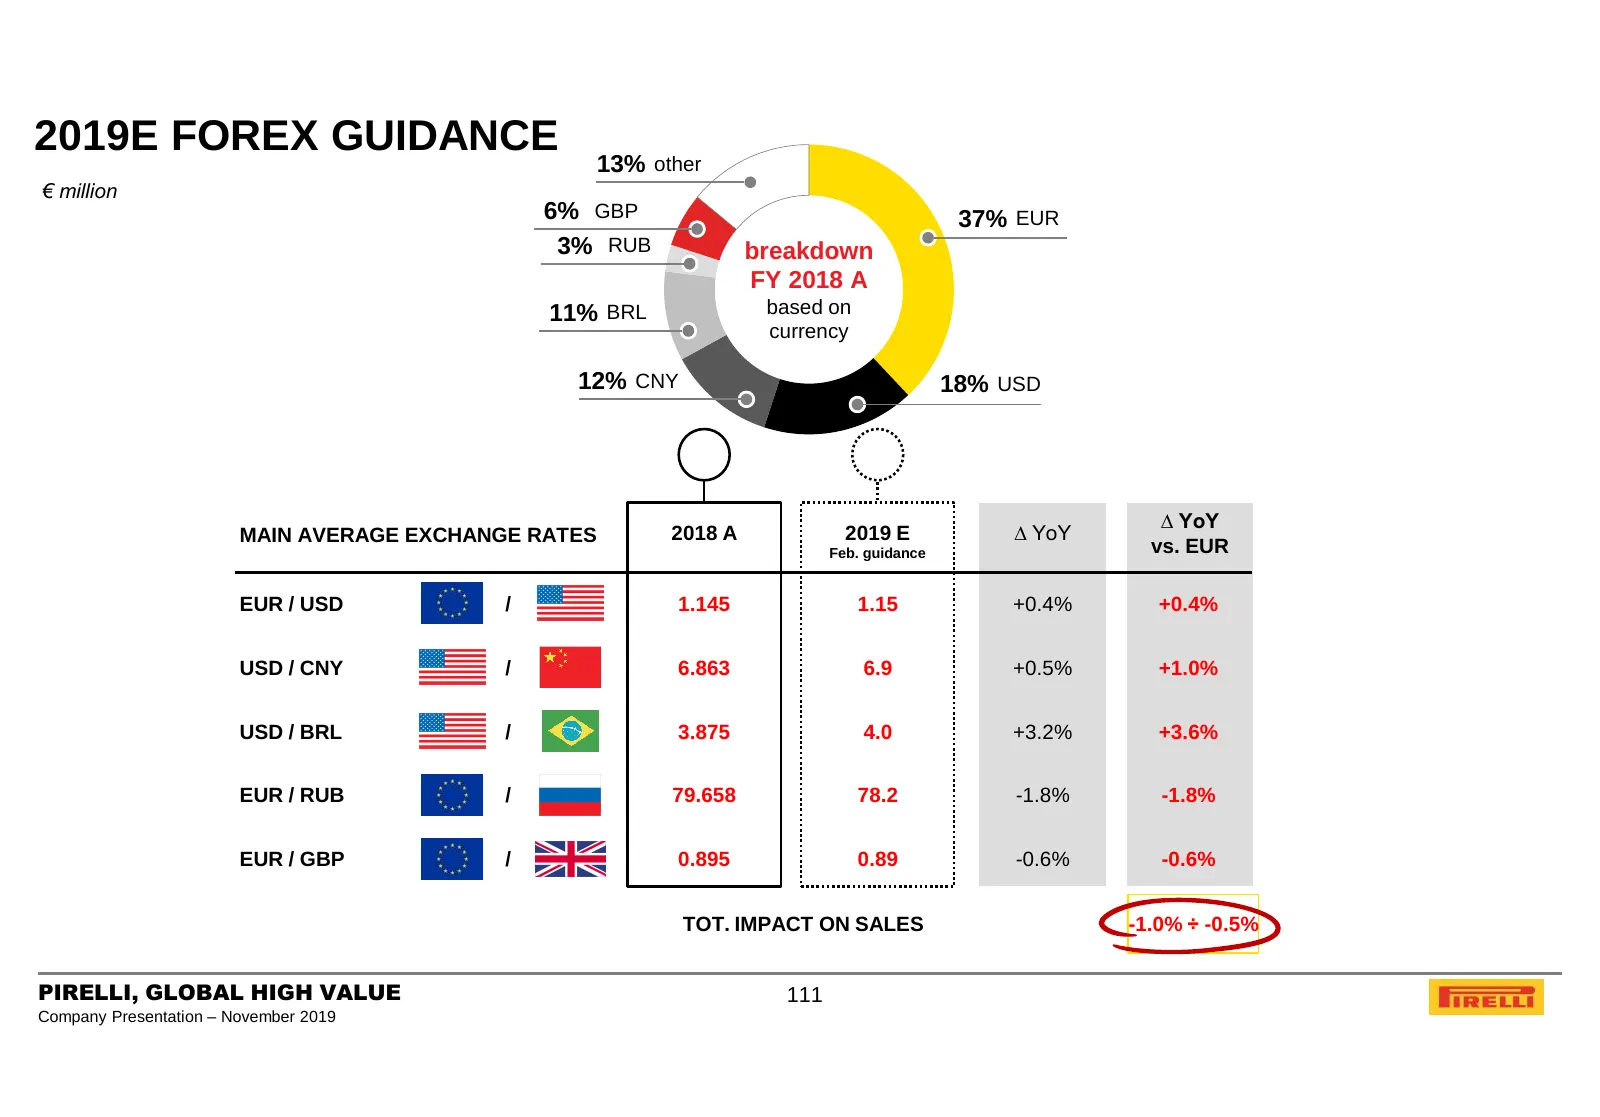
Slide 111: 2019E Forex Guidance
2019E FOREX GUIDANCE 13% other € million 6% GBP 37% EUR 3% RUB breakdown FY 2018 A 11% BRL based on currency 12% CNY 18% USD ∆ YoY MAIN AVERAGE EXCHANGE RATES 2018 A 2019 E ∆ YoY Feb. guidance vs. EUR EUR / USD / 1.145 1.15 +0.4% +0.4% USD / CNY / 6.863 6.9 +0.5% +1.0% USD / BRL / 3.875 4.0 +3.2% +3
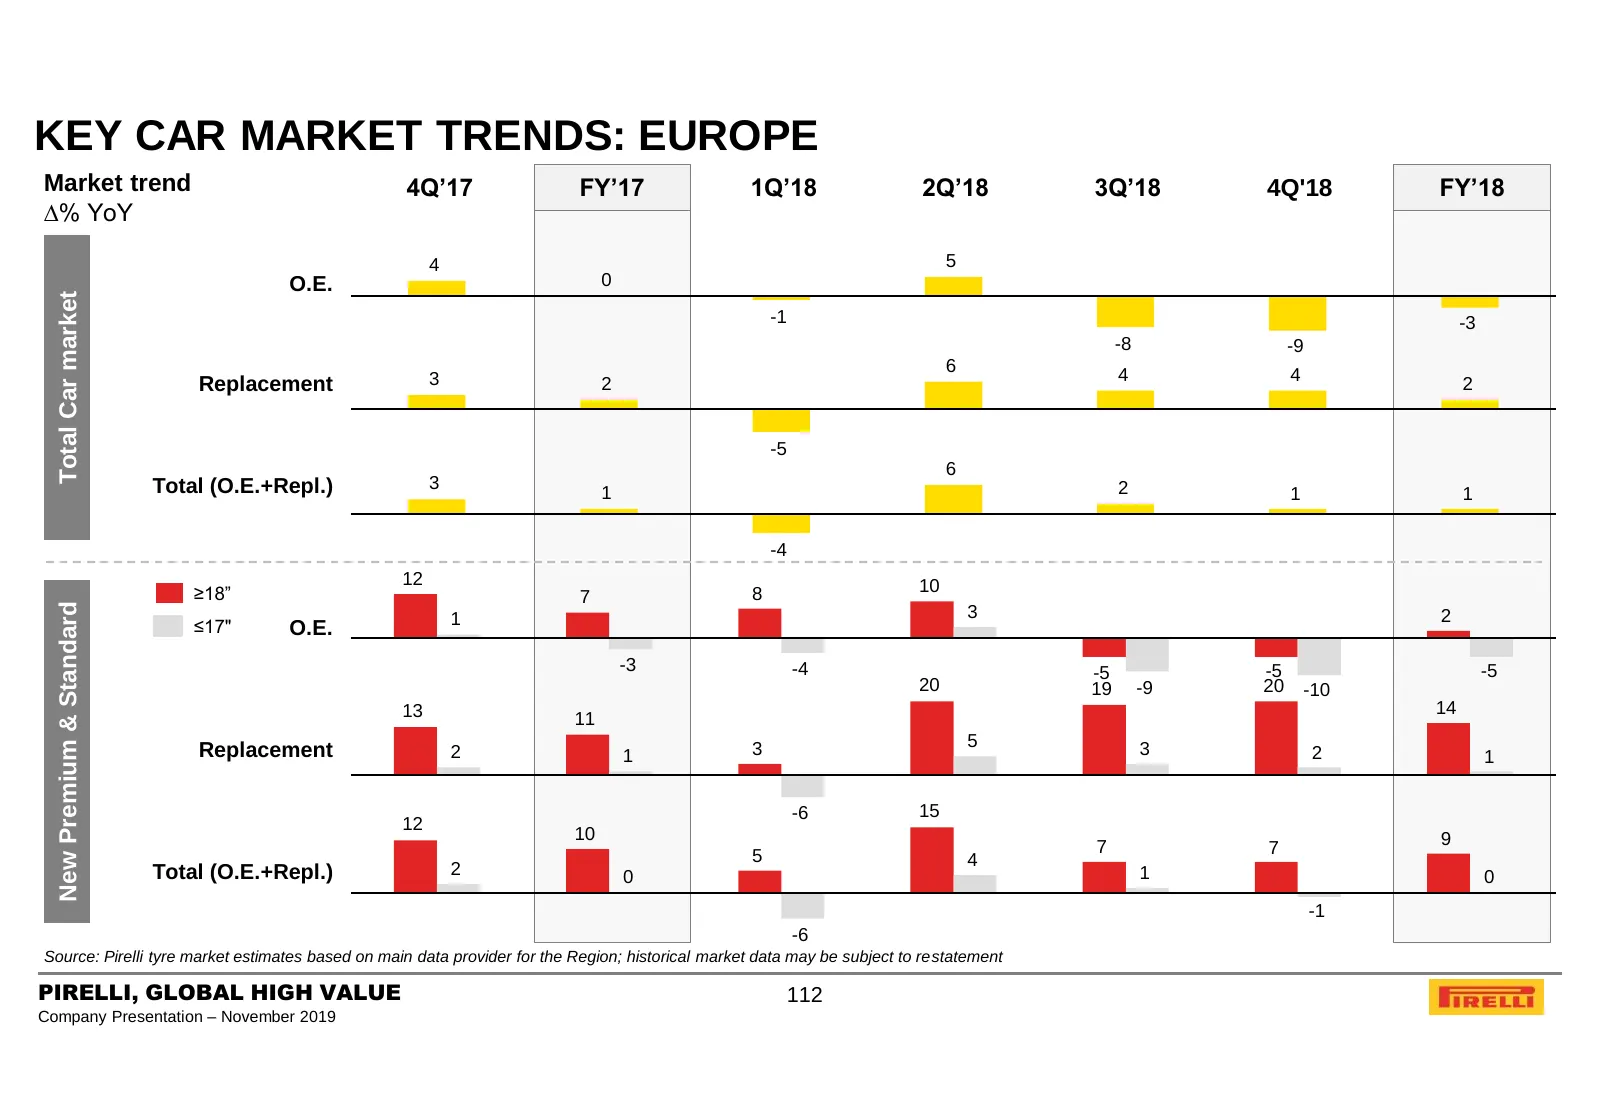
Slide 112: Key Car Market Trends: Europe
KEY CAR MARKET TRENDS: EUROPE Market trend 4Q’17 FY’17 1Q’18 2Q’18 3Q’18 4Q'18 FY’18 ∆% YoY 4 5 O.E. 0 Total Car market -1 -3 -8 -9 6 4 3 4 Replacement 2 2 -5 6 Total (O.E.+Repl.) 3 2 1 1 1 -4 12 10 ≥18” 7 8 New Premium & Standard 1 3 2 ≤17" O.E. -3 -4 -5 -5 -5 20 19 -9 20 -10 13 14 11 3 5 3 Replace
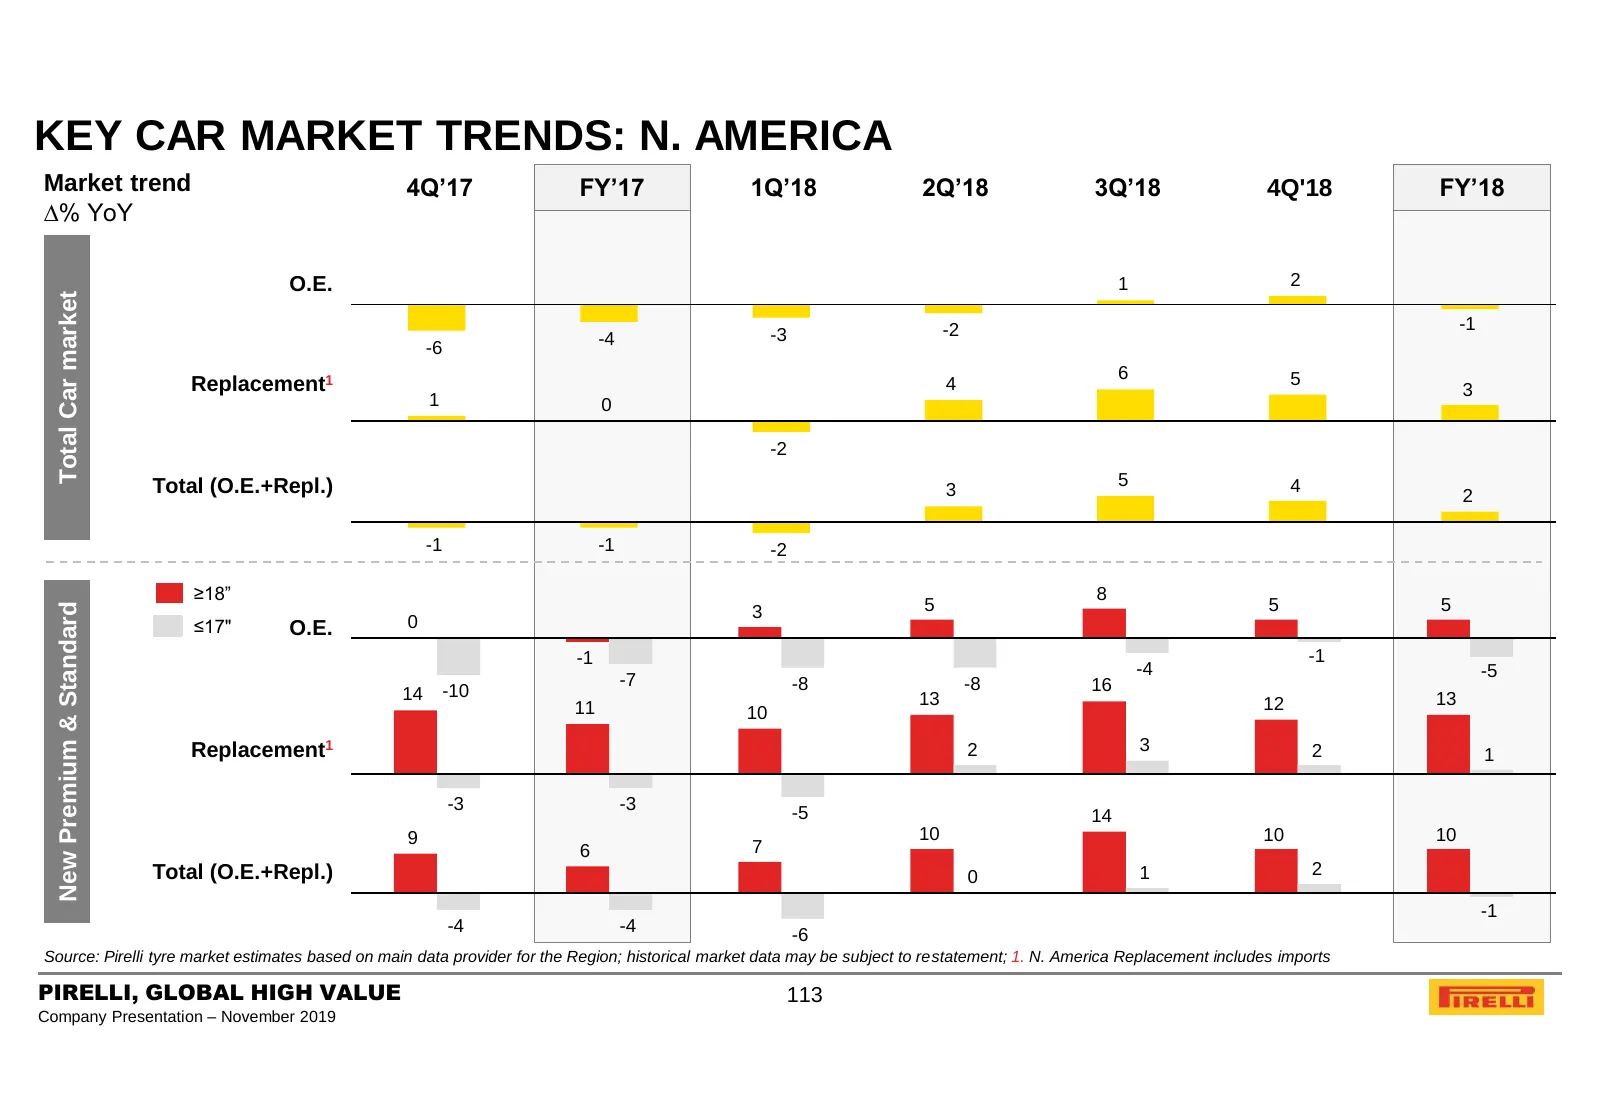
Slide 113: Key Car Market Trends: N. America
KEY CAR MARKET TRENDS: N. AMERICA Market trend 4Q’17 FY’17 1Q’18 2Q’18 3Q’18 4Q'18 FY’18 ∆% YoY O.E. 1 2 Total Car market -2 -1 -4 -3 -6 6 5 Replacement1 4 3 1 0 -2 Total (O.E.+Repl.) 5 4 3 2 -1 -1 -2 ≥18” 8 5 5 5 New Premium & Standard 3 ≤17" O.E. 0 -1 -1 -4 -5 -7 -8 -8 16 14 -10 13 13 11 10 12 Rep
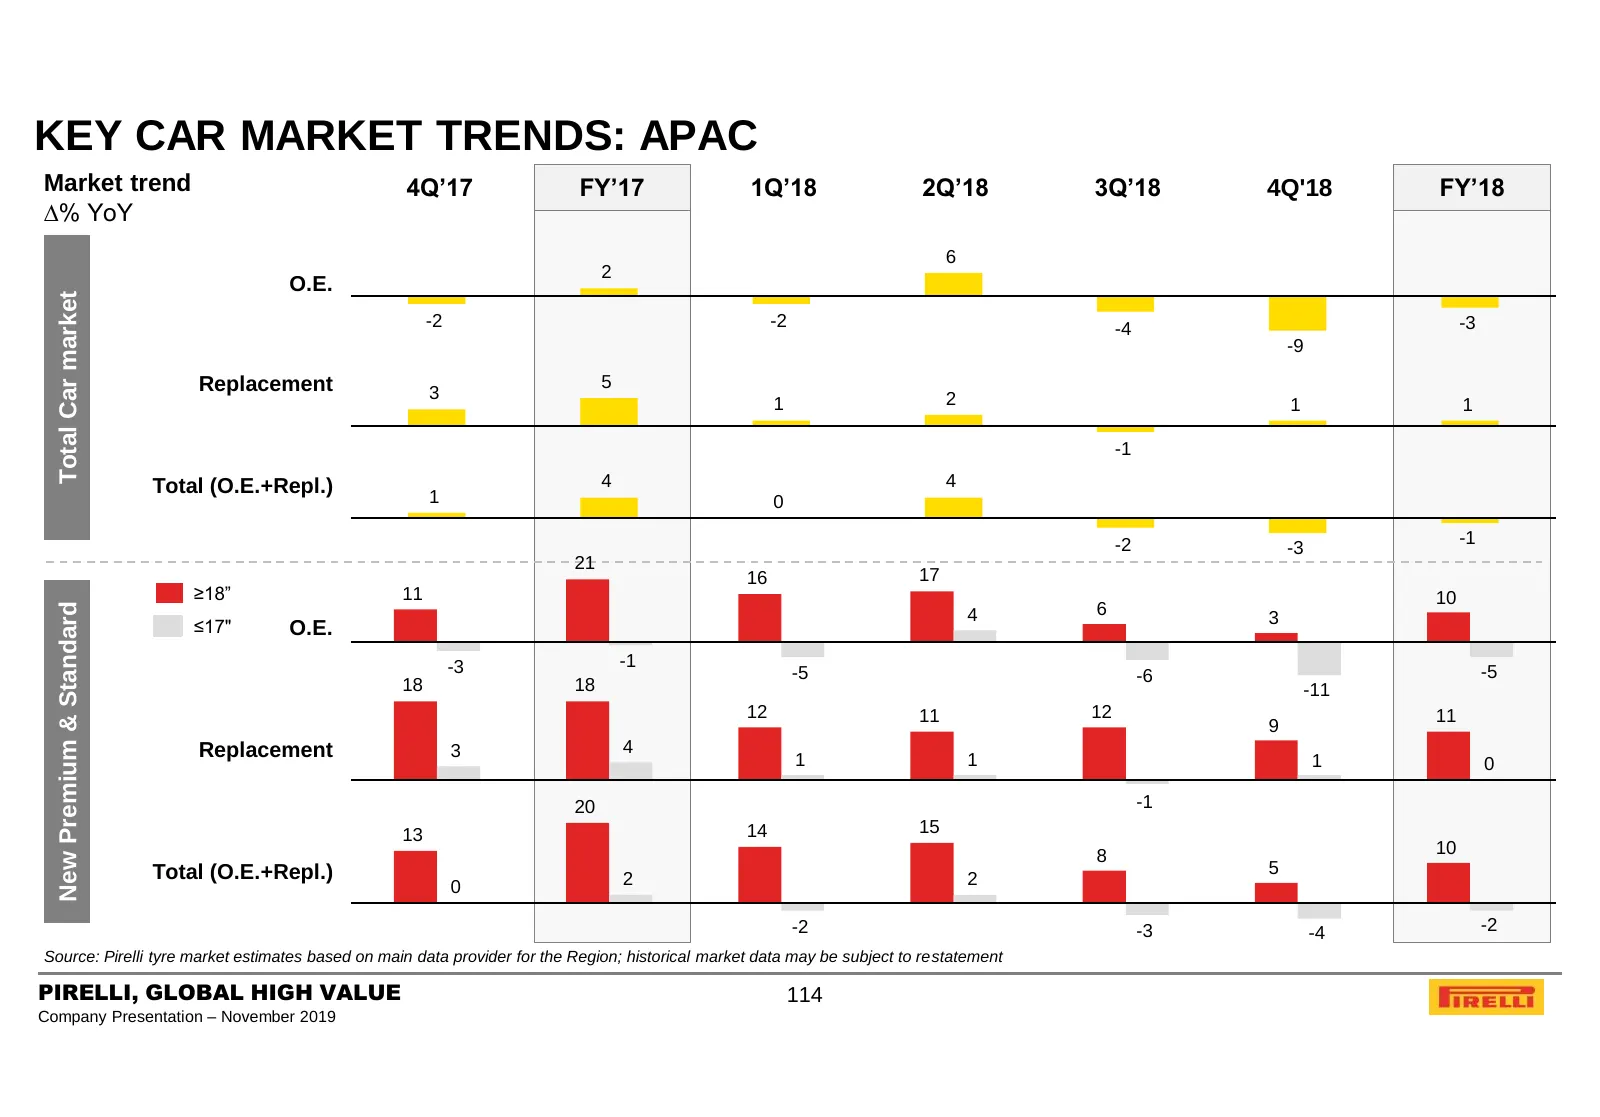
Slide 114: Key Car Market Trends: APAC
KEY CAR MARKET TRENDS: APAC Market trend 4Q’17 FY’17 1Q’18 2Q’18 3Q’18 4Q'18 FY’18 ∆% YoY 6 2 O.E. Total Car market -2 -2 -4 -3 -9 Replacement 5 3 2 1 1 1 -1 Total (O.E.+Repl.) 4 4 1 0 -2 -1 -3 21 16 17 ≥18” 11 10 New Premium & Standard 4 6 ≤17" 3 O.E. -3 -1 -5 -6 -5 18 18 -11 12 11 12 11 9 Replacem
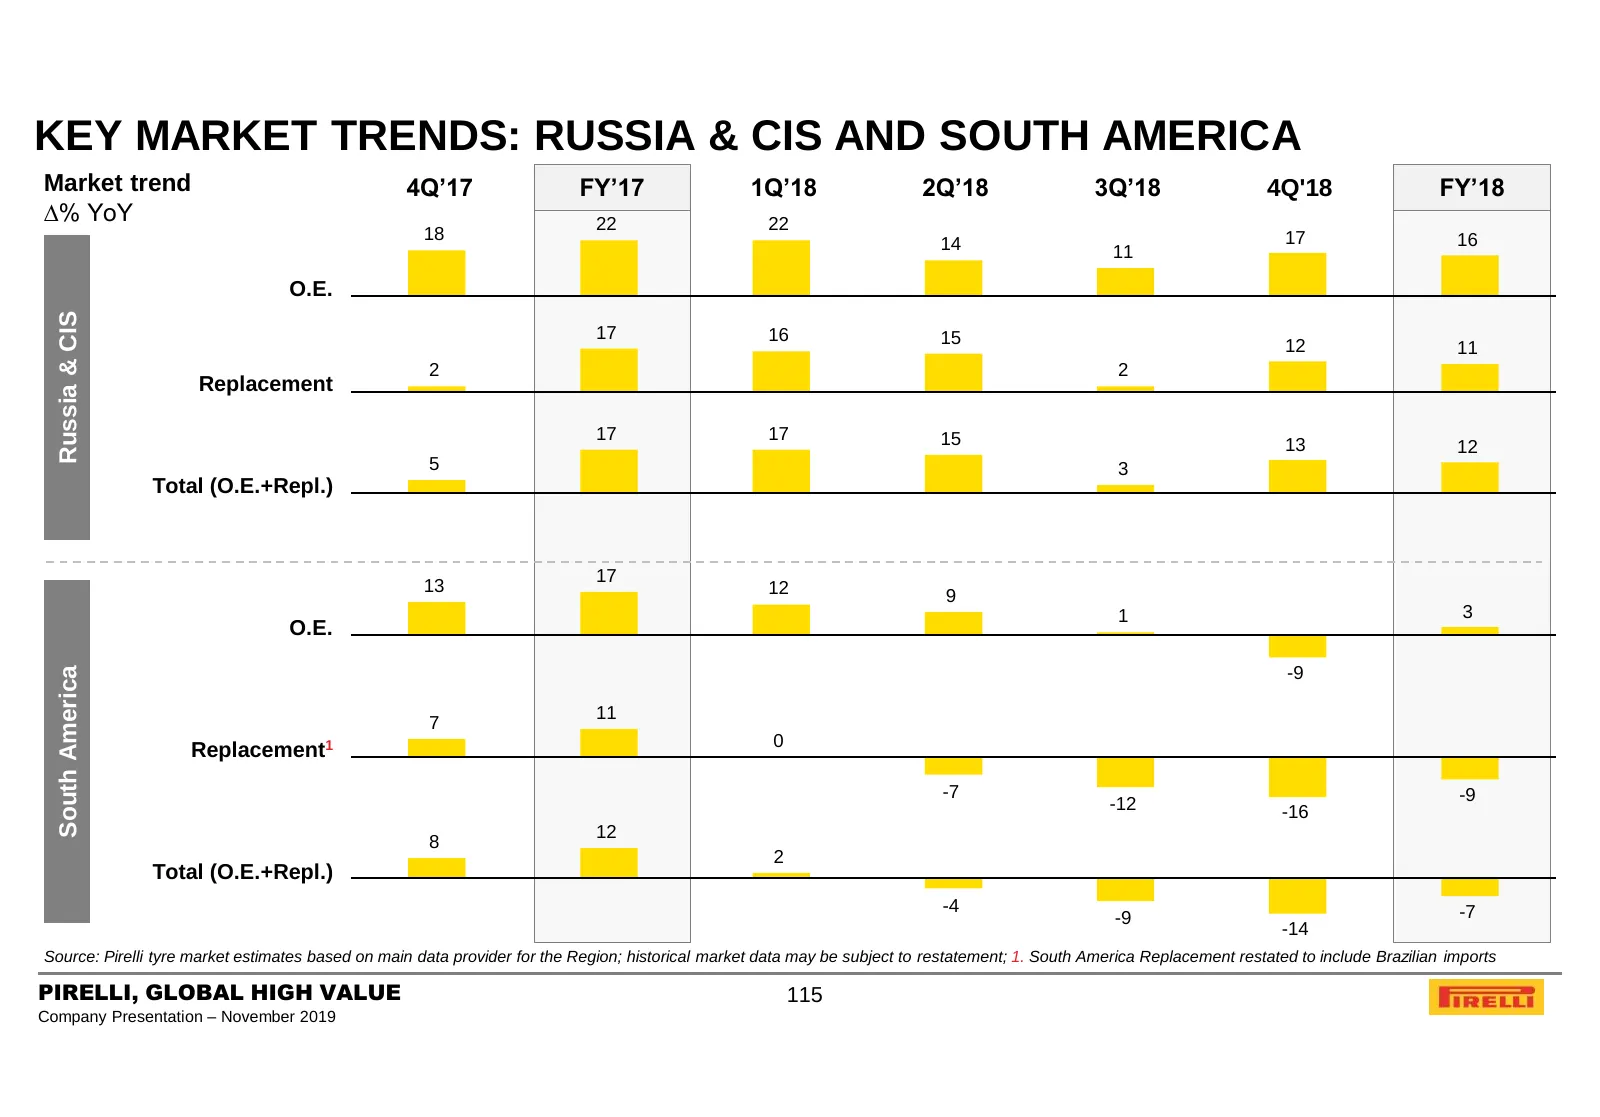
Slide 115: Key Market Trends: Russia & CIS and South America
KEY MARKET TRENDS: RUSSIA & CIS AND SOUTH AMERICA Market trend 4Q’17 FY’17 1Q’18 2Q’18 3Q’18 4Q'18 FY’18 ∆% YoY 22 22 18 17 16 14 11 O.E. Russia & CIS 17 16 15 12 11 2 2 Replacement 17 17 15 13 12 5 3 Total (O.E.+Repl.) 17 13 12 9 1 3 O.E. South America -9 11 7 0 Replacement1 -7 -9 -12 -16 12 8 2 To
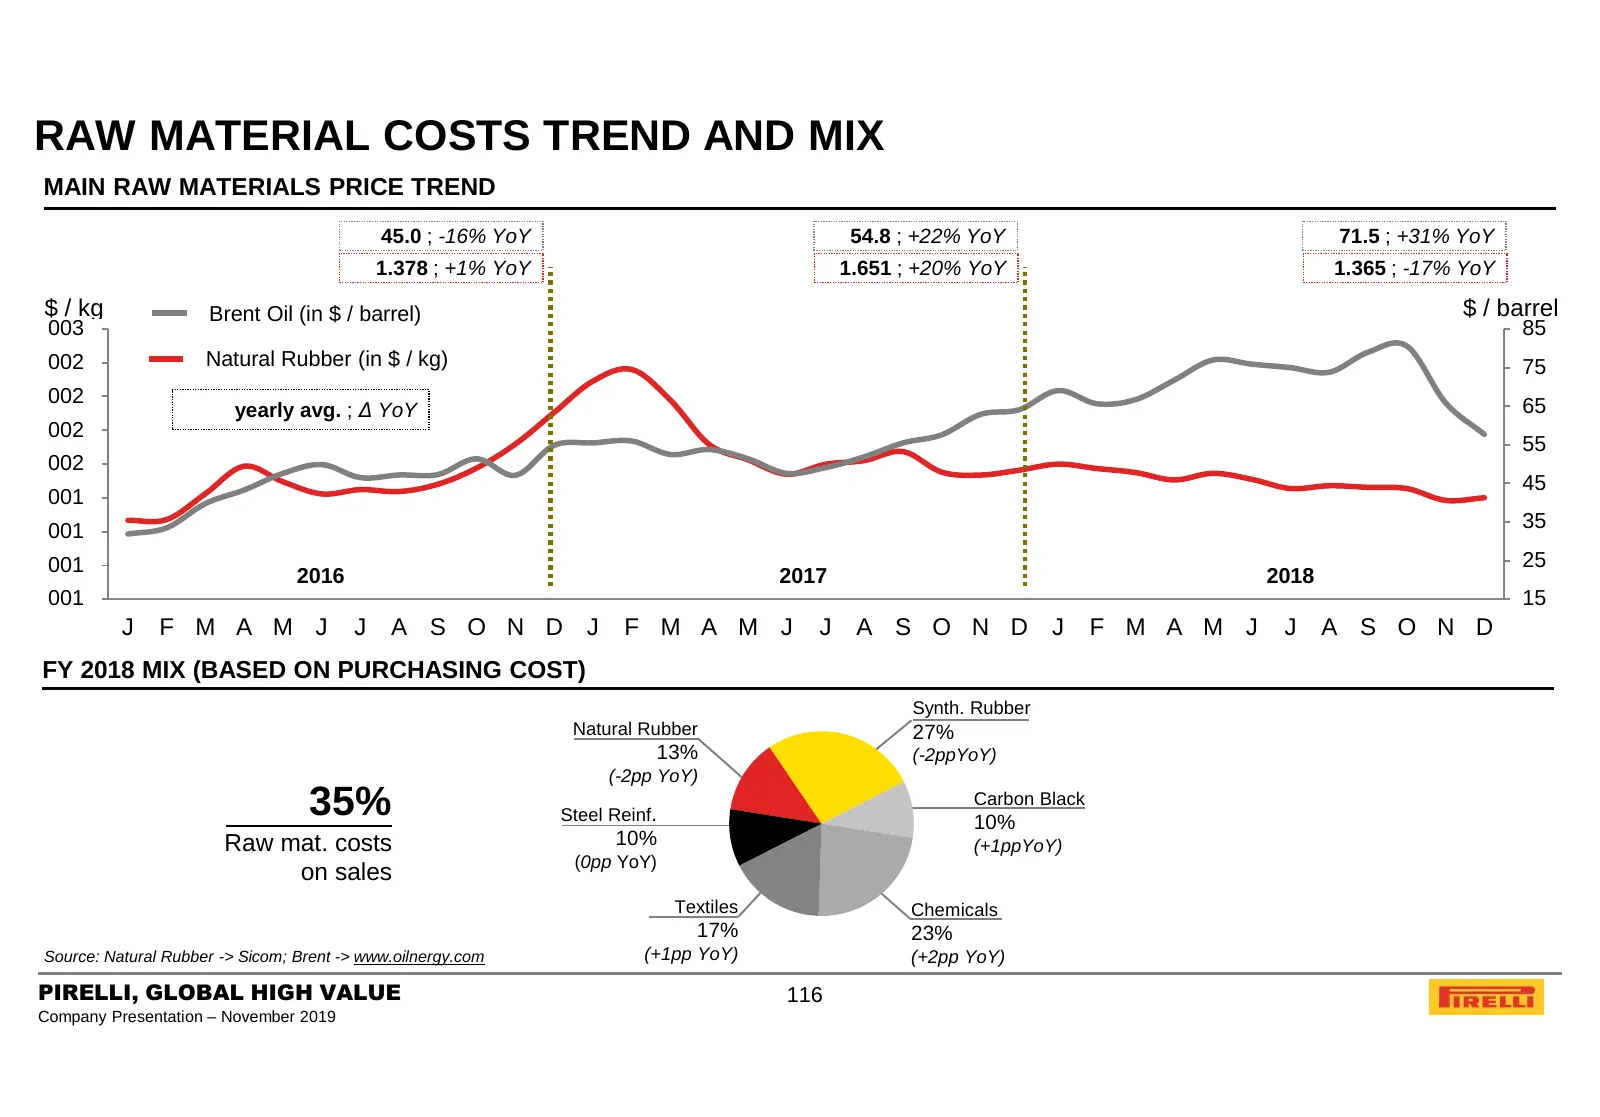
Slide 116: Raw Material Costs Trend and Mix
RAW MATERIAL COSTS TREND AND MIX MAIN RAW MATERIALS PRICE TREND 45.0 ; -16% YoY 54.8 ; +22% YoY 71.5 ; +31% YoY 1.378 ; +1% YoY 1.651 ; +20% YoY 1.365 ; -17% YoY $ / kg Brent Oil (in $ / barrel) $ / barrel 003 85 002 Natural Rubber (in $ / kg) 75 002 65 yearly avg. ; Δ YoY 002 55 002 45 001 001 35 0
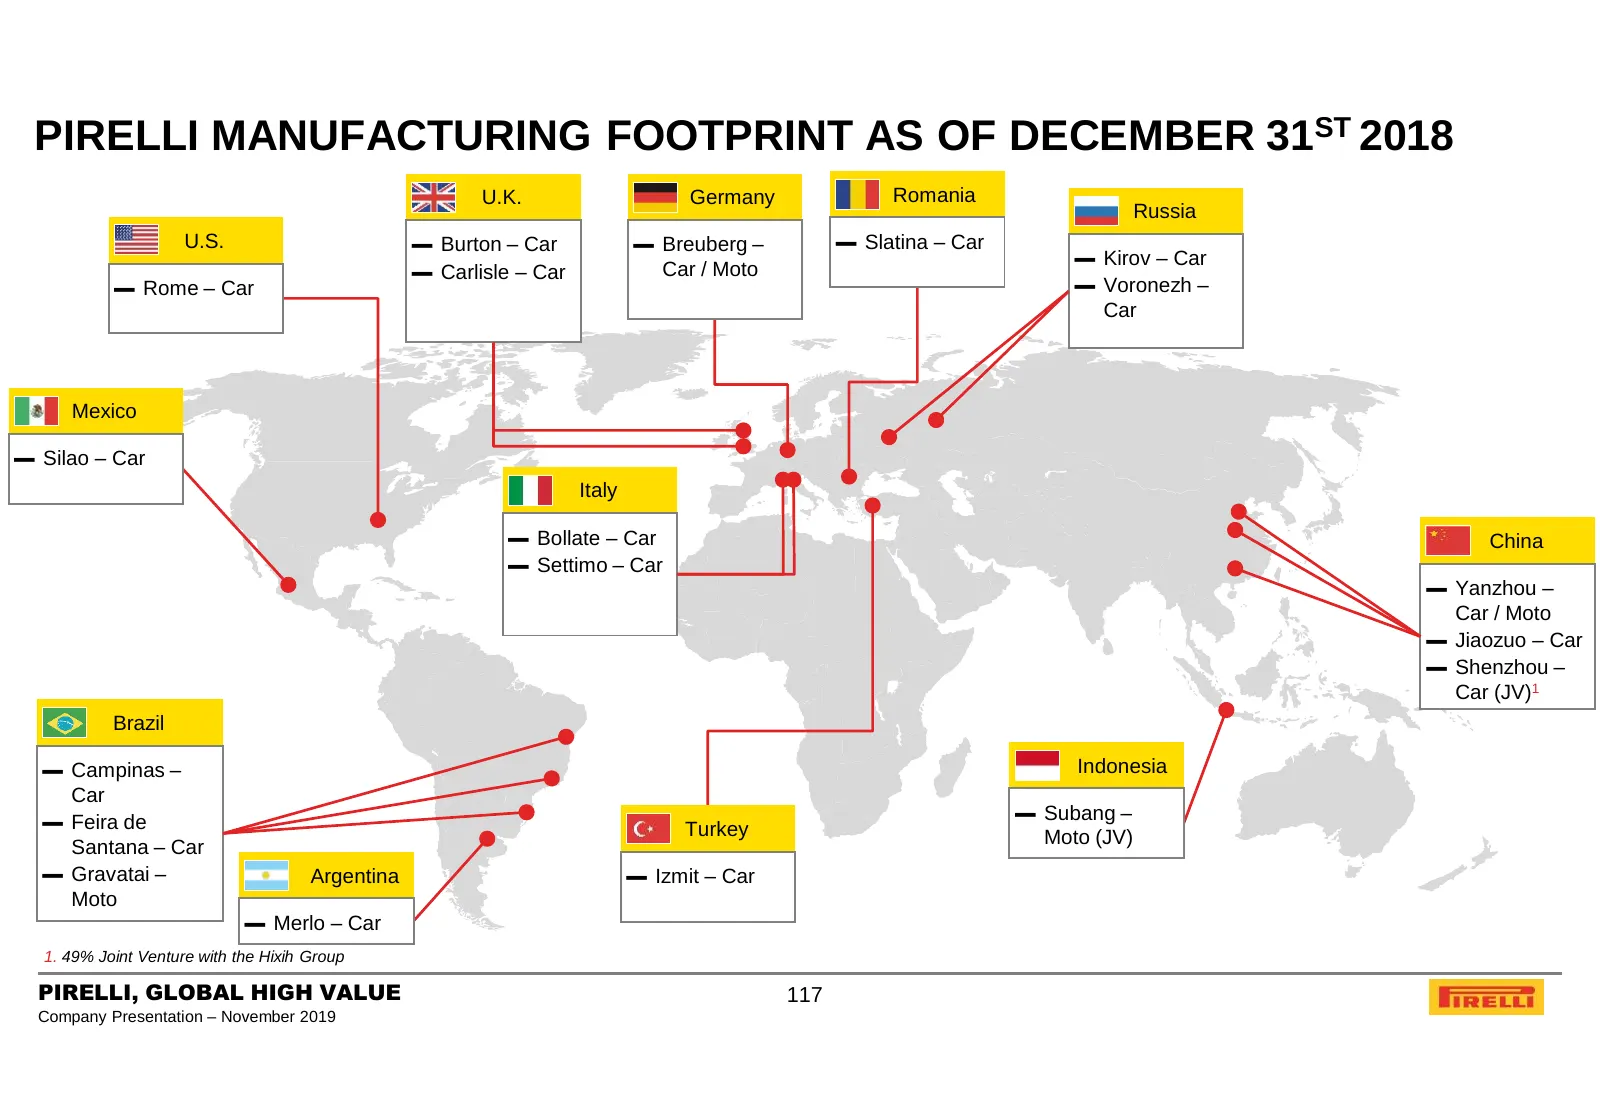
Slide 117: Manufacturing Footprint as of December 31st 2018
PIRELLI MANUFACTURING FOOTPRINT AS OF DECEMBER 31ST 2018 U.K. Germany Romania Russia U.S. ▬ Burton – Car ▬ Breuberg – ▬ Slatina – Car ▬ Kirov – Car ▬ Carlisle – Car Car / Moto ▬ Rome – Car ▬ Voronezh – Car Mexico ▬ Silao – Car Italy ▬ Bollate – Car China ▬ Settimo – Car ▬ Yanzhou – Car / Moto ▬ Jiao
Slide 118: Agenda
AGENDA 1. PIRELLI AT A GLANCE 2. BUSINESS MODEL 3. KEY INVESTMENT HIGHLIGHTS 4. MARKET AND COMPETITION 5. 9M 2019 FINANCIAL RESULTS AND 2019 OUTLOOK 6. FY 2018 FINANCIAL RESULTS AND 2019 OUTLOOK 7. GOVERNANCE 8. SUSTAINABILITY 9. APPENDIX PIRELLI, GLOBAL HIGH VALUE 118 Company Presentation – Novembe
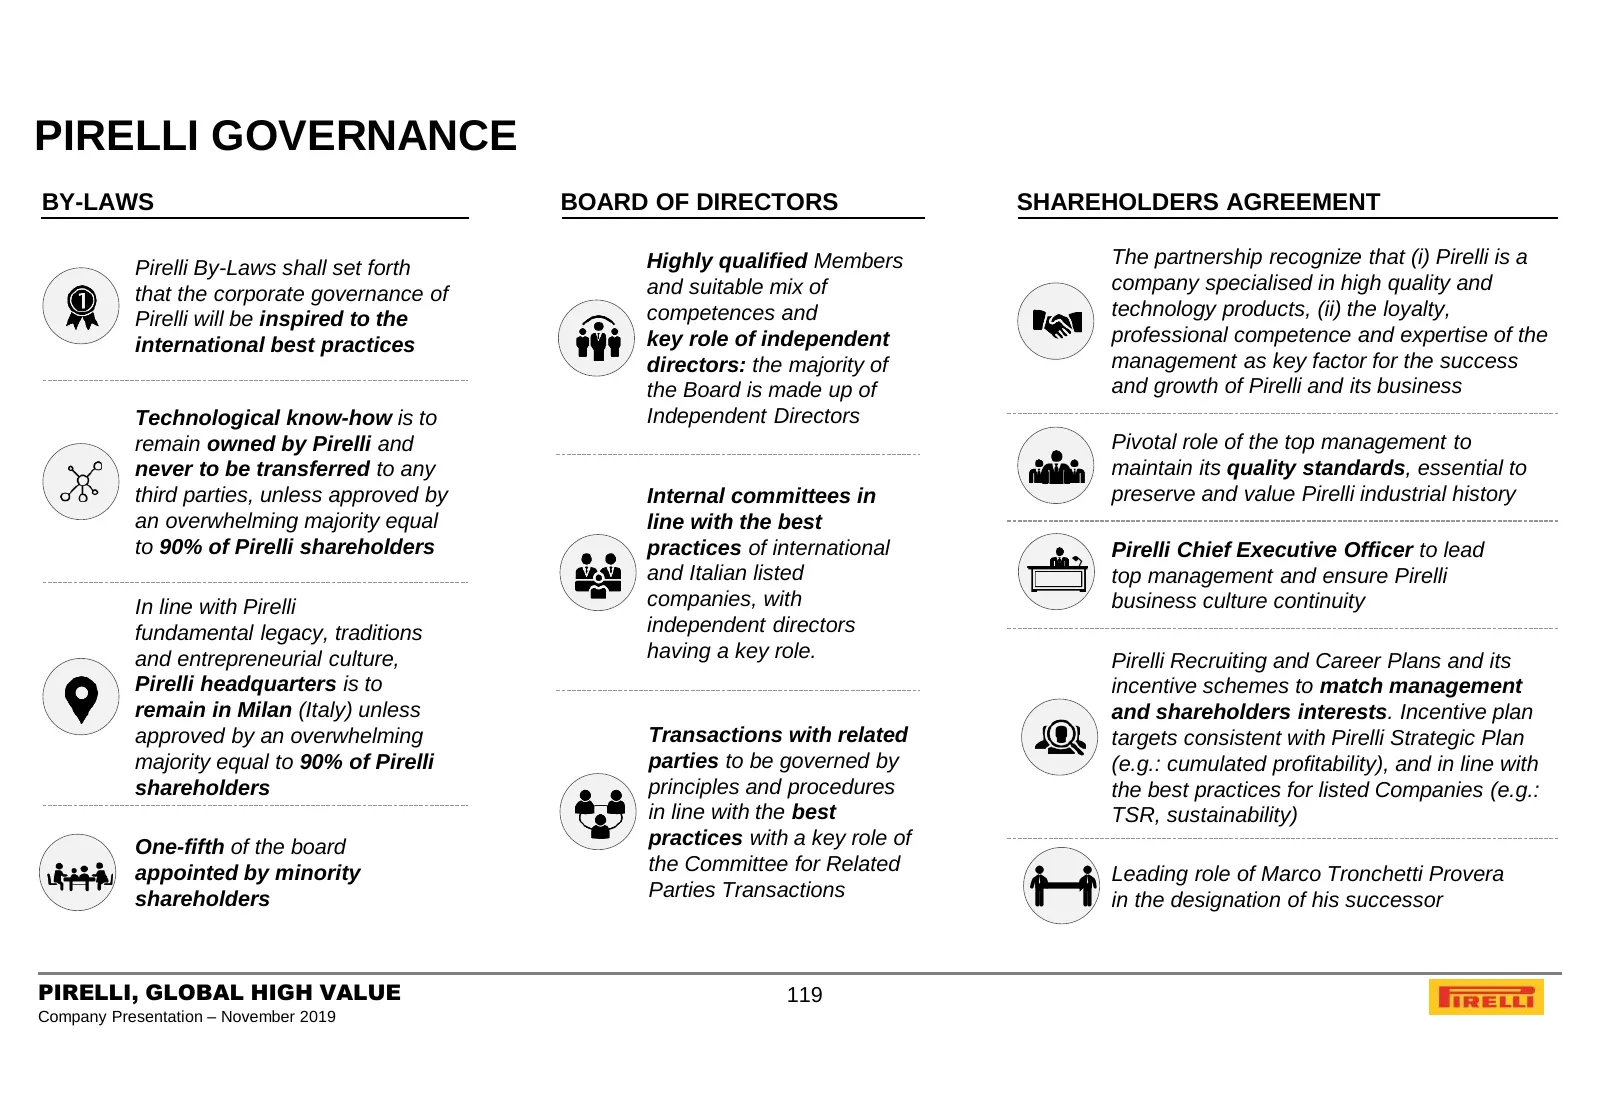
Slide 119: Pirelli Governance
PIRELLI GOVERNANCE BY-LAWS BOARD OF DIRECTORS SHAREHOLDERS AGREEMENT Pirelli By-Laws shall set forth Highly qualified Members The partnership recognize that (i) Pirelli is a that the corporate governance of and suitable mix of company specialised in high quality and Pirelli will be inspired to the c
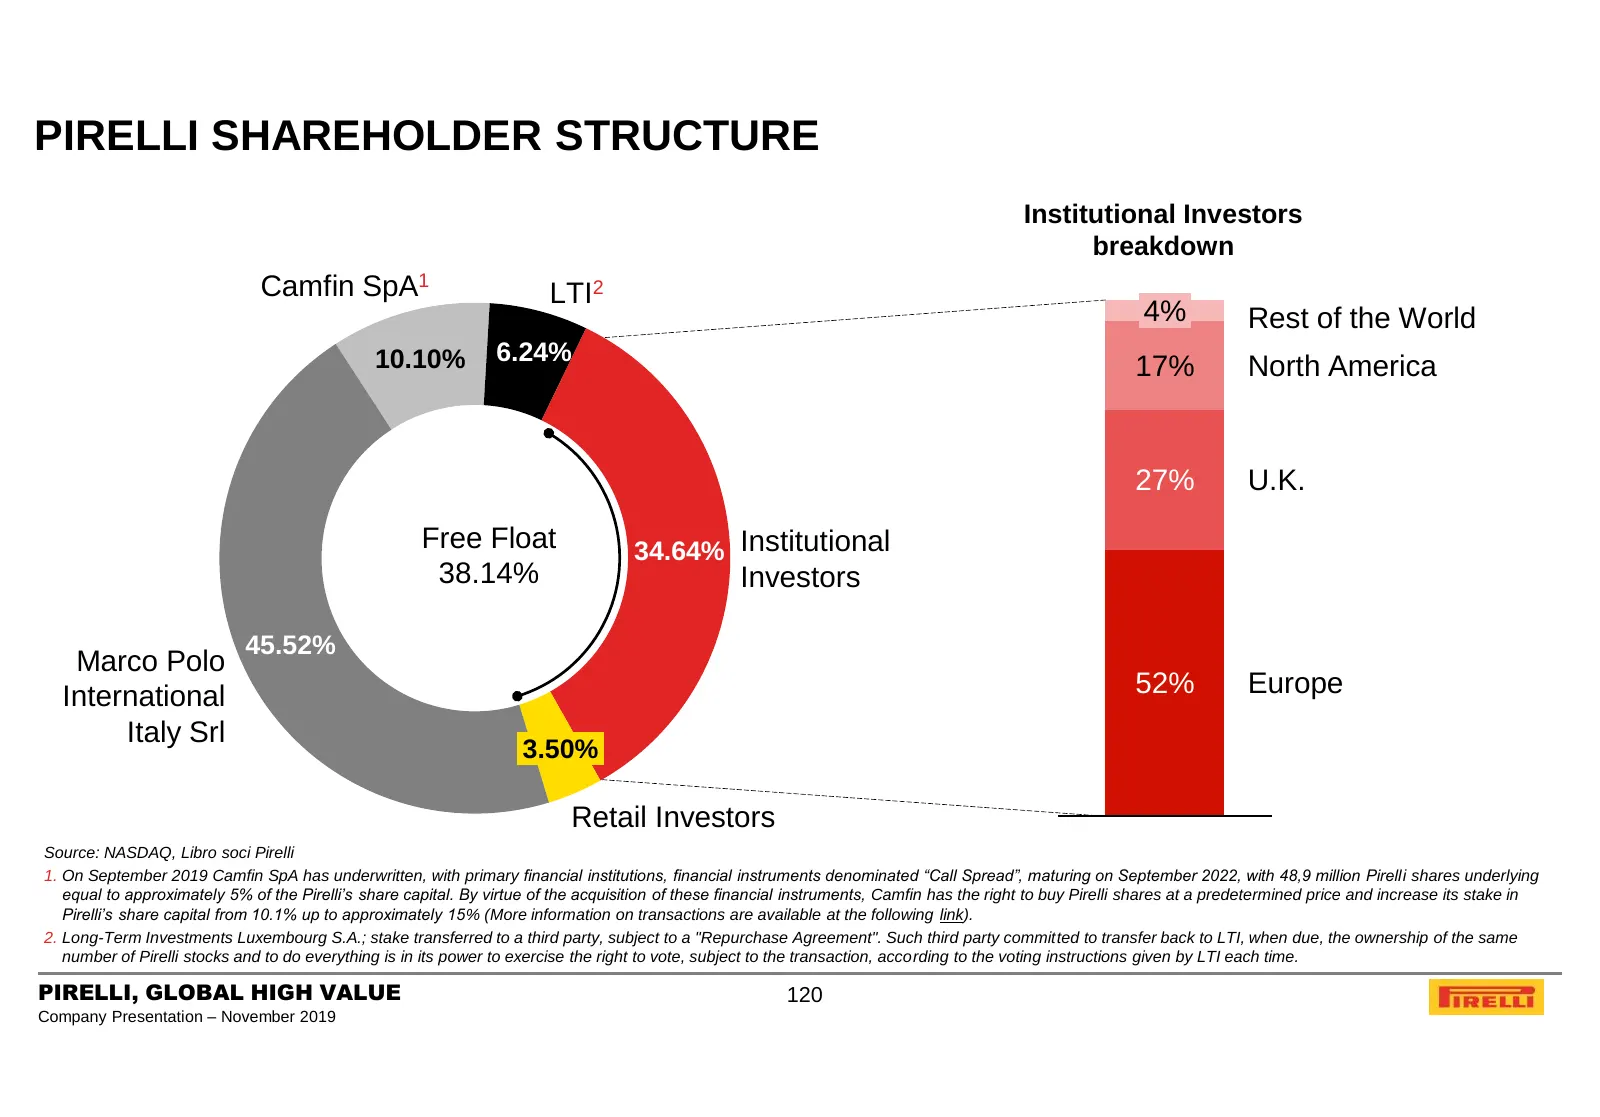
Slide 120: Pirelli Shareholder Structure
PIRELLI SHAREHOLDER STRUCTURE Institutional Investors breakdown Camfin SpA1 LTI2 4% Rest of the World 10.10% 6.24% 17% North America 27% U.K. Free Float 34.64% Institutional 38.14% Investors 45.52% Marco Polo International 52% Europe Italy Srl 3.50% Retail Investors Source: NASDAQ, Libro soci Pirell
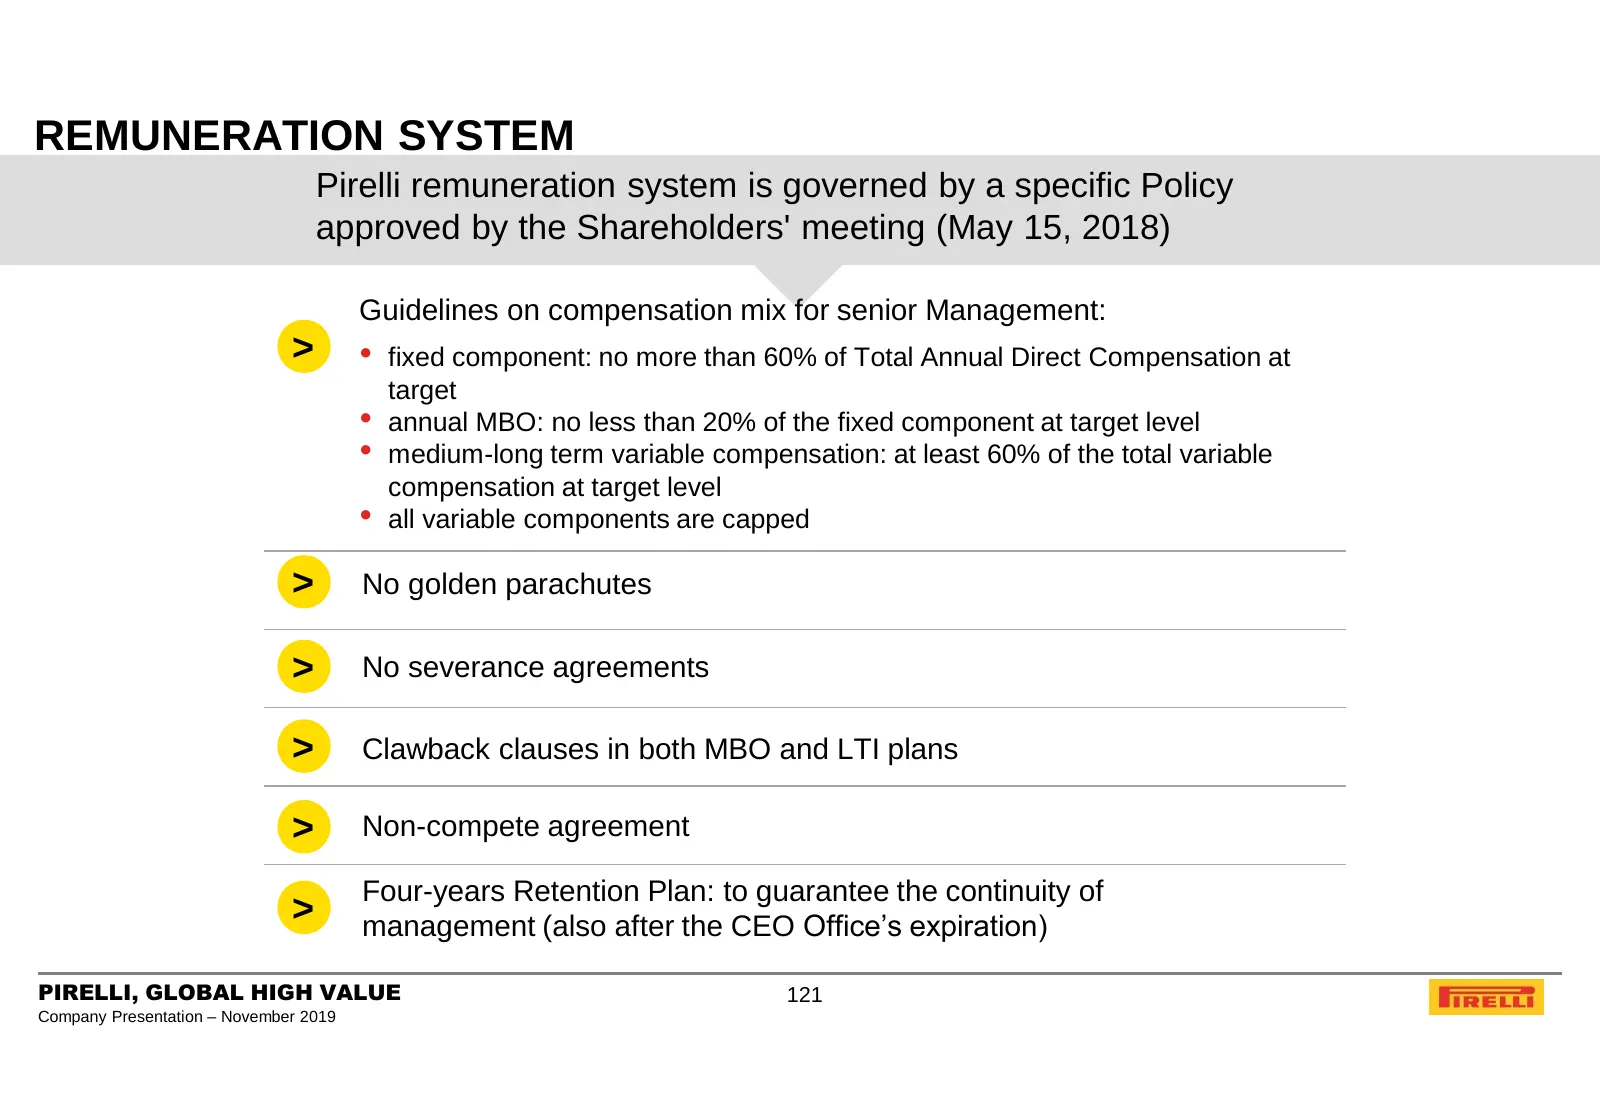
Slide 121: Remuneration System
REMUNERATION SYSTEM Pirelli remuneration system is governed by a specific Policy approved by the Shareholders' meeting (May 15, 2018) Guidelines on compensation mix for senior Management: > • fixed component: no more than 60% of Total Annual Direct Compensation at target • annual MBO: no less than 2
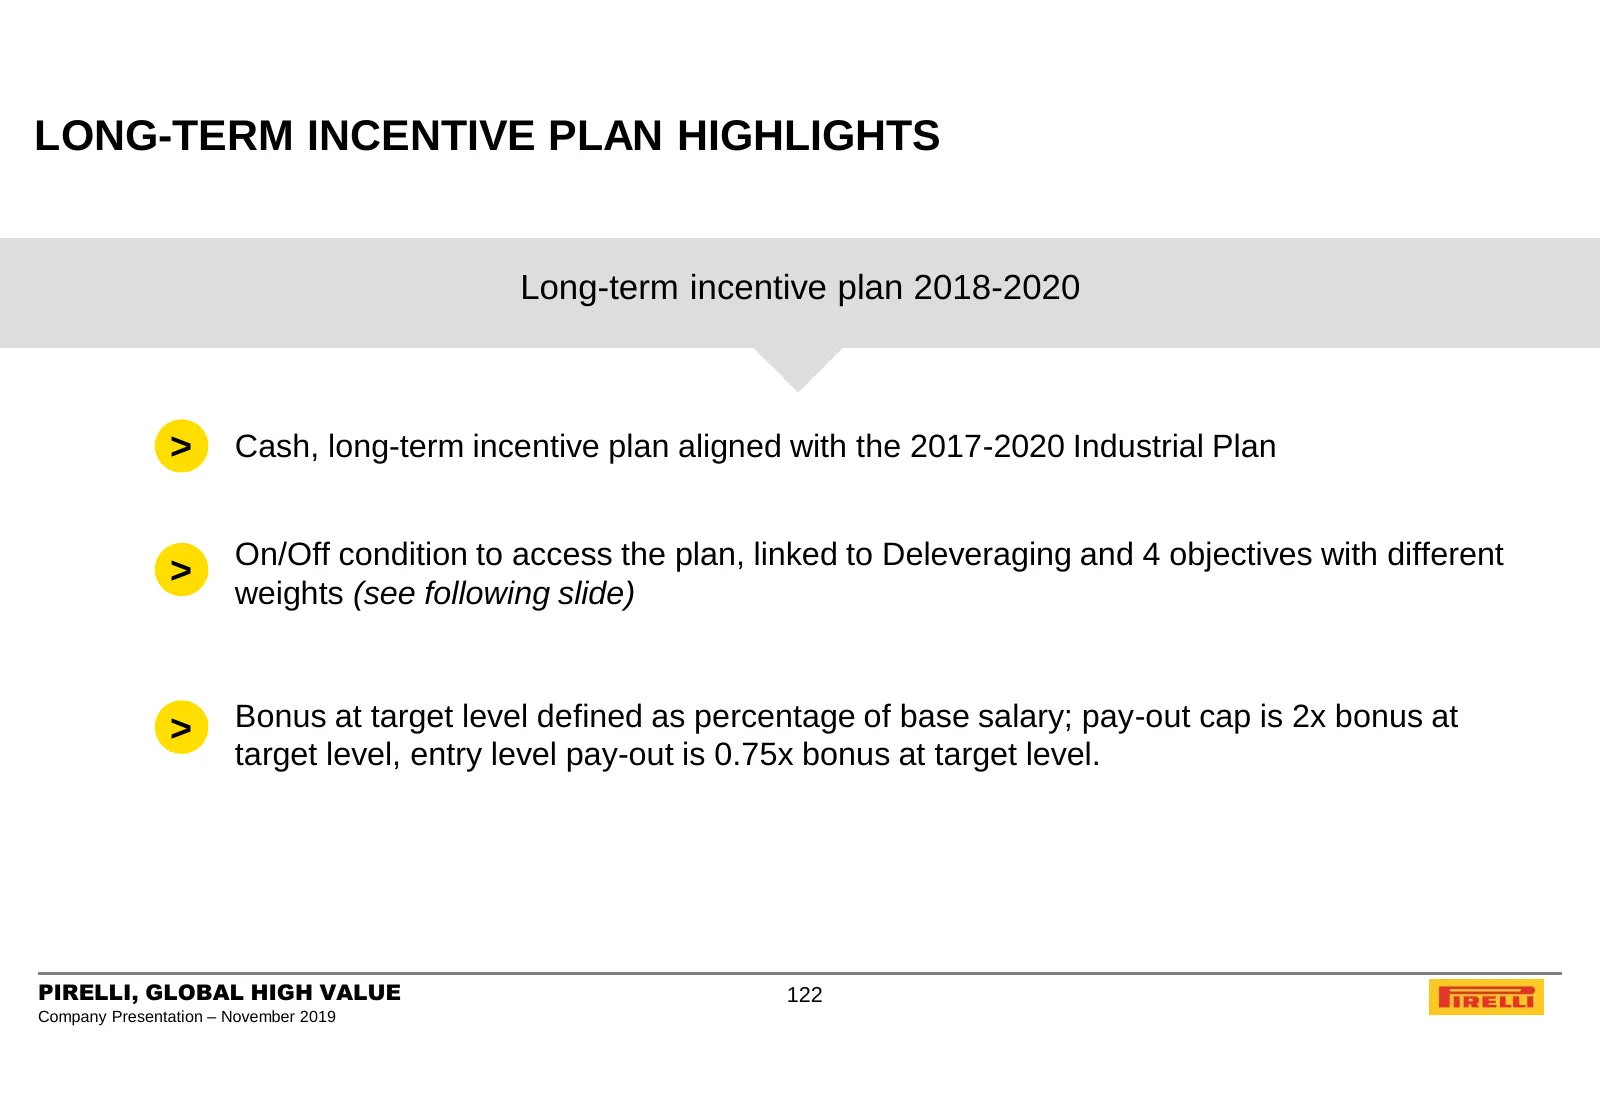
Slide 122: Long-Term Incentive Plan Highlights
LONG-TERM INCENTIVE PLAN HIGHLIGHTS Long-term incentive plan 2018-2020 > Cash, long-term incentive plan aligned with the 2017-2020 Industrial Plan On/Off condition to access the plan, linked to Deleveraging and 4 objectives with different > weights (see following slide) > Bonus at target level defin
Slide 123: Long-Term Incentive Plan Objectives
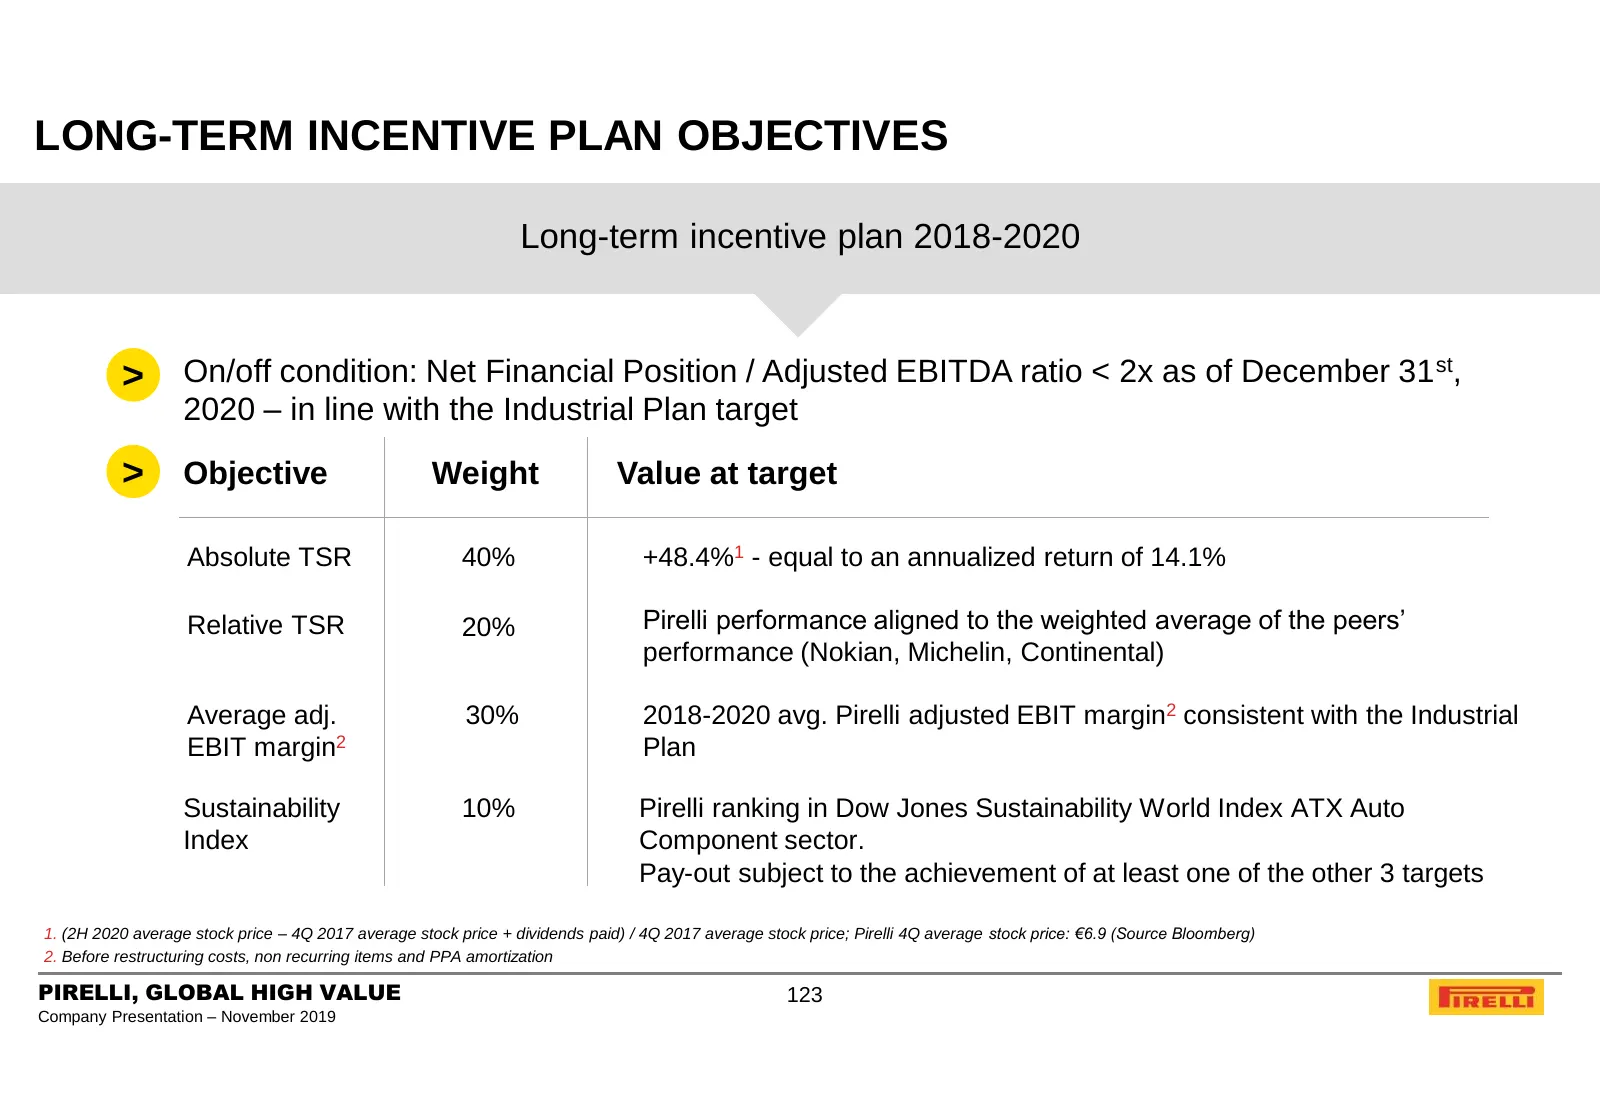
LONG-TERM INCENTIVE PLAN OBJECTIVES Long-term incentive plan 2018-2020 > On/off condition: Net Financial Position / Adjusted EBITDA ratio < 2x as of December 31 st, 2020 – in line with the Industrial Plan target > Objective Weight Value at target Absolute TSR 40% +48.4%1 - equal to an annualized ret
Slide 124: Agenda
AGENDA 1. PIRELLI AT A GLANCE 2. BUSINESS MODEL 3. KEY INVESTMENT HIGHLIGHTS 4. MARKET AND COMPETITION 5. 9M 2019 FINANCIAL RESULTS AND 2019 OUTLOOK 6. FY 2018 FINANCIAL RESULTS AND 2019 OUTLOOK 7. GOVERNANCE 8. SUSTAINABILITY 9. APPENDIX PIRELLI, GLOBAL HIGH VALUE 124 Company Presentation – Novembe
Slide 125: Agenda – Sustainability
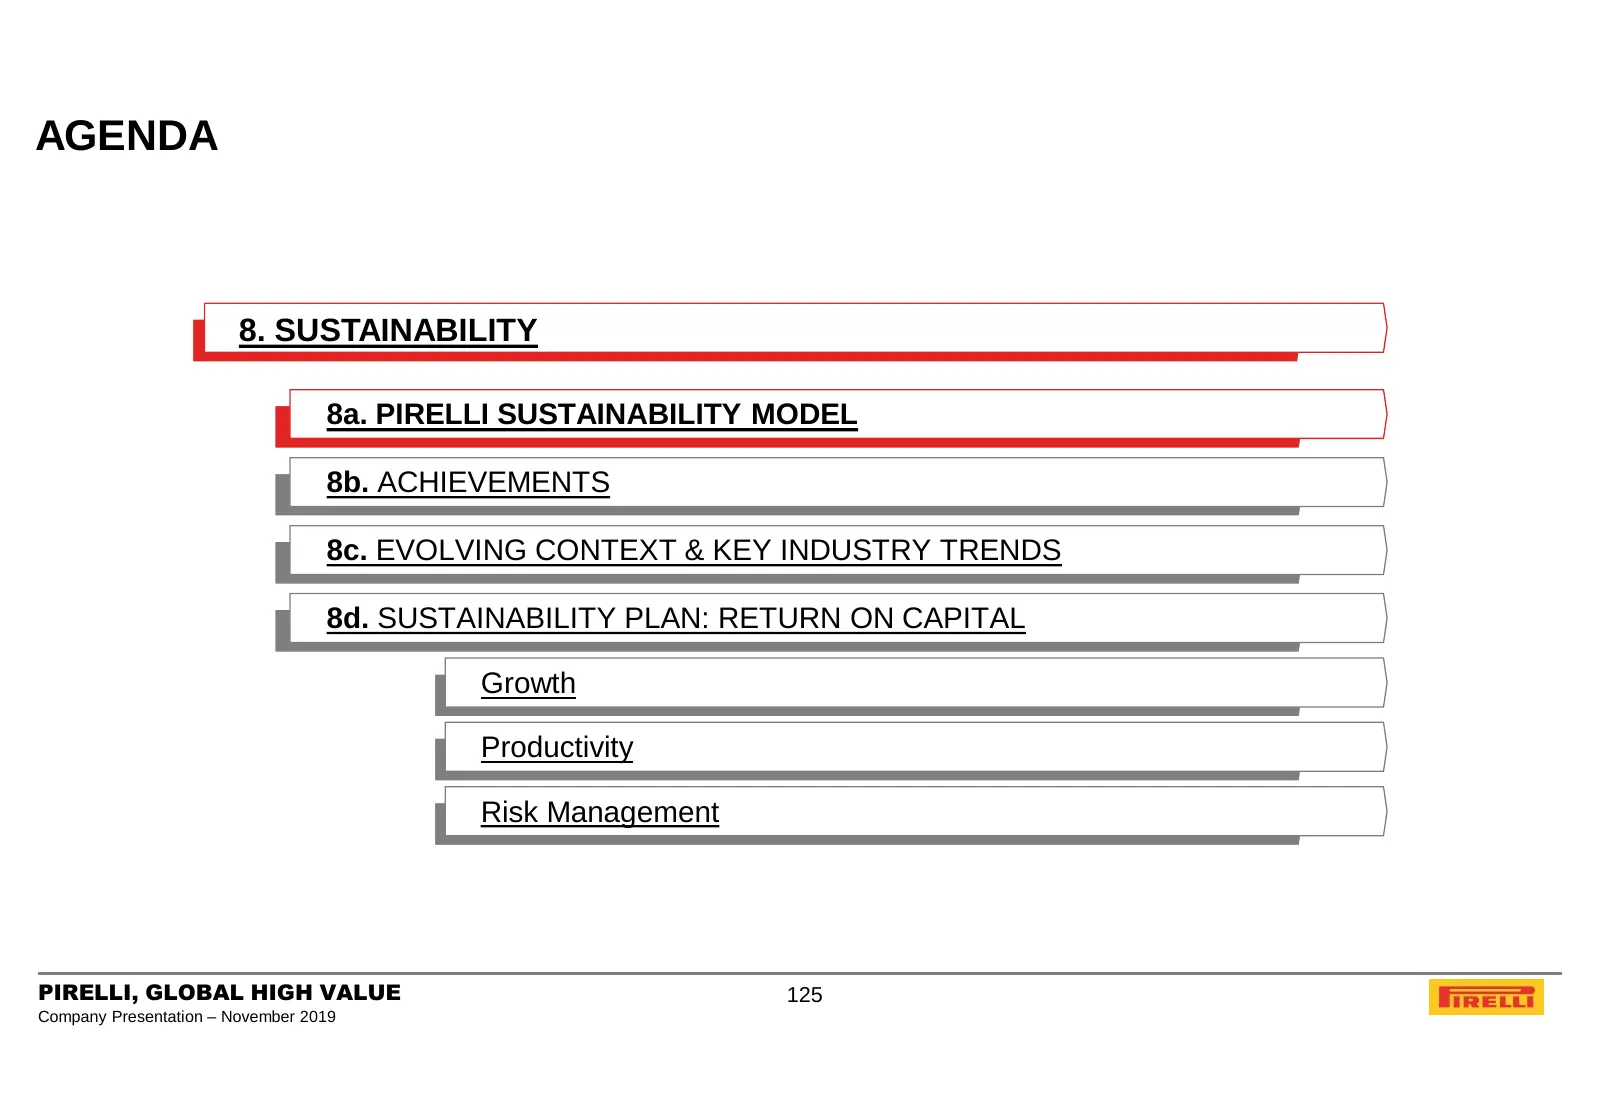
AGENDA 8. SUSTAINABILITY 8a. PIRELLI SUSTAINABILITY MODEL 8b. ACHIEVEMENTS 8c. EVOLVING CONTEXT & KEY INDUSTRY TRENDS 8d. SUSTAINABILITY PLAN: RETURN ON CAPITAL Growth Productivity Risk Management PIRELLI, GLOBAL HIGH VALUE 125 Company Presentation – November 2019
Slide 126: Pirelli Sustainability Model
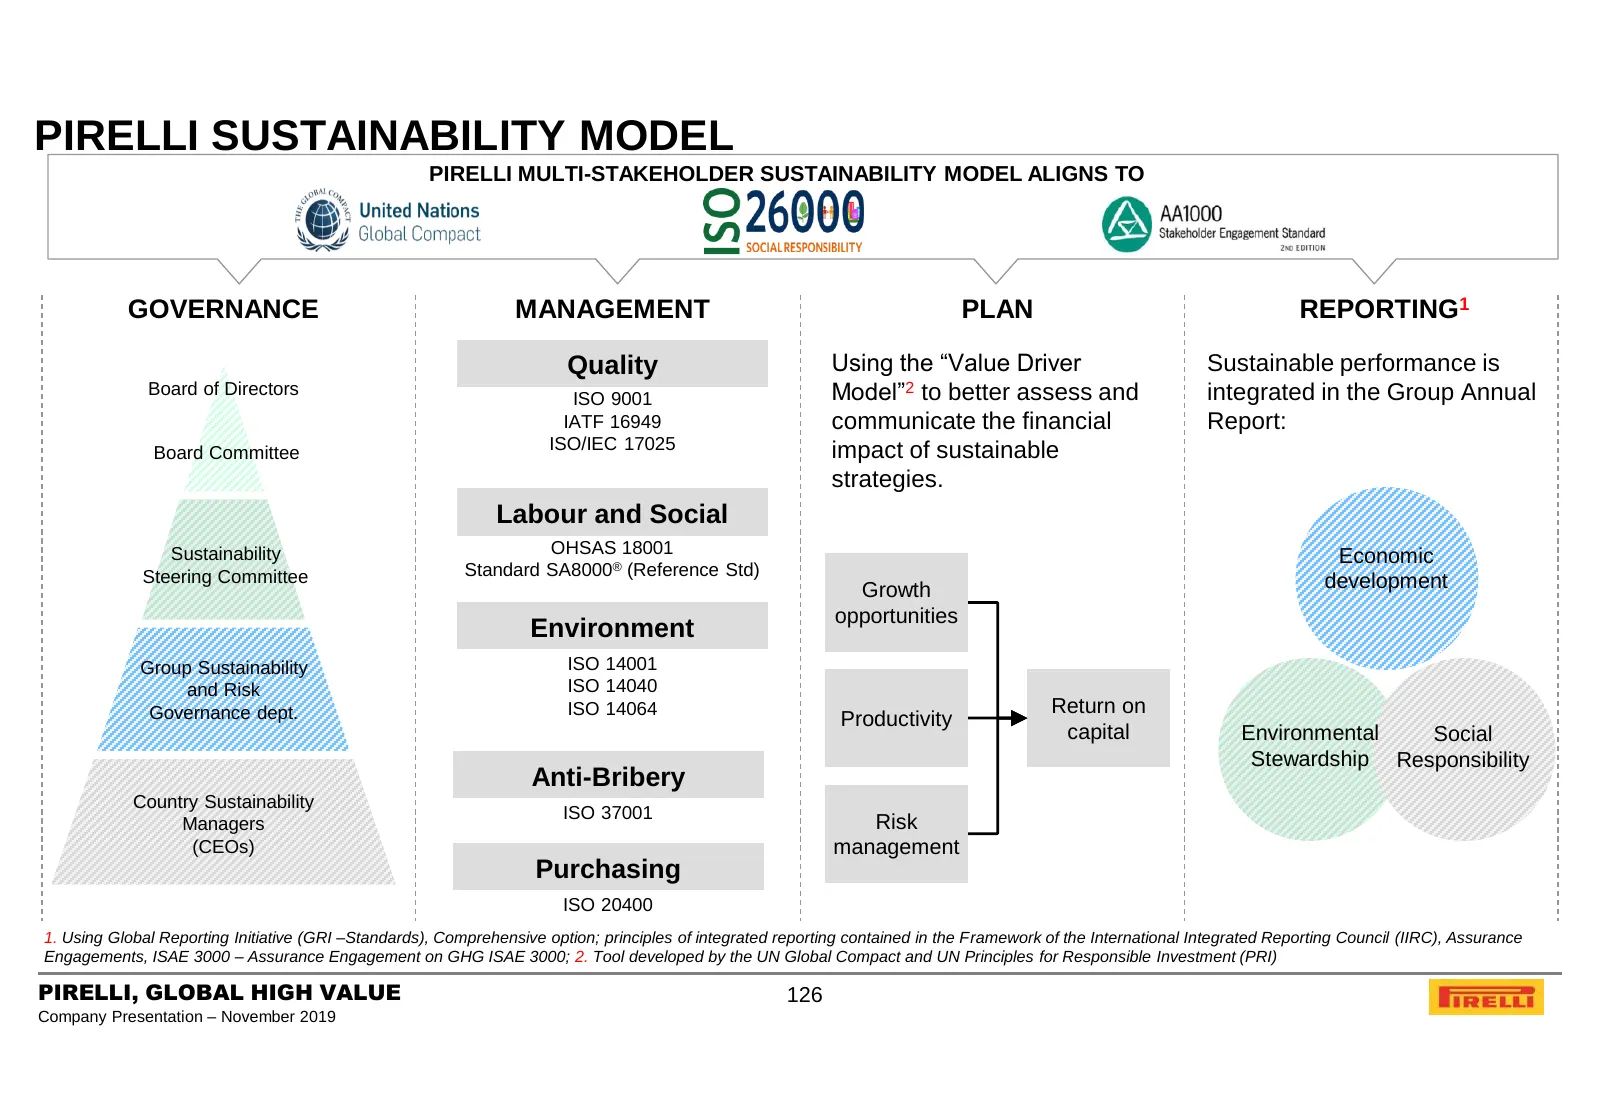
PIRELLI SUSTAINABILITY MODEL PIRELLI MULTI-STAKEHOLDER SUSTAINABILITY MODEL ALIGNS TO GOVERNANCE MANAGEMENT PLAN REPORTING1 SYSTEMS Quality Using the “Value Driver Sustainable performance is Board of Directors ISO 9001 Model”2 to better assess and integrated in the Group Annual IATF 16949 communicat
Slide 127: Comprehensive Corporate Positioning & International Engagement
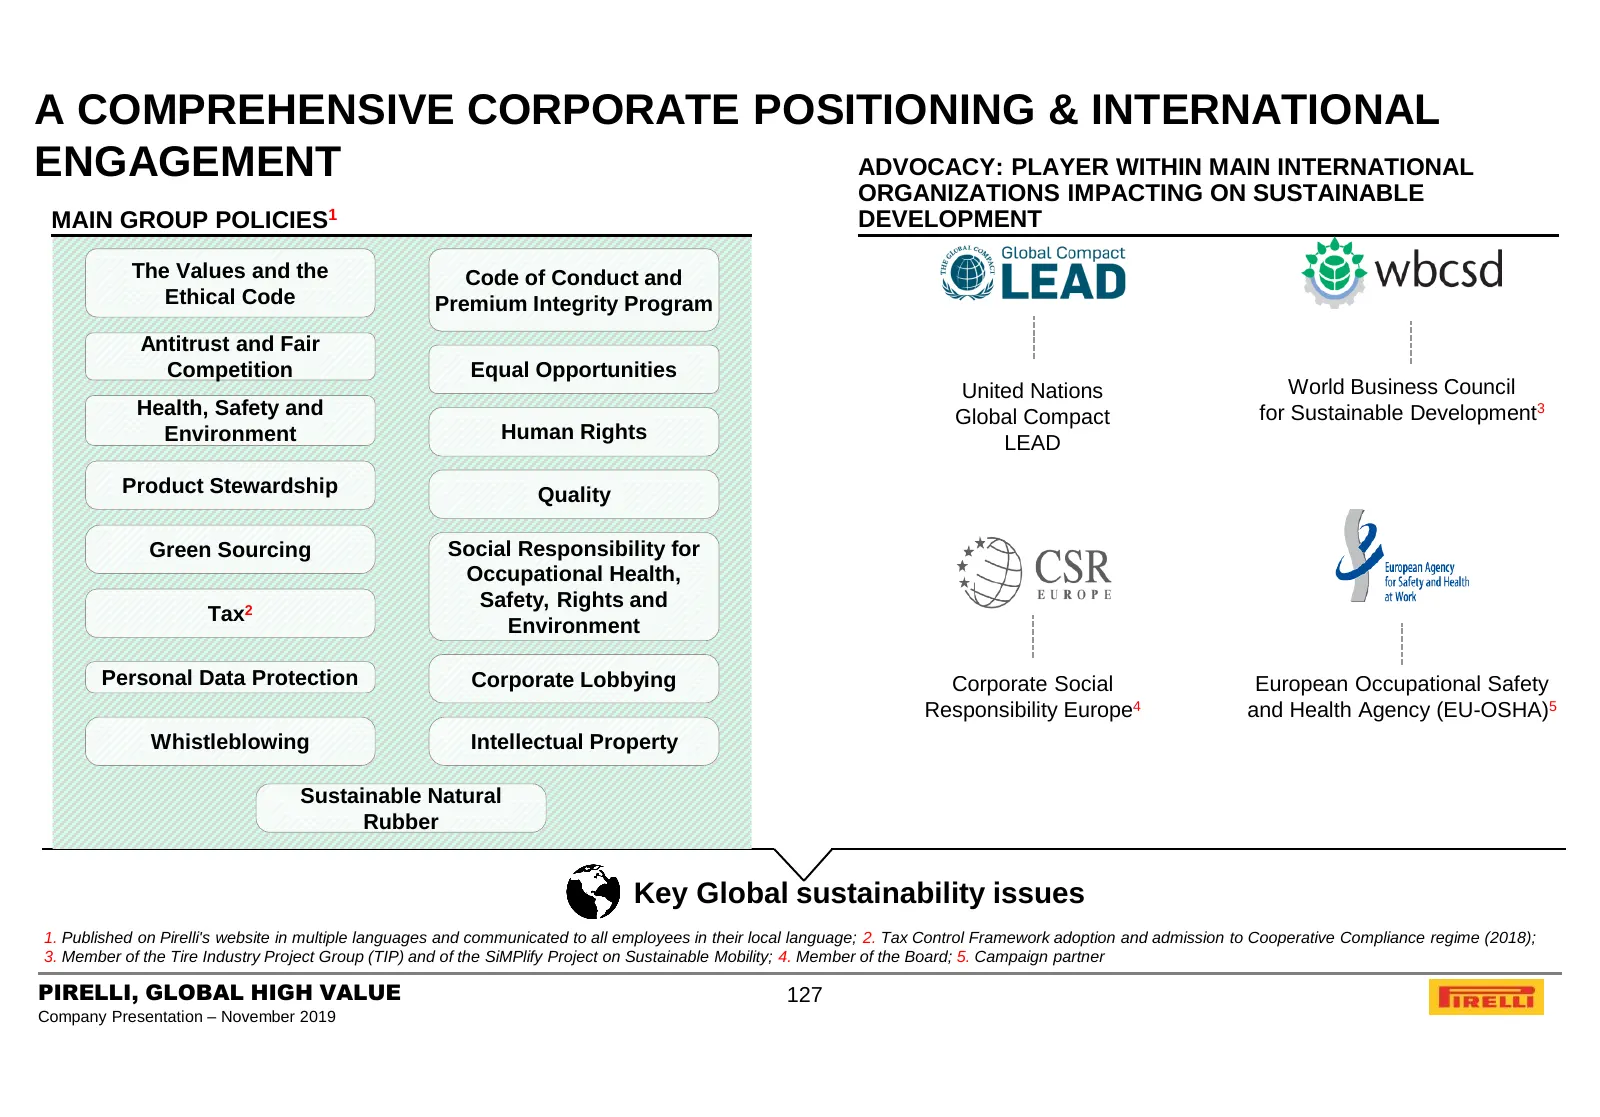
A COMPREHENSIVE CORPORATE POSITIONING & INTERNATIONAL ENGAGEMENT ADVOCACY: PLAYER WITHIN MAIN INTERNATIONAL ORGANIZATIONS IMPACTING ON SUSTAINABLE MAIN GROUP POLICIES1 DEVELOPMENT The Values and the Code of Conduct and Ethical Code Premium Integrity Program Antitrust and Fair Competition Equal Oppor
Slide 128: Agenda – Sustainability
AGENDA 8. SUSTAINABILITY 8a. PIRELLI SUSTAINABILITY MODEL 8b. ACHIEVEMENTS 8c. EVOLVING CONTEXT & KEY INDUSTRY TRENDS 8d. SUSTAINABILITY PLAN: RETURN ON CAPITAL Growth Productivity Risk Management PIRELLI, GLOBAL HIGH VALUE 128 Company Presentation – November 2019
Slide 129: 2018 Major Achievements
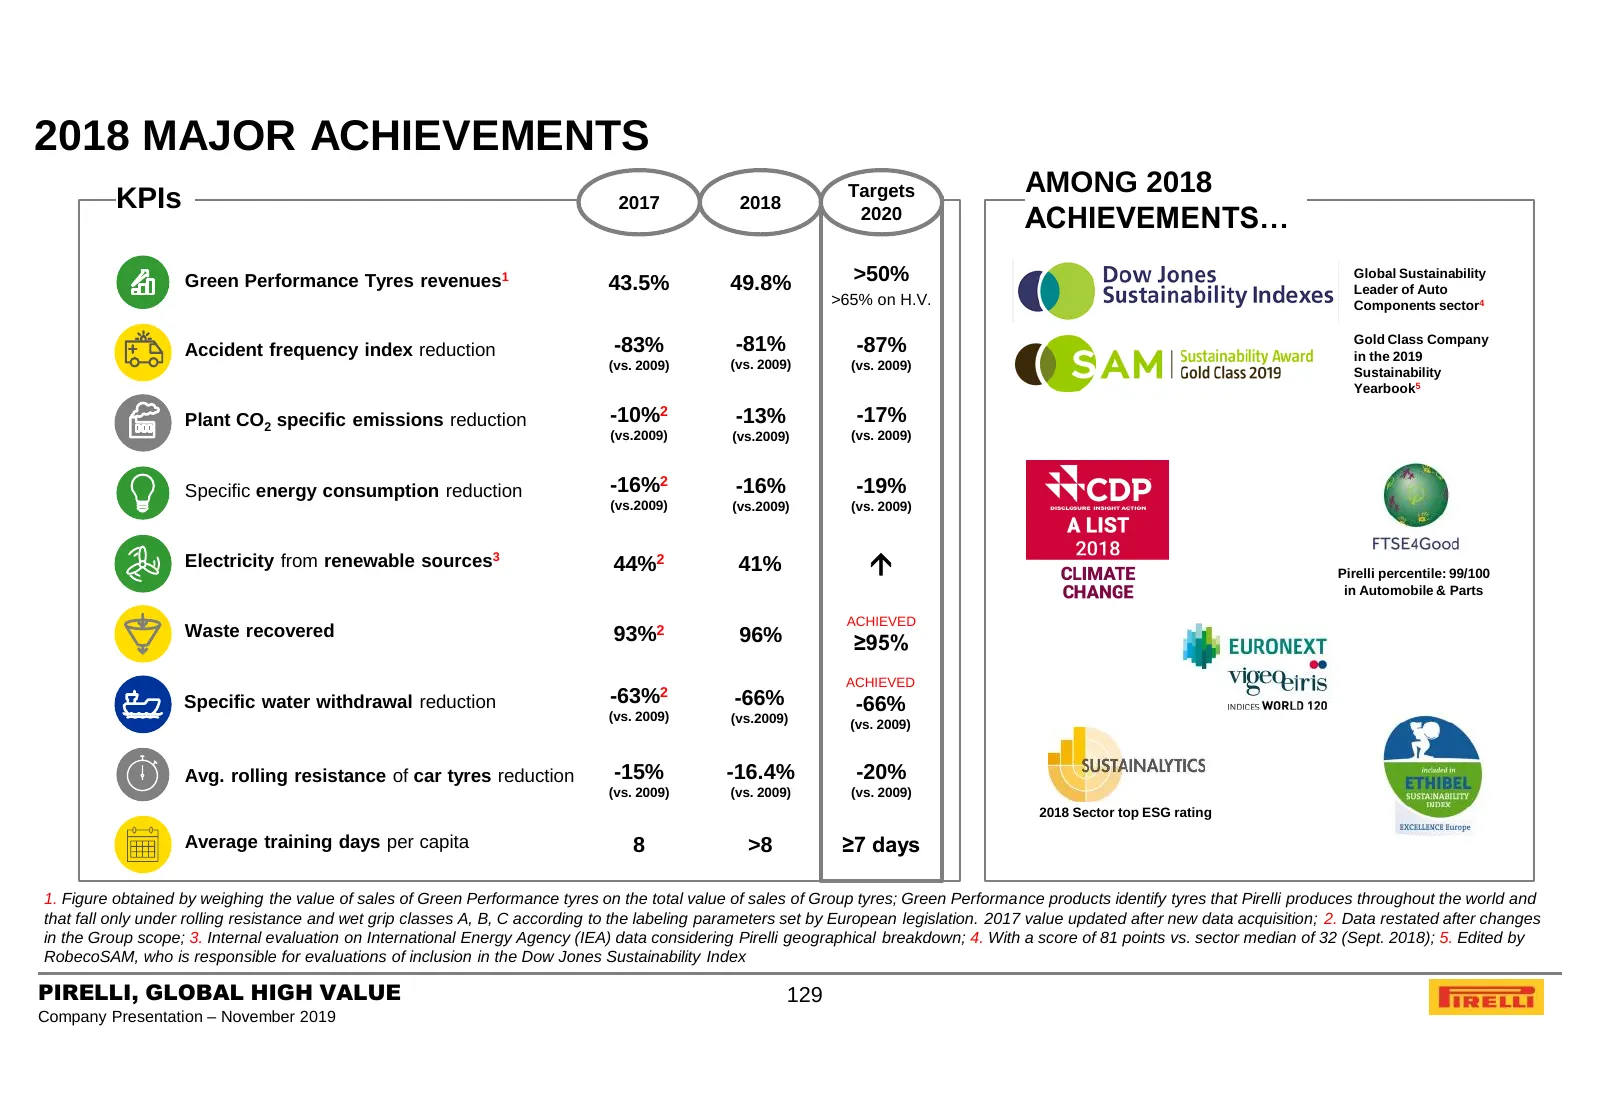
2018 MAJOR ACHIEVEMENTS Targets AMONG 2018 KPIs 2017 2018 2020 ACHIEVEMENTS… Green Performance Tyres revenues1 43.5% 49.8% >50% Global Sustainability Leader of Auto >65% on H.V. Components sector4 -81% Gold Class Company Accident frequency index reduction -83% -87% in the 2019 (vs. 2009) (vs. 2009)
Slide 130: Agenda – Sustainability
AGENDA 8. SUSTAINABILITY 8a. PIRELLI SUSTAINABILITY MODEL 8b. ACHIEVEMENTS 8c. EVOLVING CONTEXT & KEY INDUSTRY TRENDS 8d. SUSTAINABILITY PLAN: RETURN ON CAPITAL Growth Productivity Risk Management PIRELLI, GLOBAL HIGH VALUE 130 Company Presentation – November 2019
Slide 131: Evolving Context & Key Industry Trends
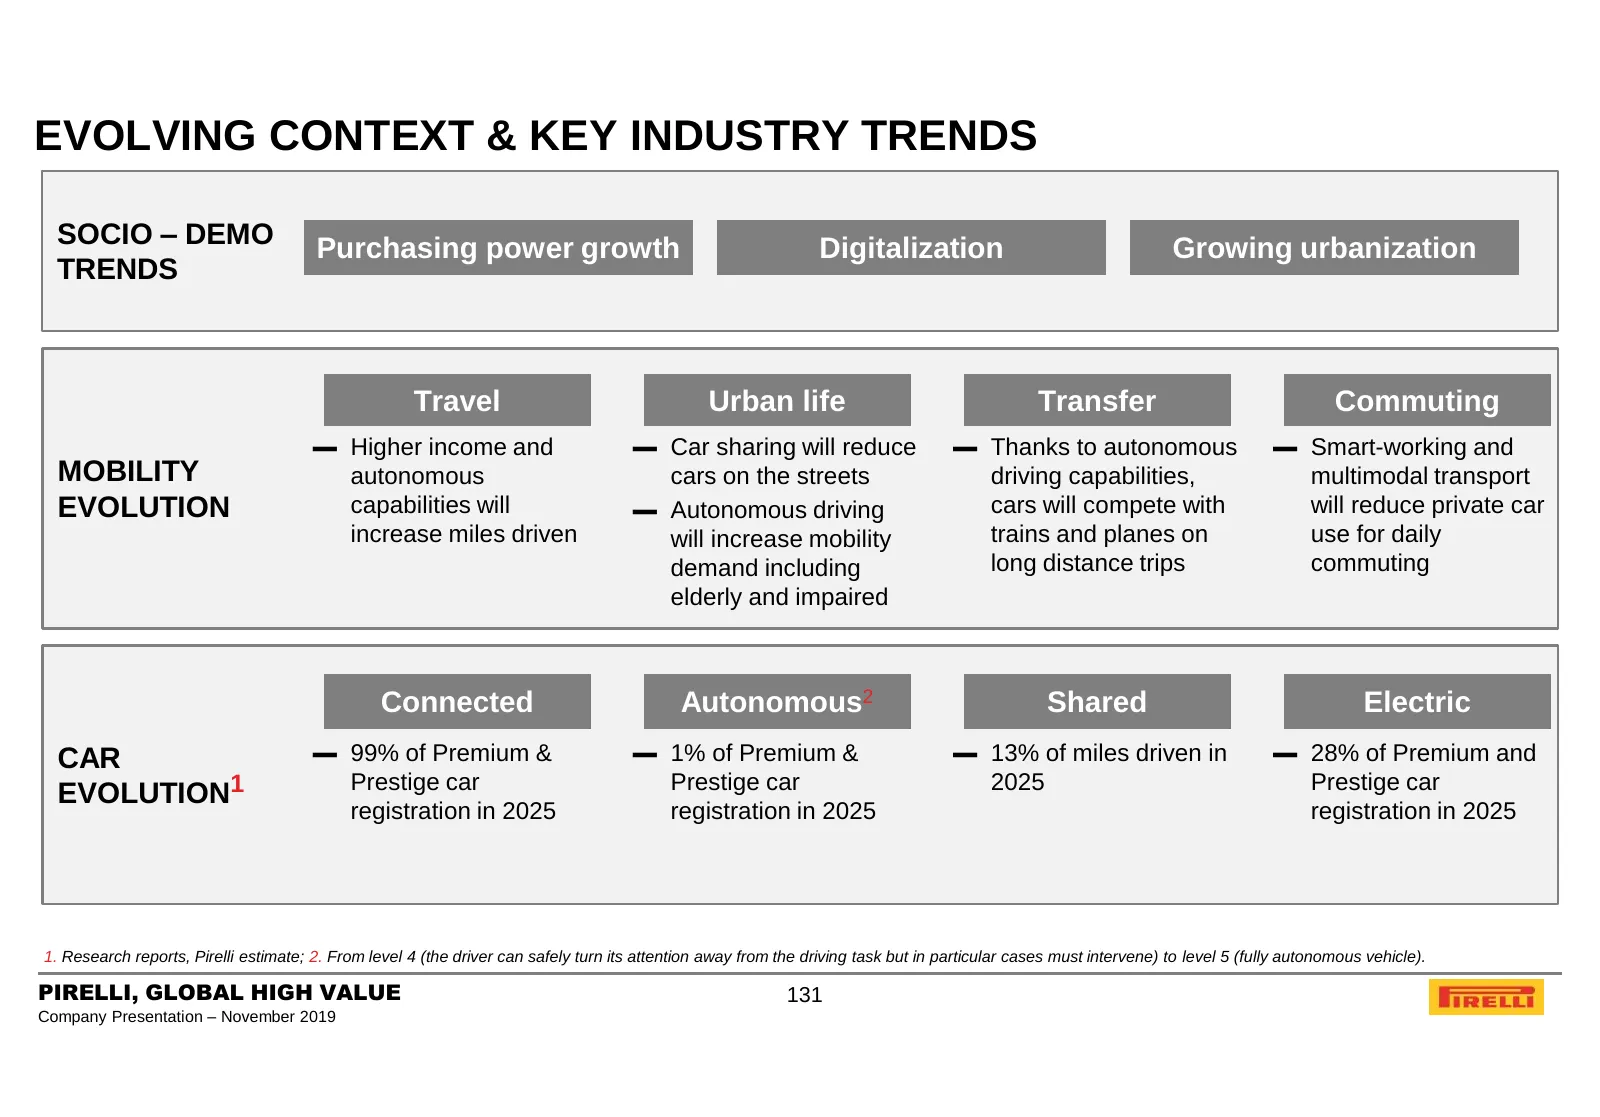
EVOLVING CONTEXT & KEY INDUSTRY TRENDS SOCIO – DEMO Purchasing power growth Digitalization Growing urbanization TRENDS Travel Urban life Transfer Commuting ▬ Higher income and ▬ Car sharing will reduce ▬ Thanks to autonomous ▬ Smart-working and MOBILITY autonomous cars on the streets driving capabil
Slide 132: Agenda – Sustainability
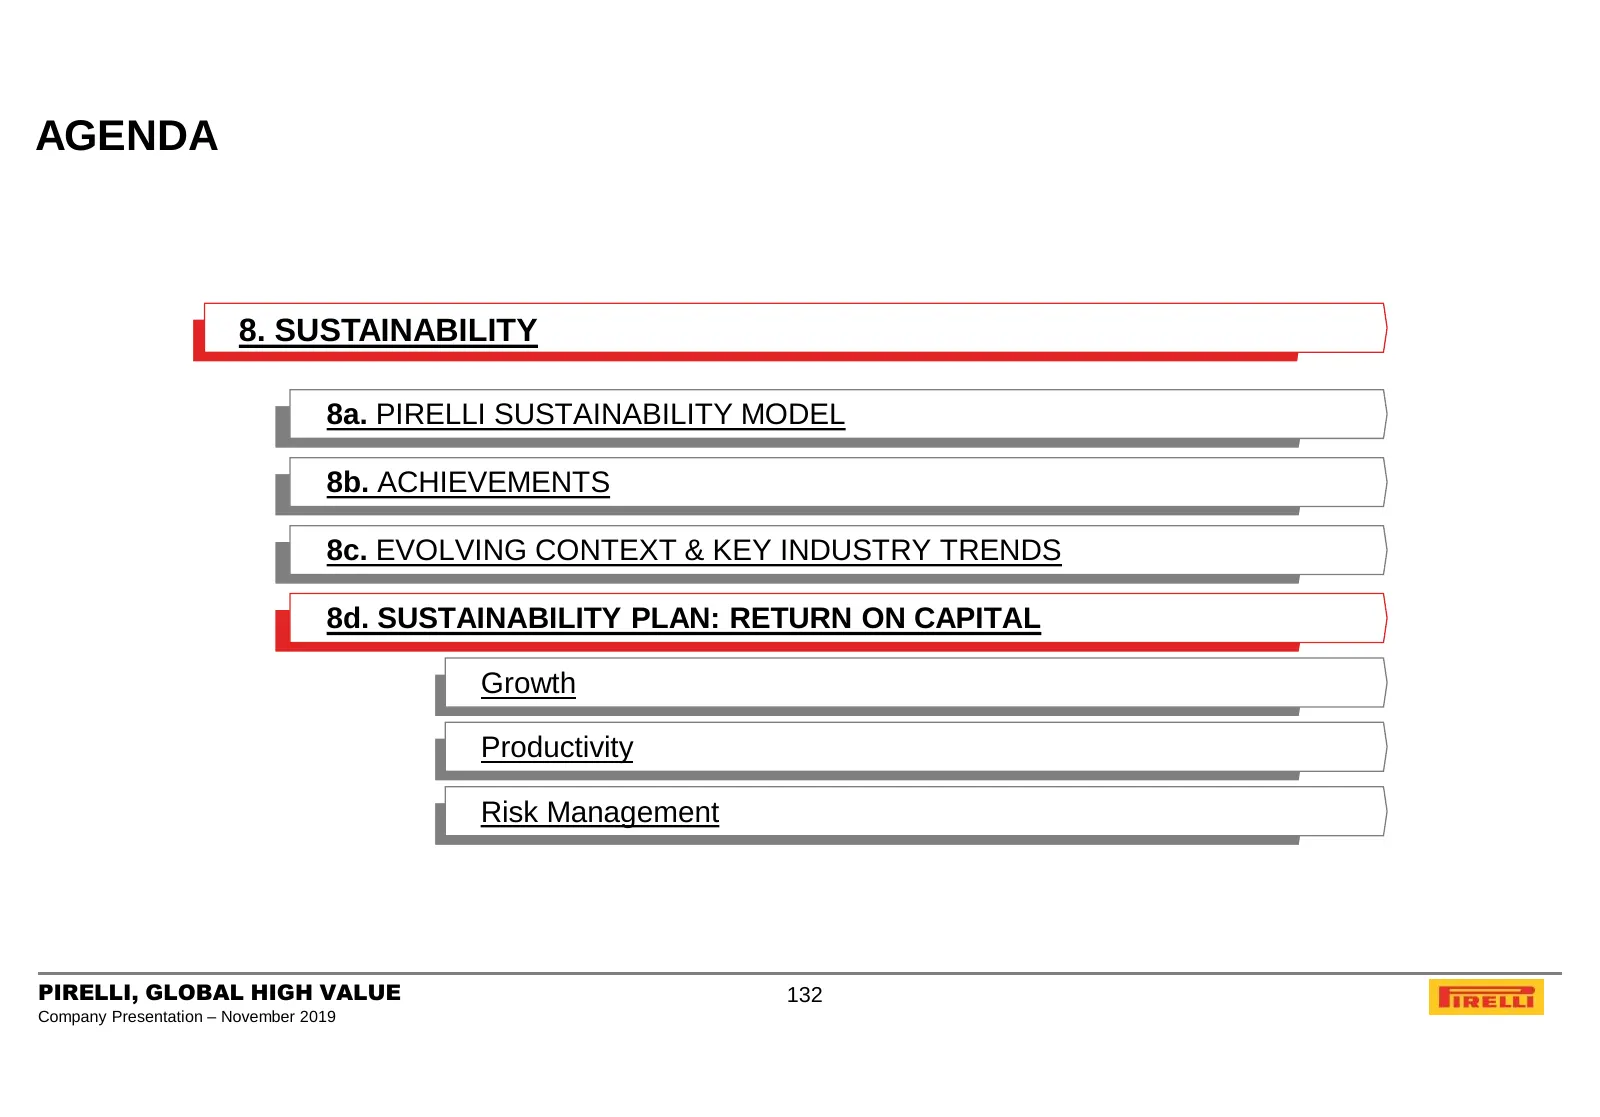
AGENDA 8. SUSTAINABILITY 8a. PIRELLI SUSTAINABILITY MODEL 8b. ACHIEVEMENTS 8c. EVOLVING CONTEXT & KEY INDUSTRY TRENDS 8d. SUSTAINABILITY PLAN: RETURN ON CAPITAL Growth Productivity Risk Management PIRELLI, GLOBAL HIGH VALUE 132 Company Presentation – November 2019
Slide 133: Sustainability Plan
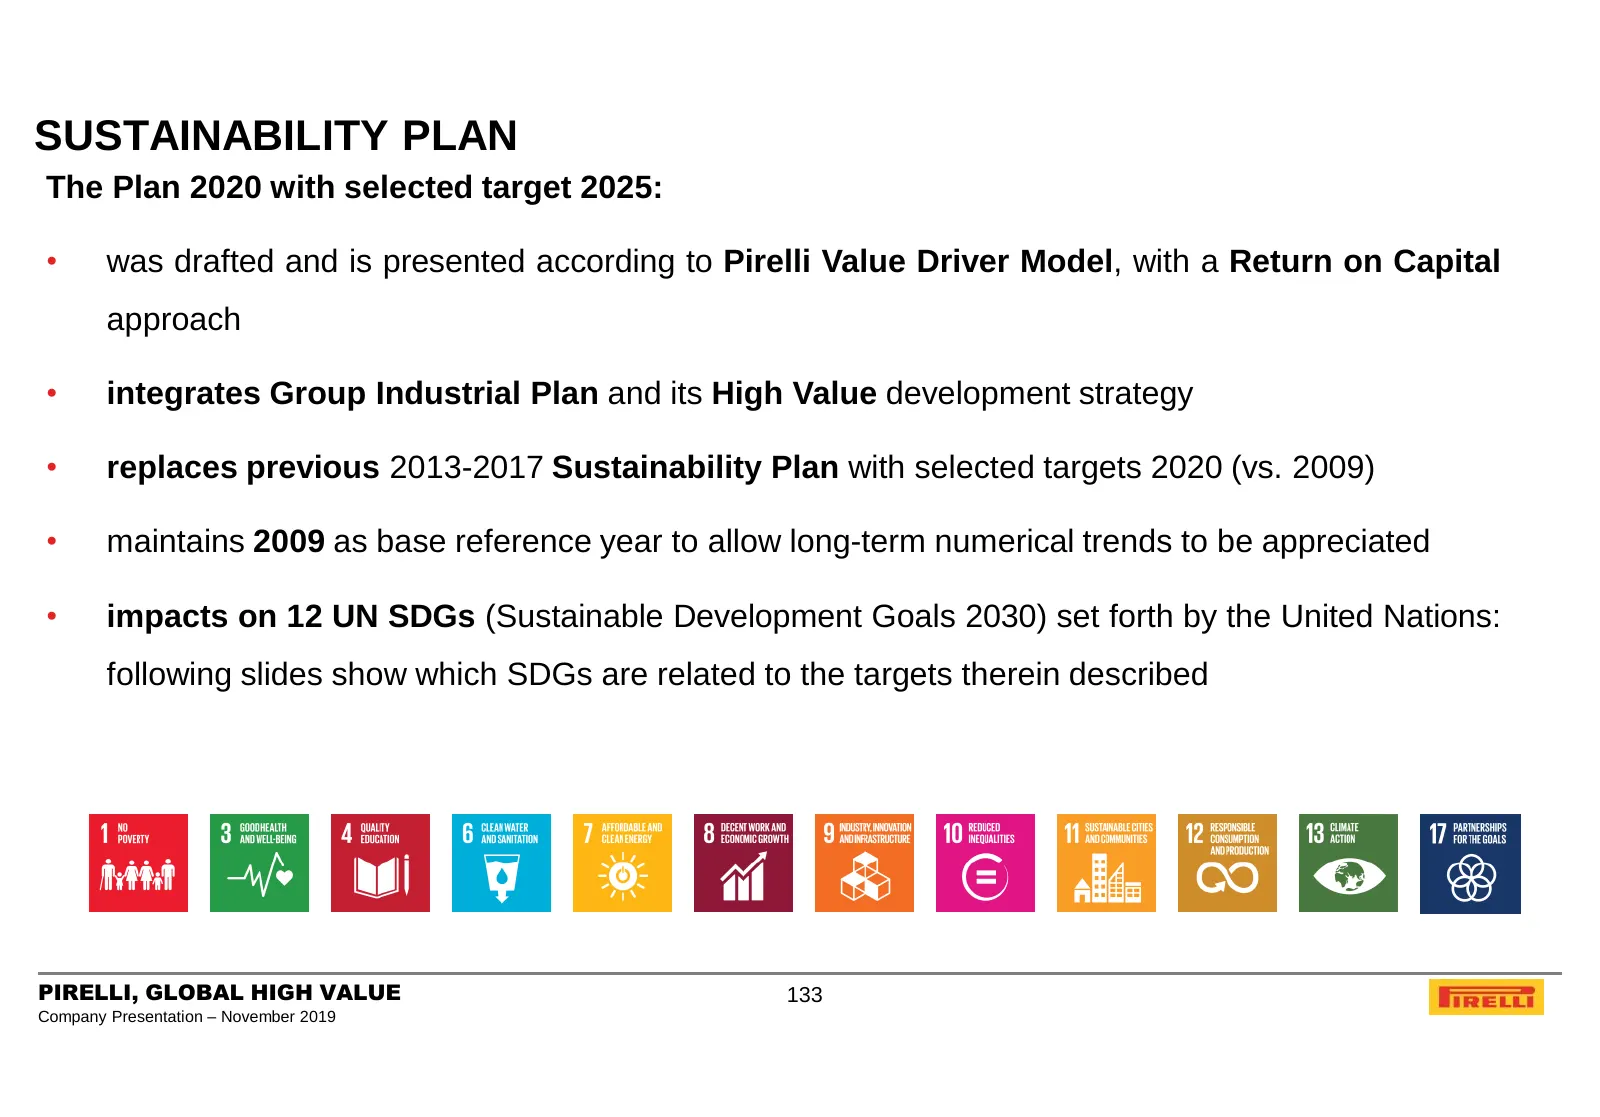
SUSTAINABILITY PLAN The Plan 2020 with selected target 2025: • was drafted and is presented according to Pirelli Value Driver Model, with a Return on Capital approach • integrates Group Industrial Plan and its High Value development strategy • replaces previous 2013-2017 Sustainability Plan with sel
Slide 134: Return on Capital
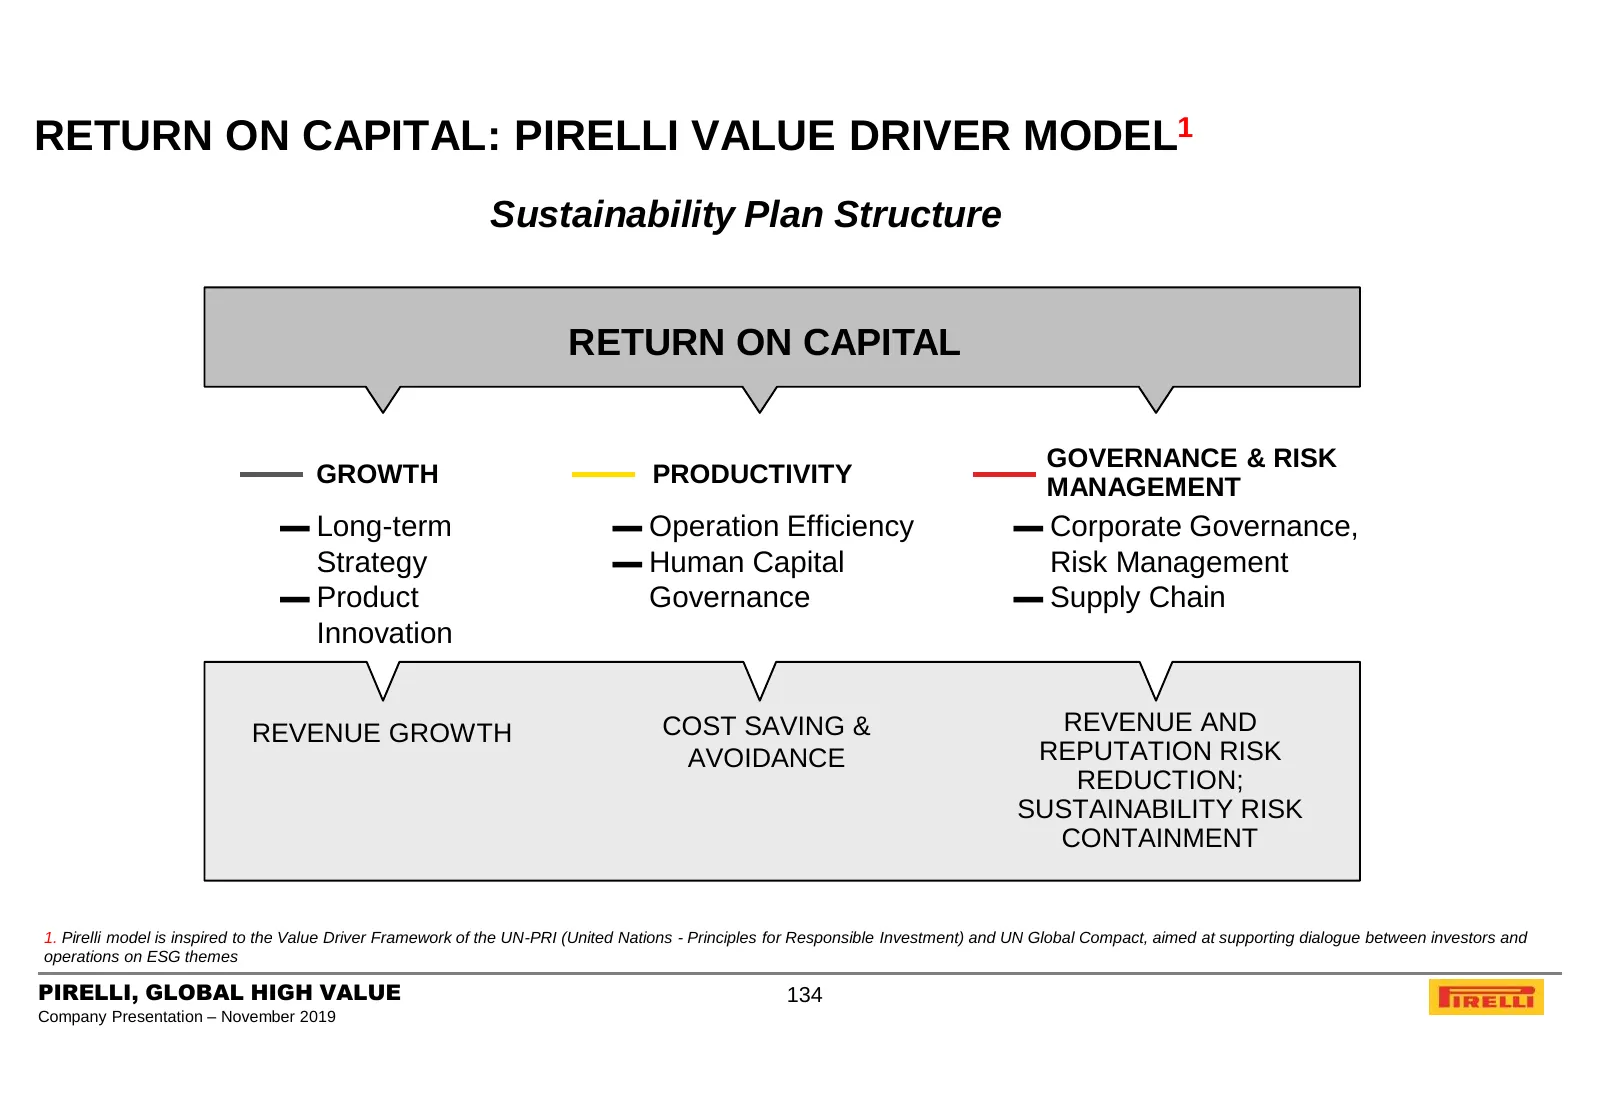
RETURN ON CAPITAL RETURN ON CAPITAL: PIRELLI VALUE DRIVER MODEL1 Sustainability Plan Structure RETURN ON CAPITAL GOVERNANCE & RISK GROWTH PRODUCTIVITY MANAGEMENT ▬ Long-term ▬ Operation Efficiency ▬ Corporate Governance, Strategy ▬ Human Capital Risk Management ▬ Product Governance ▬ Supply Chain In
Slide 135: Sustainability Levers in Pirelli Industrial Plan
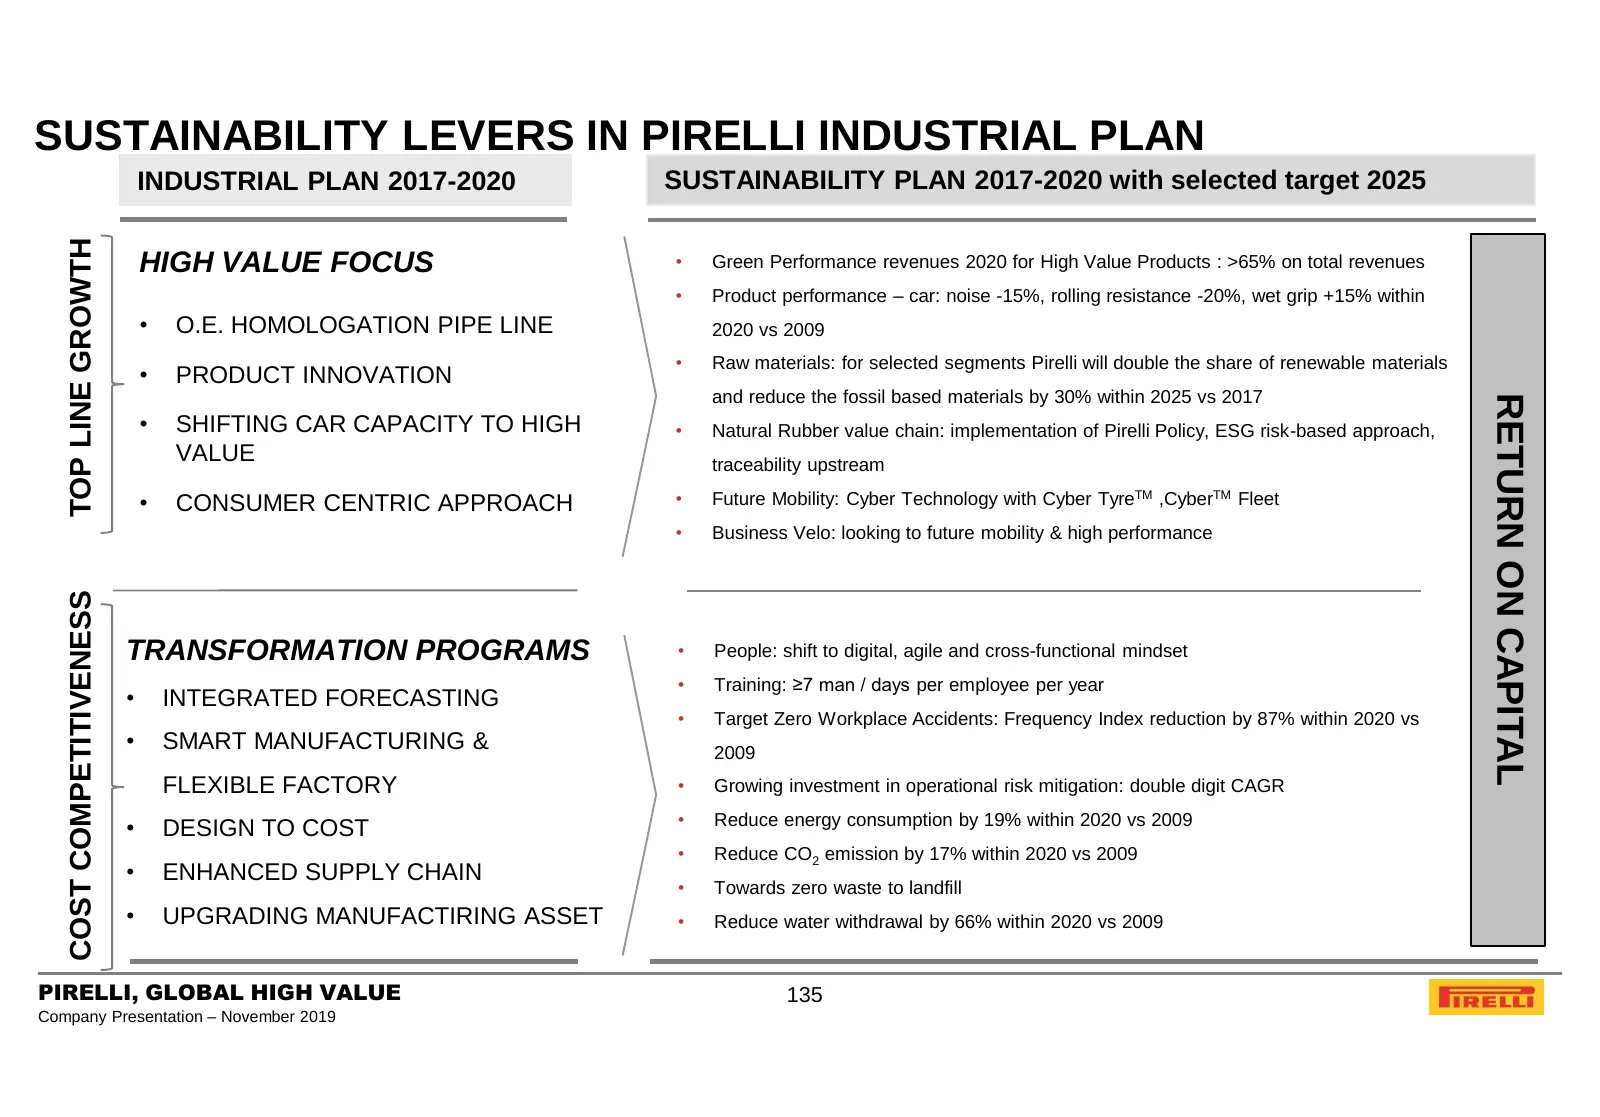
SUSTAINABILITY LEVERS IN PIRELLI INDUSTRIAL PLAN INDUSTRIAL PLAN 2017-2020 SUSTAINABILITY PLAN 2017-2020 with selected target 2025 TOP LINE GROWTH HIGH VALUE FOCUS • Green Performance revenues 2020 for High Value Products : >65% on total revenues • Product performance – car: noise -15%, rolling resi
Slide 136: Agenda – Sustainability
AGENDA 8. SUSTAINABILITY 8a. PIRELLI SUSTAINABILITY MODEL 8b. ACHIEVEMENTS 8c. EVOLVING CONTEXT & KEY INDUSTRY TRENDS 8d. SUSTAINABILITY PLAN: RETURN ON CAPITAL Growth Productivity Risk Management PIRELLI, GLOBAL HIGH VALUE 136 Company Presentation – November 2019
Slide 137: Growth: Aligning Strategy to Footprint
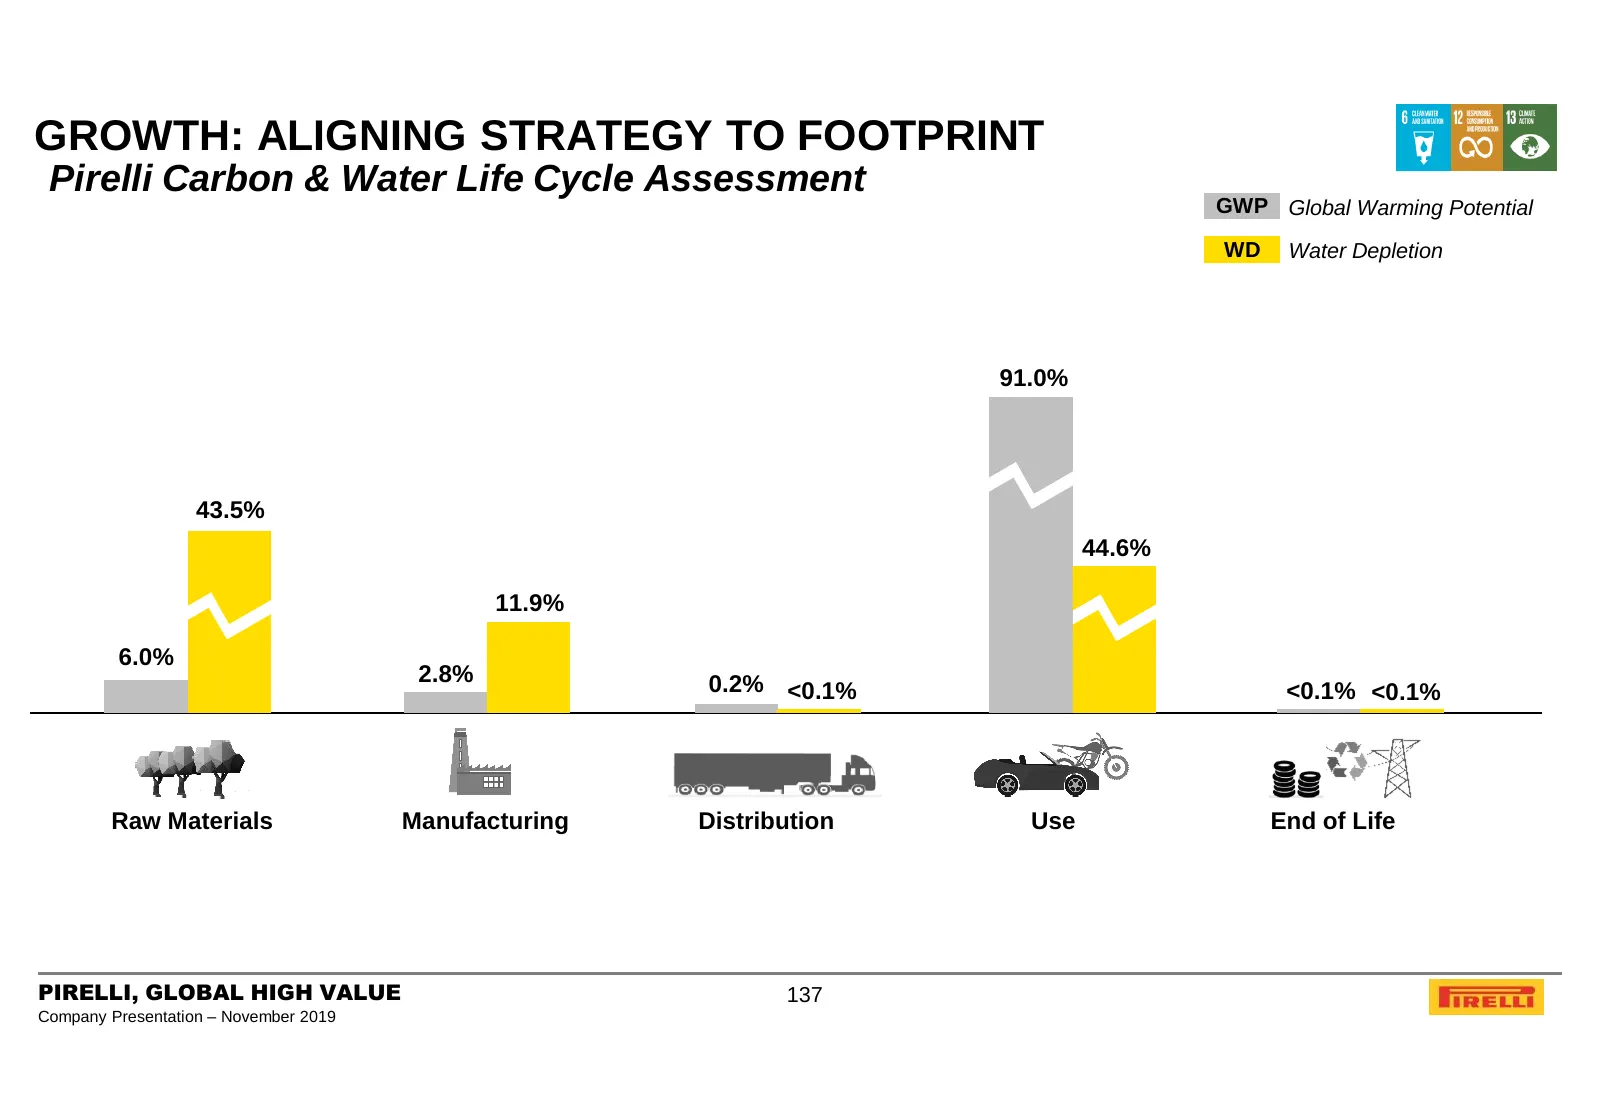
GROWTH: ALIGNING STRATEGY TO FOOTPRINT Pirelli Carbon & Water Life Cycle Assessment GWP Global Warming Potential WD Water Depletion 91.0% 43.5% 44.6% 11.9% 6.0% 2.8% 0.2% <0.1% <0.1% <0.1% Raw Materials Manufacturing Distribution Use End of Life PIRELLI, GLOBAL HIGH VALUE 137 Company Presentation –
Slide 138: Growth: Product Innovation
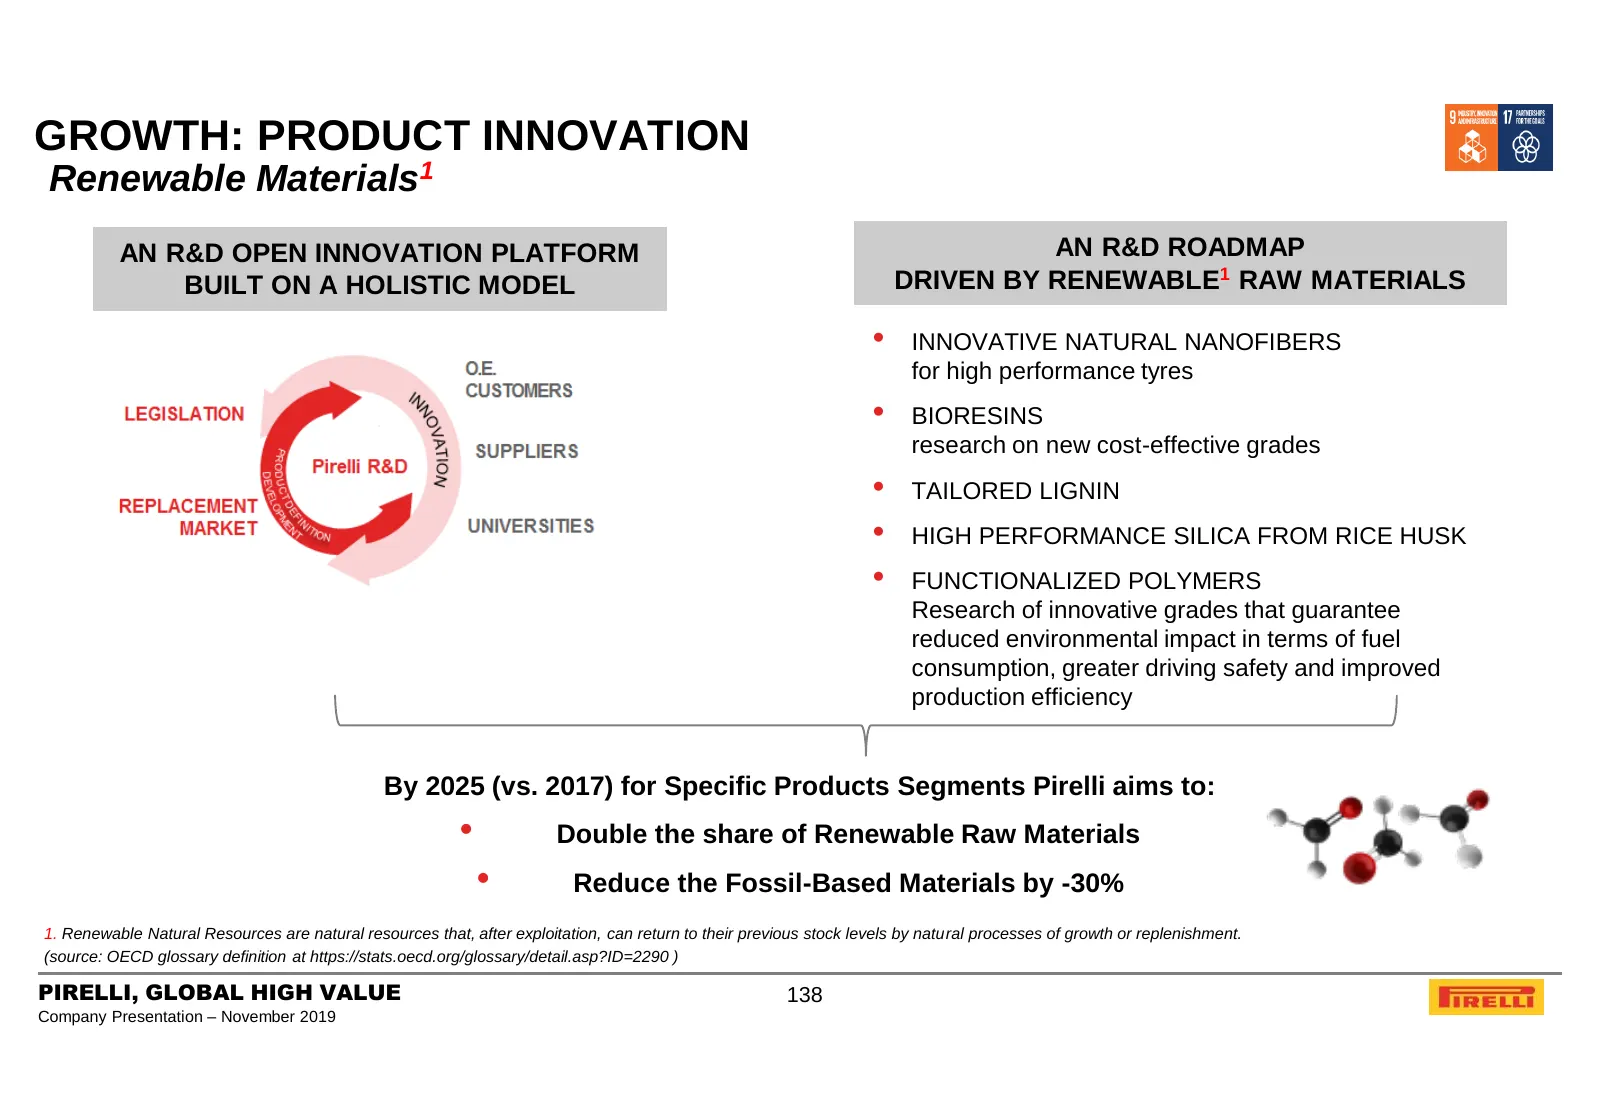
GROWTH: PRODUCT INNOVATION Renewable Materials1 AN R&D OPEN INNOVATION PLATFORM AN R&D ROADMAP BUILT ON A HOLISTIC MODEL DRIVEN BY RENEWABLE1 RAW MATERIALS • INNOVATIVE NATURAL NANOFIBERS for high performance tyres • BIORESINS research on new cost-effective grades • TAILORED LIGNIN • HIGH PERFORMANC
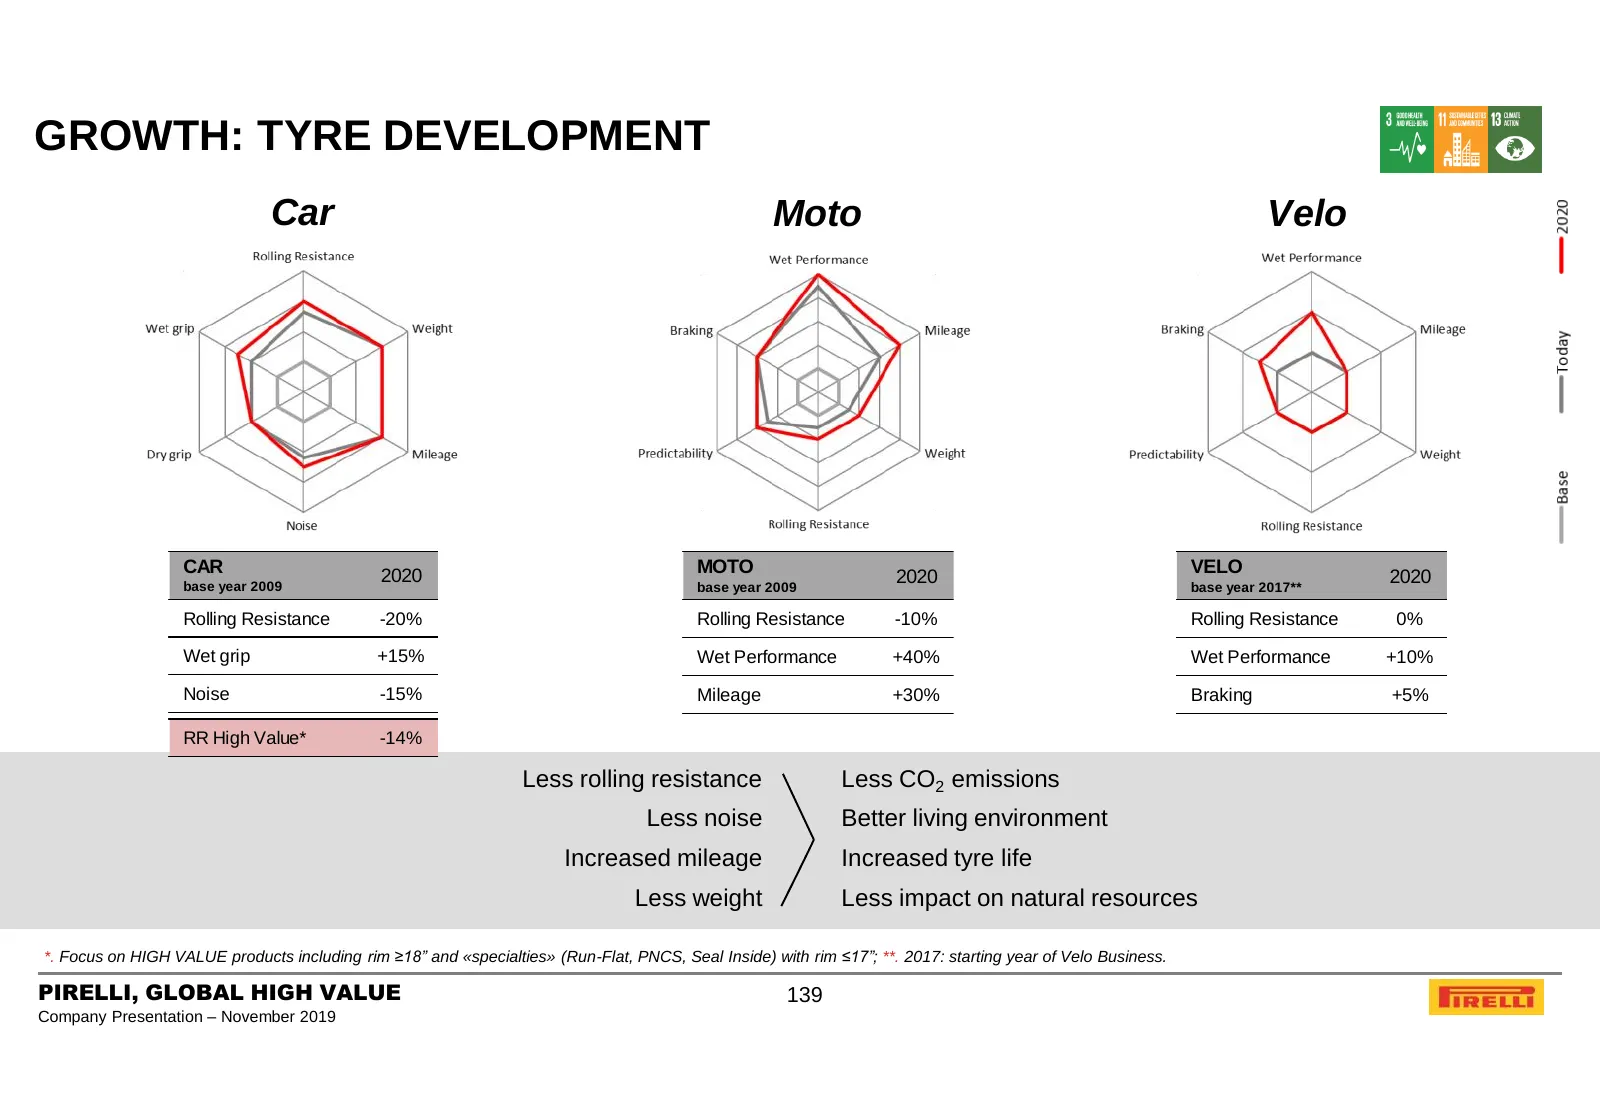
Slide 139: Growth: Tyre Development
GROWTH: TYRE DEVELOPMENT Car Moto Velo CAR 2020 MOTO 2020 VELO 2020 base year 2009 base year 2009 base year 2017** Rolling Resistance -20% Rolling Resistance -10% Rolling Resistance 0% Wet grip +15% Wet Performance +40% Wet Performance +10% Noise -15% Mileage +30% Braking +5% RR High Value* -14% Les
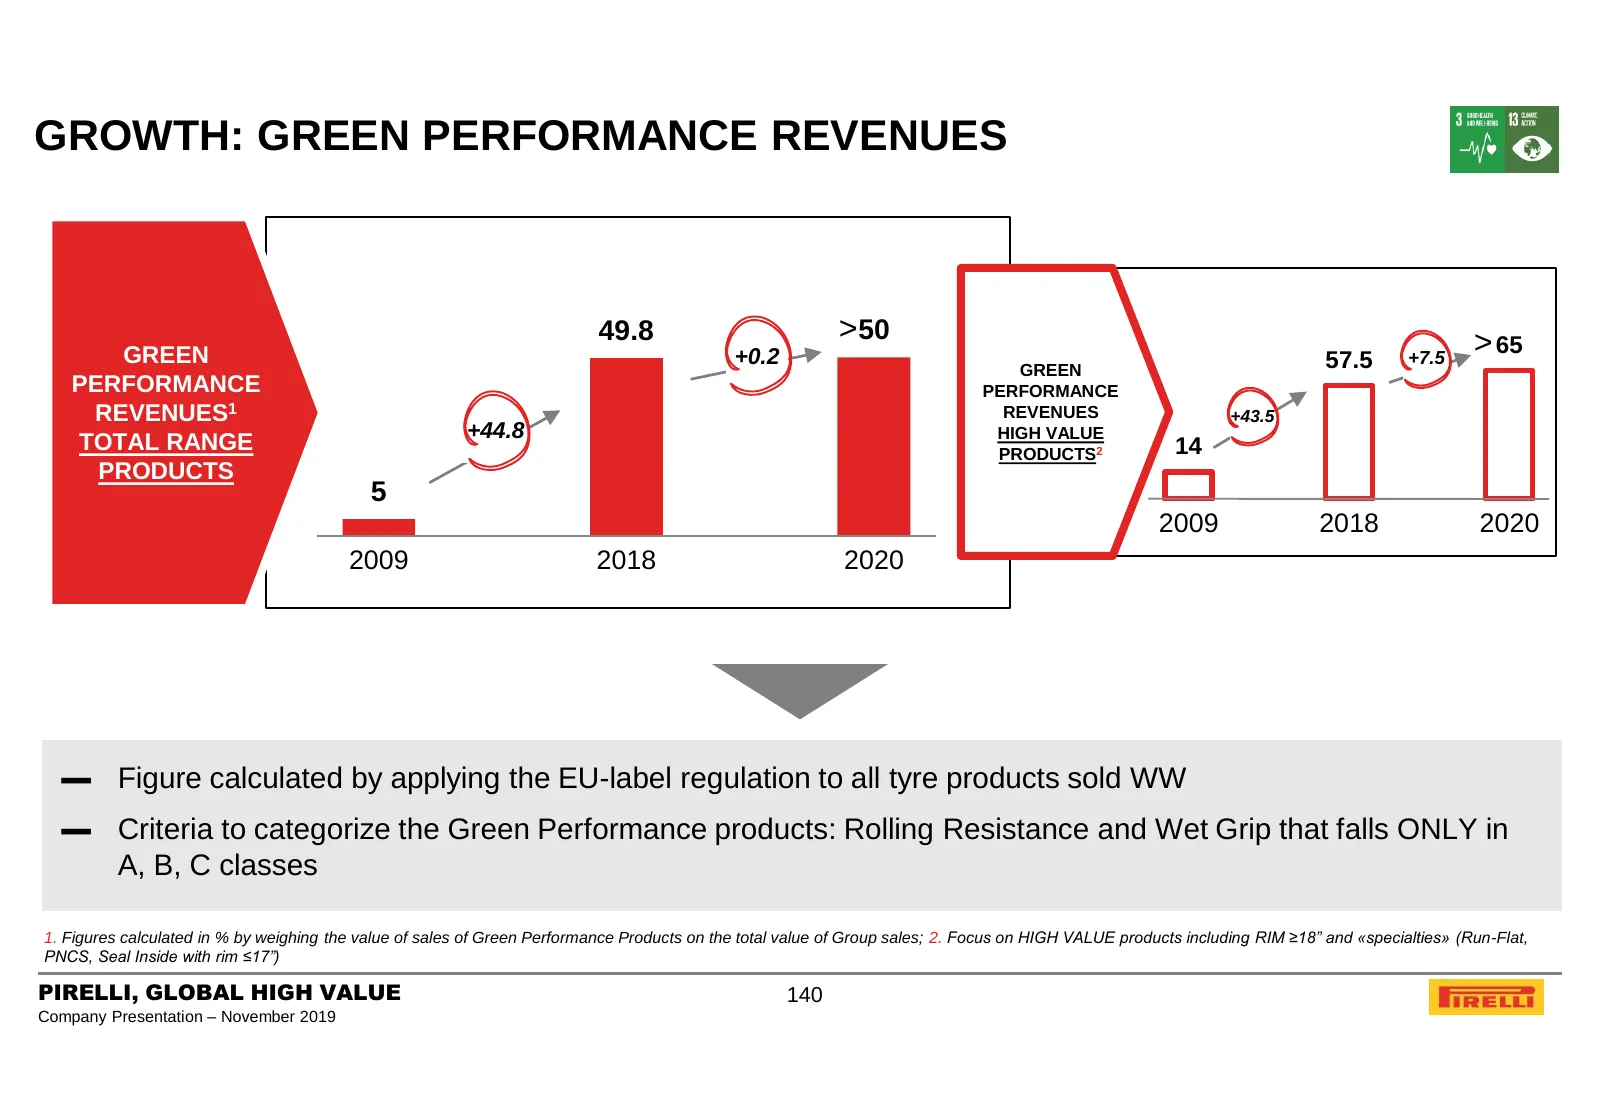
Slide 140: Growth: Green Performance Revenues
GROWTH: GREEN PERFORMANCE REVENUES 49.8 >50 > 65 GREEN +0.2 57.5 +7.5 GREEN PERFORMANCE PERFORMANCE REVENUES1 REVENUES +43.5 +44.8 HIGH VALUE TOTAL RANGE PRODUCTS2 14 PRODUCTS 5 2009 2018 2020 2009 2018 2020 ▬ Figure calculated by applying the EU-label regulation to all tyre products sold WW ▬ Crite
Slide 141: Agenda – Sustainability
AGENDA 8. SUSTAINABILITY 8a. PIRELLI SUSTAINABILITY MODEL 8b. ACHIEVEMENTS 8c. EVOLVING CONTEXT & KEY INDUSTRY TRENDS 8d. SUSTAINABILITY PLAN: RETURN ON CAPITAL Growth Productivity Risk Management PIRELLI, GLOBAL HIGH VALUE 141 Company Presentation – November 2019
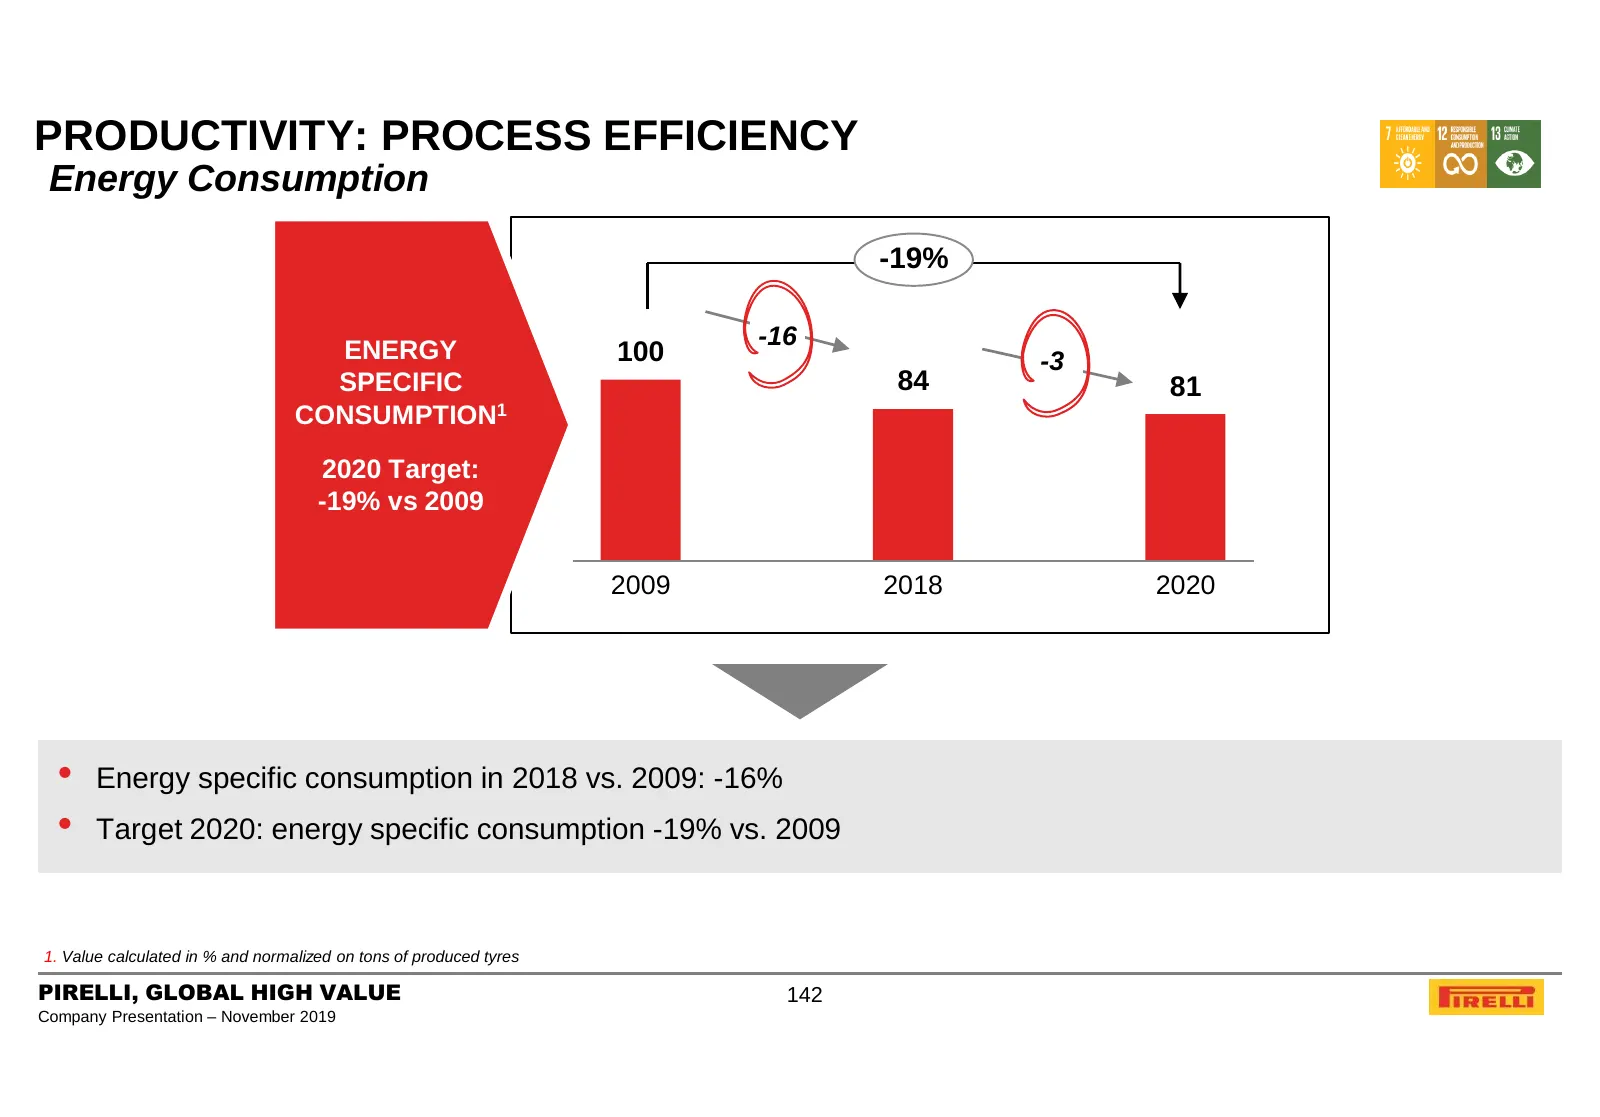
Slide 142: Productivity: Process Efficiency – Energy Consumption
PRODUCTIVITY: PROCESS EFFICIENCY Energy Consumption -19% -16 ENERGY 100 -3 SPECIFIC 84 81 CONSUMPTION1 2020 Target: -19% vs 2009 2009 2018 2020 • Energy specific consumption in 2018 vs. 2009: -16% • Target 2020: energy specific consumption -19% vs. 2009 1. Value calculated in % and normalized on ton
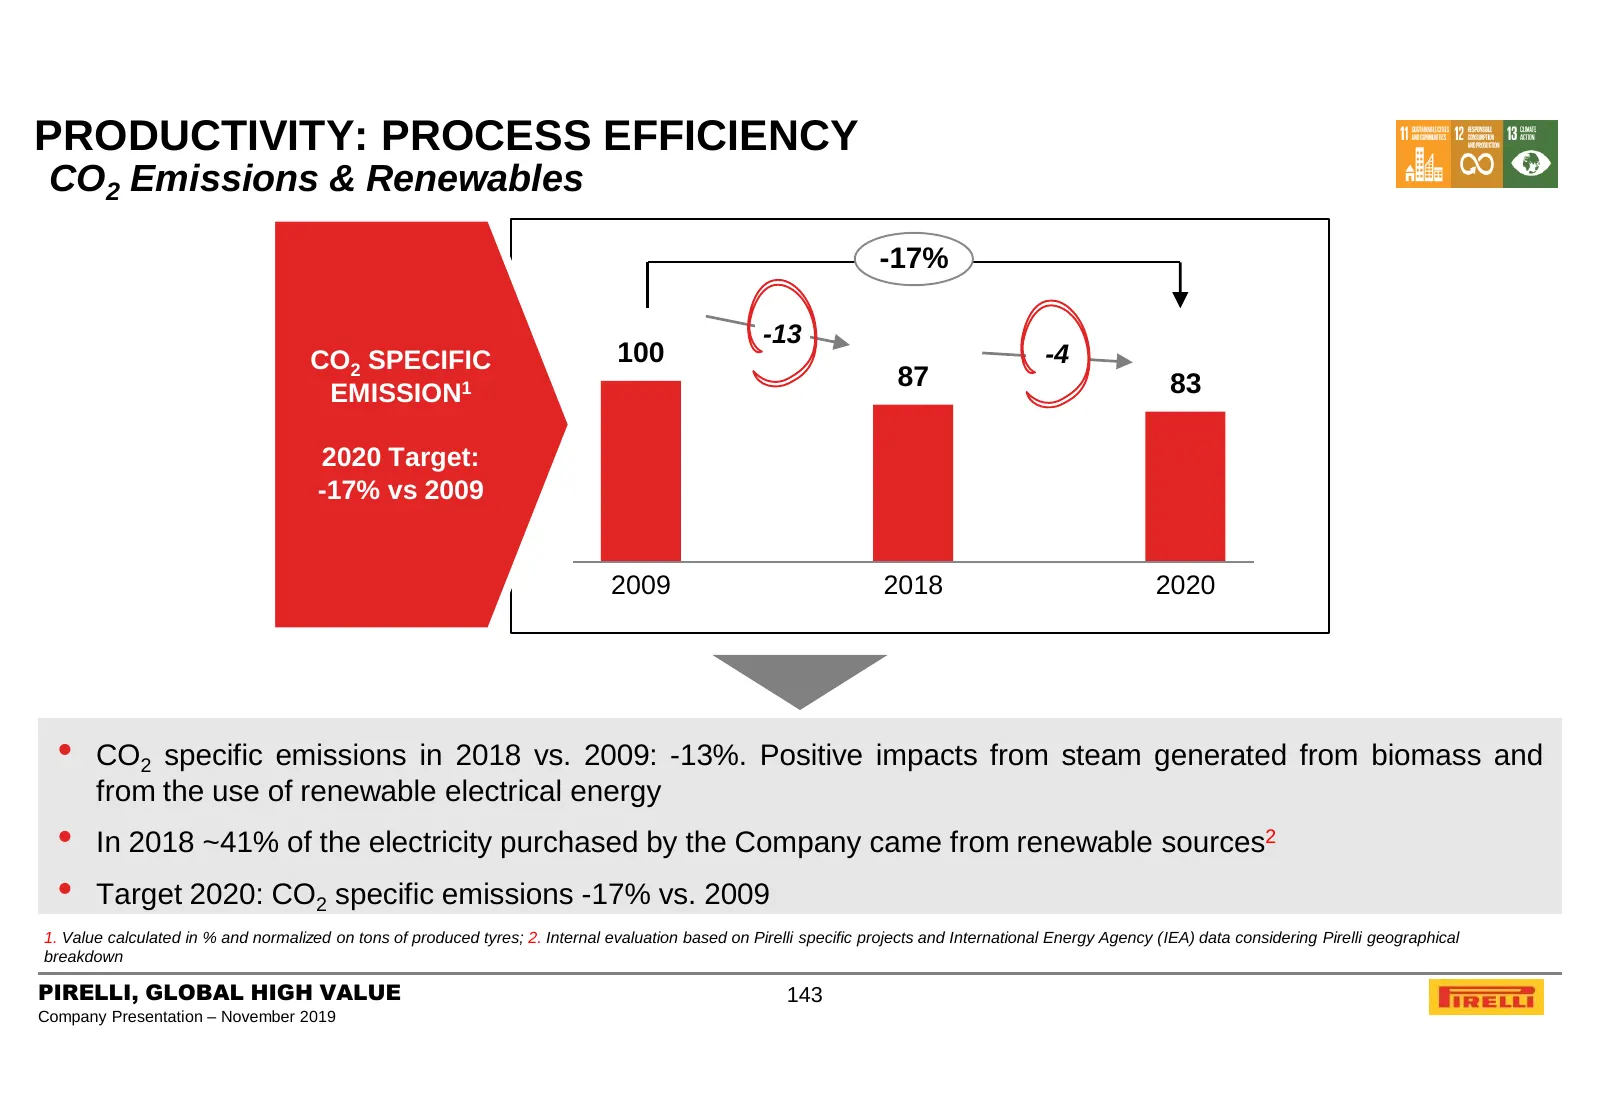
Slide 143: Productivity: Process Efficiency – CO2 Emissions
PRODUCTIVITY: PROCESS EFFICIENCY CO2 Emissions & Renewables -17% -13 CO2 SPECIFIC 100 -4 87 83 EMISSION1 2020 Target: -17% vs 2009 2009 2018 2020 • CO2 specific emissions in 2018 vs. 2009: -13%. Positive impacts from steam generated from biomass and from the use of renewable electrical energy • In 2
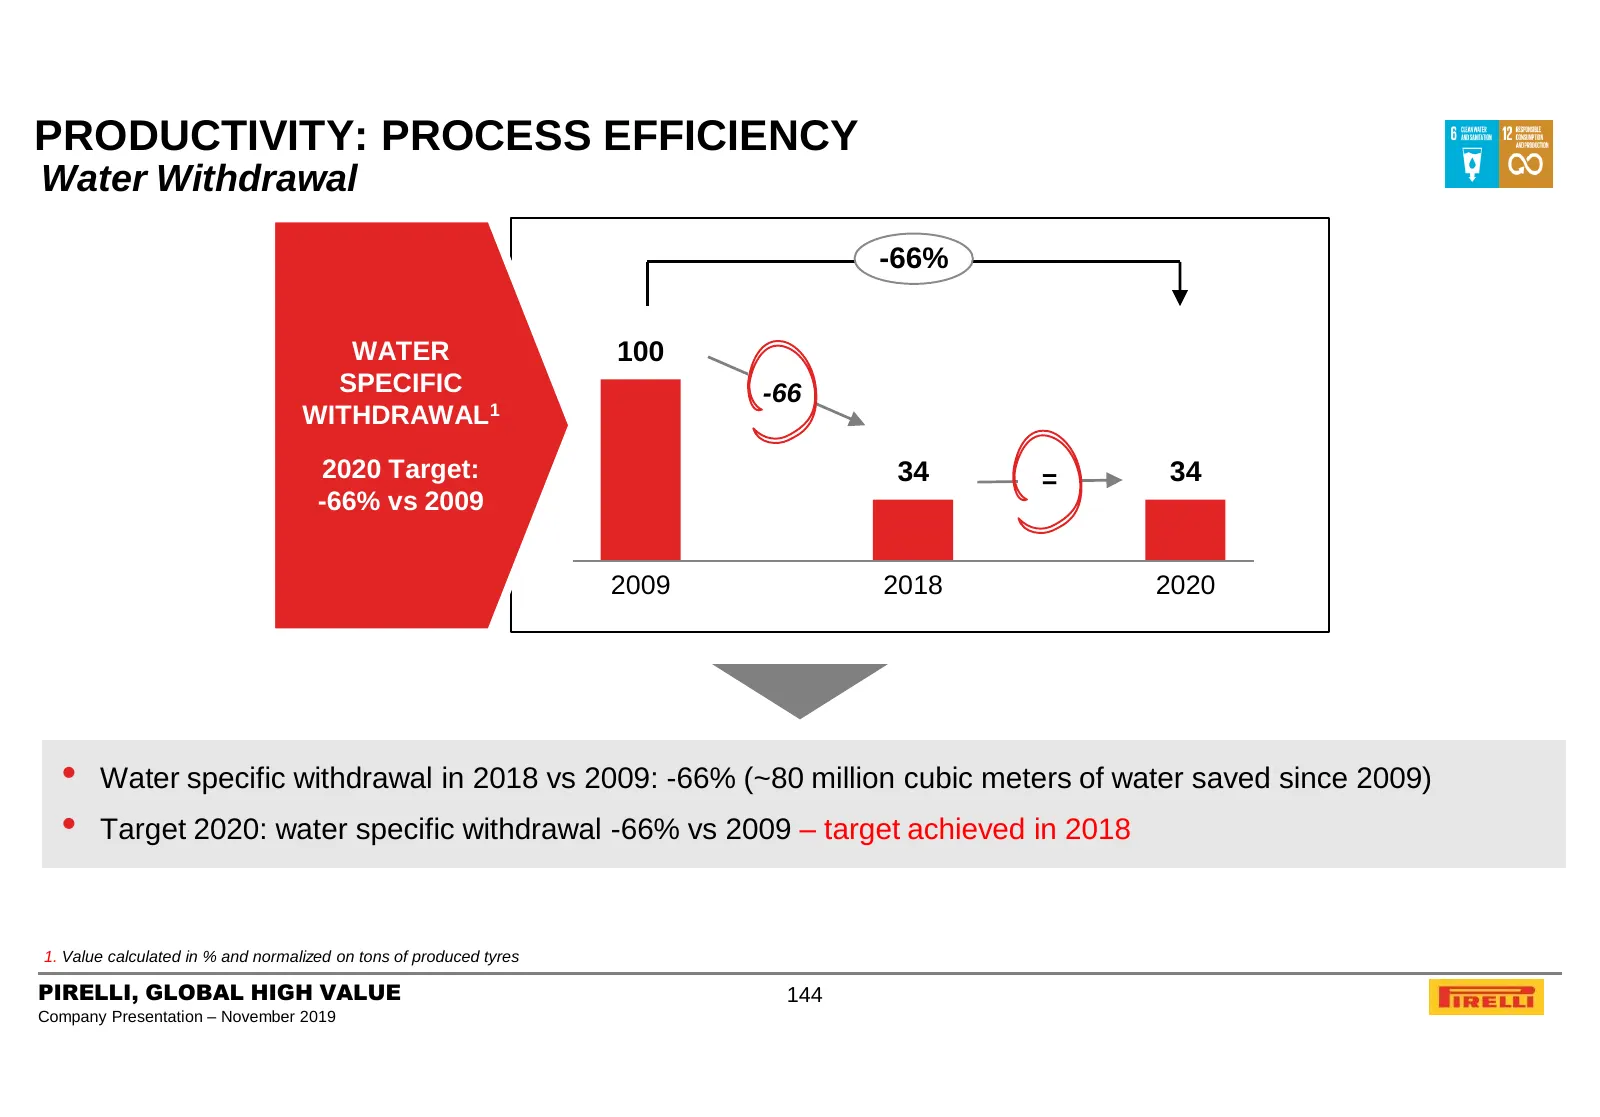
Slide 144: Productivity: Process Efficiency – Water Withdrawal
PRODUCTIVITY: PROCESS EFFICIENCY Water Withdrawal -66% WATER 100 SPECIFIC -66 WITHDRAWAL1 2020 Target: 34 = 34 -66% vs 2009 2009 2018 2020 • Water specific withdrawal in 2018 vs 2009: -66% (~80 million cubic meters of water saved since 2009) • Target 2020: water specific withdrawal -66% vs 2009 – ta
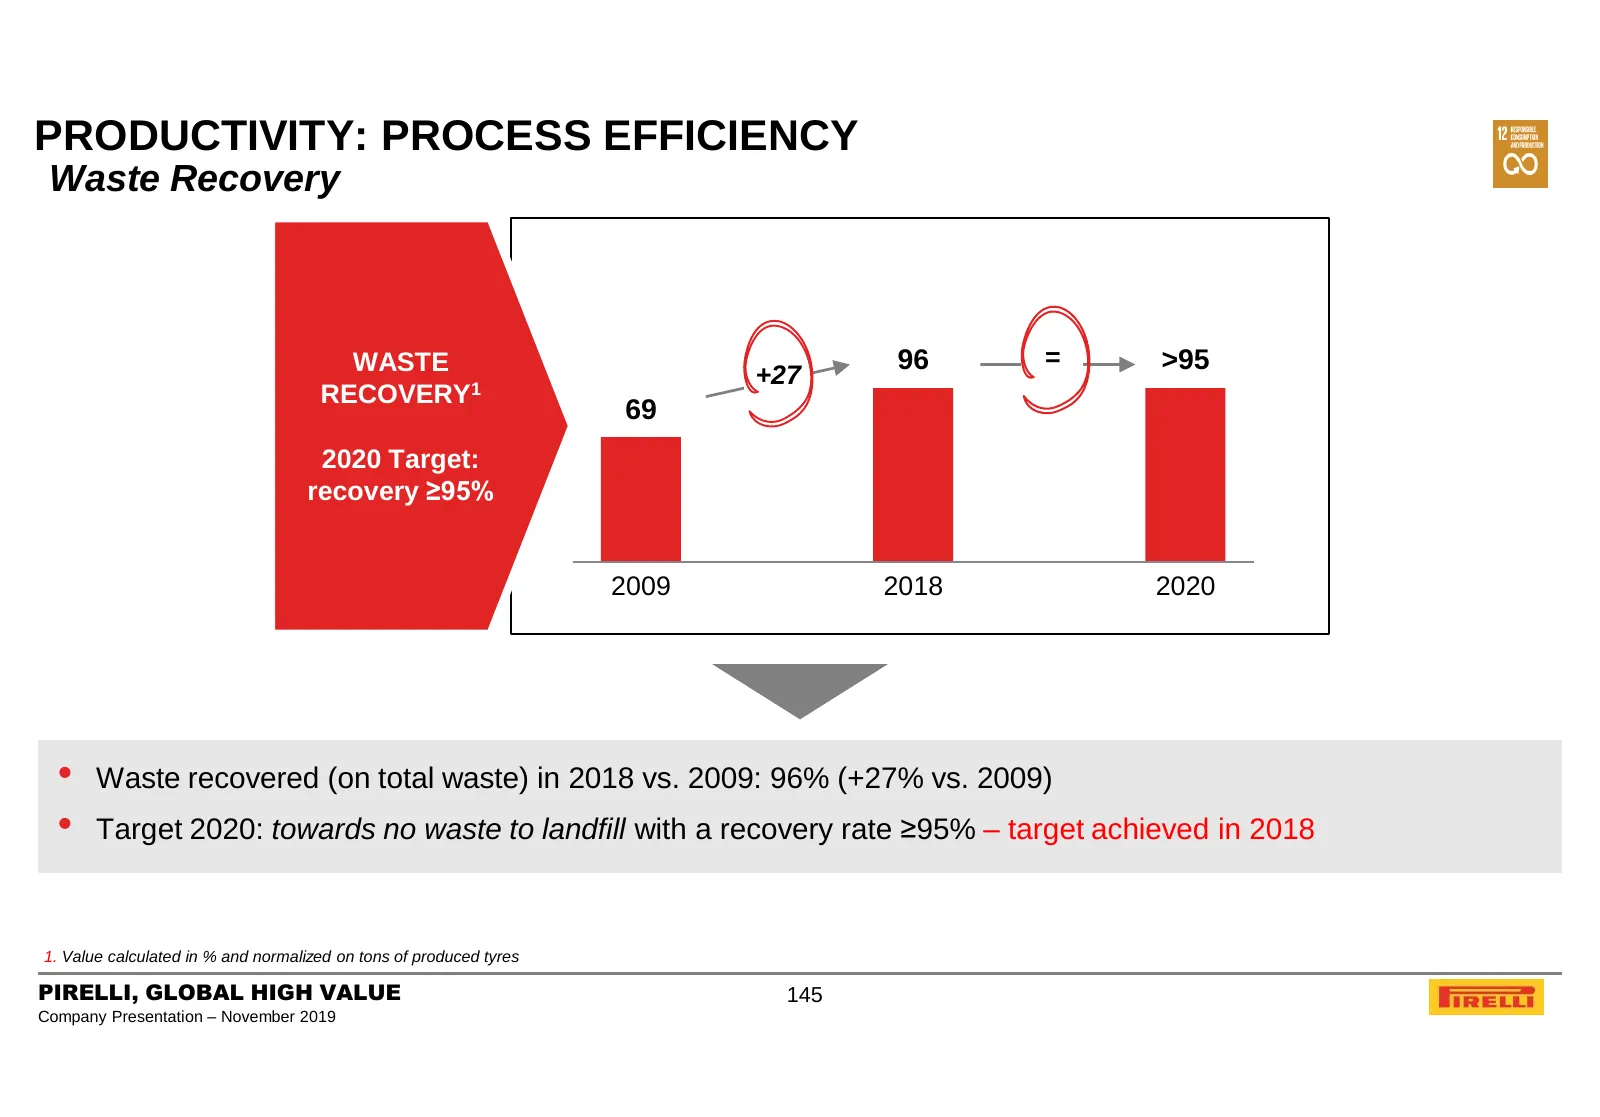
Slide 145: Productivity: Process Efficiency – Waste Recovery
PRODUCTIVITY: PROCESS EFFICIENCY Waste Recovery WASTE 96 = >95 +27 RECOVERY1 69 2020 Target: recovery ≥95% 2009 2018 2020 • Waste recovered (on total waste) in 2018 vs. 2009: 96% (+27% vs. 2009) • Target 2020: towards no waste to landfill with a recovery rate ≥95% – target achieved in 2018 1. Value
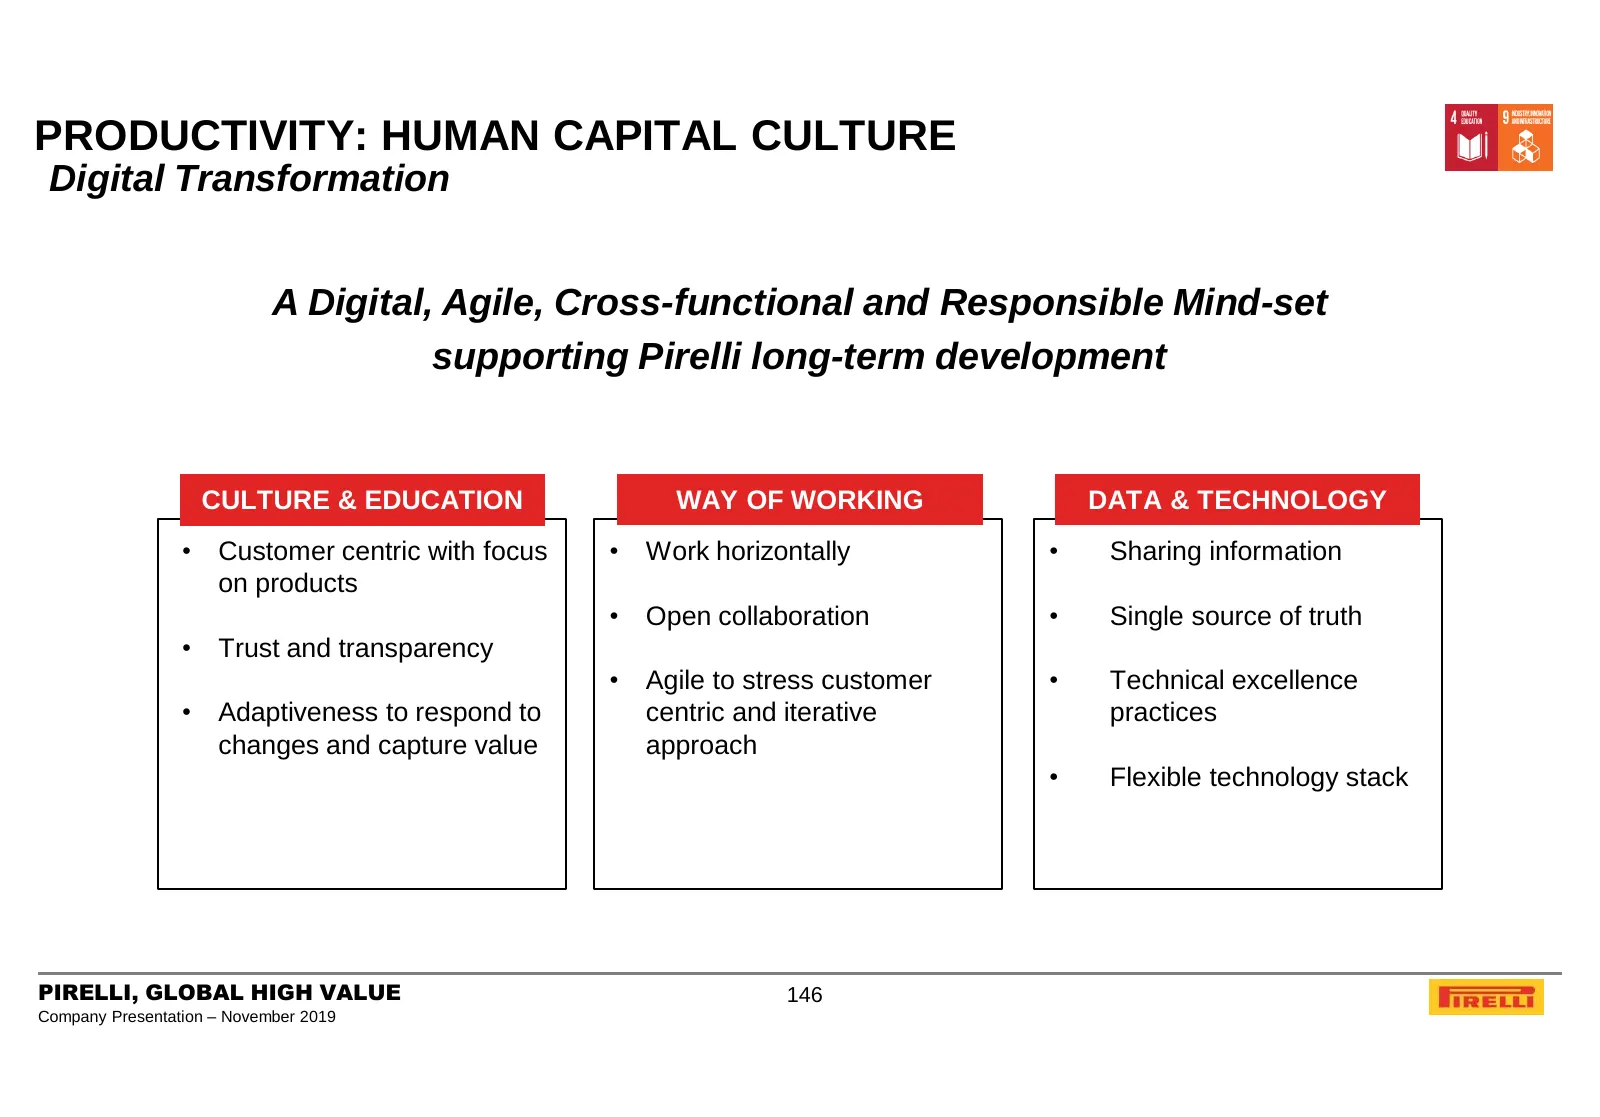
Slide 146: Productivity: Human Capital Culture
PRODUCTIVITY: HUMAN CAPITAL CULTURE Digital Transformation A Digital, Agile, Cross-functional and Responsible Mind-set supporting Pirelli long-term development CULTURE & EDUCATION WAY OF WORKING DATA & TECHNOLOGY • Customer centric with focus • Work horizontally • Sharing information on products • O
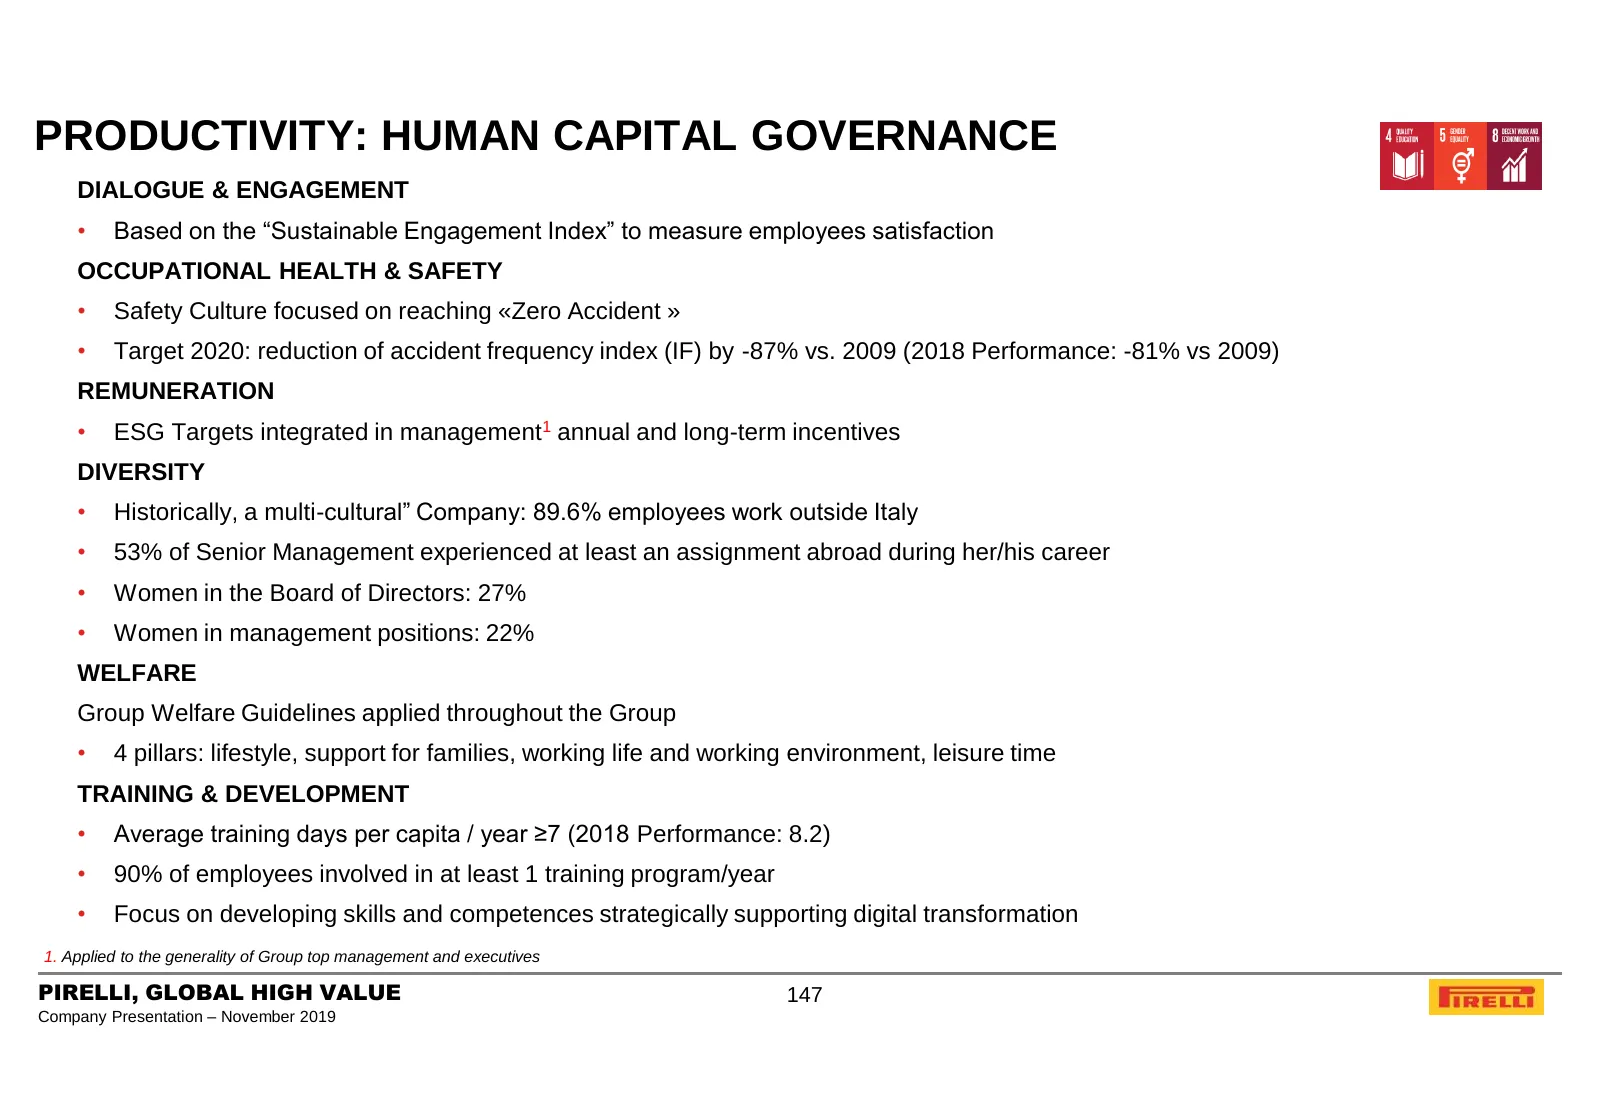
Slide 147: Productivity: Human Capital Governance
PRODUCTIVITY: HUMAN CAPITAL GOVERNANCE DIALOGUE & ENGAGEMENT • Based on the “Sustainable Engagement Index” to measure employees satisfaction OCCUPATIONAL HEALTH & SAFETY • Safety Culture focused on reaching «Zero Accident » • Target 2020: reduction of accident frequency index (IF) by -87% vs. 2009 (
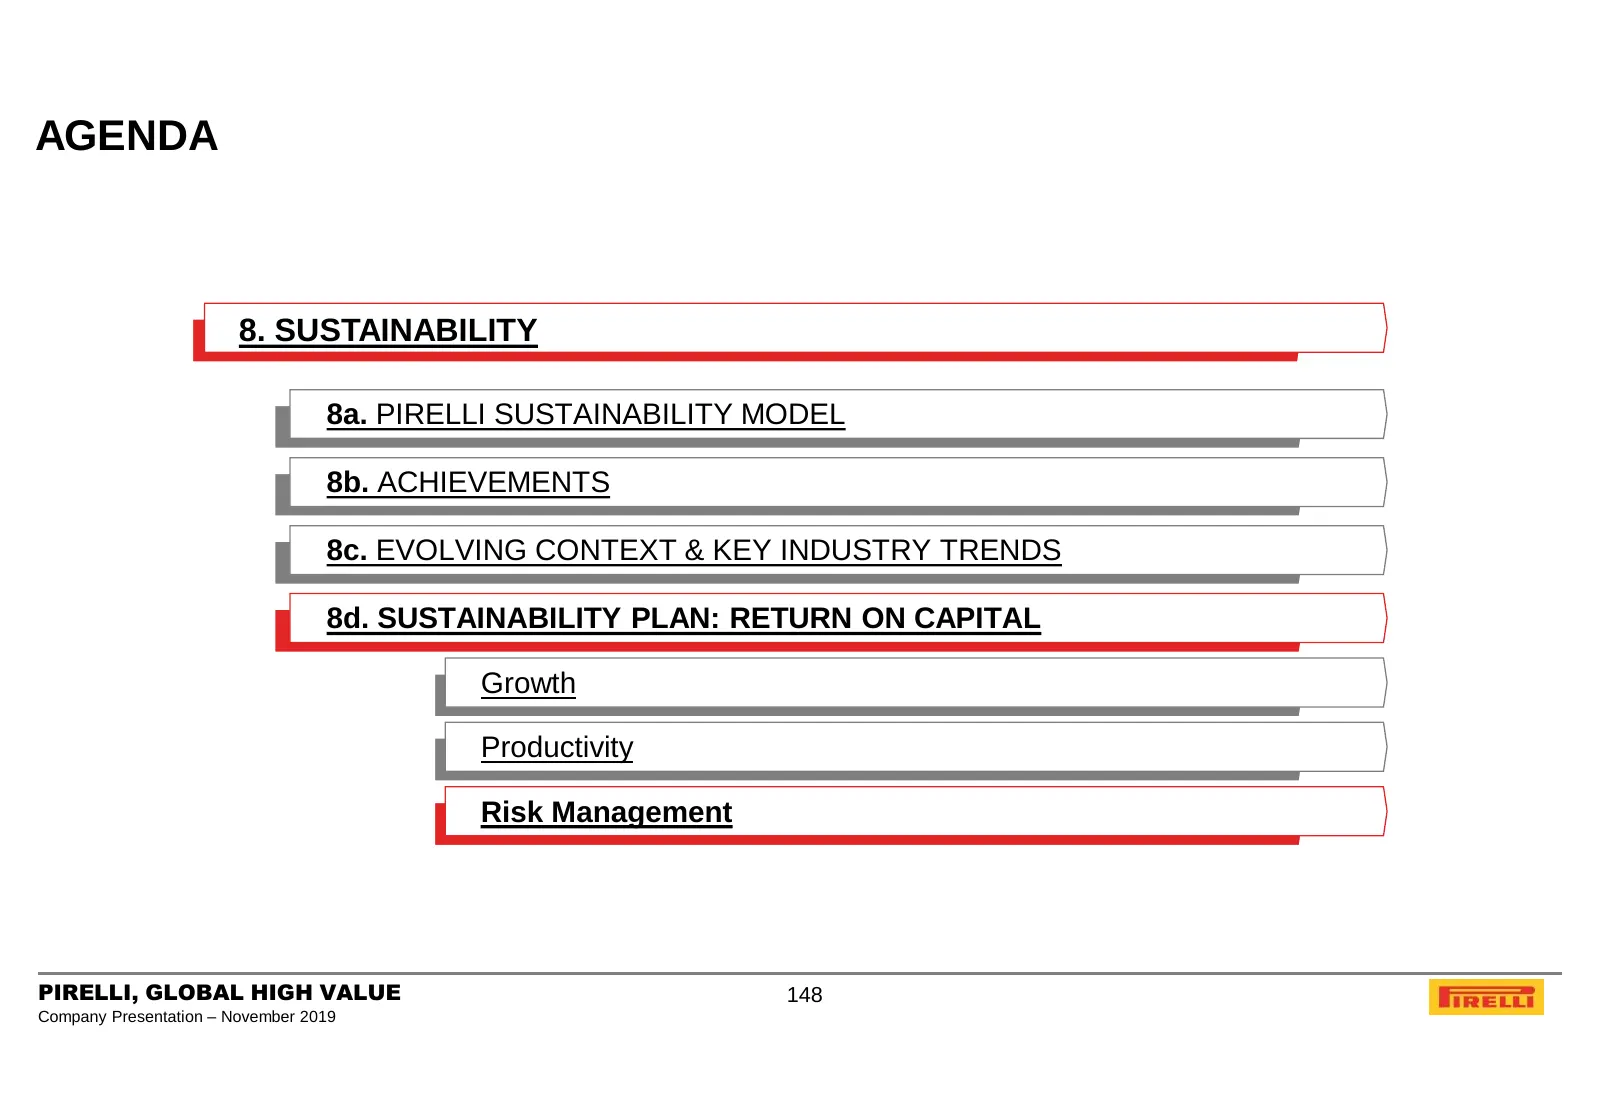
Slide 148: Agenda – Sustainability
AGENDA 8. SUSTAINABILITY 8a. PIRELLI SUSTAINABILITY MODEL 8b. ACHIEVEMENTS 8c. EVOLVING CONTEXT & KEY INDUSTRY TRENDS 8d. SUSTAINABILITY PLAN: RETURN ON CAPITAL Growth Productivity Risk Management PIRELLI, GLOBAL HIGH VALUE 148 Company Presentation – November 2019
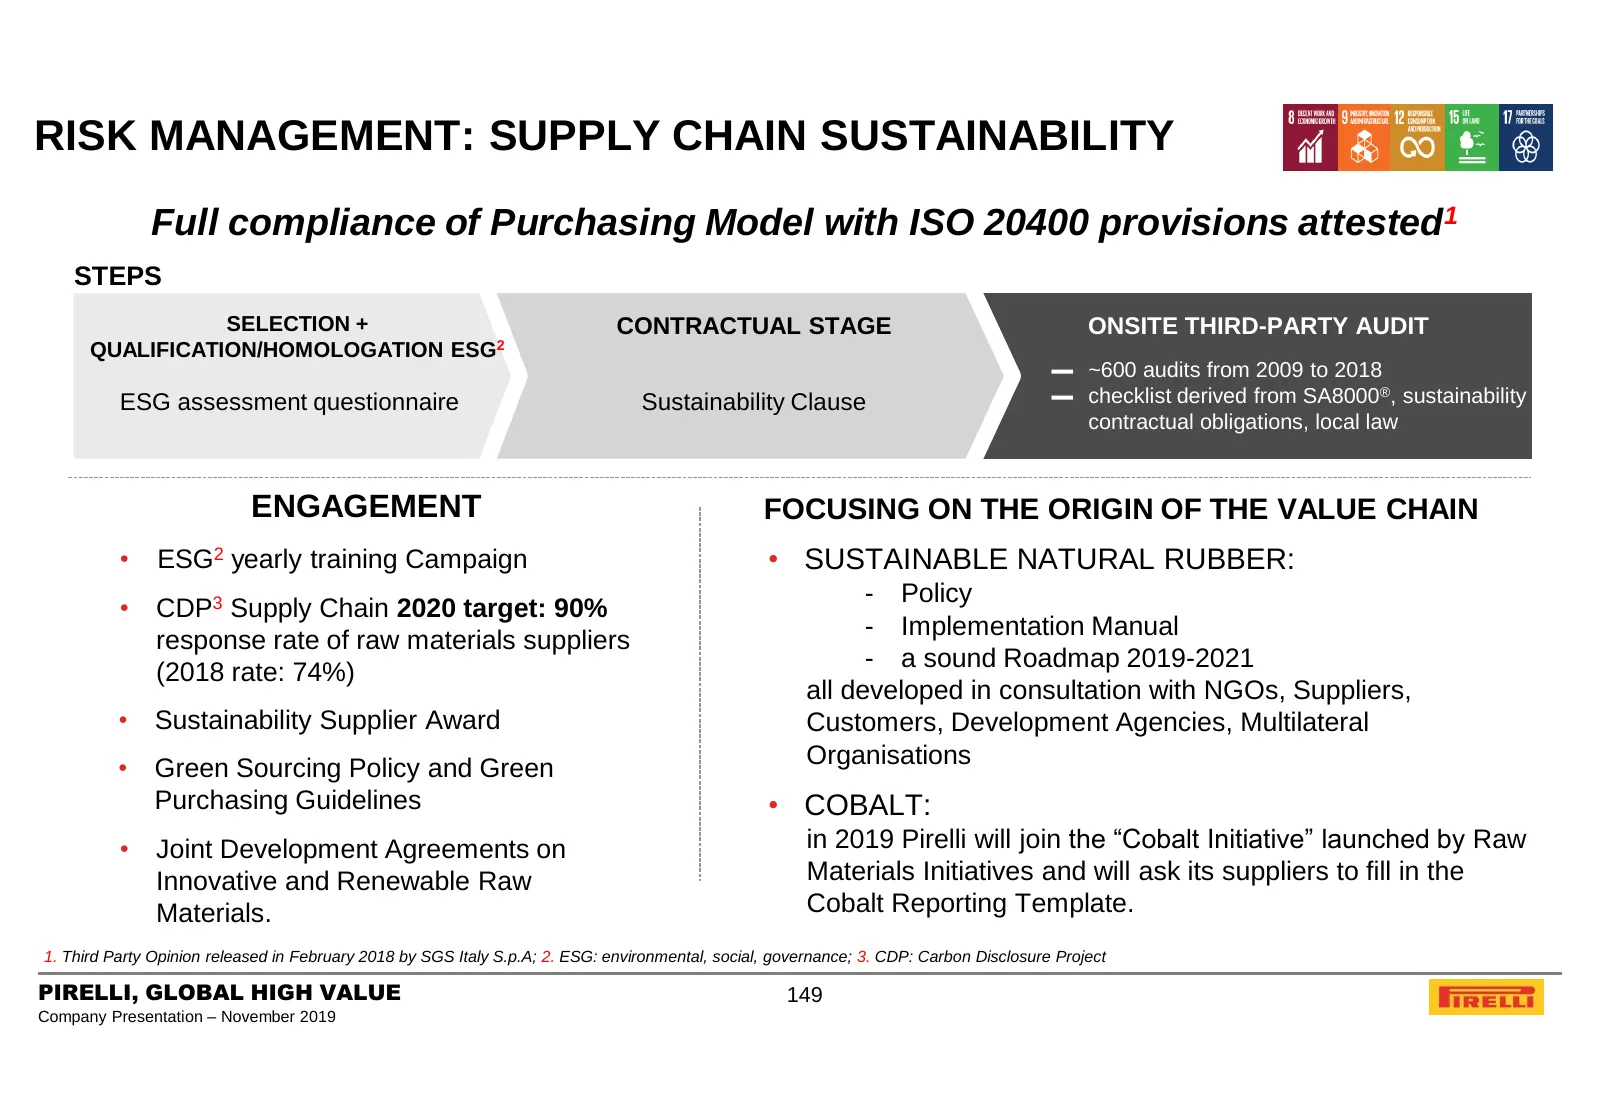
Slide 149: Risk Management: Supply Chain Sustainability
RISK MANAGEMENT: SUPPLY CHAIN SUSTAINABILITY Full compliance of Purchasing Model with ISO 20400 provisions attested1 STEPS SELECTION + CONTRACTUAL STAGE ONSITE THIRD-PARTY AUDIT QUALIFICATION/HOMOLOGATION ESG2 ▬ ~600 audits from 2009 to 2018 ESG assessment questionnaire Sustainability Clause ▬ check
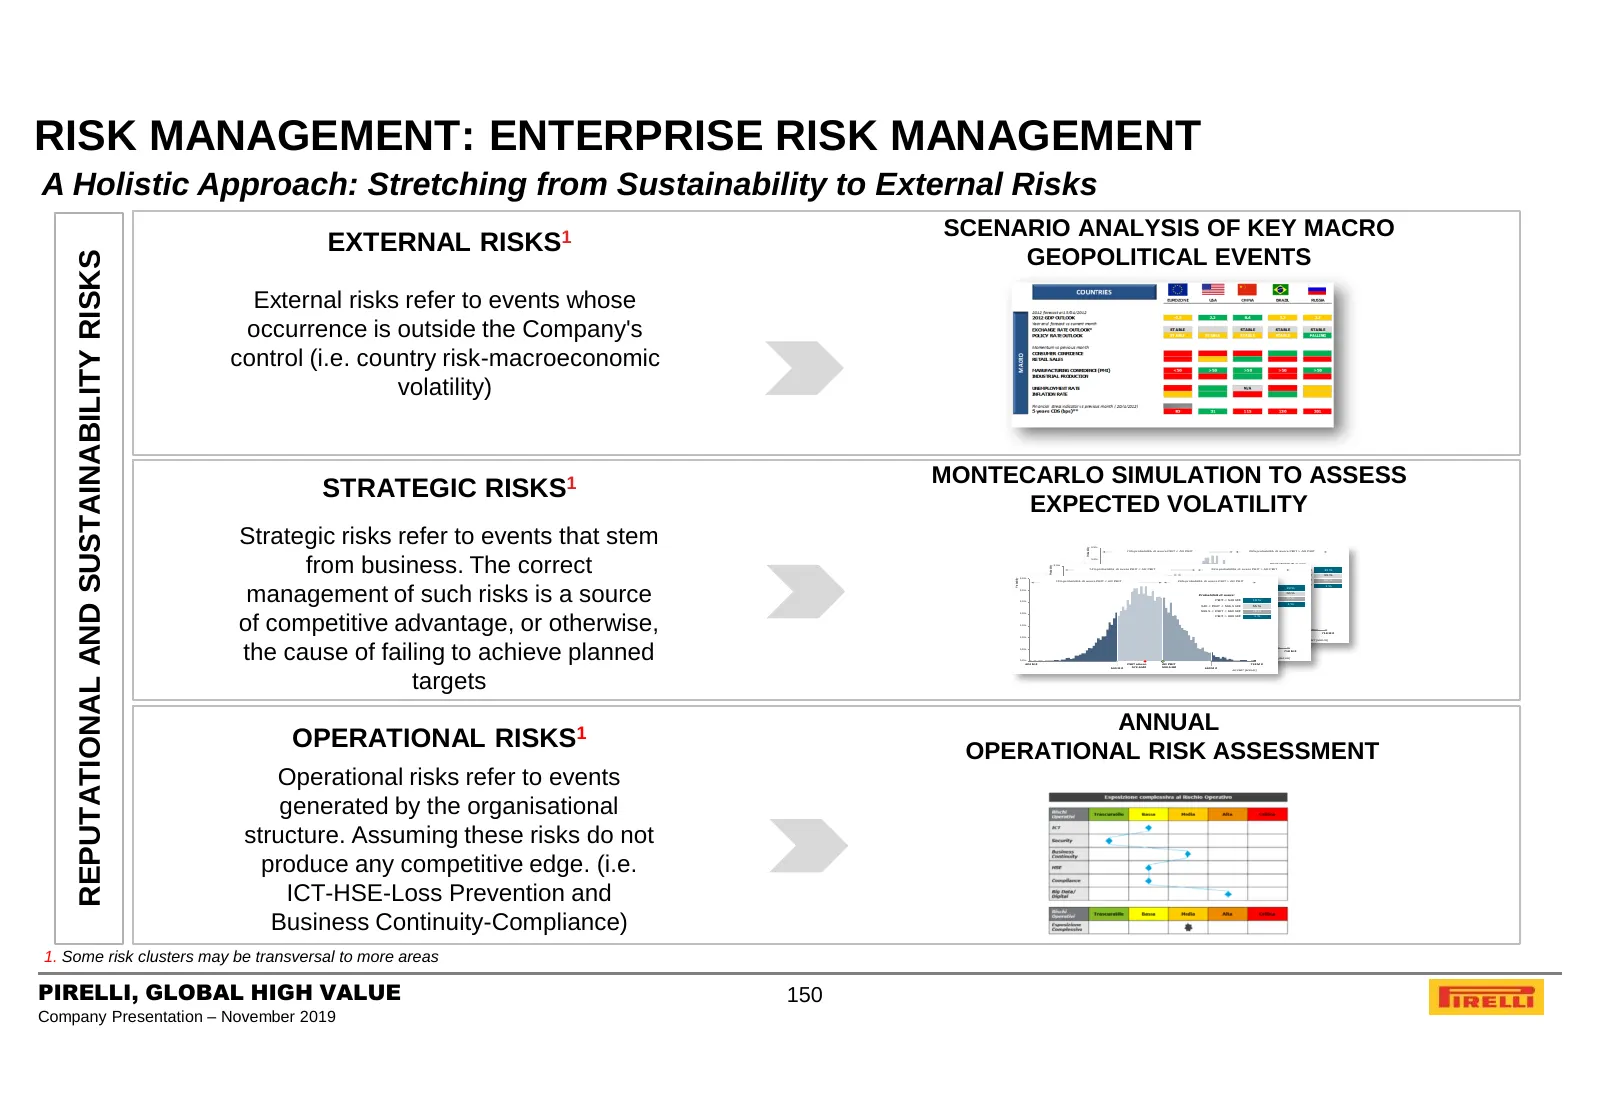
Slide 150: Risk Management: Enterprise Risk Management
RISK MANAGEMENT: ENTERPRISE RISK MANAGEMENT A Holistic Approach: Stretching from Sustainability to External Risks SCENARIO ANALYSIS OF KEY MACRO EXTERNAL RISKS1 GEOPOLITICAL EVENTS REPUTATIONAL AND SUSTAINABILITY RISKS External risks refer to events whose occurrence is outside the Company's control
Slide 151: Agenda
AGENDA 1. PIRELLI AT A GLANCE 2. BUSINESS MODEL 3. KEY INVESTMENT HIGHLIGHTS 4. MARKET AND COMPETITION 5. 9M 2019 FINANCIAL RESULTS AND 2019 OUTLOOK 6. FY 2018 FINANCIAL RESULTS AND 2019 OUTLOOK 7. GOVERNANCE 8. SUSTAINABILITY 9. APPENDIX PIRELLI, GLOBAL HIGH VALUE 151 Company Presentation – Novembe
Slide 152: Key Financial Highlights
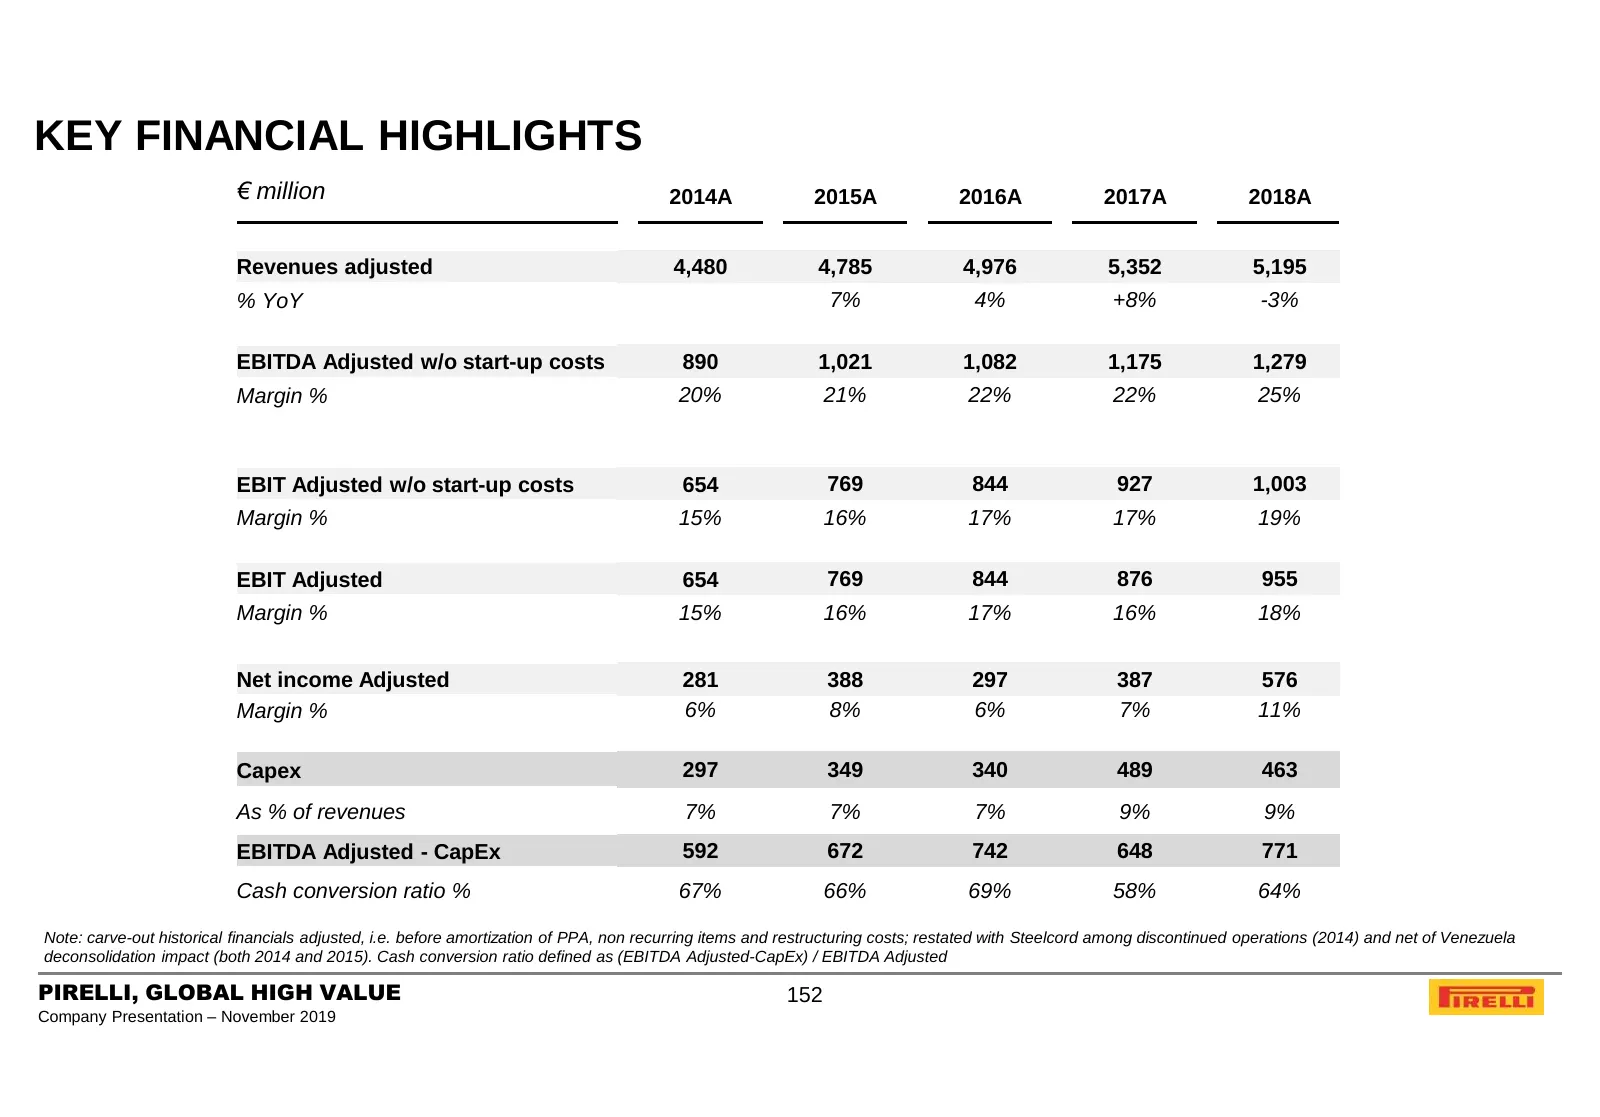
KEY FINANCIAL HIGHLIGHTS € million 2014A 2015A 2016A 2017A 2018A Revenues adjusted 4,480 4,785 4,976 5,352 5,195 % YoY 7% 4% +8% -3% EBITDA Adjusted w/o start-up costs 890 1,021 1,082 1,175 1,279 Margin % 20% 21% 22% 22% 25% EBIT Adjusted w/o start-up costs 654 769 844 927 1,003 Margin % 15% 16% 17%
Slide 153: Best in Class Top Line Growth Driven by High Value
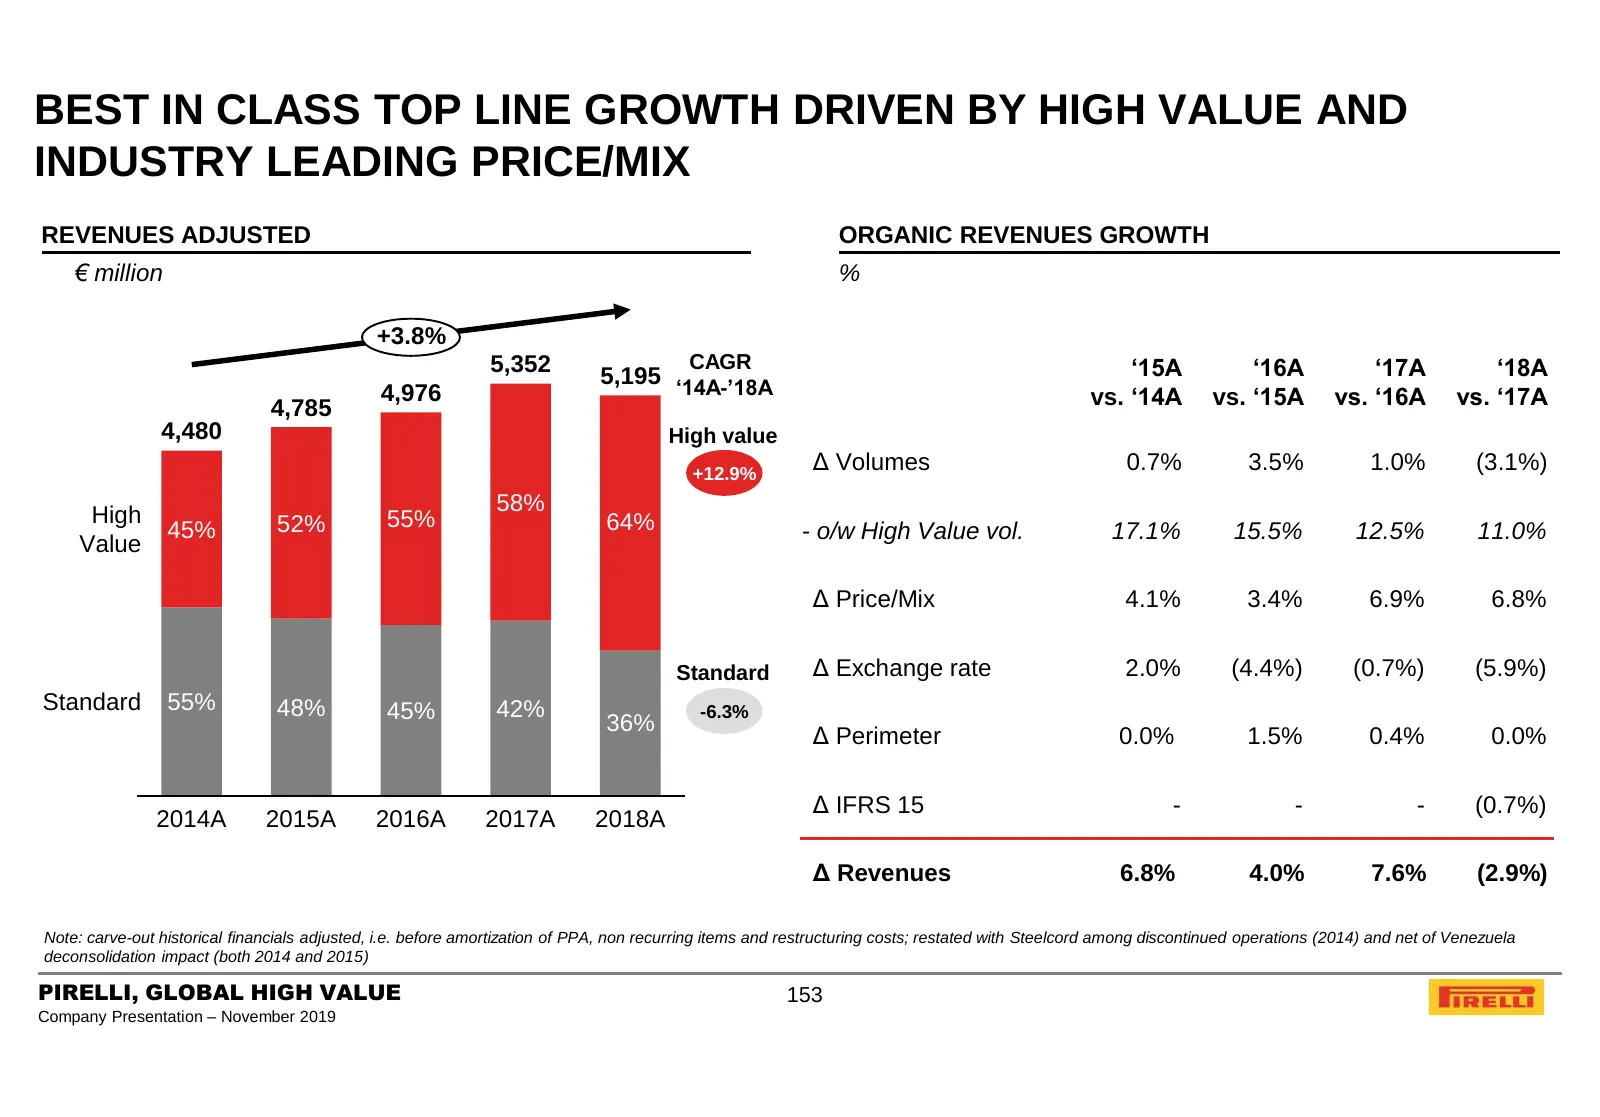
BEST IN CLASS TOP LINE GROWTH DRIVEN BY HIGH VALUE AND INDUSTRY LEADING PRICE/MIX REVENUES ADJUSTED ORGANIC REVENUES GROWTH € million % +3.8% 5,352 CAGR ‘15A ‘16A ‘17A ‘18A 5,195 ‘14A-’18A 4,785 4,976 vs. ‘14A vs. ‘15A vs. ‘16A vs. ‘17A 4,480 High value +12.9% Δ Volumes 0.7% 3.5% 1.0% (3.1%) 58% Hig
Slide 154: High Value Focus with Tangible Impact on Margin
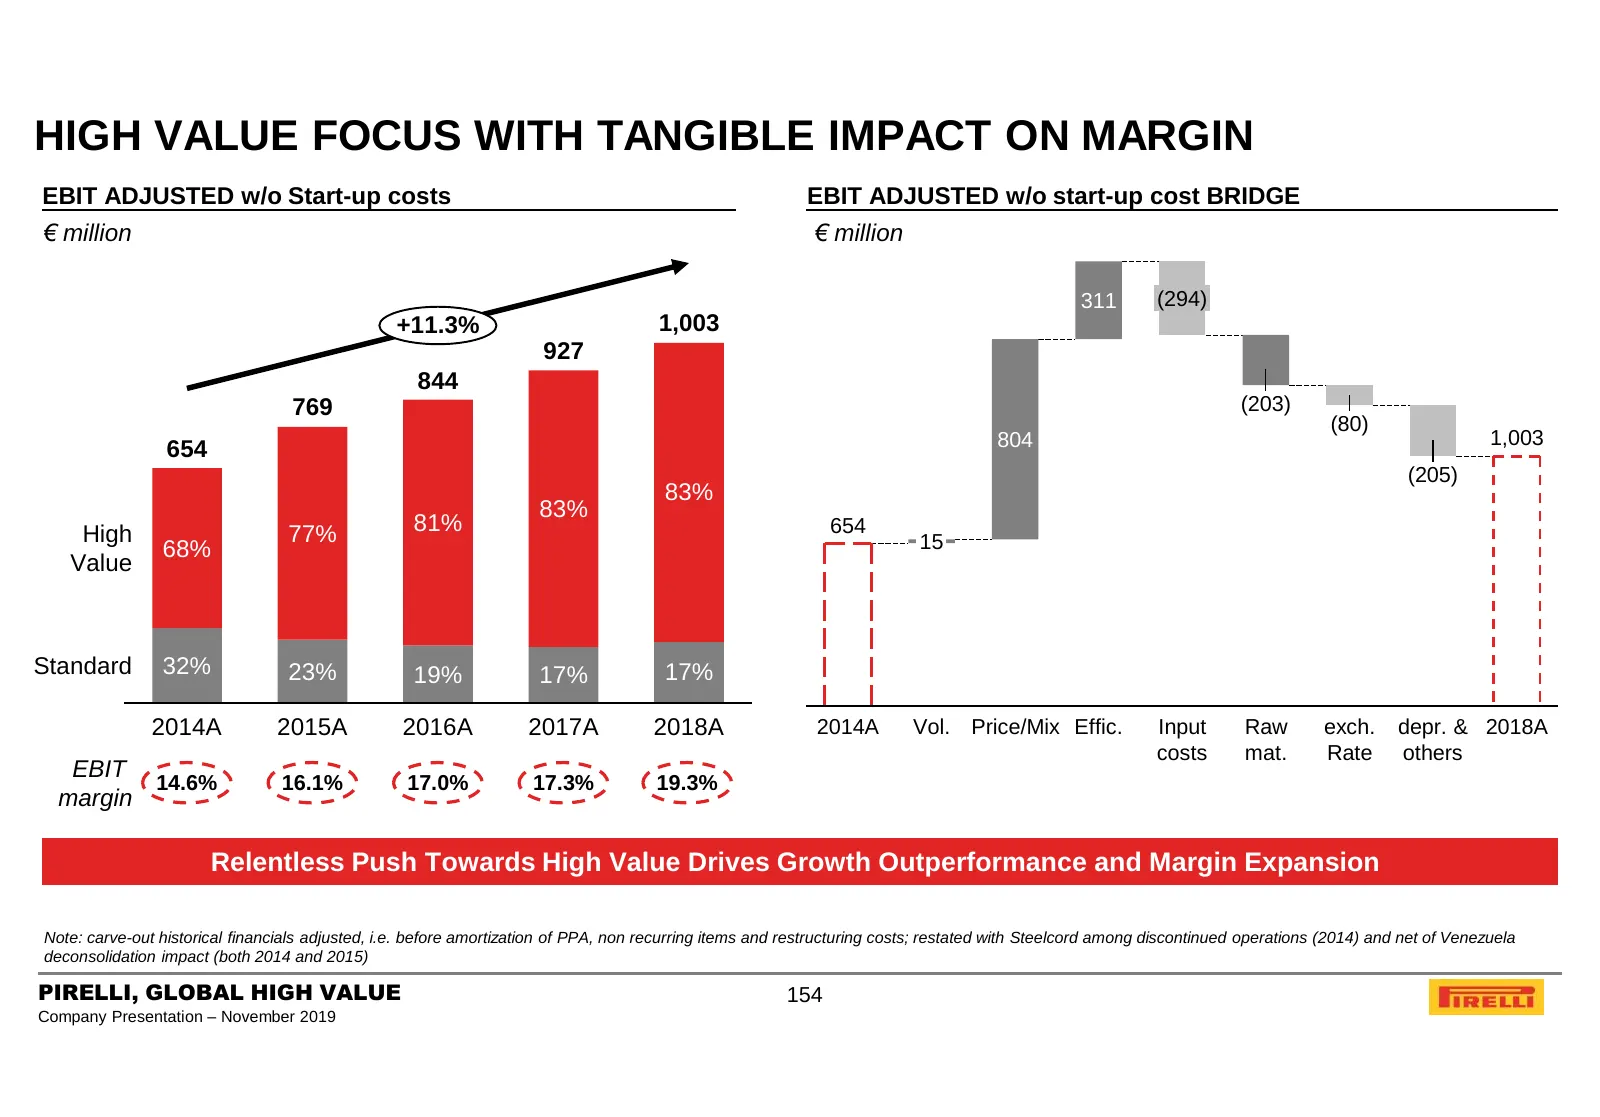
HIGH VALUE FOCUS WITH TANGIBLE IMPACT ON MARGIN EBIT ADJUSTED w/o Start-up costs EBIT ADJUSTED w/o start-up cost BRIDGE € million € million 311 (294) +11.3% 1,003 927 844 769 (203) (80) 804 1,003 654 (205) 83% 83% High 77% 81% 654 68% 15 Value Standard 32% 23% 19% 17% 17% 2014A 2015A 2016A 2017A 201
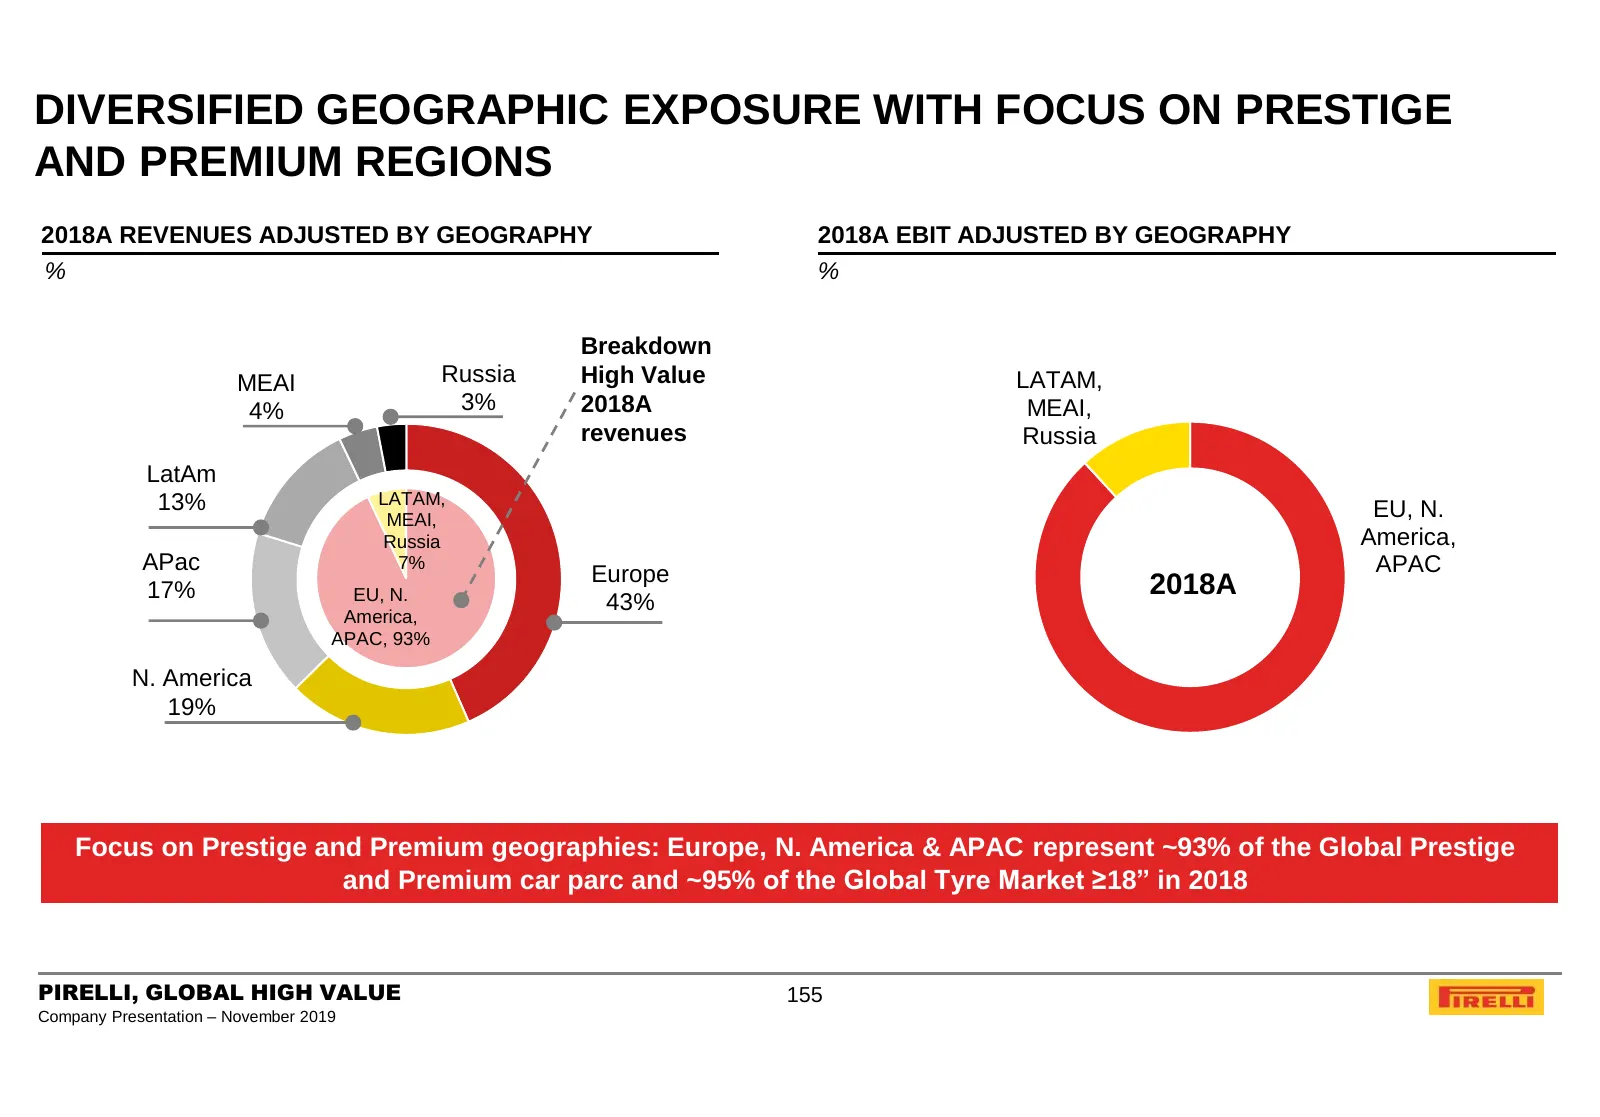
Slide 155: Diversified Geographic Exposure with Focus on Prestige and Premium
DIVERSIFIED GEOGRAPHIC EXPOSURE WITH FOCUS ON PRESTIGE AND PREMIUM REGIONS 2018A REVENUES ADJUSTED BY GEOGRAPHY 2018A EBIT ADJUSTED BY GEOGRAPHY % % Breakdown MEAI Russia High Value LATAM, 4% 3% 2018A MEAI, revenues Russia LatAm 13% LATAM, MEAI, EU, N. Russia America, APac 7% APAC Europe 2018A 17% E
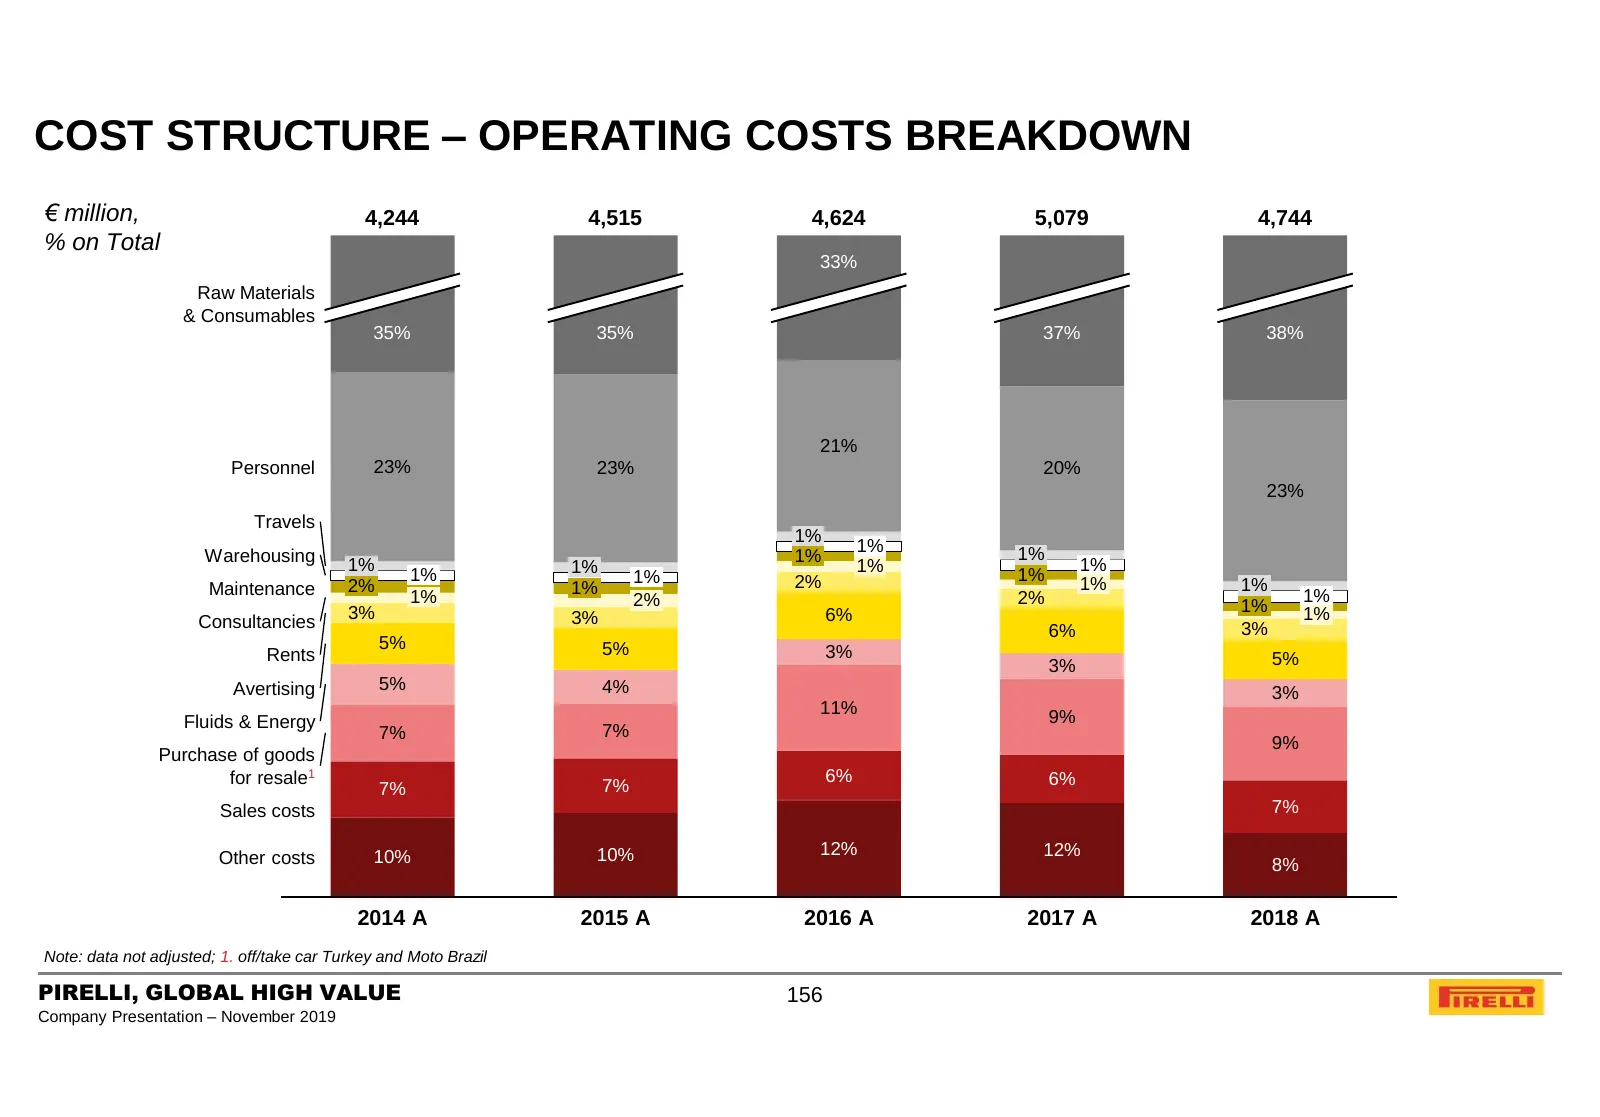
Slide 156: Cost Structure – Operating Costs Breakdown
COST STRUCTURE – OPERATING COSTS BREAKDOWN € million, 4,244 4,515 4,624 5,079 4,744 % on Total 33% Raw Materials & Consumables 35% 35% 37% 38% 21% Personnel 23% 23% 20% 23% Travels 1% 1% 1% Warehousing 1% 1% 1% 1% 1% 1% 1% 2% 1% 1% Maintenance 2% 1% 1% 1% 2% 2% 1% 3% 6% 1% 1% Consultancies 3% 6% 3%
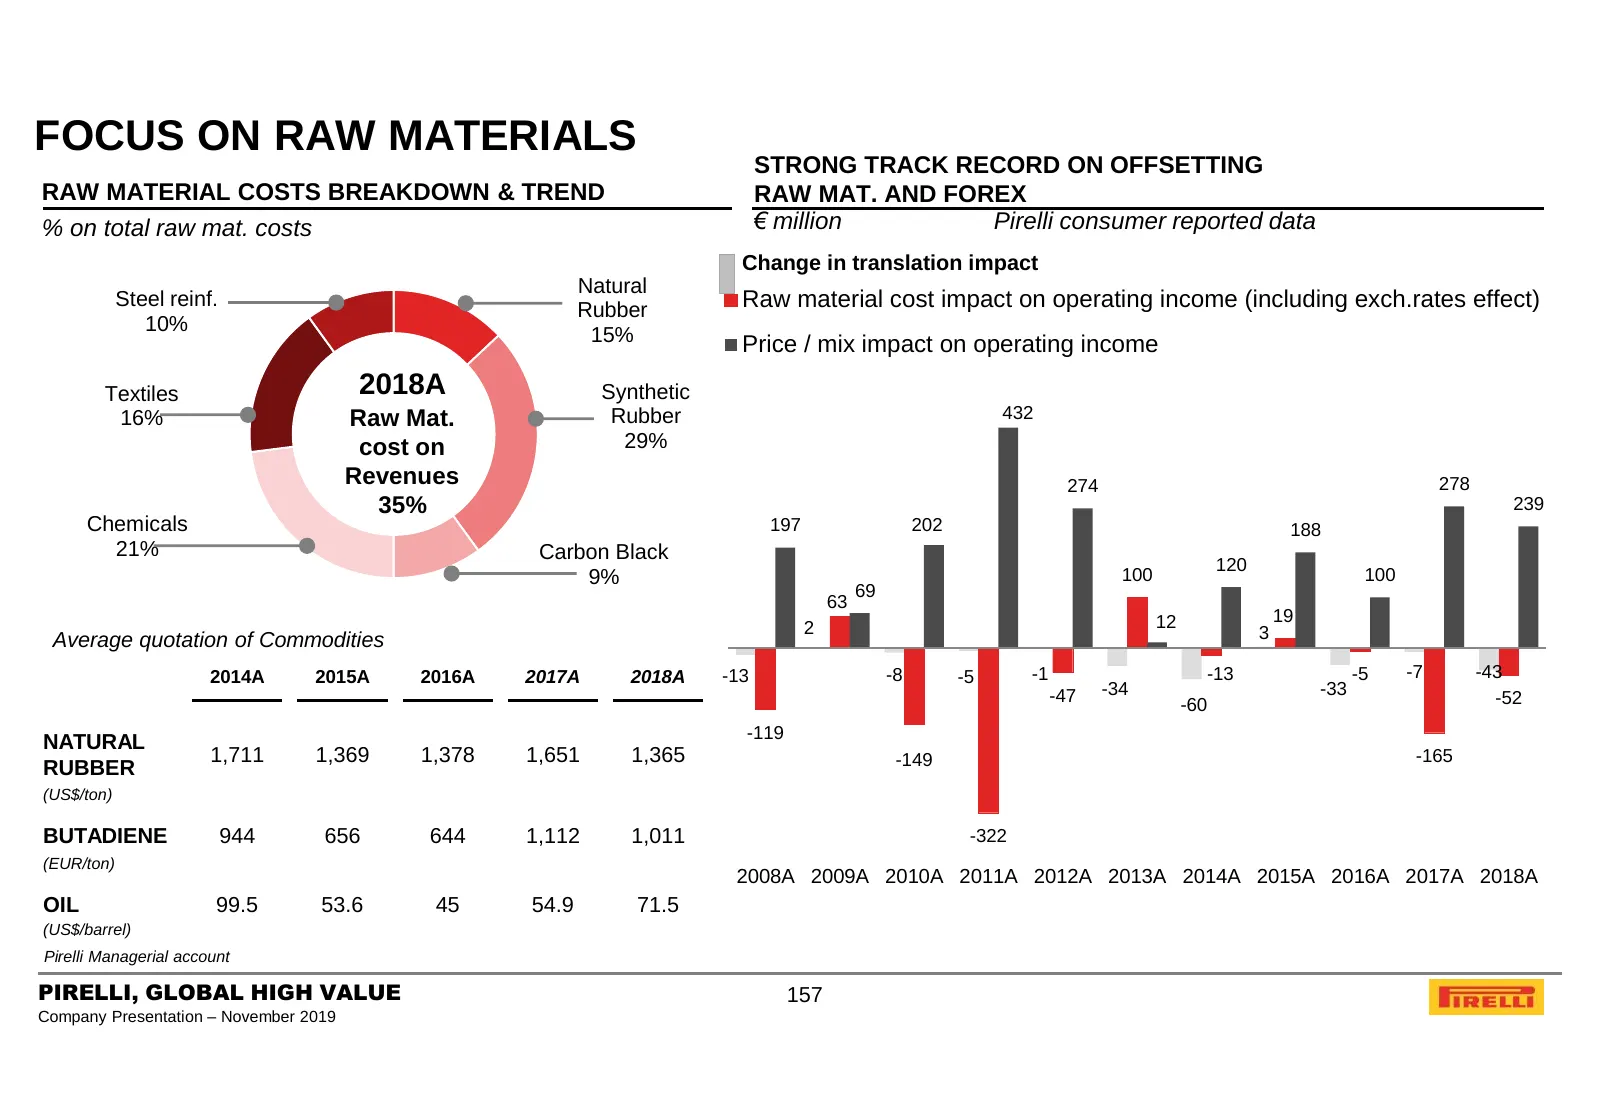
Slide 157: Focus on Raw Materials
FOCUS ON RAW MATERIALS STRONG TRACK RECORD ON OFFSETTING RAW MATERIAL COSTS BREAKDOWN & TREND RAW MAT. AND FOREX % on total raw mat. costs € million Pirelli consumer reported data Change in translation impact Natural Steel reinf. Rubber Raw material cost impact on operating income (including exch.ra
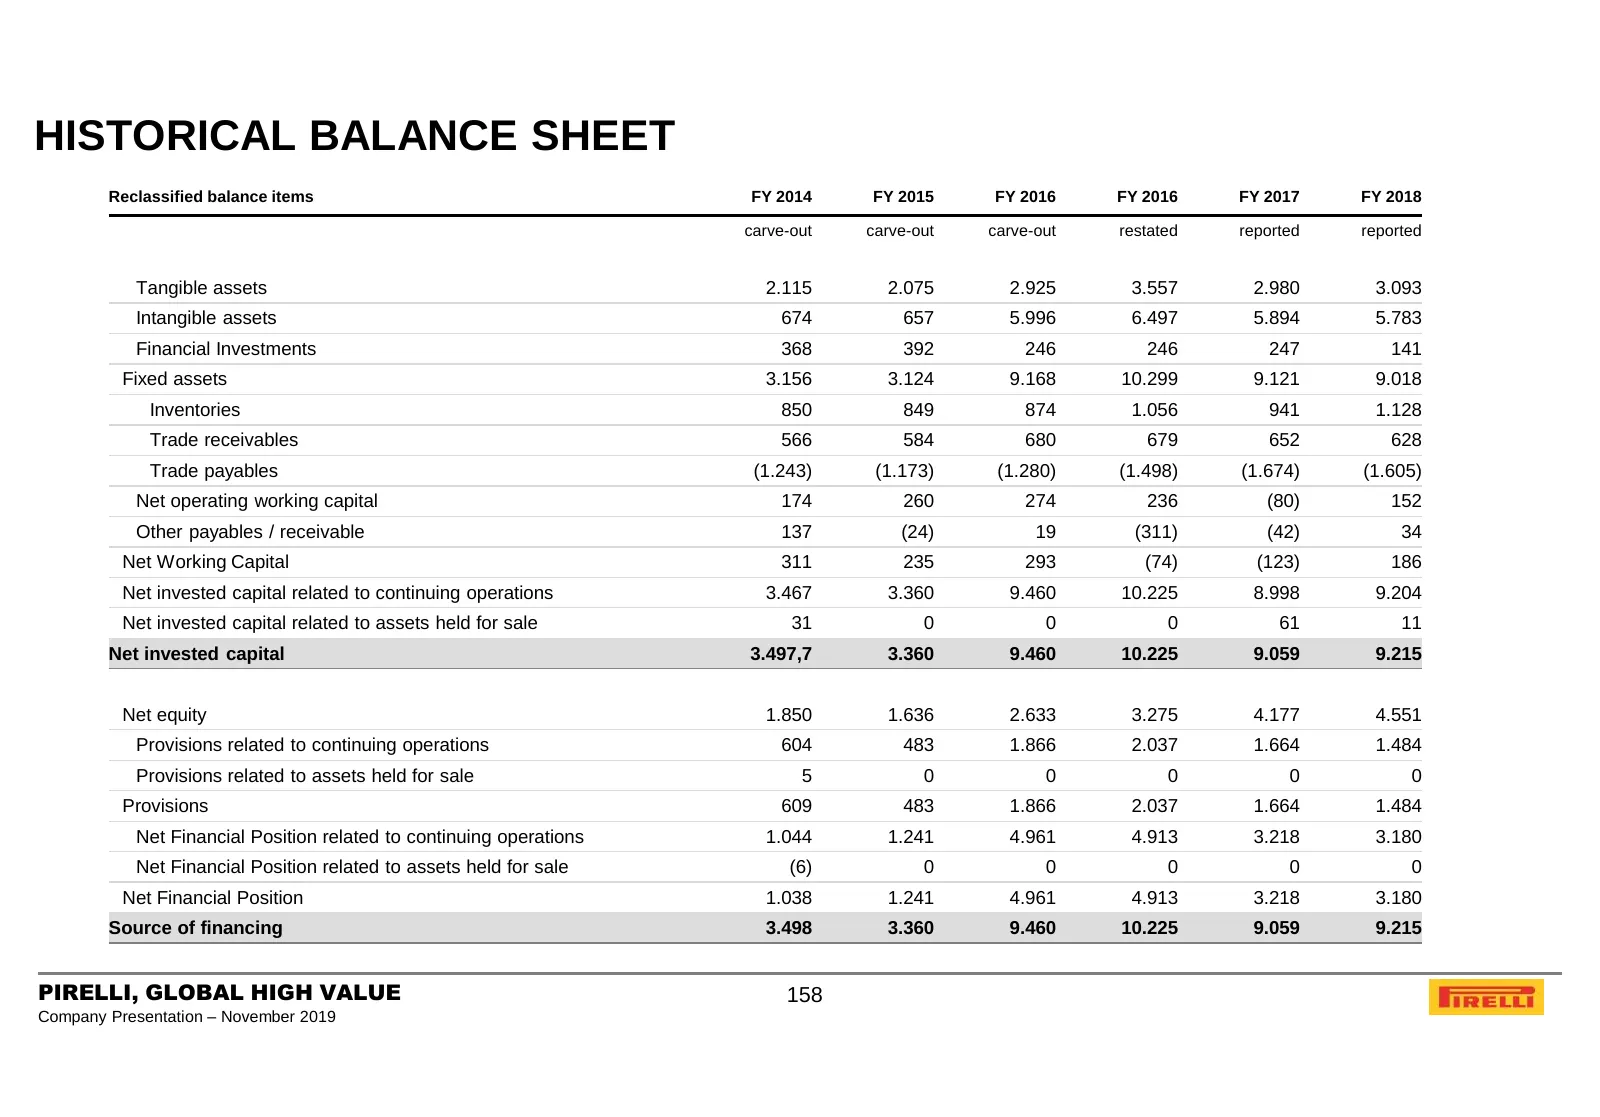
Slide 158: Historical Balance Sheet
HISTORICAL BALANCE SHEET Reclassified balance items FY 2014 FY 2015 FY 2016 FY 2016 FY 2017 FY 2018 carve-out carve-out carve-out restated reported reported Tangible assets 2.115 2.075 2.925 3.557 2.980 3.093 Intangible assets 674 657 5.996 6.497 5.894 5.783 Financial Investments 368 392 246 246 247
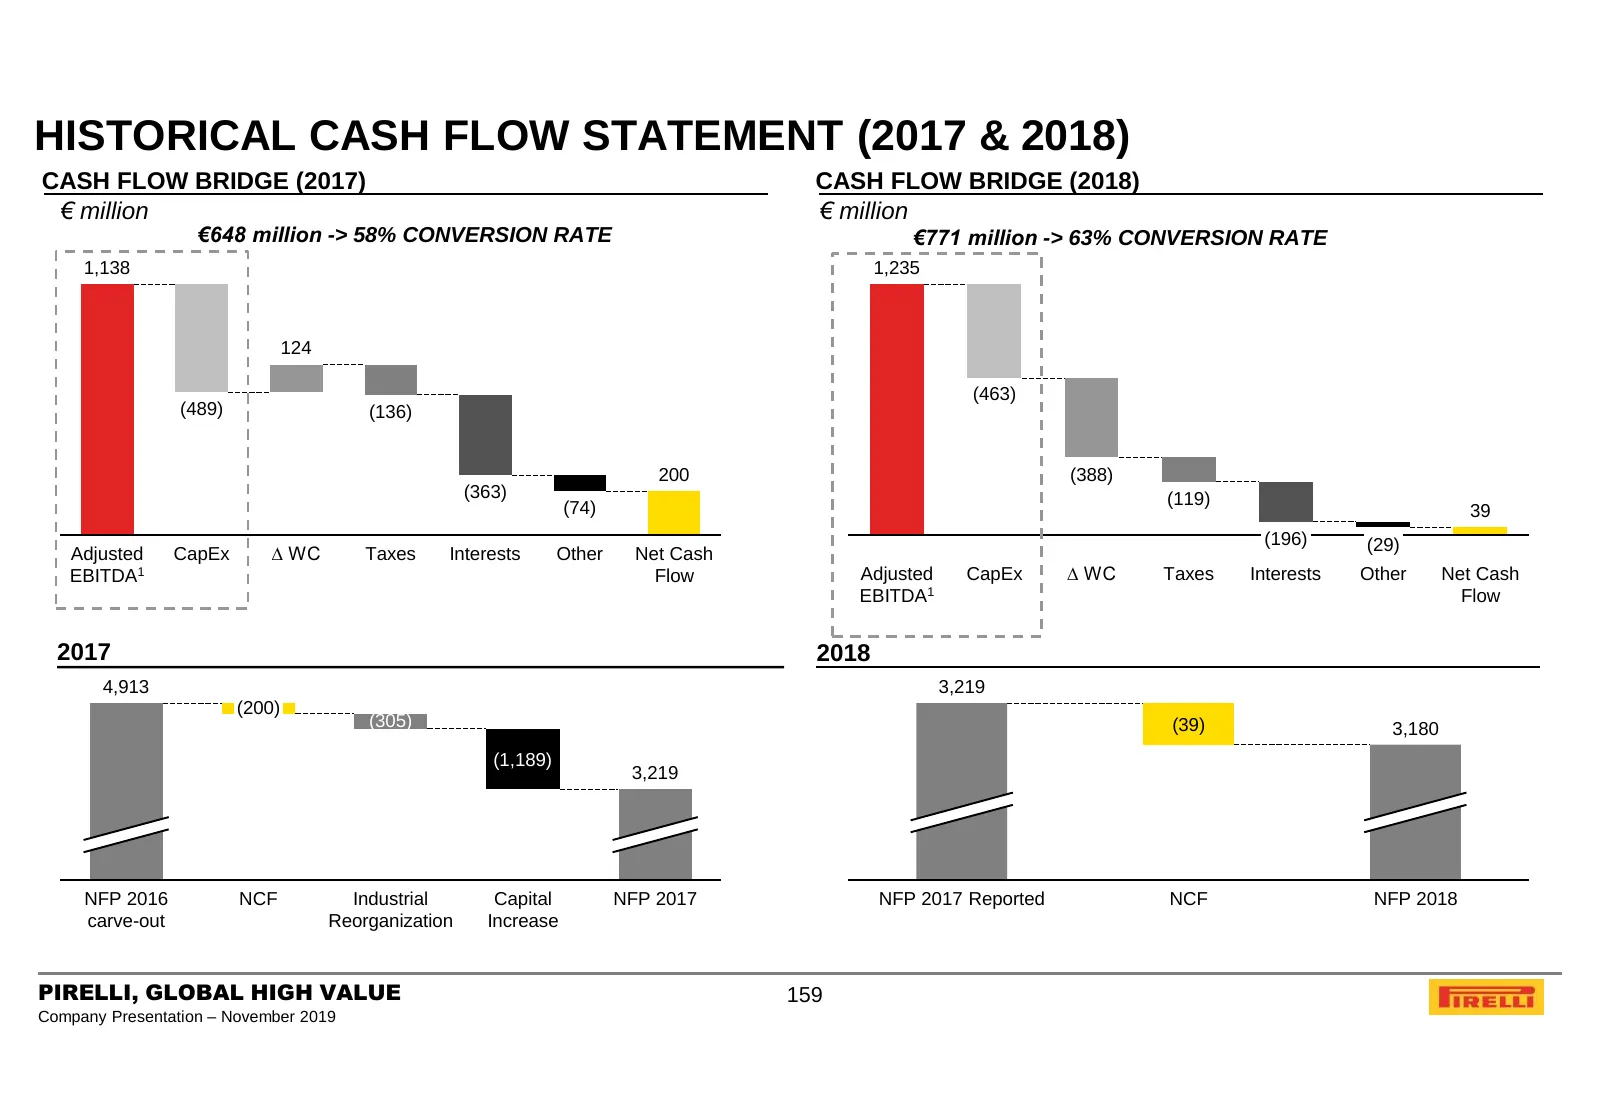
Slide 159: Historical Cash Flow Statement (2017 & 2018)
HISTORICAL CASH FLOW STATEMENT (2017 & 2018) CASH FLOW BRIDGE (2017) CASH FLOW BRIDGE (2018) € million € million €648 million -> 58% CONVERSION RATE €771 million -> 63% CONVERSION RATE 1,138 1,235 124 (463) (489) (136) 200 (388) (363) (119) (74) 39 (196) (29) Adjusted CapEx ∆ WC Taxes Interests Othe
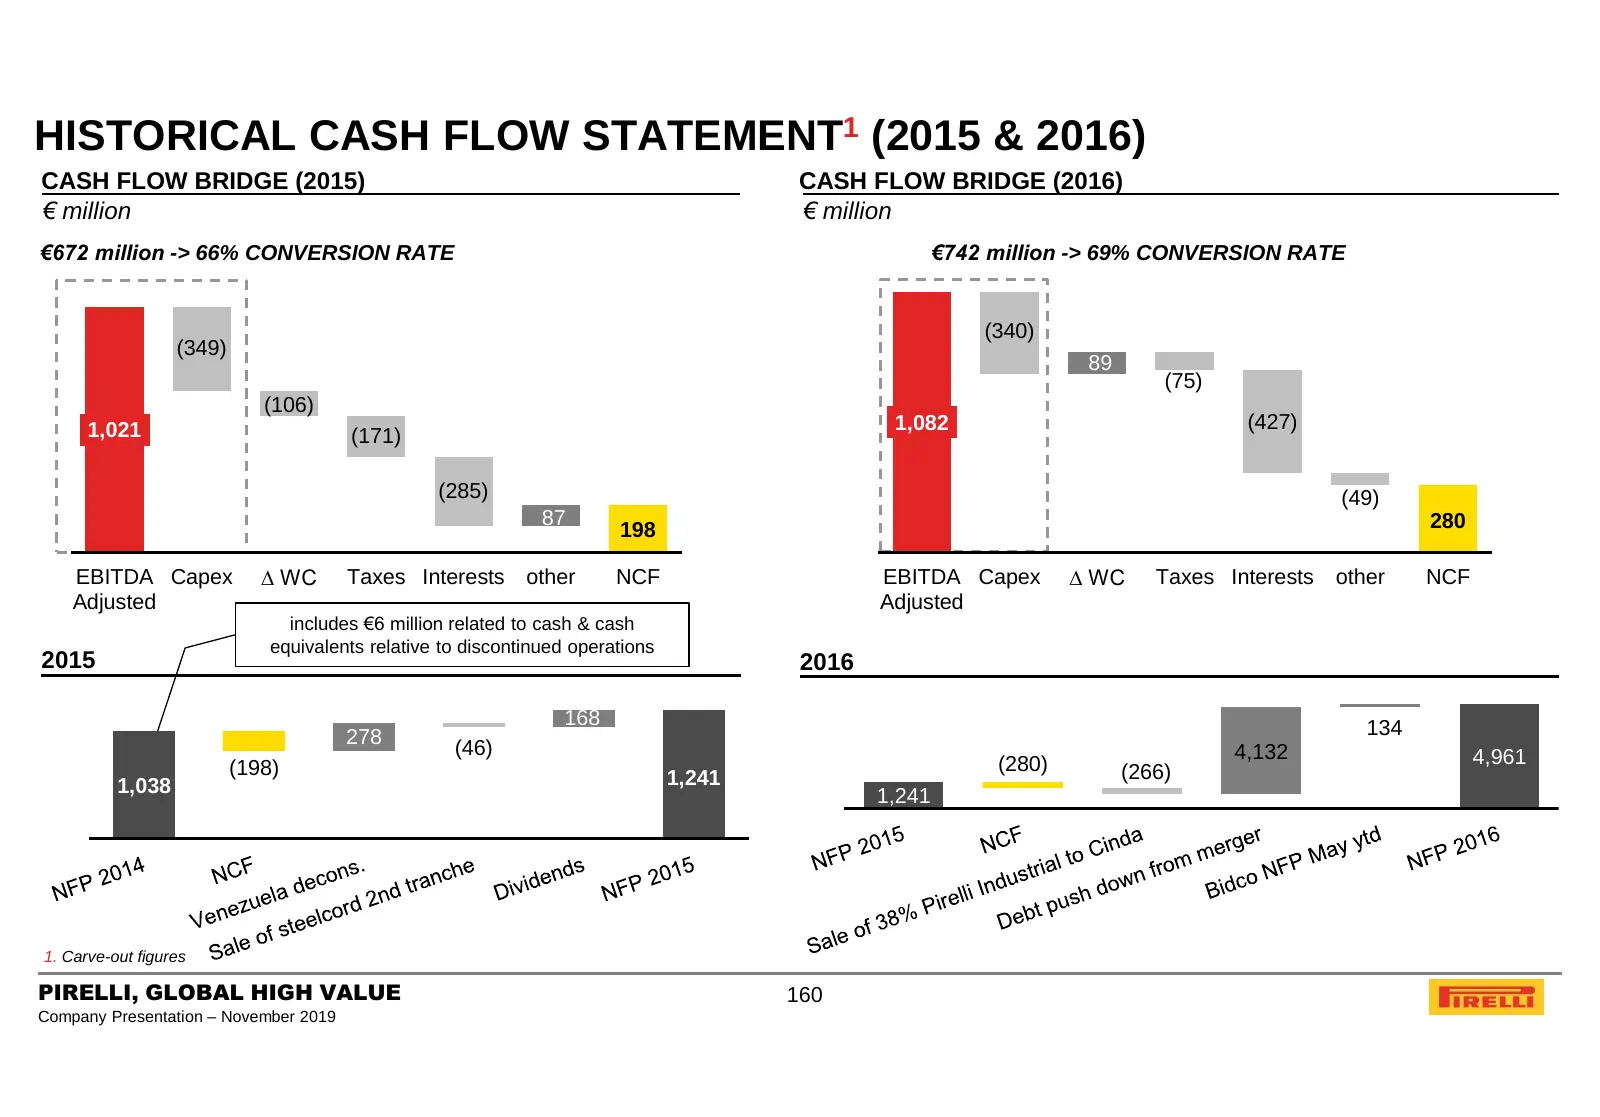
Slide 160: Historical Cash Flow Statement (2015 & 2016)
HISTORICAL CASH FLOW STATEMENT1 (2015 & 2016) CASH FLOW BRIDGE (2015) CASH FLOW BRIDGE (2016) € million € million €672 million -> 66% CONVERSION RATE €742 million -> 69% CONVERSION RATE (340) (349) 89 (75) (106) 1,021 1,082 (427) (171) (285) (49) 87 280 198 EBITDA Capex ∆ WC Taxes Interests other NC
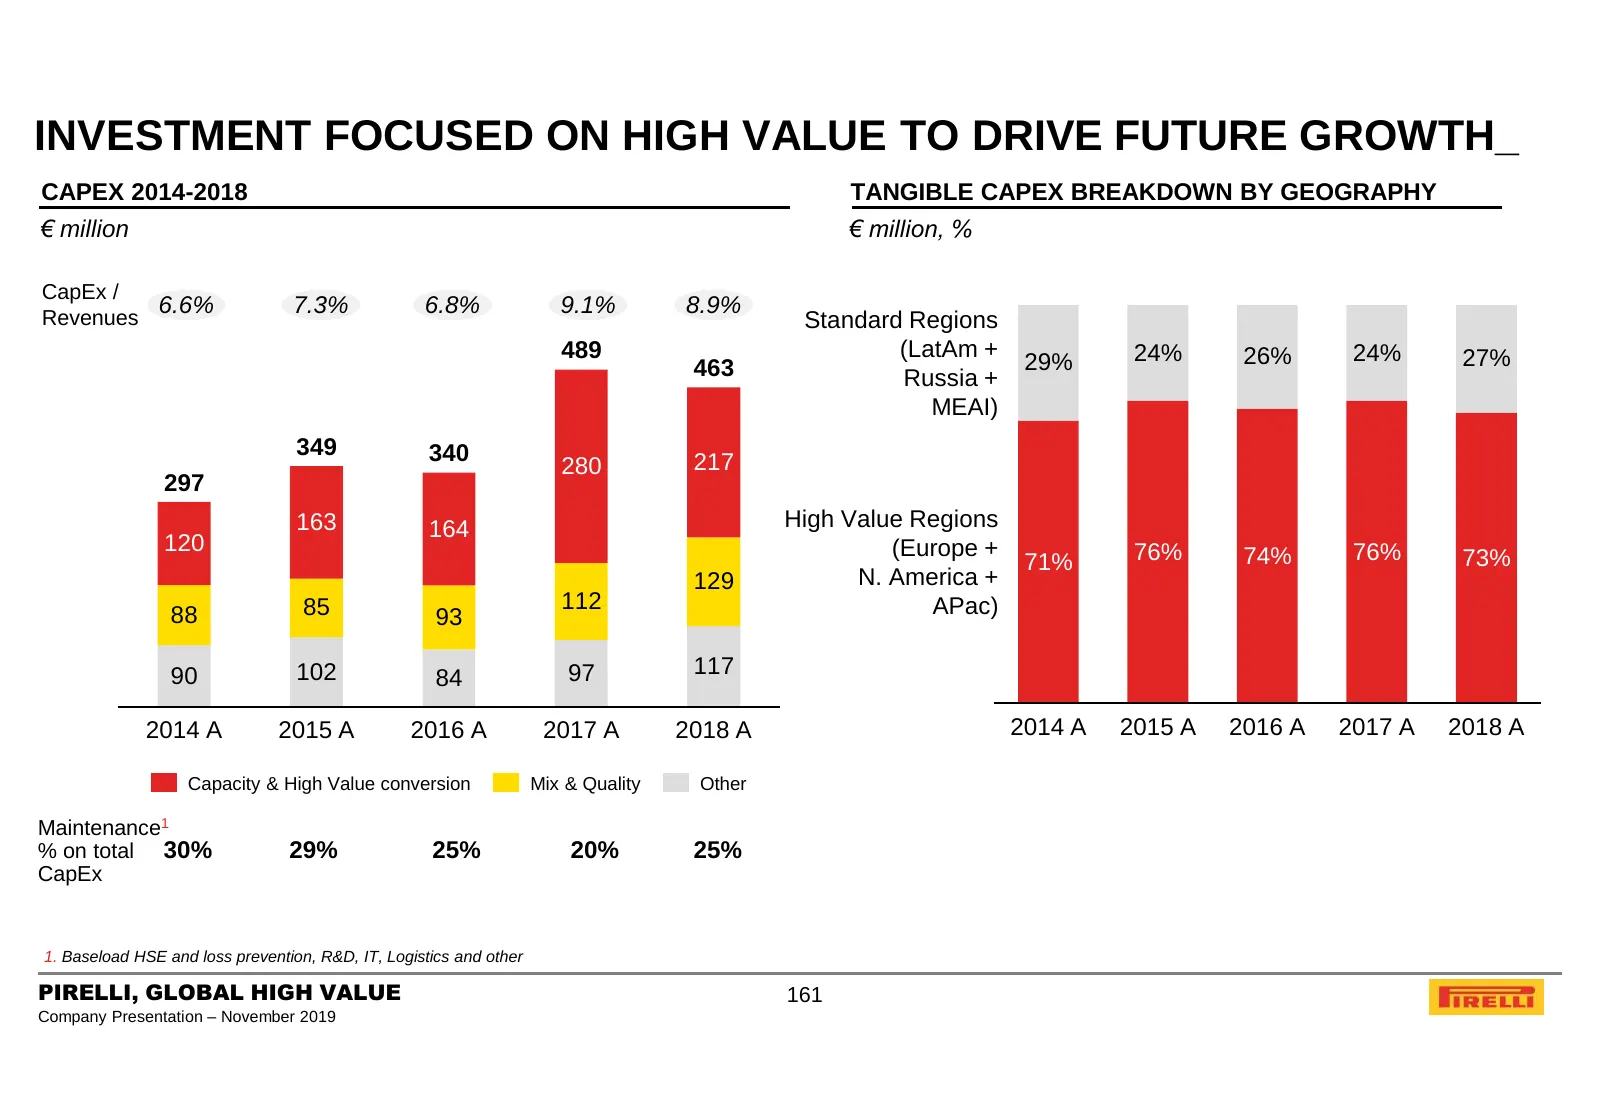
Slide 161: Investment Focused on High Value to Drive Future Growth
INVESTMENT FOCUSED ON HIGH VALUE TO DRIVE FUTURE GROWTH_ CAPEX 2014-2018 TANGIBLE CAPEX BREAKDOWN BY GEOGRAPHY € million € million, % CapEx / Revenues 6.6% 7.3% 6.8% 9.1% 8.9% Standard Regions 489 (LatAm + 24% 26% 24% 27% 463 29% Russia + MEAI) 349 340 280 217 297 163 164 High Value Regions 120 (Eur
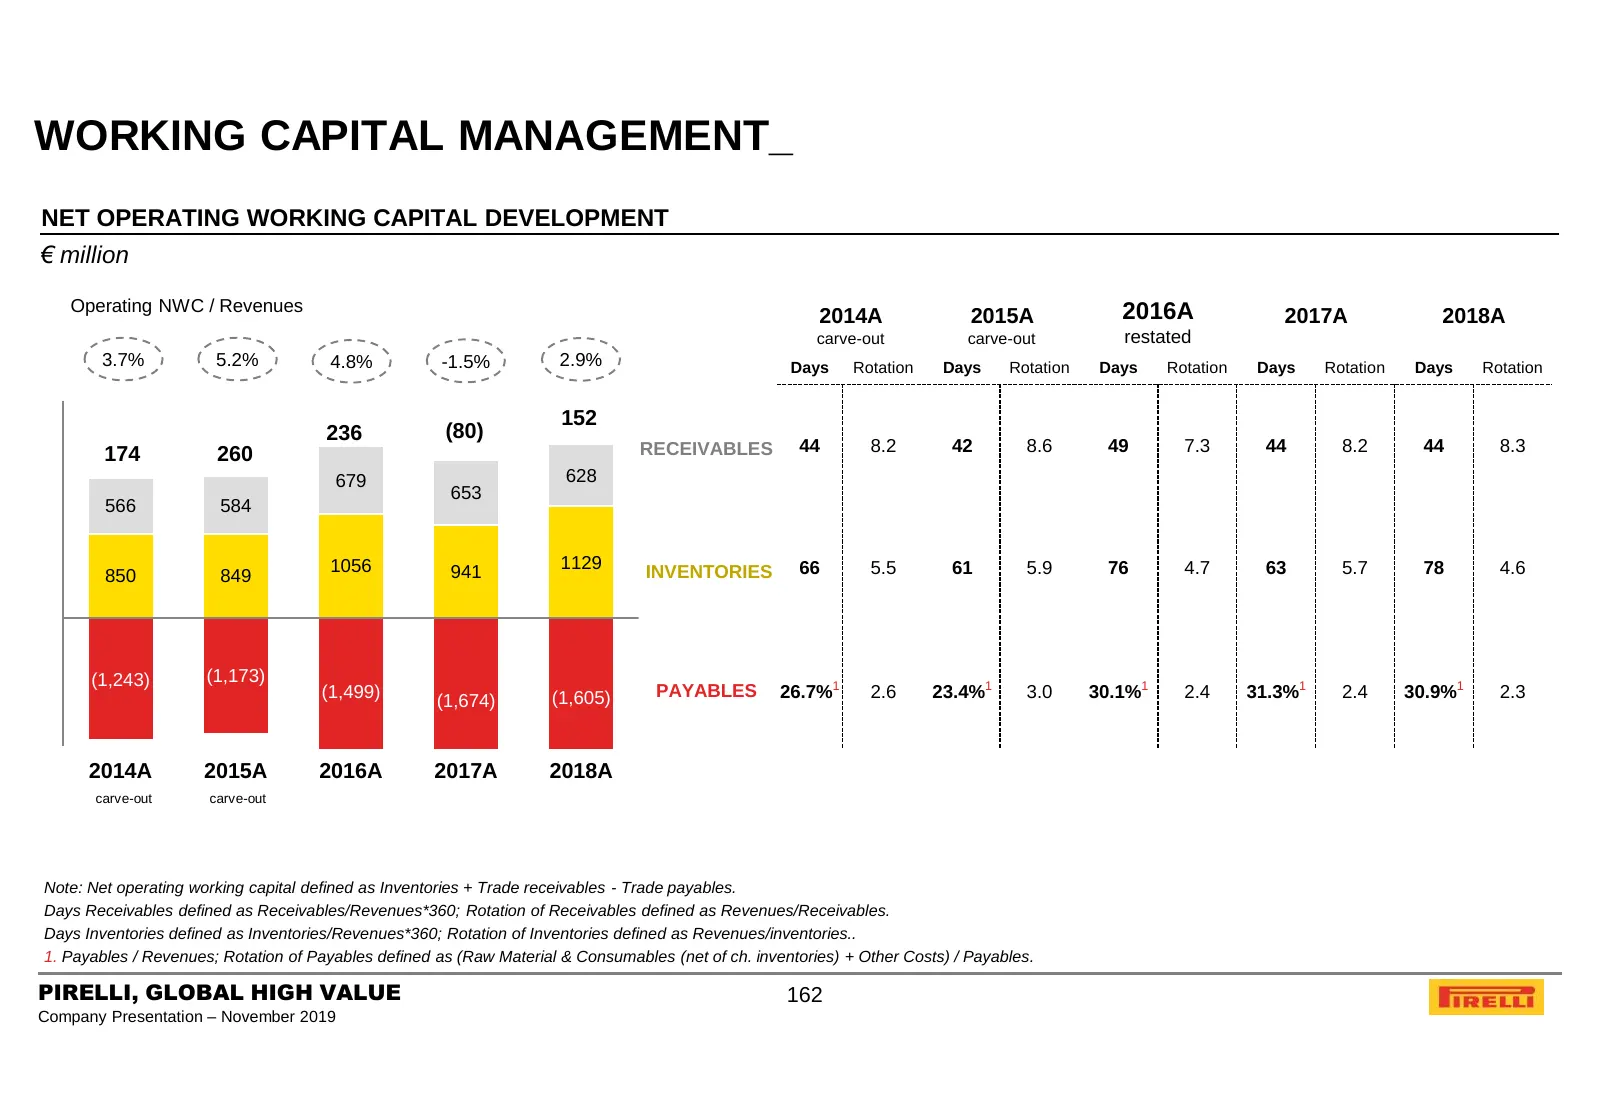
Slide 162: Working Capital Management
WORKING CAPITAL MANAGEMENT_ NET OPERATING WORKING CAPITAL DEVELOPMENT € million Operating NWC / Revenues 2016A 2014A 2015A 2017A 2018A carve-out carve-out restated 3.7% 5.2% 4.8% -1.5% 2.9% Days Rotation Days Rotation Days Rotation Days Rotation Days Rotation 152 236 (80) 174 260 RECEIVABLES 44 8.2

Slide 163: Pirelli, Global High Value
Copyright © 2019 Pirelli & C. S.p.A. PIRELLI, GLOBAL HIGH VALUE Company Presentation – November 2019
Source: company website
More decks from Pirelli & C. S.p.A.
 9M 2026 Earnings Presentation31 slides · Nov 5, 2026
 1H 2026 Earnings Presentation31 slides · Jul 29, 2026
 Q1 2026 Earnings Presentation29 slides · May 7, 2026
 FY 2025 Earnings Presentation36 slides · Feb 25, 2026
 9M 2025 Earnings Presentation33 slides · Nov 6, 2025
 1H 2025 Earnings Presentation34 slides · Jul 31, 2025