Naugatuck Valley Financial Corp
Naugatuck Valley Financial — IPO Roadshow (June 2011)
25 slides from Naugatuck Valley Financial's IPO roadshow presentation, Jun 28, 2011
Slide 1: 2nd Step Conversion and Offering June 2011
Issuer Free Writing Prospectus Filed pursuant to Rule 433 Registration No. 333-167482 nd 2 Step Conversion and Offering June 2011
Slide 2: Legal Matters
Legal Matters This presentation is for informational purposes only and does not constitute an offer to sell nor a solicitation of an offer to buy shares of common stock of Naugatuck Valley Financial Corporation. The offer is made only by the prospectus. The conversion involves the formation of a new
Slide 3: Forward Looking Statements
Forward Looking Statements This presentation contains forward-looking statements, which can be identified by the use of words such as “believes,” “expects,” “anticipates,” “estimates” or similar expressions. Forward-looking statements include, but are not limited to: statements of our goals, intenti
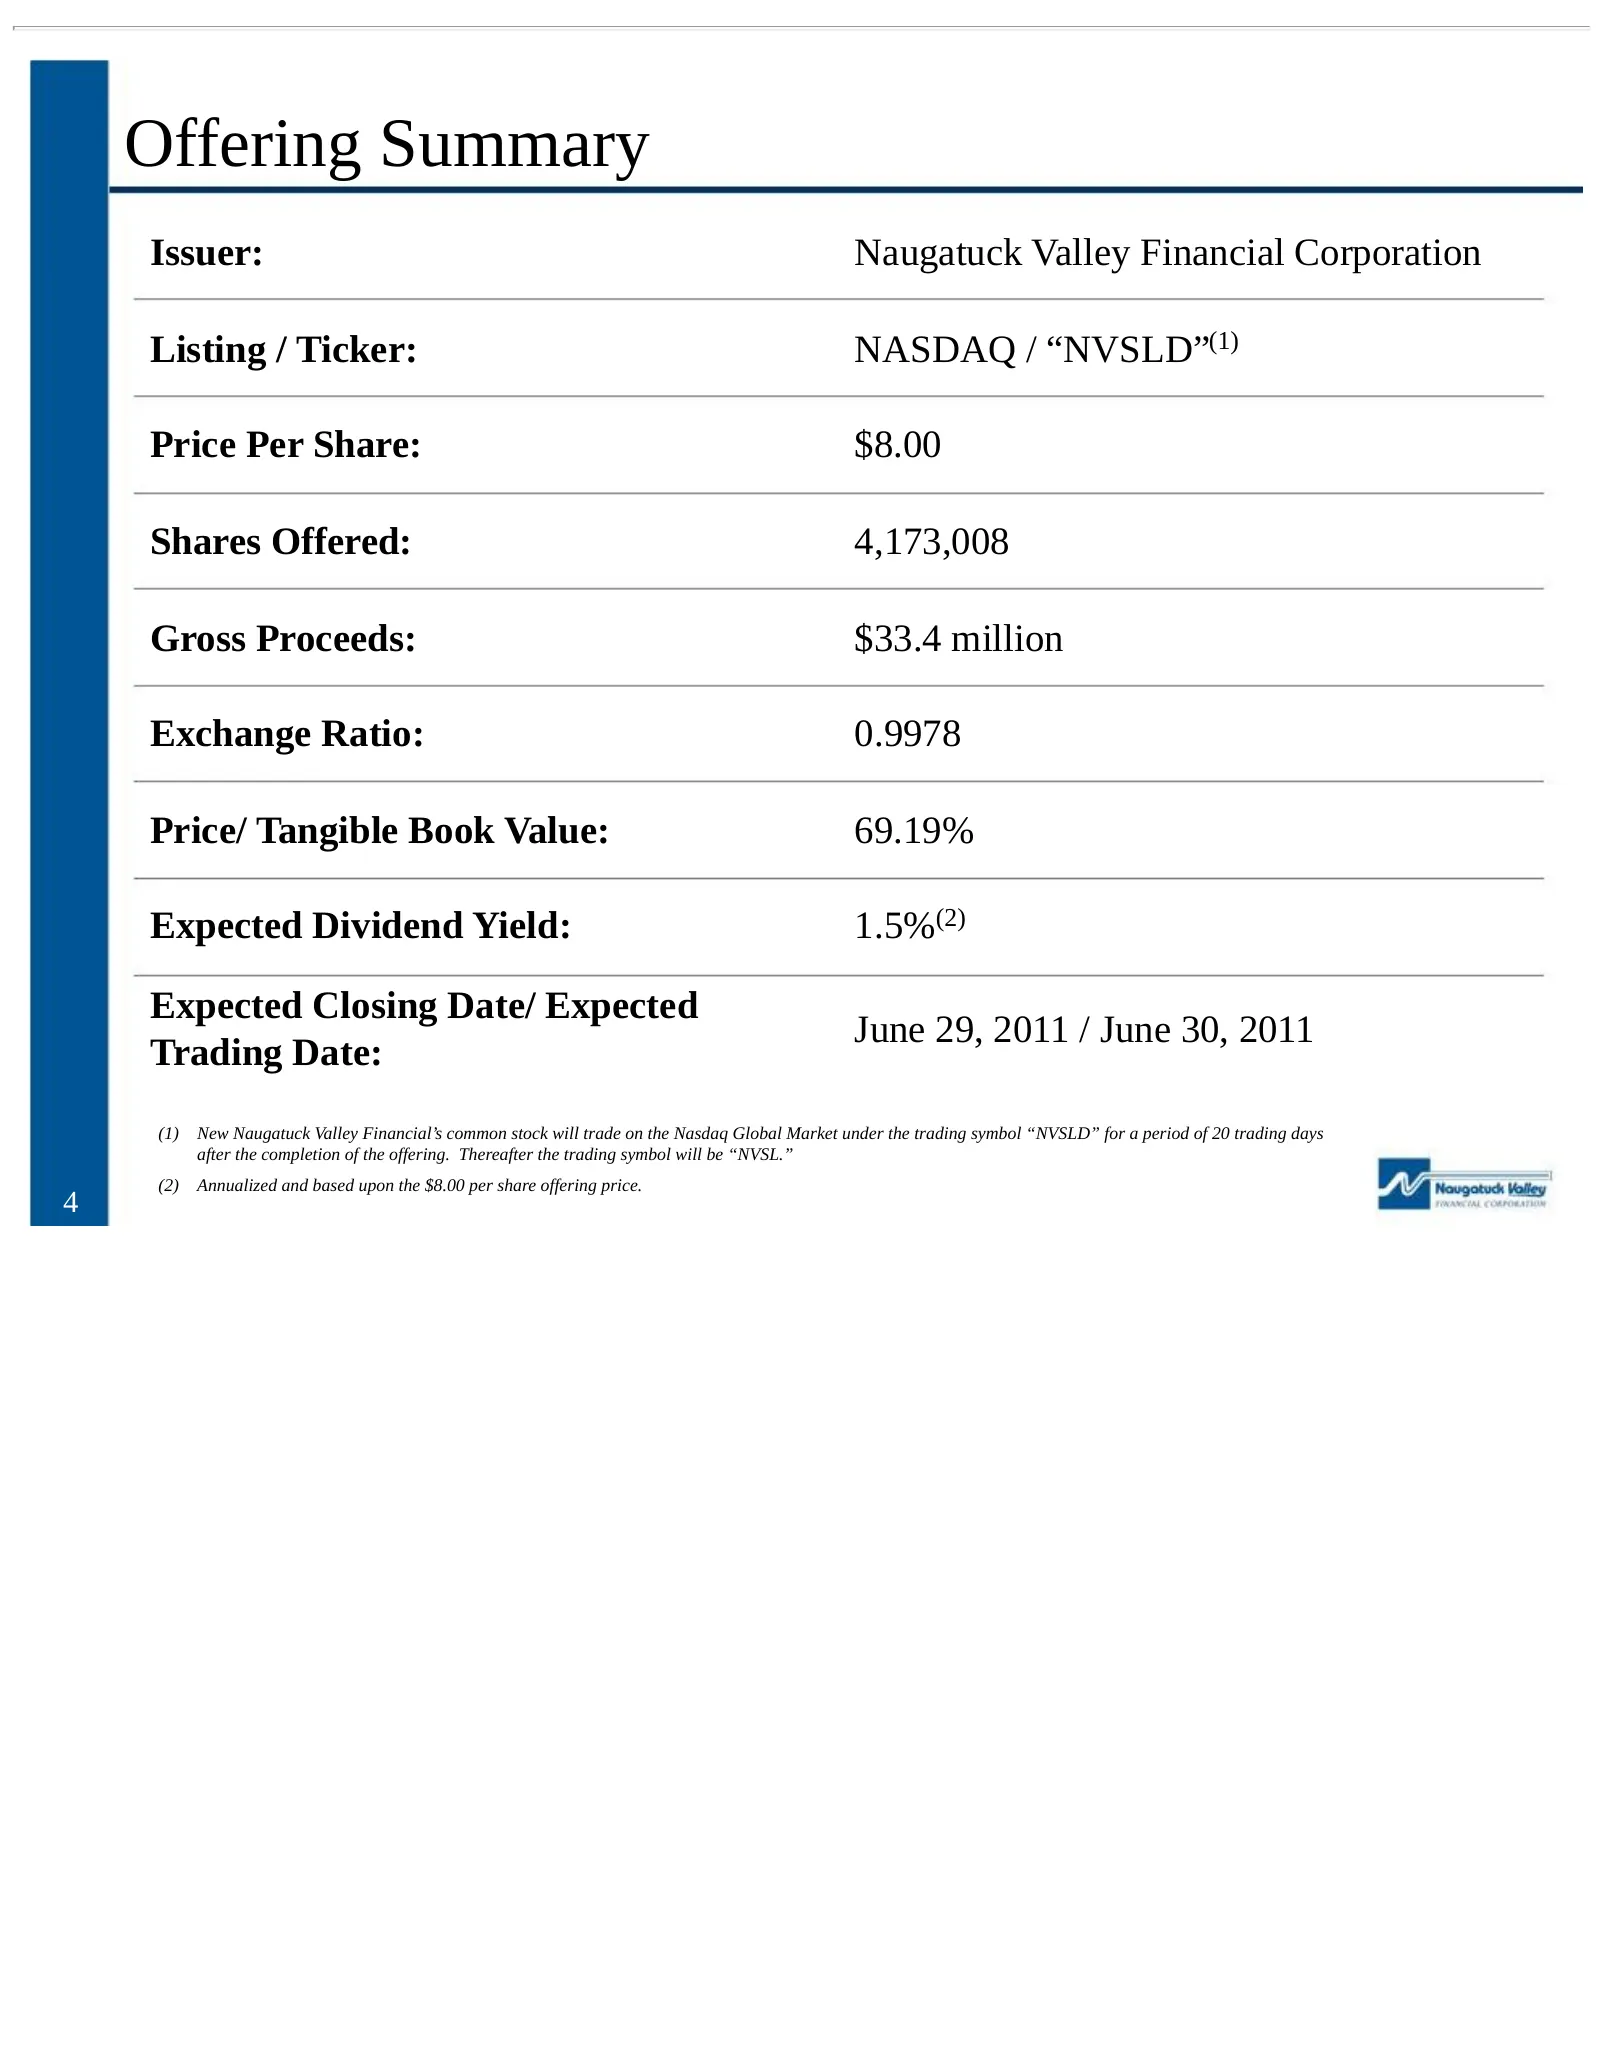
Slide 4: Offering Summary
Offering Summary Issuer: Naugatuck Valley Financial Corporation Listing / Ticker: NASDAQ / “NVSLD”(1) Price Per Share: $8.00 Shares Offered: 4,173,008 Gross Proceeds: $33.4 million Exchange Ratio: 0.9978 Price/ Tangible Book Value: 69.19% Expected Dividend Yield: 1.5%(2) Expected Closing Date/ Expec
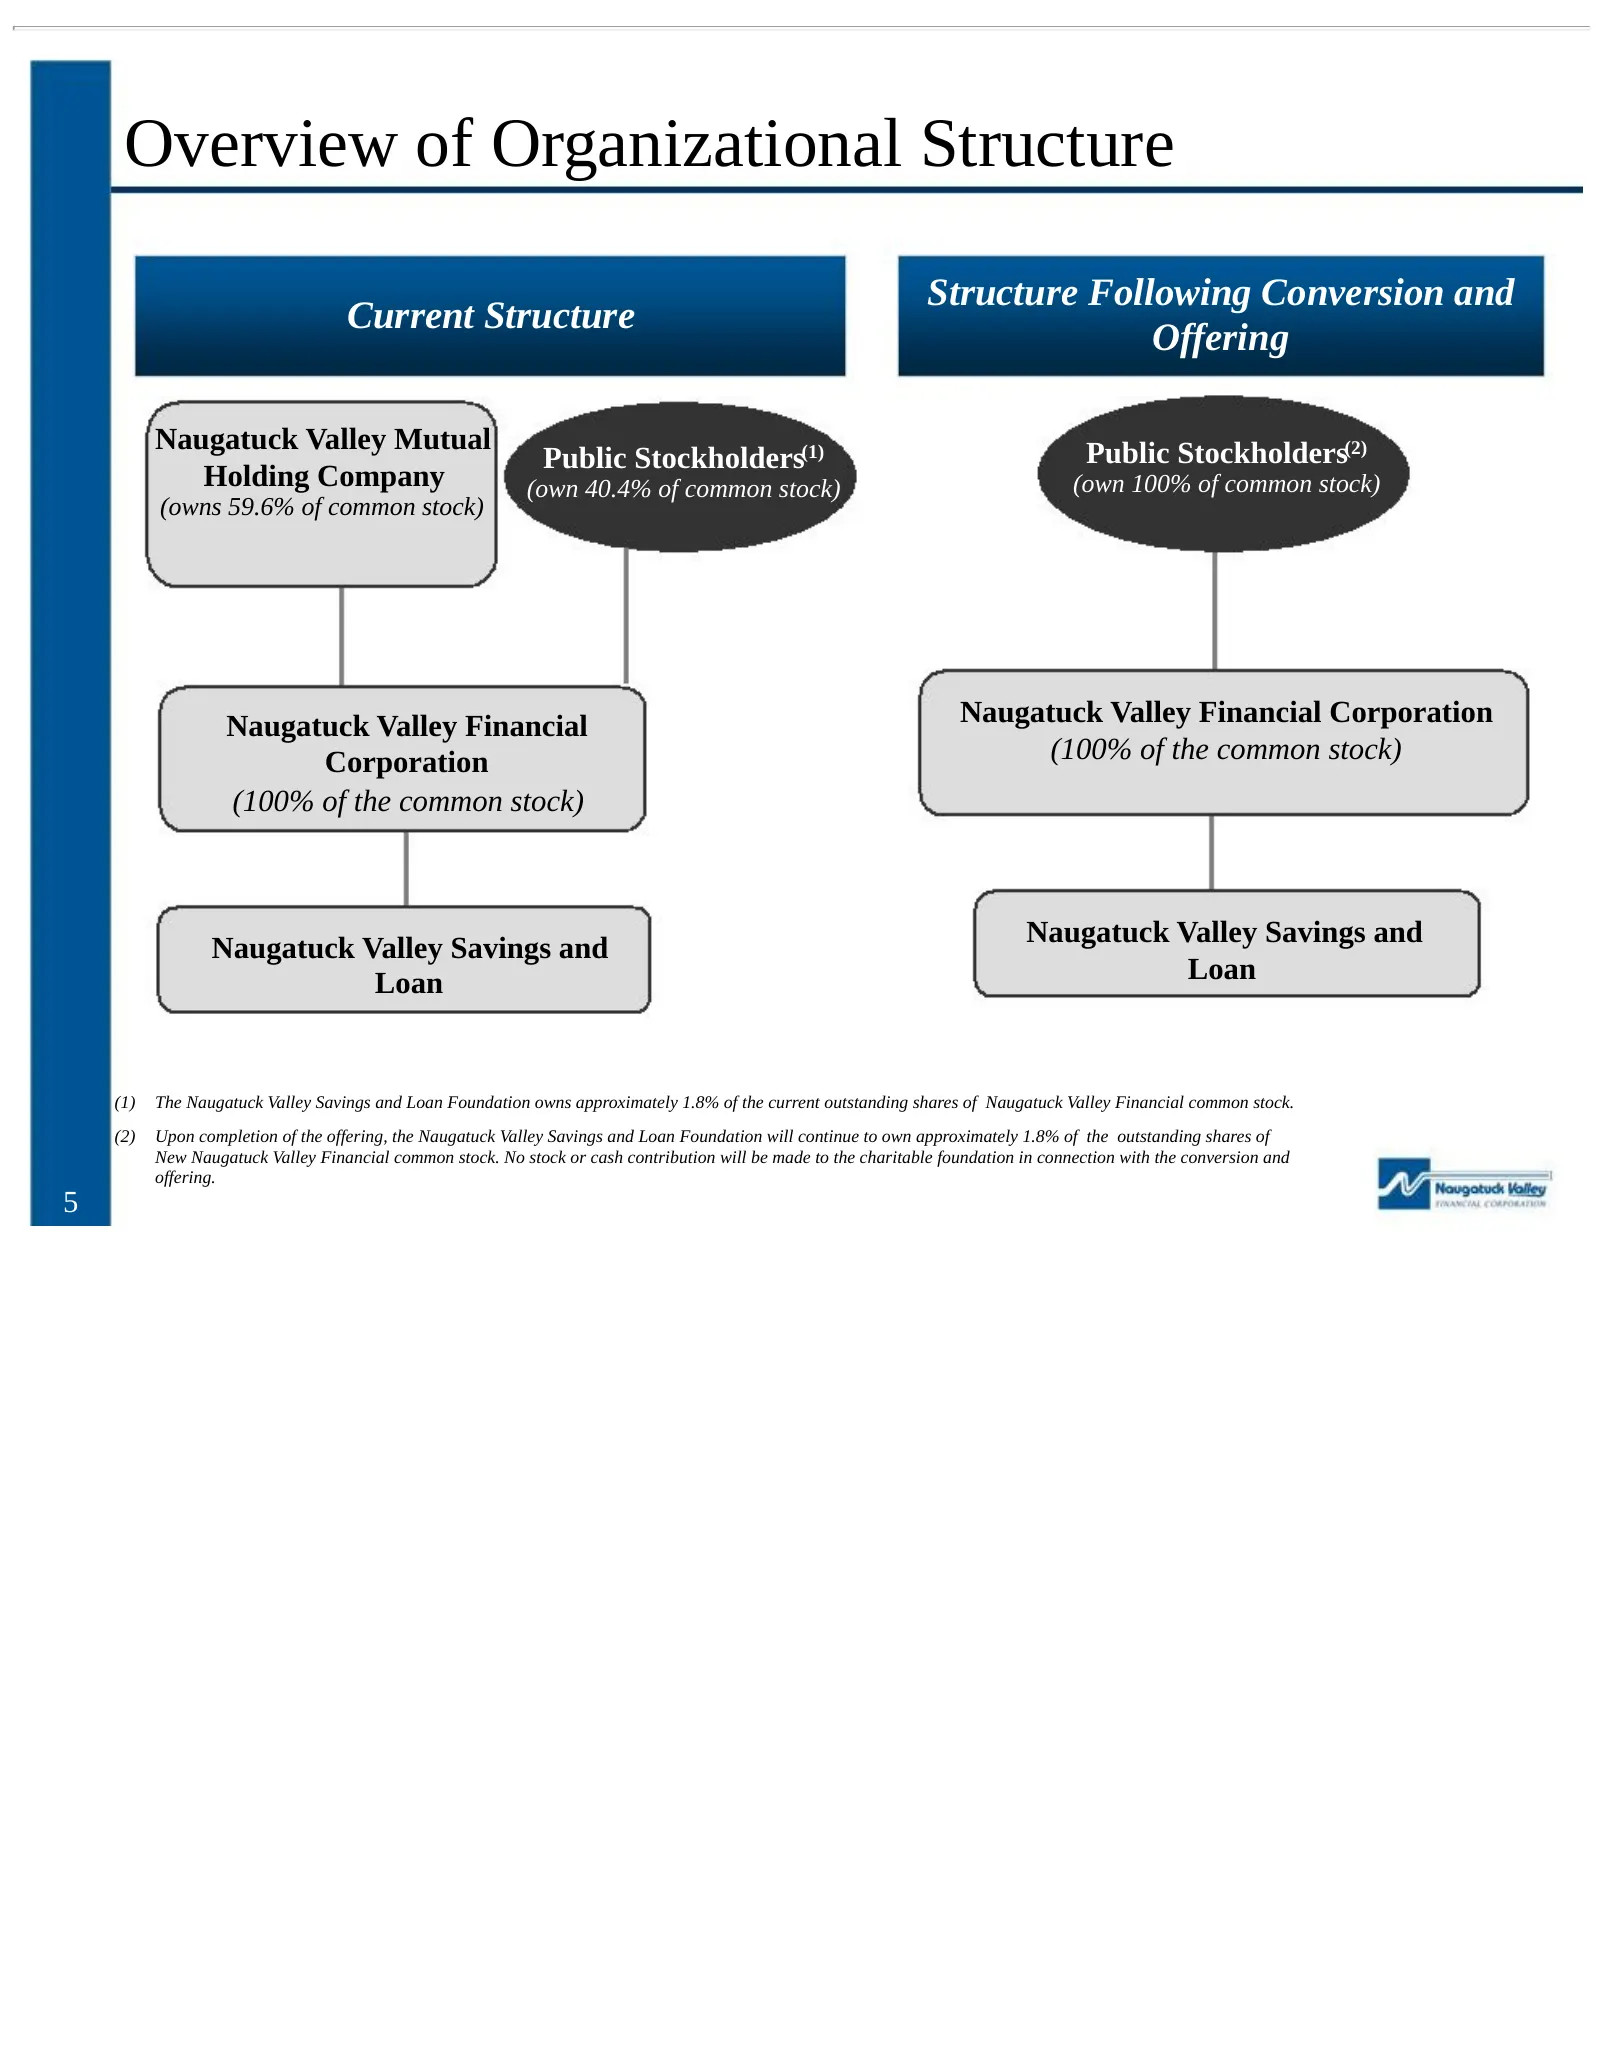
Slide 5: Overview of Organizational Structure
Overview of Organizational Structure Structure Following Conversion and Current Structure Offering Naugatuck Valley Mutual Public Stockholders(2) Public Stockholders(1) Holding Company (own 40.4% of common stock) (own 100% of common stock) (owns 59.6% of common stock) Naugatuck Valley Financial Naug
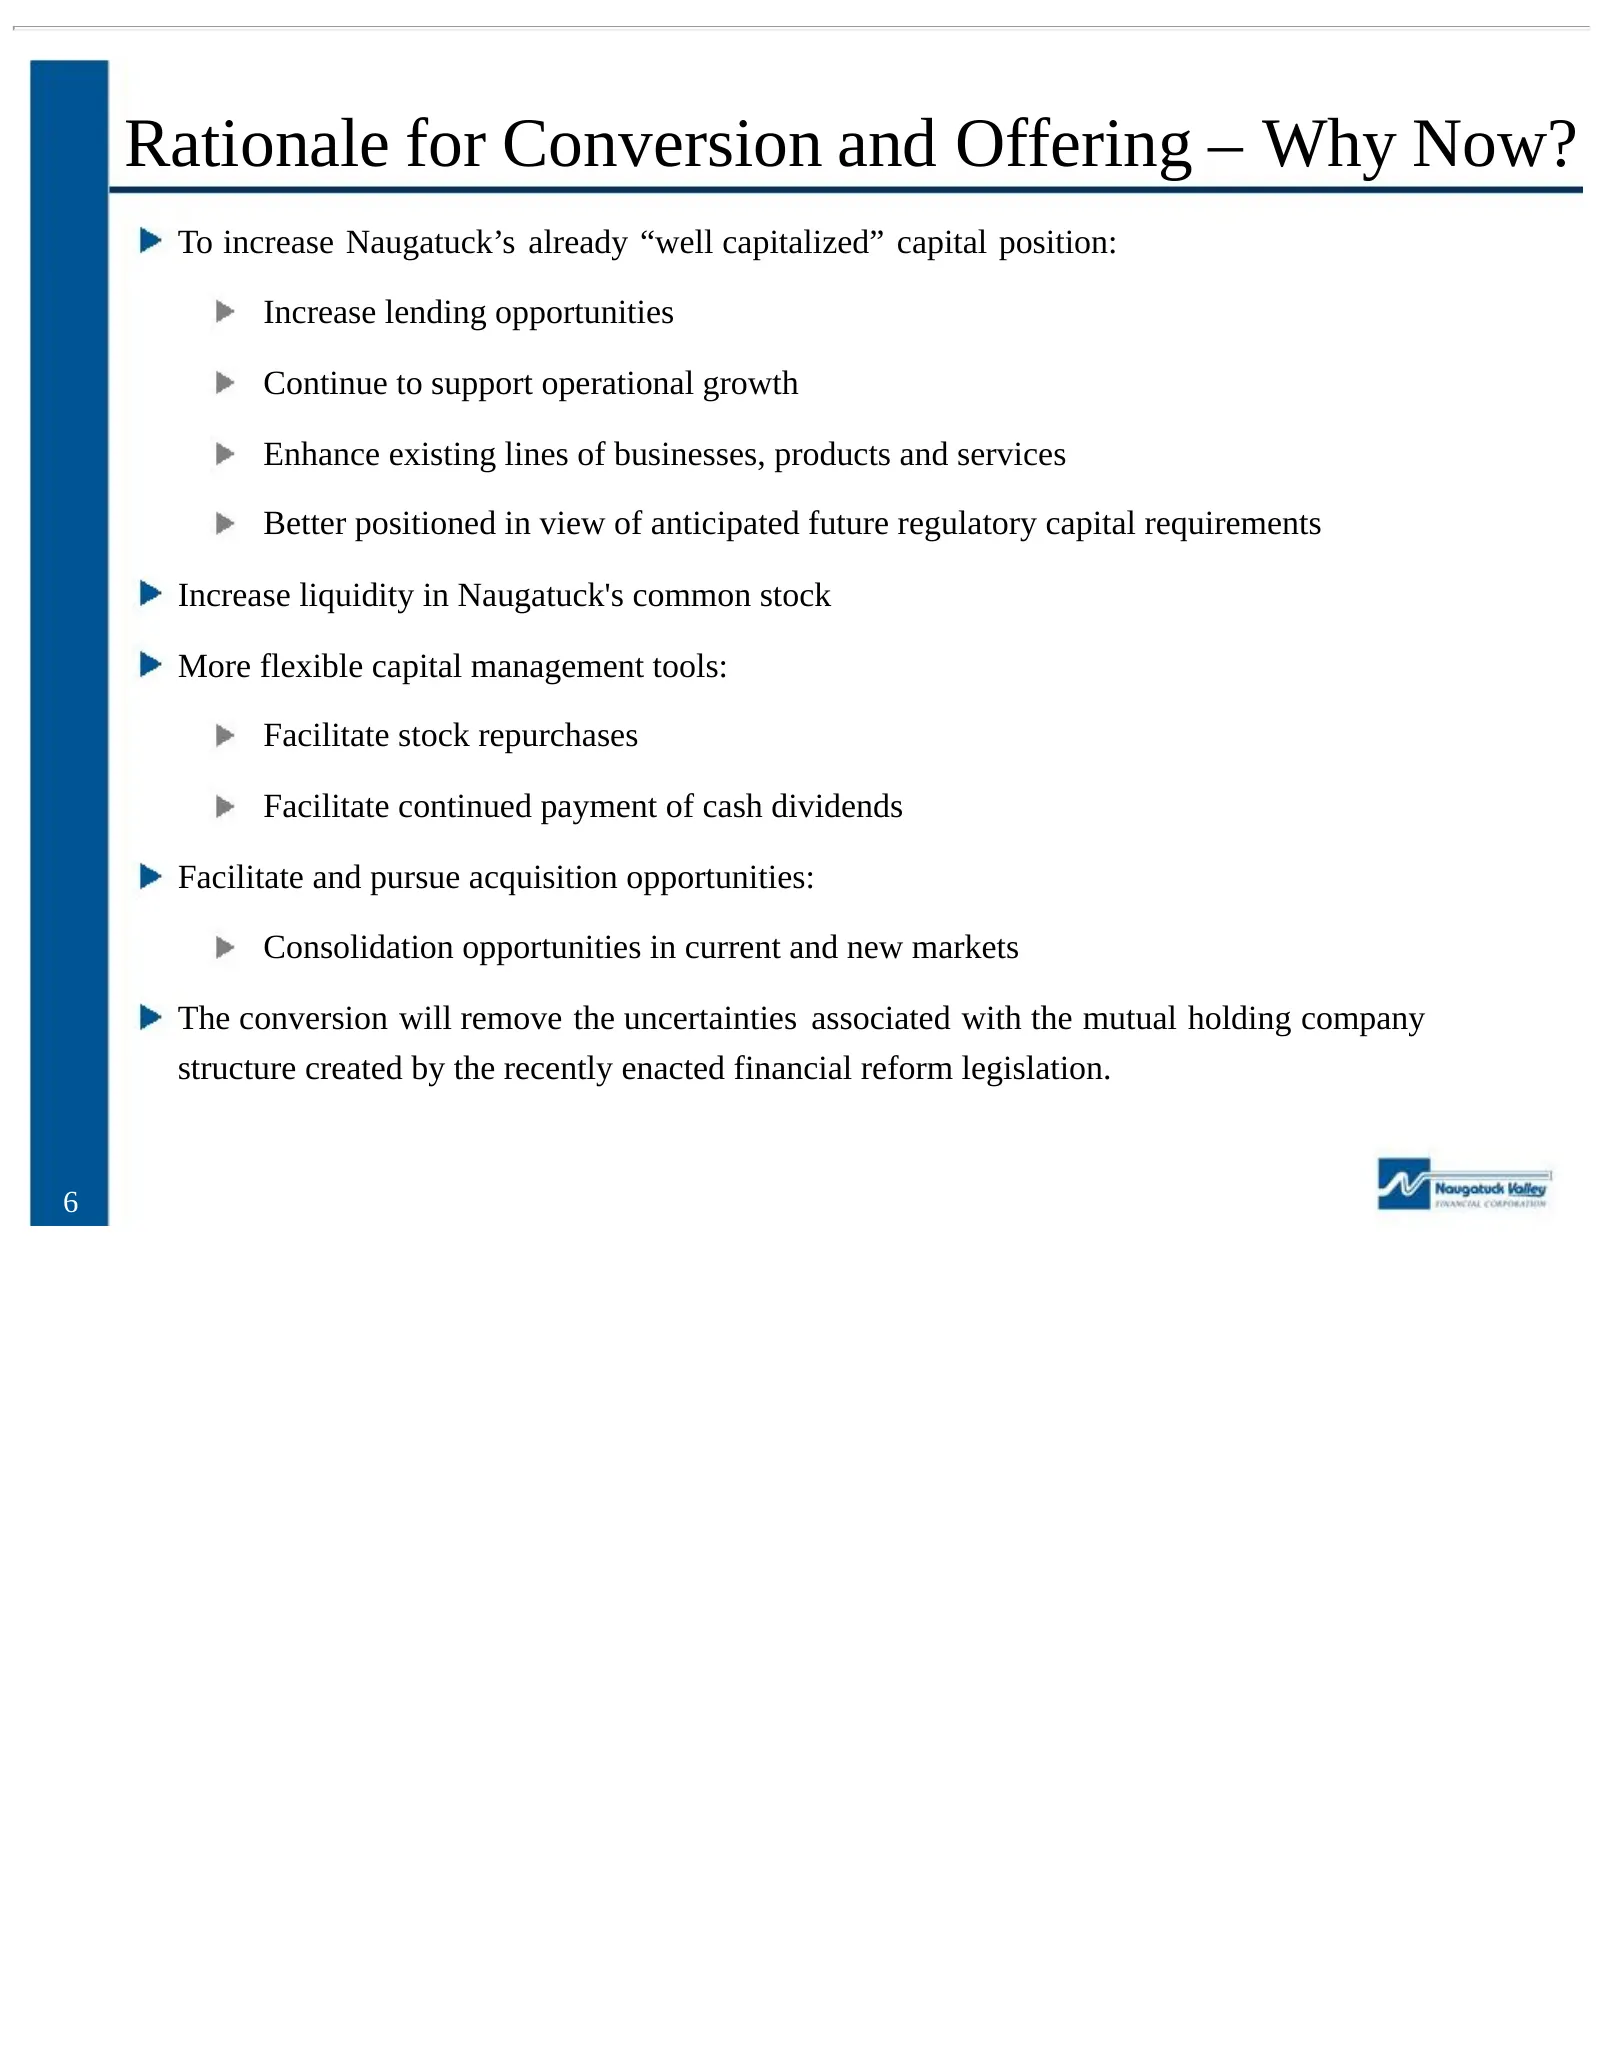
Slide 6: Rationale for Conversion and Offering – Why Now?
Rationale for Conversion and Offering – Why Now? To increase Naugatuck’s already “well capitalized” capital position: Increase lending opportunities Continue to support operational growth Enhance existing lines of businesses, products and services Better positioned in view of anticipated future regu
Slide 7: Company Overview
VY, Naugatuck Valley : FINANCIAL CORPORATION Company Overview
Slide 8: Company Profile and Overview
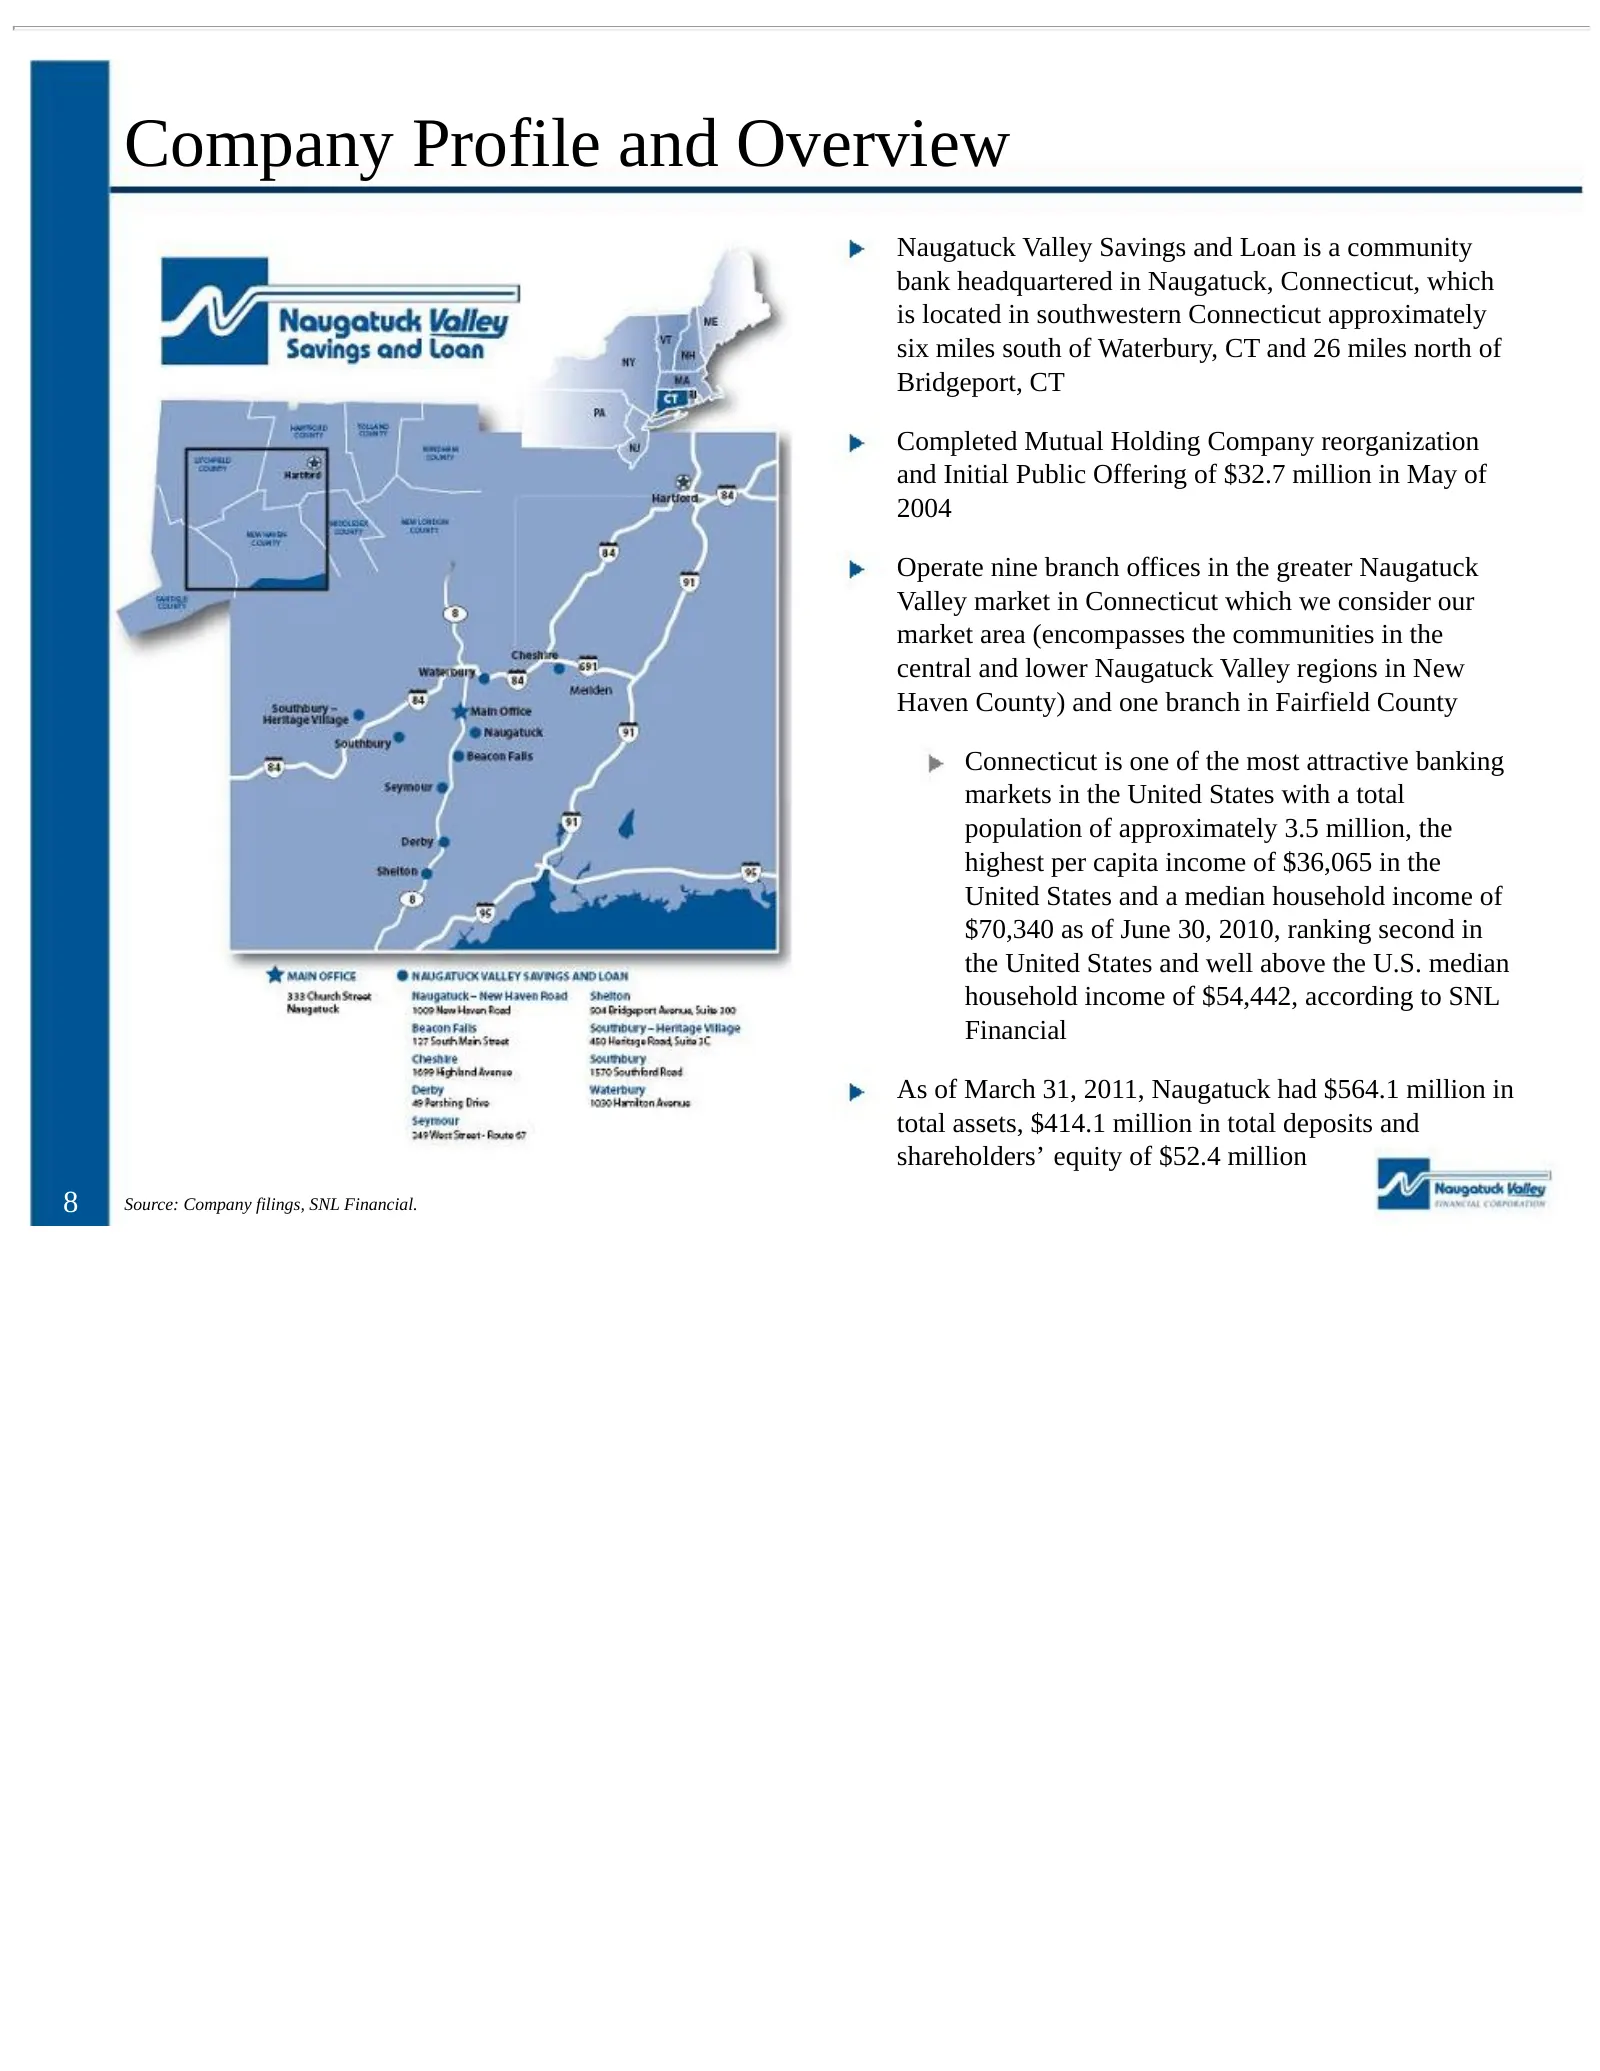
Company Profile and Overview Naugatuck Valley Savings and Loan is a community bank headquartered in Naugatuck, Connecticut, which is located in southwestern Connecticut approximately six miles south of Waterbury, CT and 26 miles north of Bridgeport, CT Completed Mutual Holding Company reorganization
Slide 9: Attractive and Stable Market Area
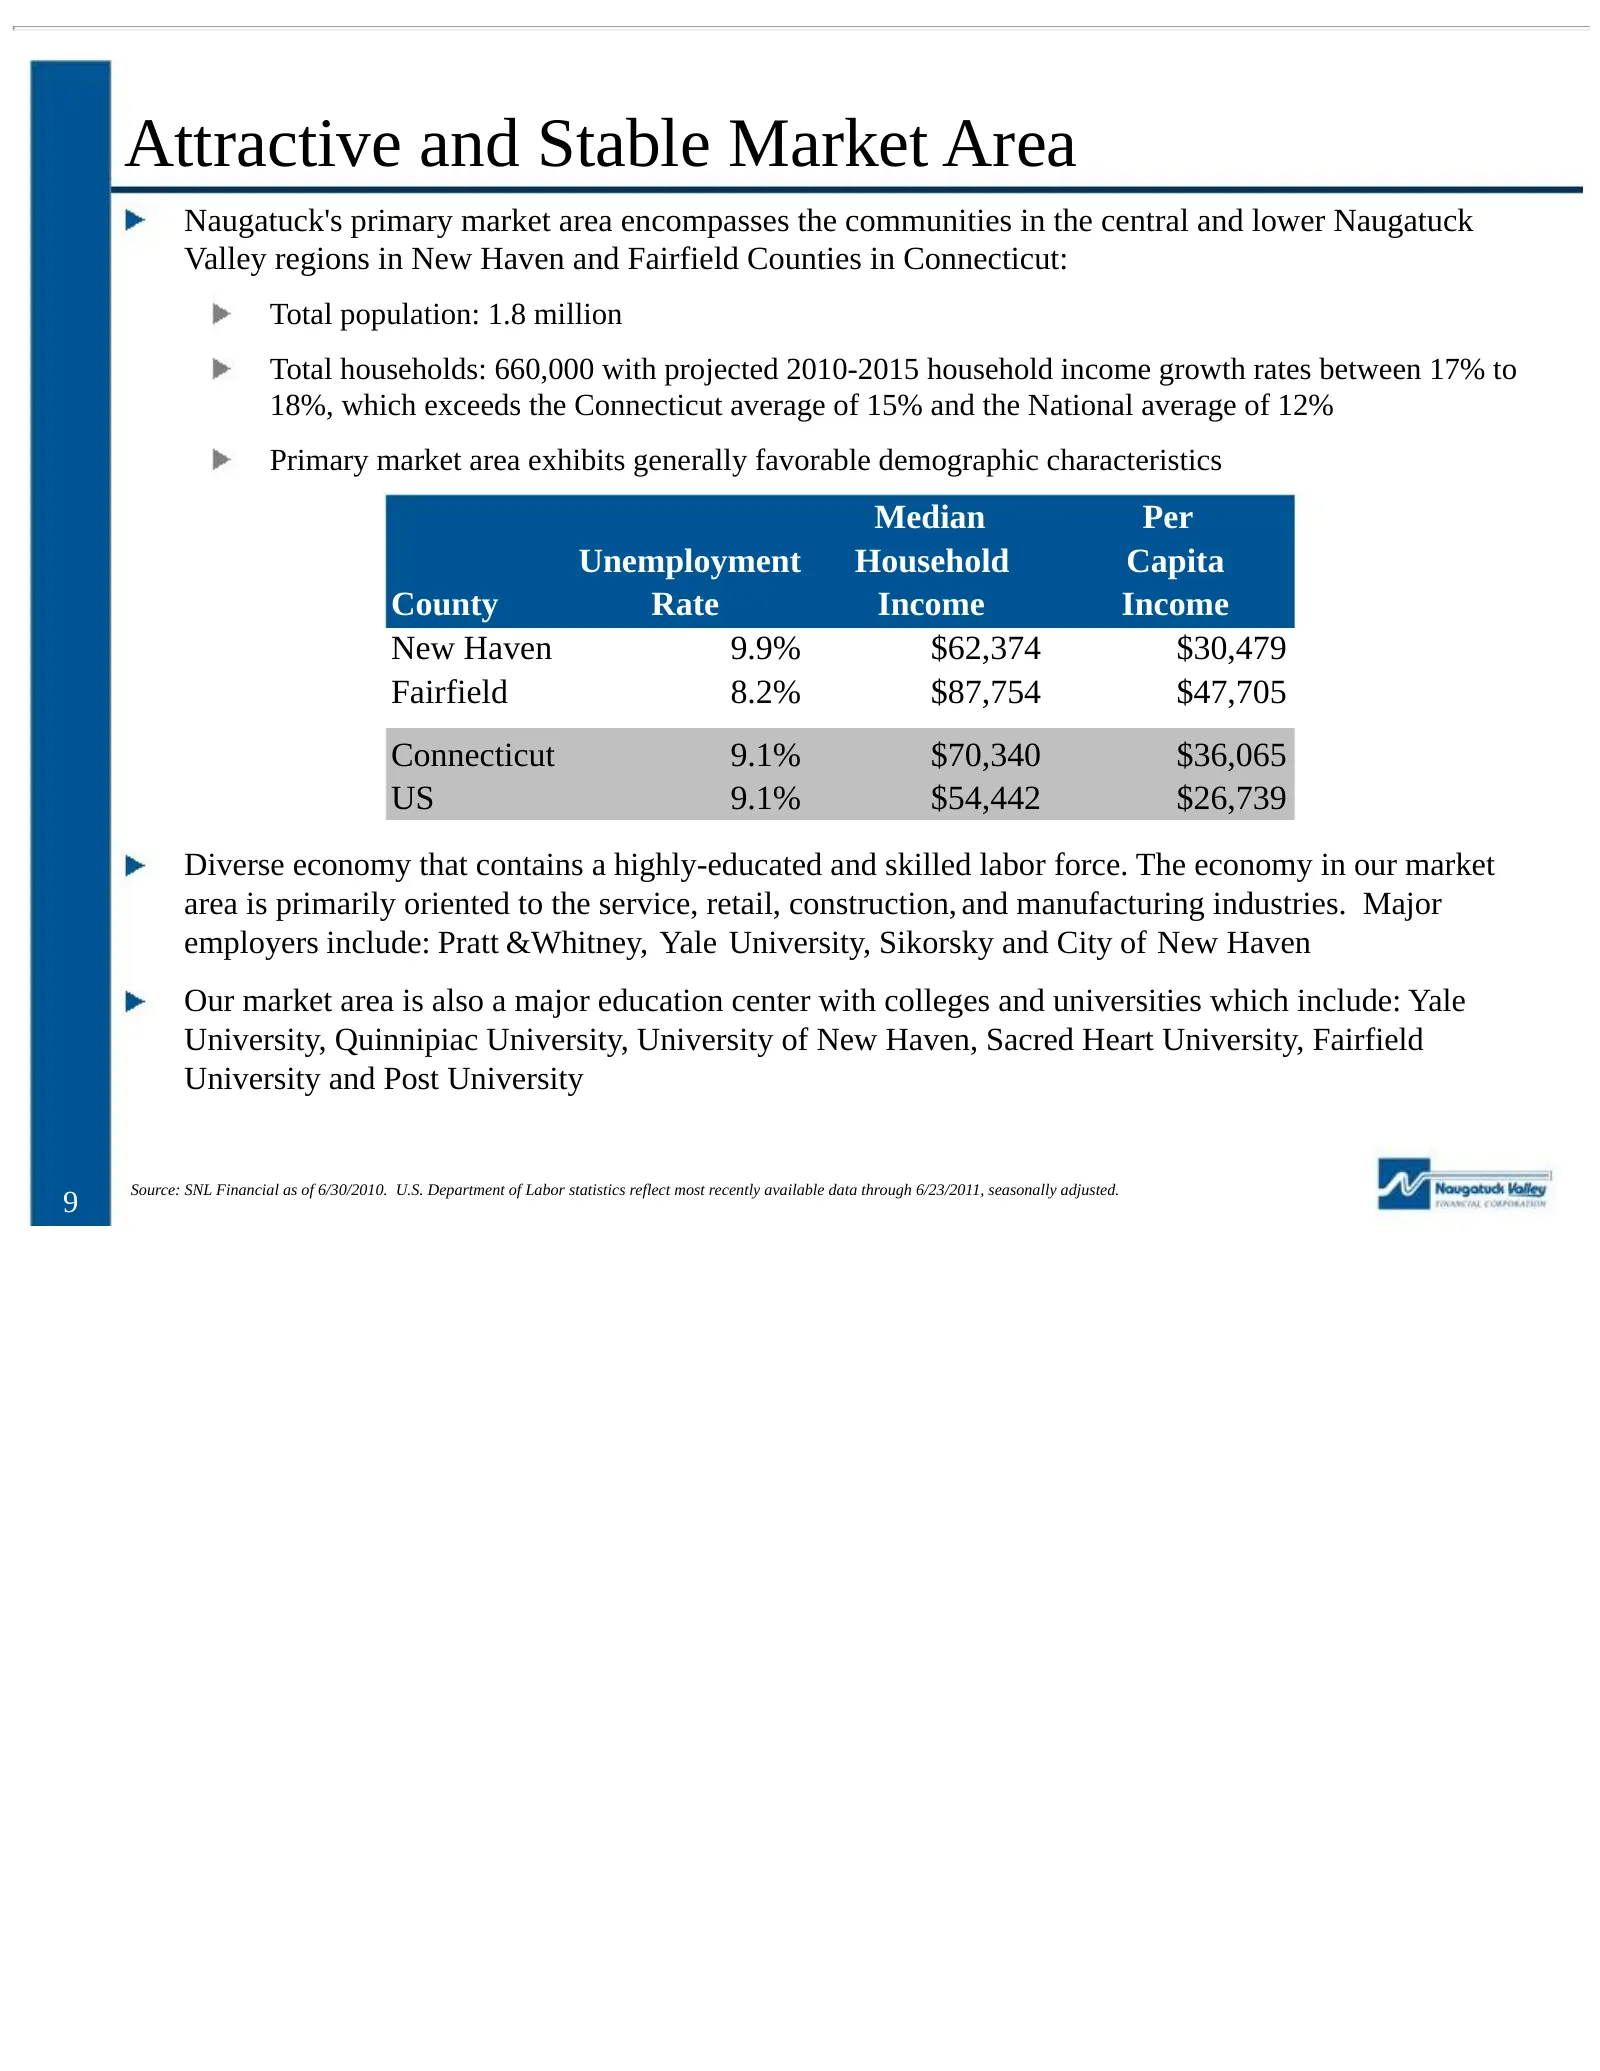
Attractive and Stable Market Area Naugatuck's primary market area encompasses the communities in the central and lower Naugatuck Valley regions in New Haven and Fairfield Counties in Connecticut: Total population: 1.8 million Total households: 660,000 with projected 2010-2015 household income growth
Slide 10: Experienced Management Team
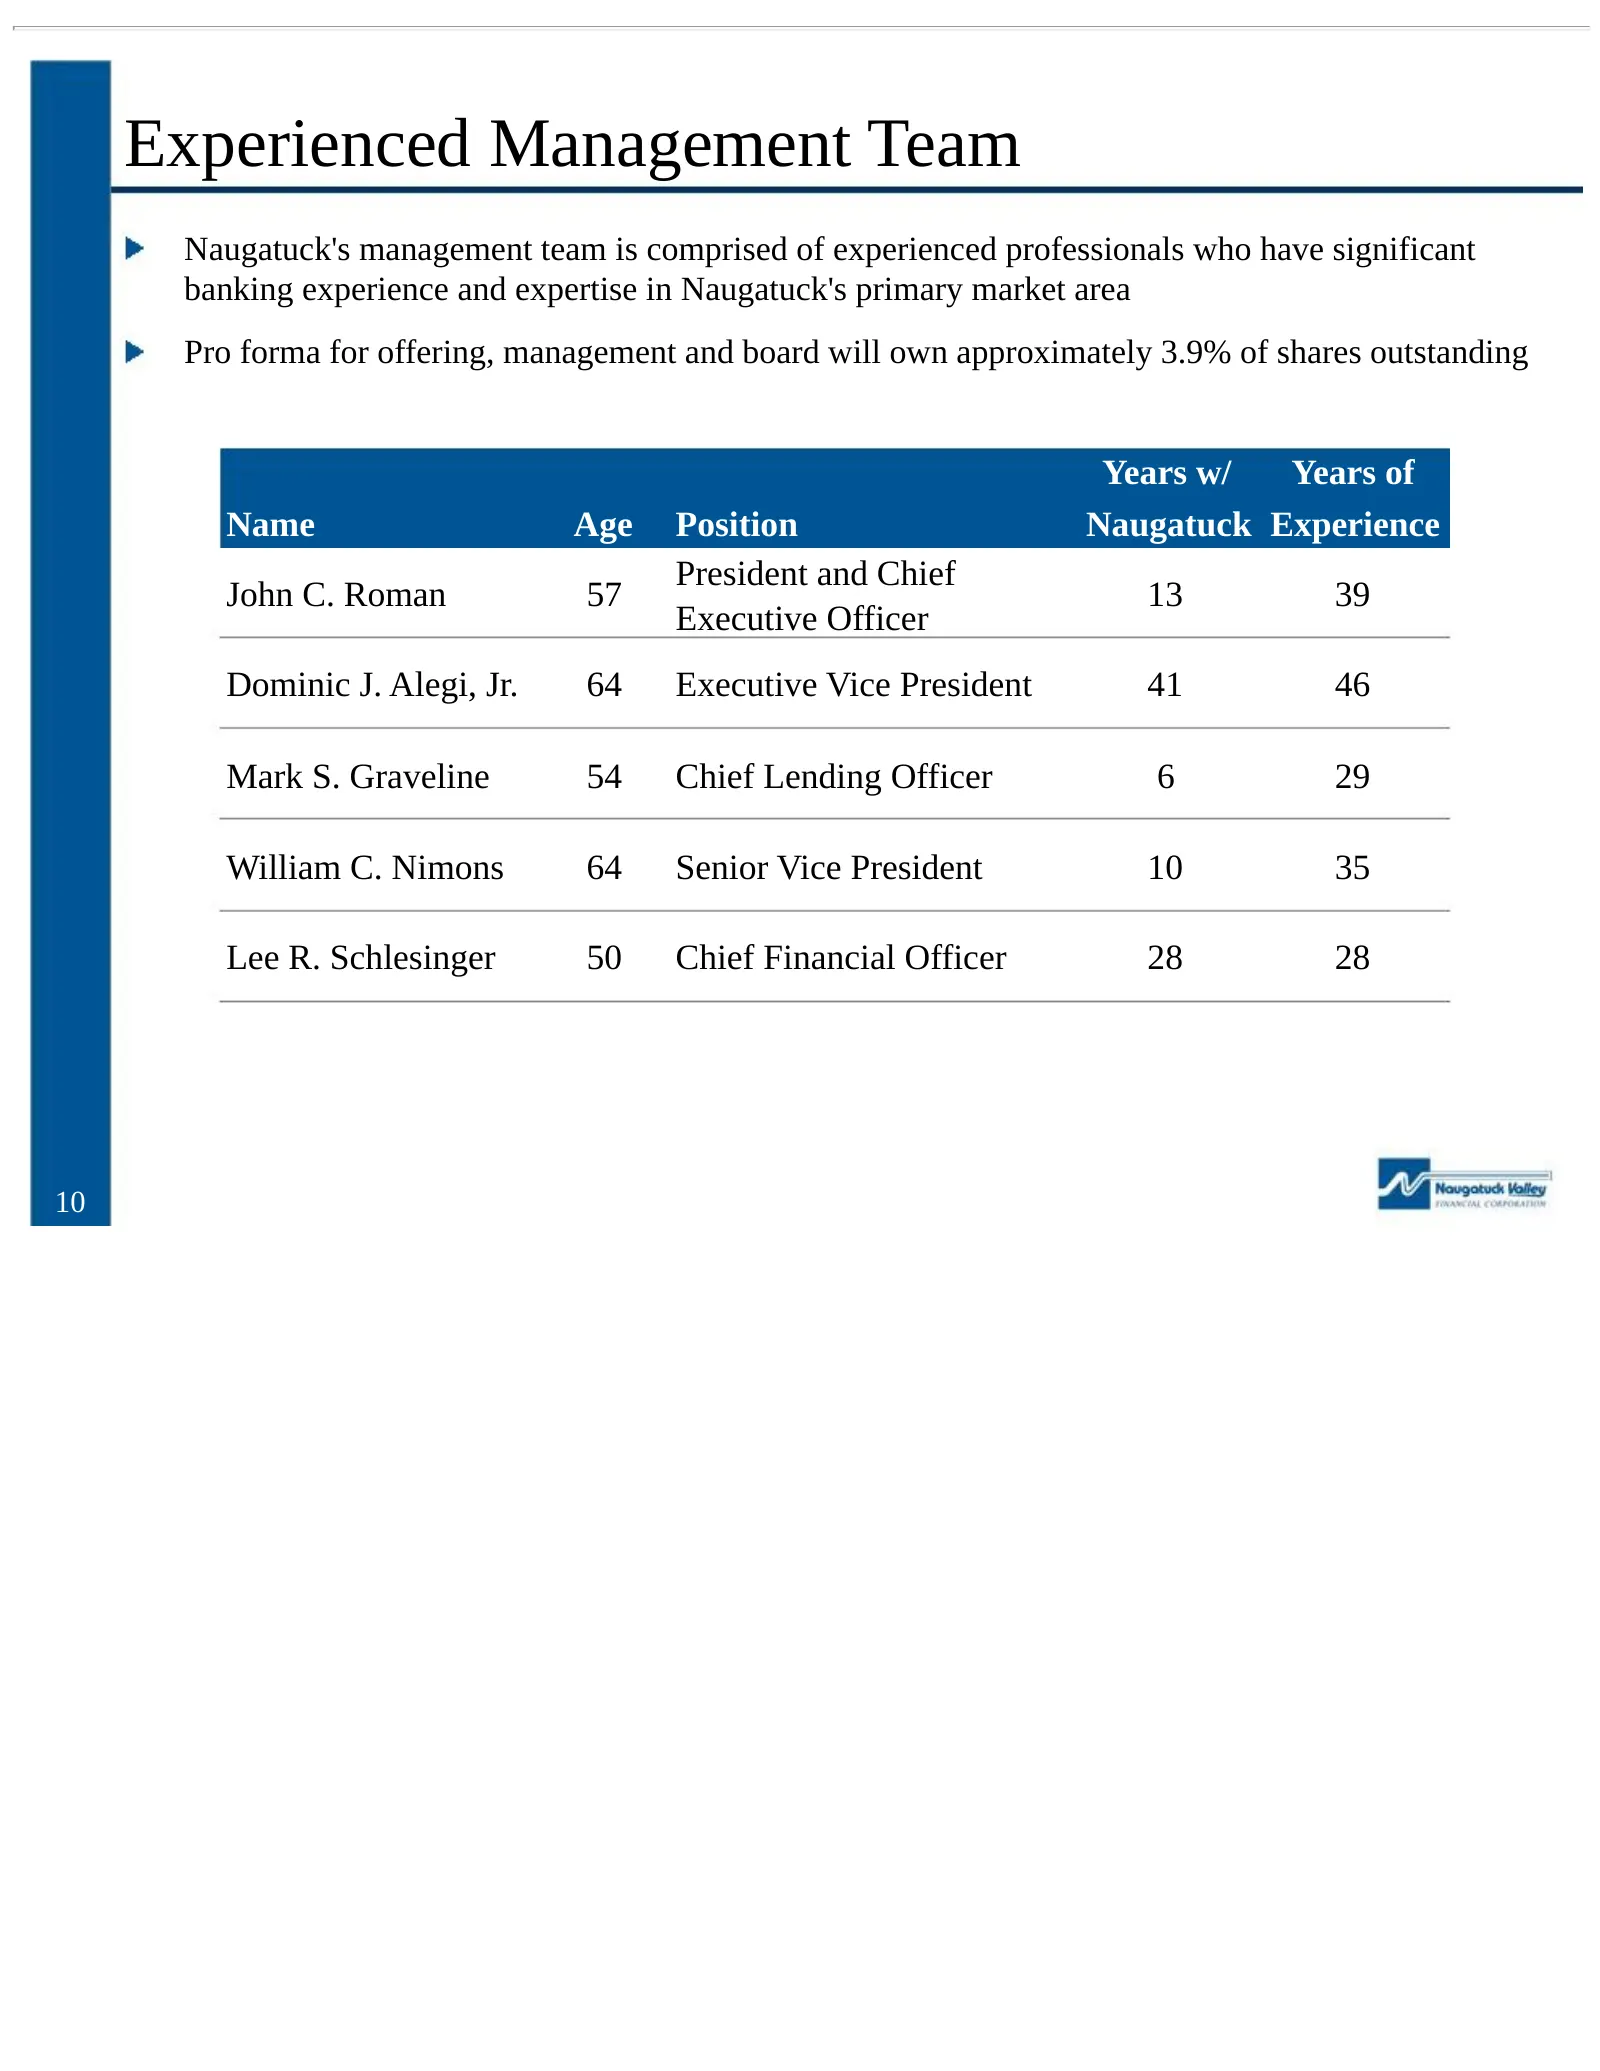
Experienced Management Team Naugatuck's management team is comprised of experienced professionals who have significant banking experience and expertise in Naugatuck's primary market area Pro forma for offering, management and board will own approximately 3.9% of shares outstanding Years w/ Years of
Slide 11: Shareholder Oriented Capital Management
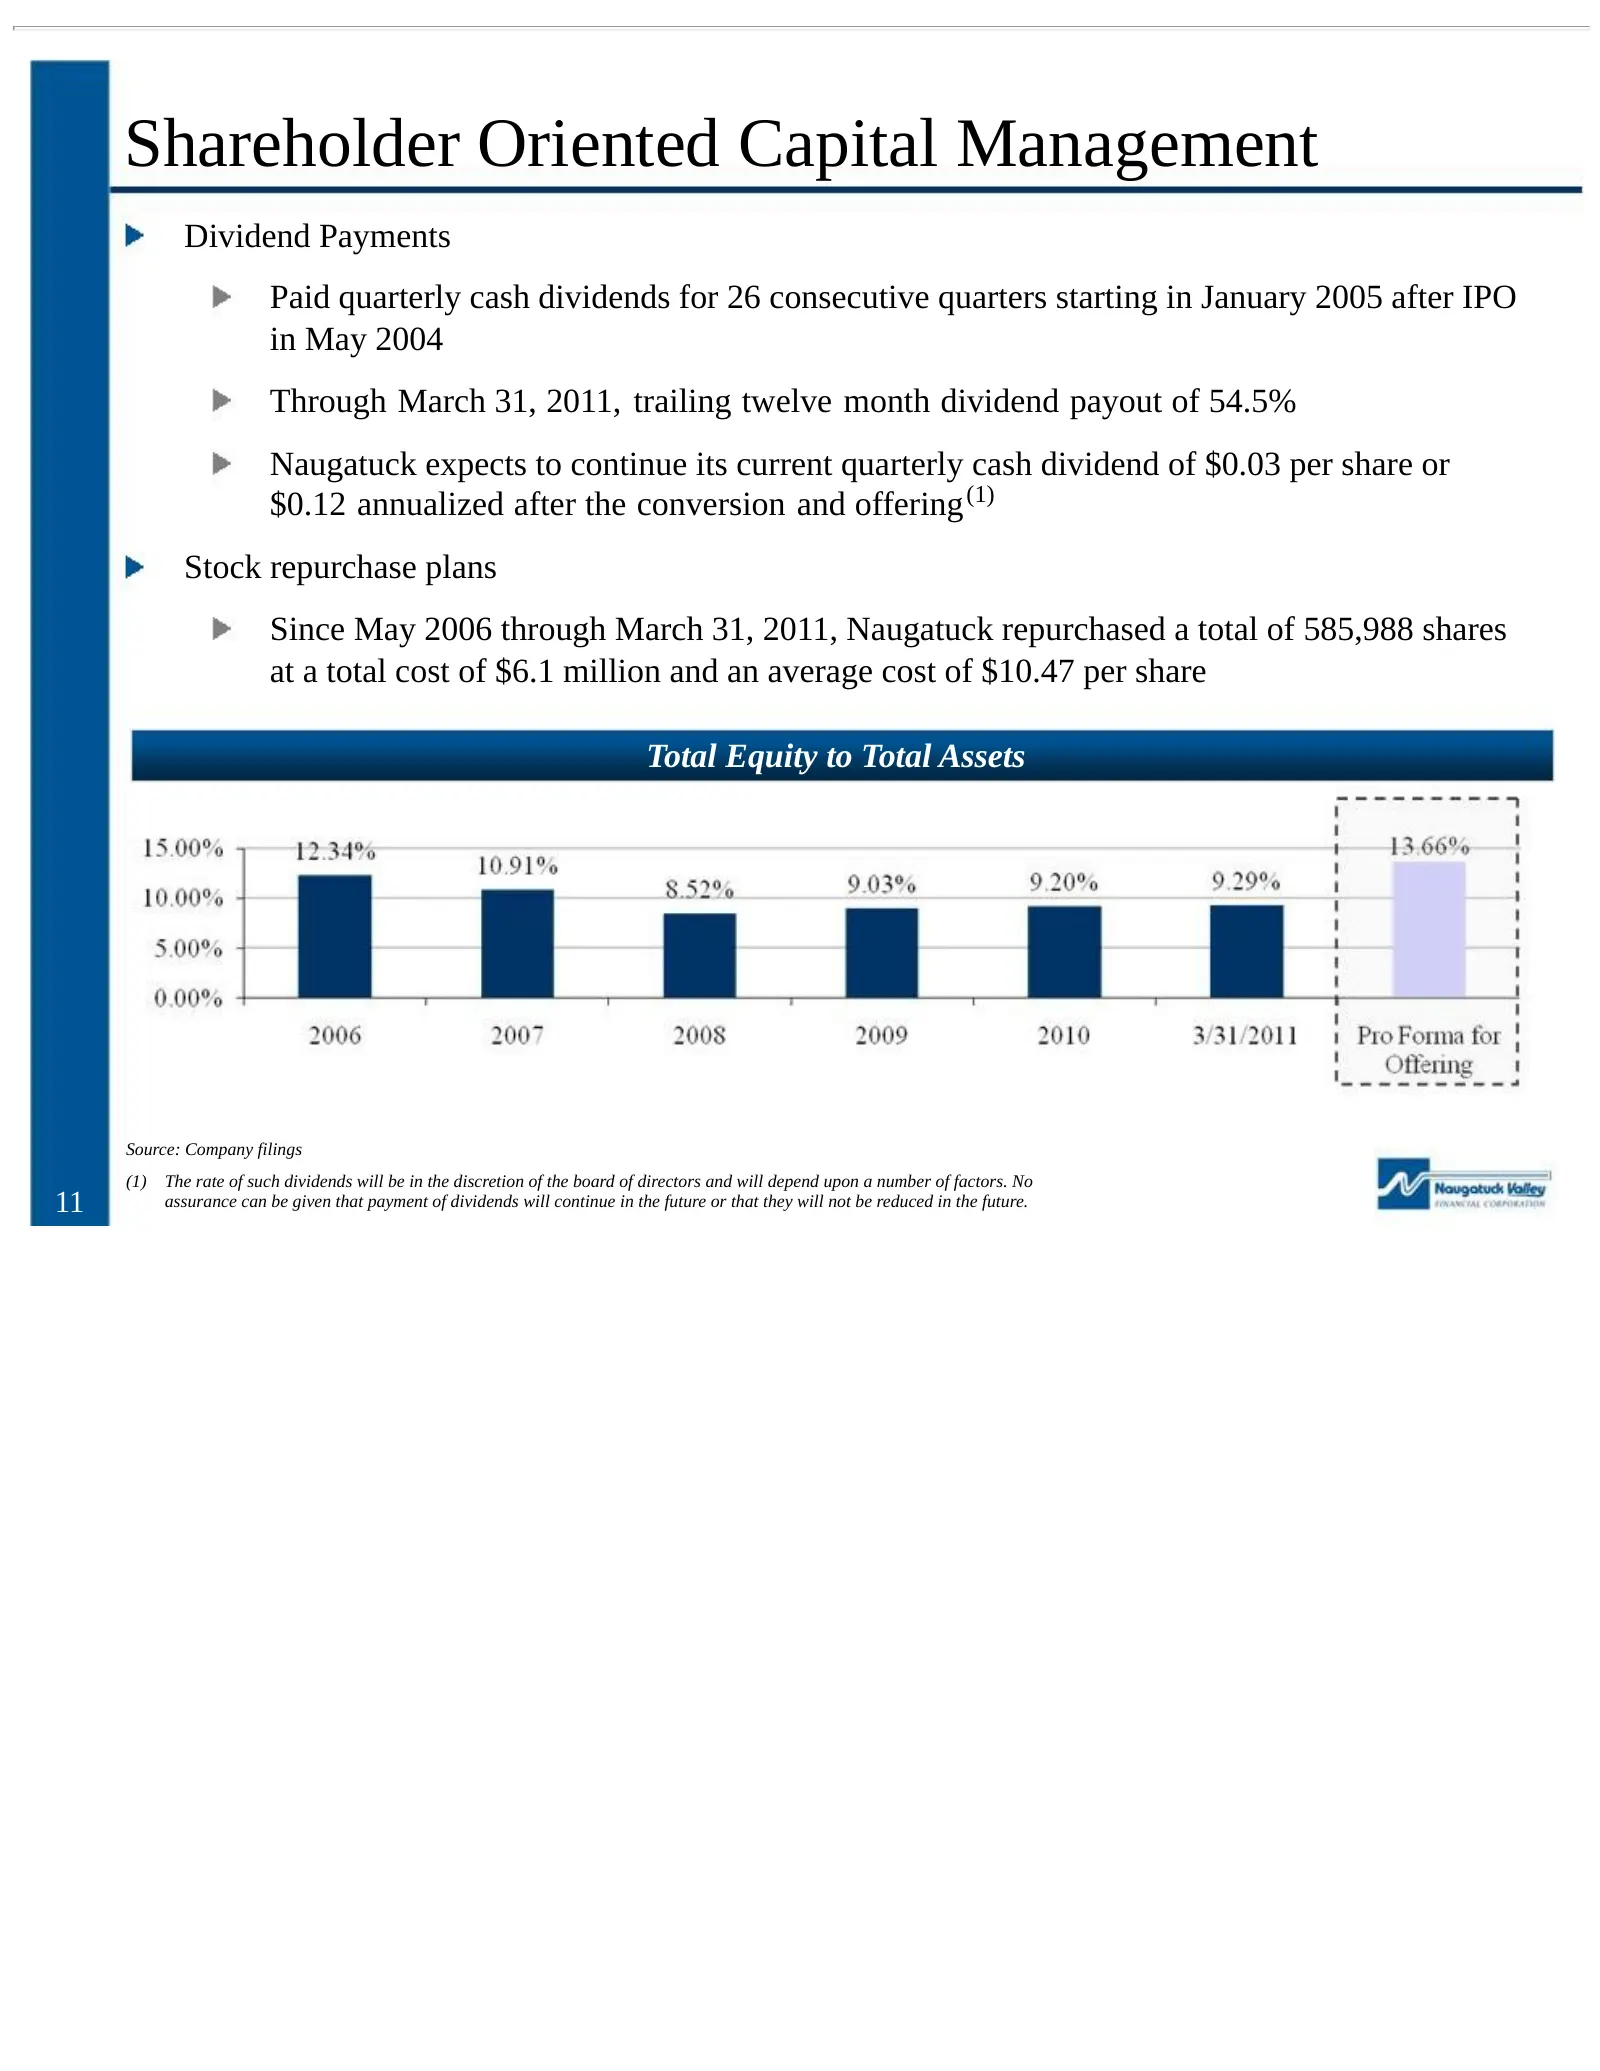
Shareholder Oriented Capital Management Dividend Payments Paid quarterly cash dividends for 26 consecutive quarters starting in January 2005 after IPO in May 2004 Through March 31, 2011, trailing twelve month dividend payout of 54.5% Naugatuck expects to continue its current quarterly cash dividend
Slide 12: Financial Highlights
VY, Naugatuck Valley FINANCIAL CORPORATION Financial Highlights
Slide 13: Prudent and Stable Loan Growth
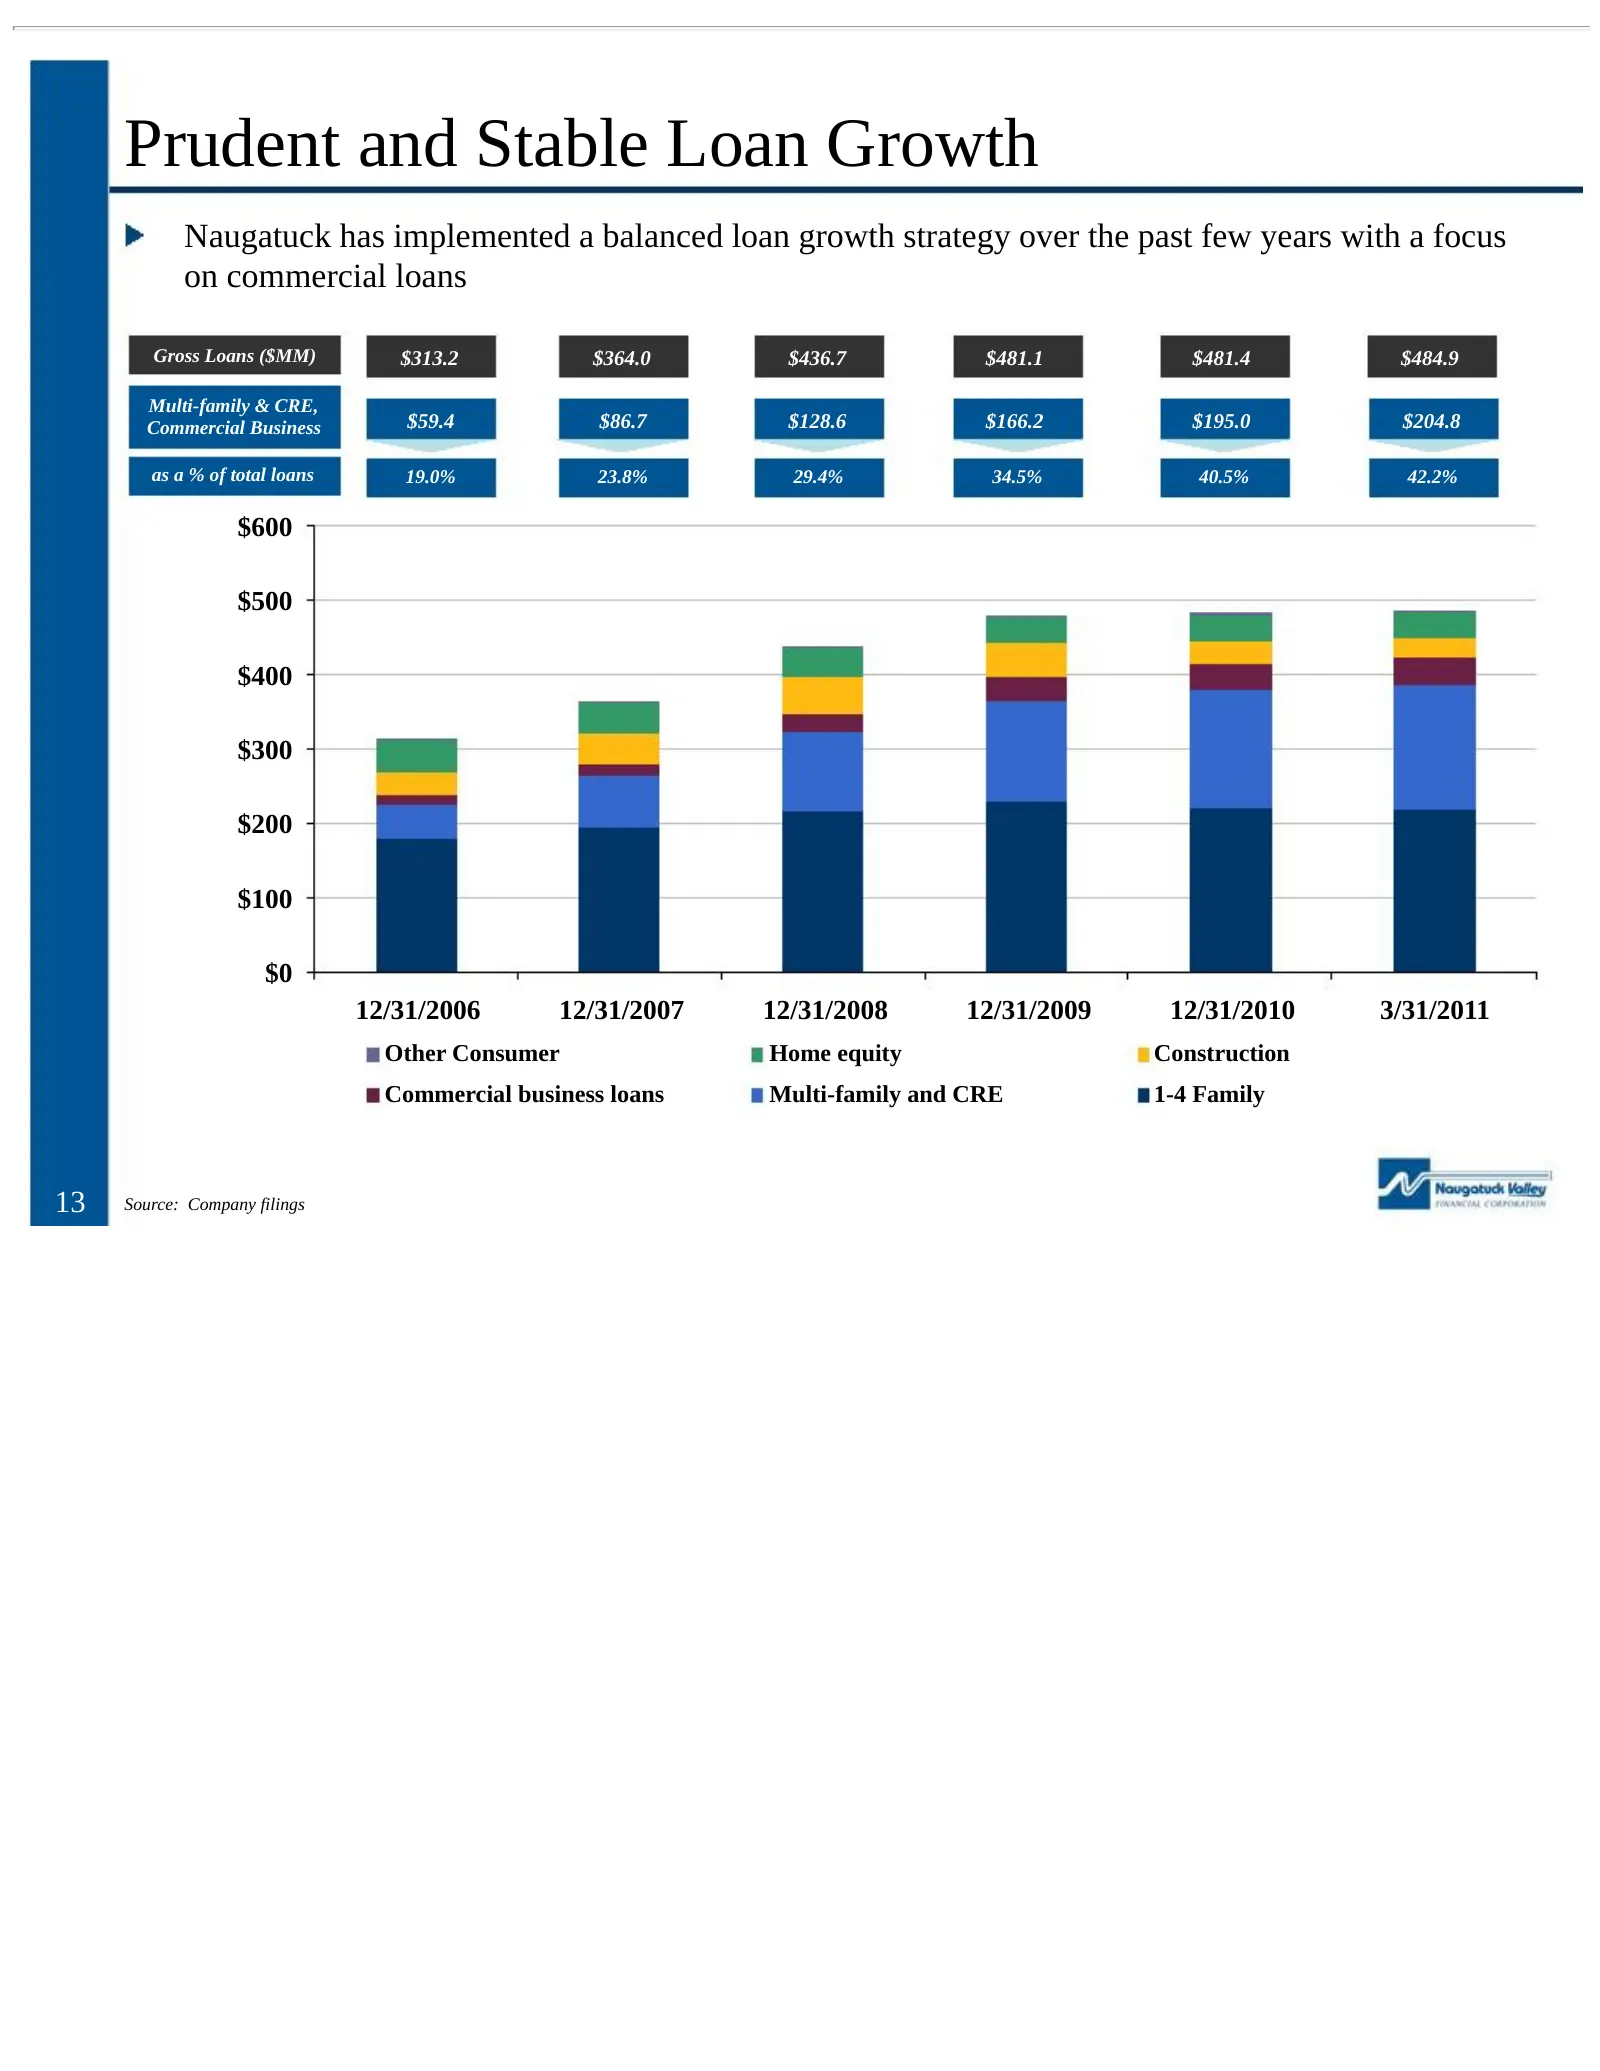
Prudent and Stable Loan Growth Naugatuck has implemented a balanced loan growth strategy over the past few years with a focus on commercial loans Gross Loans ($MM) $313.2 $364.0 $436.7 $481.1 $481.4 $484.9 Multi-family & CRE, Commercial Business $59.4 $86.7 $128.6 $166.2 $195.0 $204.8 as a % of tota
Slide 14: Commercial and Construction Concentrations
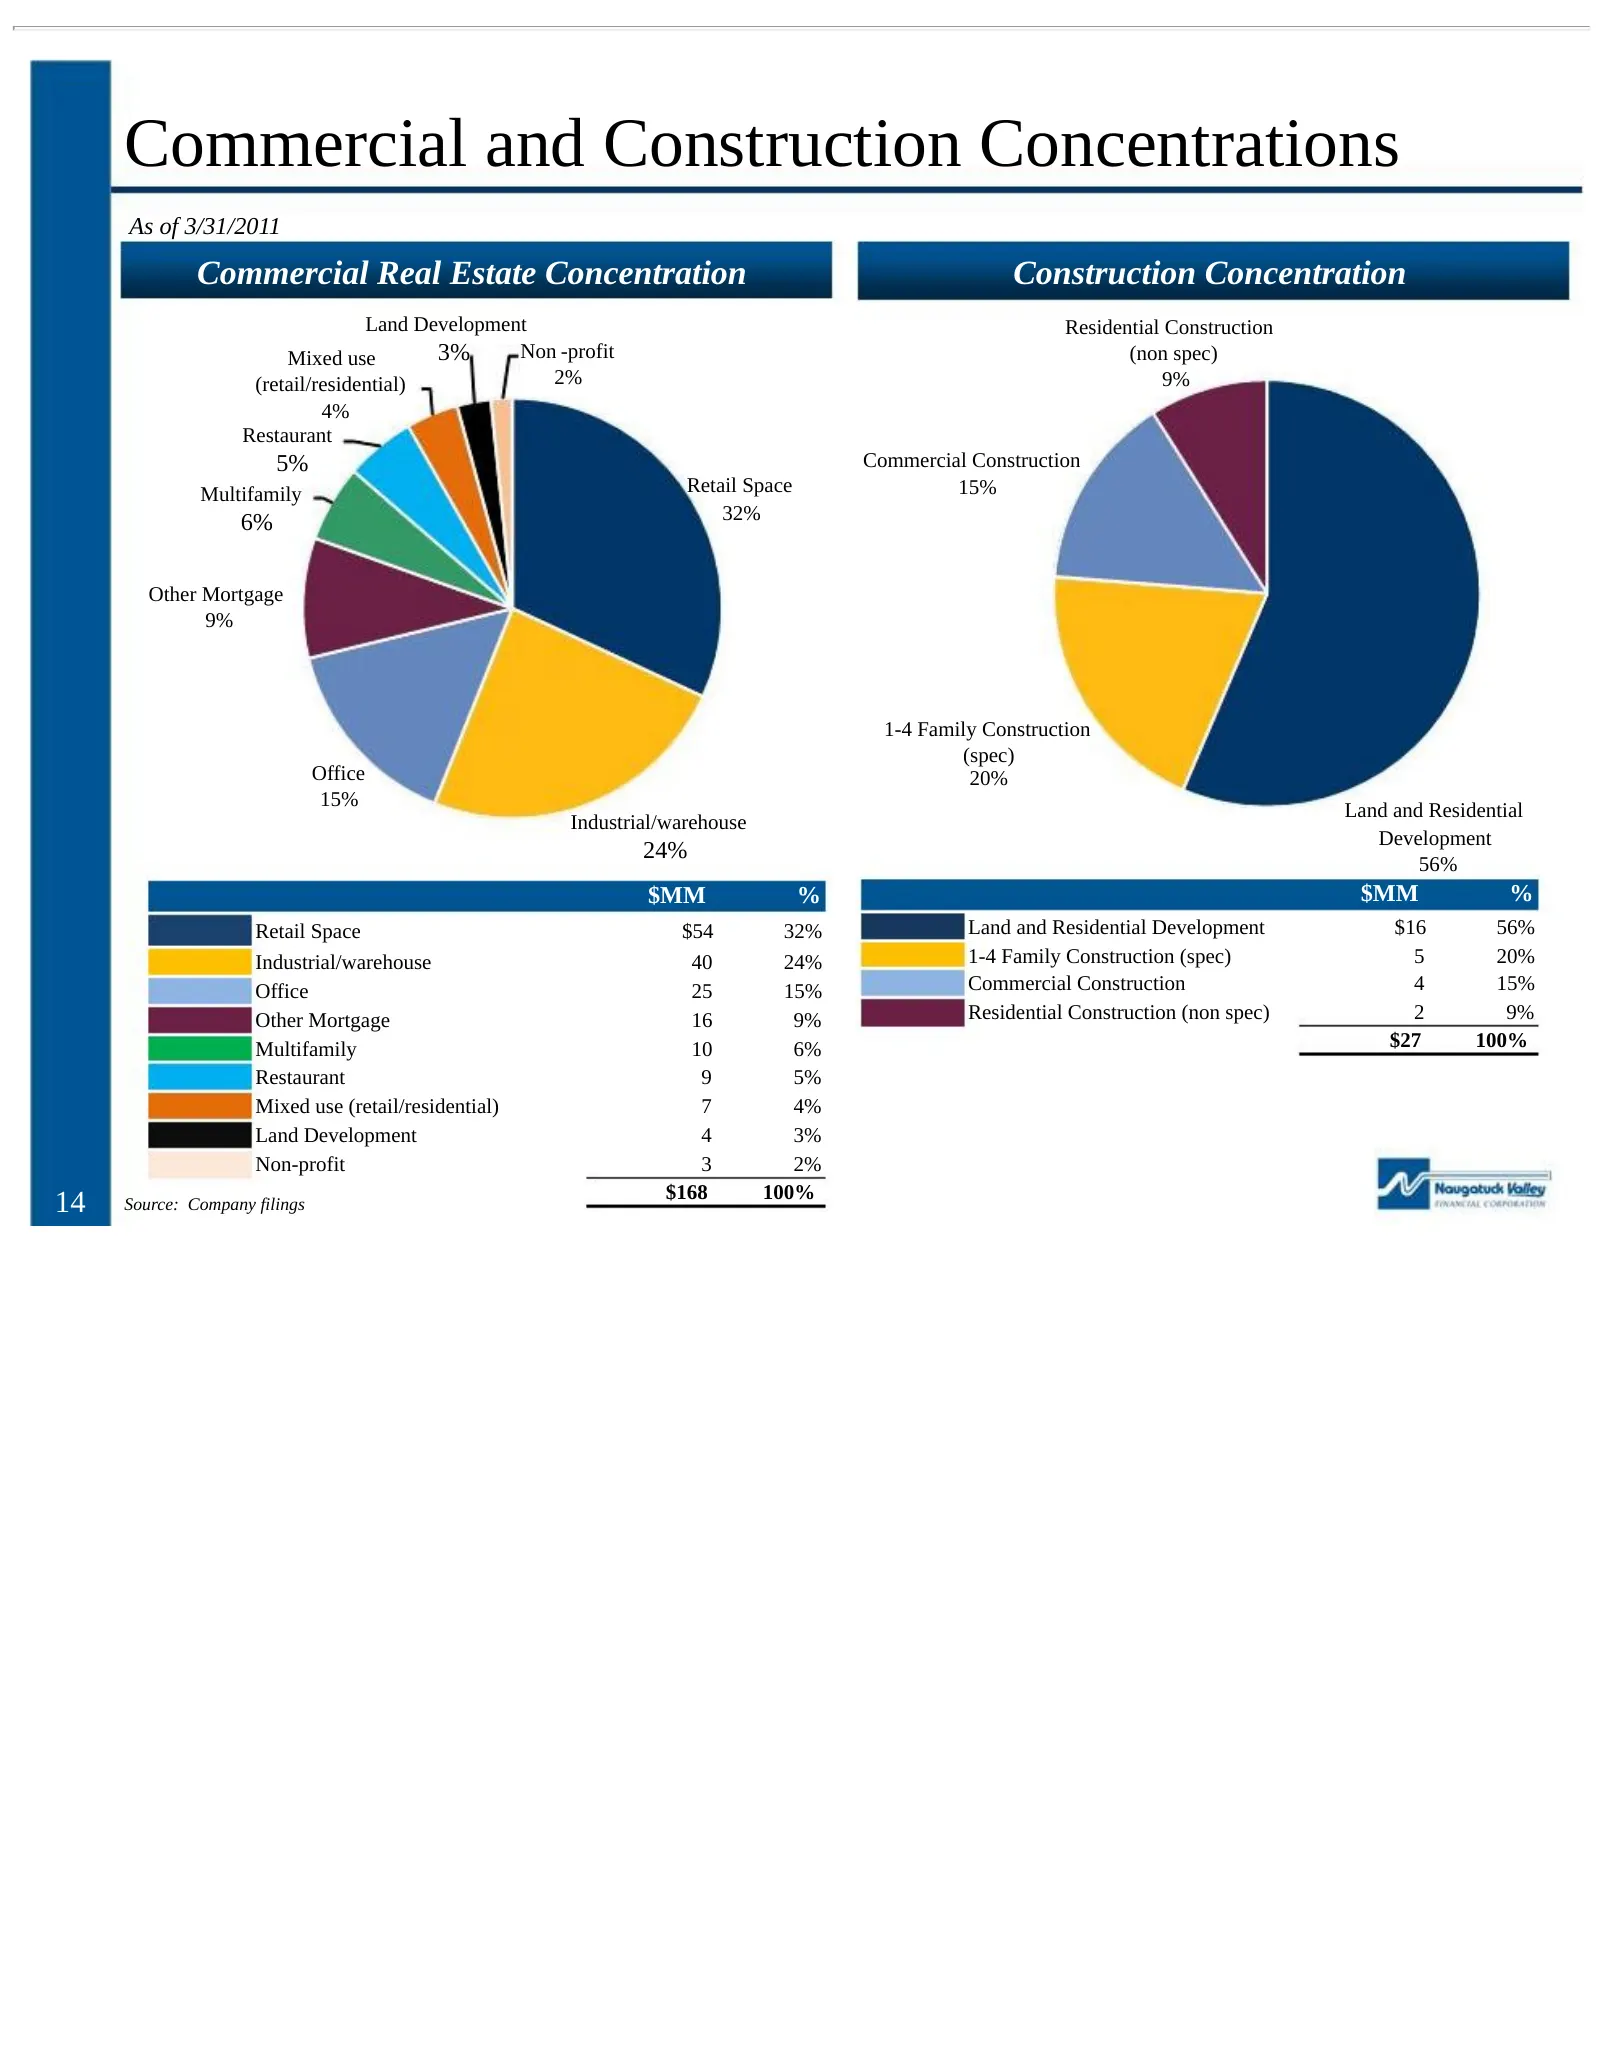
Commercial and Construction Concentrations As of 3/31/2011 Commercial Real Estate Concentration Construction Concentration Land Development Residential Construction Mixed use 3% Non -profit (non spec) (retail/residential) 2% 9% 4% Restaurant 5% Commercial Construction Multifamily Retail Space 15% 6%
Slide 15: Stabilizing Asset Quality
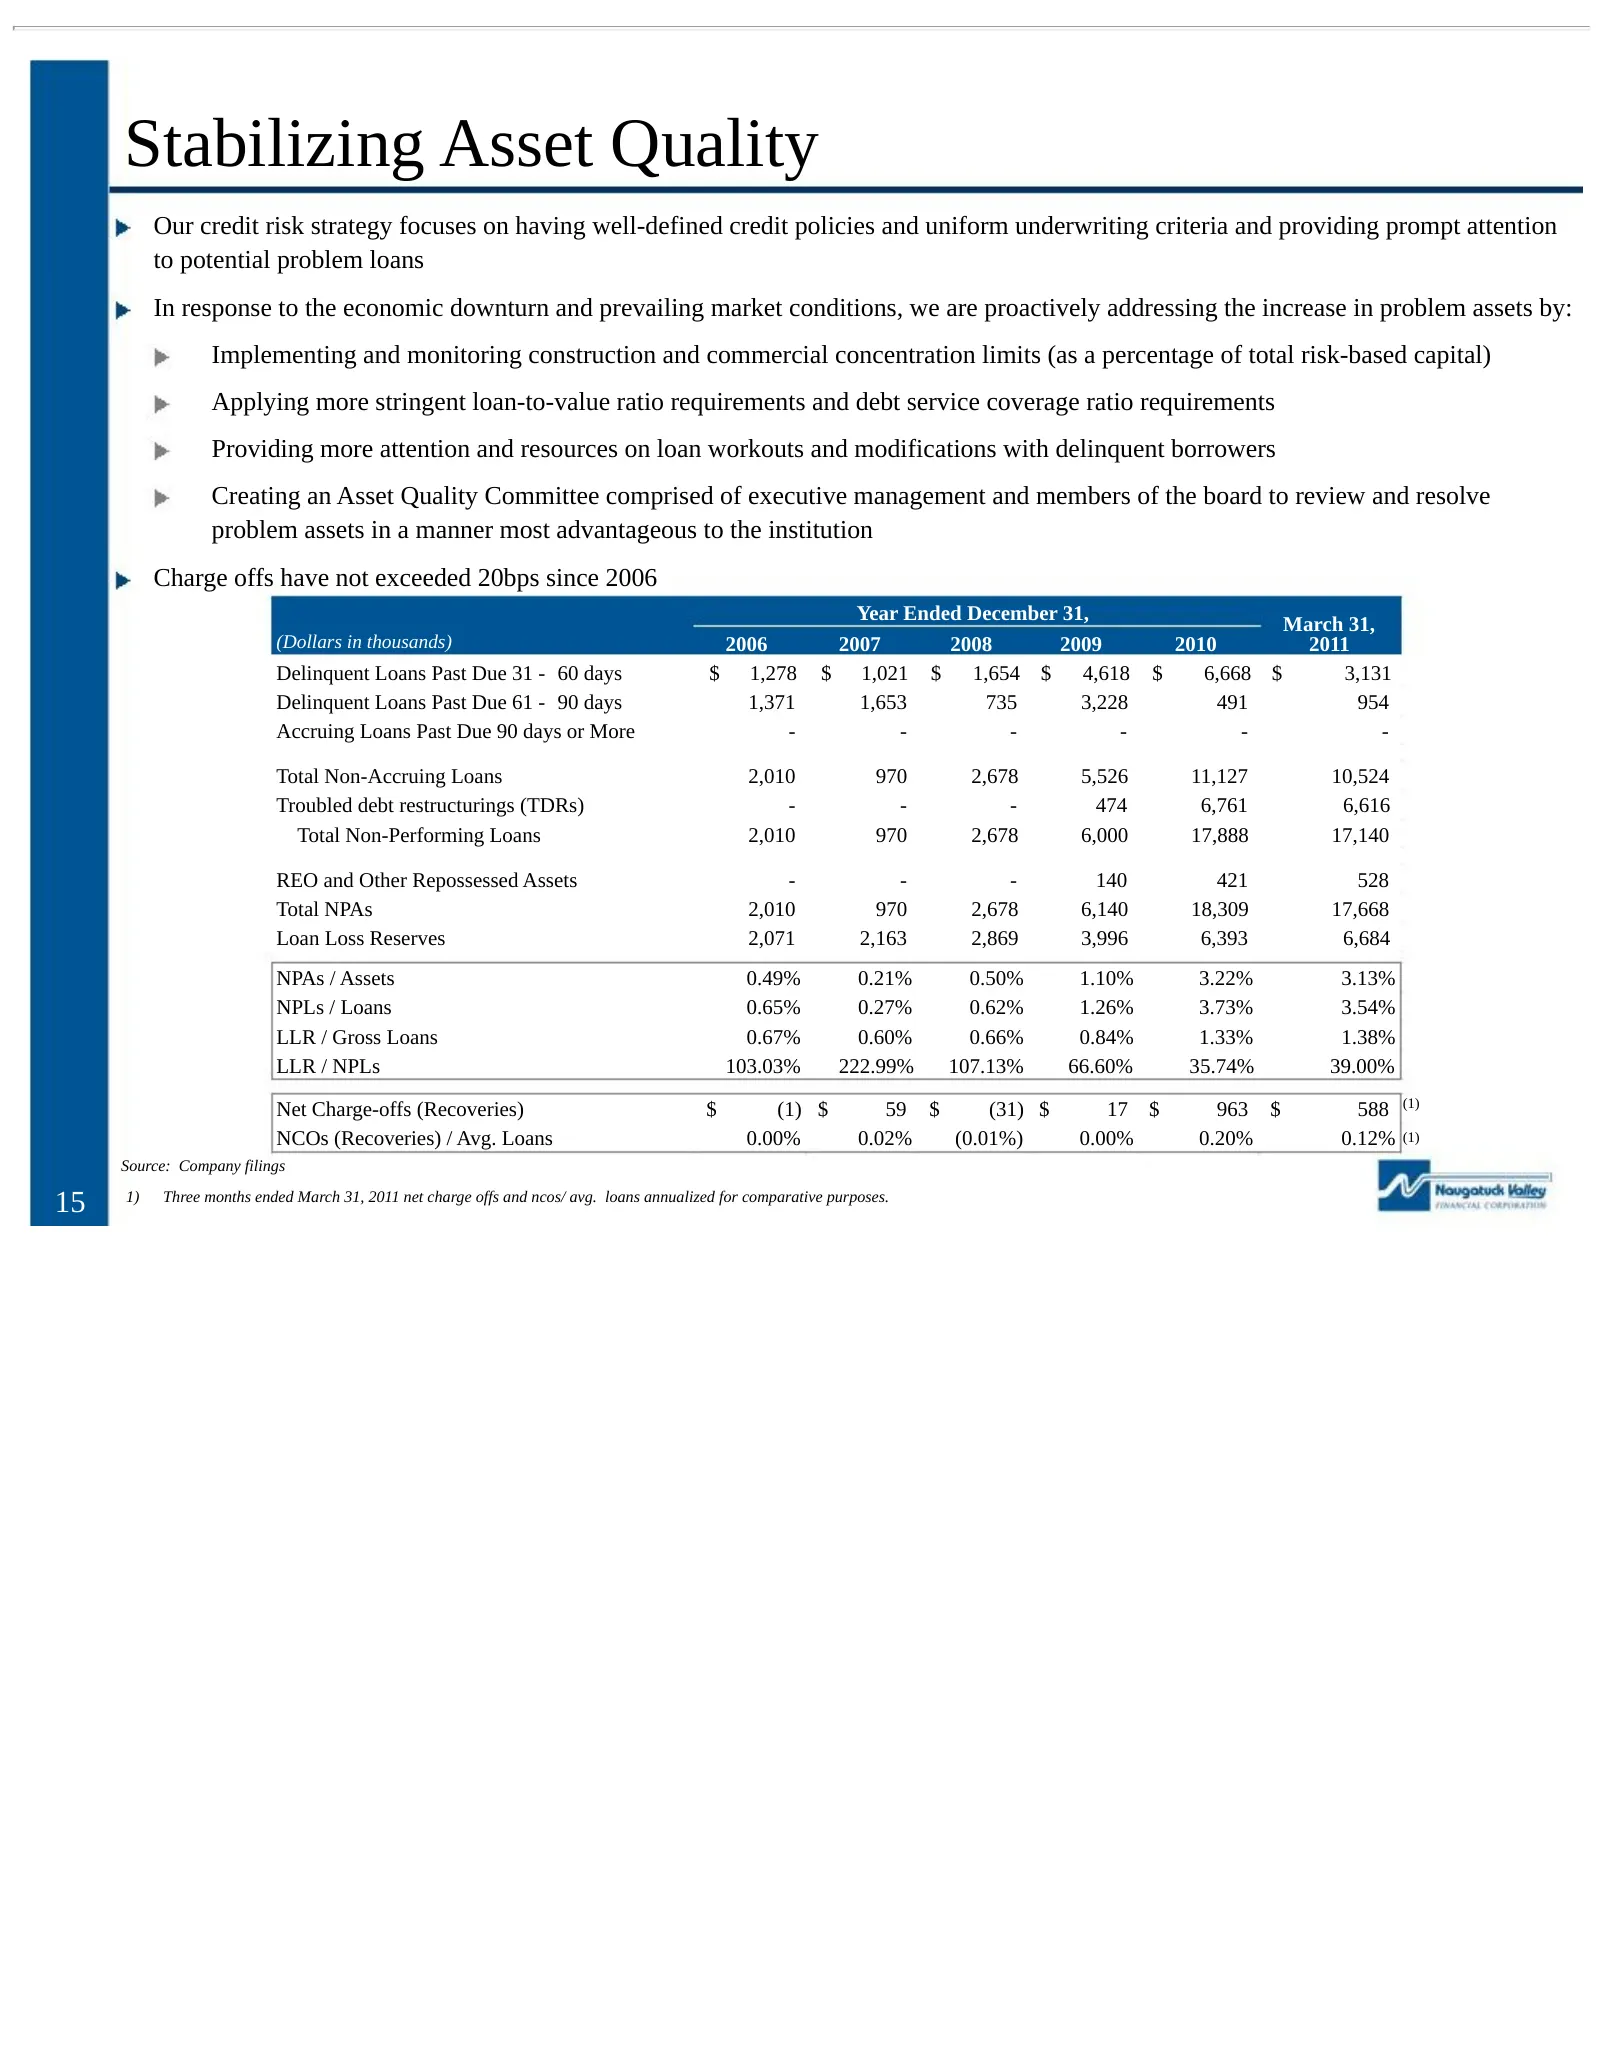
Stabilizing Asset Quality Our credit risk strategy focuses on having well-defined credit policies and uniform underwriting criteria and providing prompt attention to potential problem loans In response to the economic downturn and prevailing market conditions, we are proactively addressing the incre
Slide 16: Classified Assets
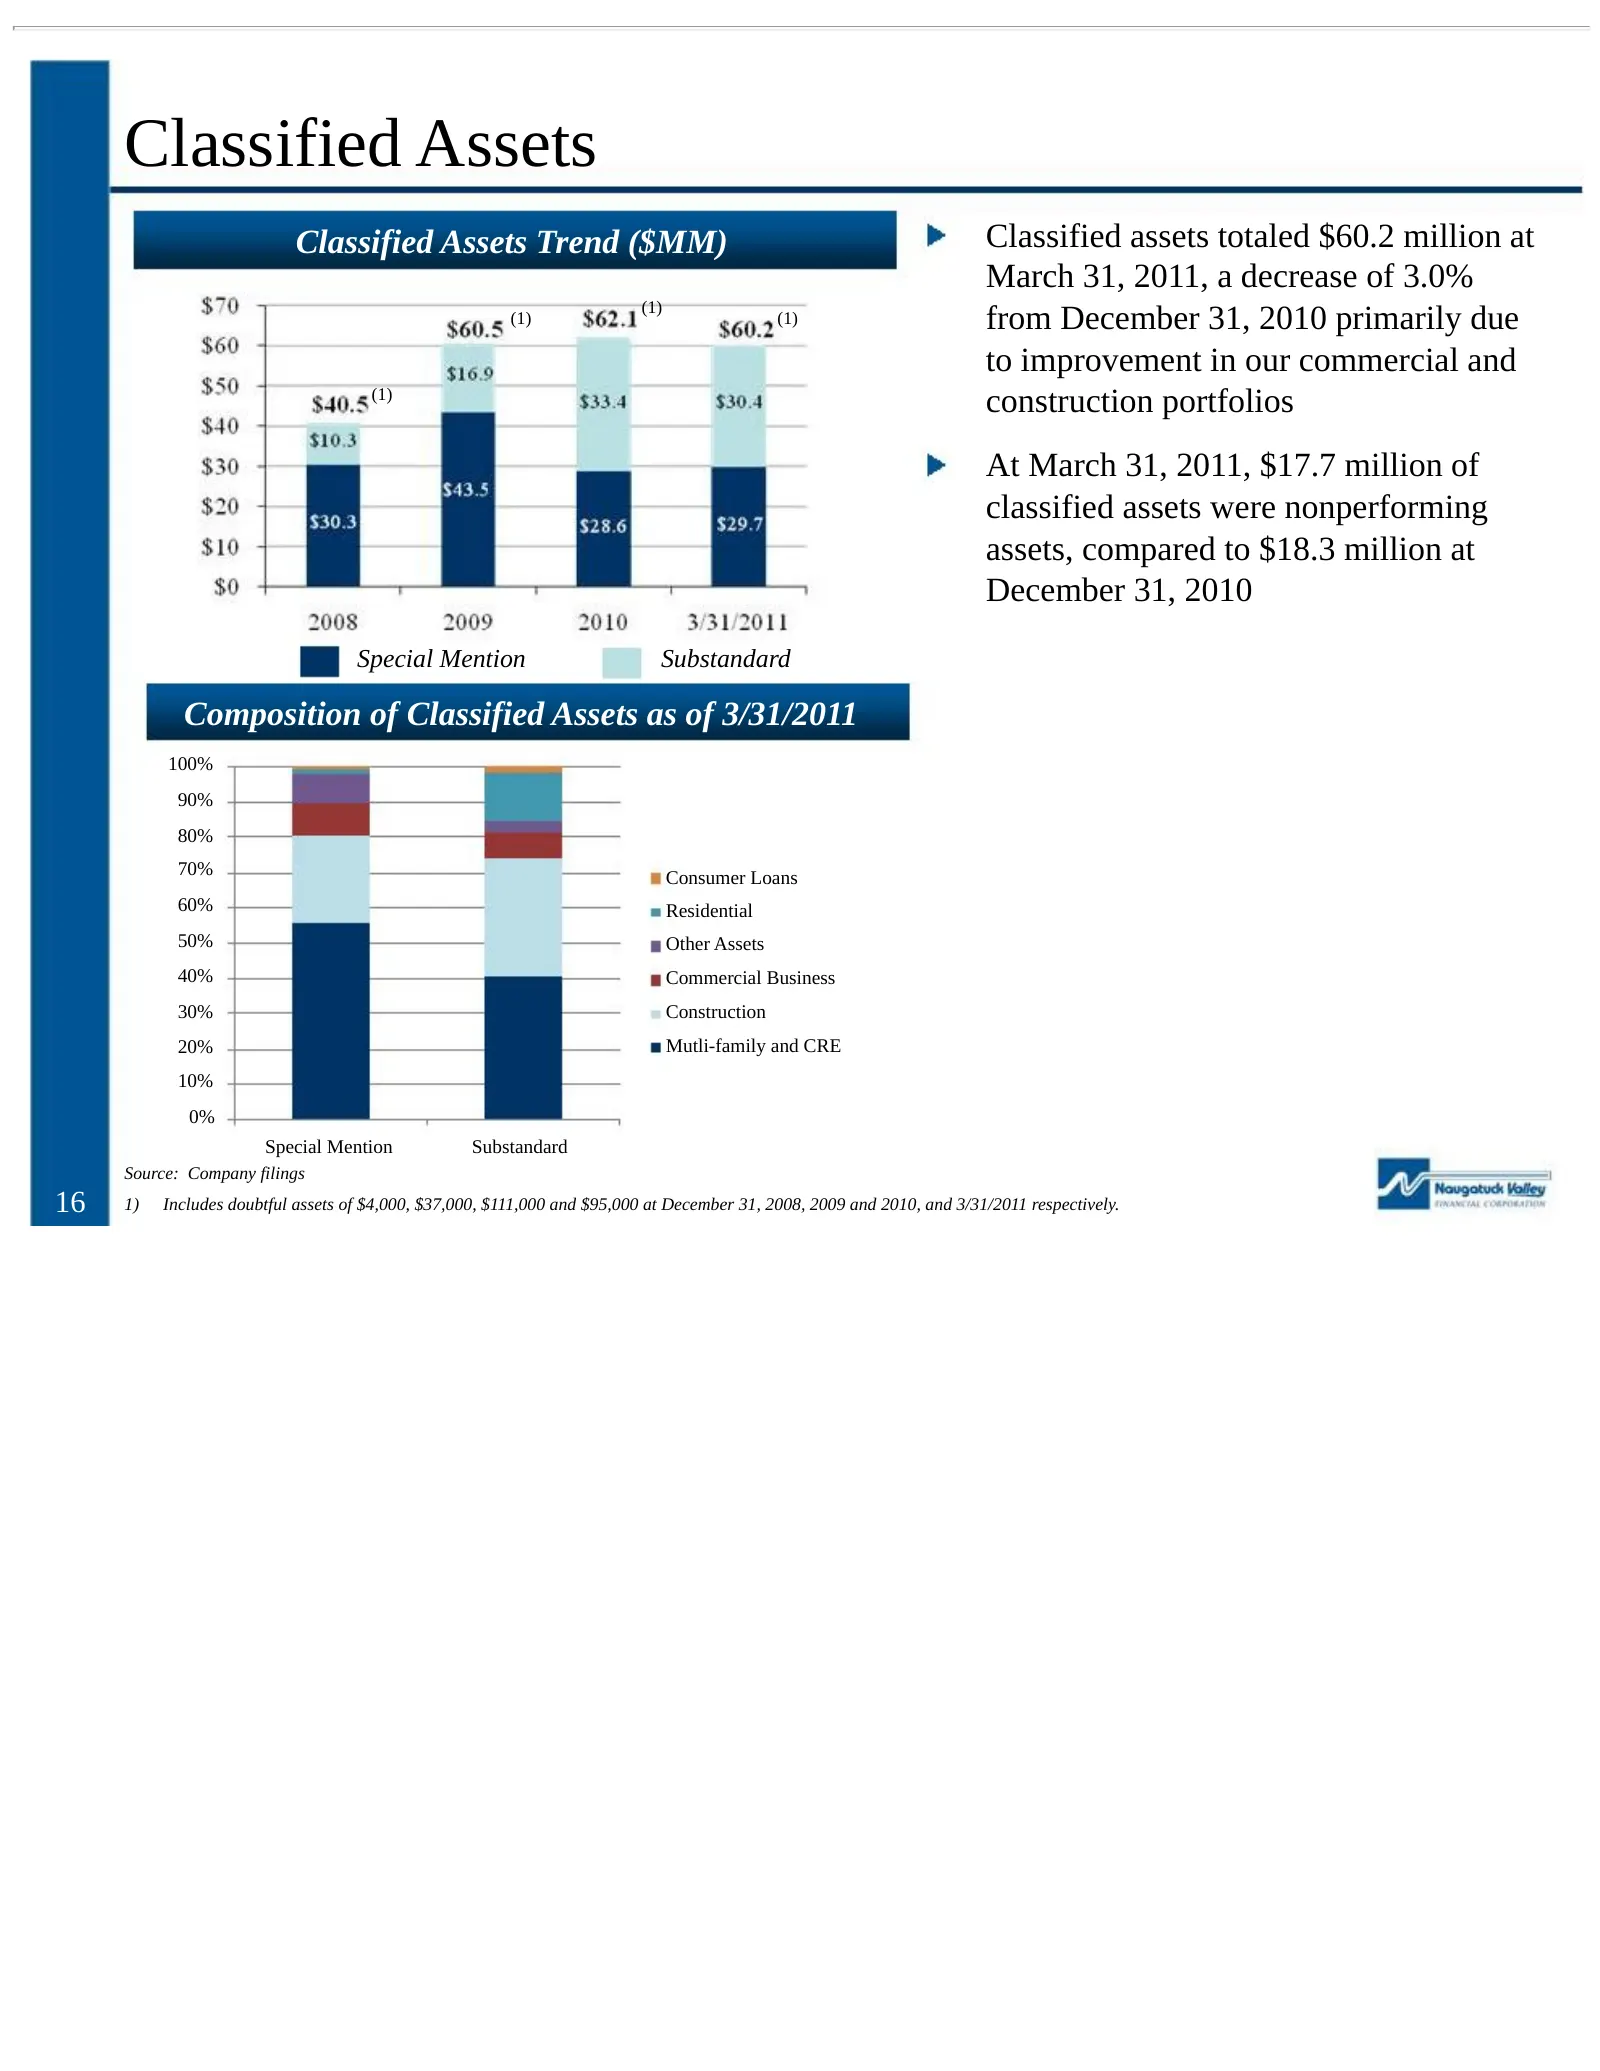
Classified Assets Classified Assets Trend ($MM) Classified assets totaled $60.2 million at March 31, 2011, a decrease of 3.0% (1) (1) (1) from December 31, 2010 primarily due to improvement in our commercial and (1) construction portfolios At March 31, 2011, $17.7 million of classified assets were n
Slide 17: Non-Accrual Loan Composition
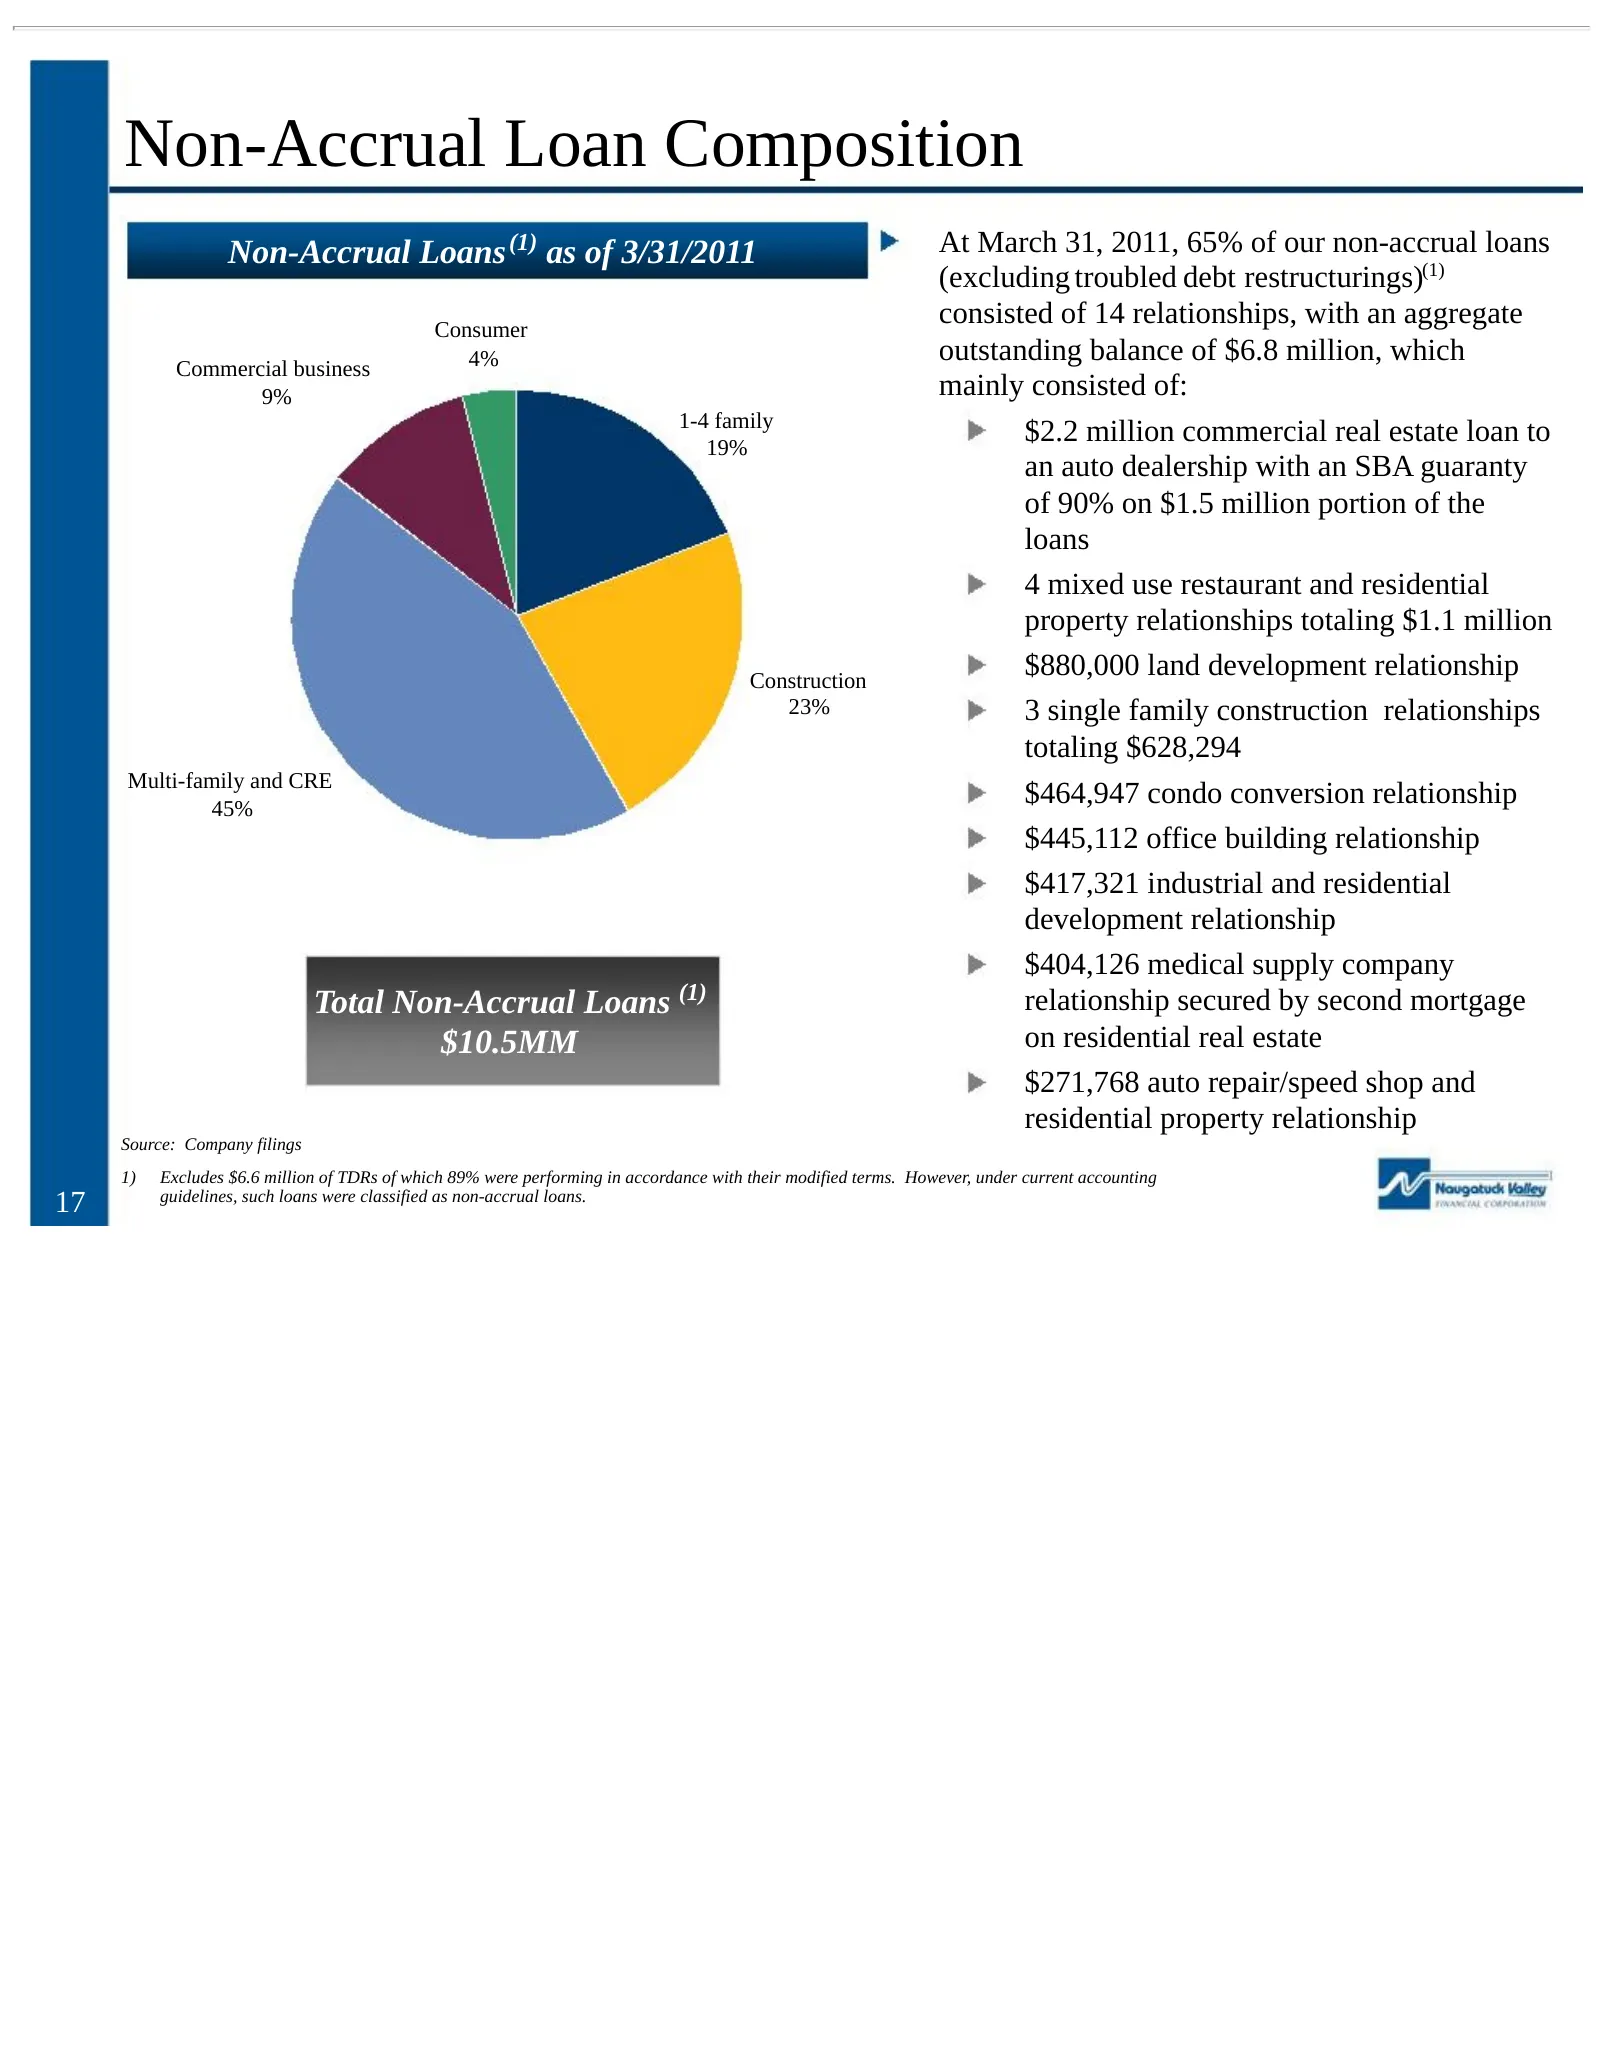
Non-Accrual Loan Composition Non-Accrual Loans (1) as of 3/31/2011 At March 31, 2011, 65% of our non-accrual loans (excluding troubled debt restructurings)(1) Consumer consisted of 14 relationships, with an aggregate 4% outstanding balance of $6.8 million, which Commercial business 9% mainly consist
Slide 18: Prudent Underwriting Standards
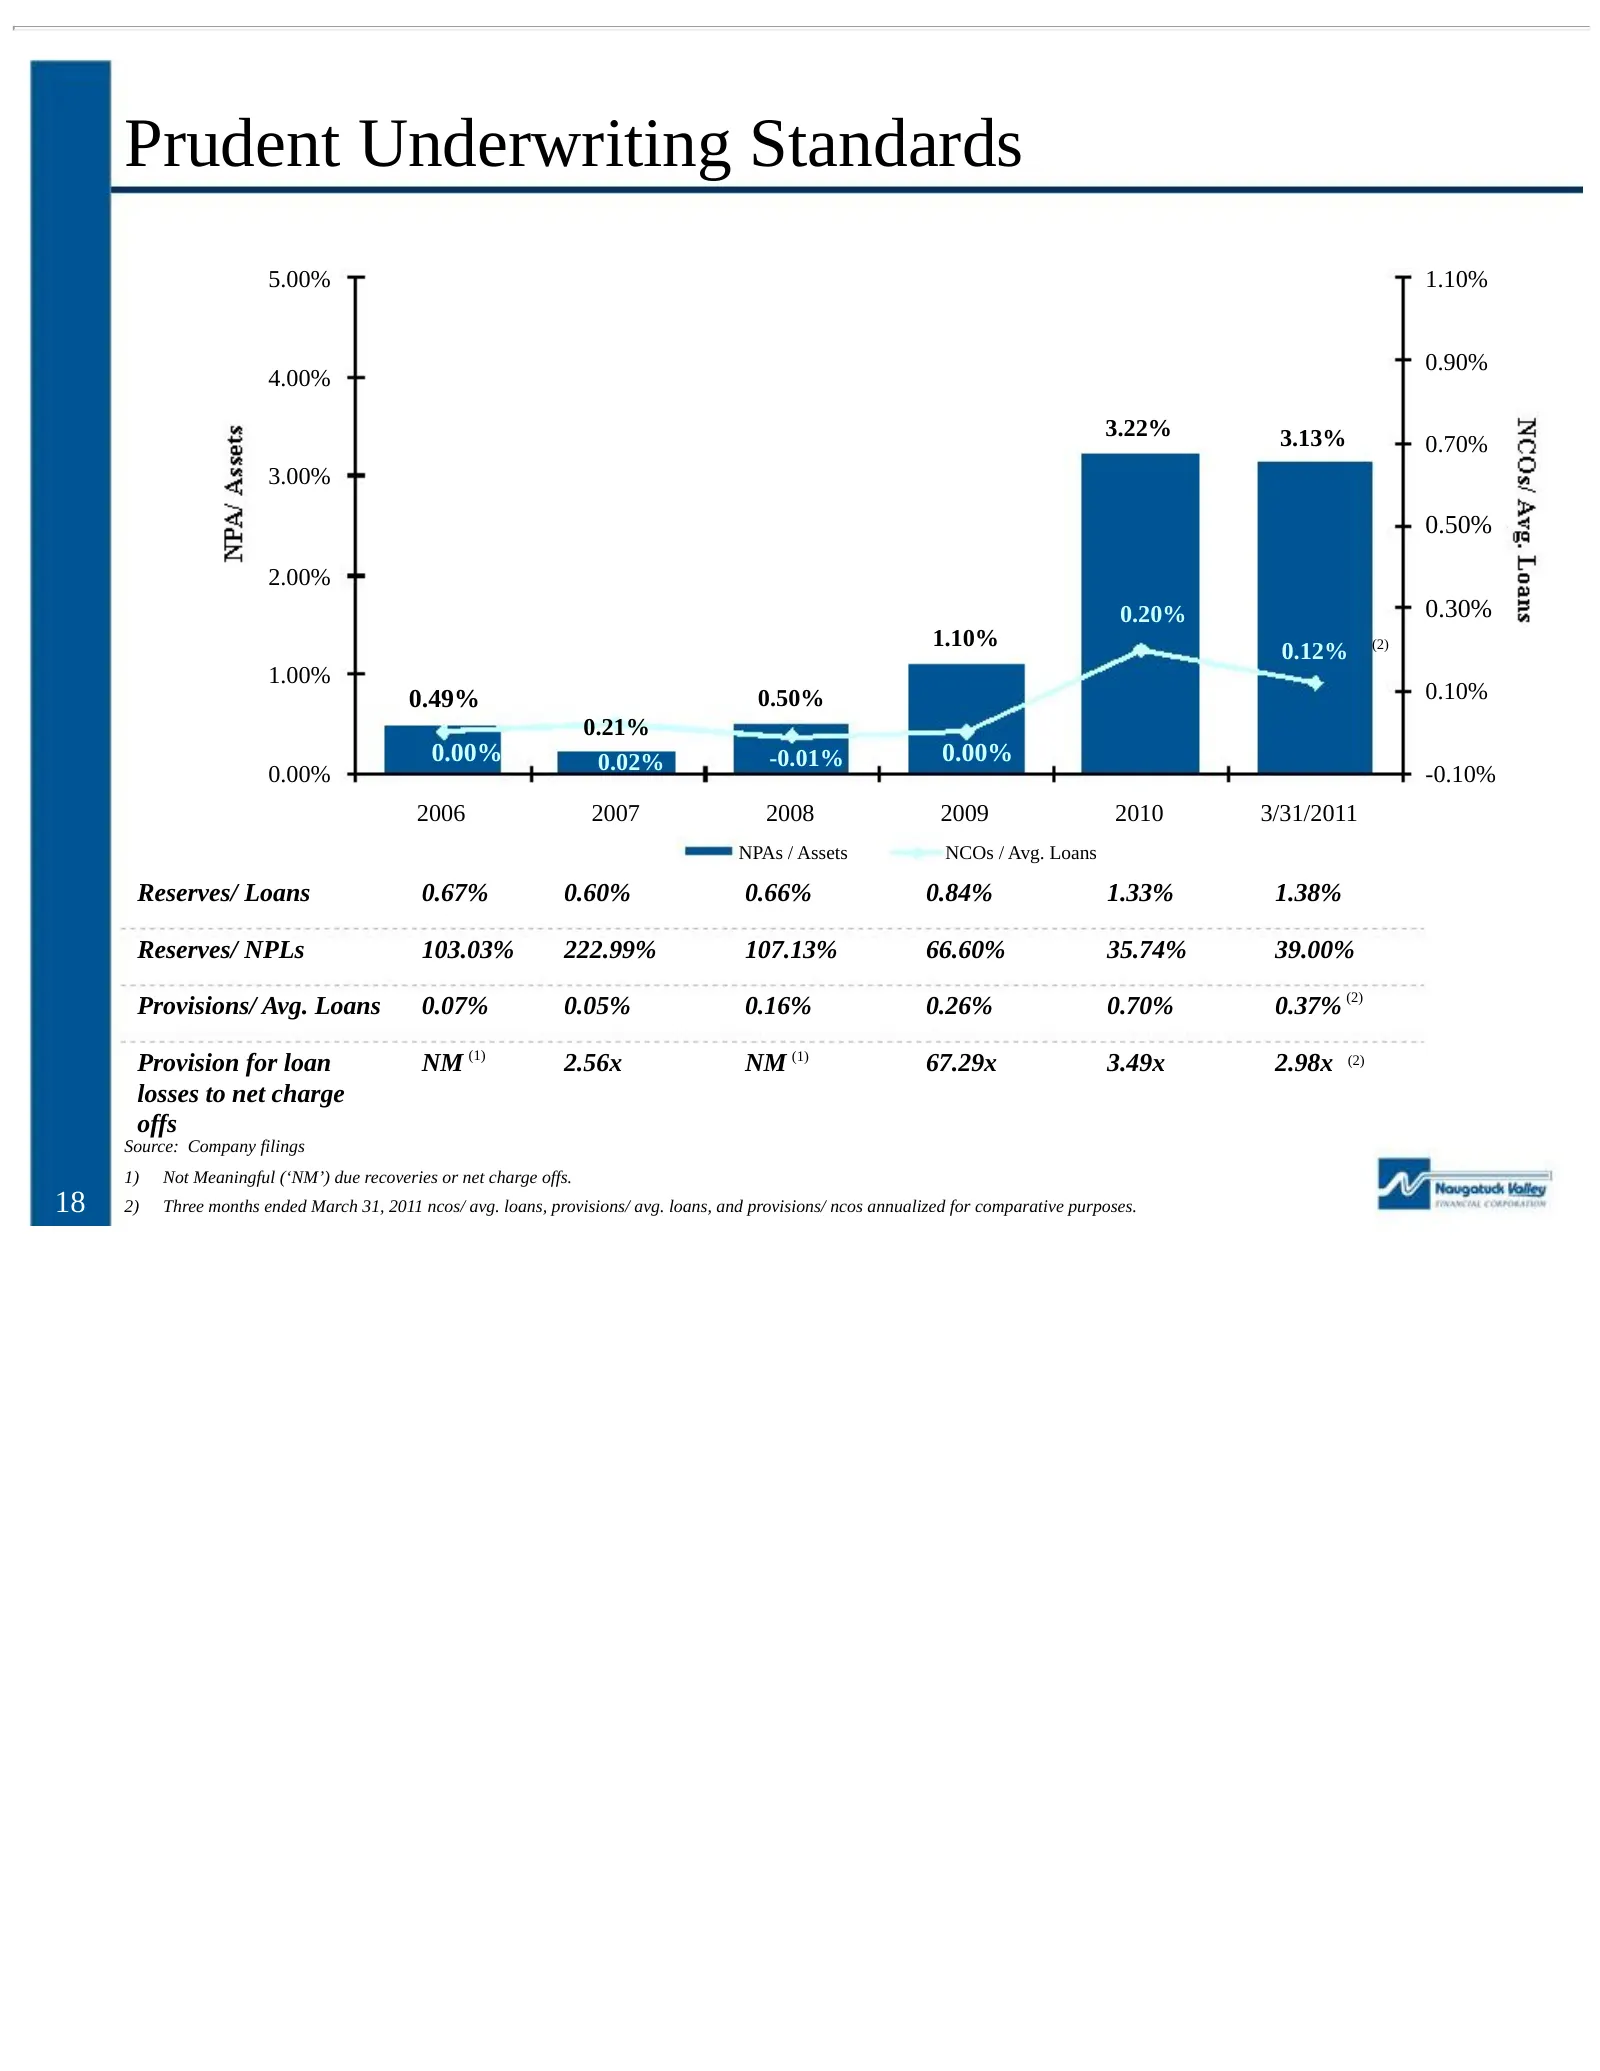
Prudent Underwriting Standards 5.00% 1.10% 0.90% 4.00% 3.22% 3.13% 0.70% 3.00% 0.50% 2.00% 0.20% 0.30% 1.10% (2) 0.12% 1.00% 0.49% 0.50% 0.10% 0.21% 0.00% 0.02% -0.01% 0.00% 0.00% -0.10% 2006 2007 2008 2009 2010 3/31/2011 NPAs / Assets NCOs / Avg. Loans Reserves/ Loans 0.67% 0.60% 0.66% 0.84% 1.33%
Slide 19: Improved Funding Base and Deposit Growth
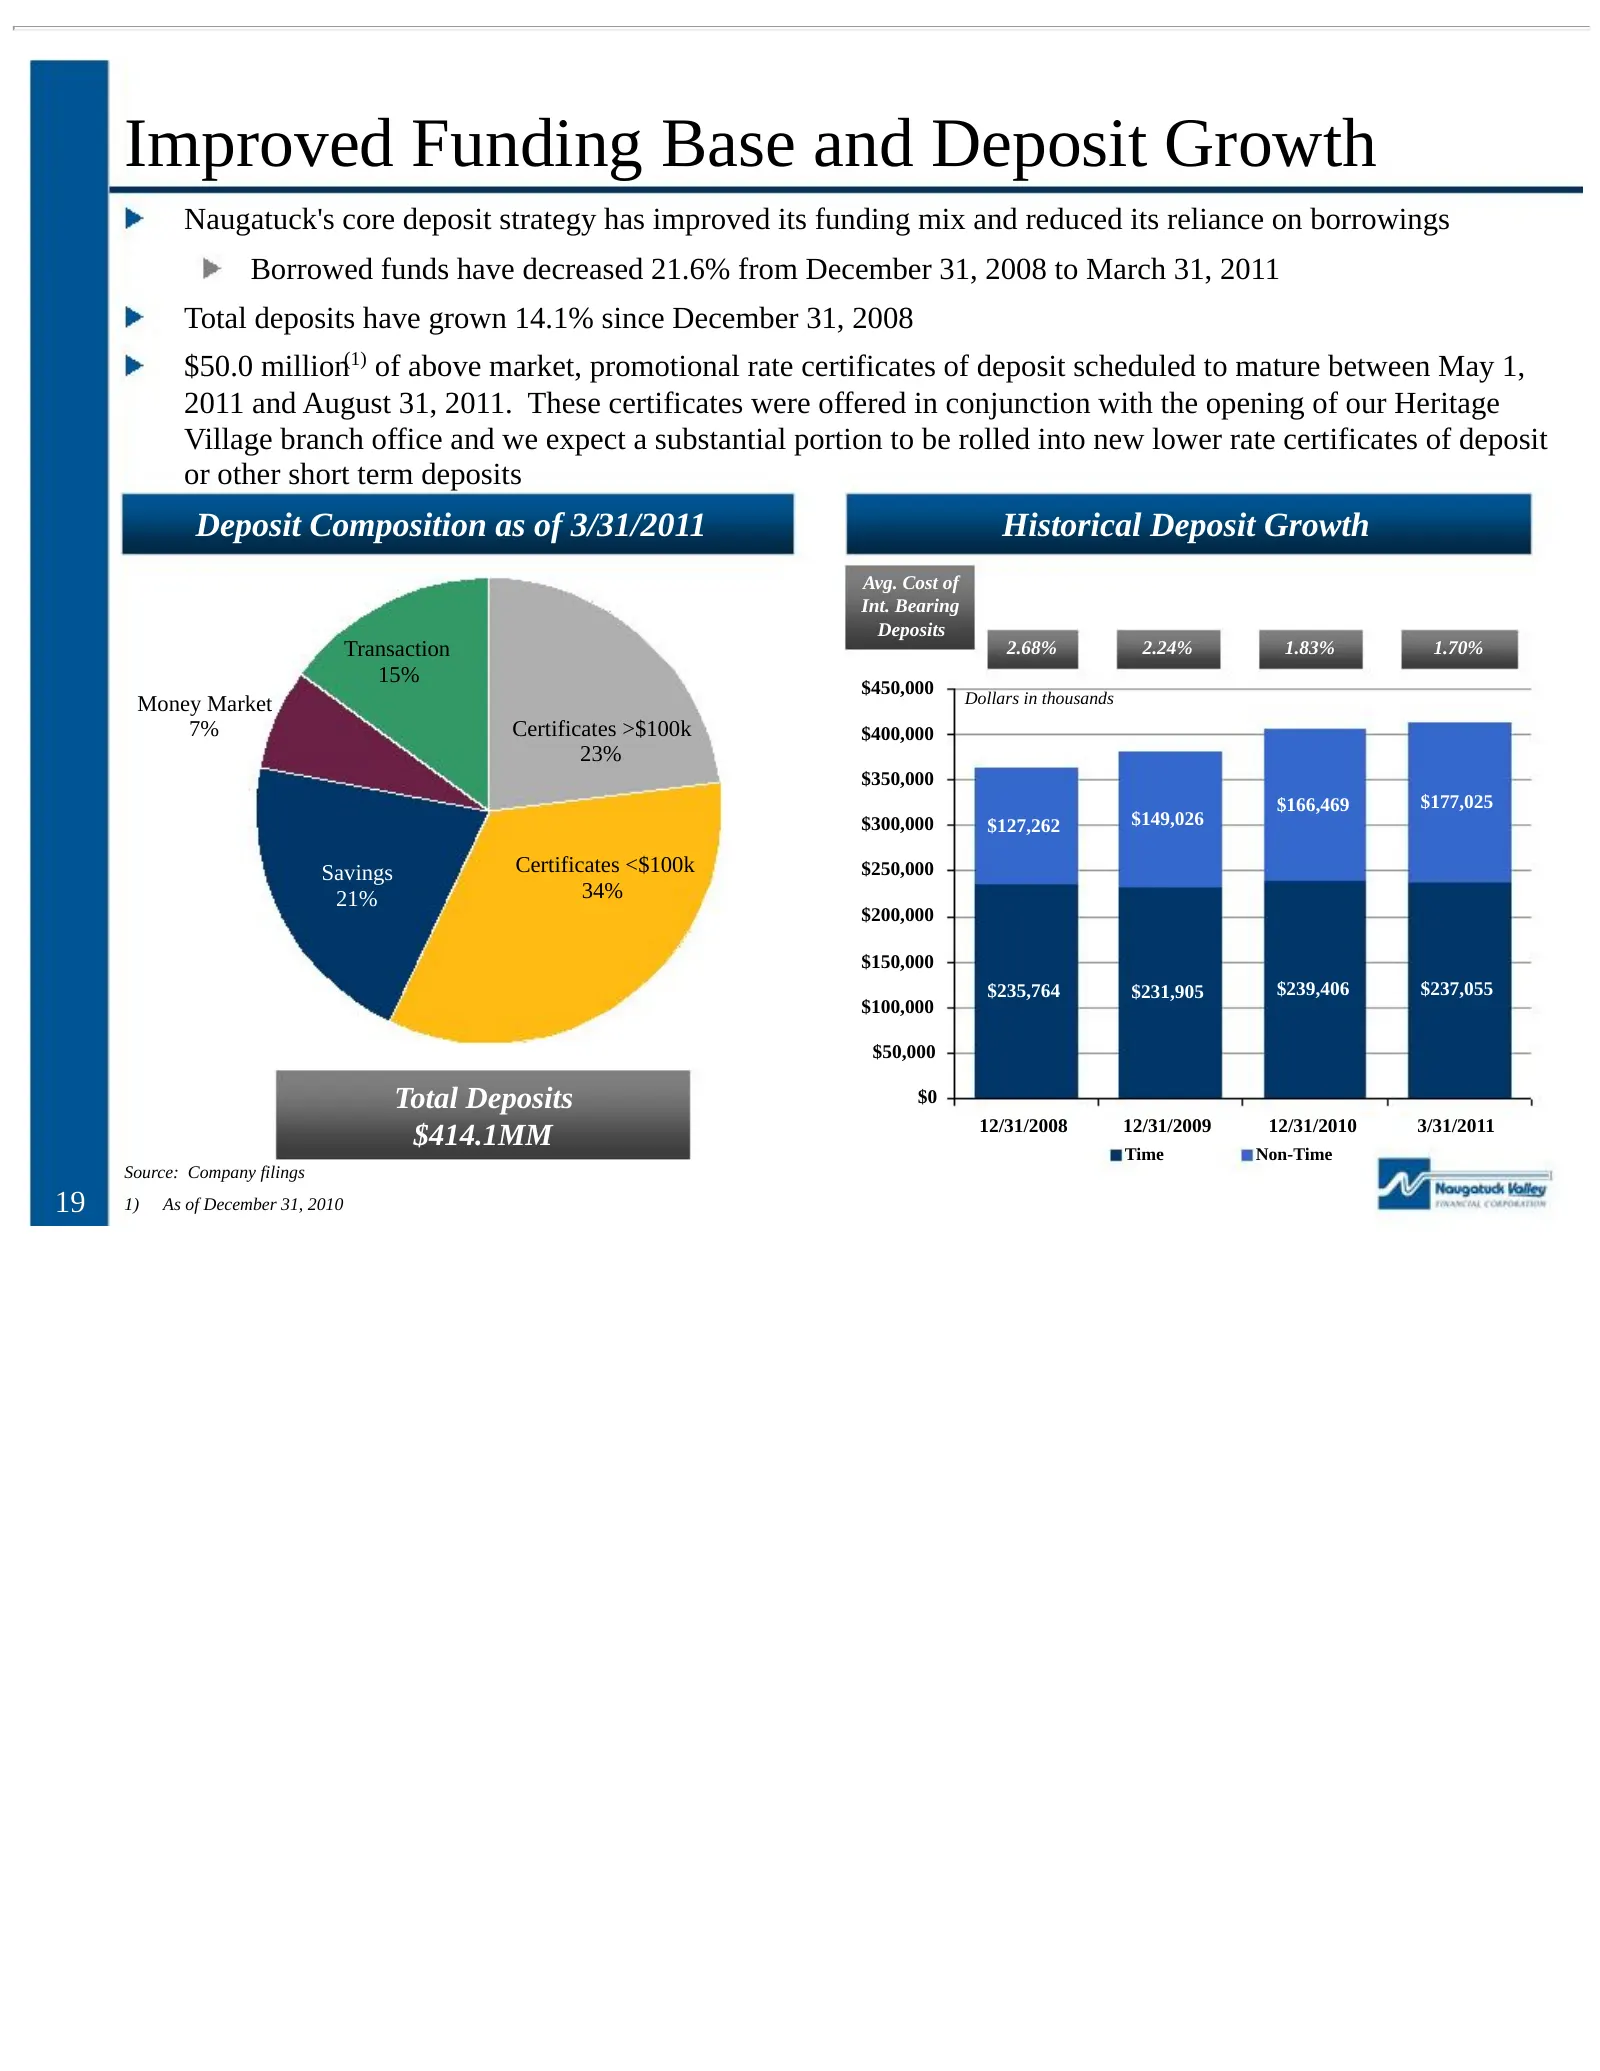
Improved Funding Base and Deposit Growth Naugatuck's core deposit strategy has improved its funding mix and reduced its reliance on borrowings Borrowed funds have decreased 21.6% from December 31, 2008 to March 31, 2011 Total deposits have grown 14.1% since December 31, 2008 $50.0 million(1) of abov
Slide 20: Investment Portfolio
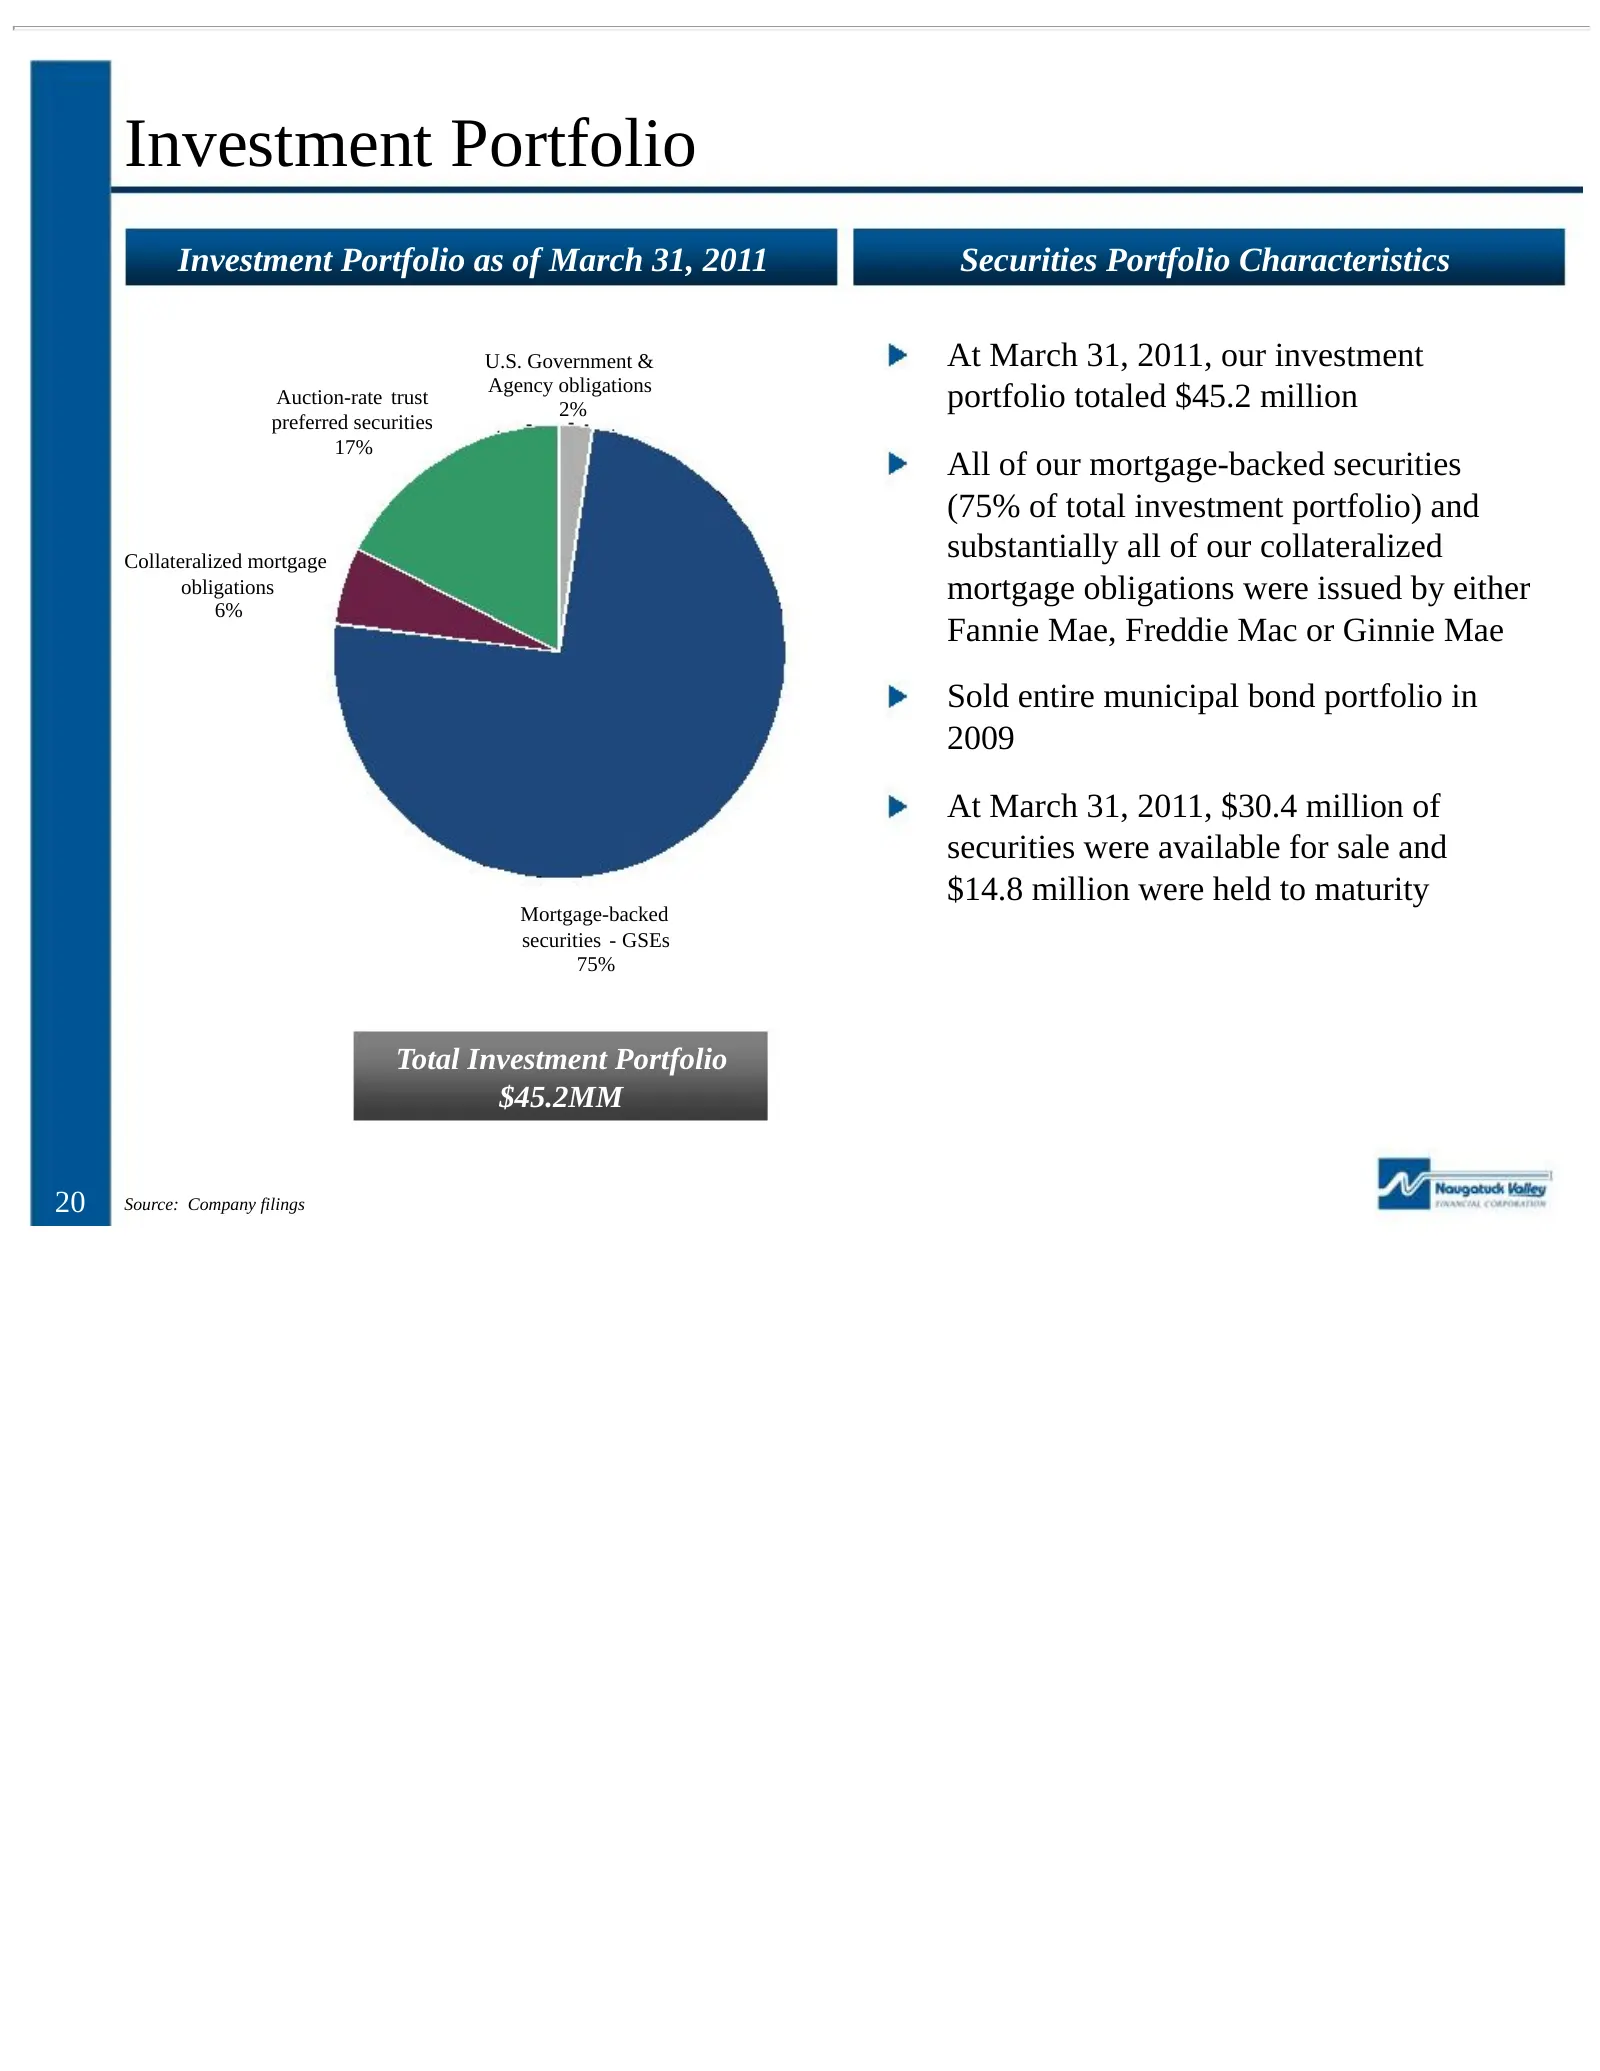
Investment Portfolio Investment Portfolio as of March 31, 2011 Securities Portfolio Characteristics U.S. Government & At March 31, 2011, our investment Agency obligations Auction-rate trust 2% portfolio totaled $45.2 million preferred securities 17% All of our mortgage-backed securities (75% of tota
Slide 21: Stable Earnings
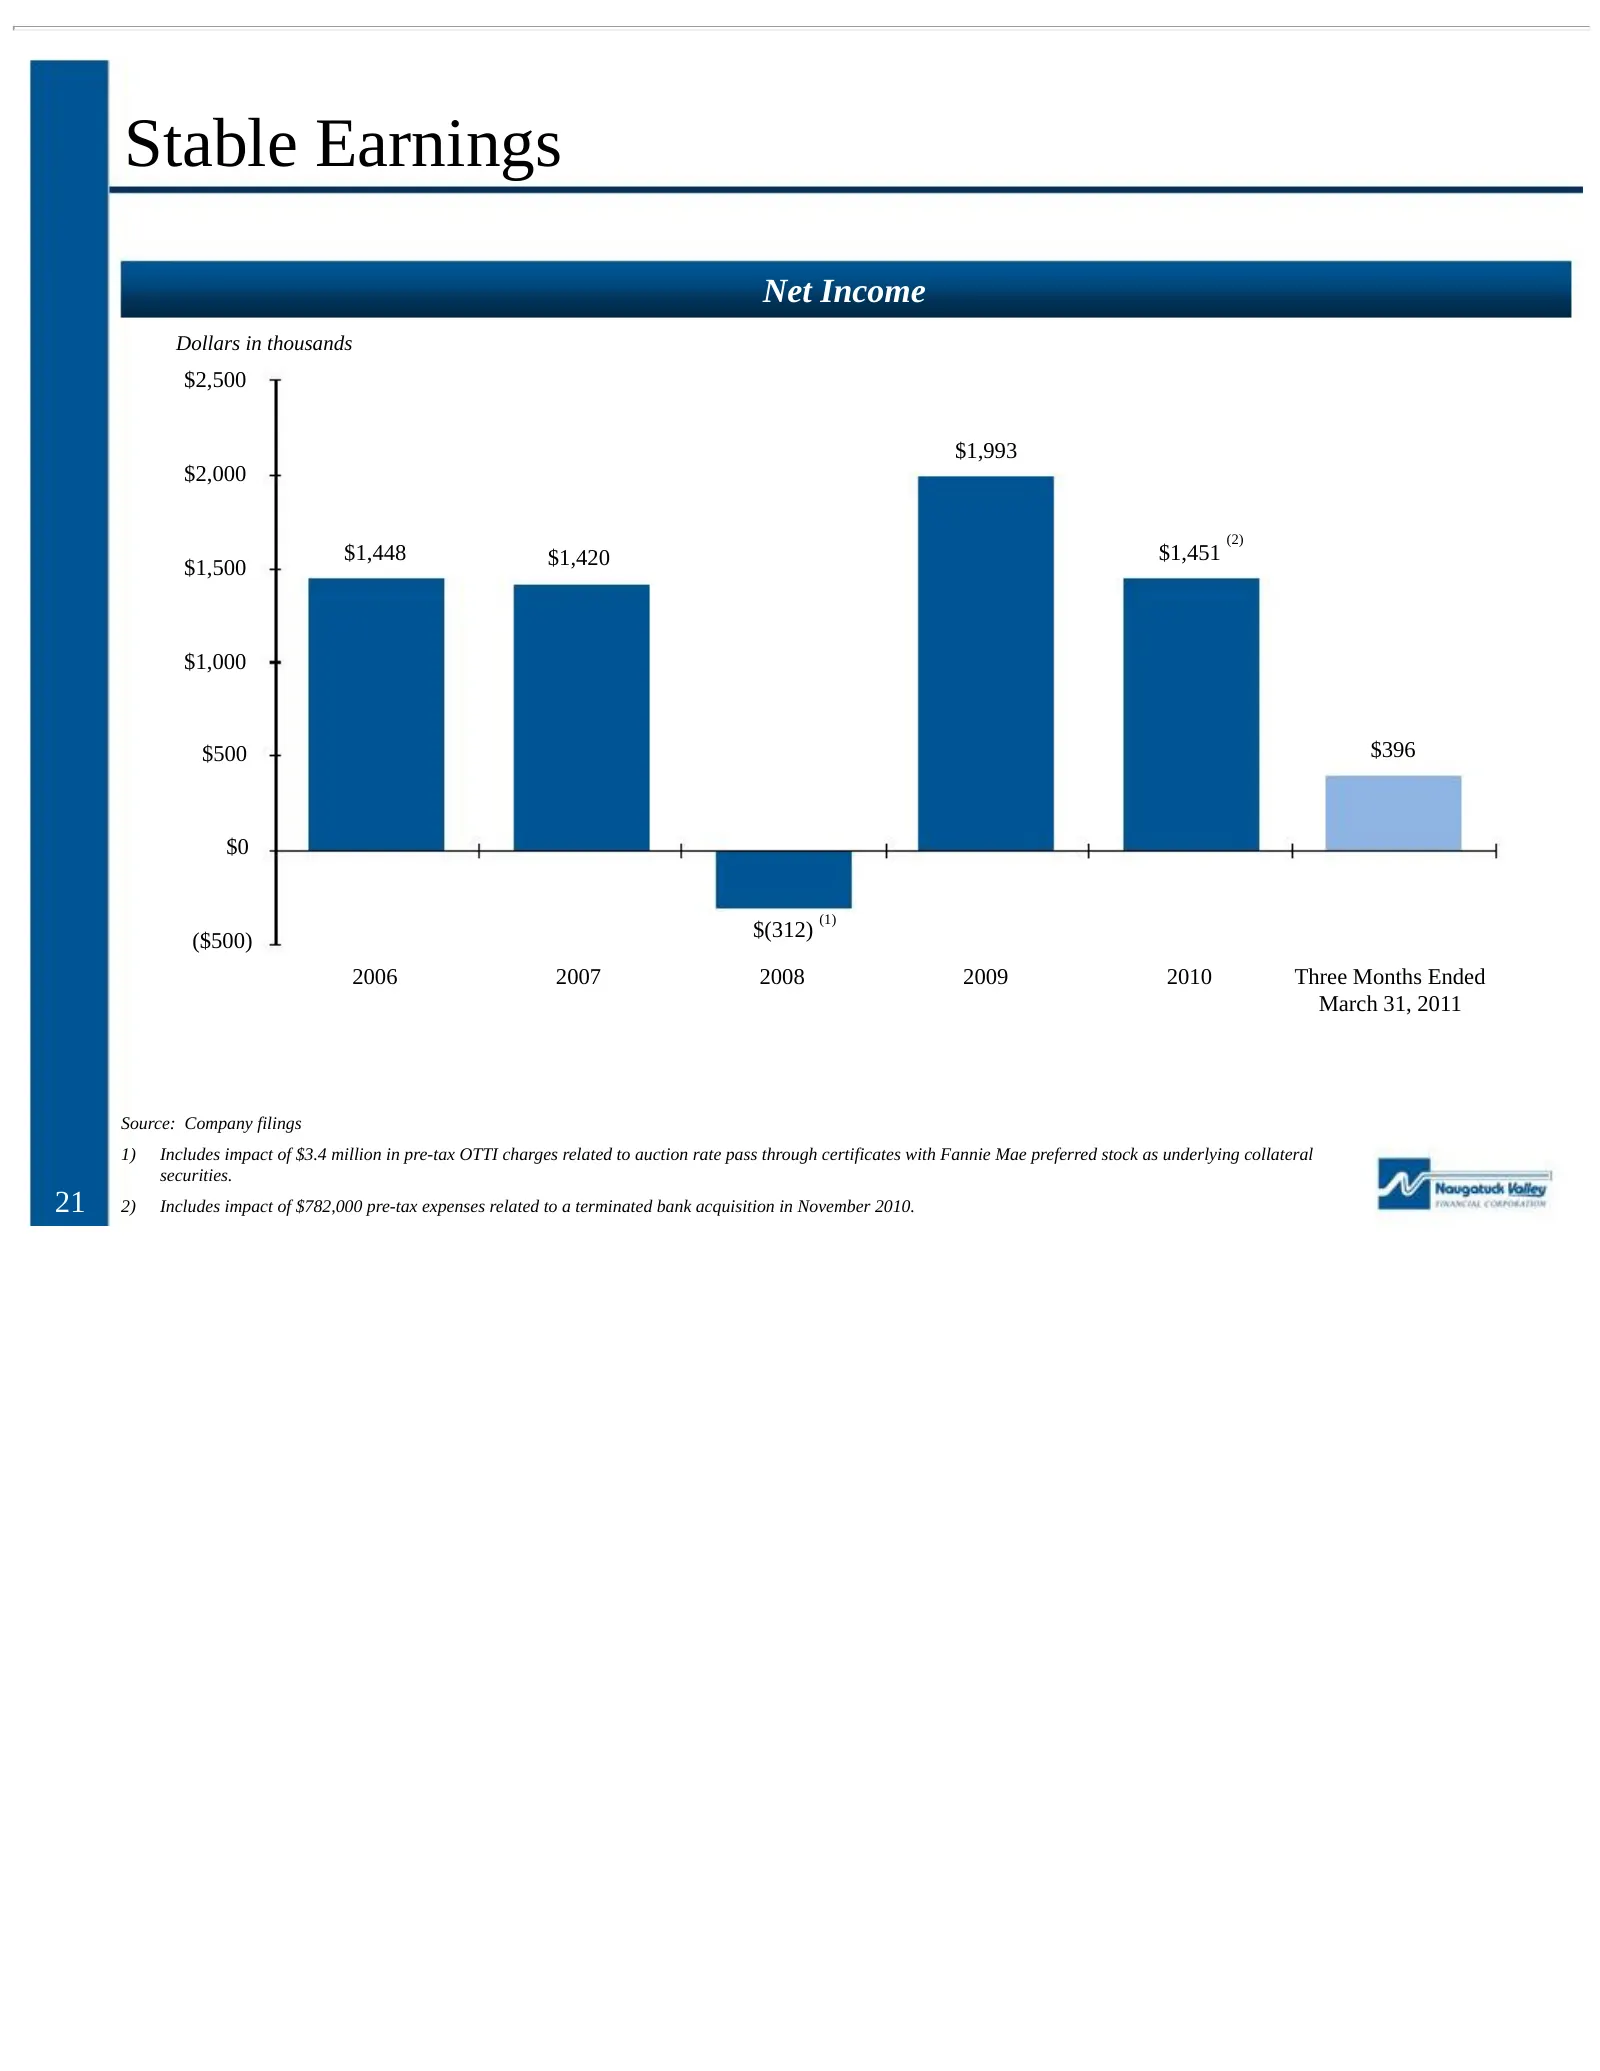
Stable Earnings Net Income Dollars in thousands $2,500 $1,993 $2,000 (2) $1,448 $1,420 $1,451 $1,500 $1,000 $500 $396 $0 (1) $(312) ($500) 2006 2007 2008 2009 2010 Three Months Ended March 31, 2011 Source: Company filings 1) Includes impact of $3.4 million in pre-tax OTTI charges related to auction
Slide 22: Offering Summary
VY, Naugatuck Valley FINANCIAL CORPORATION Offering Summary
Slide 23: Attractive Valuation
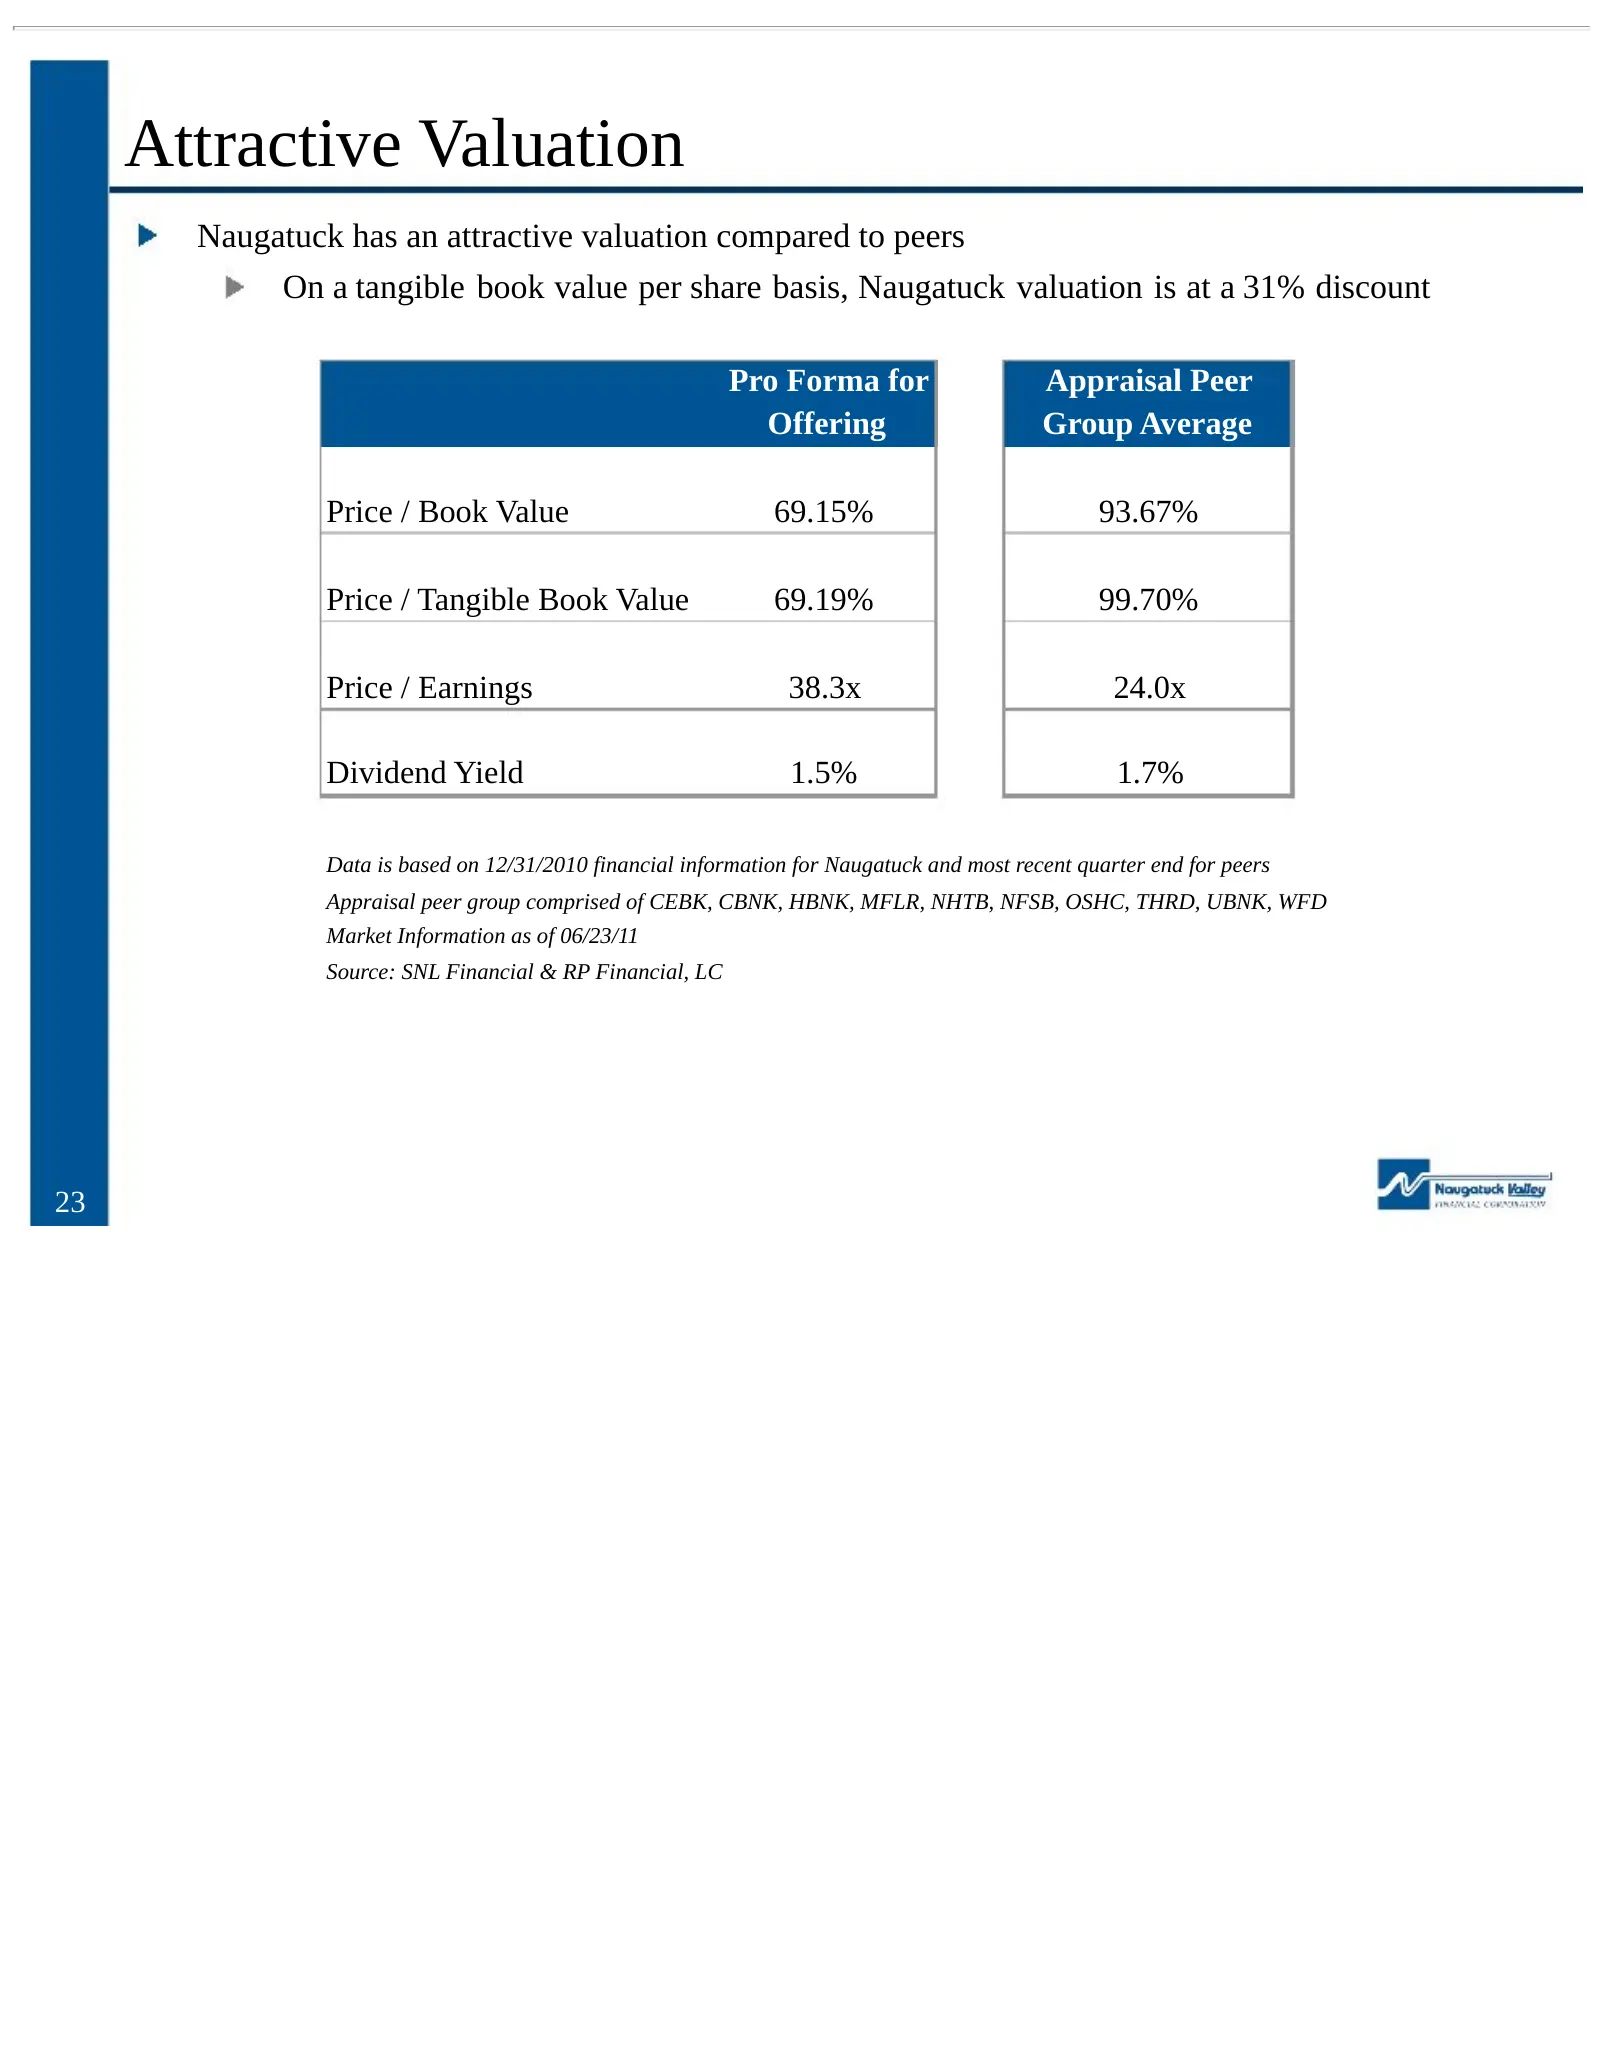
Attractive Valuation Naugatuck has an attractive valuation compared to peers On a tangible book value per share basis, Naugatuck valuation is at a 31% discount Pro Forma for Appraisal Peer Offering Group Average Price / Book Value 69.15% 93.67% Price / Tangible Book Value 69.19% 99.70% Price / Earni
Slide 24: Investment Merits
Investment Merits Community-oriented bank with experienced management team Attractive valuation with pro forma pricing at a discount to comparable peers Capital being raised provides Naugatuck additional strategic flexibility to: Capitalize on lending opportunities in the commercial and residential
Slide 25: 2nd Step Conversion and Offering June 2011
nd 2 Step Conversion and Offering June 2011
Source: SEC EDGAR · FWP filed Jun 28, 2011