Santander Holdings USA Inc · NYSE:SNUS/PH
Santander Holdings USA — Debt Investor Presentation (March 2023)
39 slides from Santander Holdings USA's debt investor presentation, Mar 3, 2023
Slide 1: Santander Holdings USA, Inc. Fourth Quarter and Full Year 2022 Fixed Income Investor Presentation
March 3, 2023 SANTANDER HOLDINGS USA, INC. Fourth Quarter and Full Year 2022 Fixed Income Investor Presentation 1
Slide 2: Important Information
Important Information This presentation of Santander Holdings USA, Inc. (“SHUSA”) contains “forward-looking statements” within the meaning of the Private Securities Litigation Reform Act of 1995 regarding the financial condition, results of operations, business plans and future performance of SHUSA.
Slide 3: Index
Index 1 2 3 4 5 At a Glance Results Capital & Santander Appendix Liquidity Investor Day 3
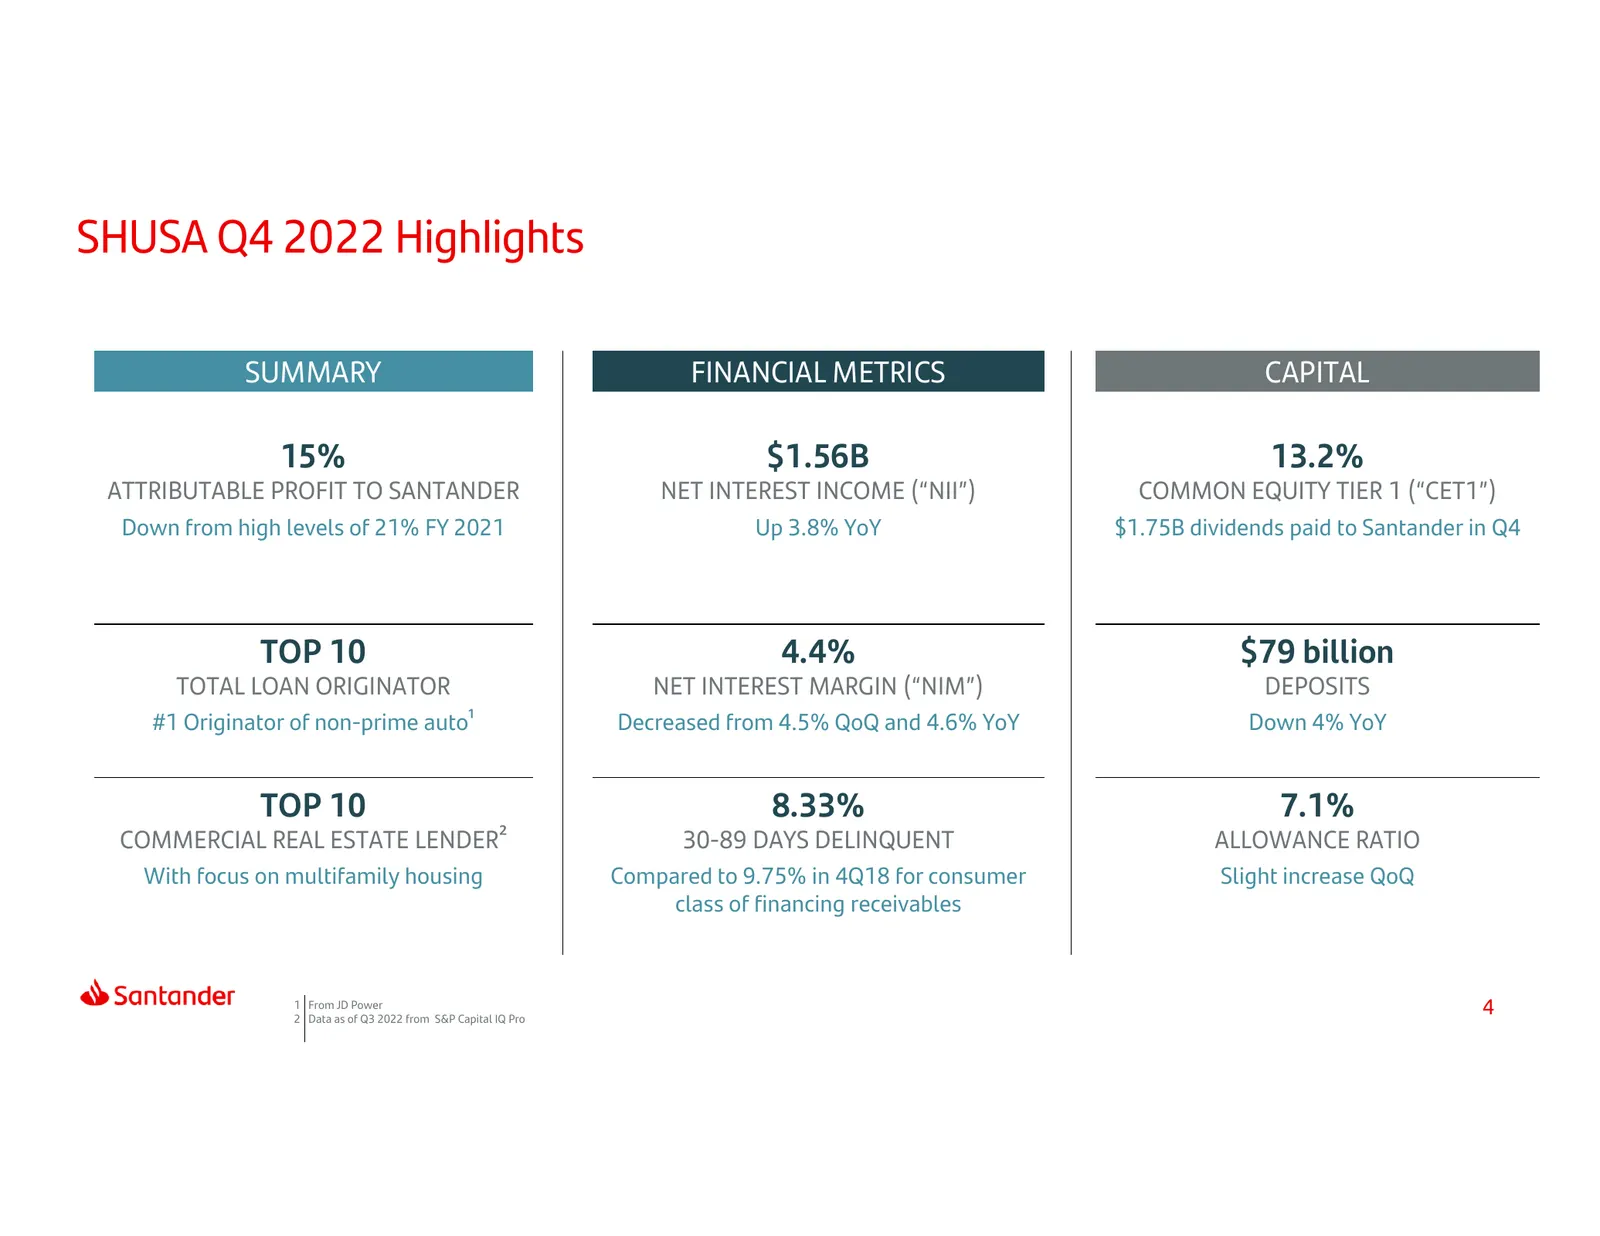
Slide 4: SHUSA Q4 2022 Highlights
SHUSA Q4 2022 Highlights SUMMARY FINANCIAL METRICS CAPITAL 15% $1.56B 13.2% ATTRIBUTABLE PROFIT TO SANTANDER NET INTEREST INCOME (“NII”) COMMON EQUITY TIER 1 (“CET1”) Down from high levels of 21% FY 2021 Up 3.8% YoY $1.75B dividends paid to Santander in Q4 TOP 10 4.4% $79 billion TOTAL LOAN ORIGINAT
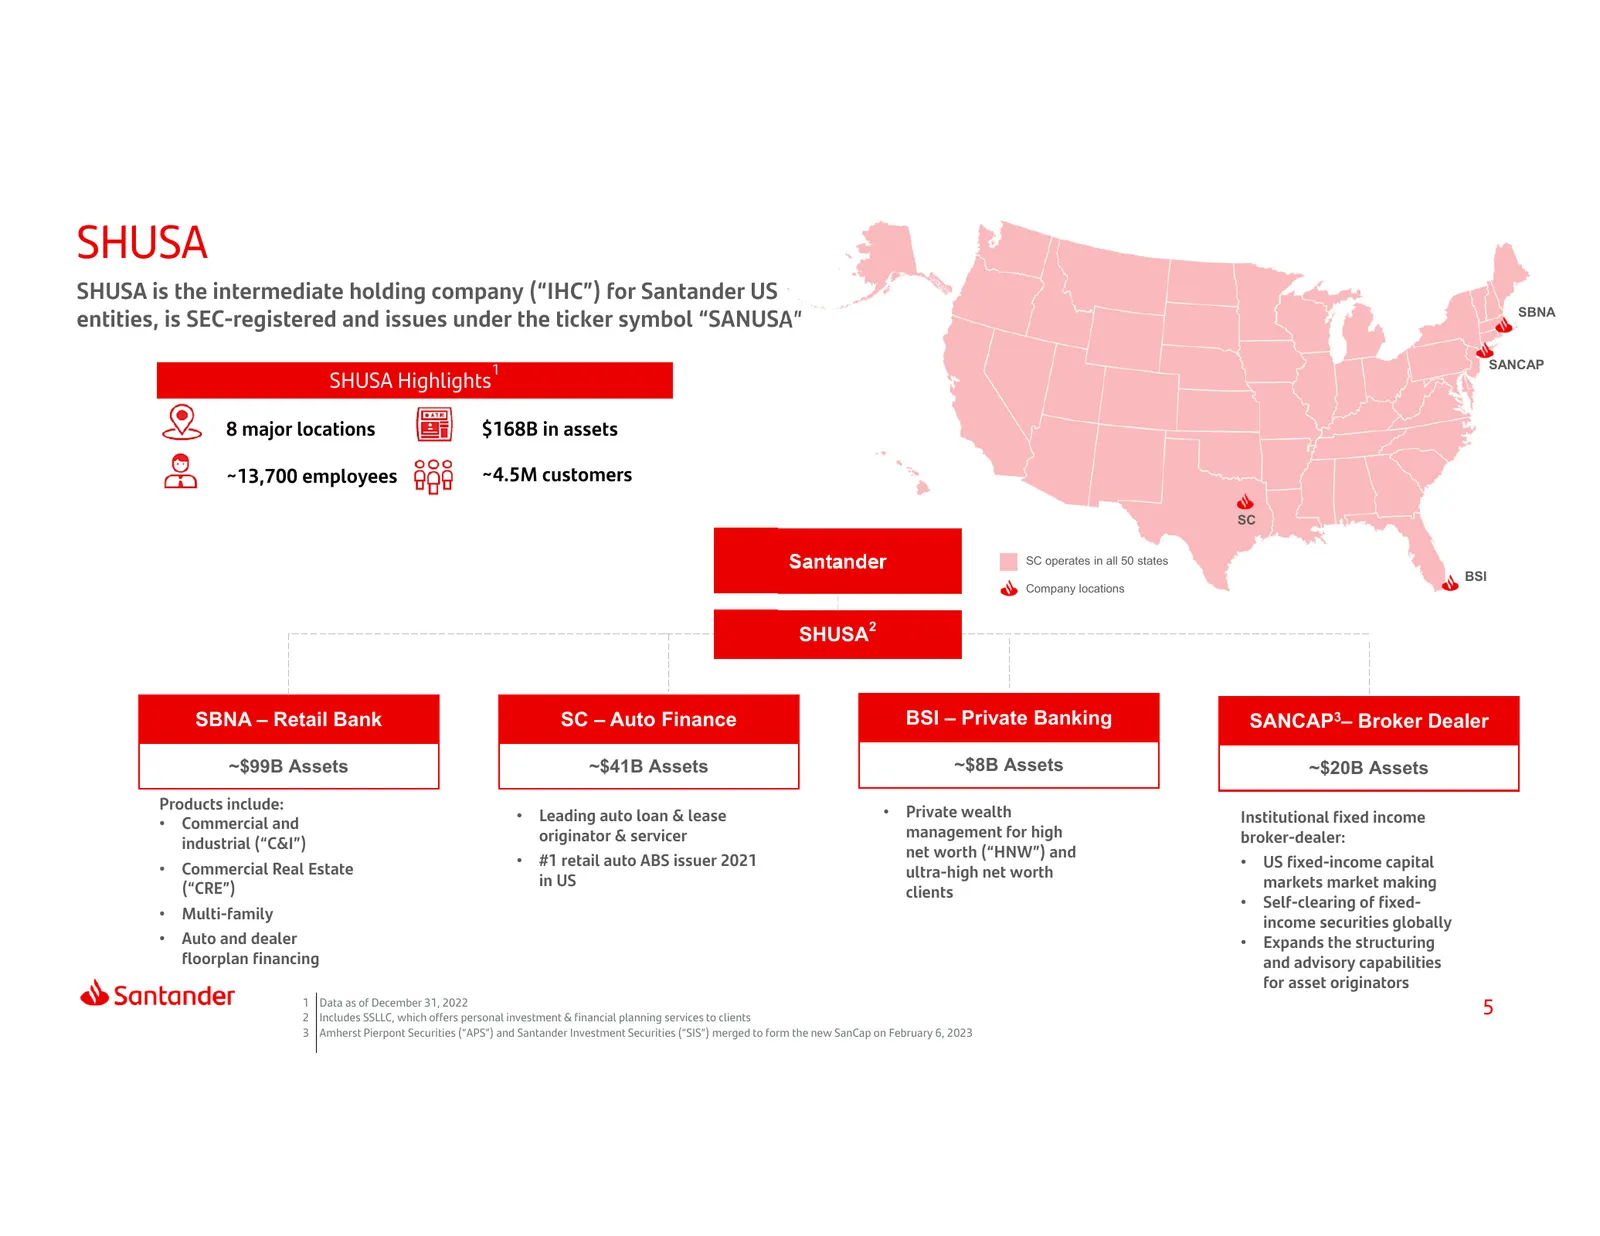
Slide 5: SHUSA
SHUSA SHUSA is the intermediate holding company (“IHC”) for Santander US SBNA entities, is SEC-registered and issues under the ticker symbol “SANUSA” 1 SANCAP SHUSA Highlights 8 major locations $168B in assets ~13,700 employees ~4.5M customers SC Santander SC operates in all 50 states BSI Company lo
Slide 6: Index
Index 1 2 3 4 5 At a Glance Results Capital & Santander Appendix Liquidity Investor Day 6
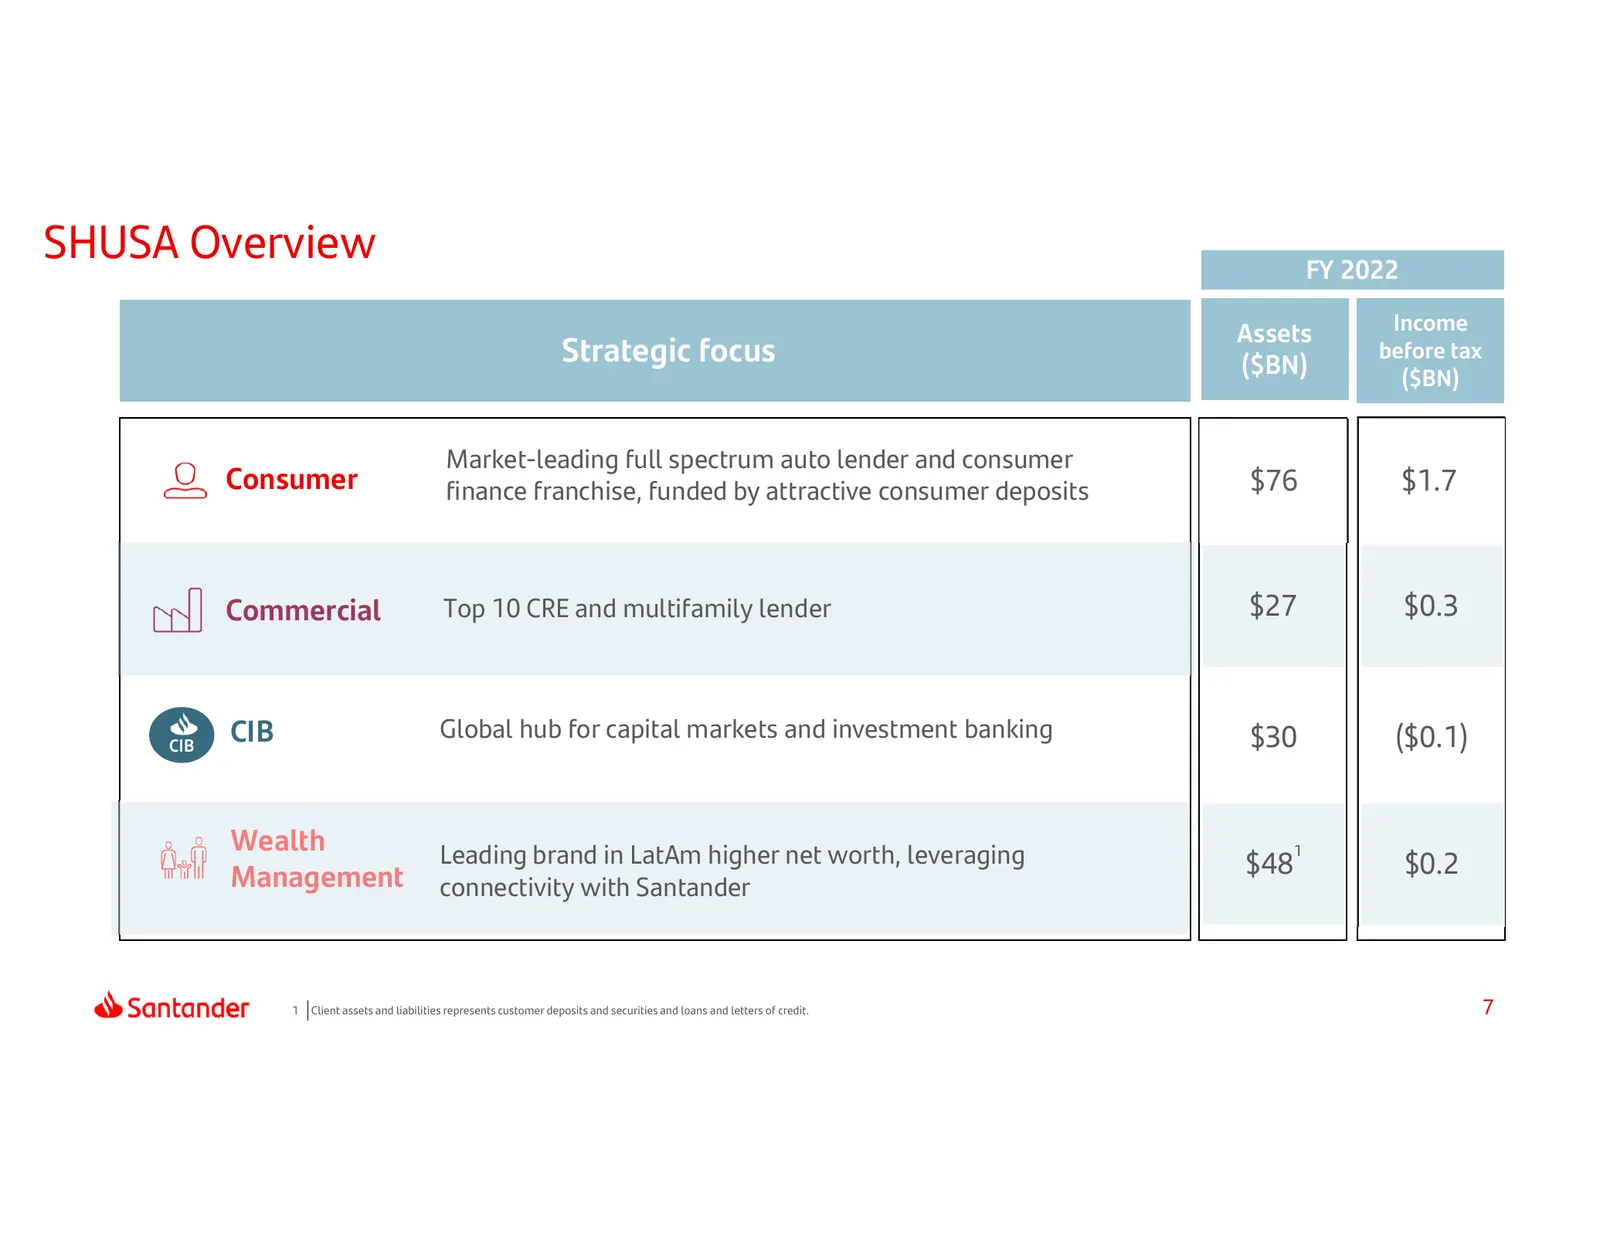
Slide 7: SHUSA Overview FY 2022
SHUSA Overview FY 2022 Assets Income Strategic focus ($BN) before tax ($BN) Strategic focus Market-leading full spectrum auto lender and consumer Consumer finance franchise, funded by attractive consumer deposits $76 $1.7 Commercial Top 10 CRE and multifamily lender $27 $0.3 CIB Global hub for capit
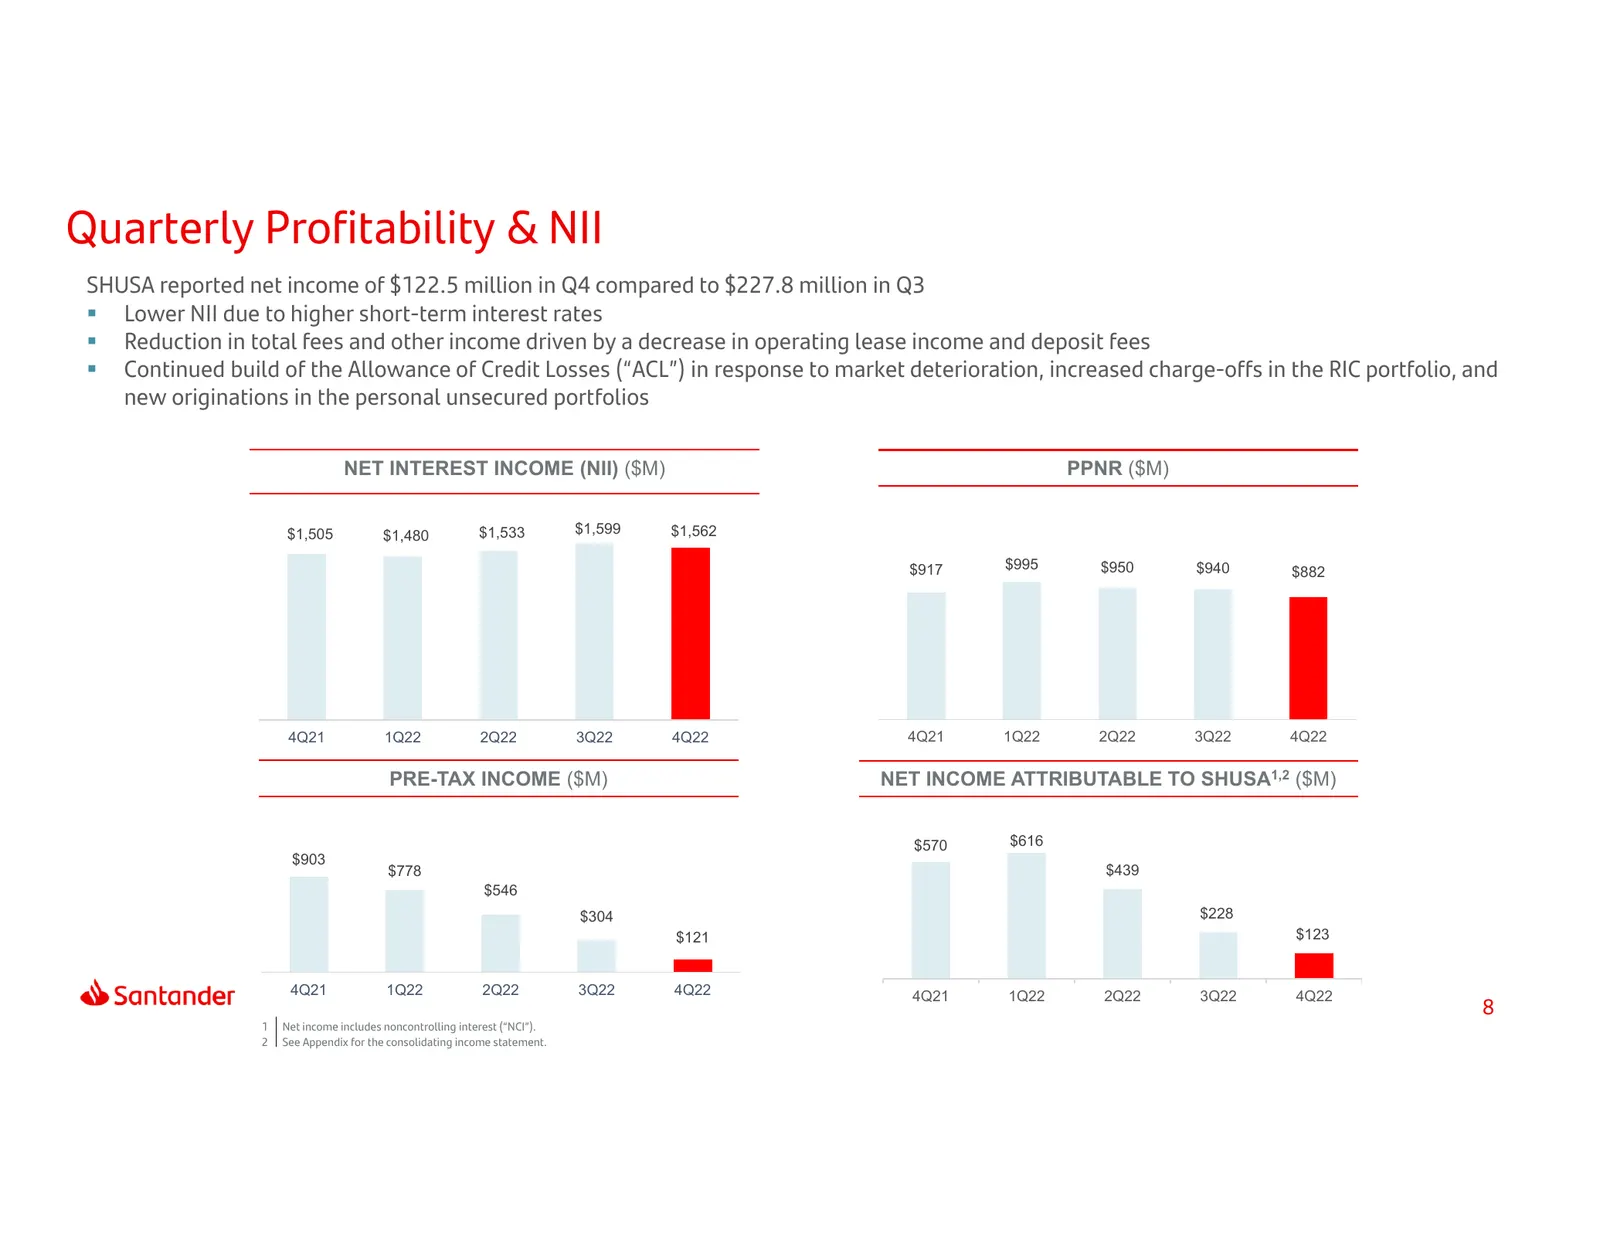
Slide 8: Quarterly Profitability & NII
Quarterly Profitability & NII SHUSA reported net income of $122.5 million in Q4 compared to $227.8 million in Q3 Lower NII due to higher short-term interest rates Reduction in total fees and other income driven by a decrease in operating lease income and deposit fees Continued build of the All
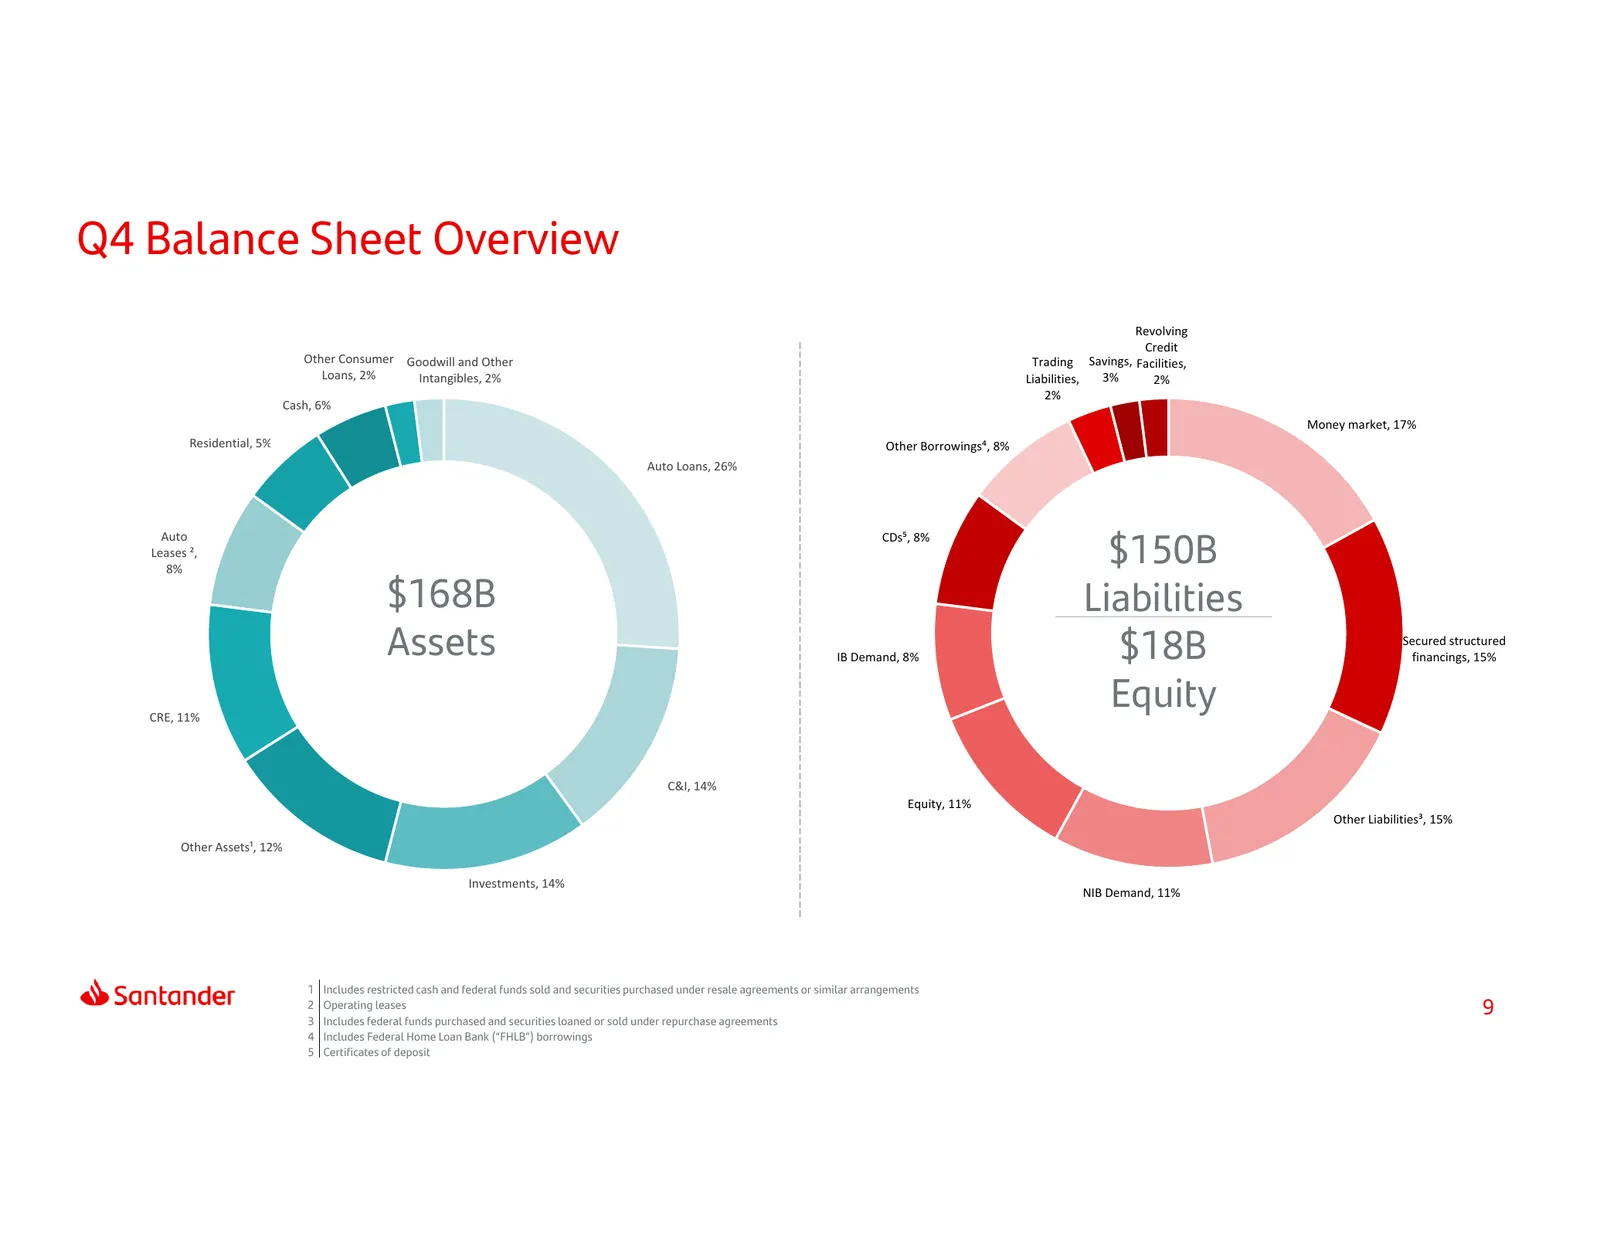
Slide 9: Q4 Balance Sheet Overview
Q4 Balance Sheet Overview Revolving Credit Other Consumer Goodwill and Other Trading Savings, Facilities, Loans, 2% Intangibles, 2% Liabilities, 3% 2% 2% Cash, 6% Money market, 17% Residential, 5% Other Borrowings⁴, 8% Auto Loans, 26% Auto CDs⁵, 8% Leases ², 8% $150B $168B Liabilities Assets IB Dema
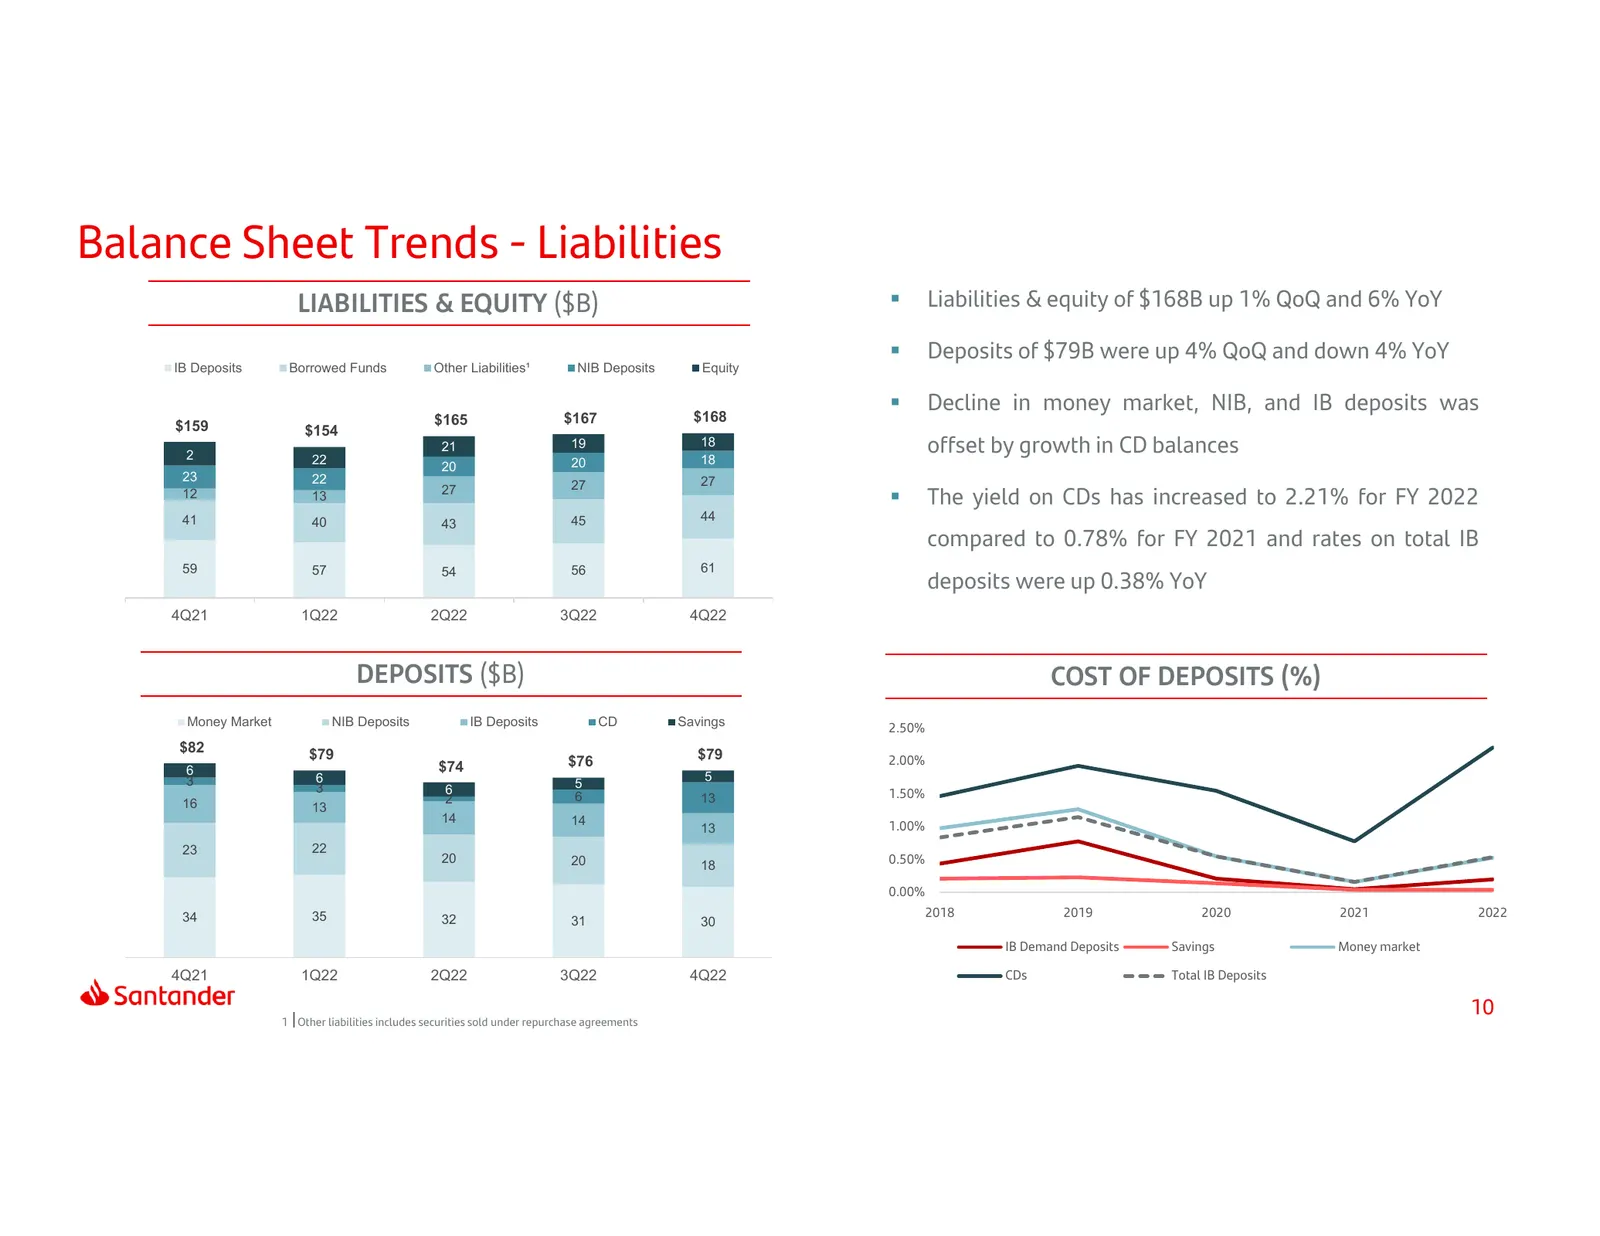
Slide 10: Balance Sheet Trends - Liabilities
Balance Sheet Trends - Liabilities LIABILITIES & EQUITY ($B) Liabilities & equity of $168B up 1% QoQ and 6% YoY Deposits of $79B were up 4% QoQ and down 4% YoY IB Deposits Borrowed Funds Other Liabilities¹ NIB Deposits Equity $168 Decline in money market, NIB, and IB deposits was $165 $167 $15
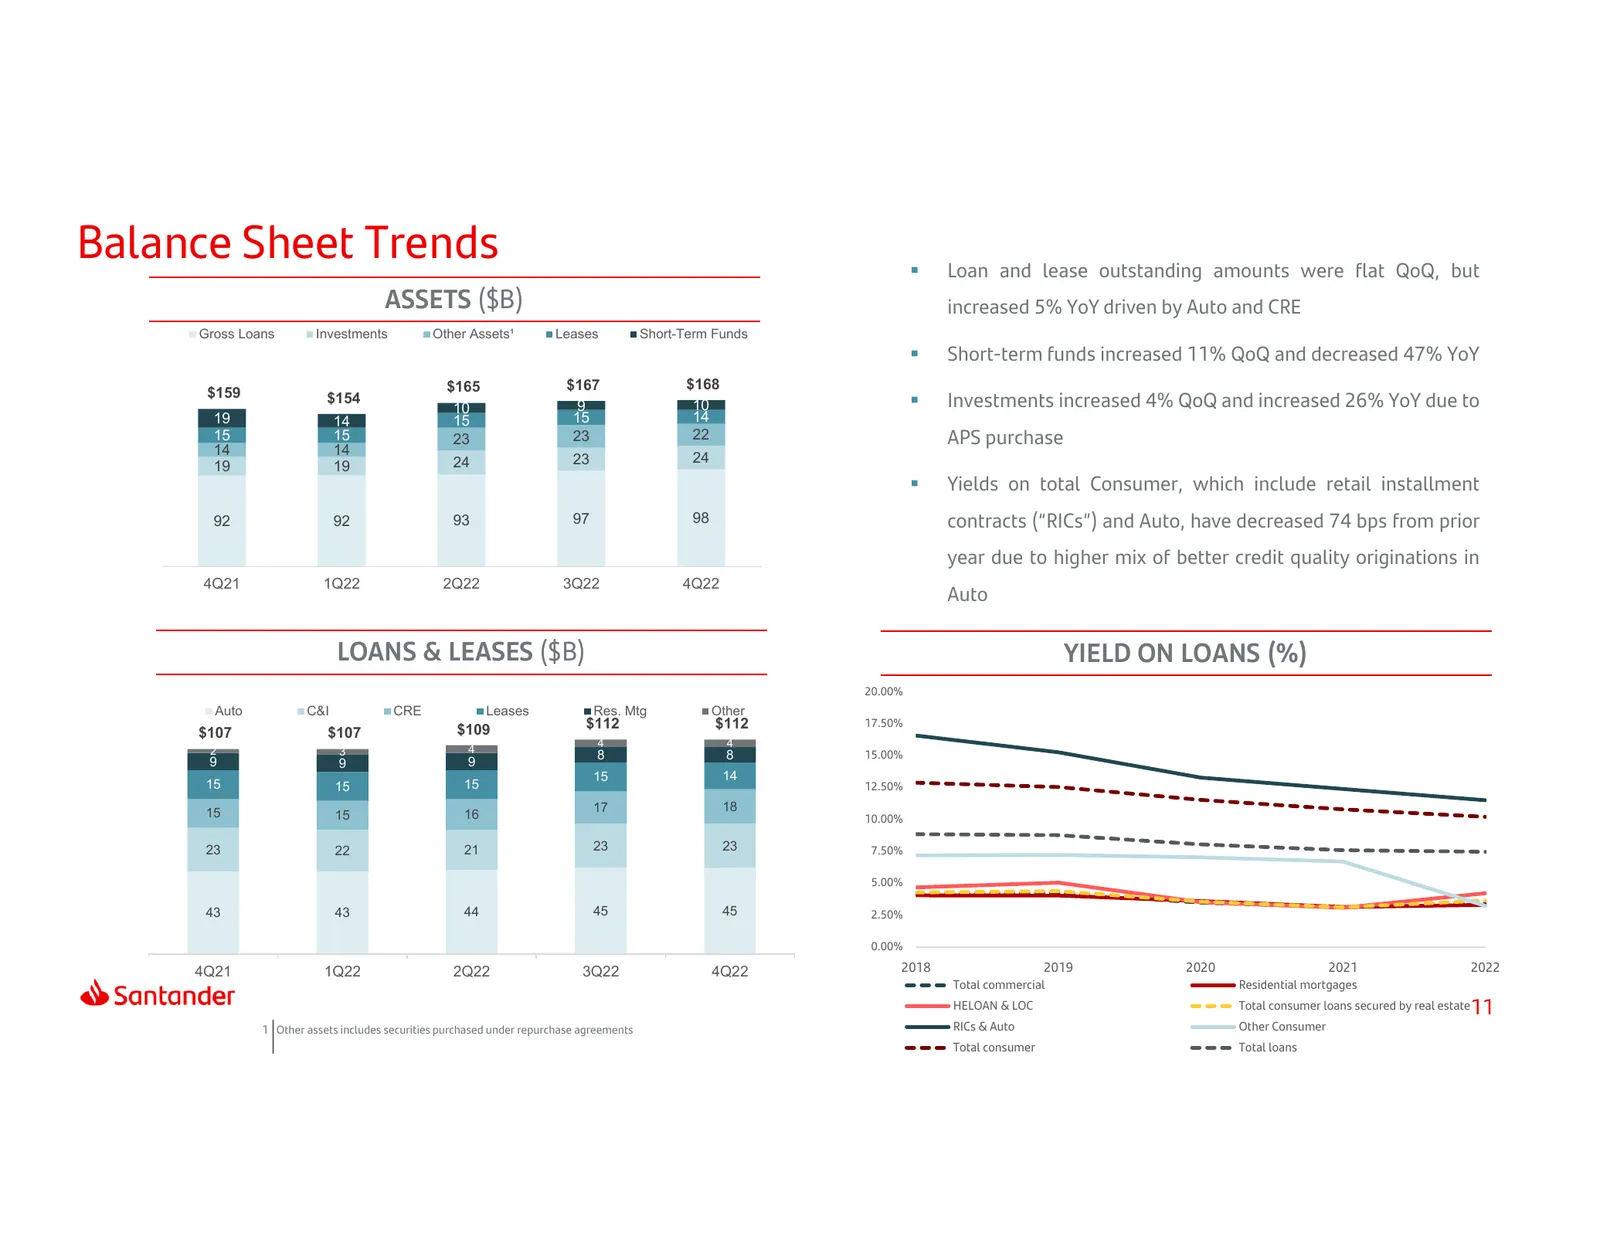
Slide 11: Balance Sheet Trends
Balance Sheet Trends Loan and lease outstanding amounts were flat QoQ, but ASSETS ($B) increased 5% YoY driven by Auto and CRE Gross Loans Investments Other Assets¹ Leases Short-Term Funds Short-term funds increased 11% QoQ and decreased 47% YoY $165 $167 $168 $159 $154 10 9 10 Investments inc
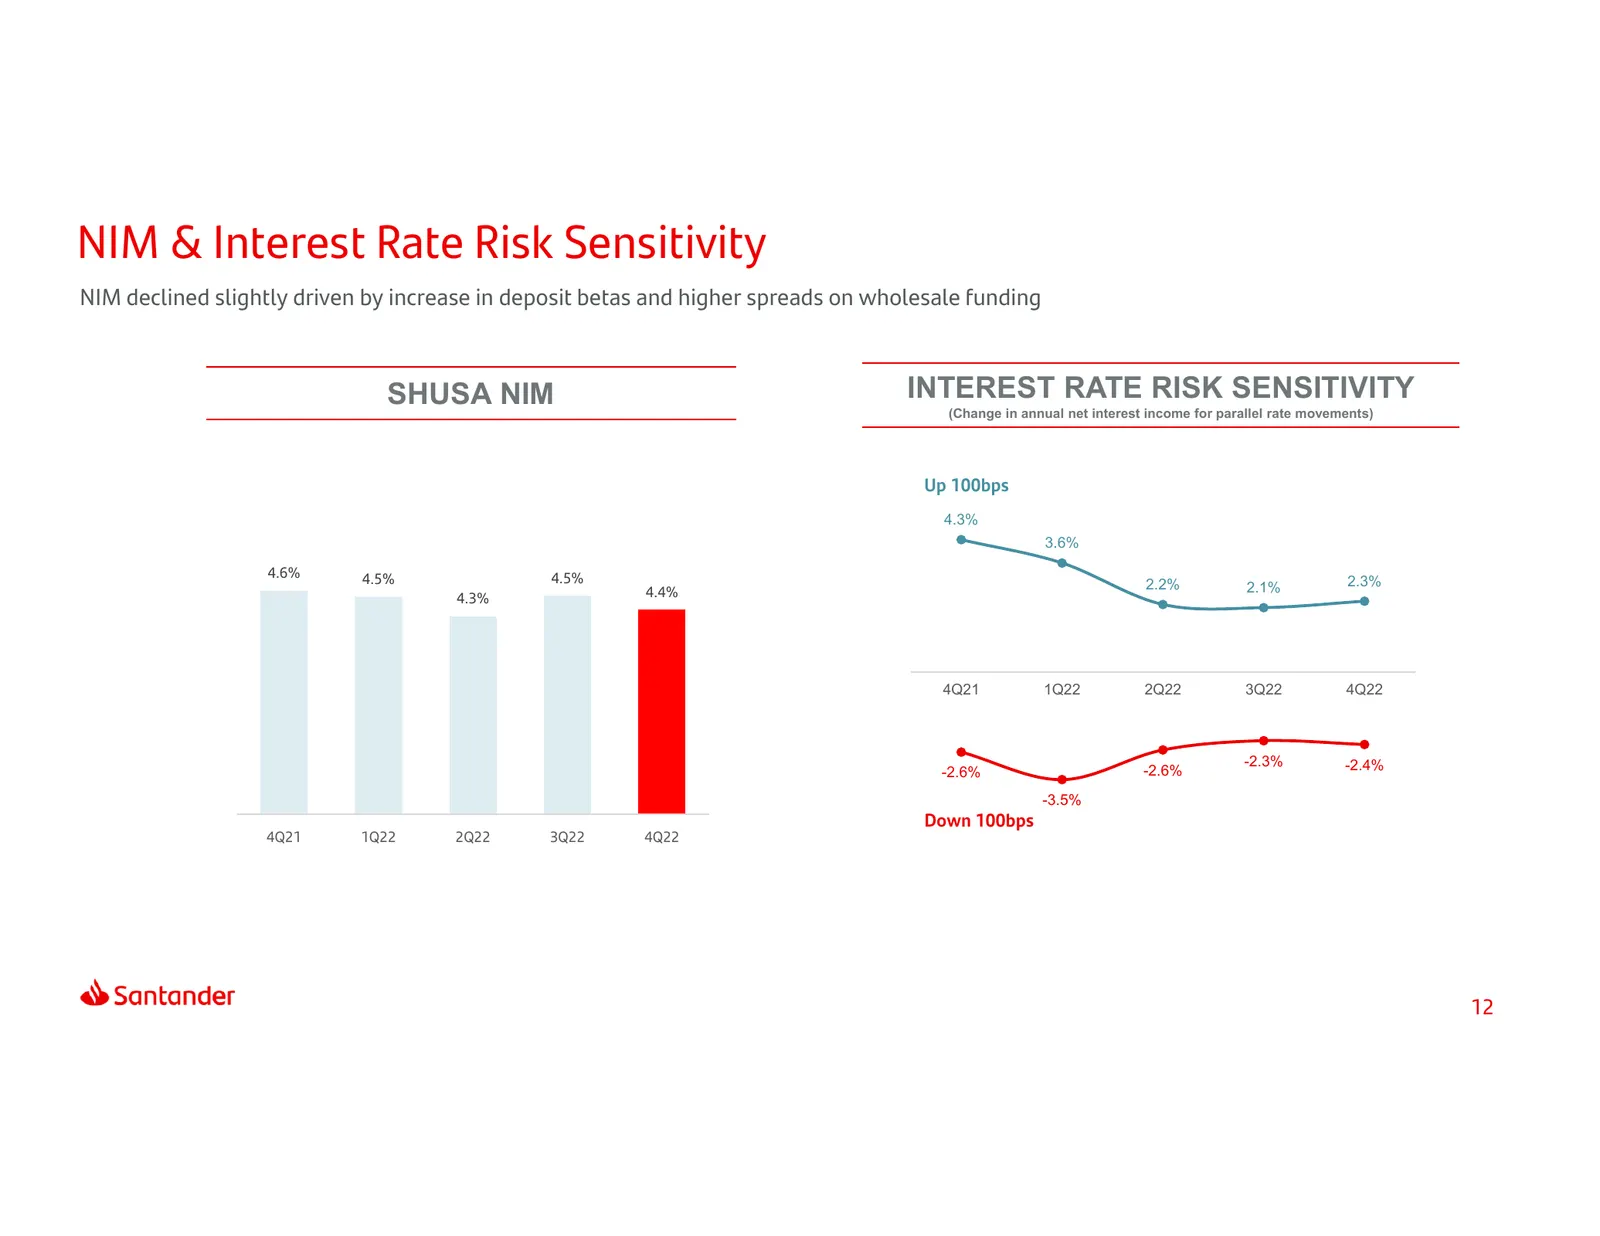
Slide 12: NIM & Interest Rate Risk Sensitivity
NIM & Interest Rate Risk Sensitivity NIM declined slightly driven by increase in deposit betas and higher spreads on wholesale funding SHUSA NIM INTEREST RATE RISK SENSITIVITY (Change in annual net interest income for parallel rate movements) Up 100bps 4.3% 3.6% 4.6% 4.5% 4.5% 2.2% 2.1% 2.3% 4.3% 4.
Slide 13: Auto Originations
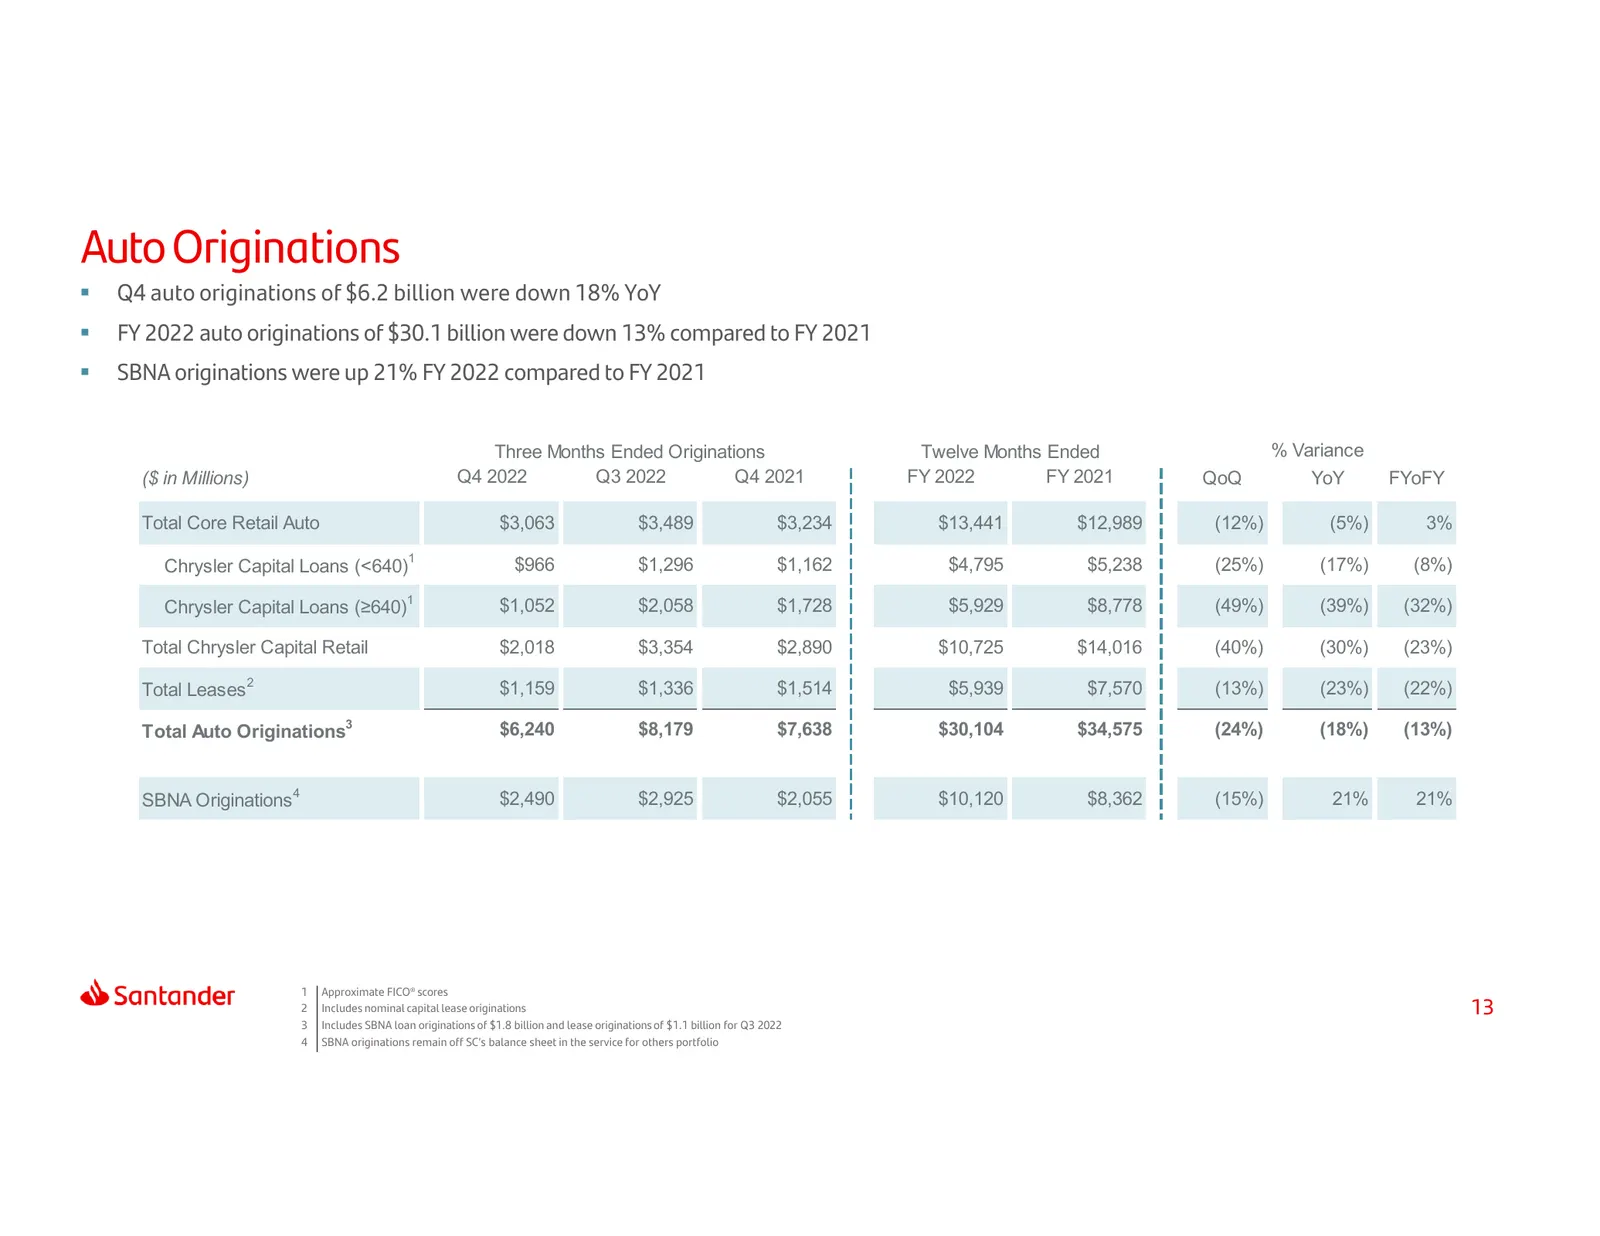
Auto Originations Q4 auto originations of $6.2 billion were down 18% YoY FY 2022 auto originations of $30.1 billion were down 13% compared to FY 2021 SBNA originations were up 21% FY 2022 compared to FY 2021 Three Months Ended Originations Twelve Months Ended % Variance ($ in Millions) Q4 2022
Slide 14: Auto Delinquency and Portfolio
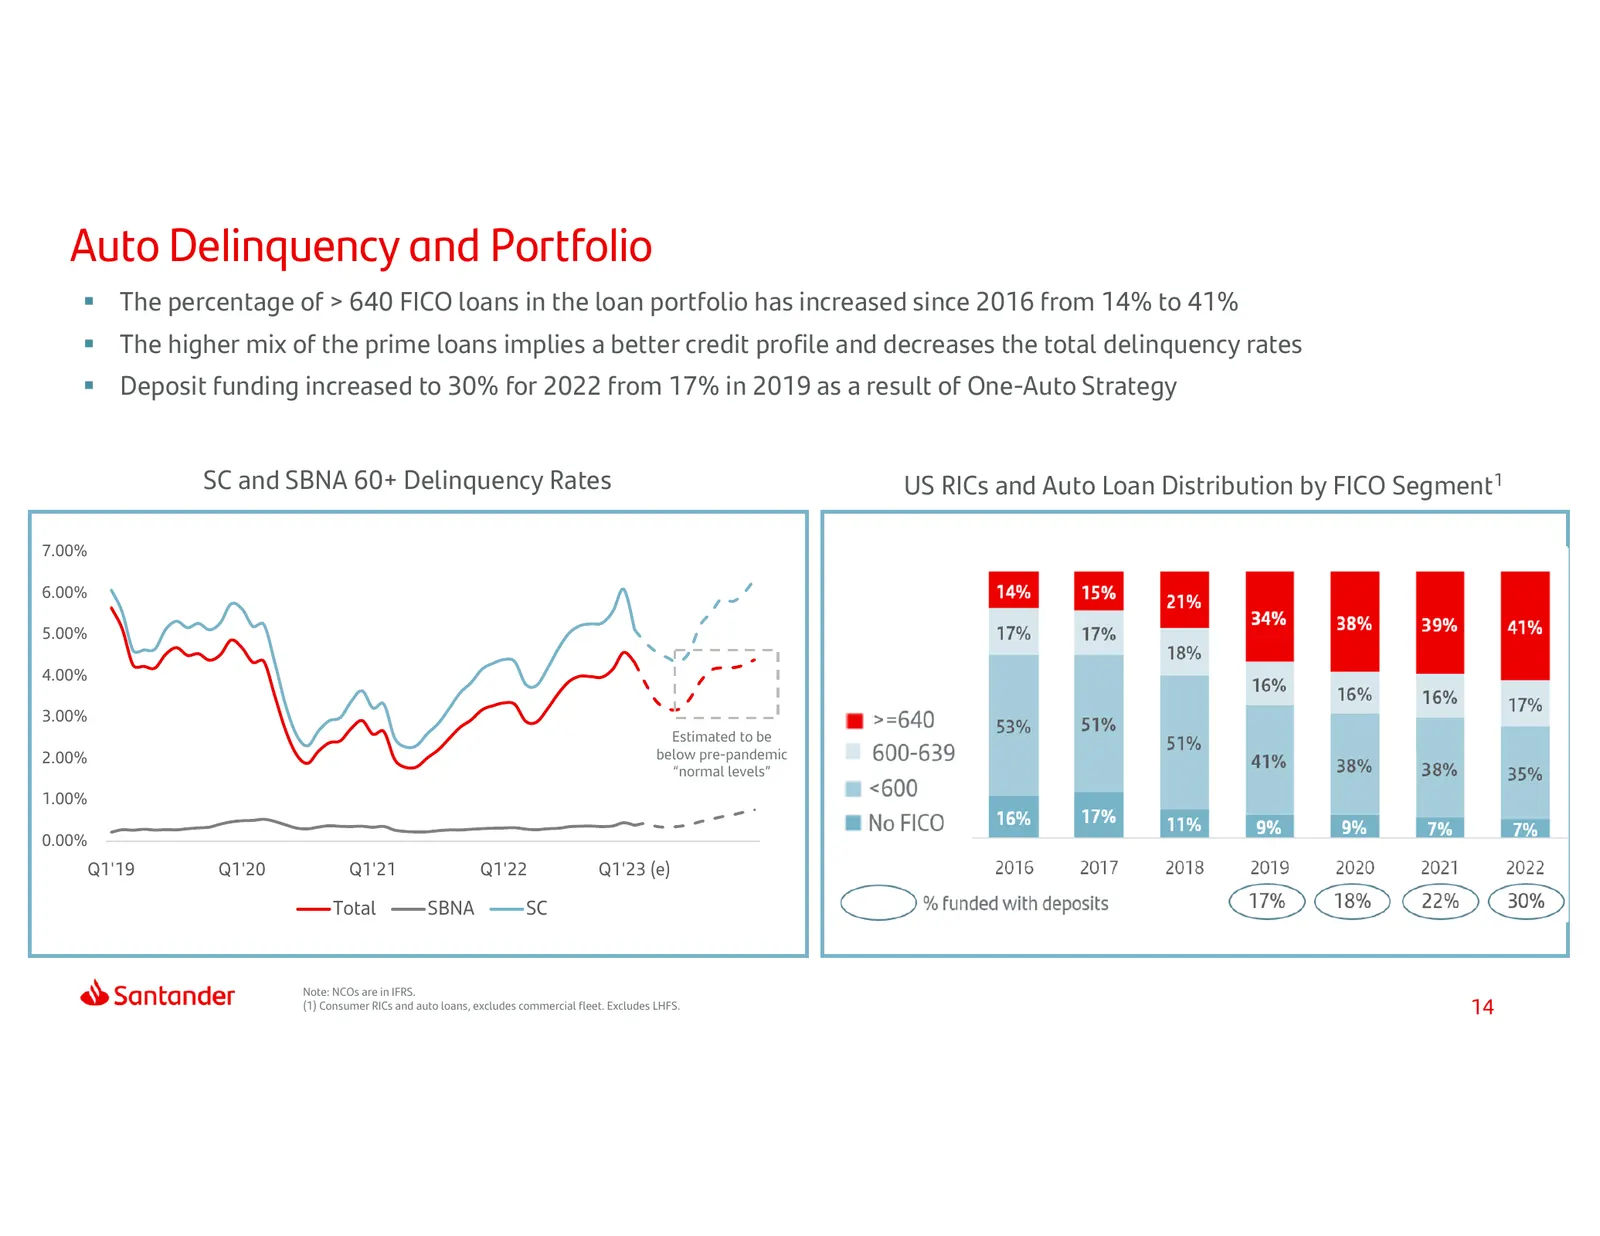
Auto Delinquency and Portfolio The percentage of > 640 FICO loans in the loan portfolio has increased since 2016 from 14% to 41% The higher mix of the prime loans implies a better credit profile and decreases the total delinquency rates Deposit funding increased to 30% for 2022 from 17% in 201
Slide 15: Consumer and Commercial Loan Delinquency
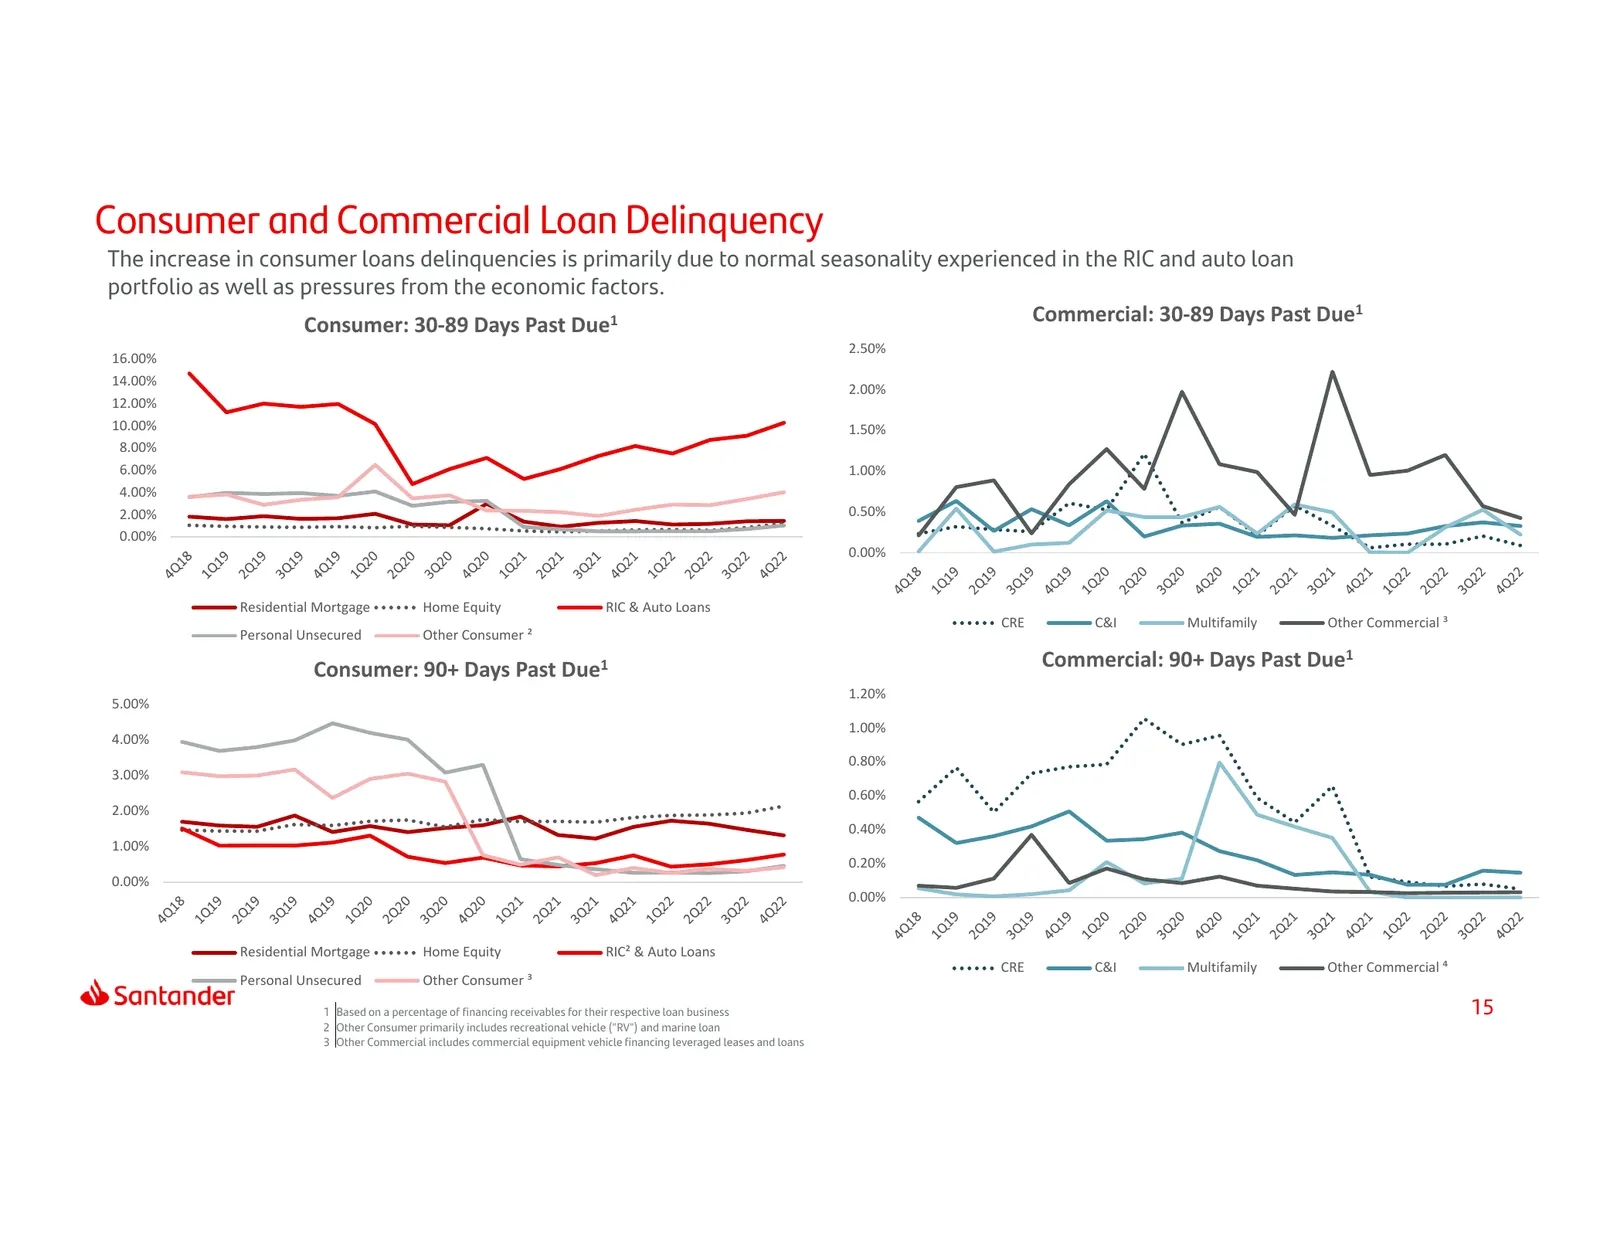
Consumer and Commercial Loan Delinquency The increase in consumer loans delinquencies is primarily due to normal seasonality experienced in the RIC and auto loan portfolio as well as pressures from the economic factors. Consumer: 30‐89 Days Past Due1 Commercial: 30‐89 Days Past Due1 2.50% 16.00% 14.
Slide 16: Charge-offs and Recoveries by Portfolio Segment
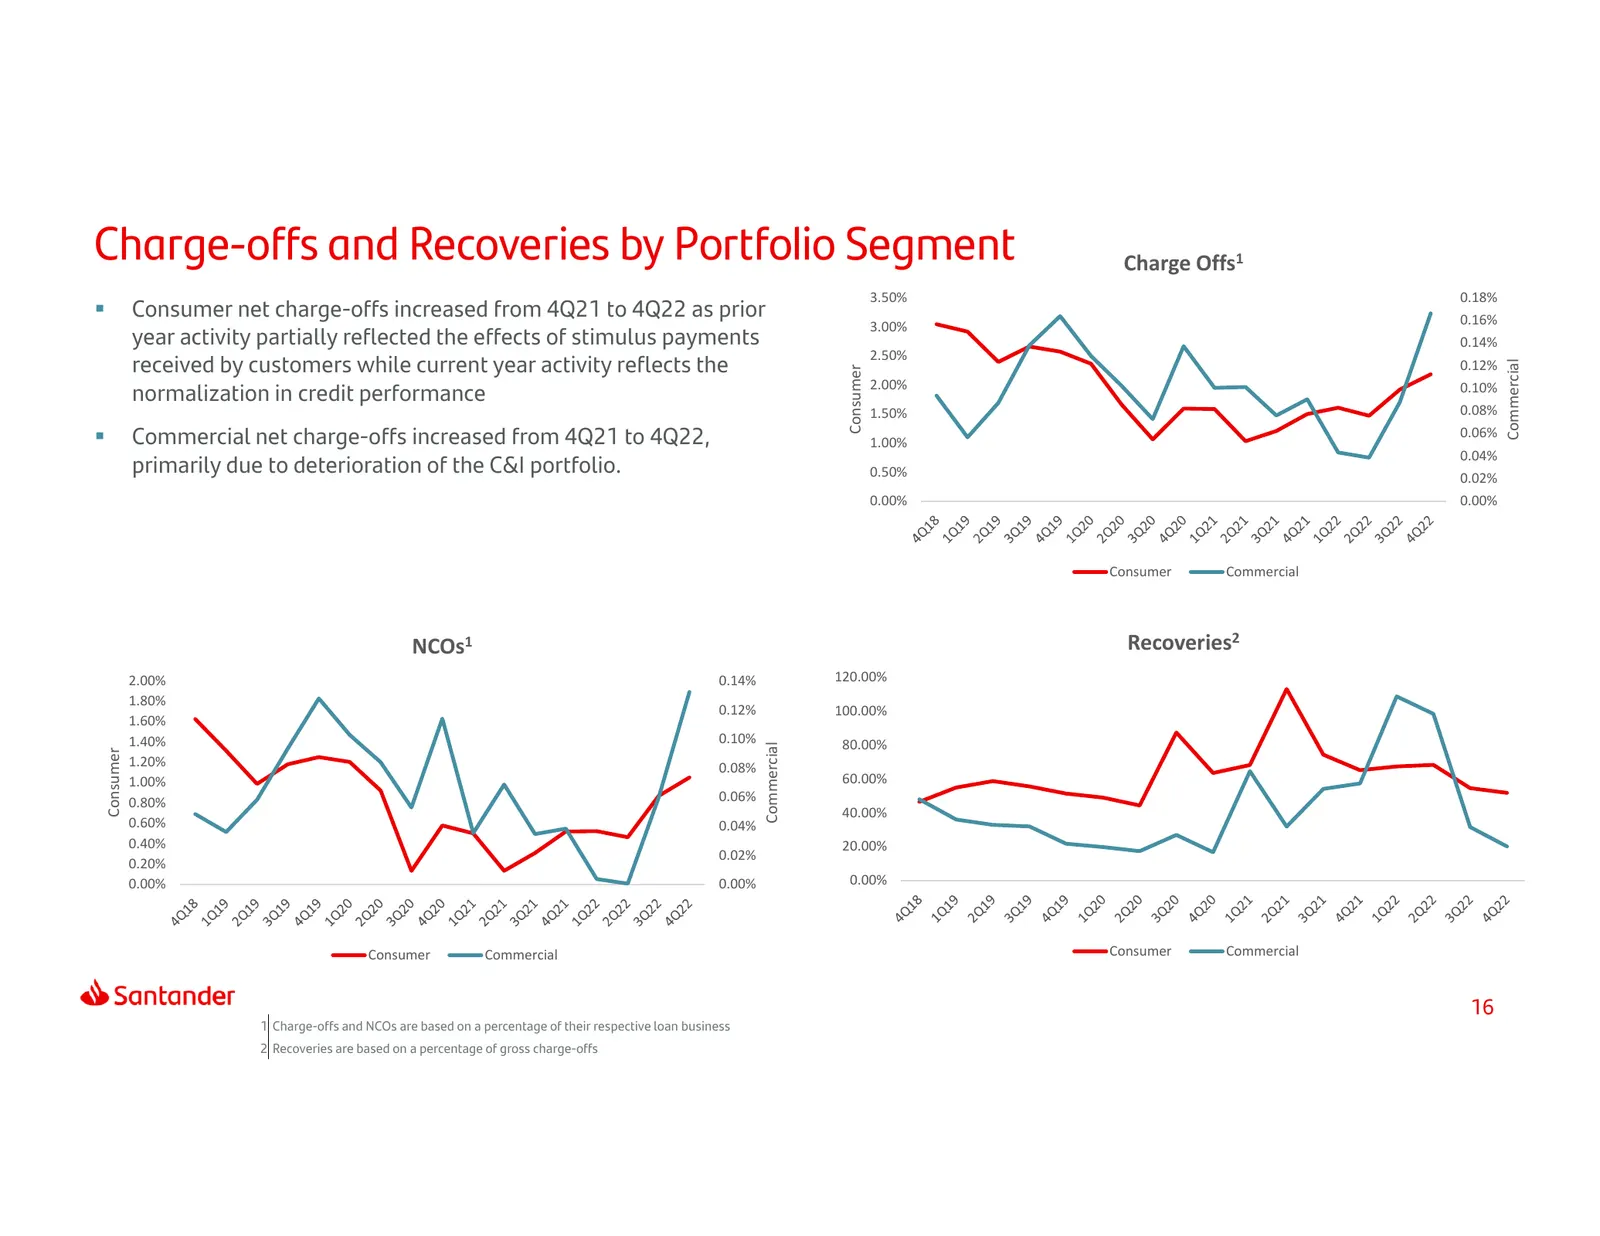
Charge-offs and Recoveries by Portfolio Segment Charge Offs1 3.50% 0.18% Consumer net charge-offs increased from 4Q21 to 4Q22 as prior 0.16% 3.00% year activity partially reflected the effects of stimulus payments 0.14% 2.50% received by customers while current year activity reflects the 0.12% Com
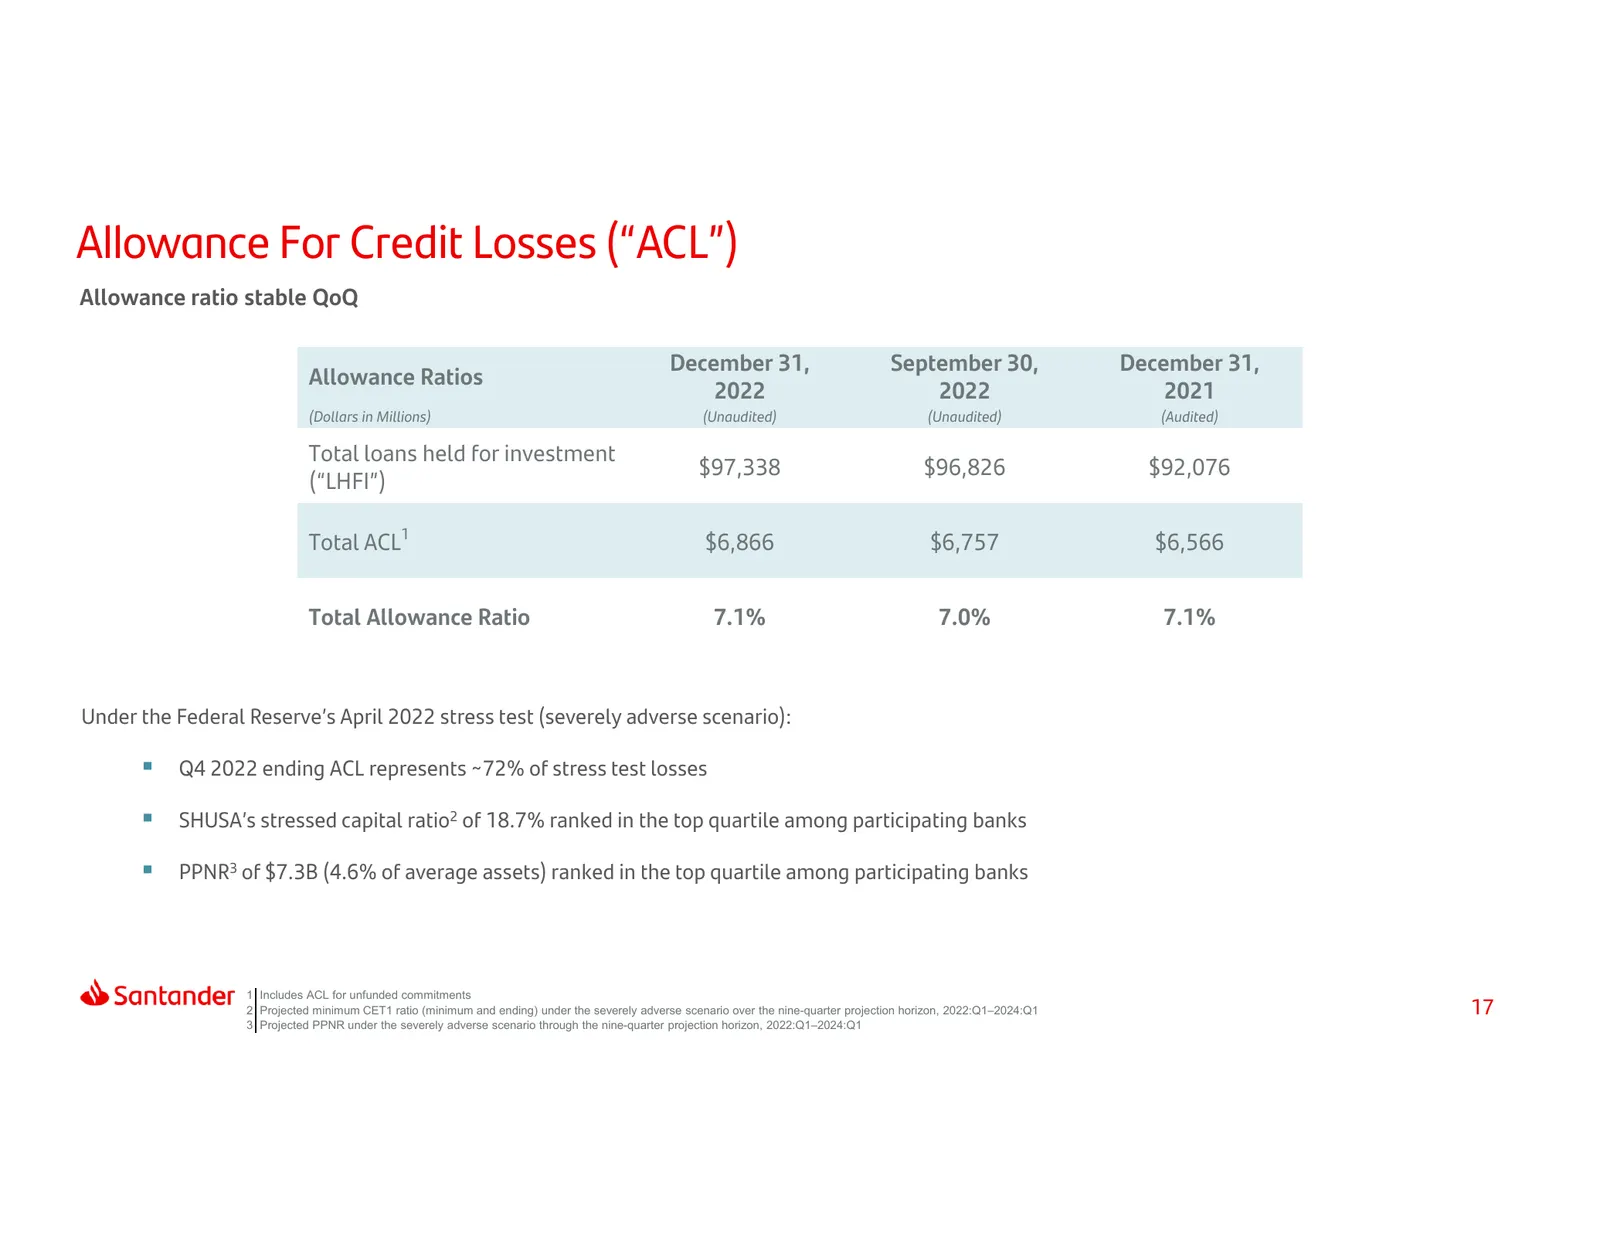
Slide 17: Allowance For Credit Losses ("ACL")
Allowance For Credit Losses (“ACL”) Allowance ratio stable QoQ December 31, September 30, December 31, Allowance Ratios 2022 2022 2021 (Dollars in Millions) (Unaudited) (Unaudited) (Audited) Total loans held for investment $97,338 $96,826 $92,076 (“LHFI”) Total ACL1 $6,866 $6,757 $6,566 Total Allowa
Slide 18: Index
Index 1 2 3 4 5 At a Glance Results Capital & Santander Appendix Liquidity Investor Day 18
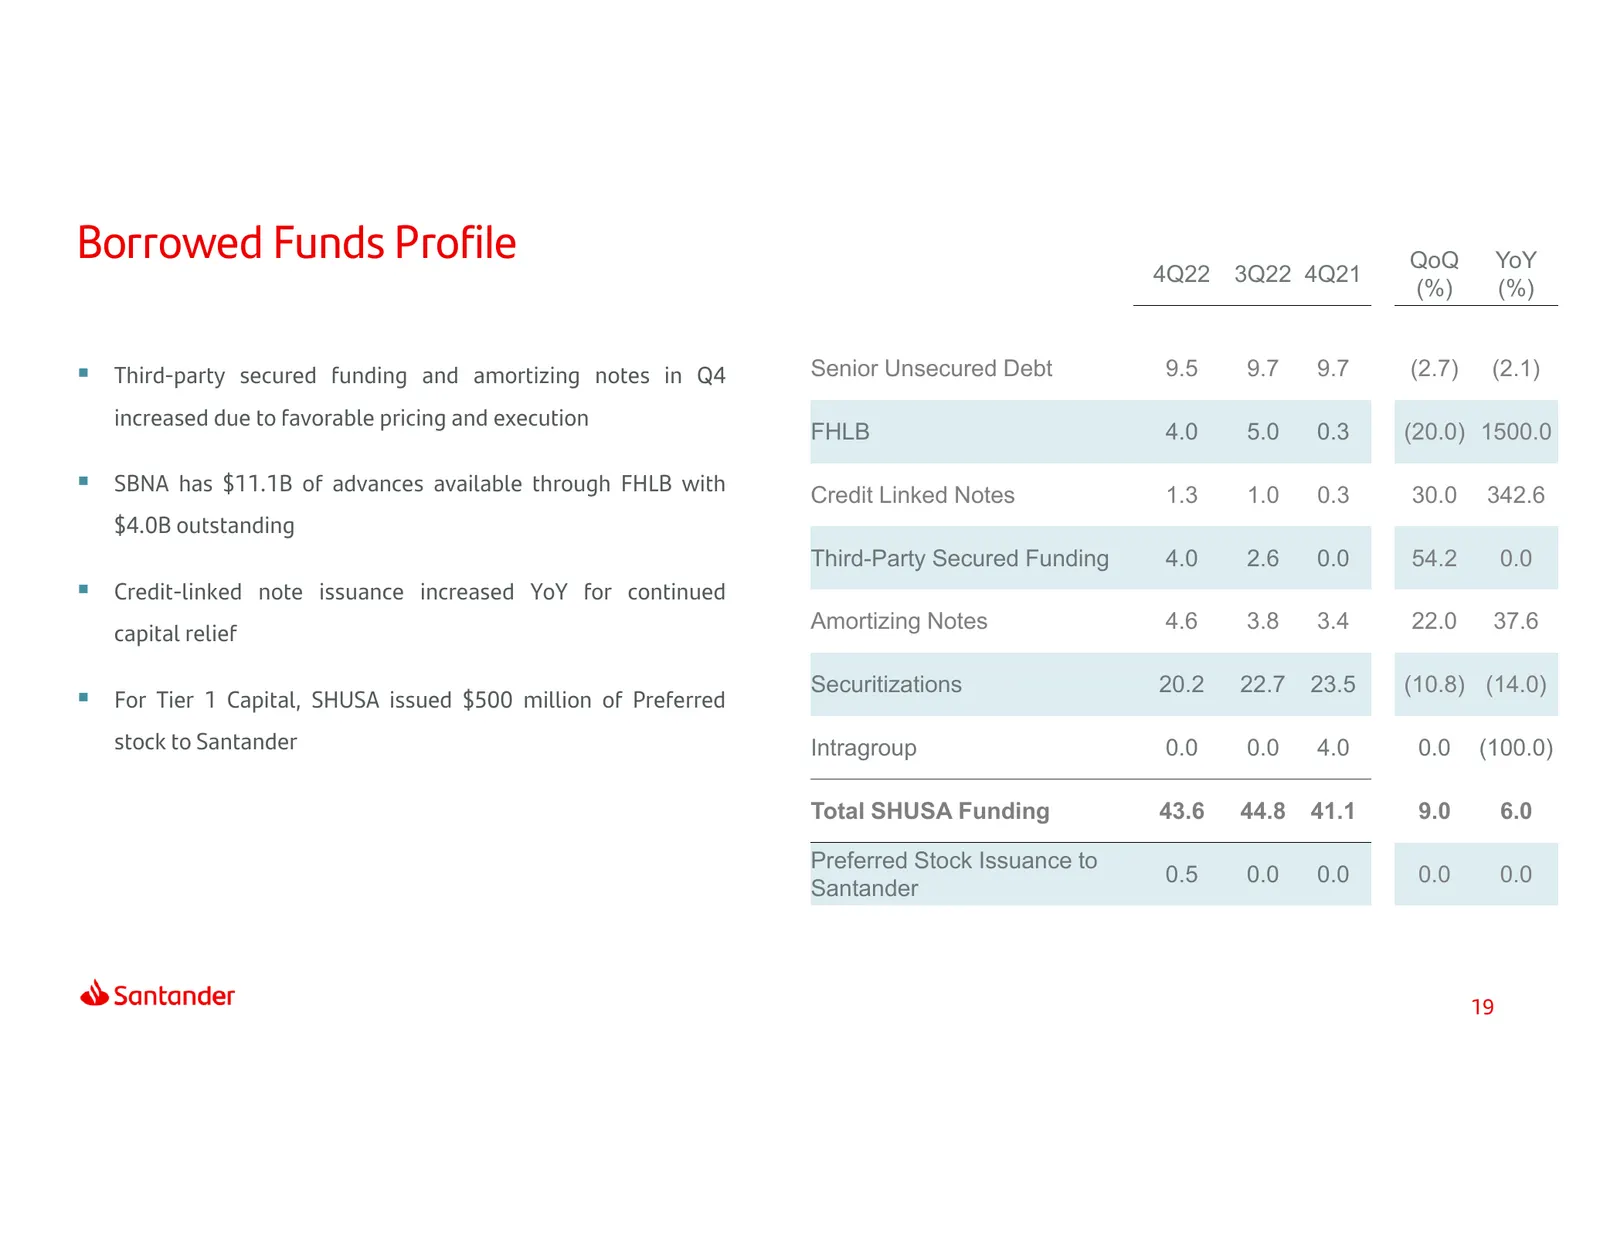
Slide 19: Borrowed Funds Profile
Borrowed Funds Profile QoQ YoY 4Q22 3Q22 4Q21 (%) (%) Third-party secured funding and amortizing notes in Q4 Senior Unsecured Debt 9.5 9.7 9.7 (2.7) (2.1) increased due to favorable pricing and execution FHLB 4.0 5.0 0.3 (20.0) 1500.0 SBNA has $11.1B of advances available through FHLB with Credi
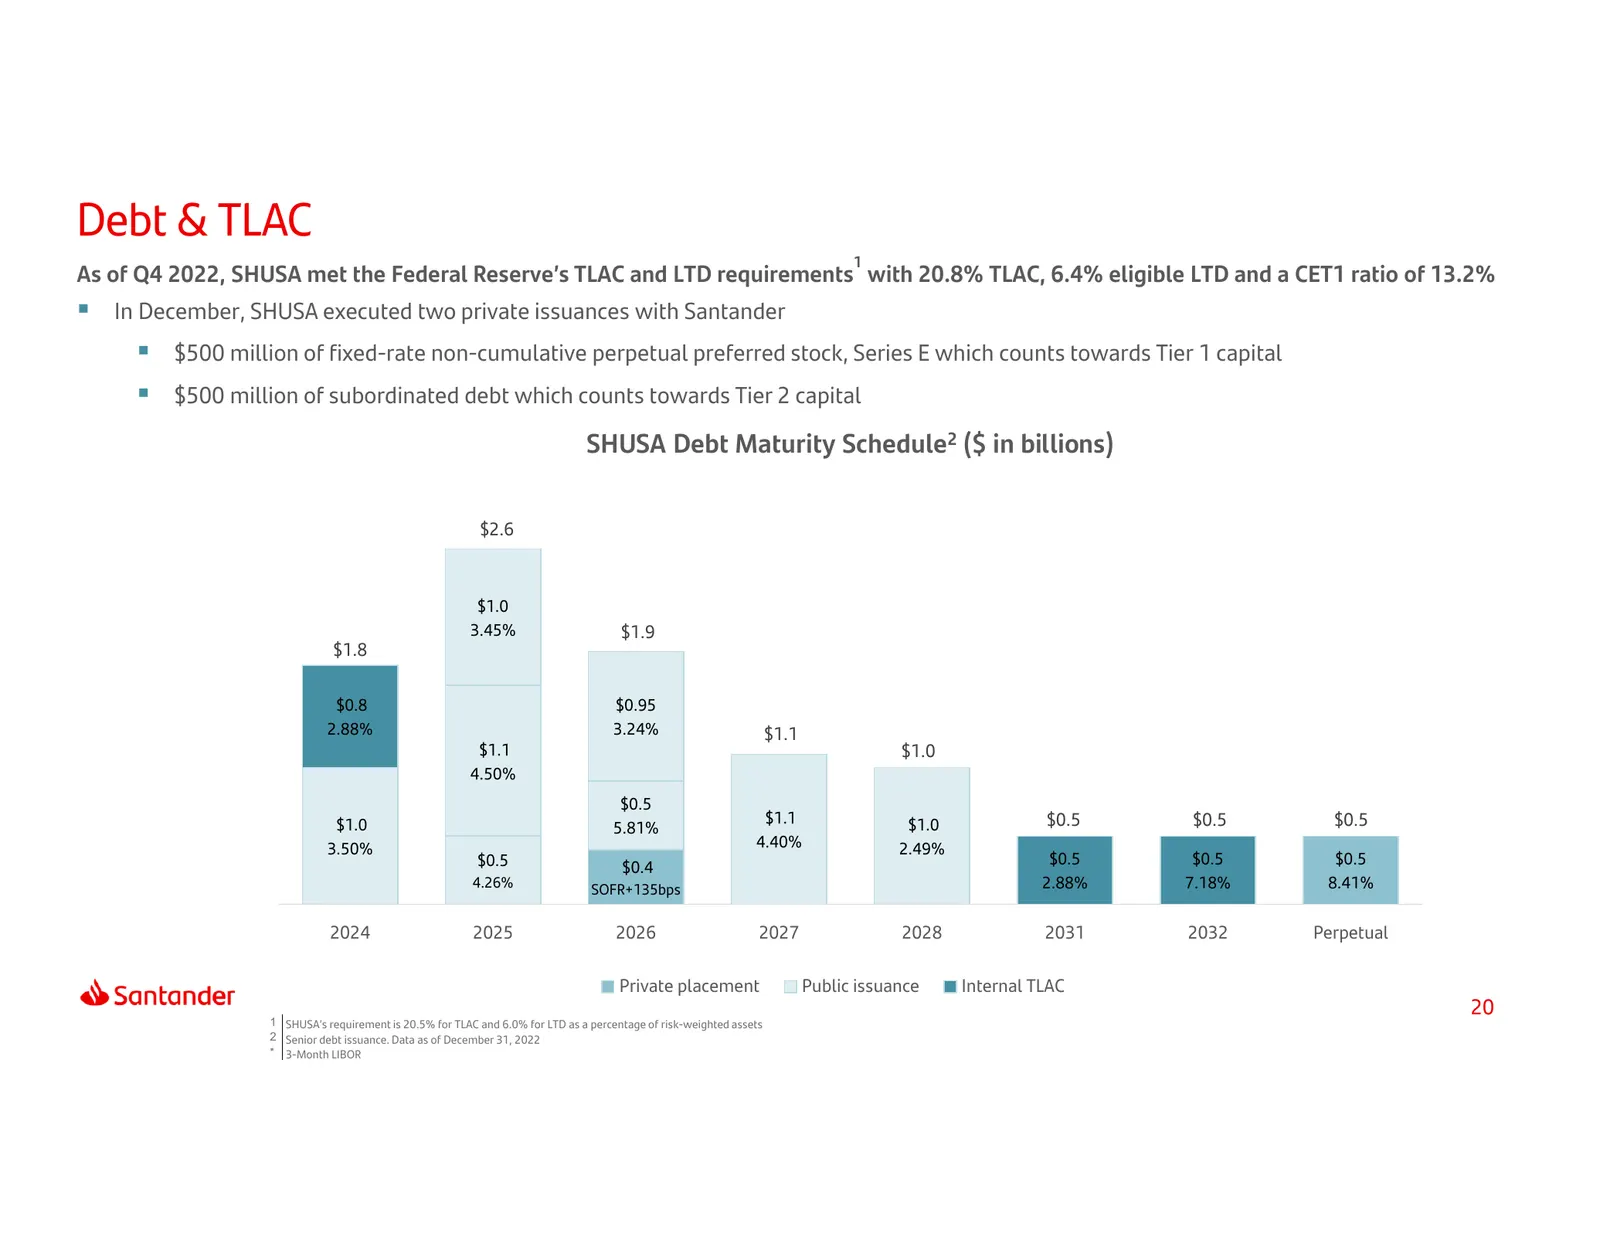
Slide 20: Debt & TLAC
Debt & TLAC 1 As of Q4 2022, SHUSA met the Federal Reserve’s TLAC and LTD requirements with 20.8% TLAC, 6.4% eligible LTD and a CET1 ratio of 13.2% In December, SHUSA executed two private issuances with Santander $500 million of fixed-rate non-cumulative perpetual preferred stock, Series E which
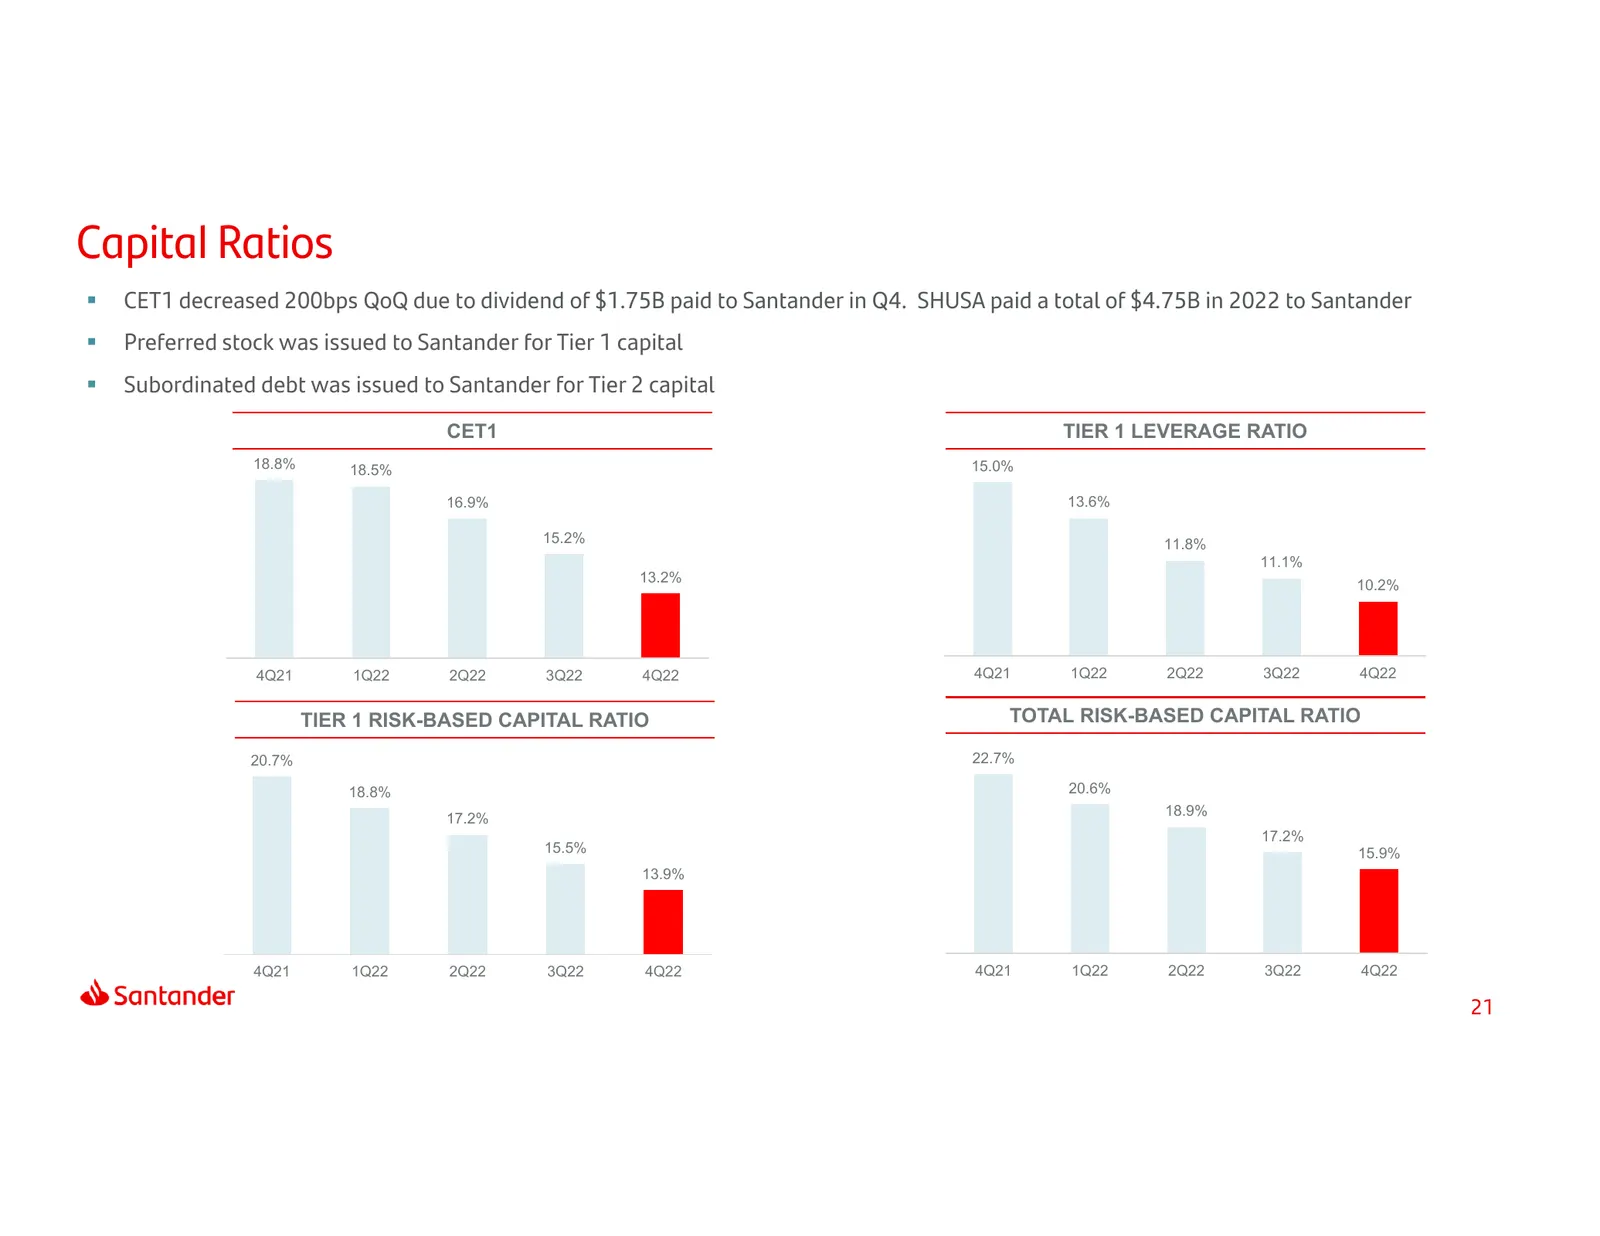
Slide 21: Capital Ratios
Capital Ratios CET1 decreased 200bps QoQ due to dividend of $1.75B paid to Santander in Q4. SHUSA paid a total of $4.75B in 2022 to Santander Preferred stock was issued to Santander for Tier 1 capital Subordinated debt was issued to Santander for Tier 2 capital CET1 TIER 1 LEVERAGE RATIO 18.8%
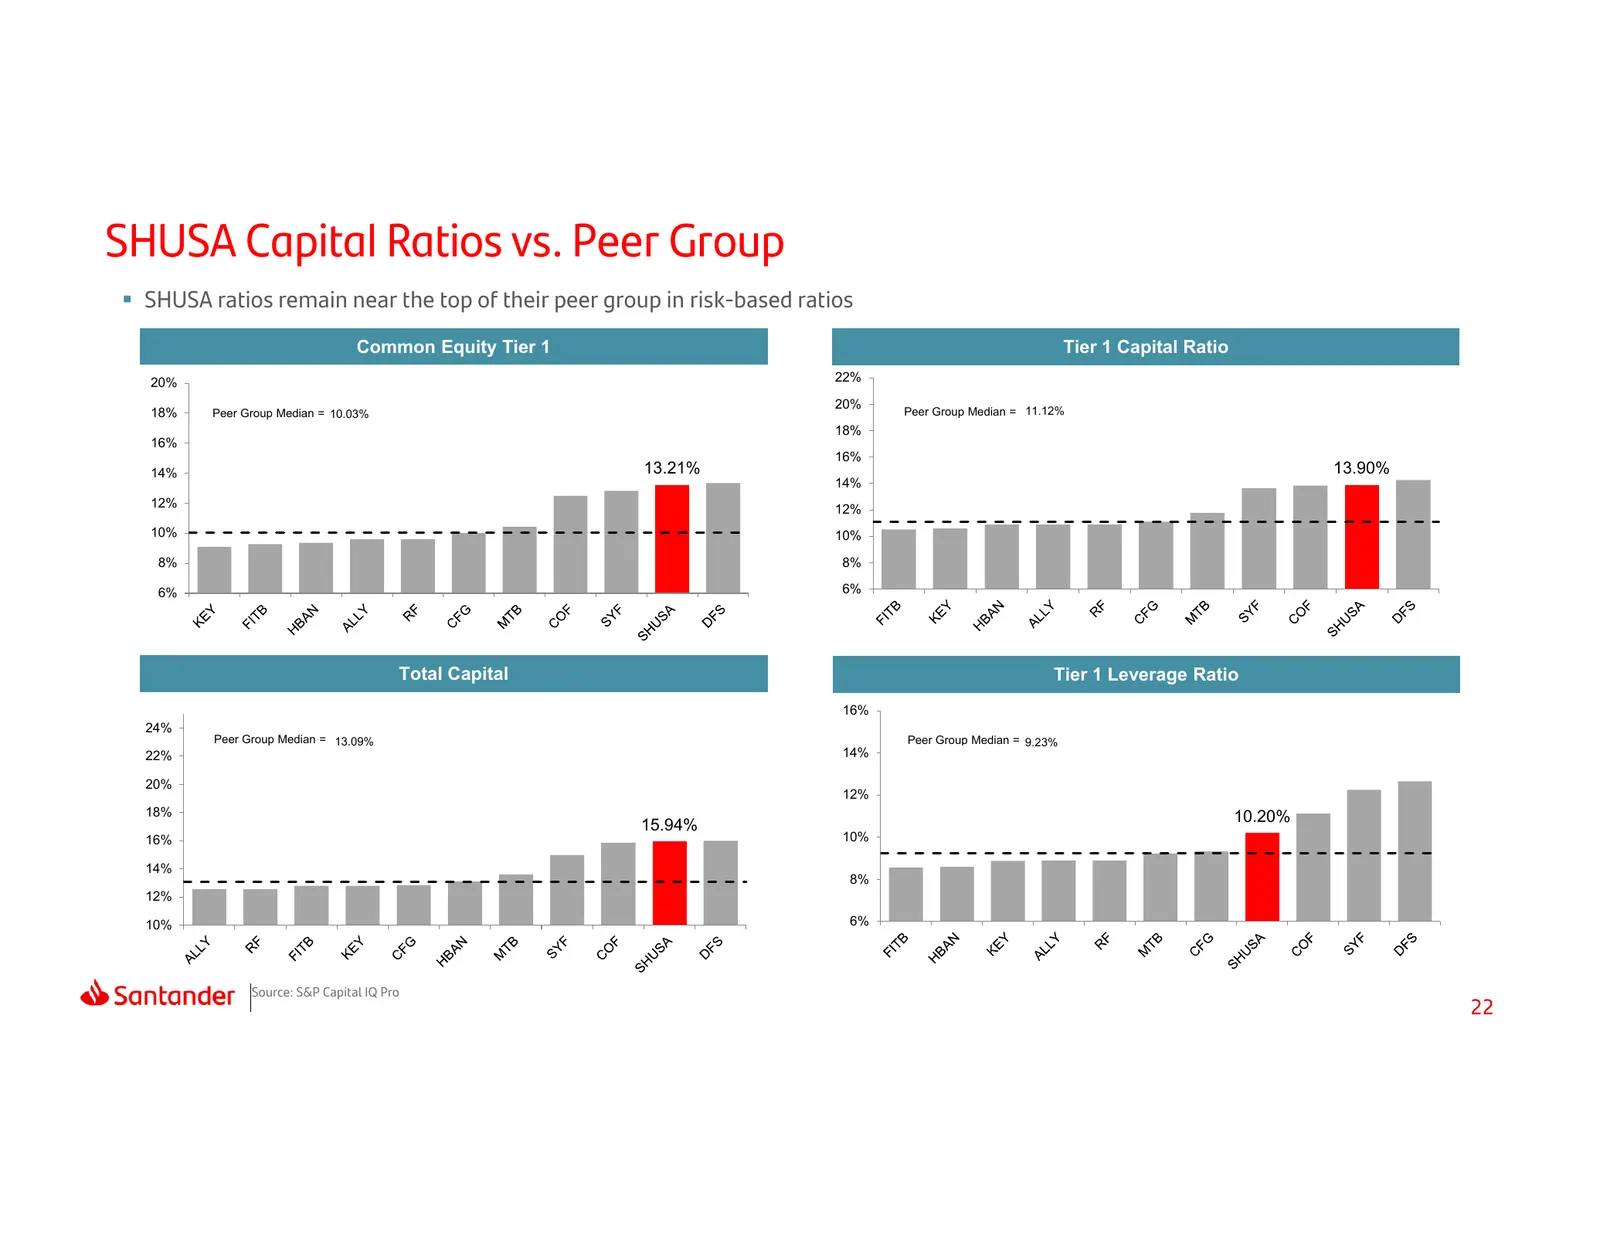
Slide 22: SHUSA Capital Ratios vs. Peer Group
SHUSA Capital Ratios vs. Peer Group SHUSA ratios remain near the top of their peer group in risk-based ratios Common Equity Tier 1 Tier 1 Capital Ratio 20% 22% 20% 18% Peer Group Median = 10.03% Peer Group Median = 11.12% 18% 16% 16% 14% 13.21% 13.90% 14% 12% 12% 10% 10% 8% 8% 6% 6% Total Capital
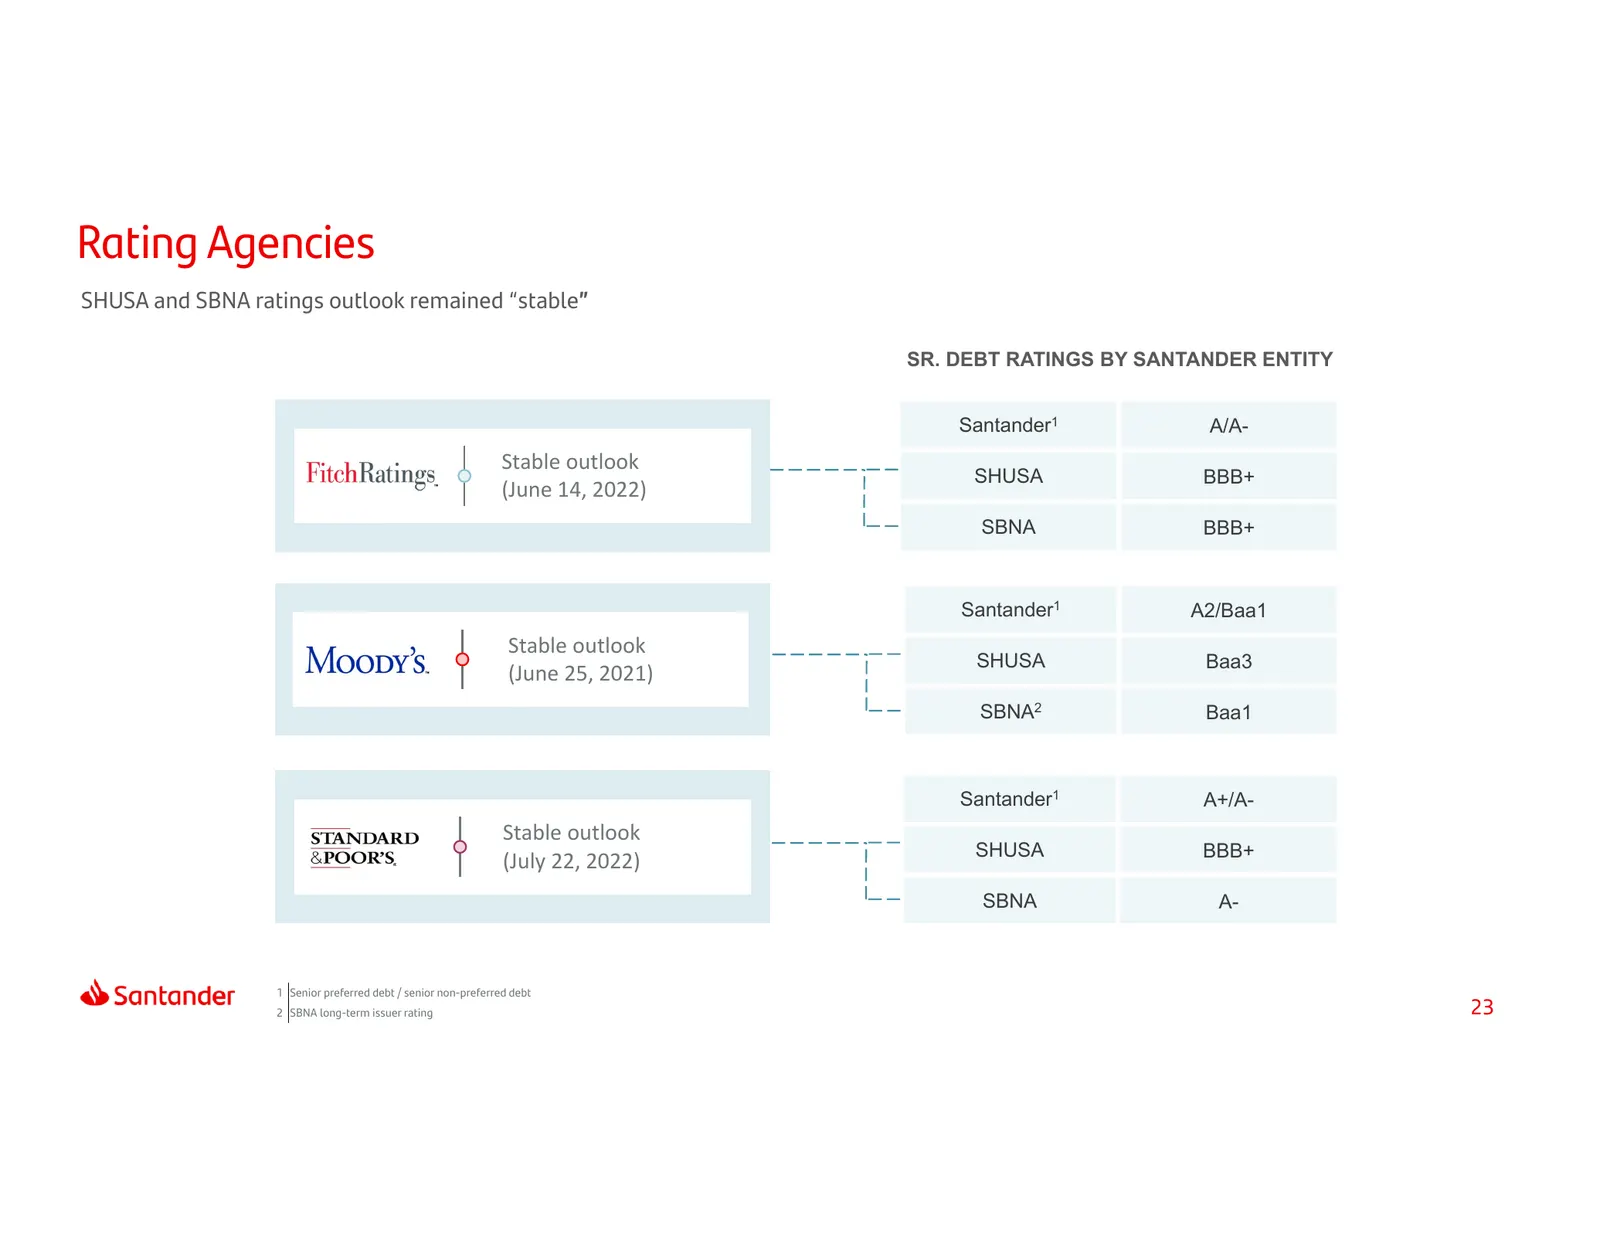
Slide 23: Rating Agencies
Rating Agencies SHUSA and SBNA ratings outlook remained “stable” SR. DEBT RATINGS BY SANTANDER ENTITY Santander1 A/A- Stable outlook SHUSA BBB+ (June 14, 2022) SBNA BBB+ Santander1 A2/Baa1 Stable outlook SHUSA Baa3 (June 25, 2021) SBNA2 Baa1 Santander1 A+/A- Stable outlook SHUSA BBB+ (July 22, 2022)
Slide 24: Index
Index 1 2 3 4 5 At a Glance Results Capital & Santander Appendix Liquidity Investor Day 24
Slide 25: The following slides were discussed at Santander Investor Day in London
The following slides were discussed at Santander Investor Day in London1 For more information on Investor Day please visit: https://santanderaccionistaseinversores.com/investor/ID/2023/ 1 Following figures in International Financial Reporting Standards (“IFRS”) 25
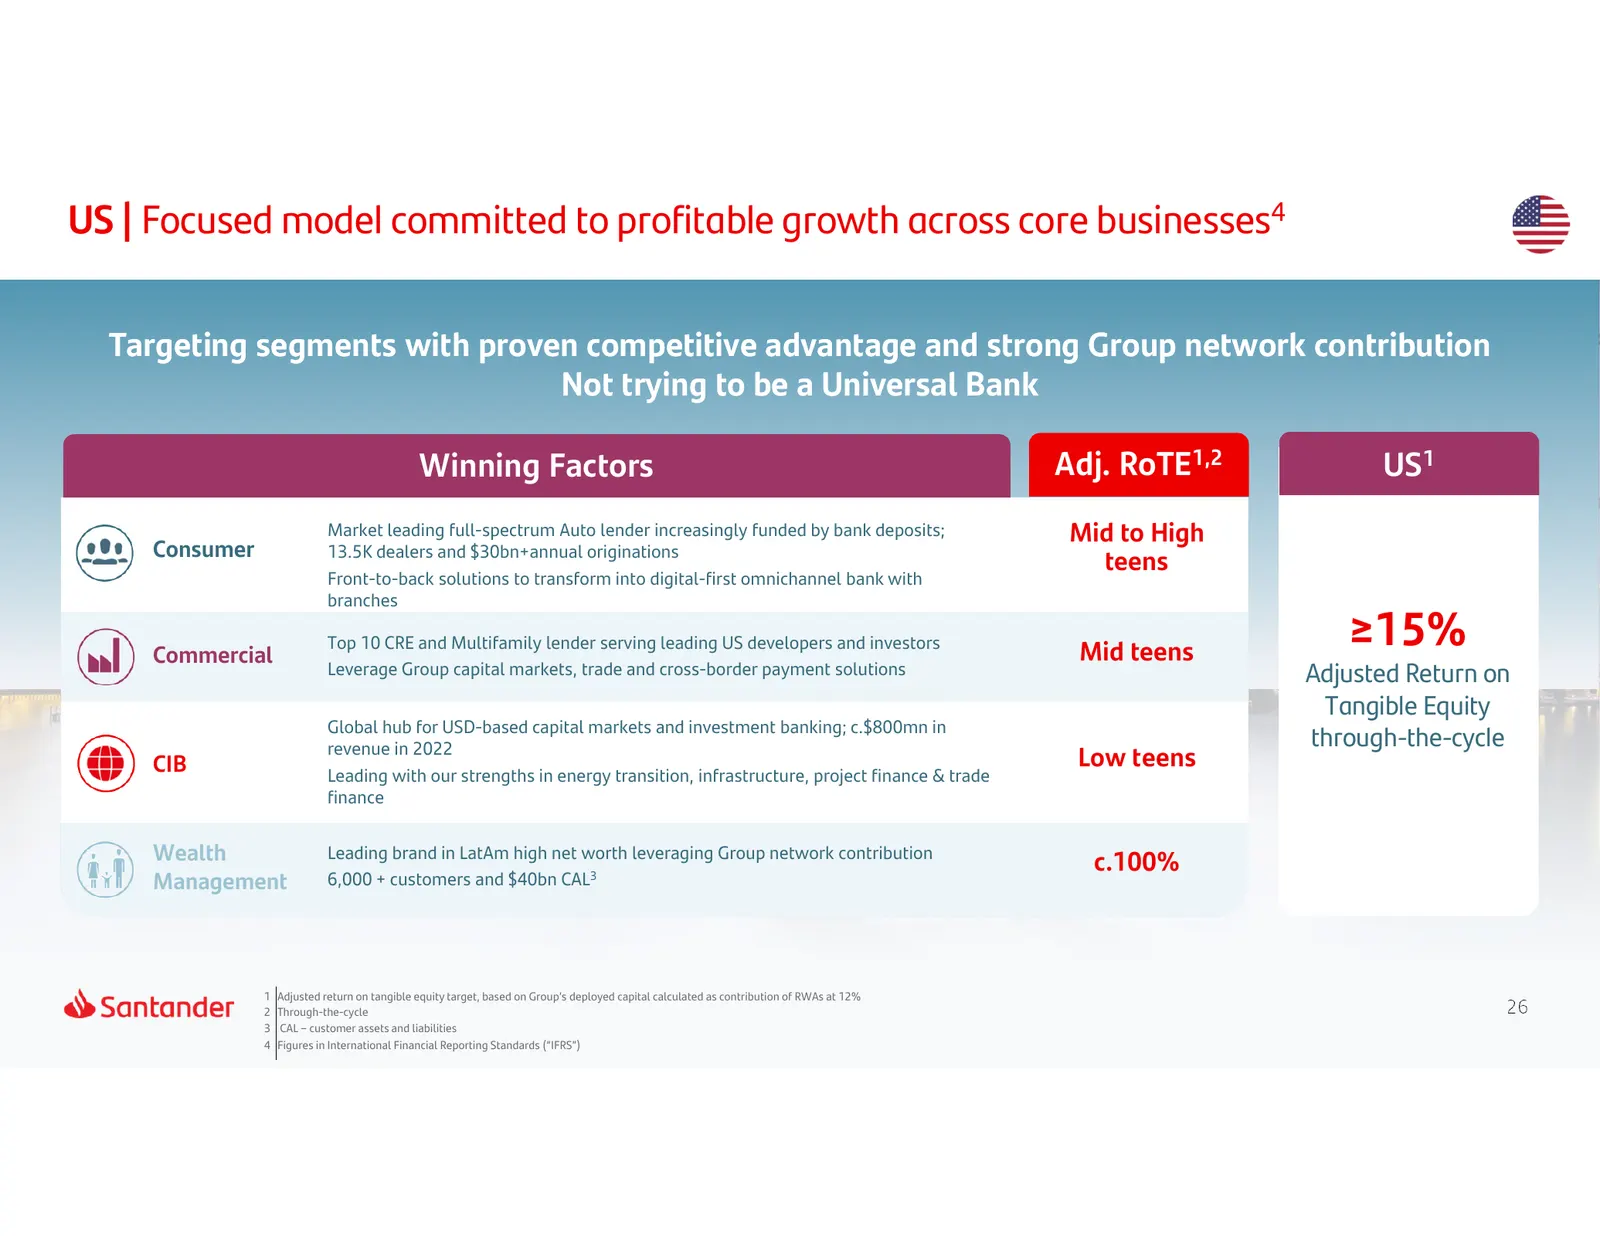
Slide 26: US | Focused model committed to profitable growth across core businesses
US | Focused model committed to profitable growth across core businesses4 Targeting segments with proven competitive advantage and strong Group network contribution Not trying to be a Universal Bank Winning Factors Adj. RoTE1,2 US1 Market leading full-spectrum Auto lender increasingly funded by bank
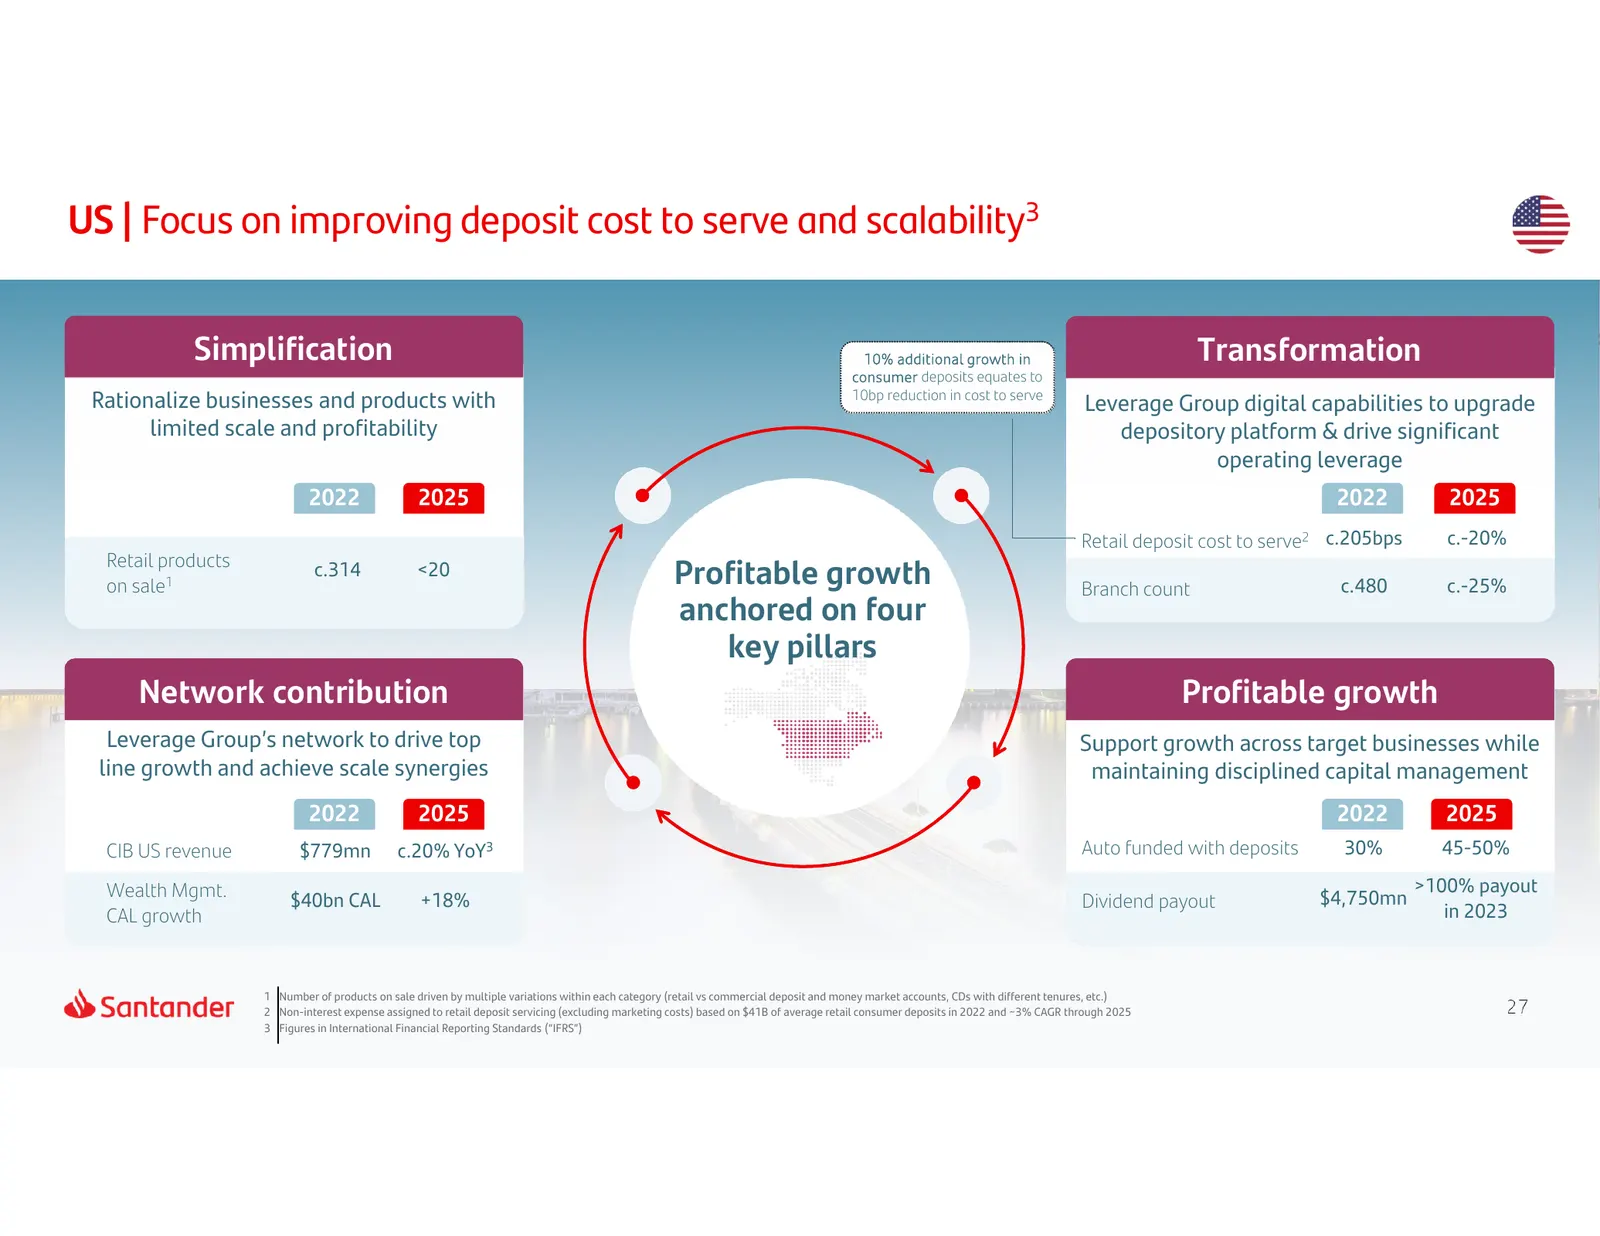
Slide 27: US | Focus on improving deposit cost to serve and scalability
US | Focus on improving deposit cost to serve and scalability3 Simplification 10% additional growth in Transformation consumer deposits equates to 10bp reduction in cost to serve Rationalize businesses and products with Leverage Group digital capabilities to upgrade limited scale and profitability d
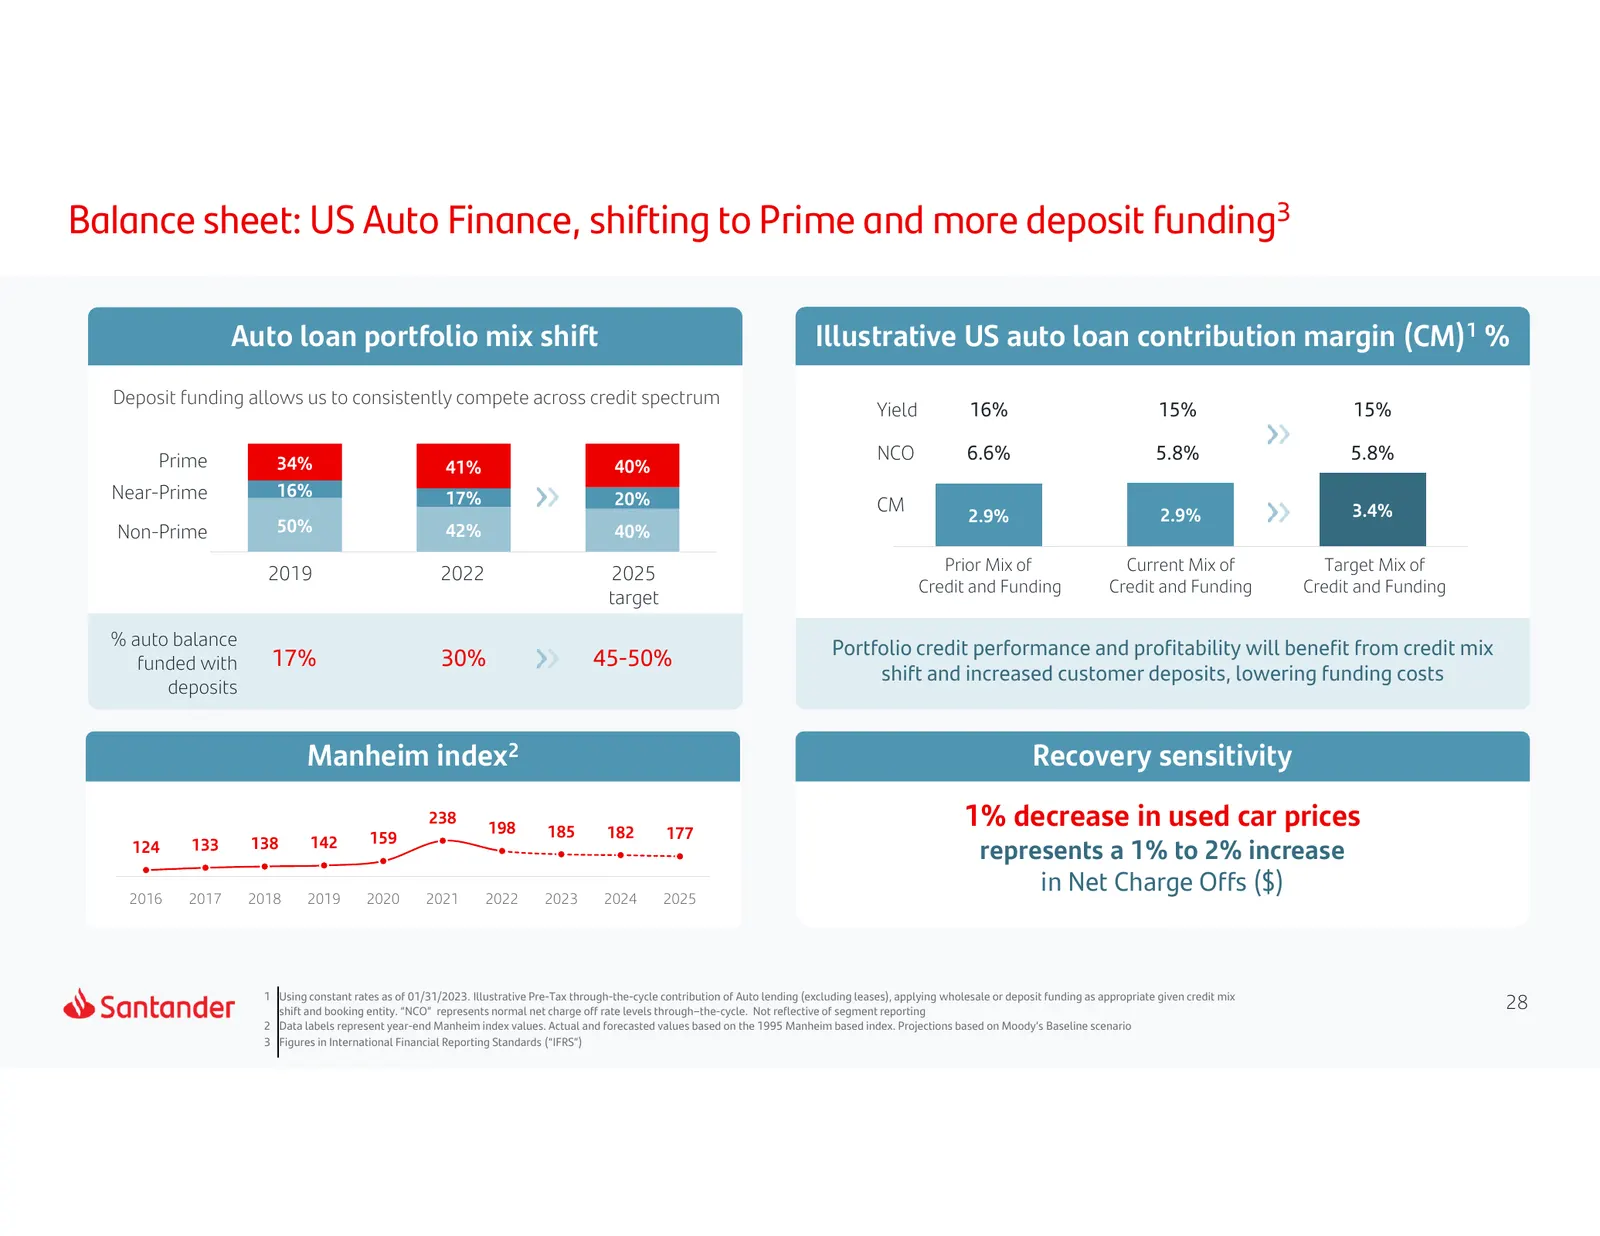
Slide 28: Balance sheet: US Auto Finance, shifting to Prime and more deposit funding
Balance sheet: US Auto Finance, shifting to Prime and more deposit funding3 Auto loan portfolio mix shift Illustrative US auto loan contribution margin (CM)1 % Deposit funding allows us to consistently compete across credit spectrum Yield 16% 15% 15% Prime NCO 6.6% 5.8% 5.8% 34% 41% 40% Near-Prime 1
Slide 29: One Transformation | Accelerating execution in US
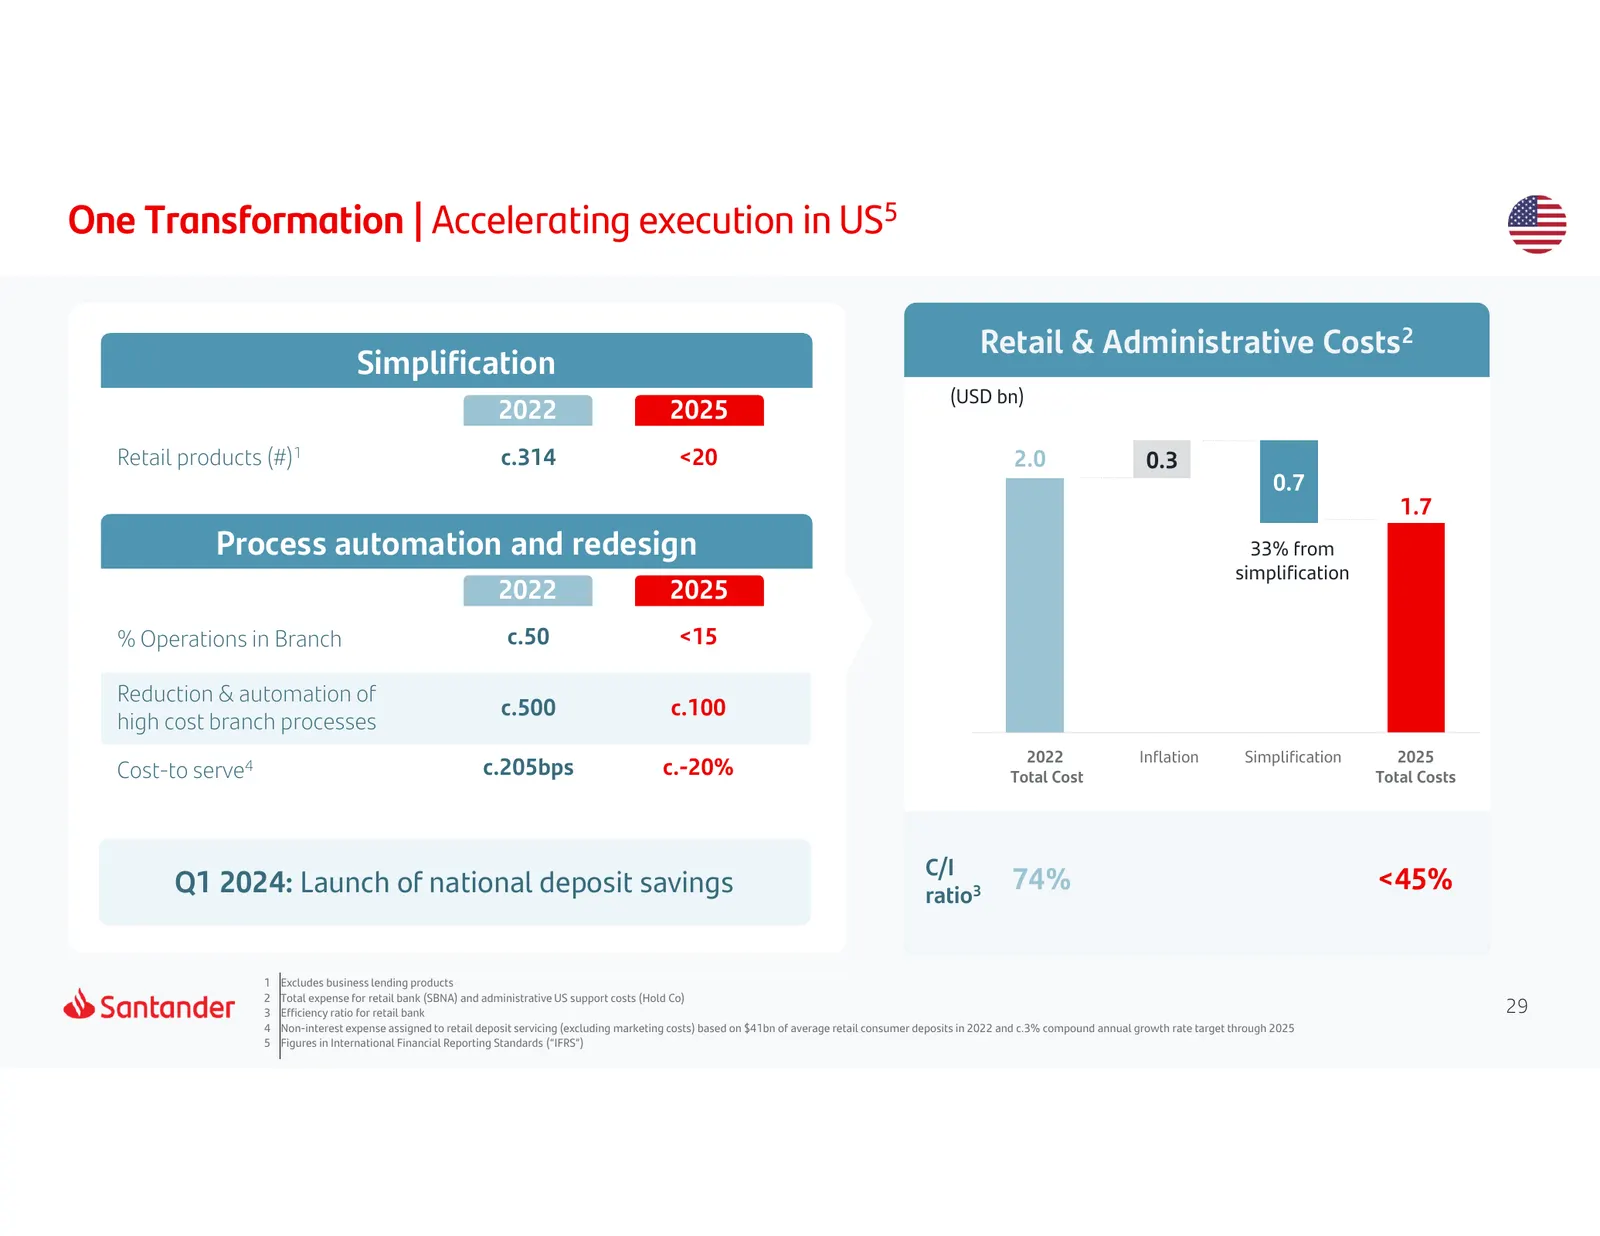
One Transformation | Accelerating execution in US5 Retail & Administrative Costs2 Simplification (USD bn) 2022 2025 Retail products (#)1 c.314 <20 2.0 0.3 0.7 1.7 Process automation and redesign 33% from simplification 2022 2025 % Operations in Branch c.50 <15 Reduction & automation of c.500 c.100 h
Slide 30: Index
Index 1 2 3 4 5 At a Glance Results Capital & Santander Appendix Liquidity Investor Day 30
Slide 31: Consumer Activities
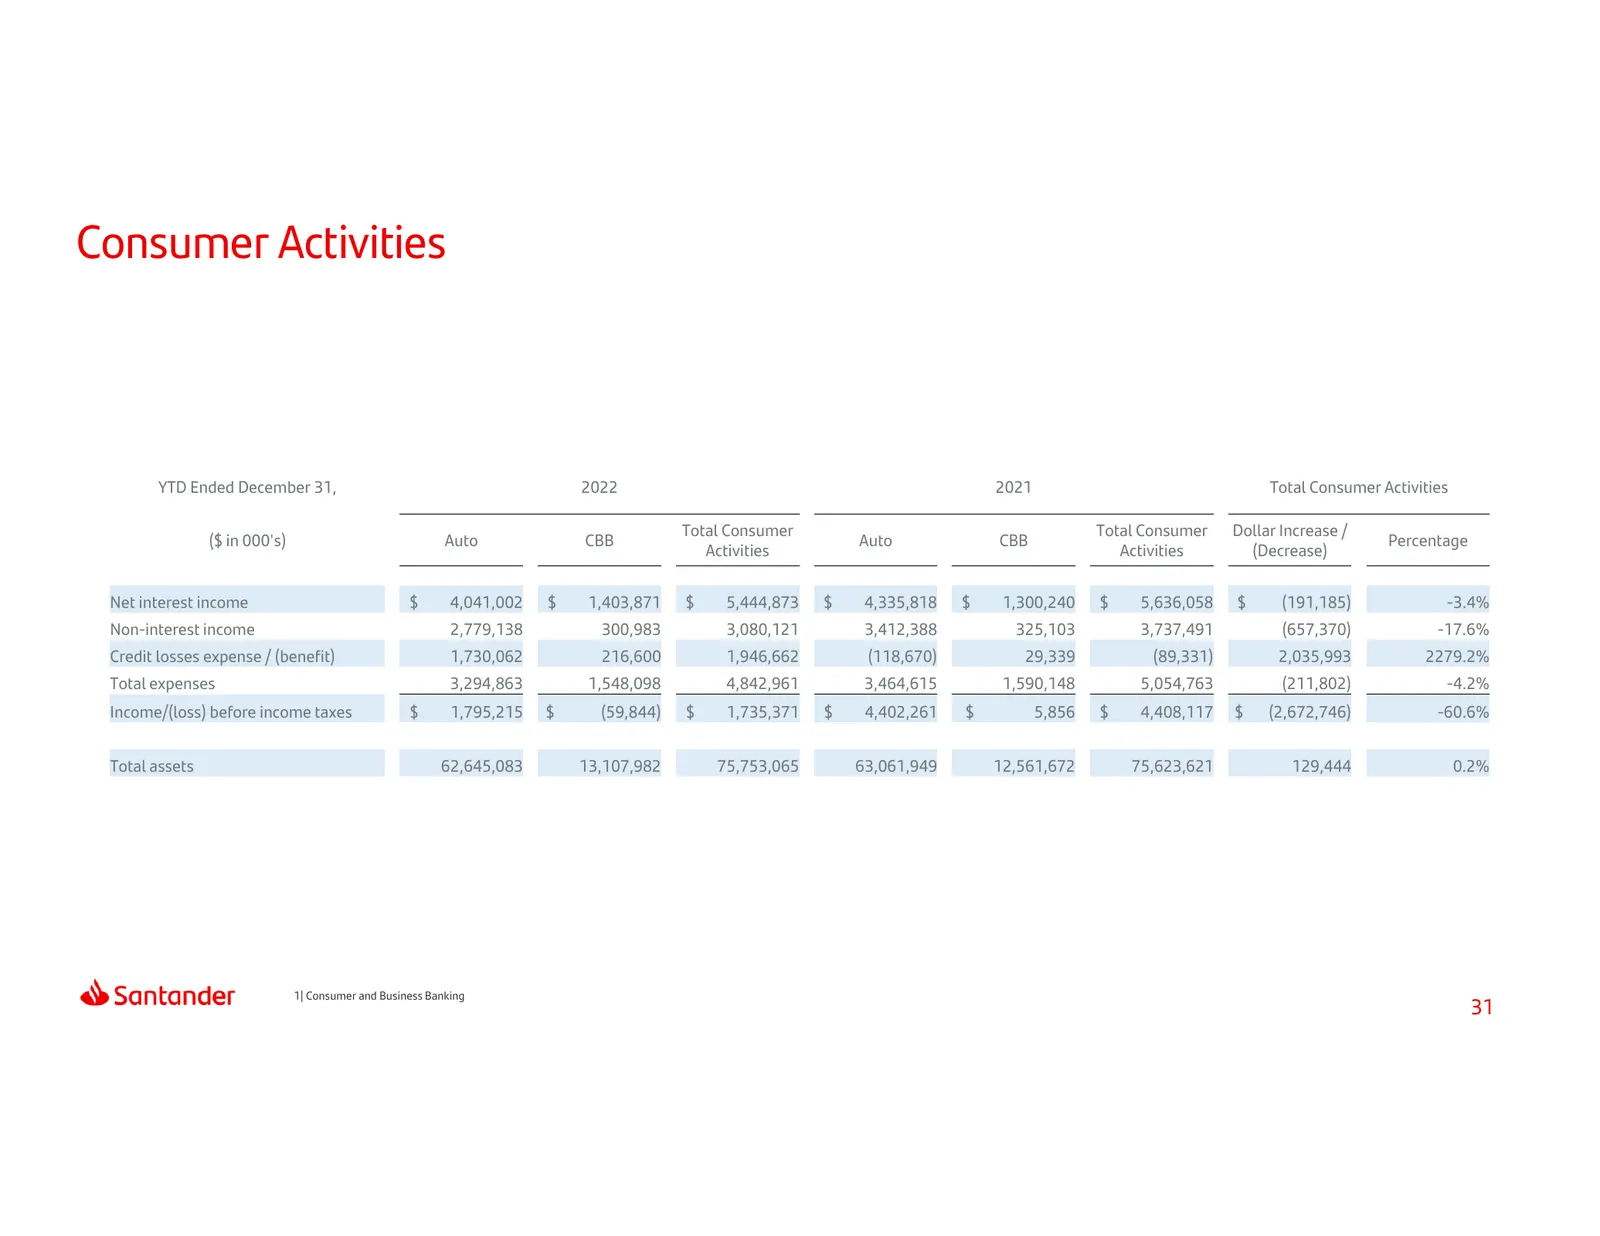
Consumer Activities YTD Ended December 31, 2022 2021 Total Consumer Activities Total Consumer Total Consumer Dollar Increase / ($ in 000's) Auto CBB Auto CBB Percentage Activities Activities (Decrease) Net interest income $ 4,041,002 $ 1,403,871 $ 5,444,873 $ 4,335,818 $ 1,300,240 $ 5,636,058 $ (191
Slide 32: Commercial Activities
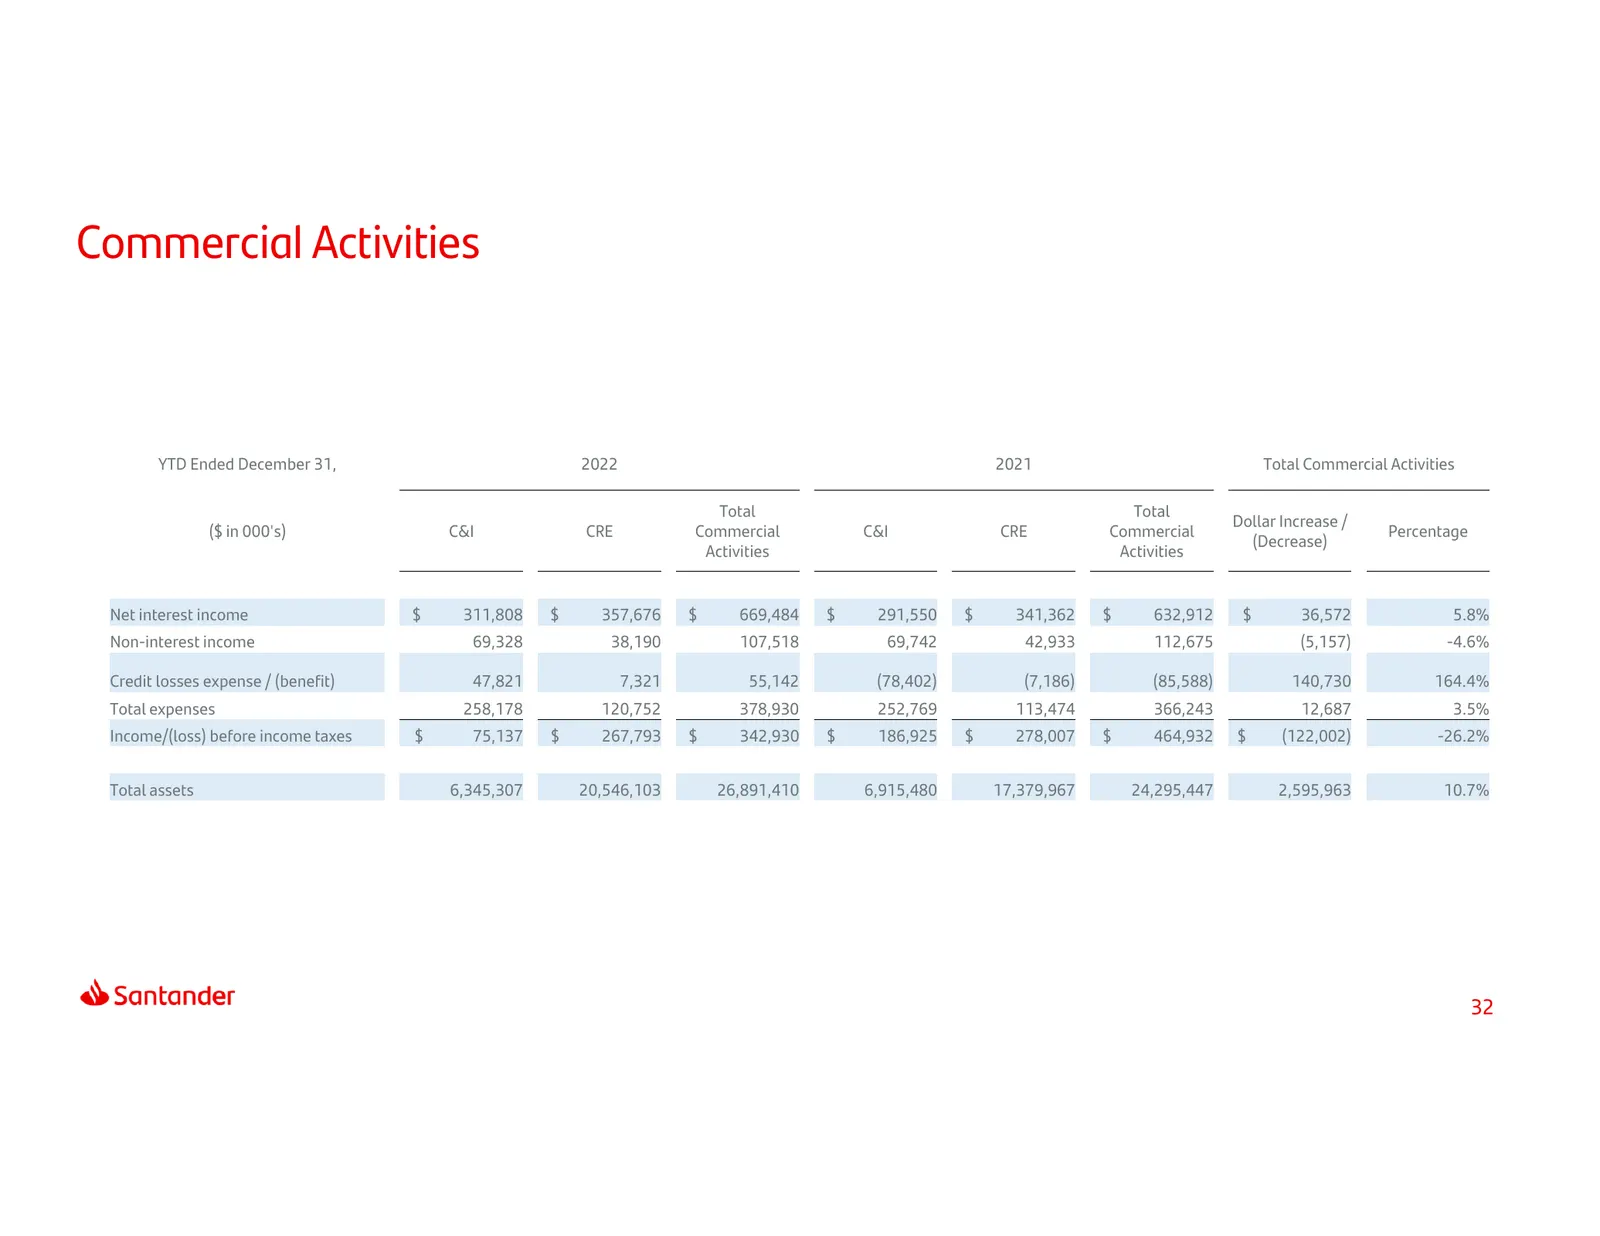
Commercial Activities YTD Ended December 31, 2022 2021 Total Commercial Activities Total Total Dollar Increase / ($ in 000's) C&I CRE Commercial C&I CRE Commercial Percentage (Decrease) Activities Activities Net interest income $ 311,808 $ 357,676 $ 669,484 $ 291,550 $ 341,362 $ 632,912 $ 36,572 5.8
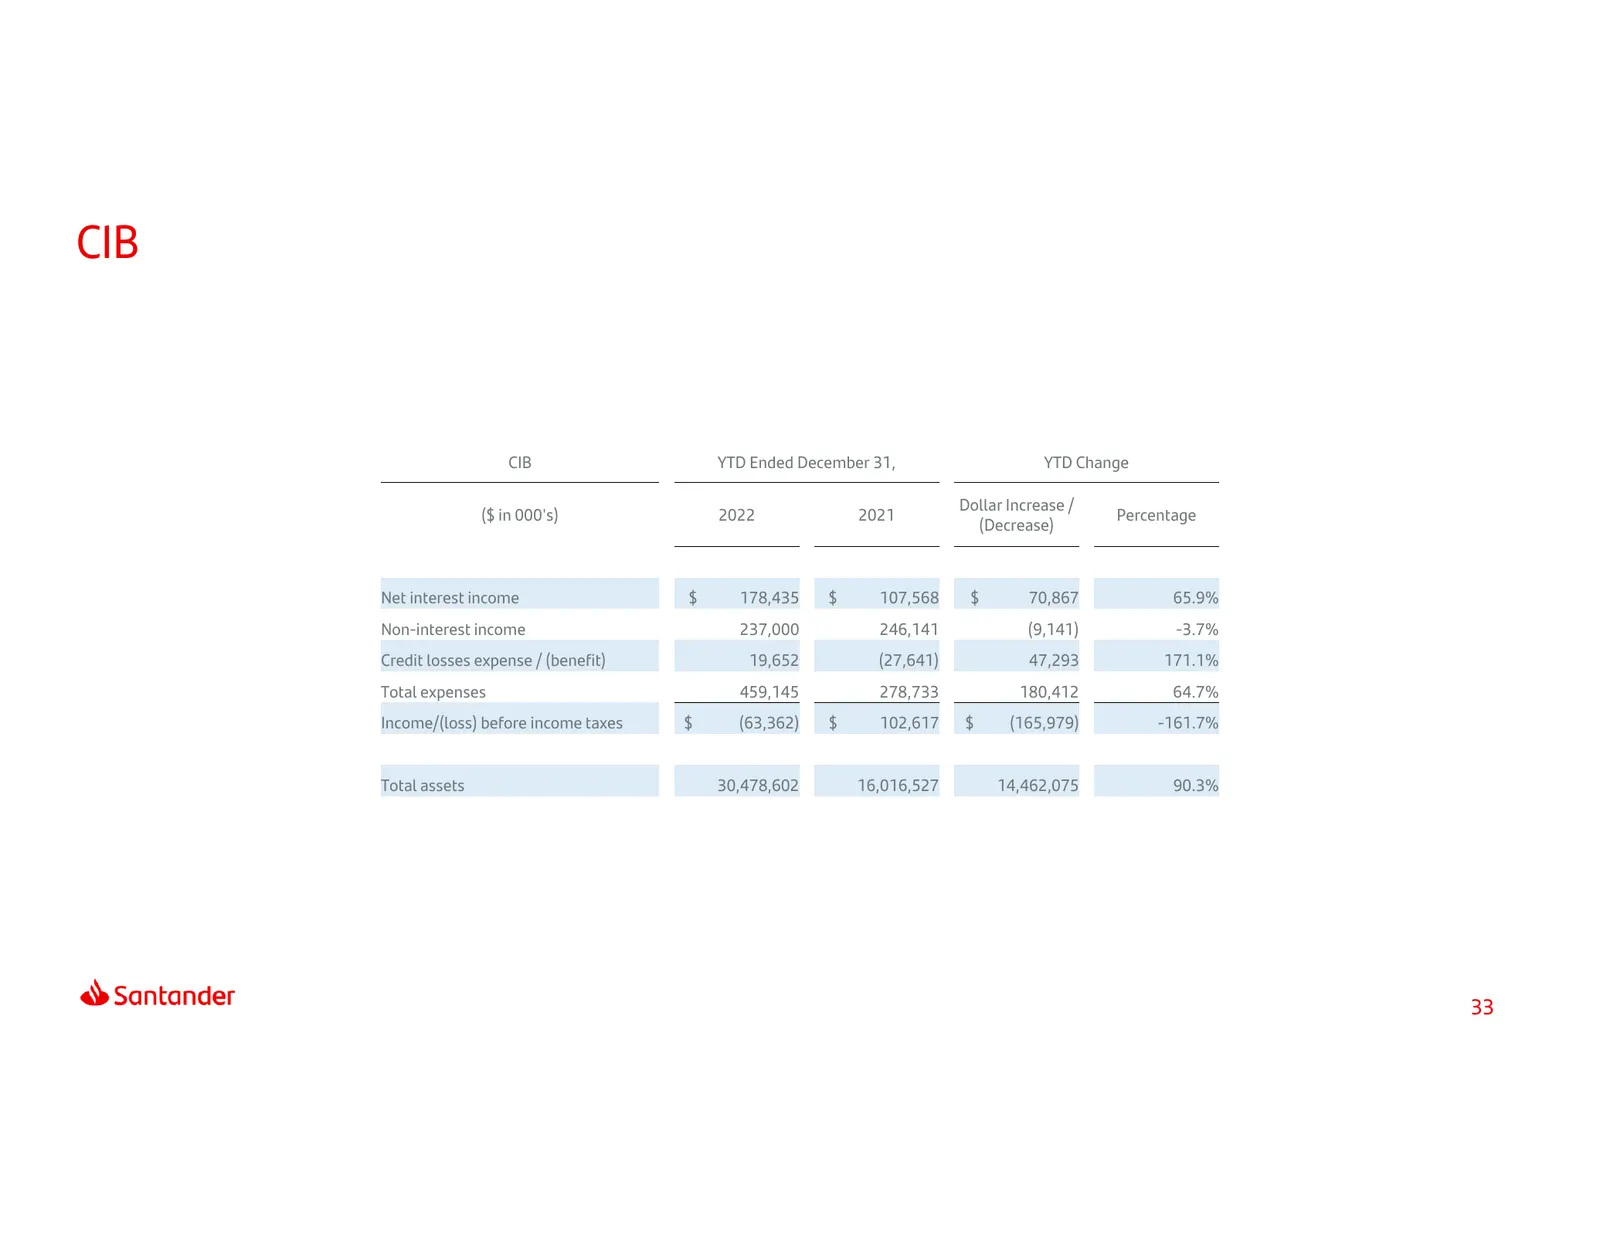
Slide 33: CIB
CIB CIB YTD Ended December 31, YTD Change Dollar Increase / ($ in 000's) 2022 2021 Percentage (Decrease) Net interest income $ 178,435 $ 107,568 $ 70,867 65.9% Non-interest income 237,000 246,141 (9,141) -3.7% Credit losses expense / (benefit) 19,652 (27,641) 47,293 171.1% Total expenses 459,145 278
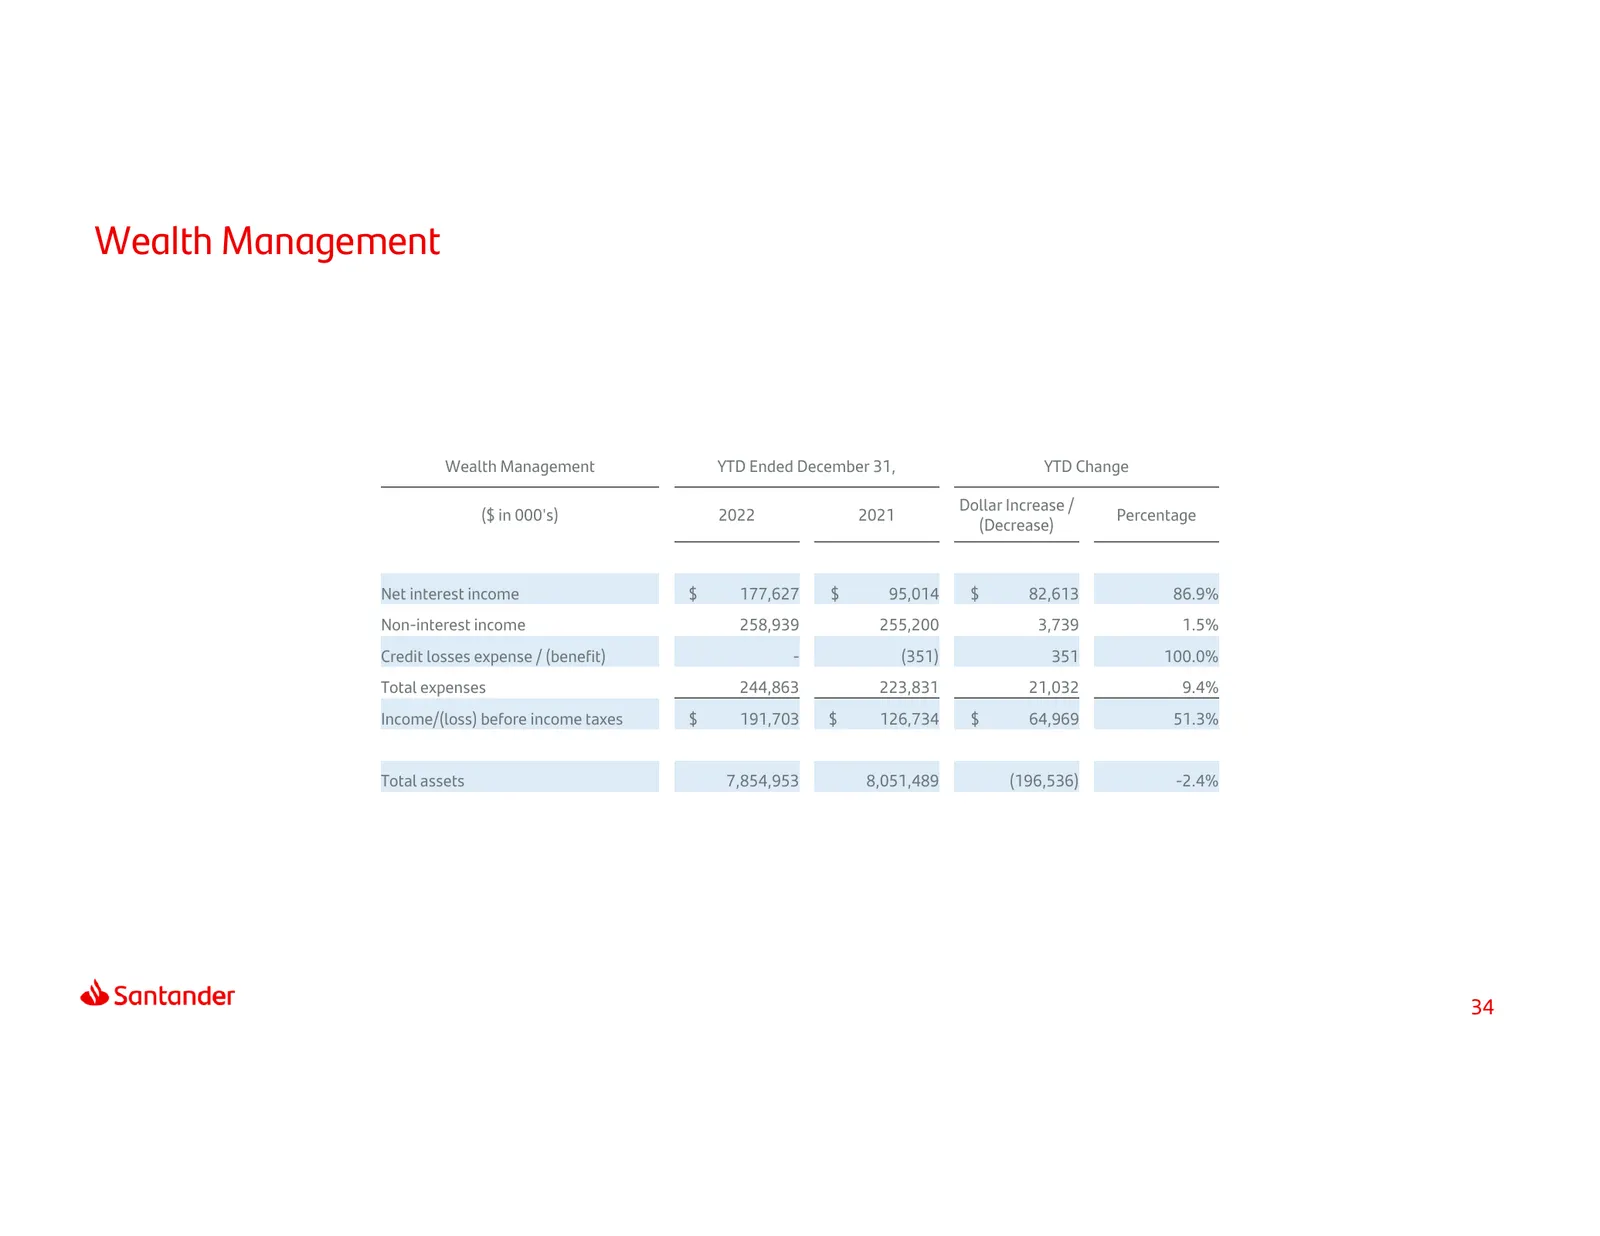
Slide 34: Wealth Management
Wealth Management Wealth Management YTD Ended December 31, YTD Change Dollar Increase / ($ in 000's) 2022 2021 Percentage (Decrease) Net interest income $ 177,627 $ 95,014 $ 82,613 86.9% Non-interest income 258,939 255,200 3,739 1.5% Credit losses expense / (benefit) - (351) 351 100.0% Total expense
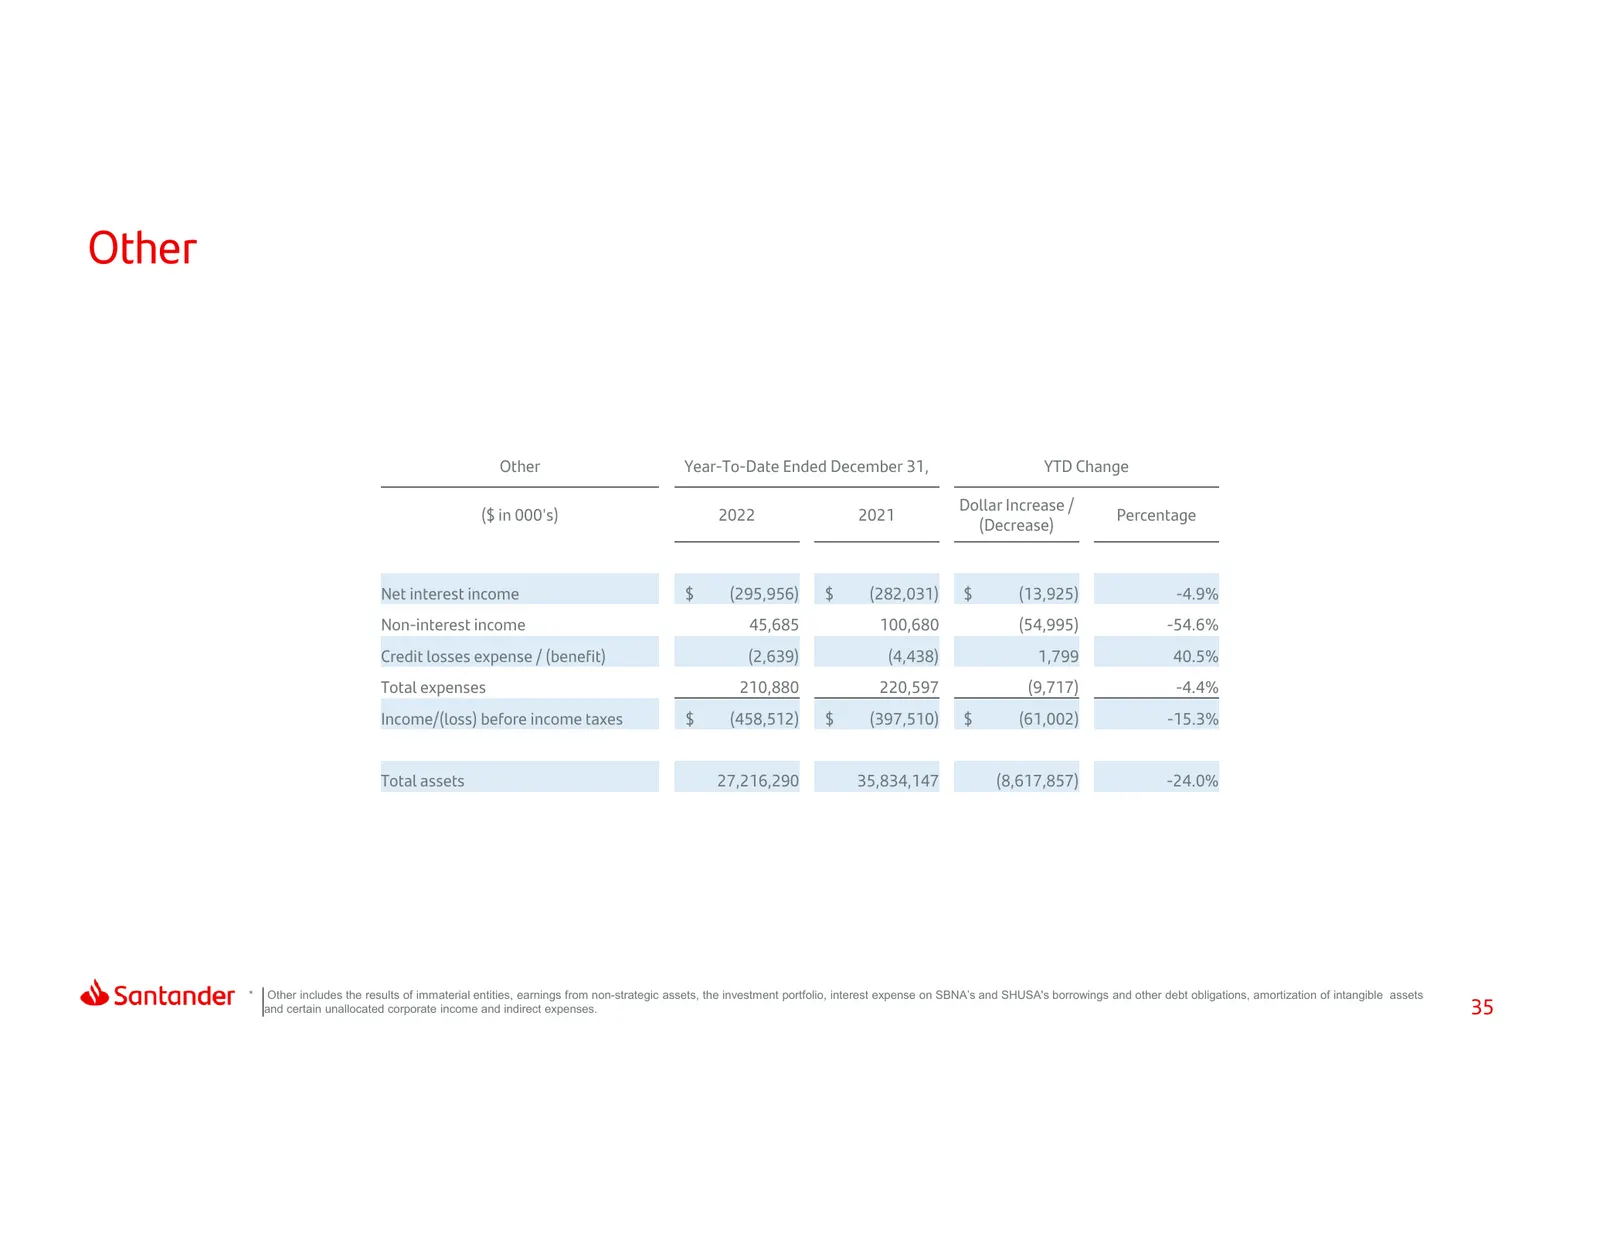
Slide 35: Other
Other Other Year-To-Date Ended December 31, YTD Change Dollar Increase / ($ in 000's) 2022 2021 Percentage (Decrease) Net interest income $ (295,956) $ (282,031) $ (13,925) -4.9% Non-interest income 45,685 100,680 (54,995) -54.6% Credit losses expense / (benefit) (2,639) (4,438) 1,799 40.5% Total ex
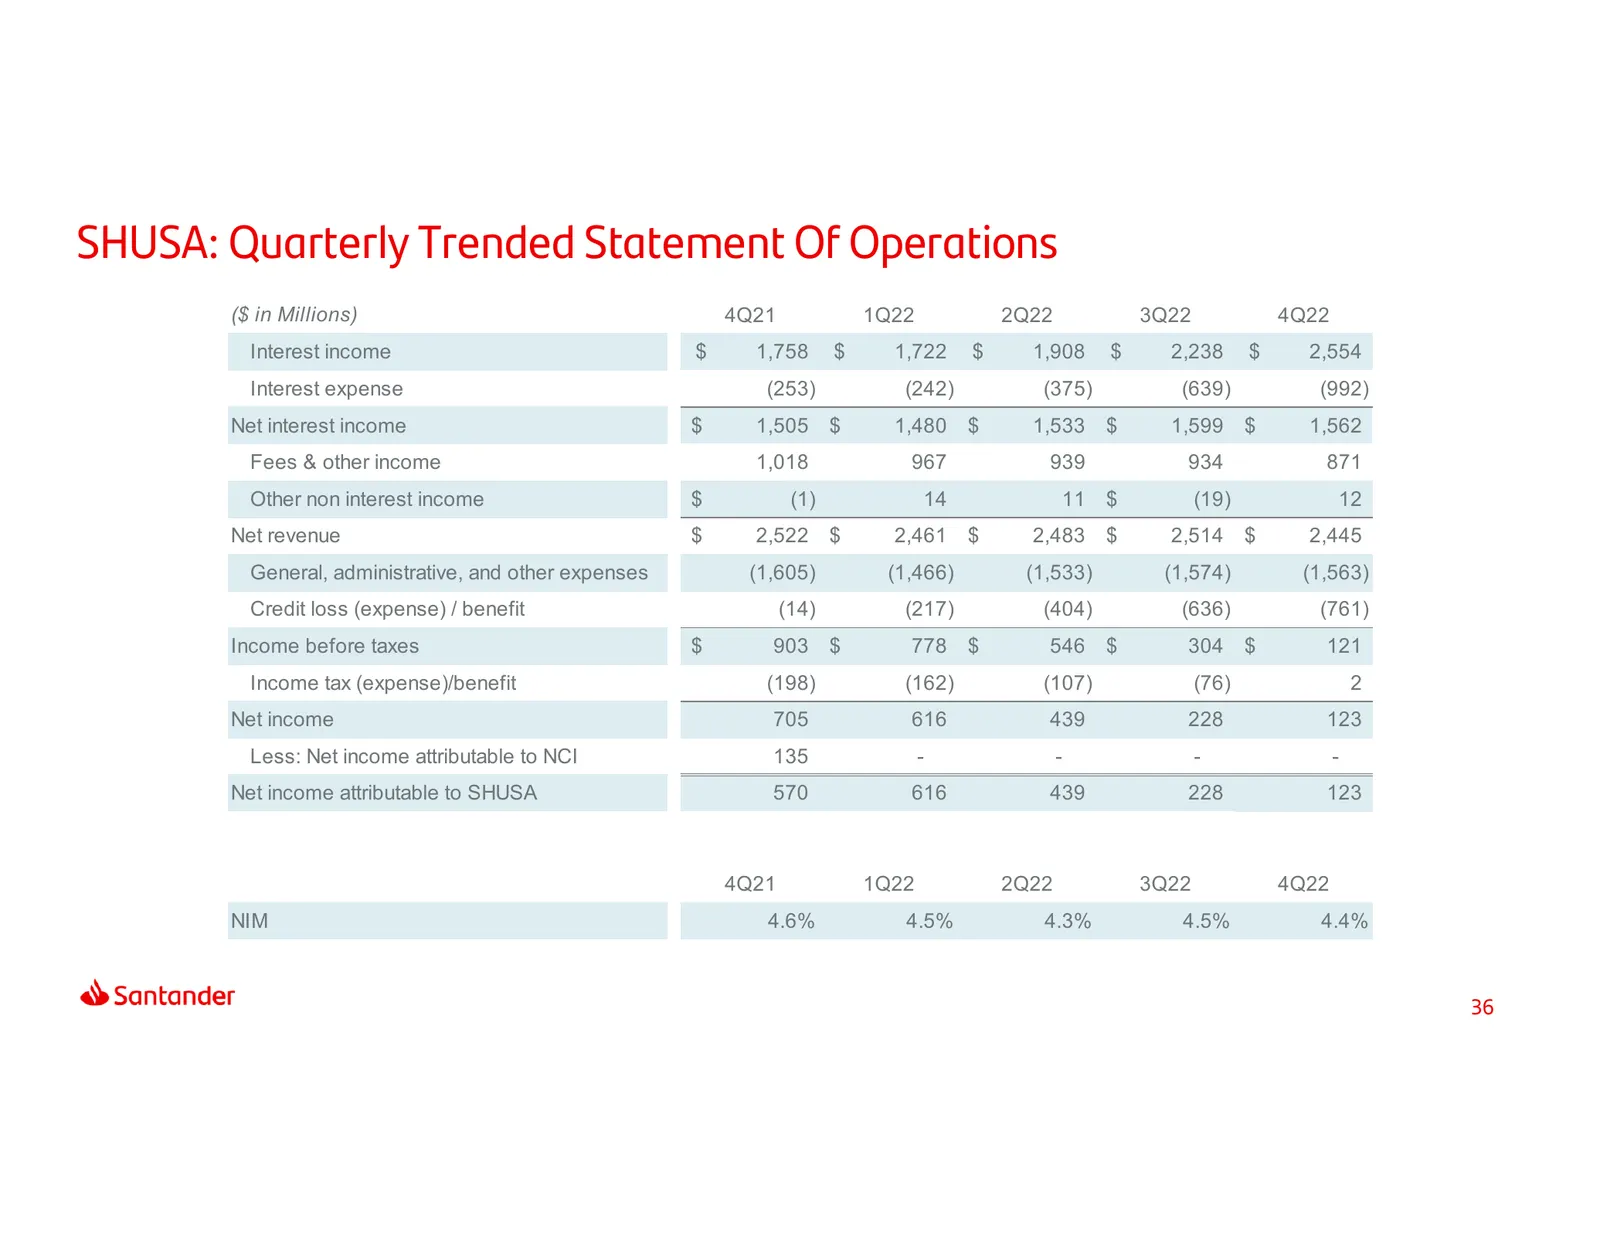
Slide 36: SHUSA: Quarterly Trended Statement Of Operations
SHUSA: Quarterly Trended Statement Of Operations ($ in Millions) 4Q21 1Q22 2Q22 3Q22 4Q22 Interest income $ 1,758 $ 1,722 $ 1,908 $ 2,238 $ 2,554 Interest expense (253) (242) (375) (639) (992) Net interest income $ 1,505 $ 1,480 $ 1,533 $ 1,599 $ 1,562 Fees & other income 1,018 967 939 934 871 Other
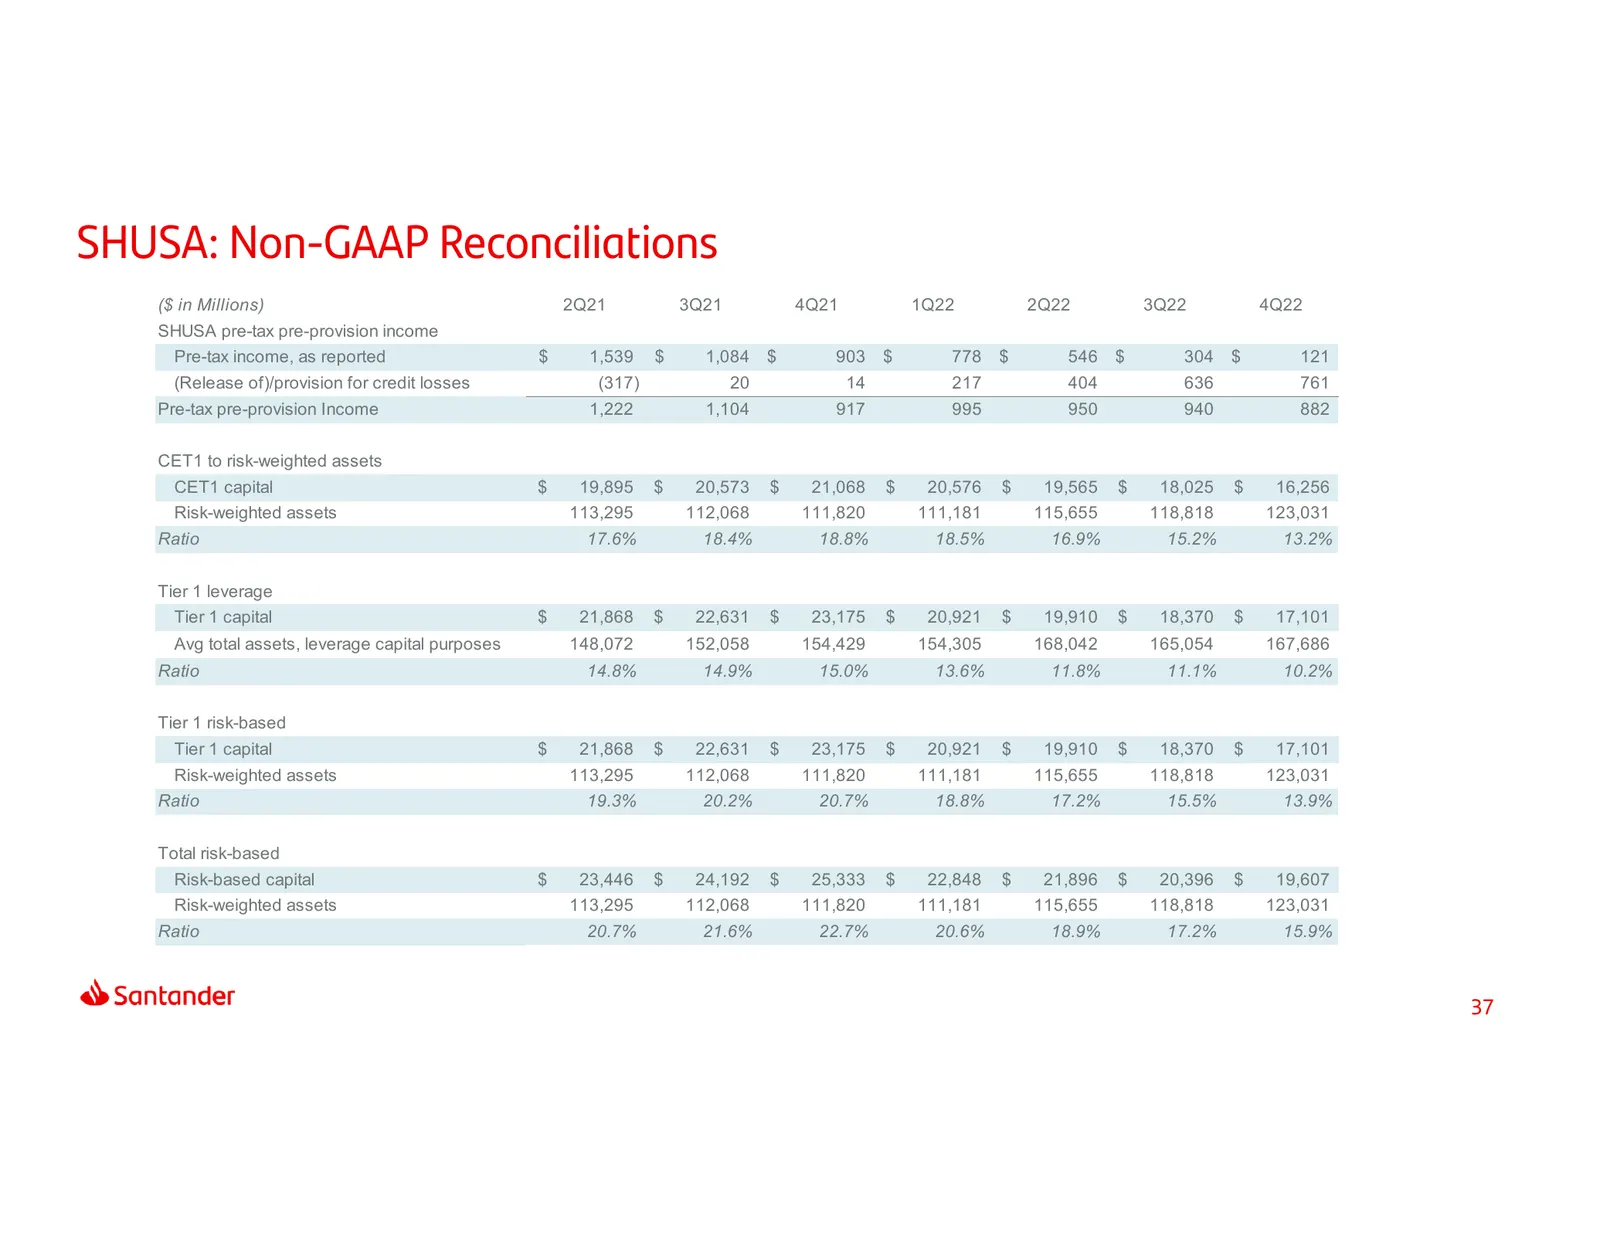
Slide 37: SHUSA: Non-GAAP Reconciliations
SHUSA: Non-GAAP Reconciliations ($ in Millions) 2Q21 3Q21 4Q21 1Q22 2Q22 3Q22 4Q22 SHUSA pre-tax pre-provision income Pre-tax income, as reported $ 1,539 $ 1,084 $ 903 $ 778 $ 546 $ 304 $ 121 (Release of)/provision for credit losses (317) 20 14 217 404 636 761 Pre-tax pre-provision Income 1,222 1,10
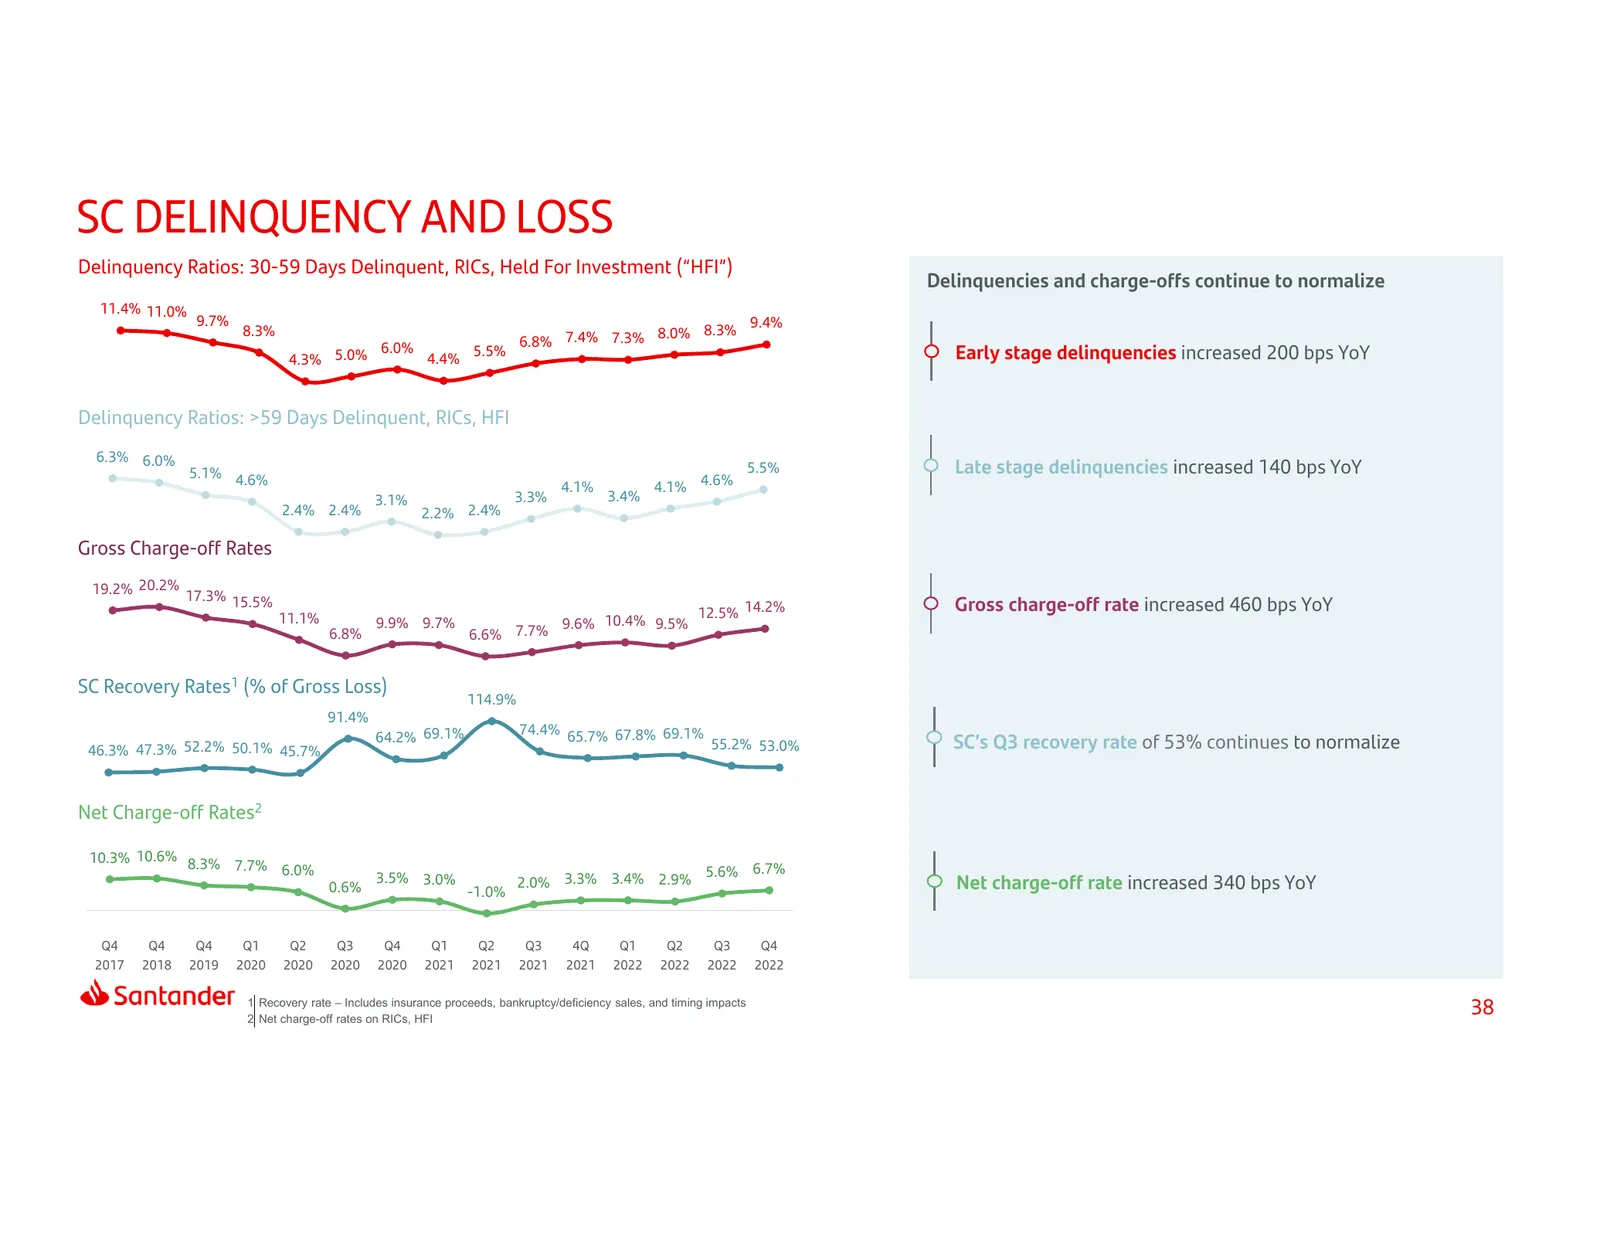
Slide 38: SC Delinquency and Loss
SC DELINQUENCY AND LOSS Delinquency Ratios: 30-59 Days Delinquent, RICs, Held For Investment (“HFI”) Delinquencies and charge-offs continue to normalize 11.4% 11.0% 9.7% 9.4% 8.3% 8.0% 8.3% 6.0% 6.8% 7.4% 7.3% 4.3% 5.0% 4.4% 5.5% Early stage delinquencies increased 200 bps YoY Delinquency Ratios: >5
Slide 39: Thank You.
Thank You. Our purpose is to help people and businesses prosper. Our culture is based on believing that everything we do should be:
Source: company website
More decks from Santander Holdings USA Inc
 Debt Investor Presentation (August 2026)30 slides · Aug 12, 2026
 Debt Investor Presentation (August 2026)30 slides · Aug 12, 2026
 Debt Investor Presentation (June 2026)29 slides · Jun 12, 2026
 Debt Investor Presentation (June 2026)29 slides · Jun 12, 2026
 Debt Investor Presentation (March 2026)36 slides · Mar 6, 2026
 Debt Investor Presentation (March 2026)36 slides · Mar 6, 2026