First Northwest Bancorp · NASDAQ:FNWB
First Northwest Bancorp — Investor Presentation (May 2020)
22 slides from First Northwest Bancorp's investor presentation, May 6, 2020
Slide 1: First Northwest Bancorp Investor Presentation
1020 INVESTOR PRESENTATION First Federal First Northwest Bancorp
Slide 2: Safe Harbor Statement
SAFE HARBOR STATEMENT This presentation contains forward-looking statements within the meaning of the Private Securities Litigation Reform Act of 1995. These statements are based on the current beliefs and expectations of First Northwest Bancorp’s management and on information available to First Nor
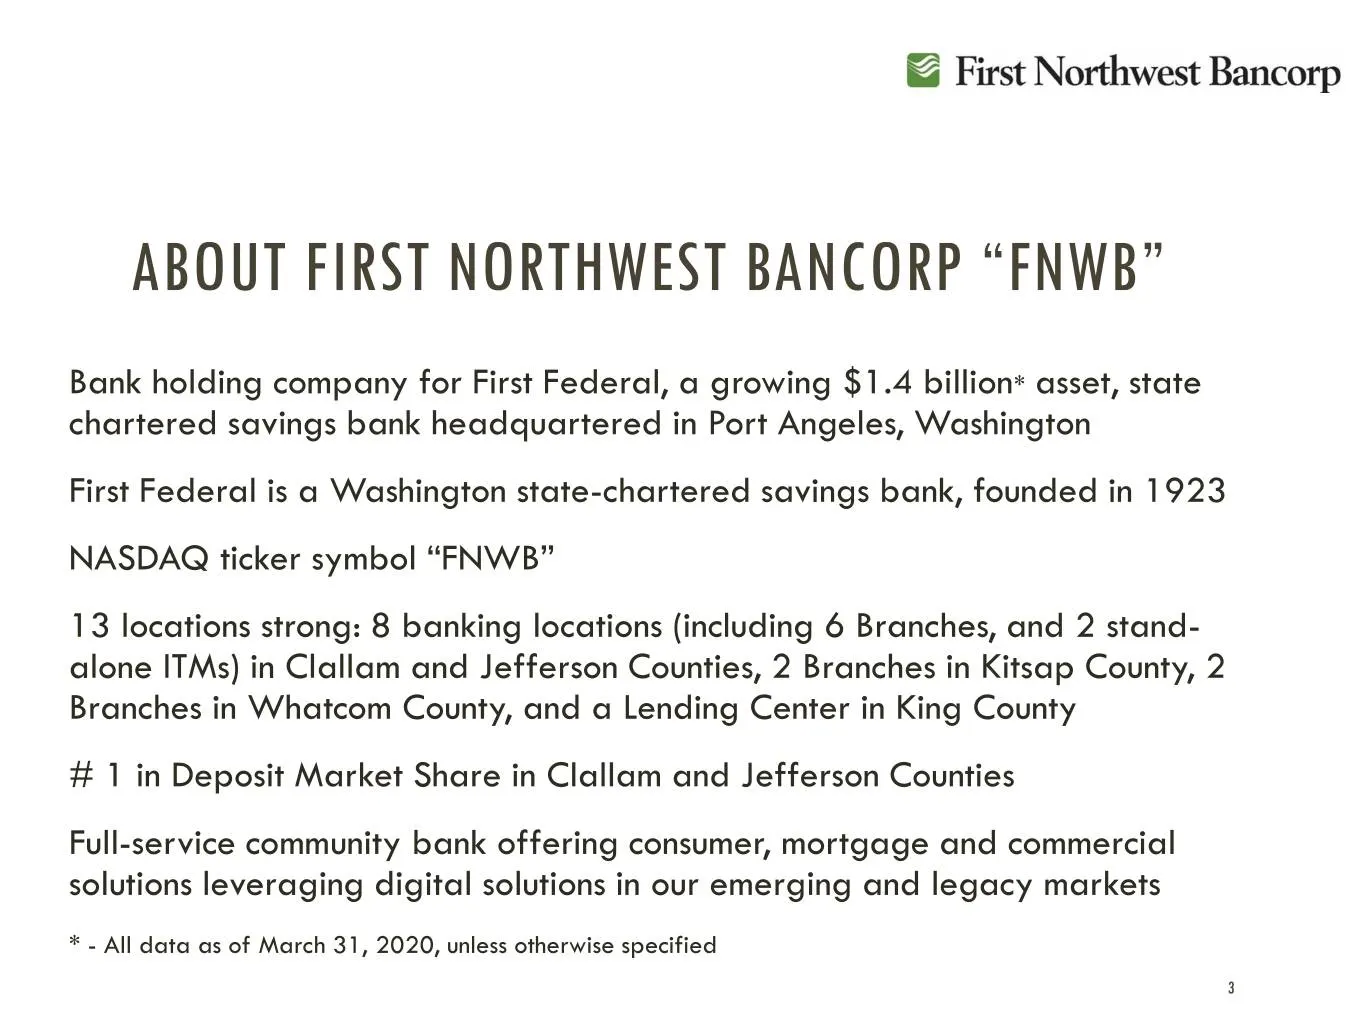
Slide 3: About First Northwest Bancorp "FNWB"
ABOUT FIRST NORTHWEST BANCORP “FNWB” Bank holding company for First Federal, a growing $1.4 billion* asset, state chartered savings bank headquartered in Port Angeles, Washington First Federal is a Washington state-chartered savings bank, founded in 1923 NASDAQ ticker symbol “FNWB” 13 locations stro
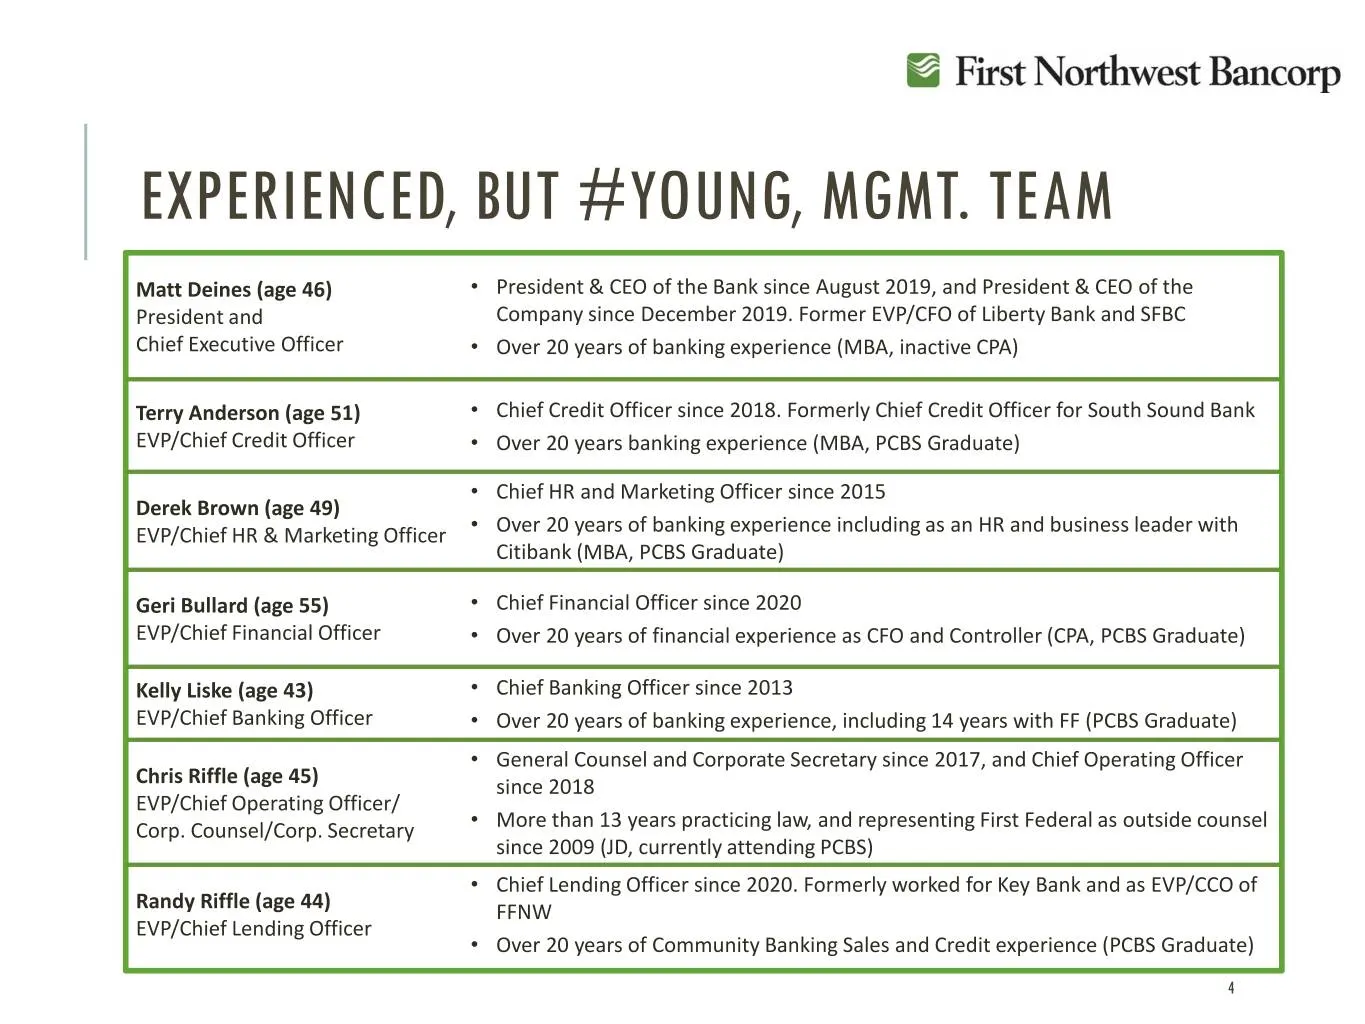
Slide 4: Experienced, but #Young, Management Team
EXPERIENCED, BUT #YOUNG, MGMT. TEAM Matt Deines (age 46) • President & CEO of the Bank since August 2019, and President & CEO of the President and Company since December 2019. Former EVP/CFO of Liberty Bank and SFBC Chief Executive Officer • Over 20 years of banking experience (MBA, inactive CPA) Te
Slide 5: Other Key Hires
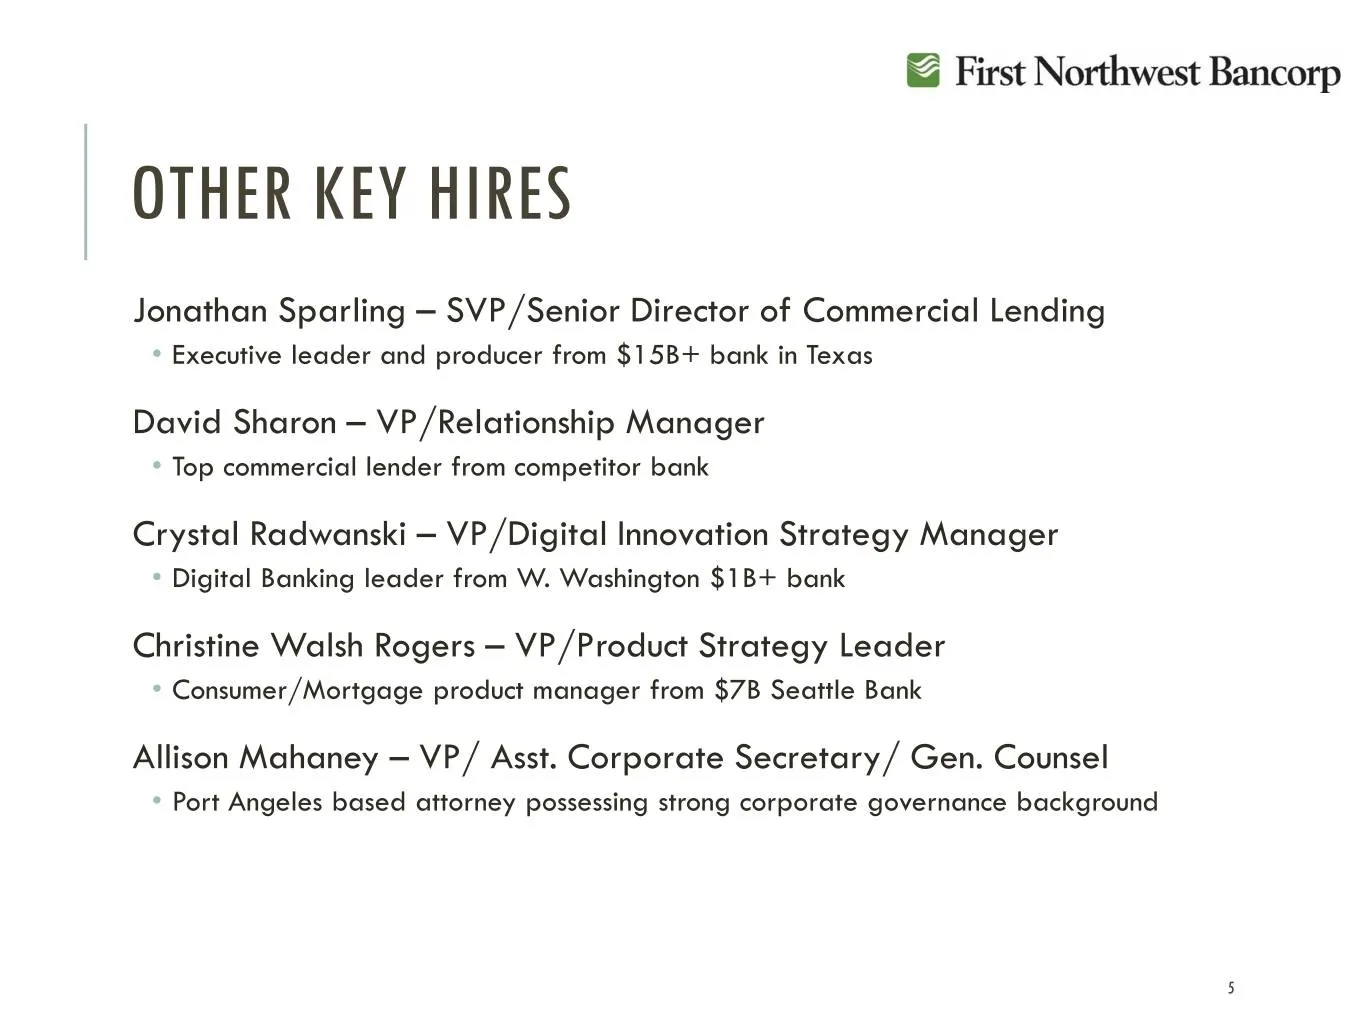
OTHER KEY HIRES Jonathan Sparling – SVP/Senior Director of Commercial Lending • Executive leader and producer from $15B+ bank in Texas David Sharon – VP/Relationship Manager • Top commercial lender from competitor bank Crystal Radwanski – VP/Digital Innovation Strategy Manager • Digital Banking lead
Slide 6: COVID – Response
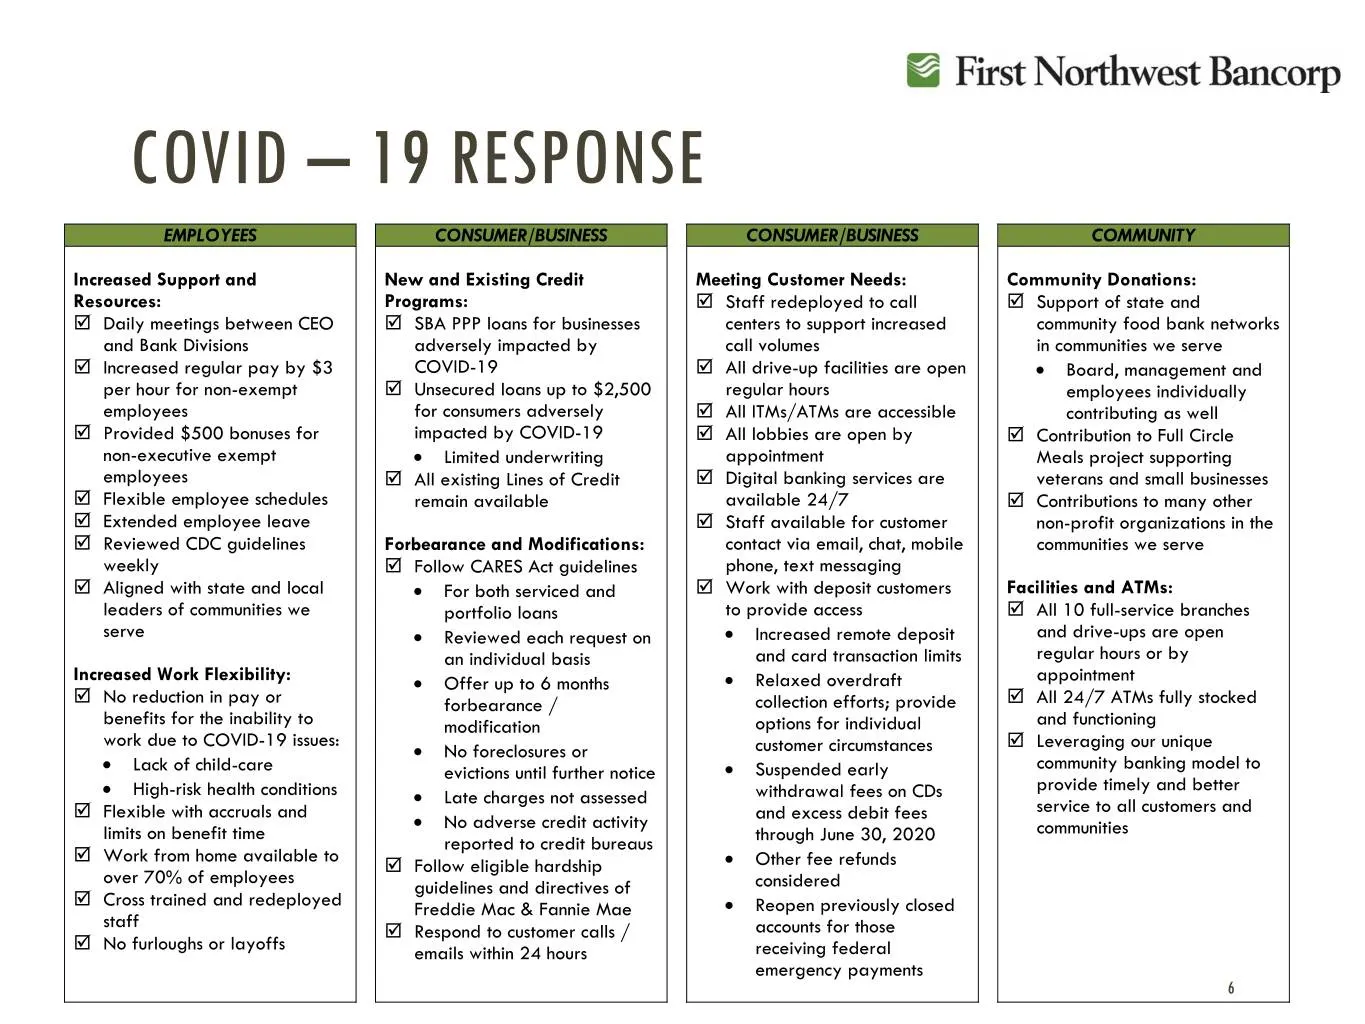
COVID – 19 RESPONSE EMPLOYEES CONSUMER/BUSINESS CONSUMER/BUSINESS COMMUNITY Increased Support and New and Existing Credit Meeting Customer Needs: Community Donations: Resources: Programs: Staff redeployed to call Support of state and Daily meetings between CEO SBA PPP loans for businesses ce
Slide 7: Capital and Liquidity
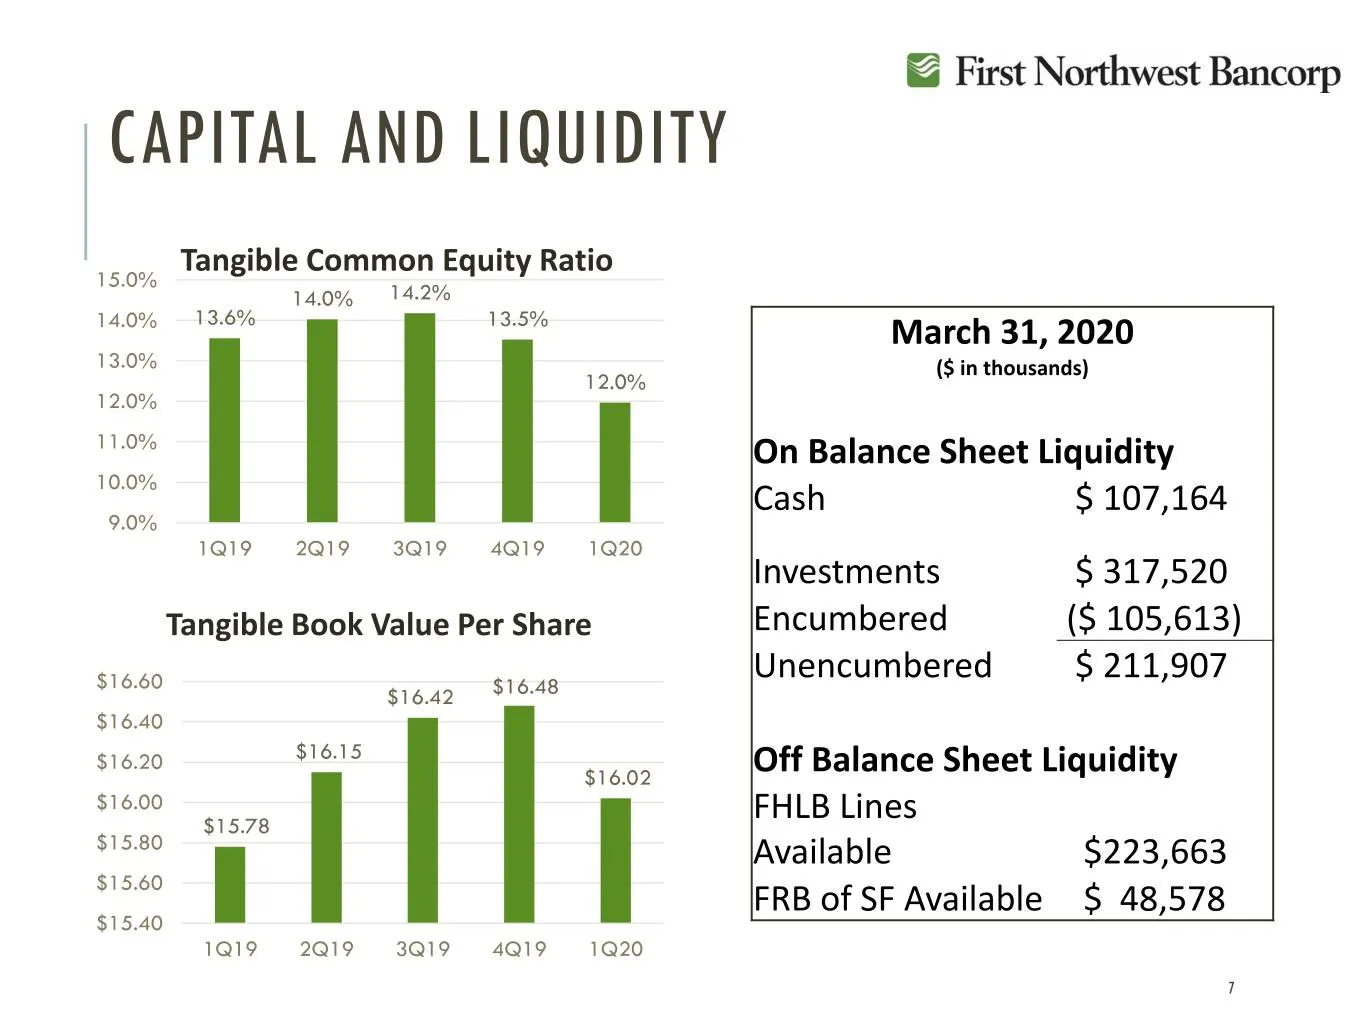
CAPITAL AND LIQUIDITY Tangible Common Equity Ratio 15.0% 14.0% 14.2% 14.0% 13.6% 13.5% March 31, 2020 13.0% ($ in thousands) 12.0% 12.0% 11.0% On Balance Sheet Liquidity 10.0% Cash $ 107,164 9.0% 1Q19 2Q19 3Q19 4Q19 1Q20 Investments $ 317,520 Tangible Book Value Per Share Encumbered ($ 105,613) $16.
Slide 8: High Risk Industry Concentrations
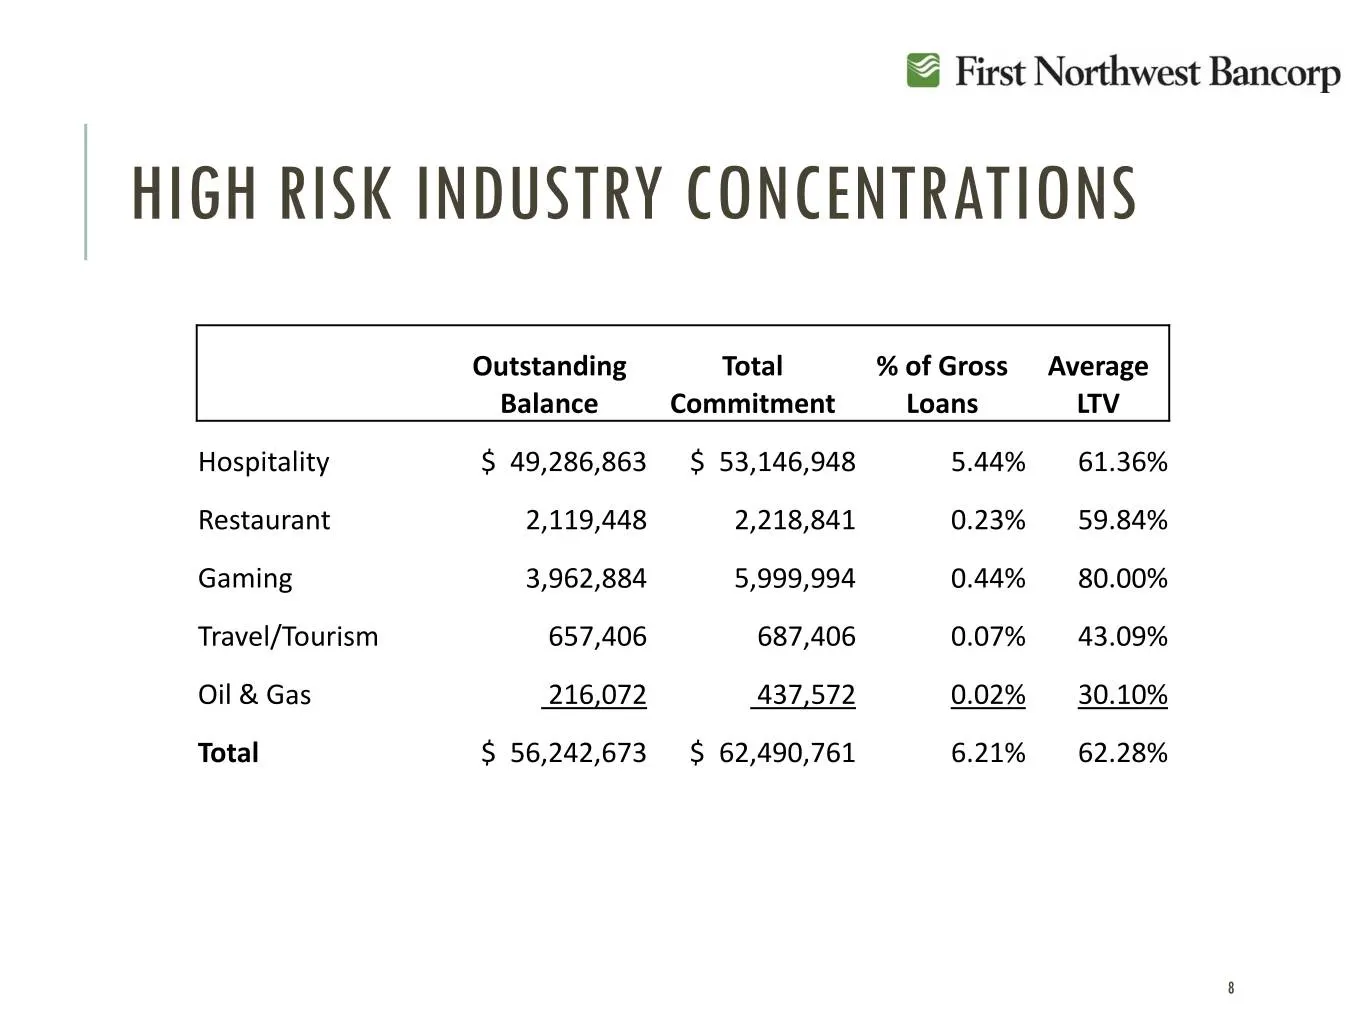
HIGH RISK INDUSTRY CONCENTRATIONS Outstanding Total % of Gross Average Balance Commitment Loans LTV Hospitality $ 49,286,863 $ 53,146,948 5.44% 61.36% Restaurant 2,119,448 2,218,841 0.23% 59.84% Gaming 3,962,884 5,999,994 0.44% 80.00% Travel/Tourism 657,406 687,406 0.07% 43.09% Oil & Gas 216,072 437
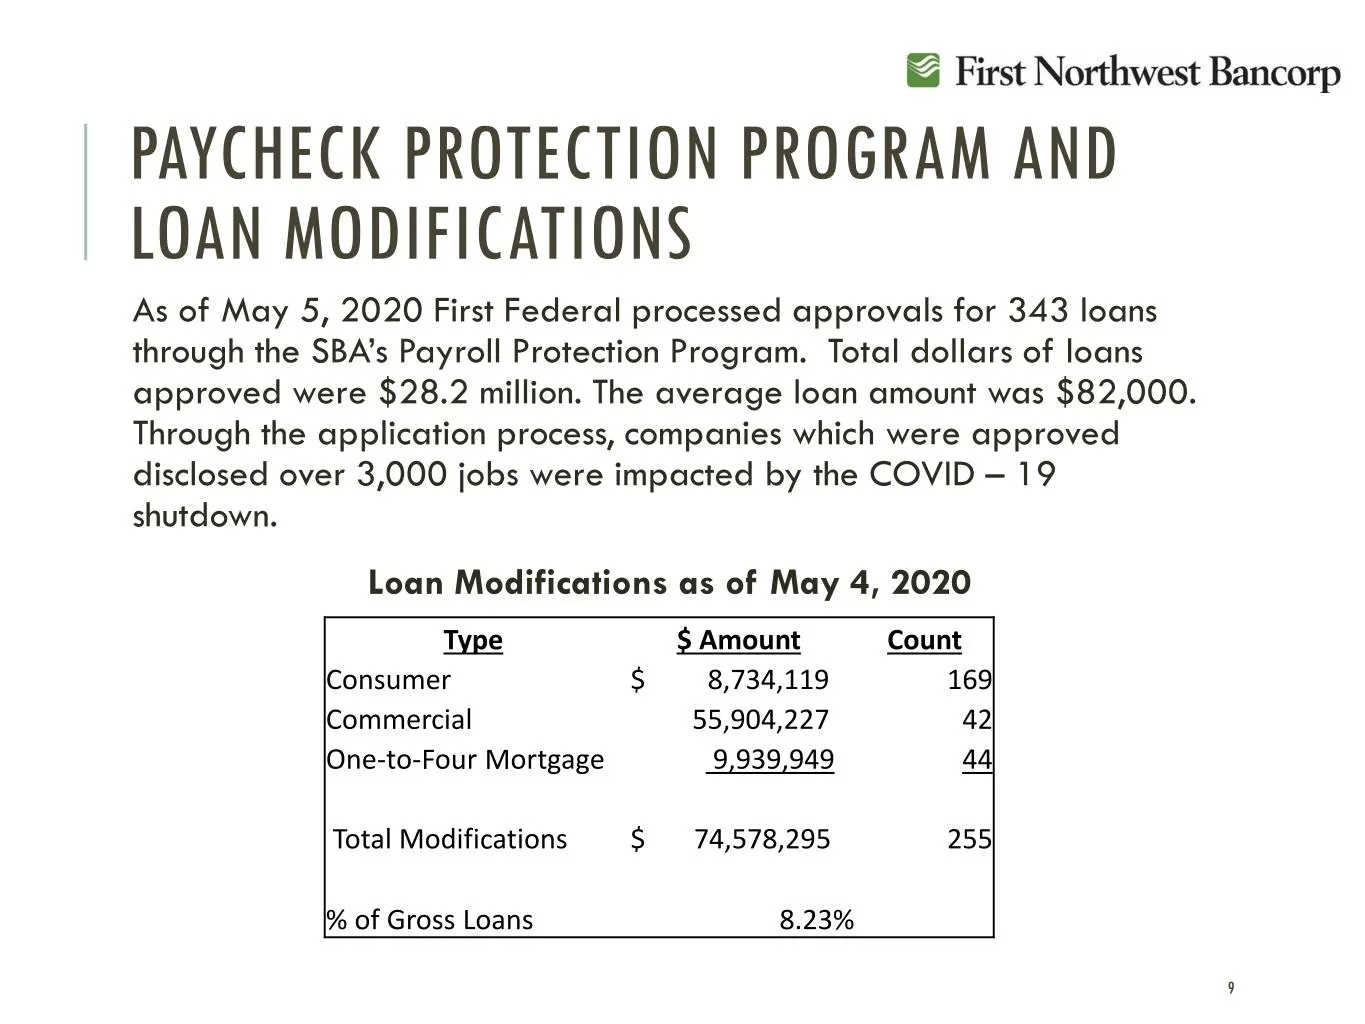
Slide 9: Paycheck Protection Program and Loan Modifications
PAYCHECK PROTECTION PROGRAM AND LOAN MODIFICATIONS As of May 5, 2020 First Federal processed approvals for 343 loans through the SBA’s Payroll Protection Program. Total dollars of loans approved were $28.2 million. The average loan amount was $82,000. Through the application process, companies which
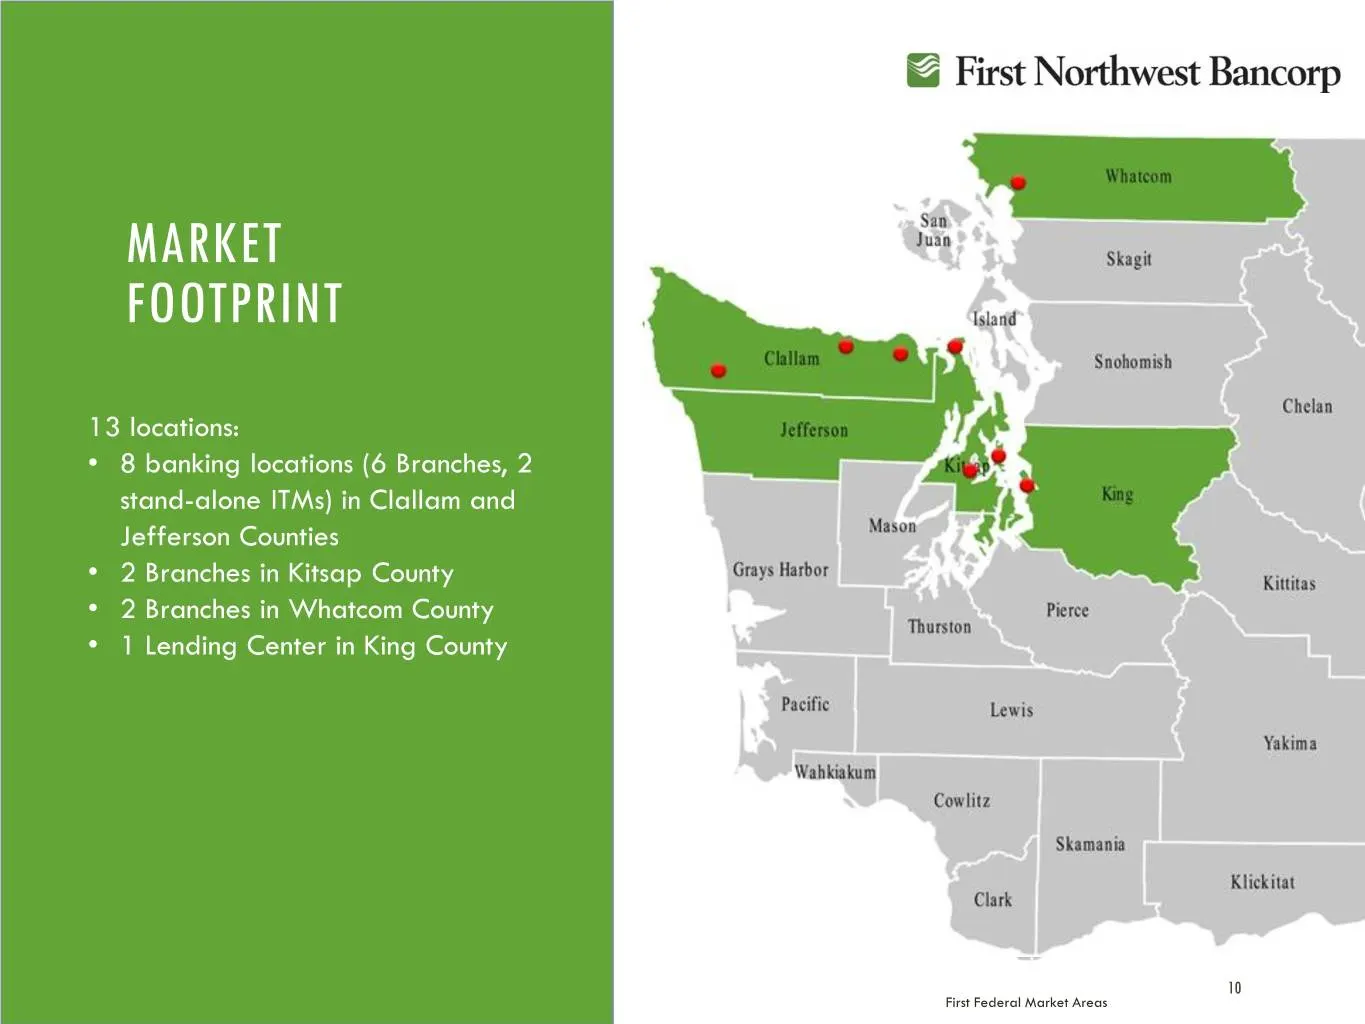
Slide 10: Market Branch Footprint
MARKET BRANCHFOOTPRINT FOOTPRINT 13• 6 locations: branches in Clallam and Jefferson • 8counties banking locations (6 Branches, 2 • stand2 branches-alone in KitsapITMs) Countyin Clallam and • 2 branches in Whatcom county • LendingJefferson center Counties in King county • Total2 Branches of 11 locati
Slide 11: Strategies for the Bank Today
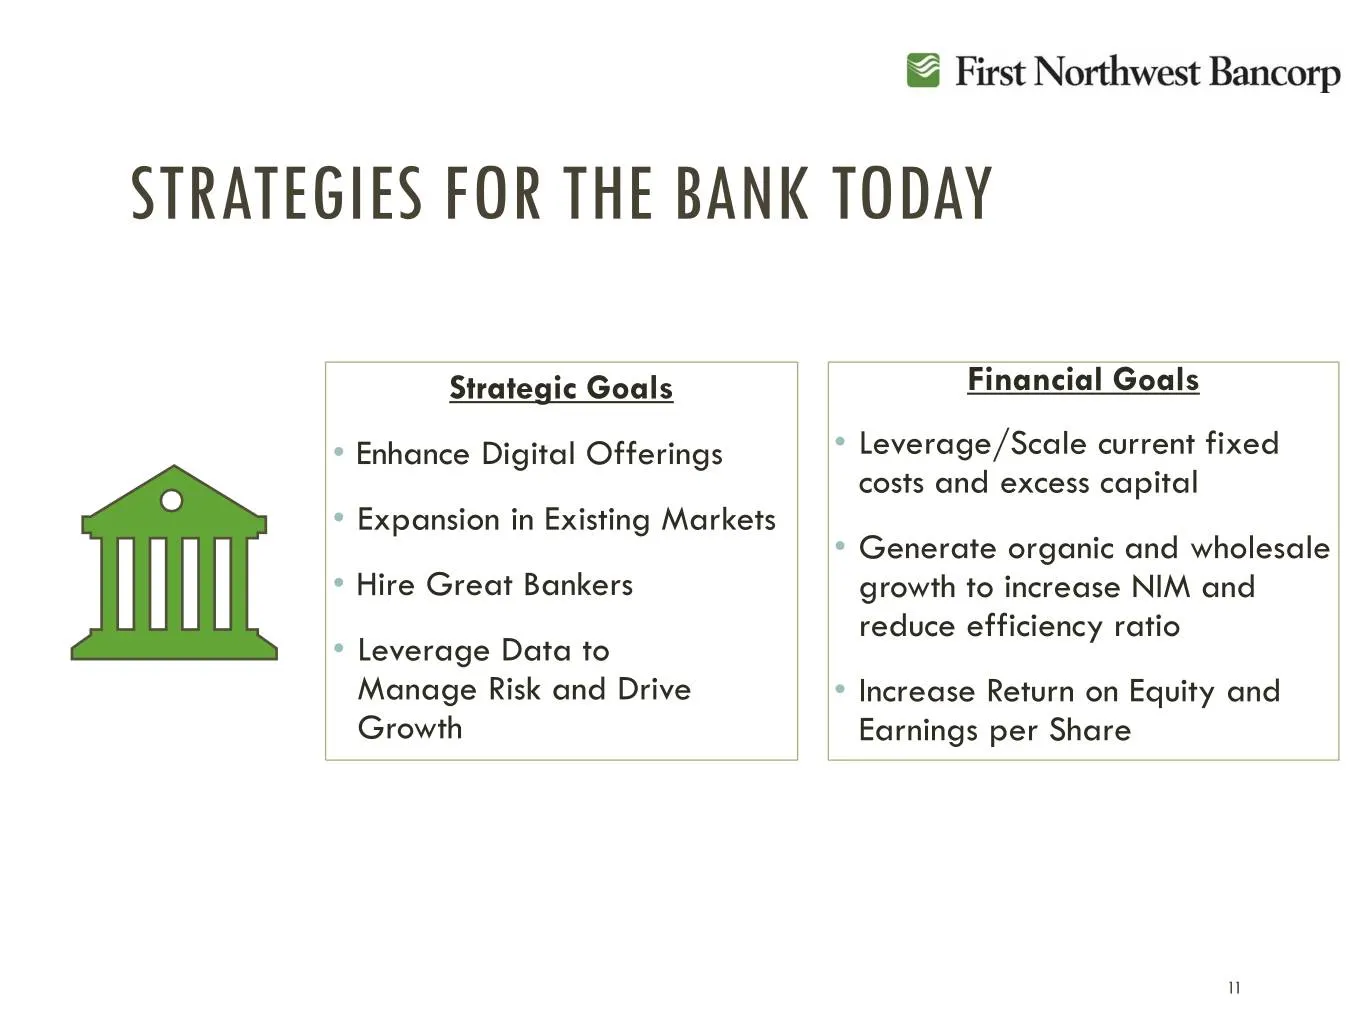
STRATEGIES FOR THE BANK TODAY Strategic Goals Financial Goals • Enhance Digital Offerings • Leverage/Scale current fixed costs and excess capital • Expansion in Existing Markets • Generate organic and wholesale • Hire Great Bankers growth to increase NIM and reduce efficiency ratio • Leverage Data t
Slide 12: Opportunity to Leverage
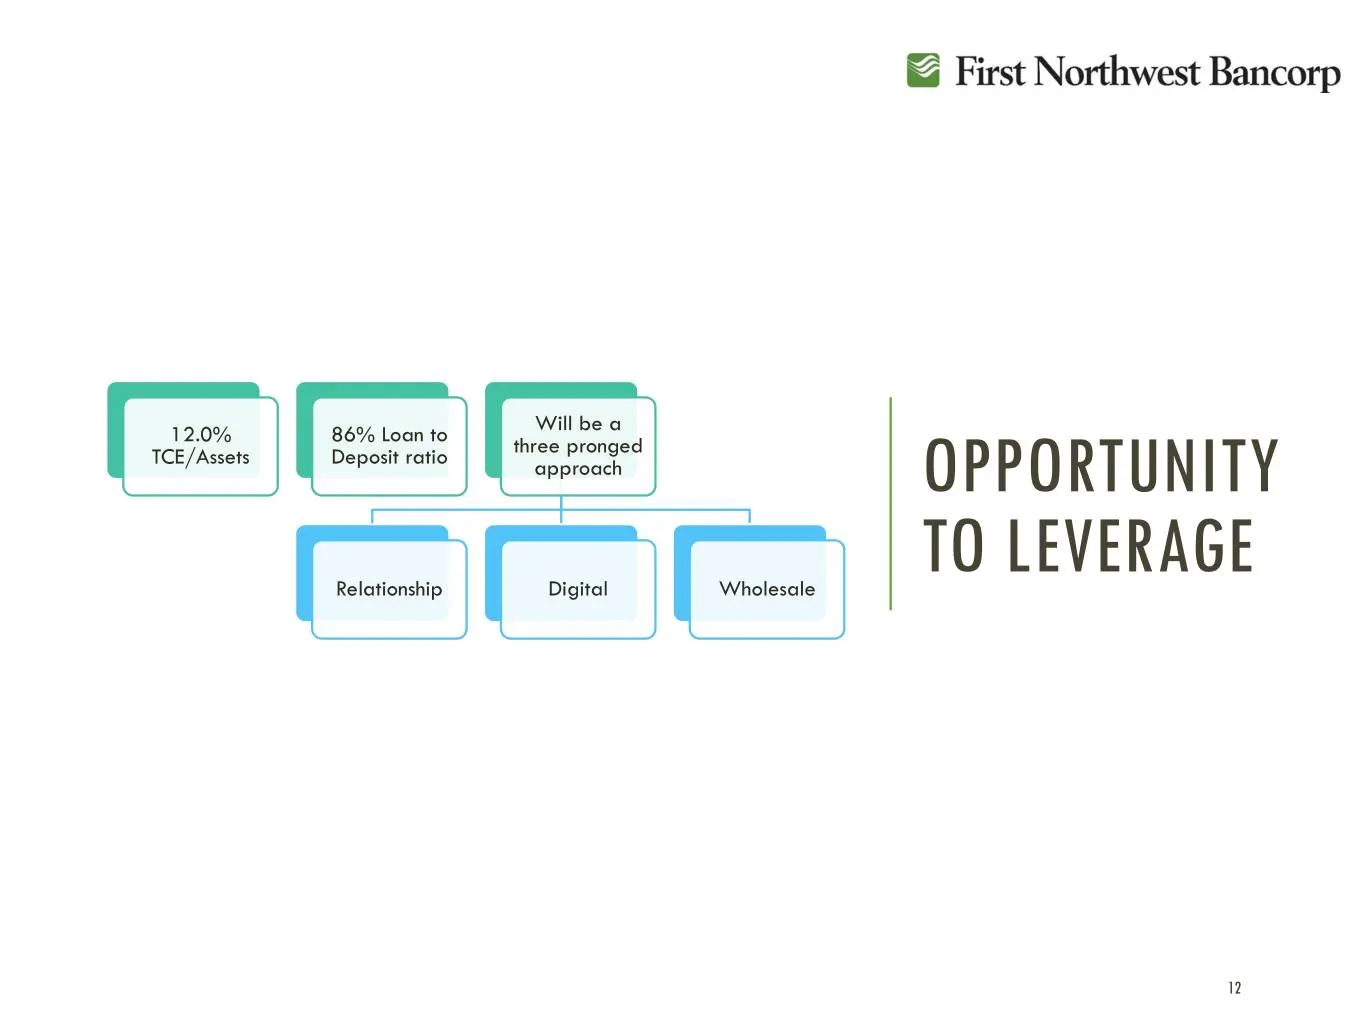
Will be a 12.0% 86% Loan to three pronged TCE/Assets Deposit ratio approach OPPORTUNITY TO LEVERAGE Relationship Digital Wholesale 12
Slide 13: Q1 2020 Financial Highlights
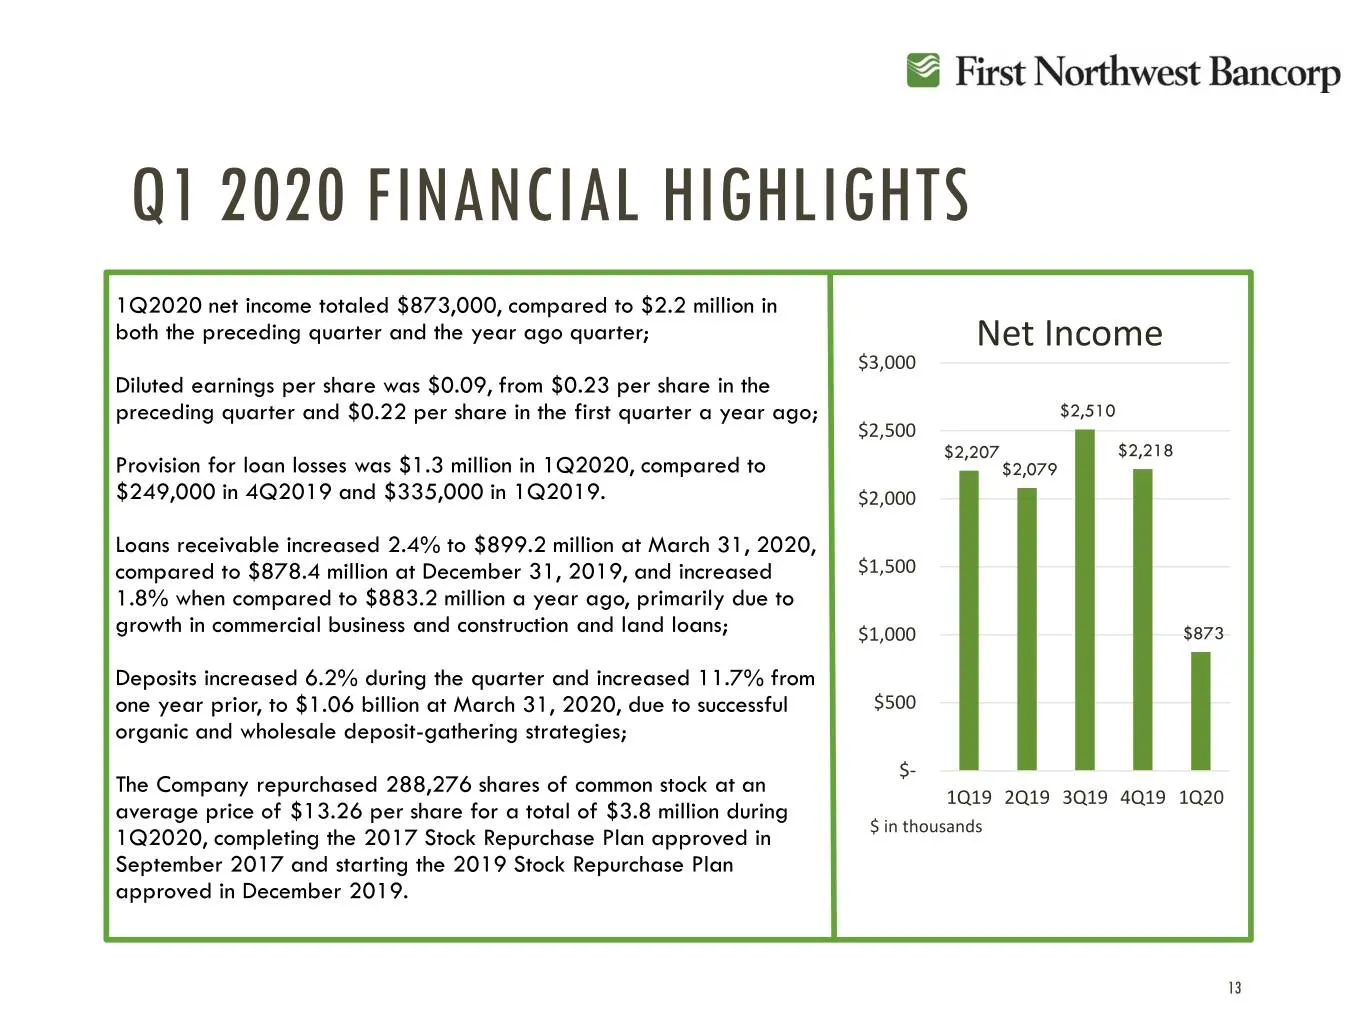
Q1 2020 FINANCIAL HIGHLIGHTS 1Q2020 net income totaled $873,000, compared to $2.2 million in both the preceding quarter and the year ago quarter; Net Income $3,000 Diluted earnings per share was $0.09, from $0.23 per share in the preceding quarter and $0.22 per share in the first quarter a year ago;
Slide 14: Balance Sheet
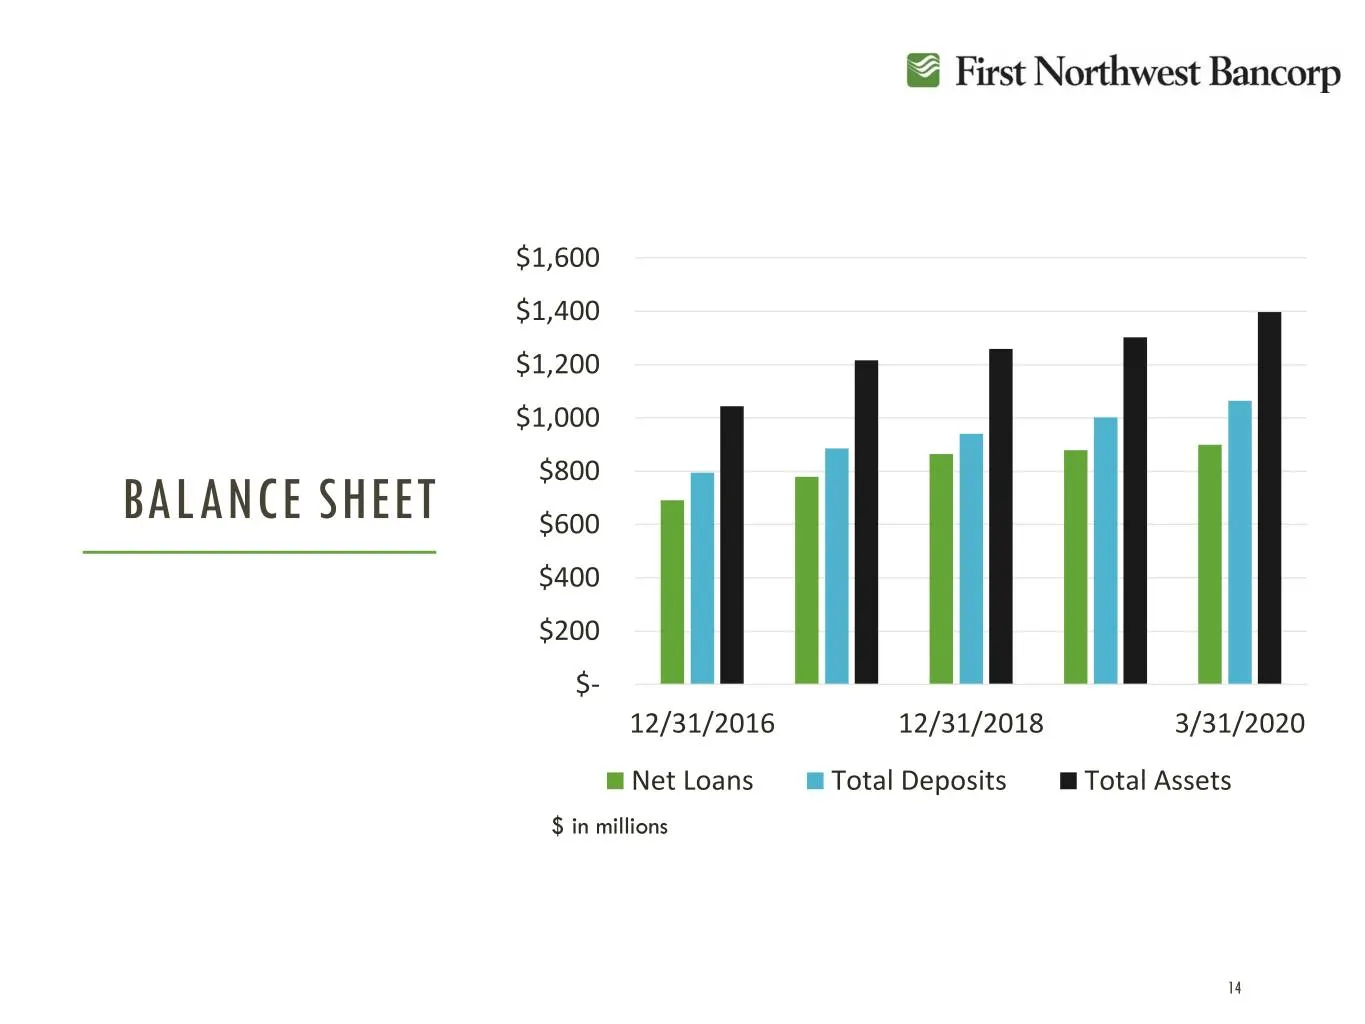
$1,600 $1,400 $1,200 $1,000 $800 BALANCE SHEET $600 $400 $200 $- 12/31/2016 12/31/2018 3/31/2020 Net Loans Total Deposits Total Assets $ in millions 14
Slide 15: Diversified Loan Portfolio
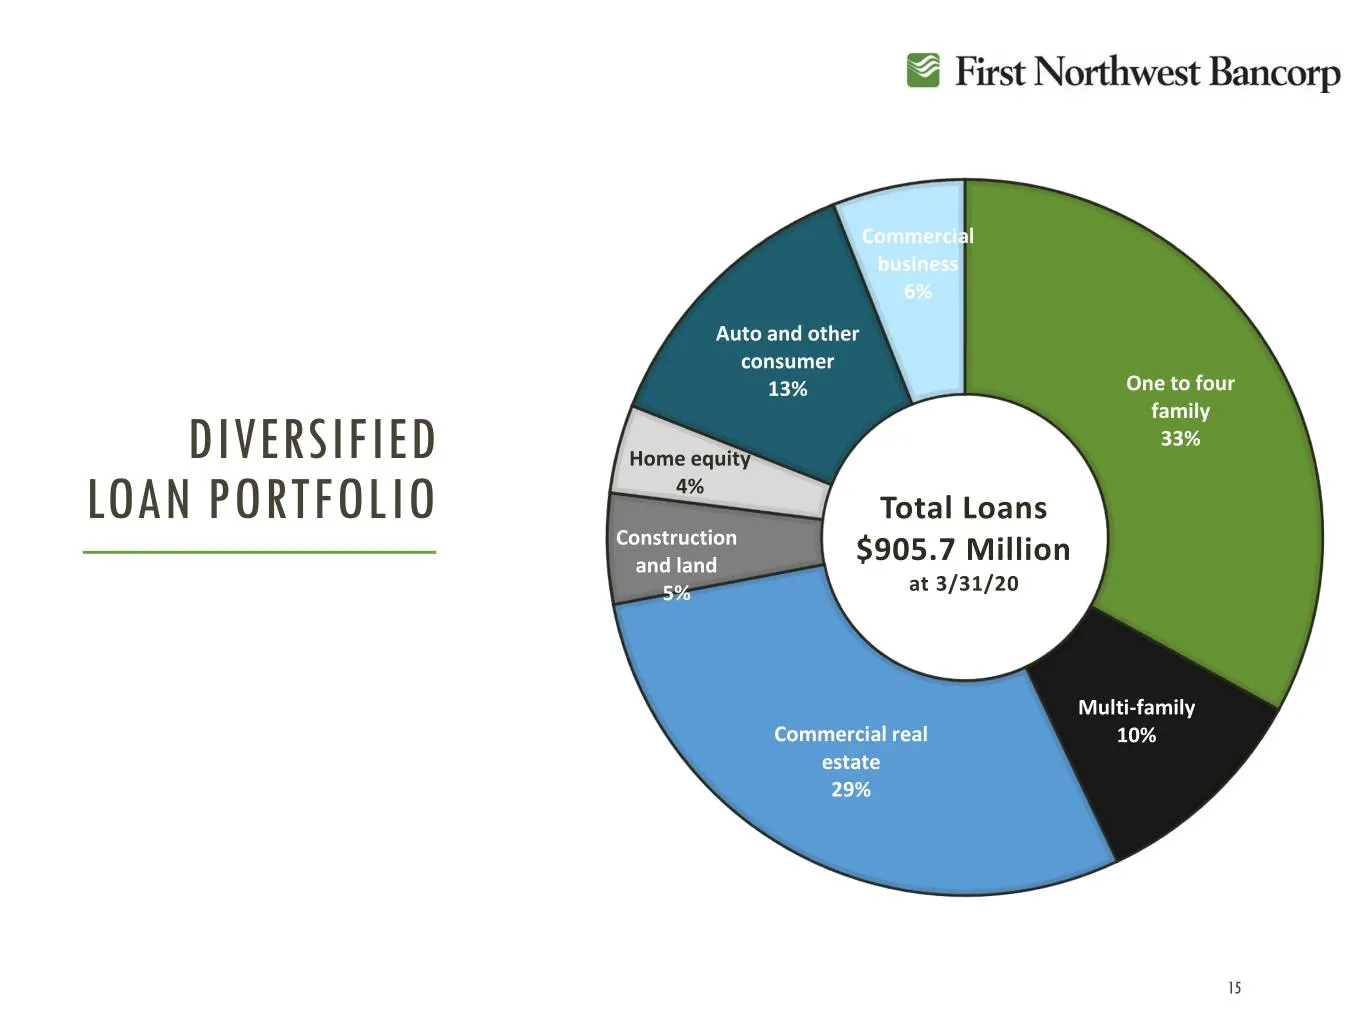
Commercial business 6% Auto and other consumer 13% One to four family 33% DIVERSIFIED Home equity 4% LOAN PORTFOLIO Total Loans Construction and land $905.7 Million 5% at 3/31/20 Multi-family Commercial real 10% estate 29% 15
Slide 16: Deposit Portfolio
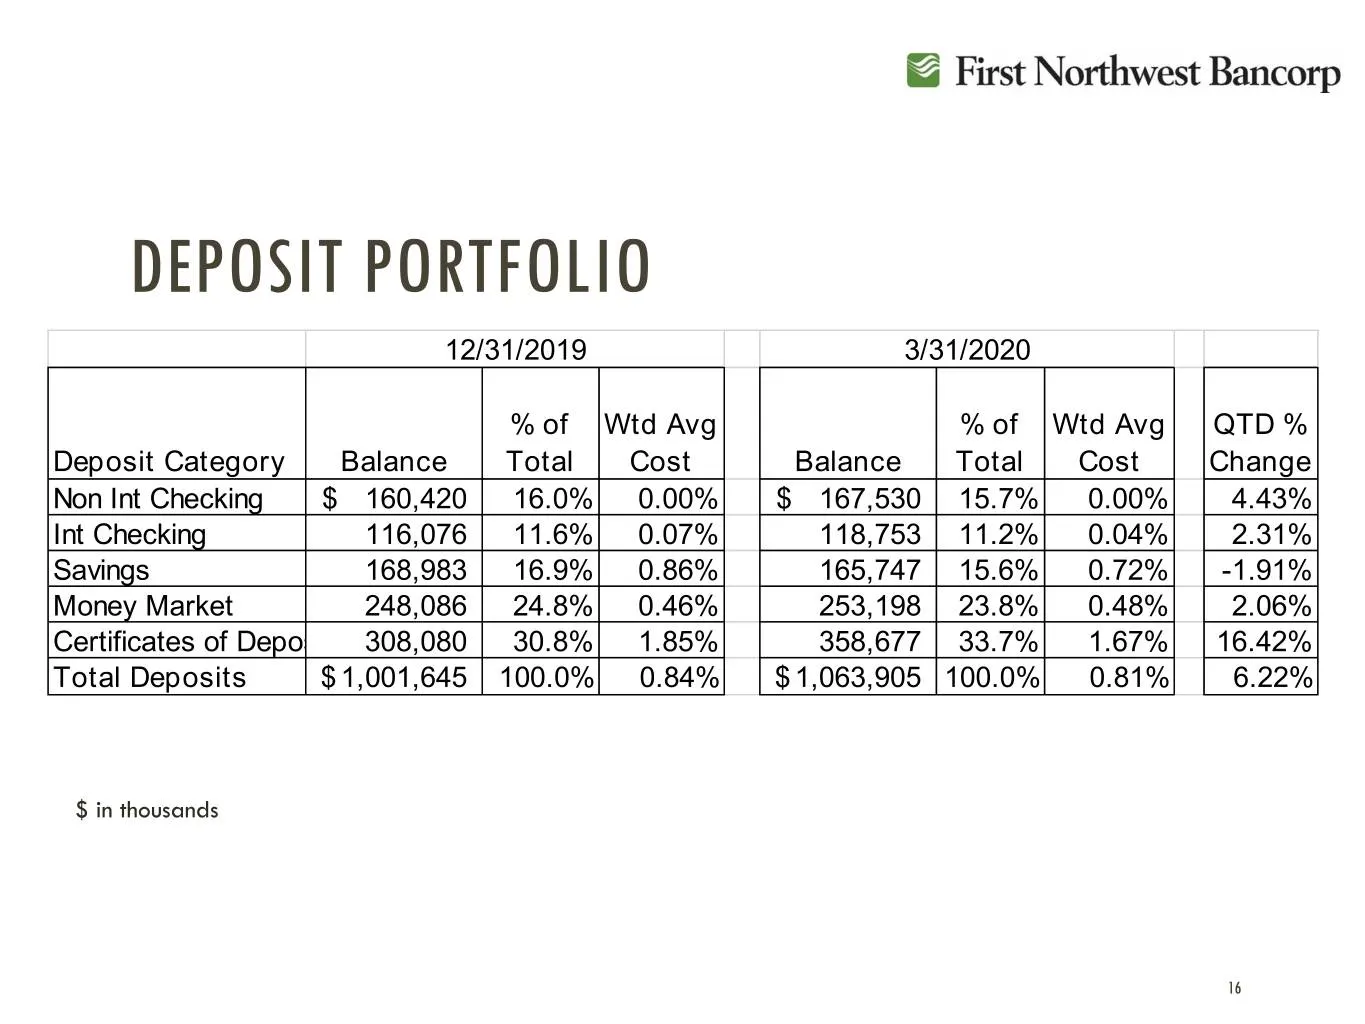
DEPOSIT PORTFOLIO 12/31/2019 3/31/2020 % of Wtd Avg % of Wtd Avg QTD % Deposit Category Balance Total Cost Balance Total Cost Change Non Int Checking $ 160,420 16.0% 0.00% $ 167,530 15.7% 0.00% 4.43% Int Checking 116,076 11.6% 0.07% 118,753 11.2% 0.04% 2.31% Savings 168,983 16.9% 0.86% 165,747 15.6%
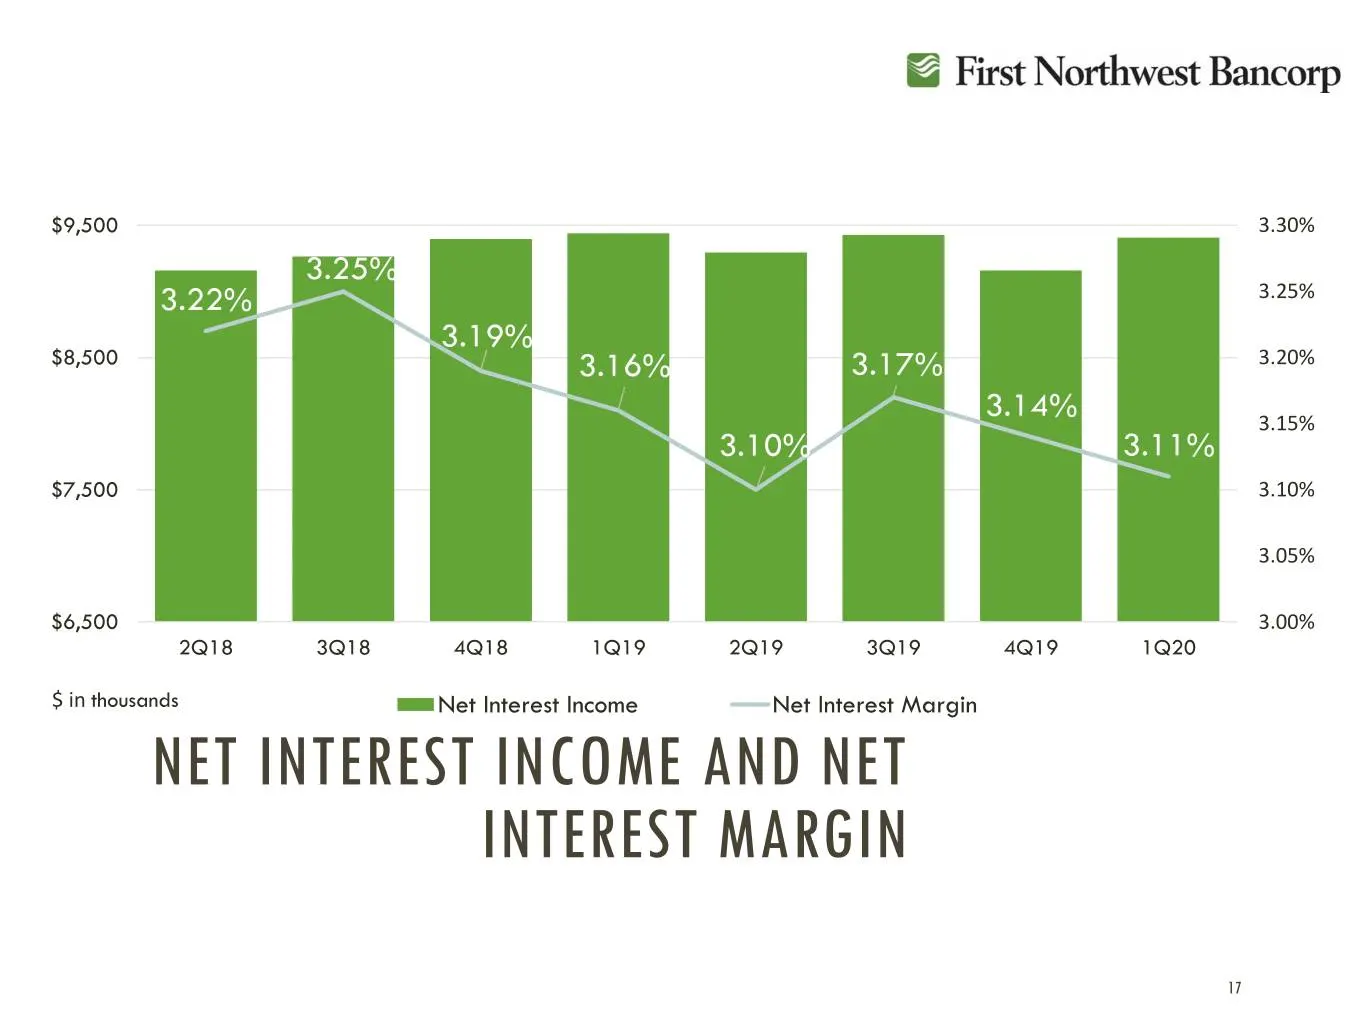
Slide 17: Net Interest Income and Net Interest Margin
$9,500 3.30% 3.25% 3.22% 3.25% 3.19% $8,500 3.16% 3.17% 3.20% 3.14% 3.15% 3.10% 3.11% $7,500 3.10% 3.05% $6,500 3.00% 2Q18 3Q18 4Q18 1Q19 2Q19 3Q19 4Q19 1Q20 $ in thousands Net Interest Income Net Interest Margin NET INTEREST INCOME AND NET INTEREST MARGIN 17
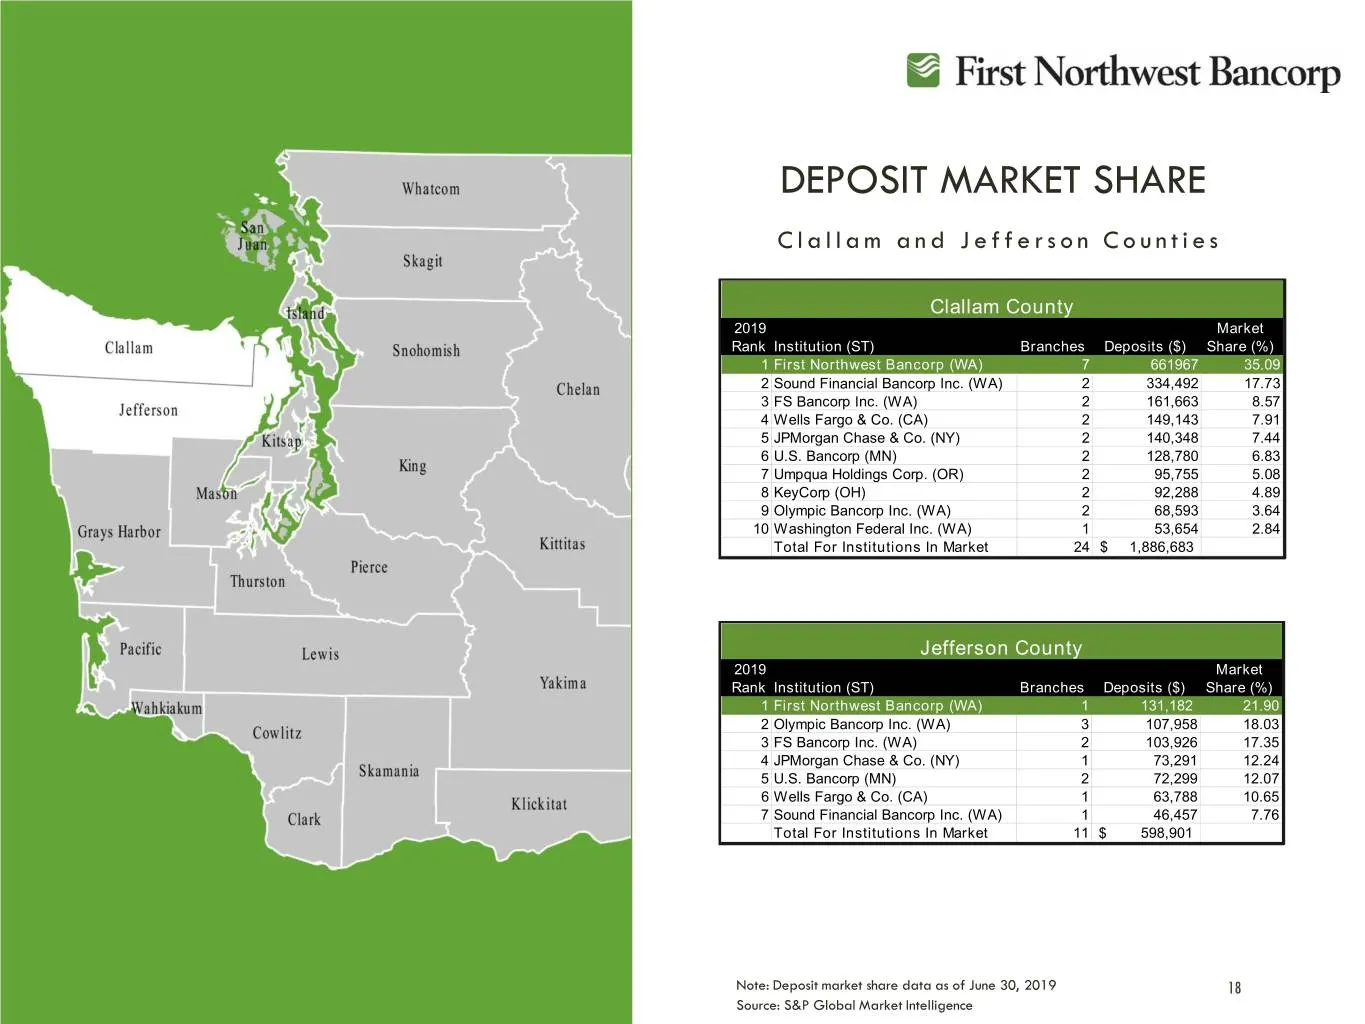
Slide 18: Deposit Market Share: Clallam and Jefferson Counties
DEPOSIT MARKET SHARE Clallam and Jefferson Counties Clallam County 2019 Market Rank Institution (ST) Branches Deposits ($) Share (%) 1 First Northwest Bancorp (WA) 7 661967 35.09 2 Sound Financial Bancorp Inc. (WA) 2 334,492 17.73 3 FS Bancorp Inc. (WA) 2 161,663 8.57 4 Wells Fargo & Co. (CA) 2 149,
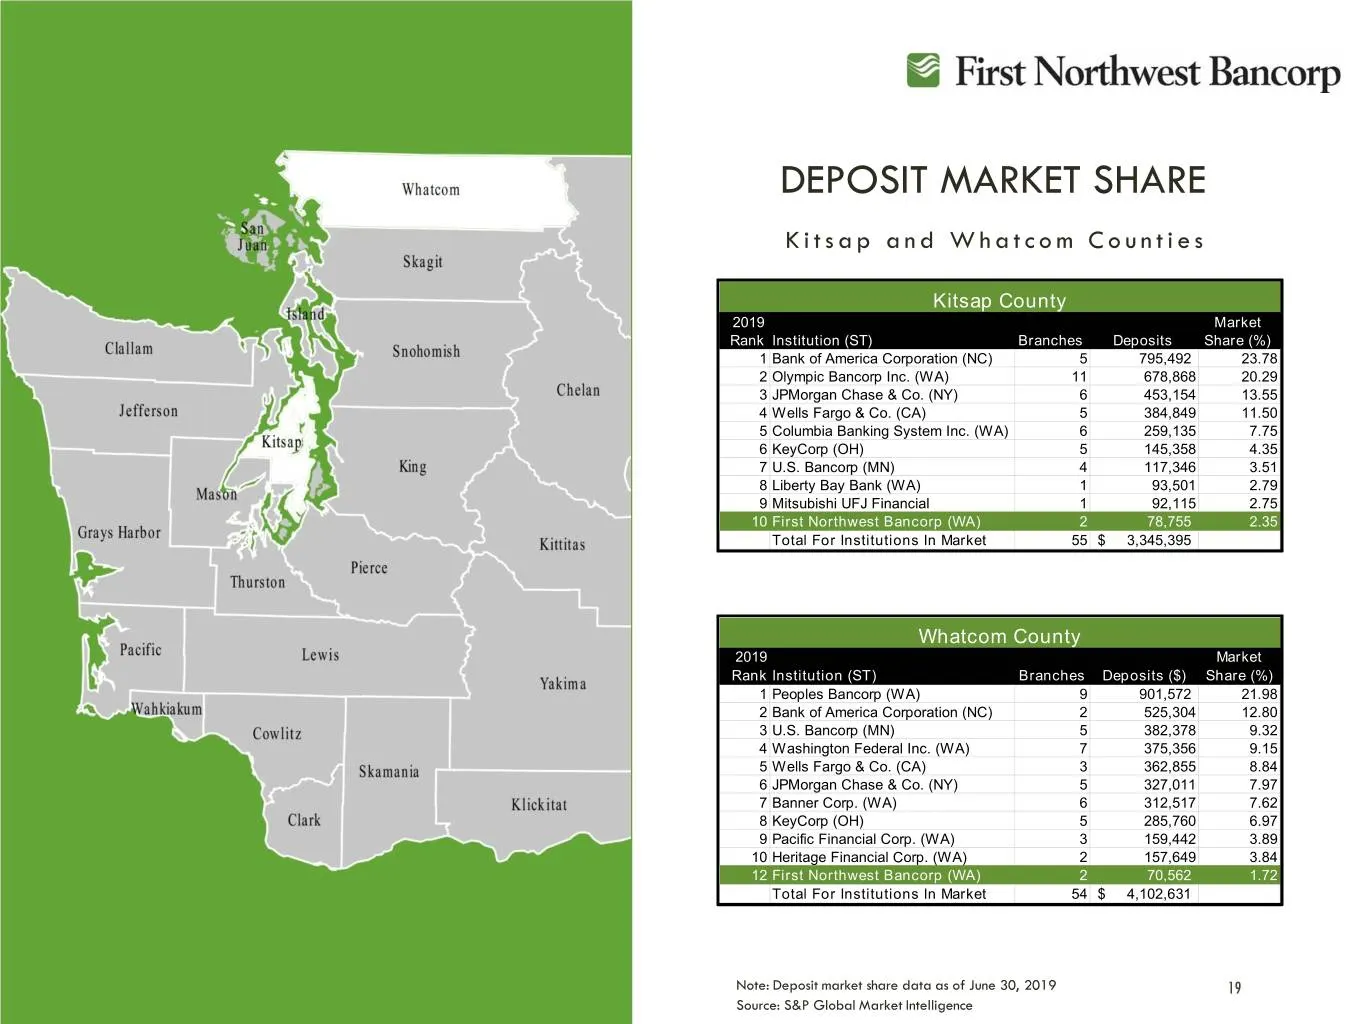
Slide 19: Deposit Market Share: Kitsap and Whatcom Counties
DEPOSIT MARKET SHARE Kitsap and Whatcom Counties Kitsap County 2019 Market Rank Institution (ST) Branches Deposits Share (%) 1 Bank of America Corporation (NC) 5 795,492 23.78 2 Olympic Bancorp Inc. (WA) 11 678,868 20.29 3 JPMorgan Chase & Co. (NY) 6 453,154 13.55 4 Wells Fargo & Co. (CA) 5 384,849
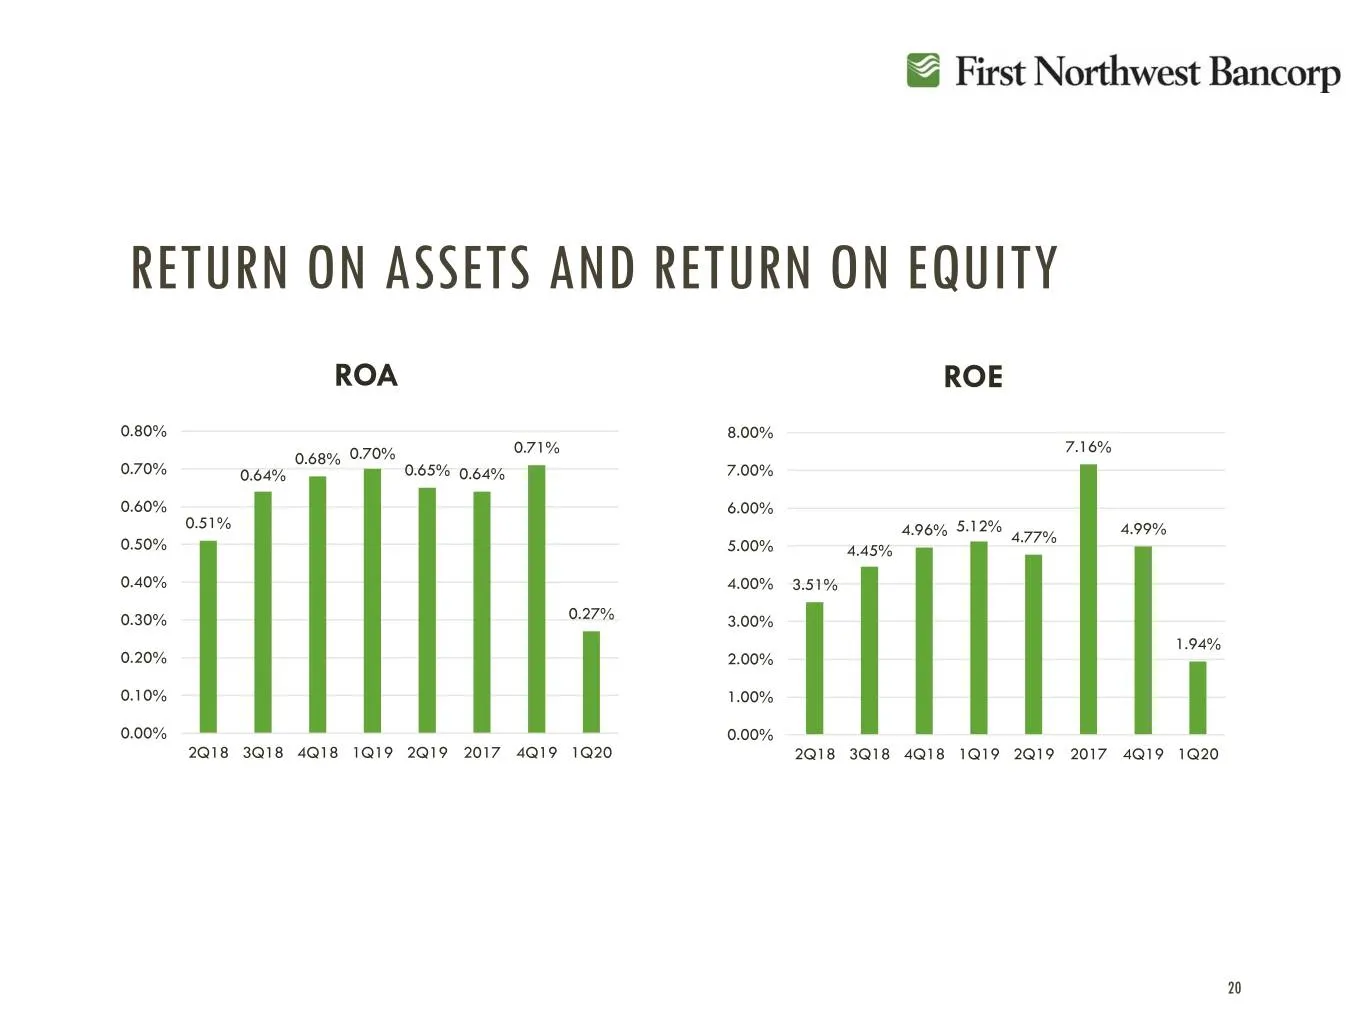
Slide 20: Return on Assets and Return on Equity
RETURN ON ASSETS AND RETURN ON EQUITY ROA ROE 0.80% 8.00% 0.71% 7.16% 0.68% 0.70% 0.70% 0.64% 0.65% 0.64% 7.00% 0.60% 6.00% 0.51% 5.12% 4.96% 4.77% 4.99% 0.50% 5.00% 4.45% 0.40% 4.00% 3.51% 0.30% 0.27% 3.00% 1.94% 0.20% 2.00% 0.10% 1.00% 0.00% 0.00% 2Q18 3Q18 4Q18 1Q19 2Q19 2017 4Q19 1Q20 2Q18 3Q18
Slide 21: Financial Goals and Objectives
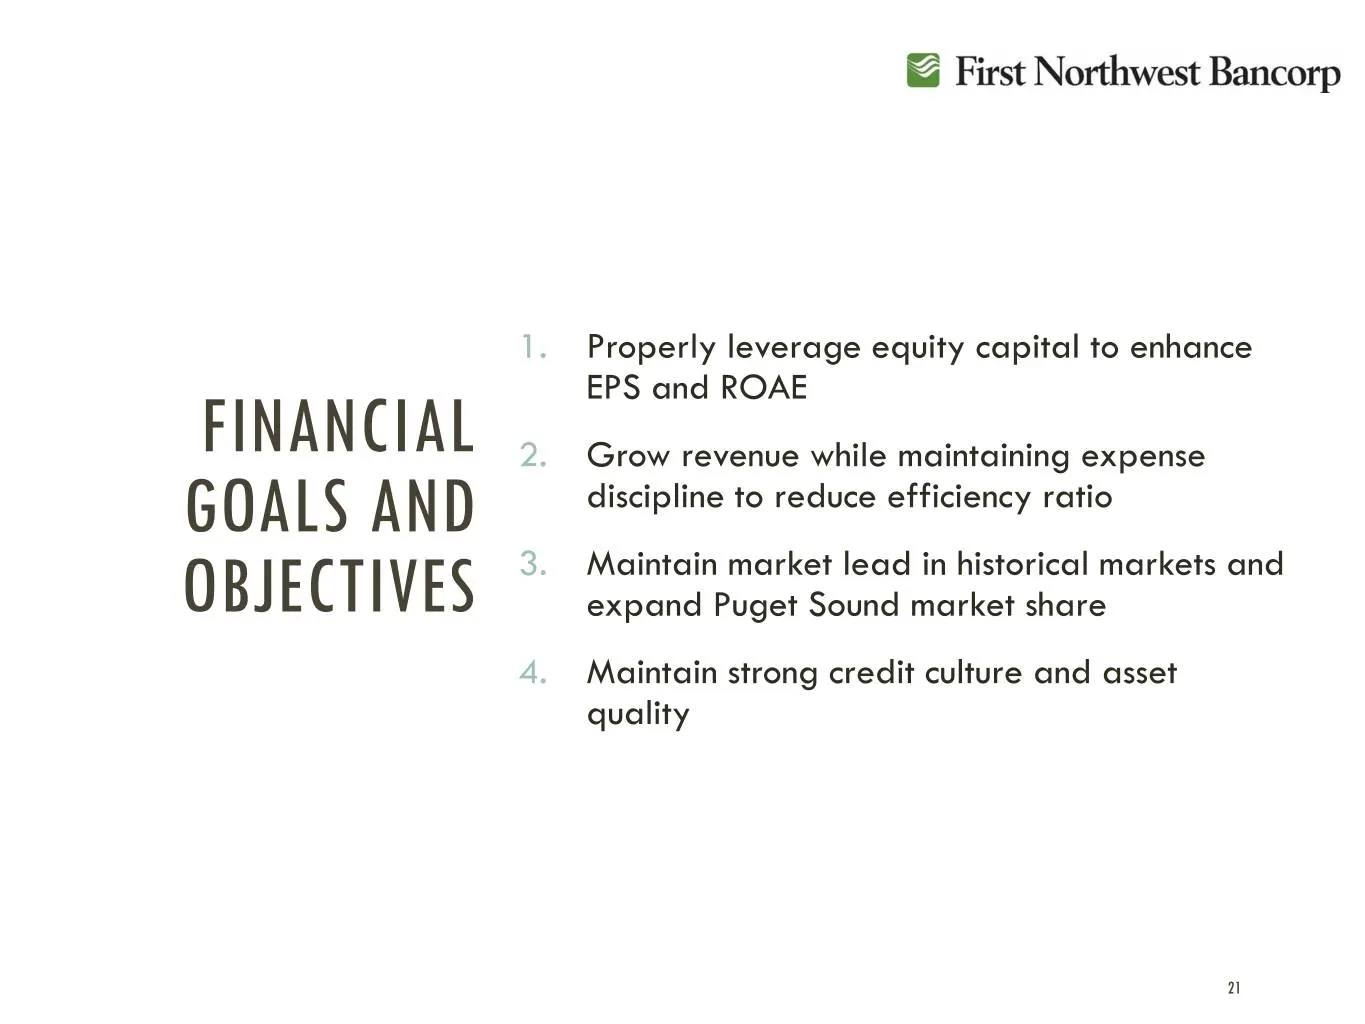
1. Properly leverage equity capital to enhance EPS and ROAE FINANCIAL 2. Grow revenue while maintaining expense GOALS AND discipline to reduce efficiency ratio 3. Maintain market lead in historical markets and OBJECTIVES expand Puget Sound market share 4. Maintain strong credit culture and asset qua
Slide 22: Questions? Safe Harbor Statement
SAFE HARBOR STATEMENT This presentation contains forward-looking statements within the meaning of the Private Securities Litigation Reform Act of 1995. These statements are based on the current beliefs and expectations of First Northwest Bancorp’s management and on information available to First Nor
Source: SEC EDGAR · 8-K filed May 6, 2020
More decks from First Northwest Bancorp
 Q3 2026 Earnings Presentation20 slides · Oct 29, 2026
 Q2 2026 Earnings Presentation20 slides · July 2026
 Q1 2026 Earnings Presentation20 slides · May 2026
 Q4 2025 Earnings Presentation30 slides · Feb 4, 2026
 Q4 2025 Earnings Presentation30 slides · February 2026
 Q3 2025 Earnings Presentation29 slides · Oct 29, 2025