York Space Systems Inc. · NYSE:YSS
York Space Systems — Q3 2026 Earnings Presentation
30 slides from York Space Systems's earnings presentation, Nov 12, 2026

Slide 1: York Space Systems Q3 2026
wel YORK mek; 2026
Slide 2: Forward-Looking Statements
Forward-Looking Statements This presentation contains “forward -looking statements” within the meaning of, and the Company intends such forward -looking statements to be covered by, the safe harbor provisions of the Private Securities Litigation Reform Act of 1995. Forward-looking statements are inh
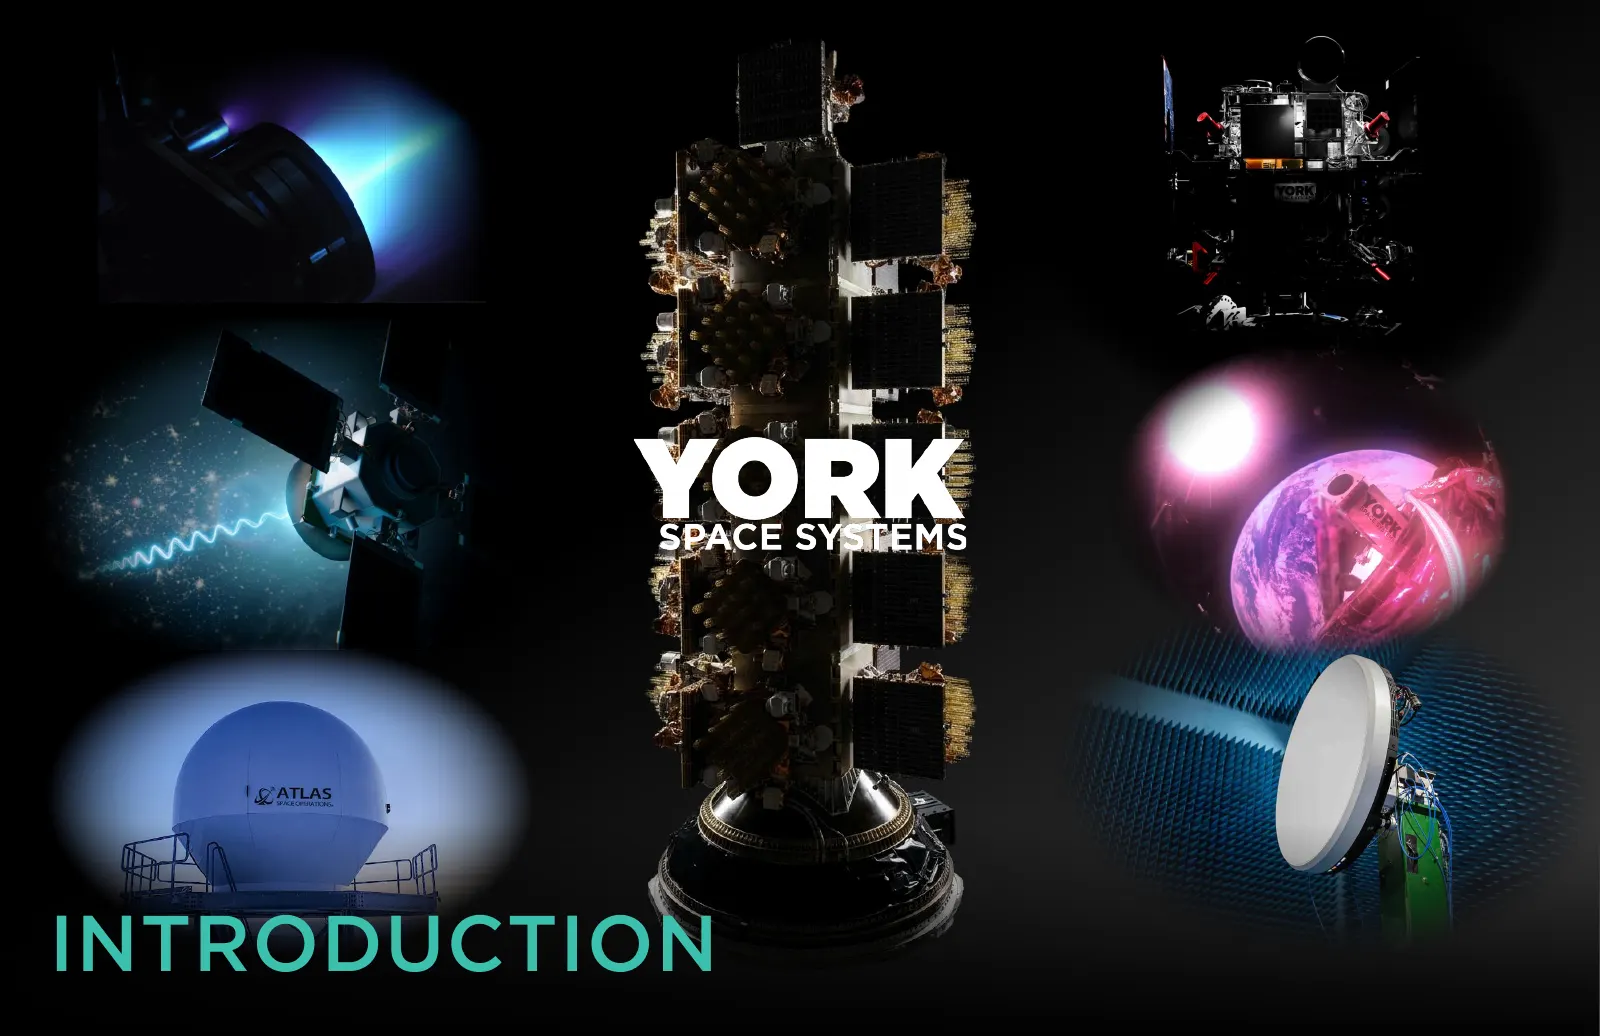
Slide 3: Introduction
INTRODUCTION
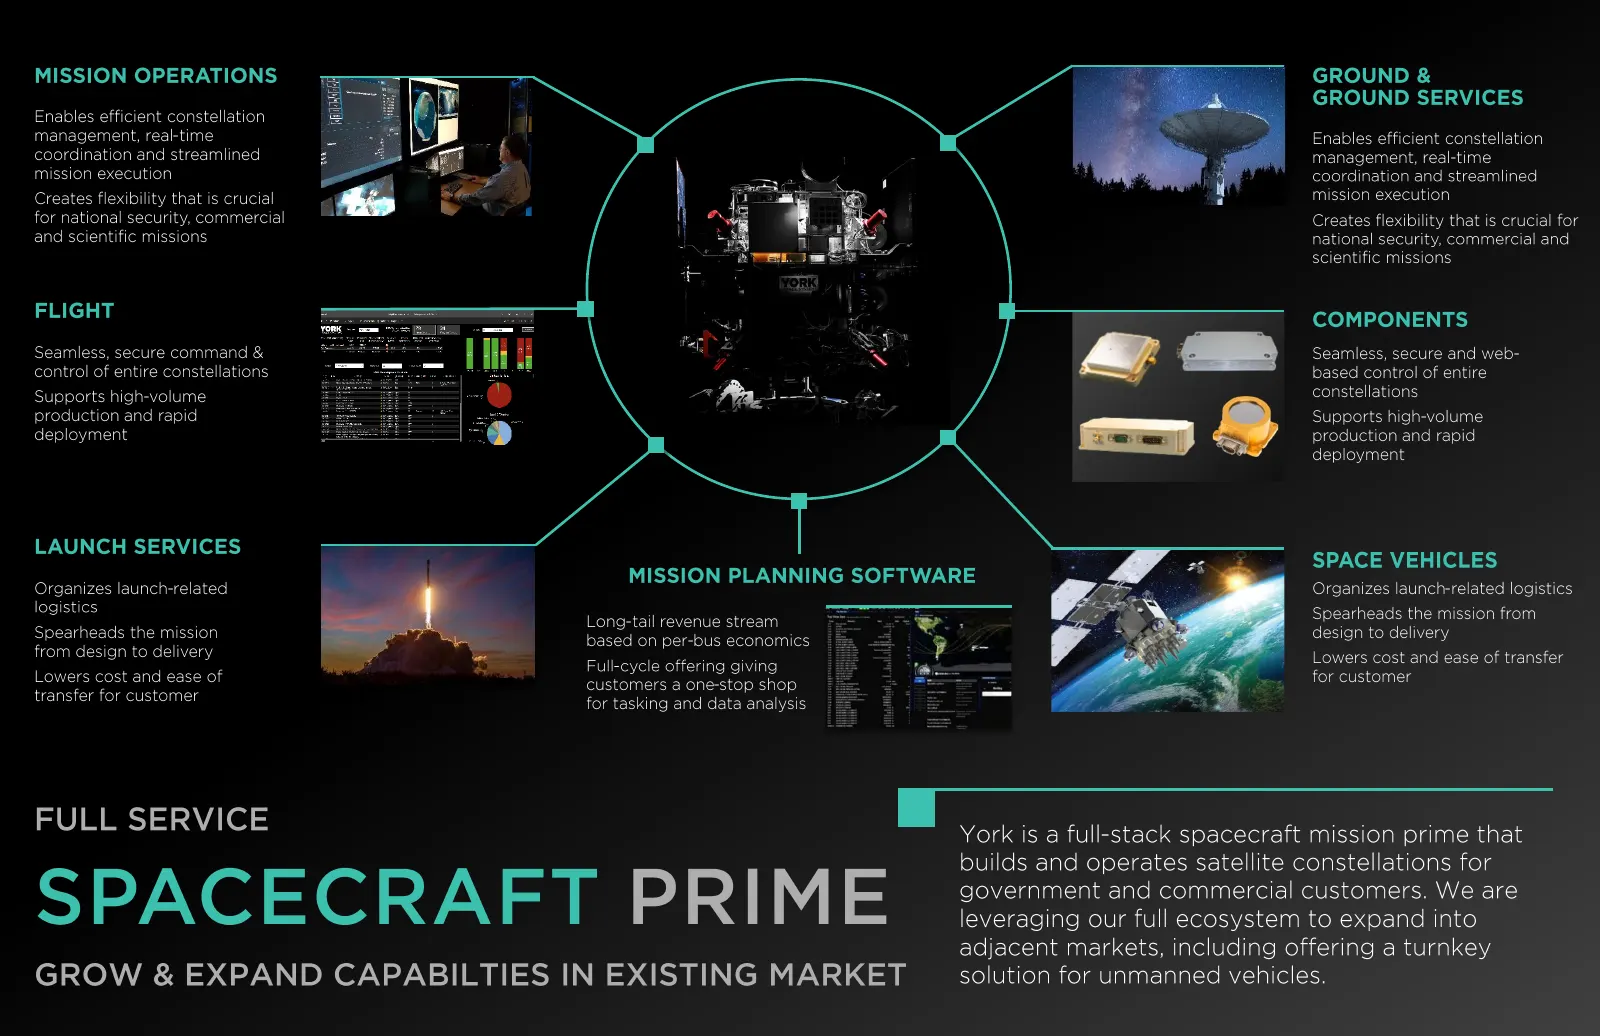
Slide 4: Spacecraft prime, mission operations and ground services
MISSION OPERATIONS GROUND & GROUND SERVICES Enables efficient constellation management, real - time Enables efficient constellation coordination and streamlined management, real - time mission execution coordination and streamlined Creates flexibility that is crucial mission execution for national s
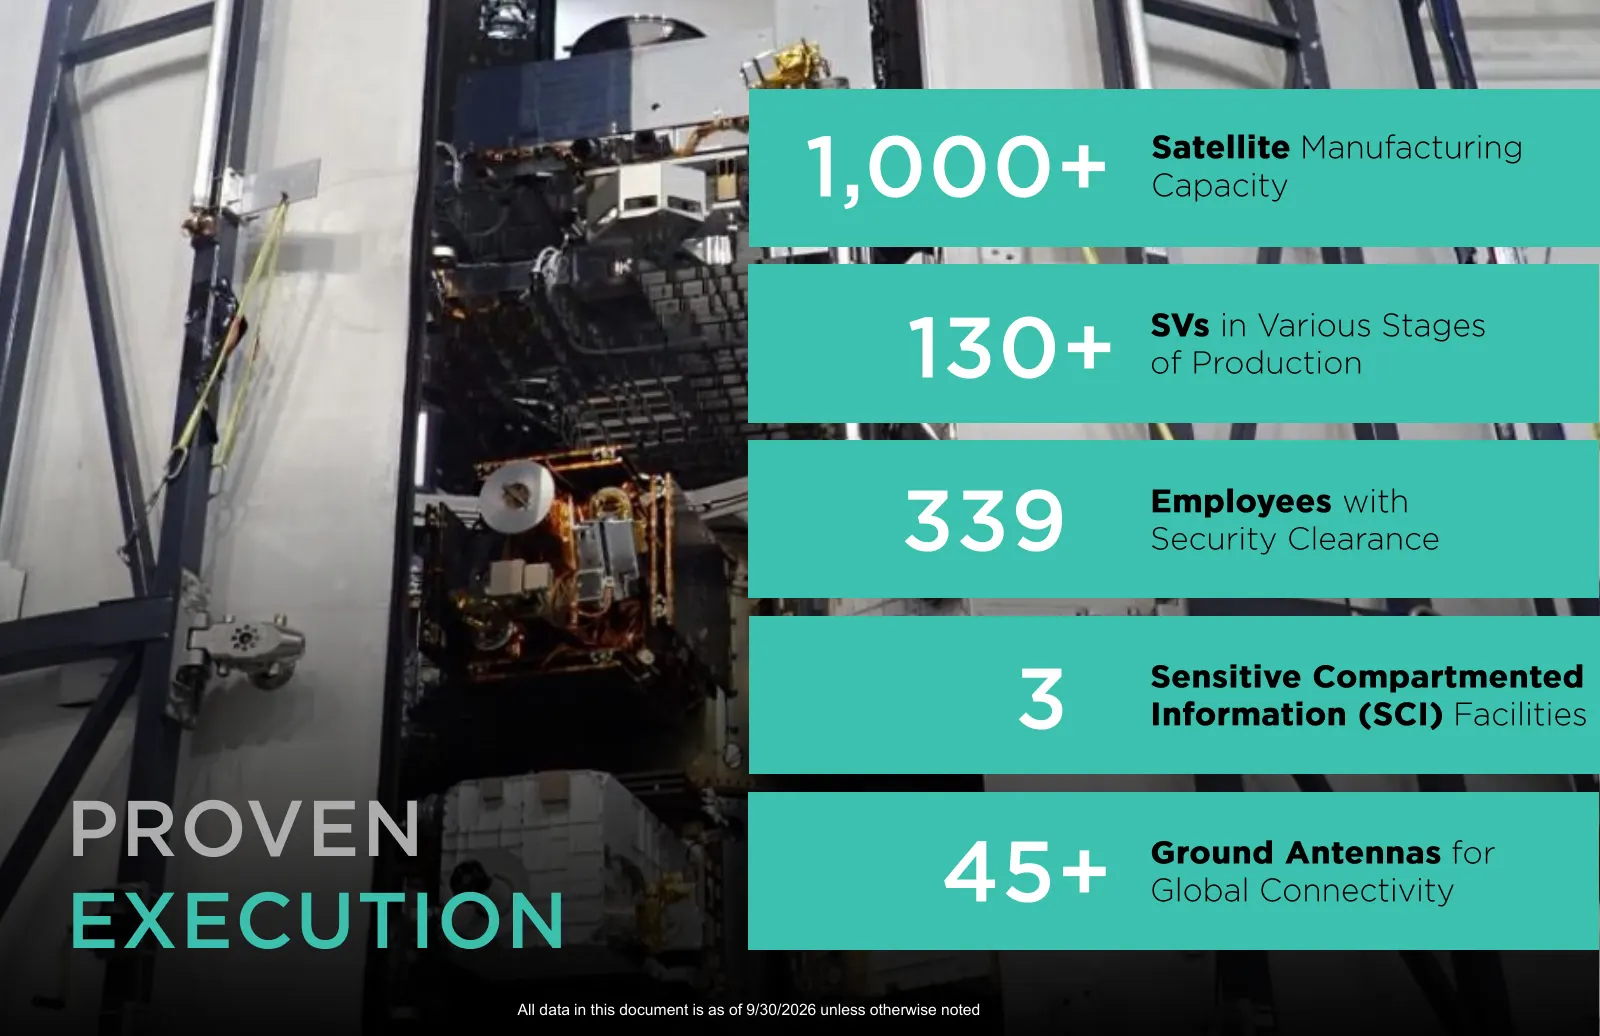
Slide 5: Proven Execution
1,000+ Satellite Capacity Manufacturing SVs in Various Stages 130+ of Production 339 Employees with Security Clearance Sensitive Compartmented 3 Information (SCI) Facilities PROVEN 45+ Ground Antennas Global Connectivity for EXECUTION All data in this document is as of 9/30/2026 unless otherwise not
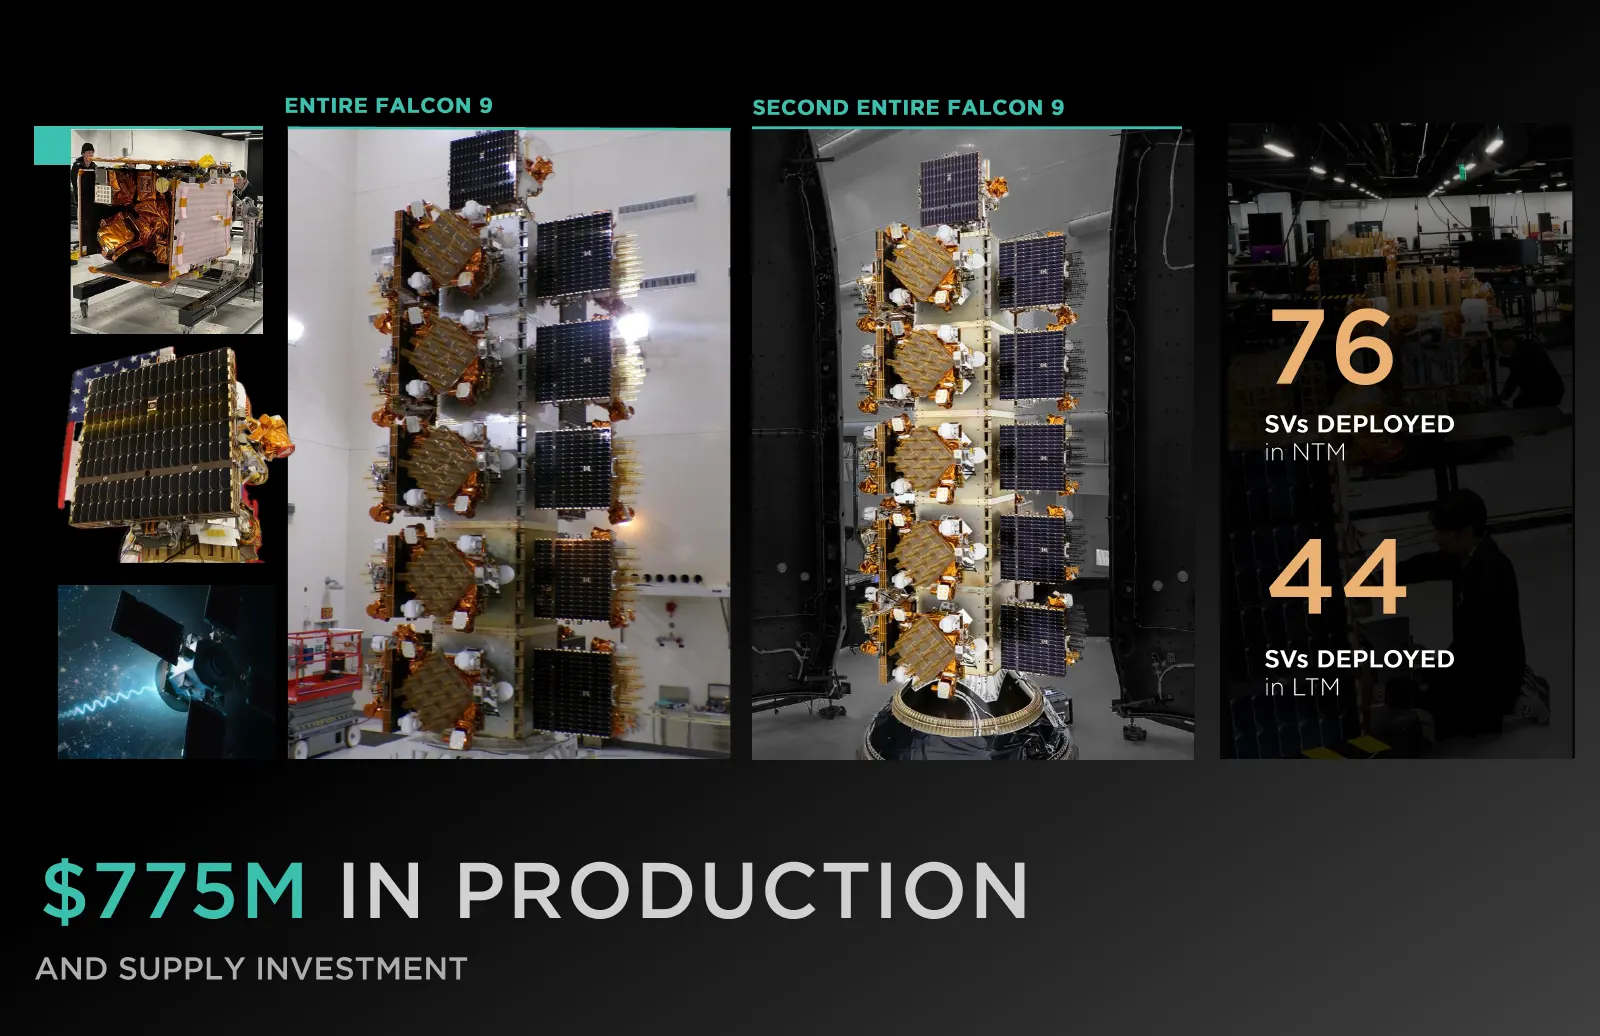
Slide 6: $775M in Production and Supply Investment
ENTIRE FALCON 9 SECOND ENTIRE FALCON 9 76 SVs DEPLOYED in NTM 44 SVs DEPLOYED in LTM $775M IN PRODUCTION AND SUPPLY INVESTMENT
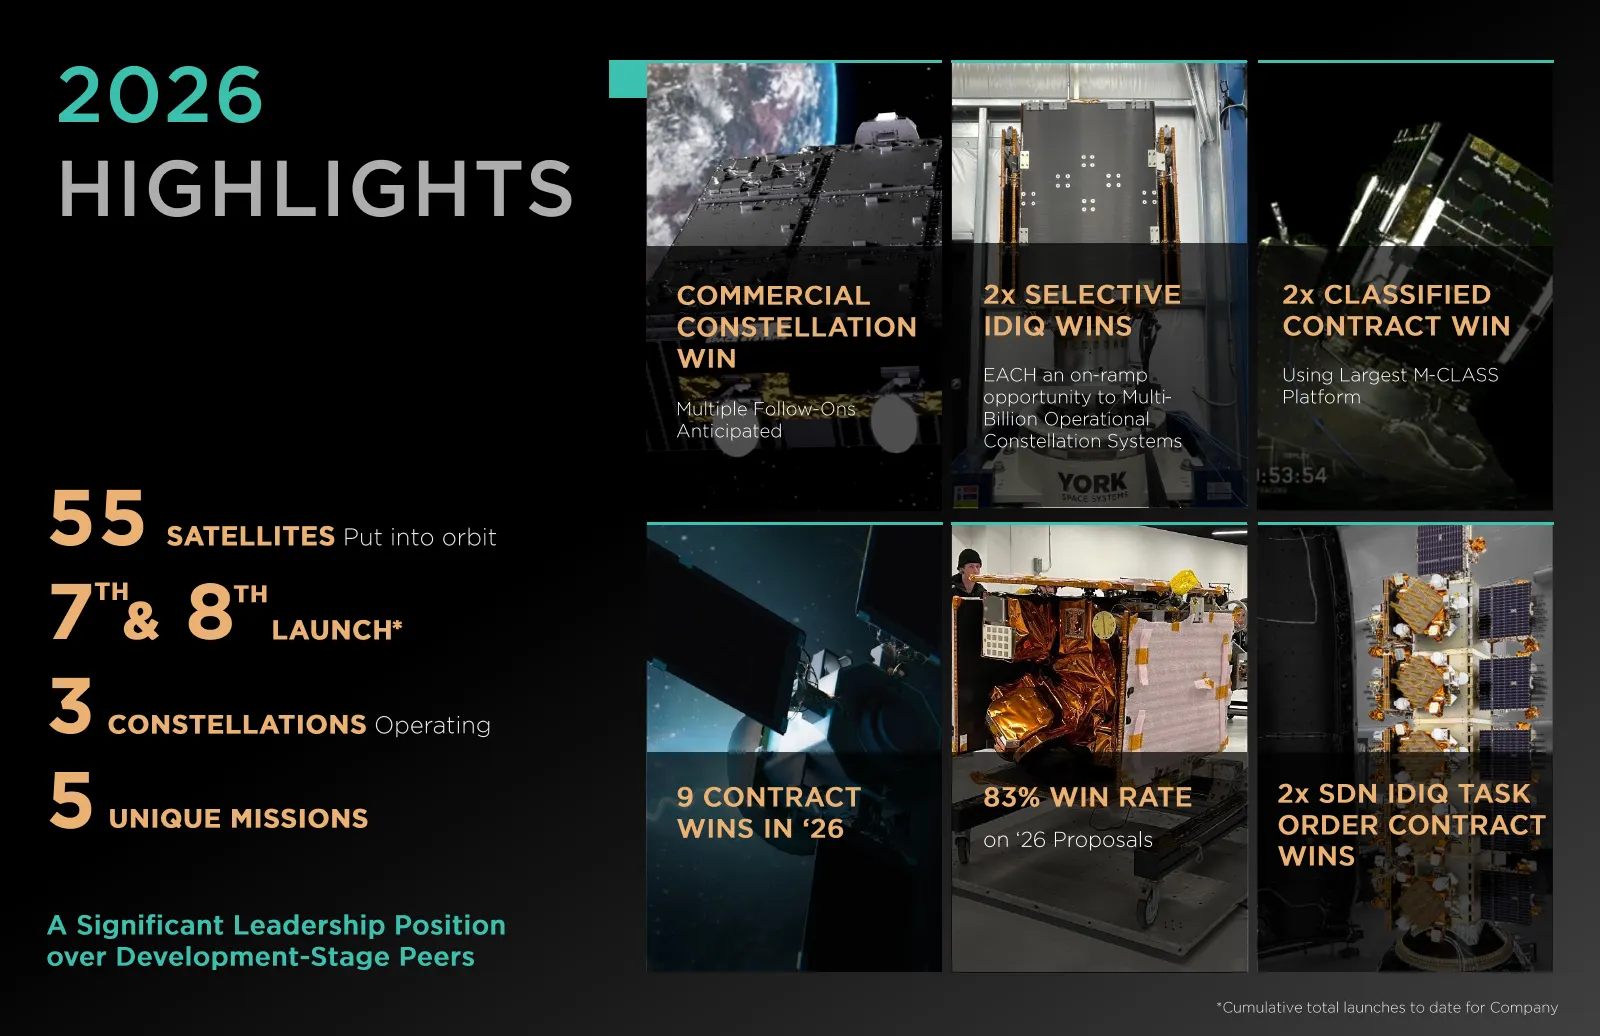
Slide 7: 2026 Highlights
2026 HIGHLIGHTS COMMERCIAL 2x SELECTIVE 2x CLASSIFIED CONSTELLATION IDIQ WINS CONTRACT WIN WIN EACH an on - ramp Using Largest M - CLASS opportunity to Multi - Platform Multiple Follow - Ons Billion Operational Anticipated Constellation Systems 55 SATELLITES Put into orbit 7 &8 TH TH LAUNCH * 3 CONS
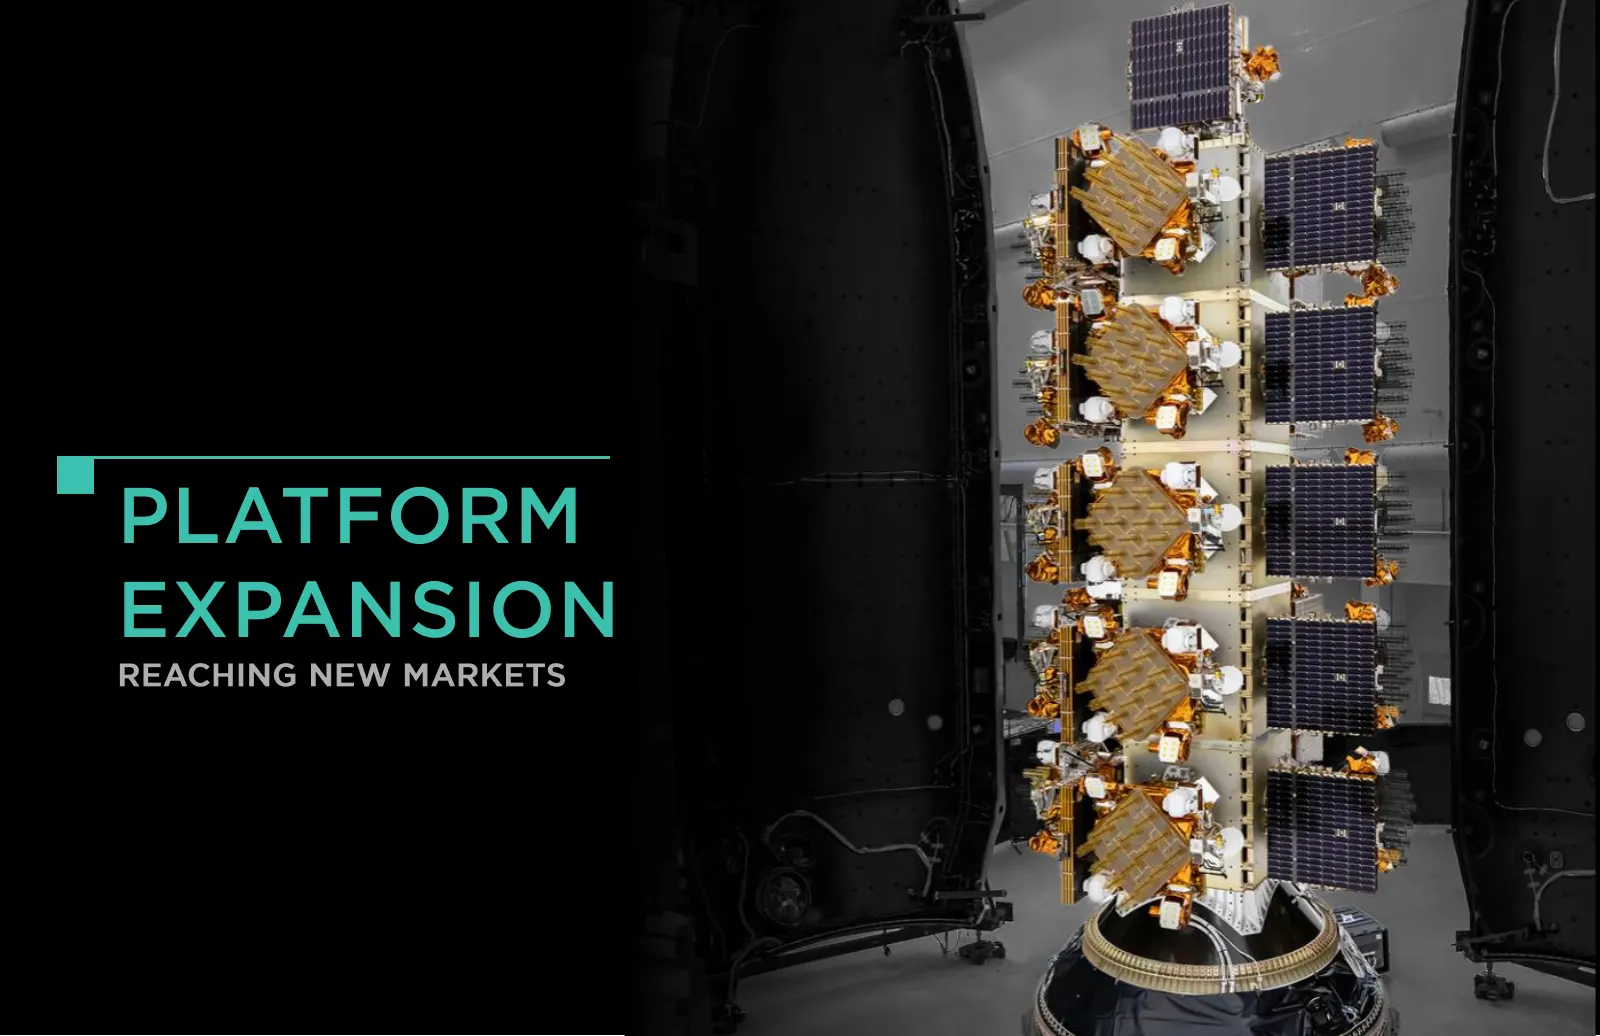
Slide 8: Platform Expansion
PLATFORM EXPANSION REACHING NEW MARKETS
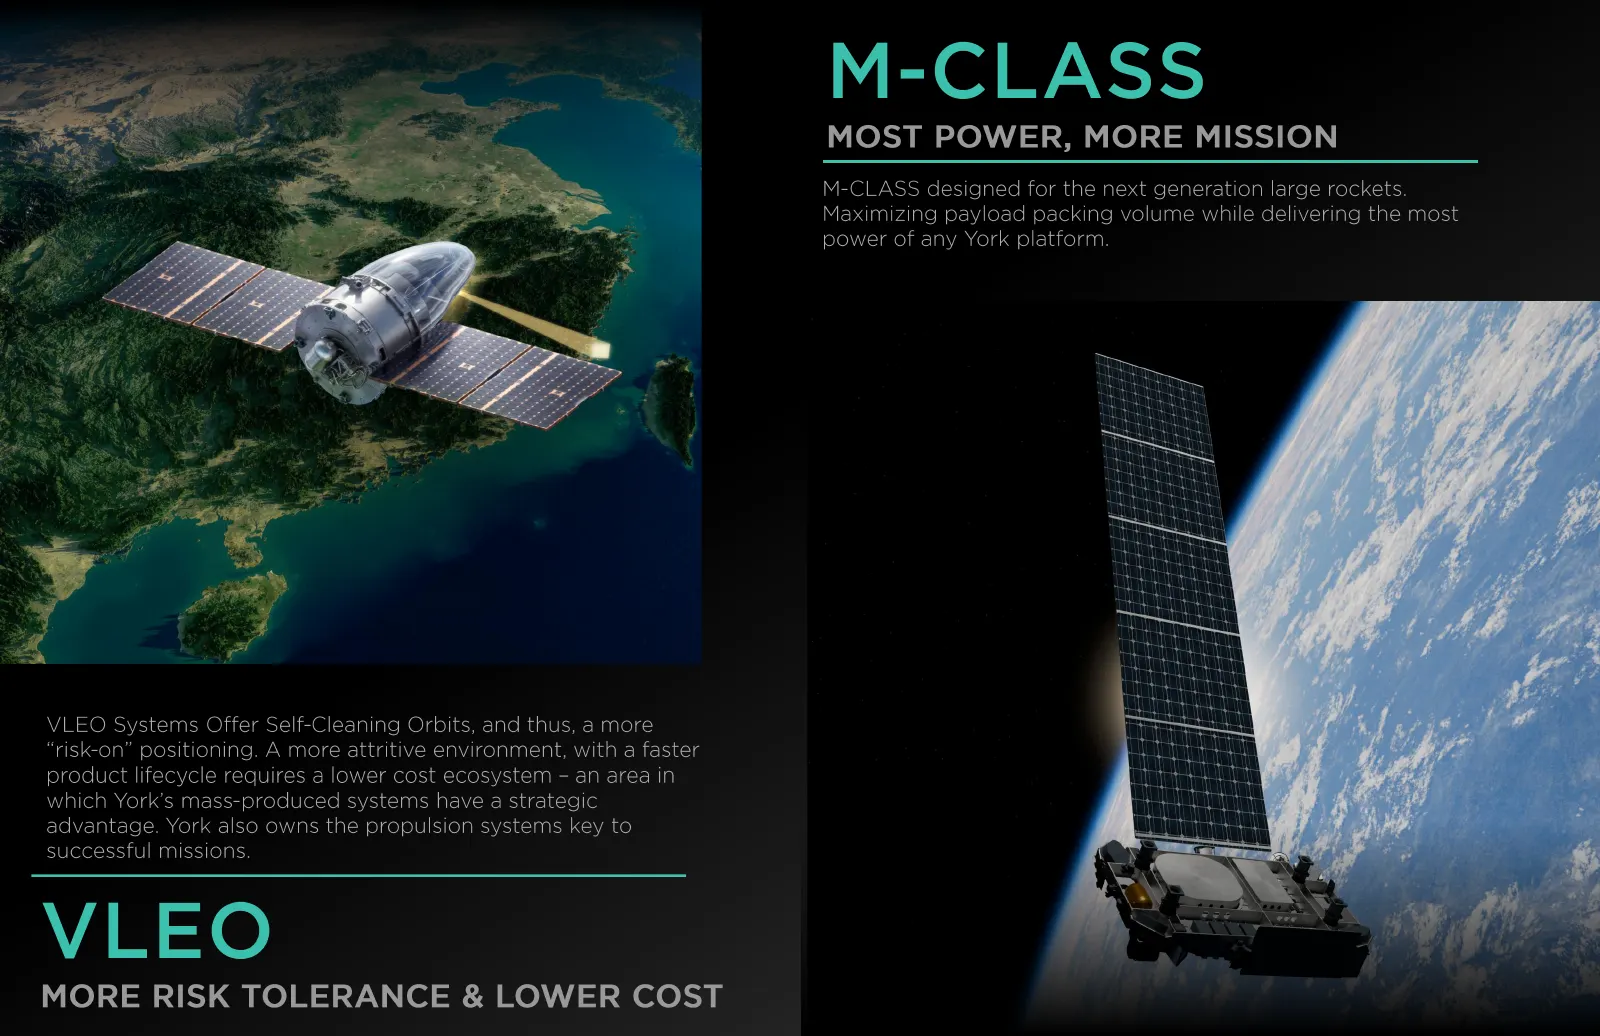
Slide 9: M-Class VLEO
M- CLASS MOST POWER, MORE MISSION M- CLASS designed for the next generation large rockets. Maximizing payload packing volume while delivering the most power of any York platform. VLEO Systems Offer Self -Cleaning Orbits, and thus, a more “risk - on” positioning. A more attritive environment, with a
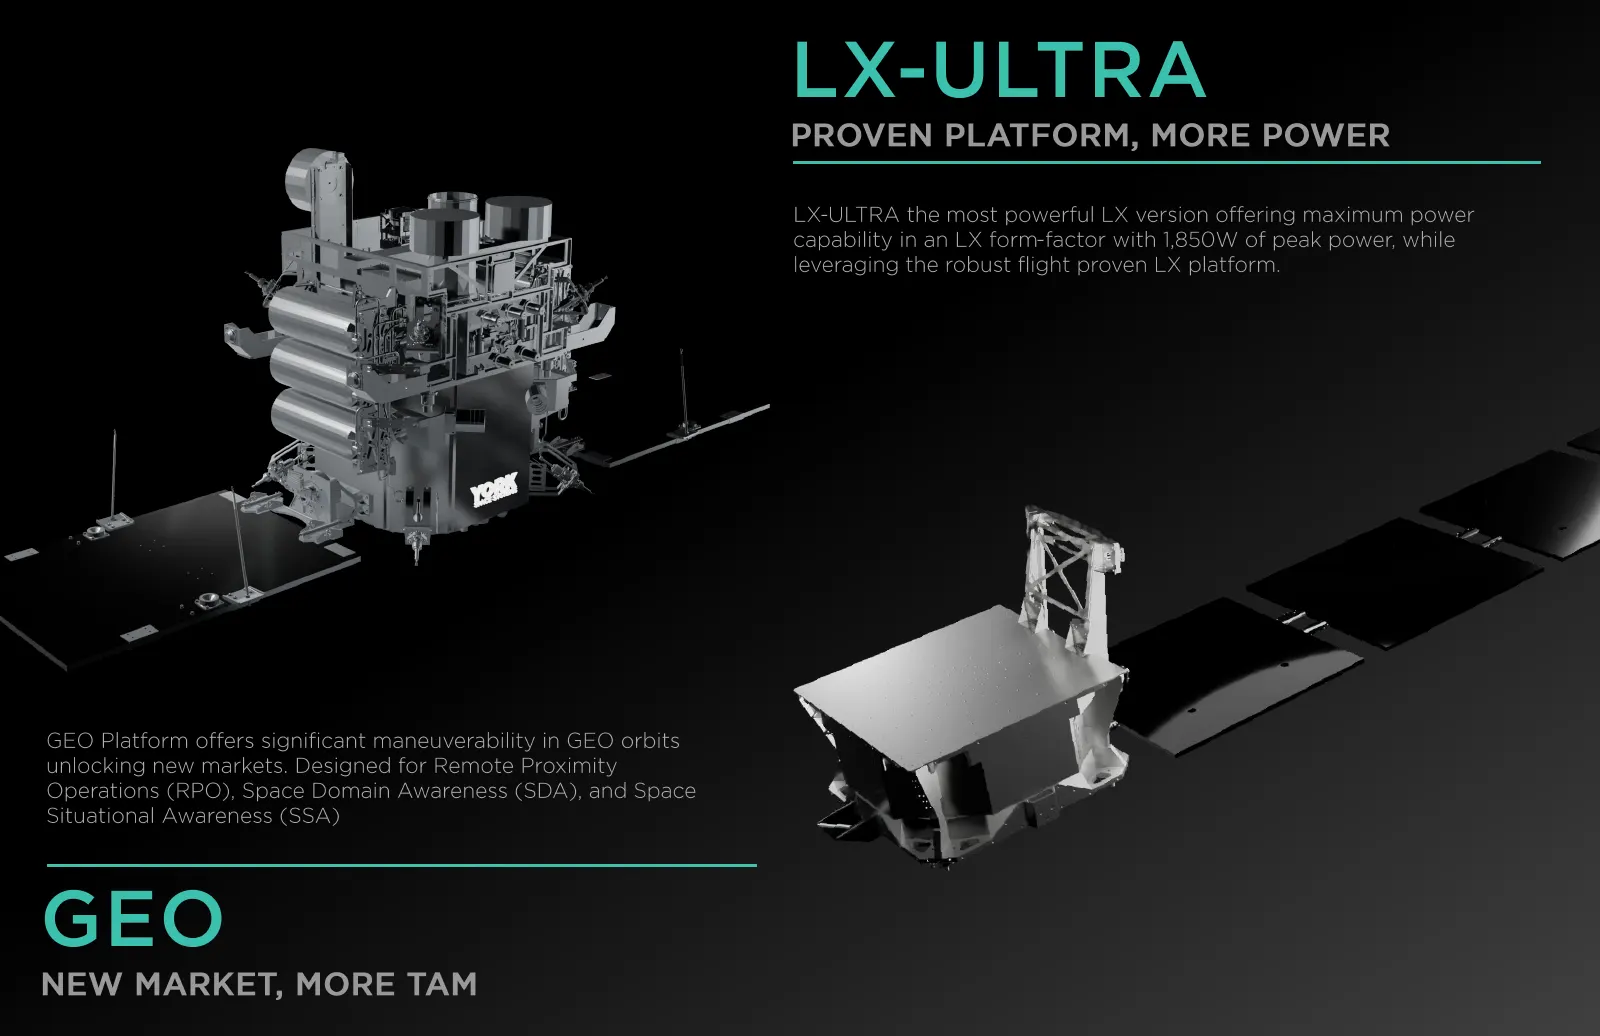
Slide 10: LX-Ultra GEO
LX - ULTRA PROVEN PLATFORM, MORE POWER LX - ULTRA the most powerful LX version offering maximum power capability in an LX form - factor with 1,850W of peak power, while leveraging the robust flight proven LX platform. GEO Platform offers significant maneuverability in GEO orbits unlocking new market
Slide 11: Proven Missions
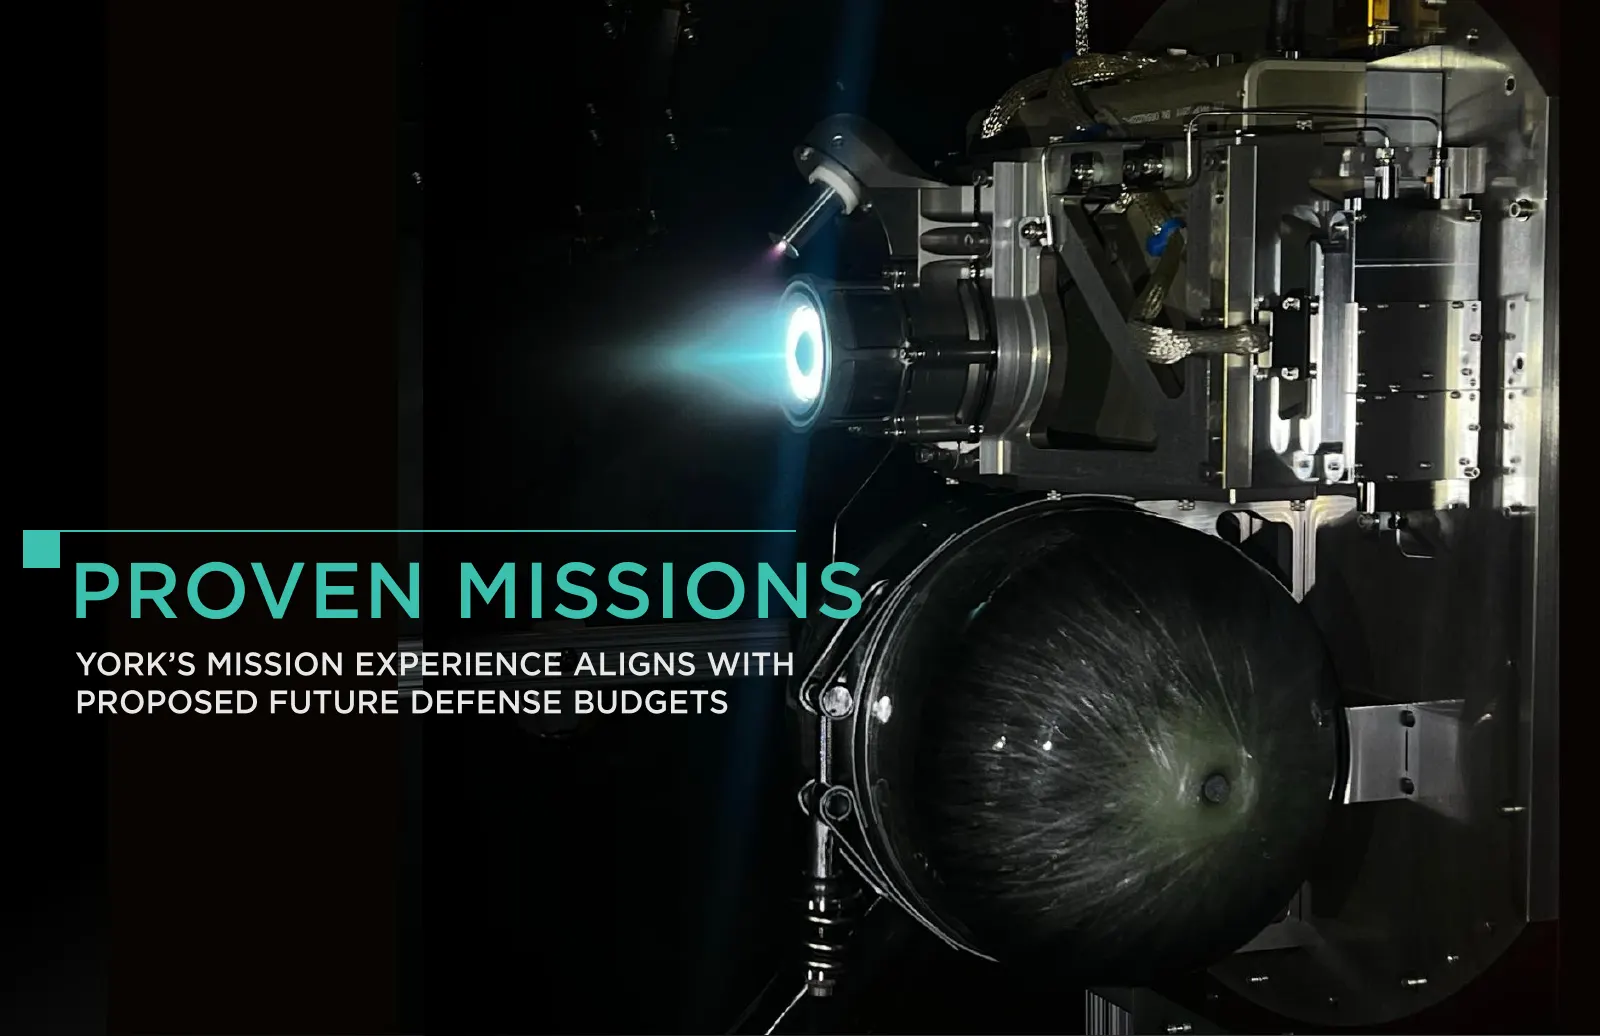
PROVEN MISSIONS YORK’S MISSION EXPERIENCE ALIGNS WITH PROPOSED FUTURE DEFENSE BUDGETS
Slide 12: Platforms Serving Expanding Markets
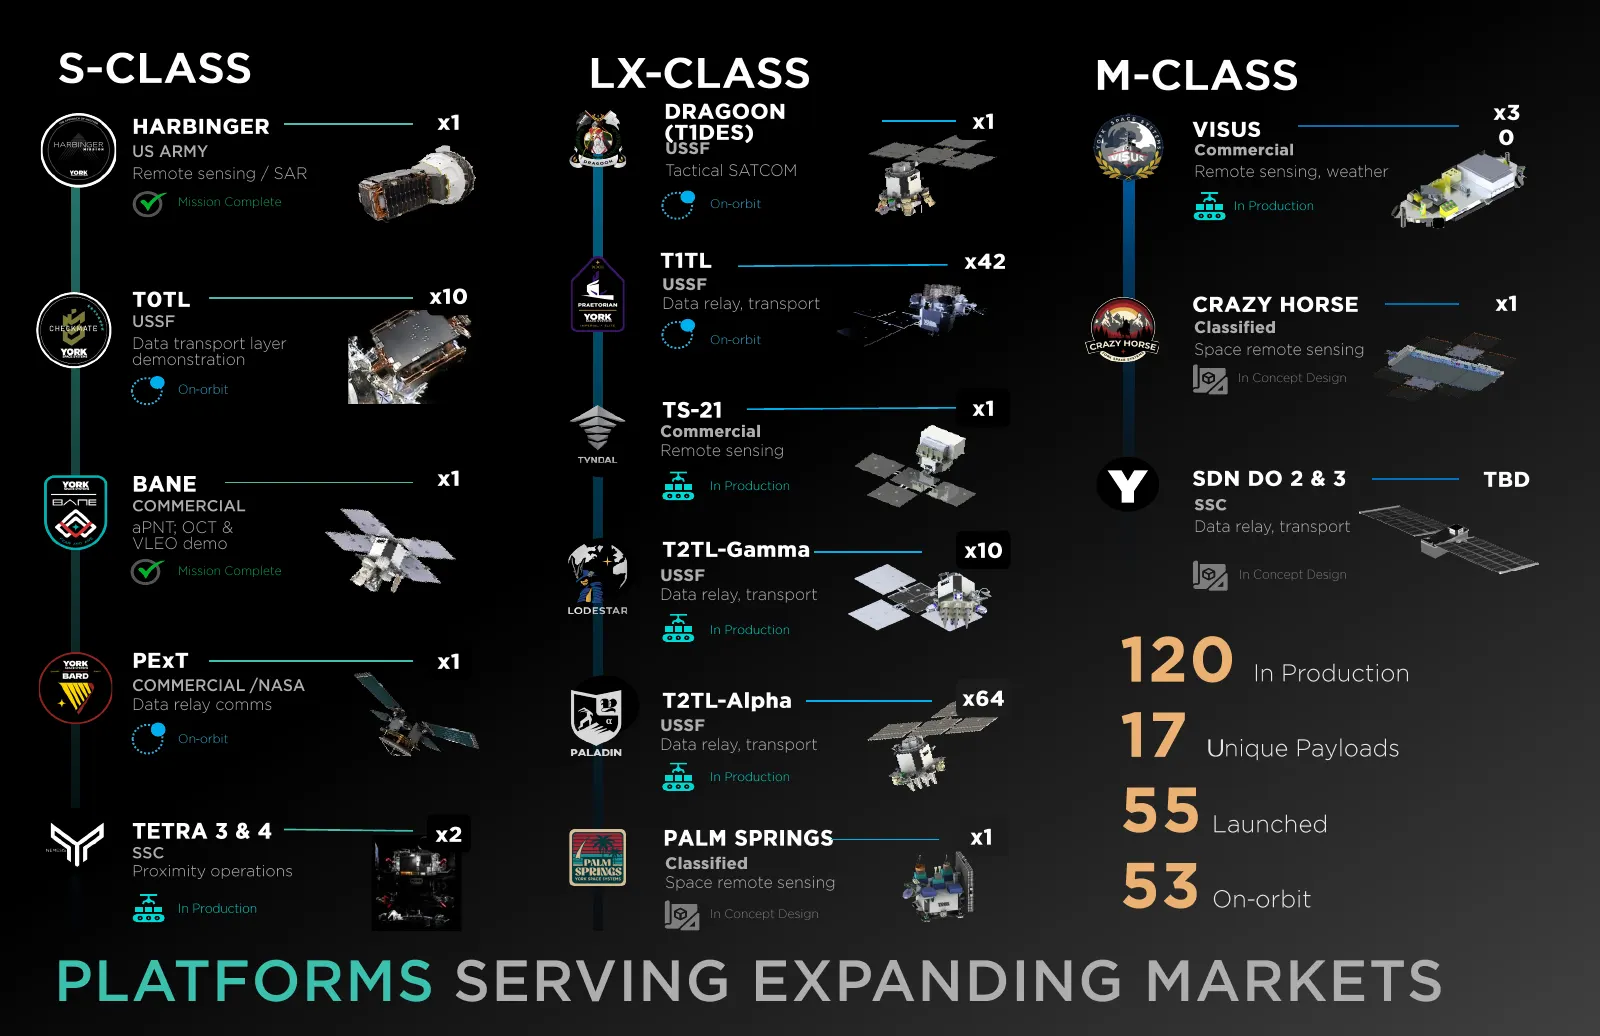
S - CLASS LX - CLASS M- CLASS DRAGOON x1 x3 HARBINGER x1 (T1DES) VISUS USSF Commercial 0 US ARMY Remote sensing / SAR Tactical SATCOM Remote sensing, weather Mission Complete On - orbit In Production T1TL x42 USSF T0TL x10 Data relay, transport CRAZY HORSE x1 USSF Classified Data transport layer On
Slide 13: Mission Contracts & Capabilities
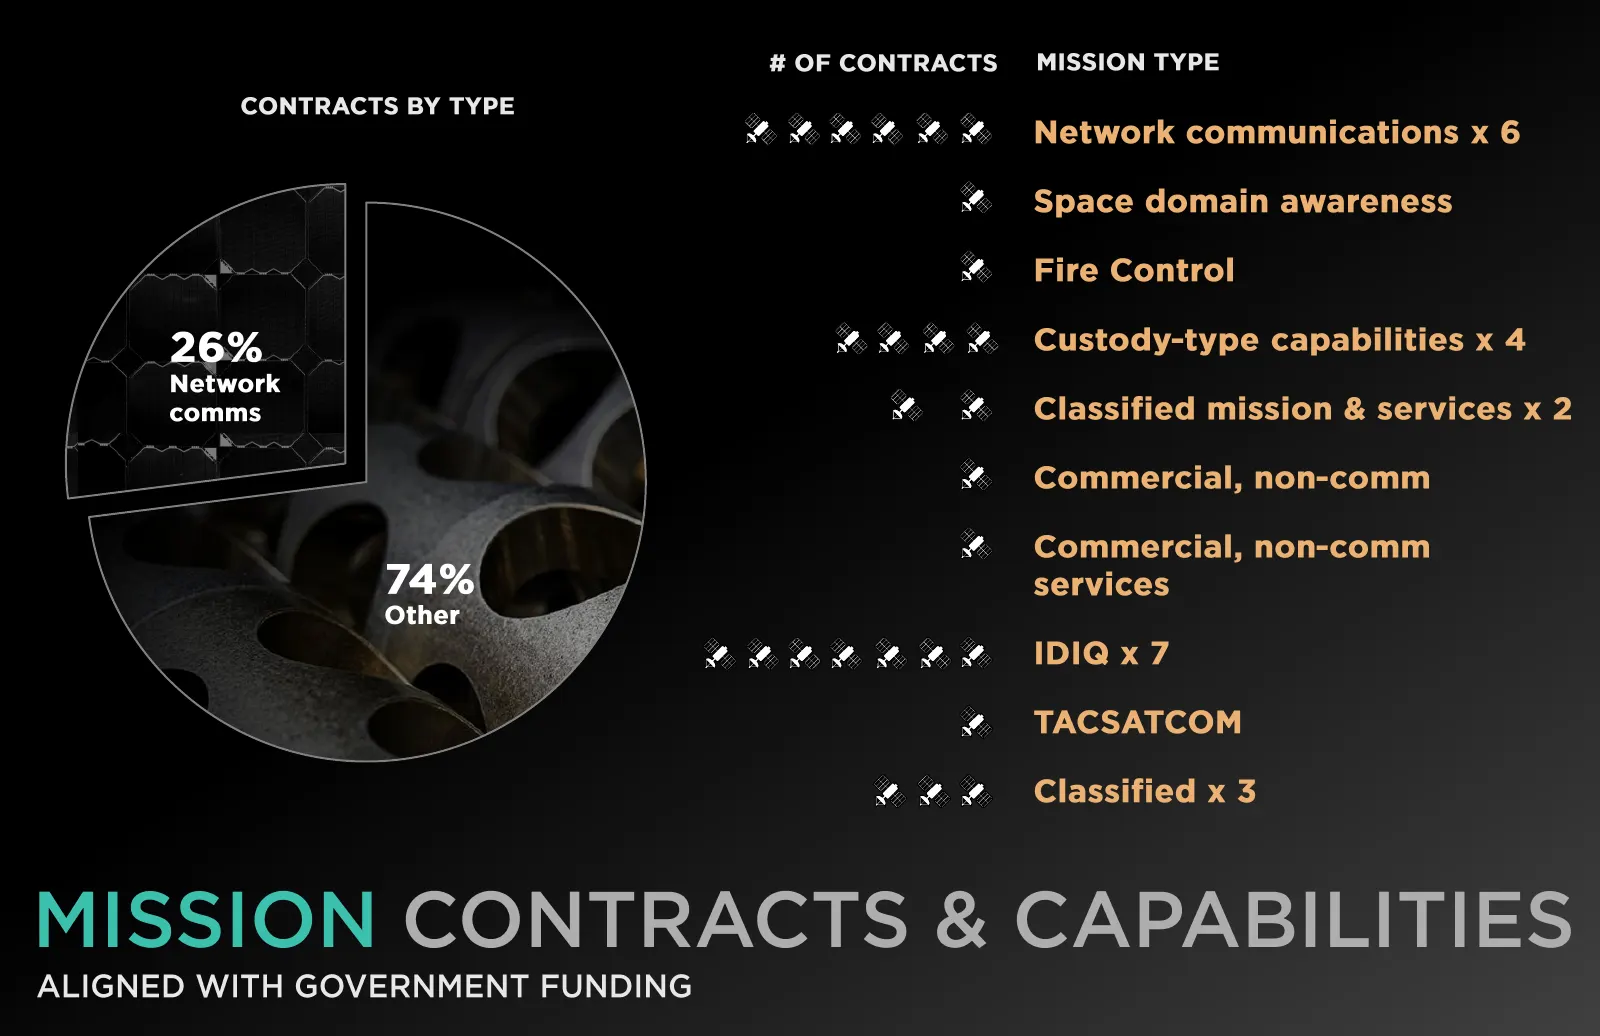
# OF CONTRACTS MISSION TYPE CONTRACTS BY TYPE Network communications x 6 Space domain awareness Fire Control 26% Custody - type capabilities x 4 Network comms Classified mission & services x 2 Commercial, non - comm Commercial, non - comm 74% services Other IDIQ x 7 TACSATCOM Classified x 3 MISSION
Slide 14: Mission Capabilities Under Contract
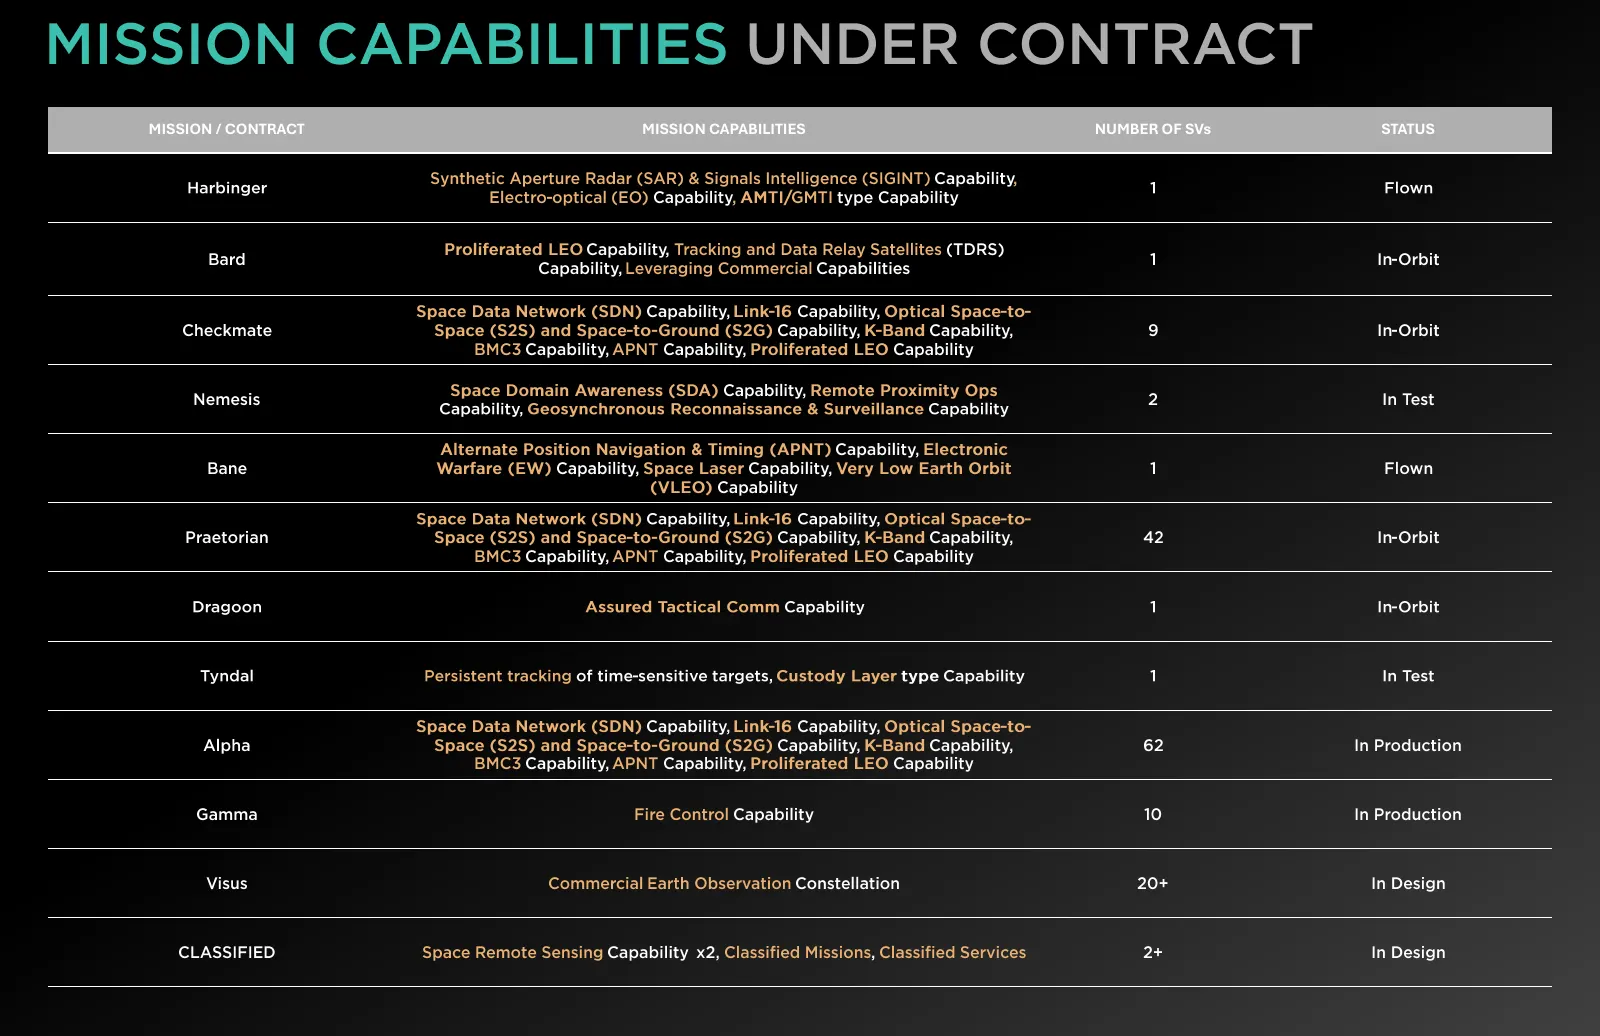
MISSION CAPABILITIES UNDER CONTRACT MISSION / CONTRACT MISSION CAPABILITIES NUMBER OF SVs STATUS Synthetic Aperture Radar (SAR) & Signals Intelligence (SIGINT) Capability , Harbinger 1 Flown Electro - optical (EO) Capability , AMTI/ GMTI type Capability Proliferated LEO Capability , Tracking and Dat
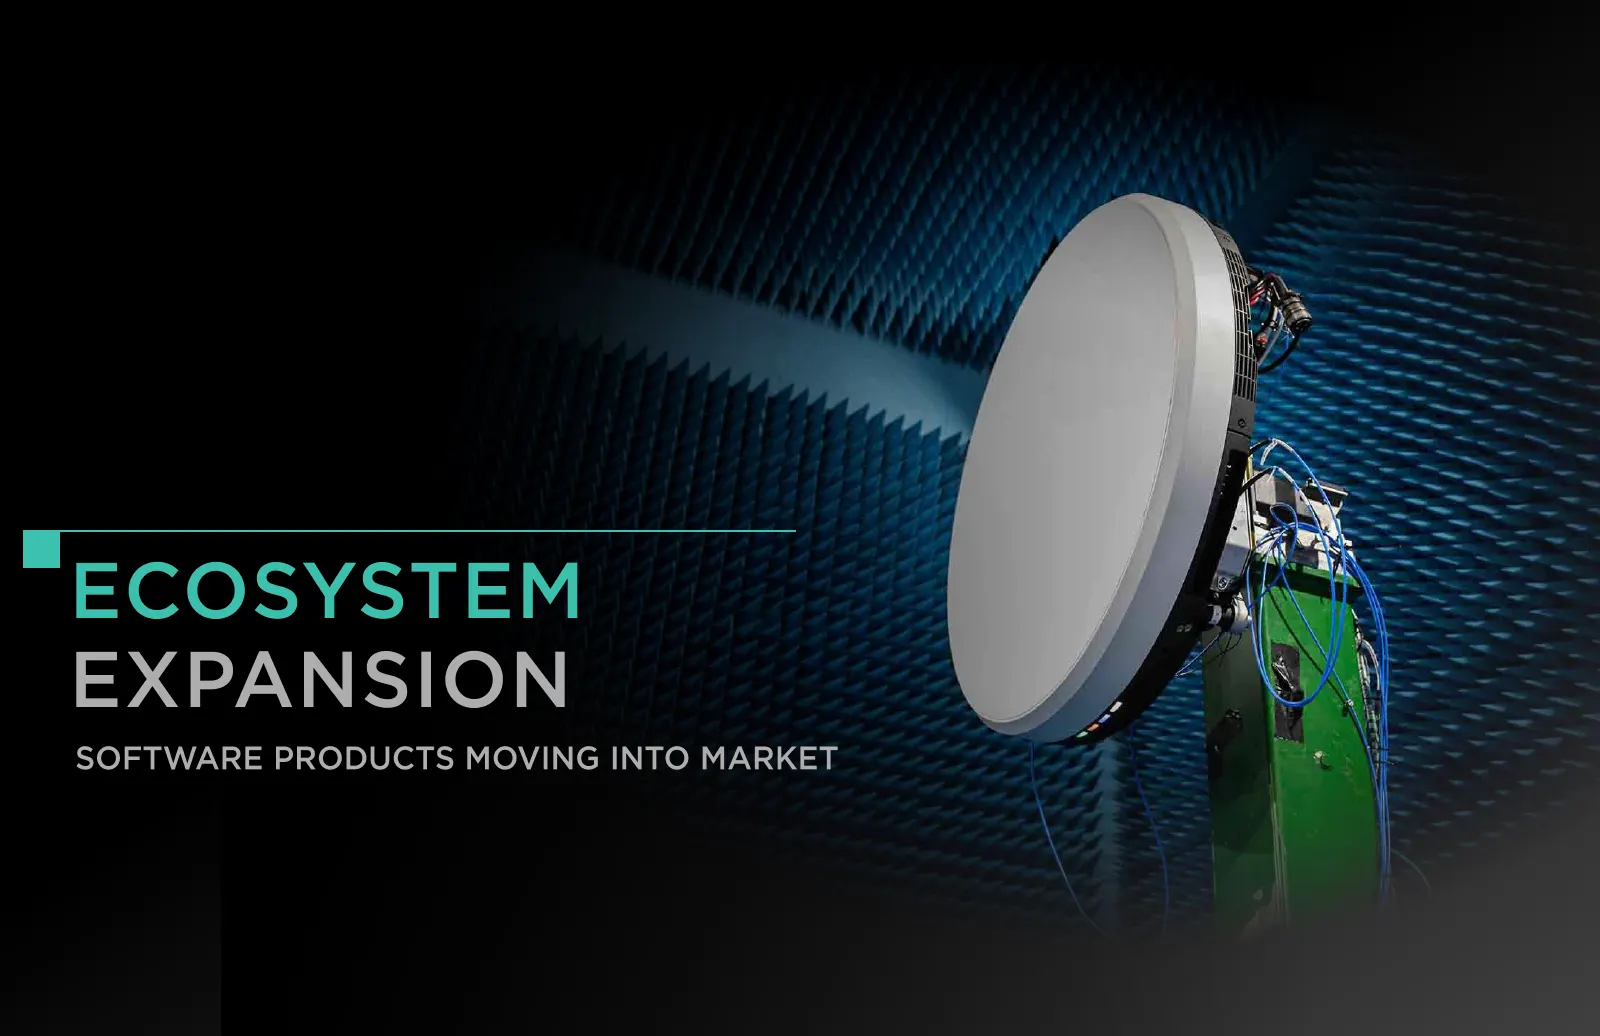
Slide 15: Ecosystem Expansion
ECOSYSTEM EXPANSION SOFTWARE PRODUCTS MOVING INTO MARKET
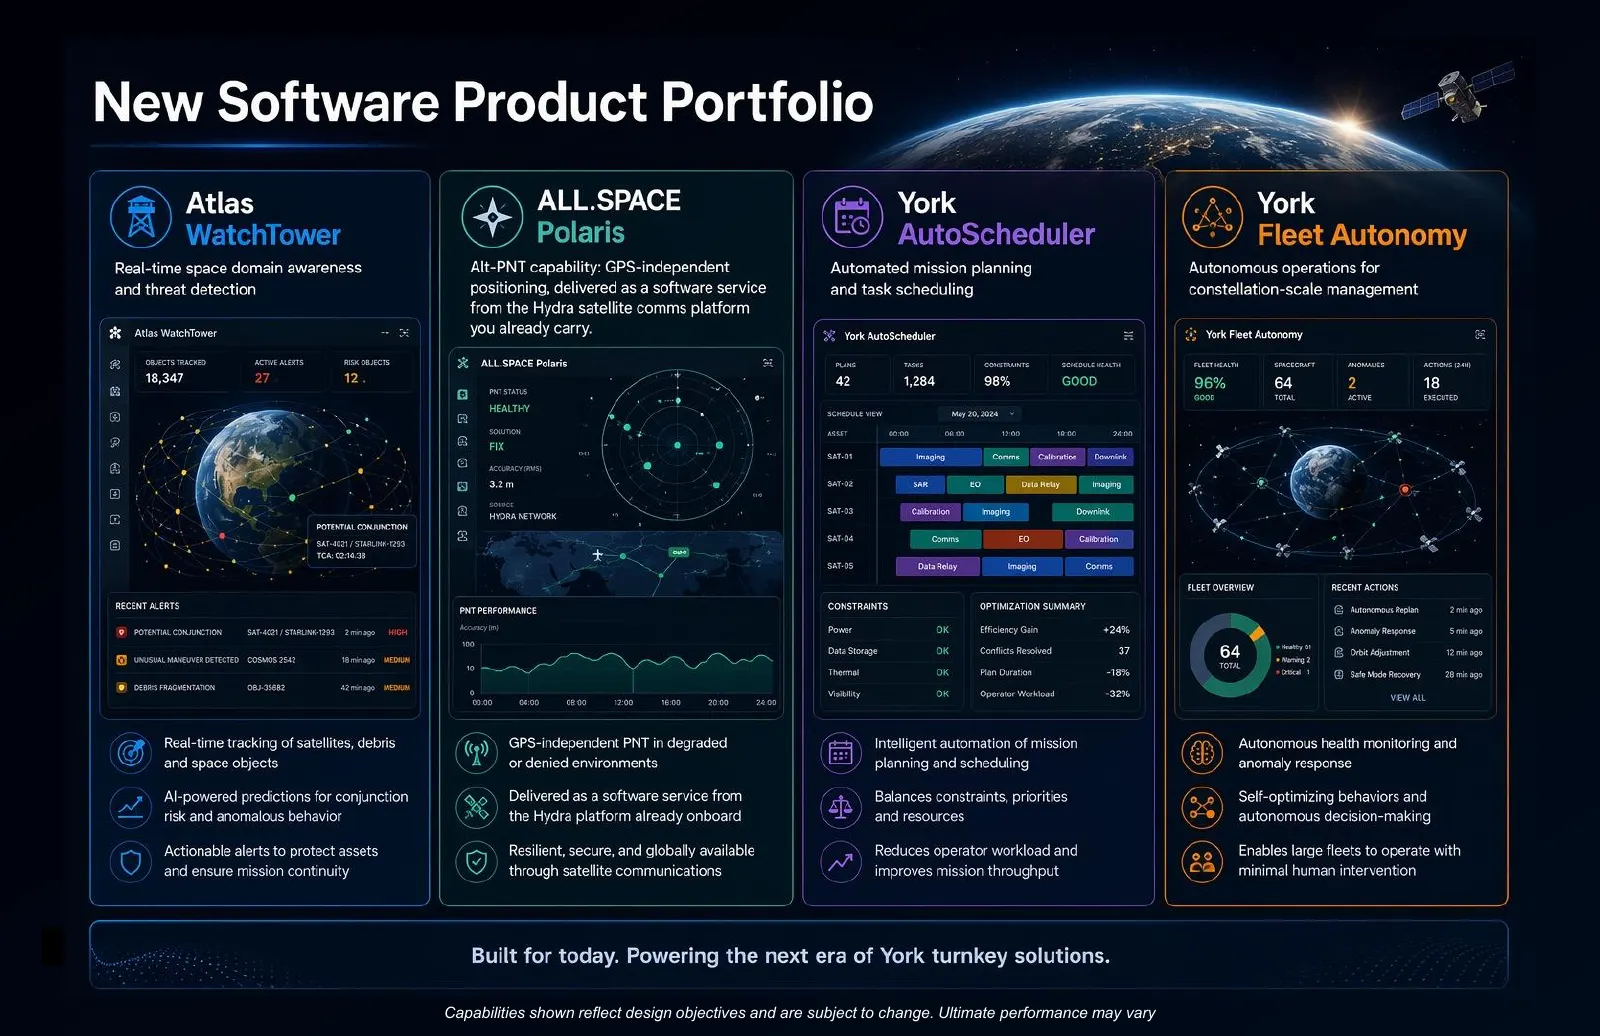
Slide 16: Software products capabilities
Capabilities shown reflect design objectives and are subject to change. Ultimate performance may vary
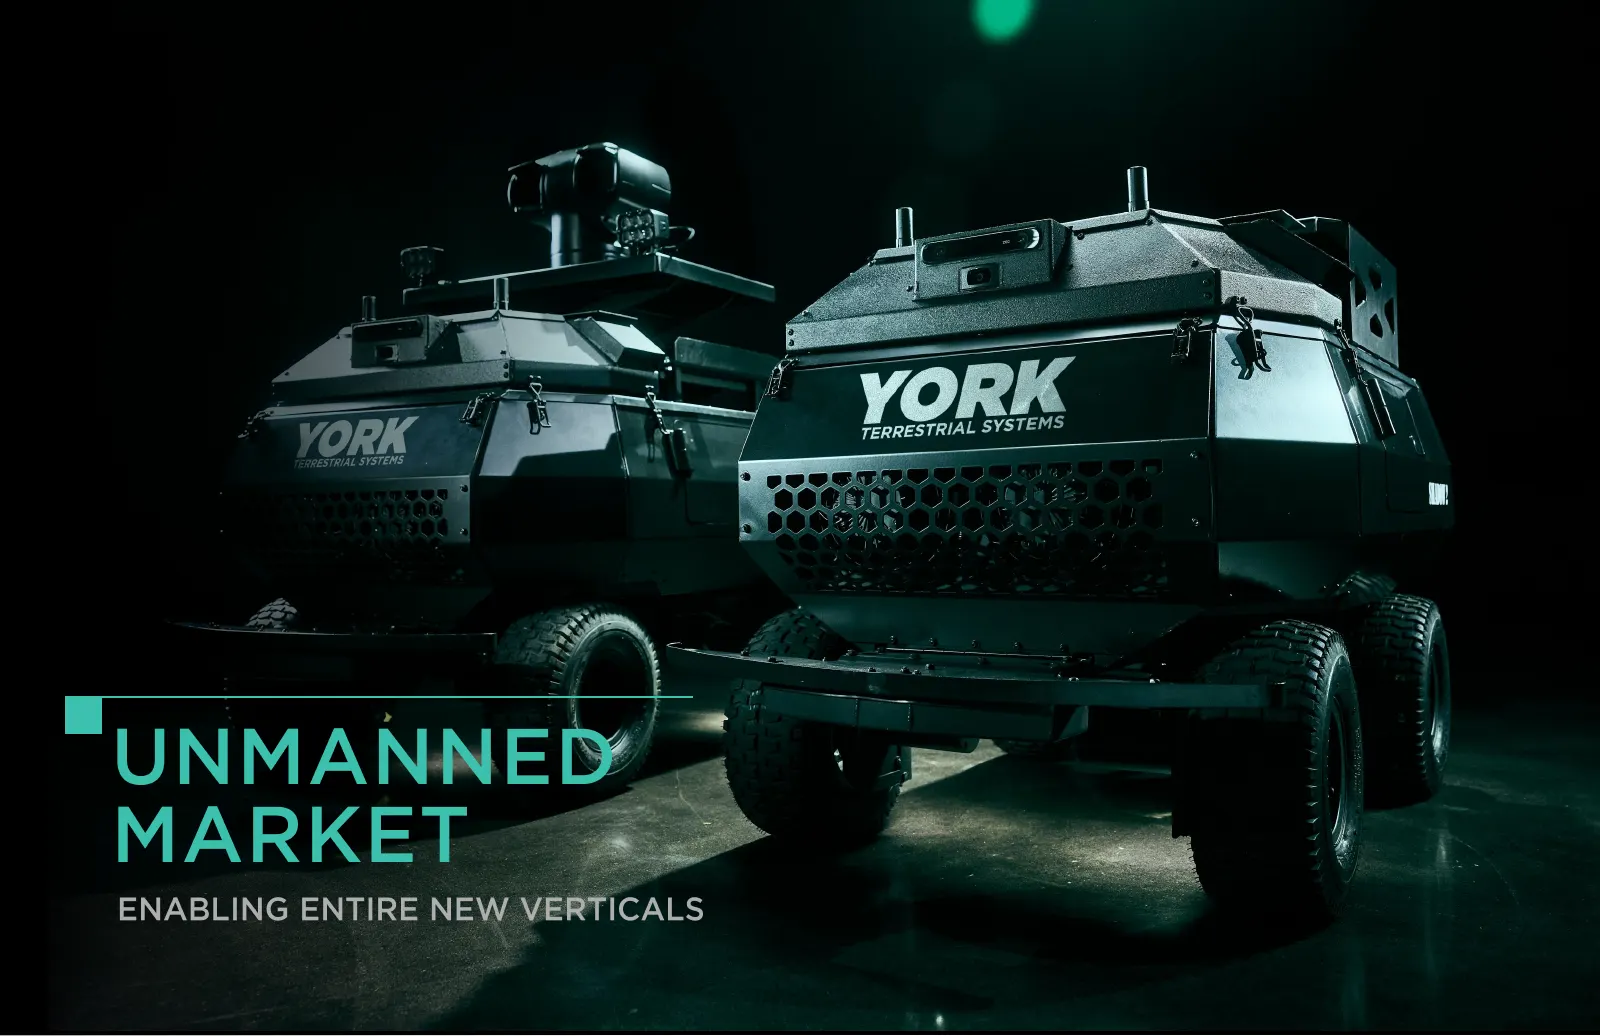
Slide 17: Unmanned Market
UNMANNED MARKET ENABLING ENTIRE NEW VERTICALS
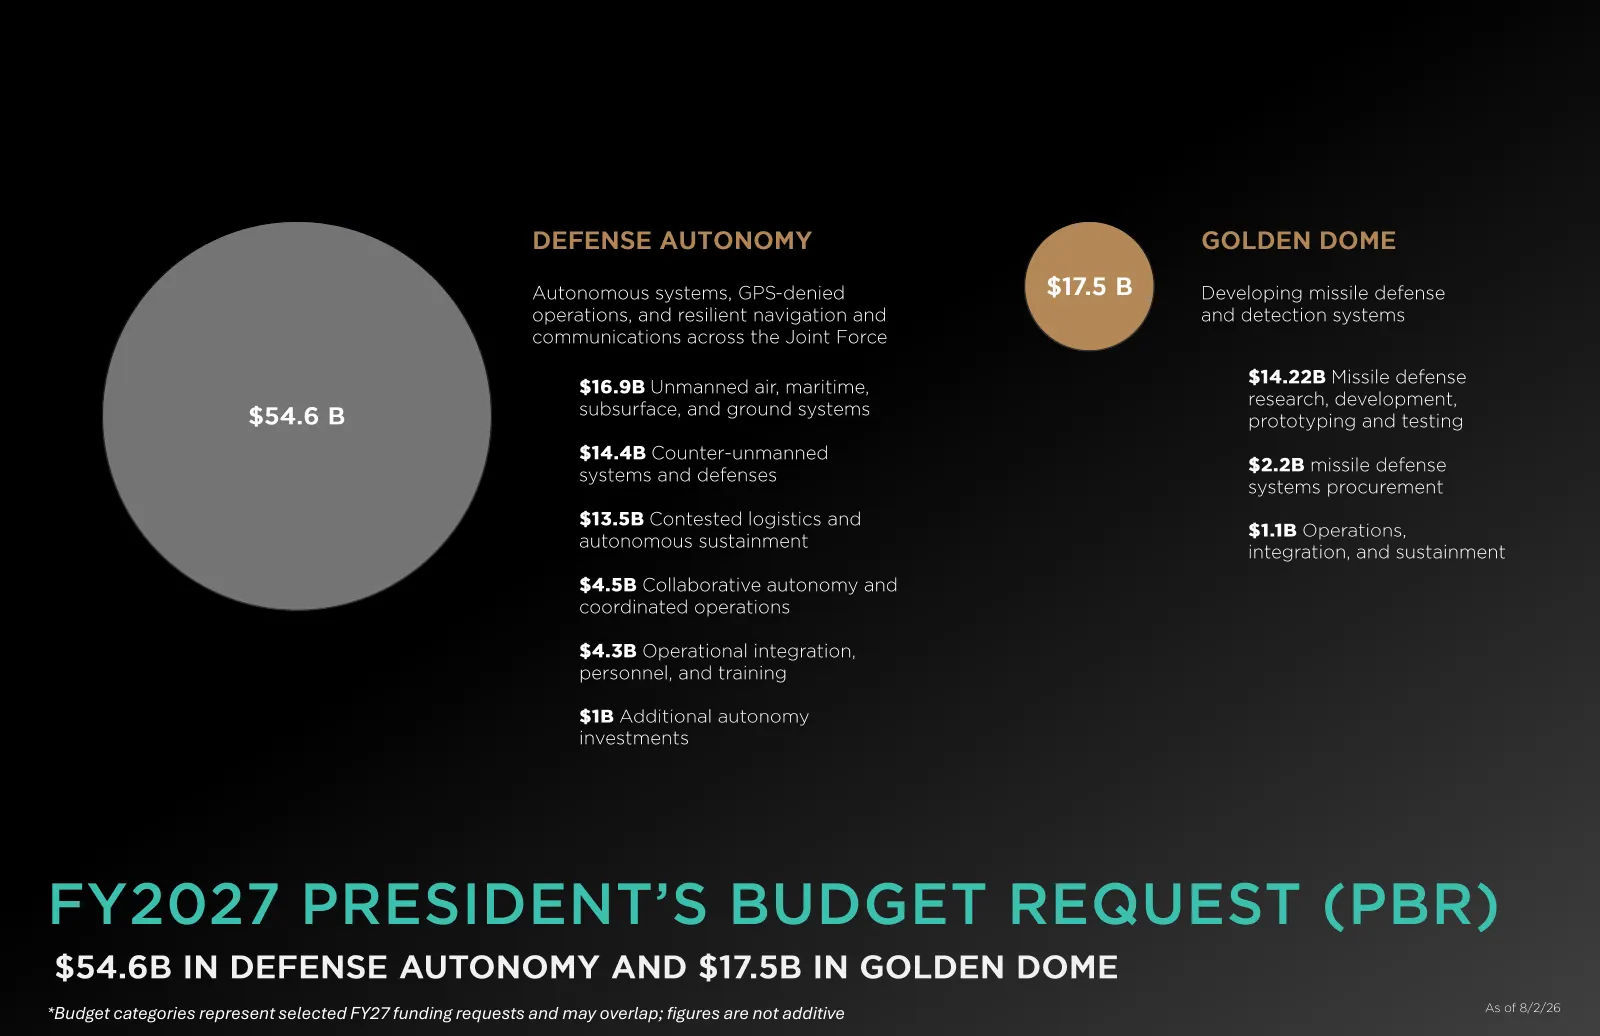
Slide 18: FY2027 President's Budget Request: Defense Autonomy and Golden Dome
DEFENSE AUTONOMY GOLDEN DOME Autonomous systems, GPS - denied $17.5 B Developing missile defense operations, and resilient navigation and and detection systems communications across the Joint Force $14.22B Missile defense $16.9B Unmanned air, maritime, research, development, $54.6 B subsurface, and
Slide 19: Revenue Potential
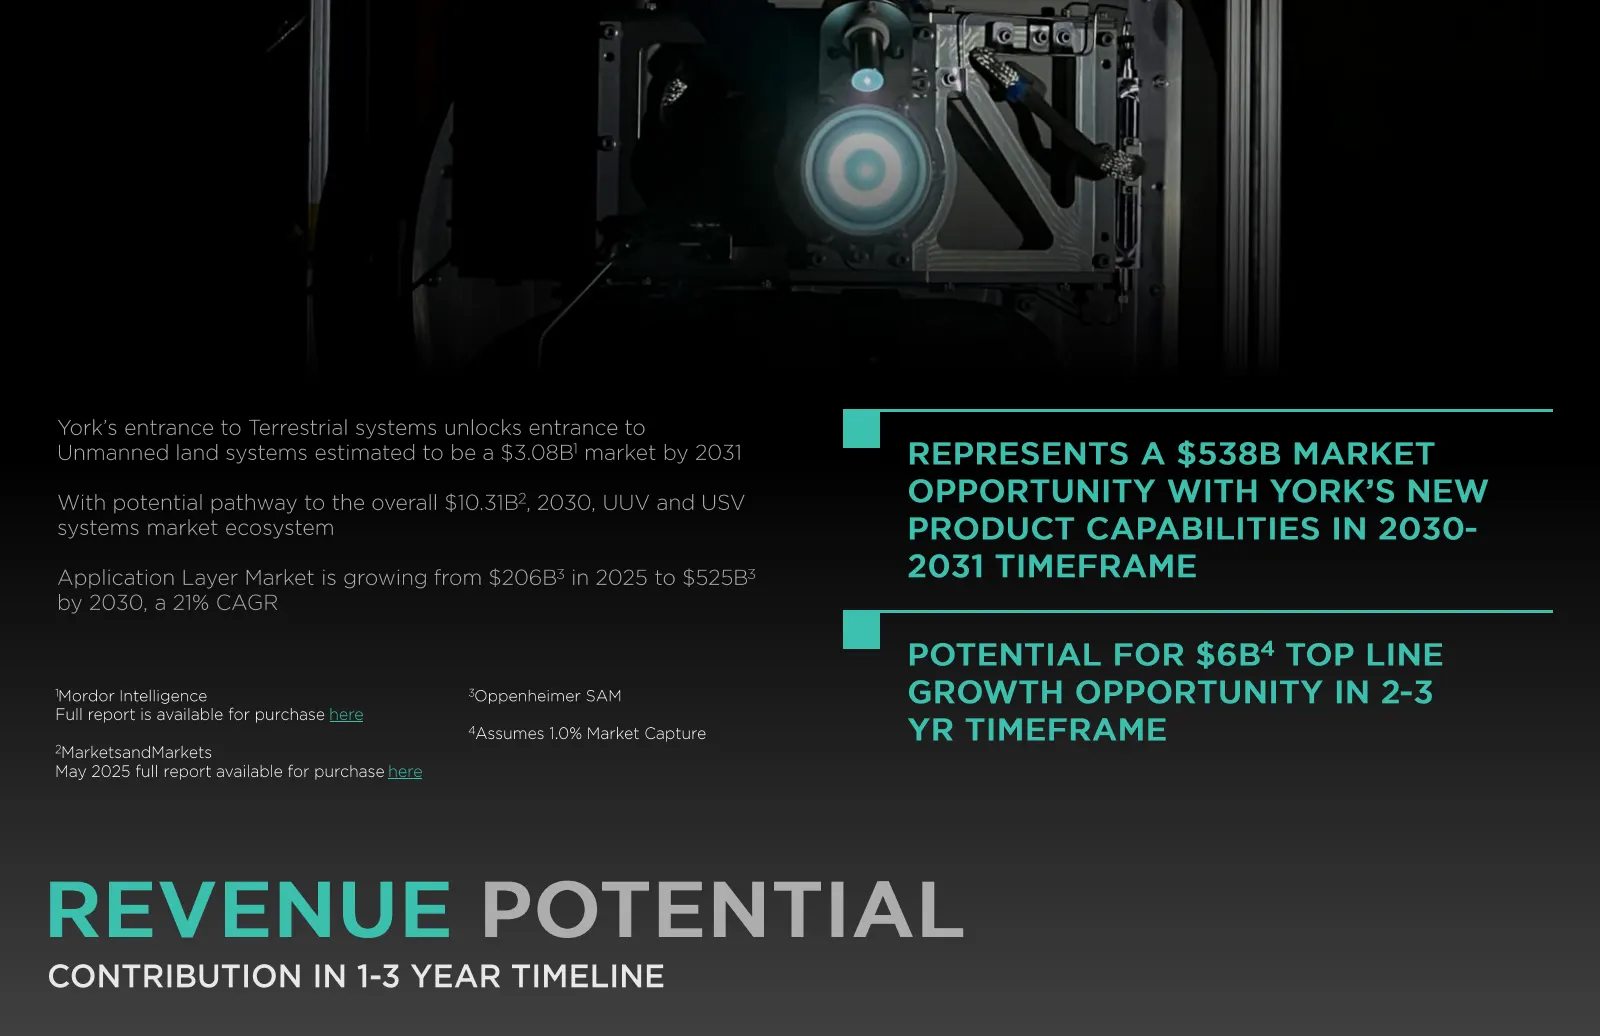
York’s entrance to Terrestrial systems unlocks entrance to Unmanned land systems estimated to be a $3.08B 1 market by 2031 REPRESENTS A $538B MARKET With potential pathway to the overall $10.31B 2 , 2030, UUV and USV OPPORTUNITY WITH YORK’S NEW systems market ecosystem PRODUCT CAPABILITIES IN 2030 -
Slide 20: Capabilities Demonstration
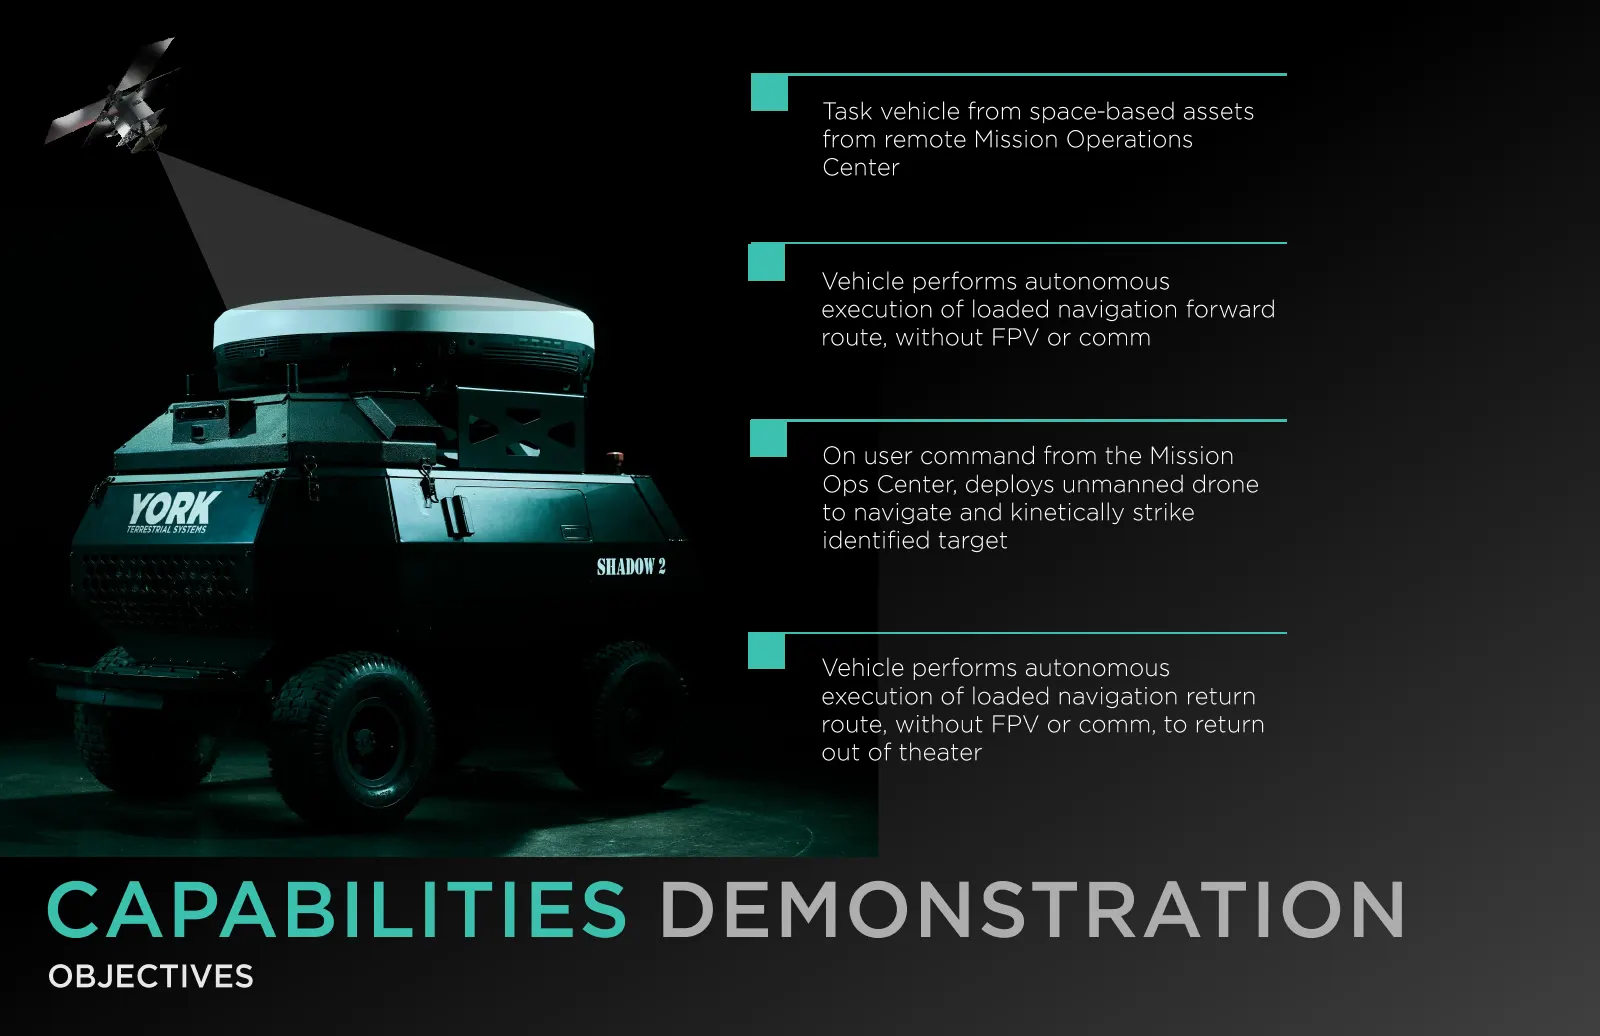
Task vehicle from space - based assets from remote Mission Operations Center Vehicle performs autonomous execution of loaded navigation forward route, without FPV or comm On user command from the Mission Ops Center, deploys unmanned drone to navigate and kinetically strike identified target Vehicle
Slide 21: Win Statistics
WIN STATISTICS CONTRACTS, BUDGETS & BACKLOG
Slide 22: $14.9 Billion Pipeline
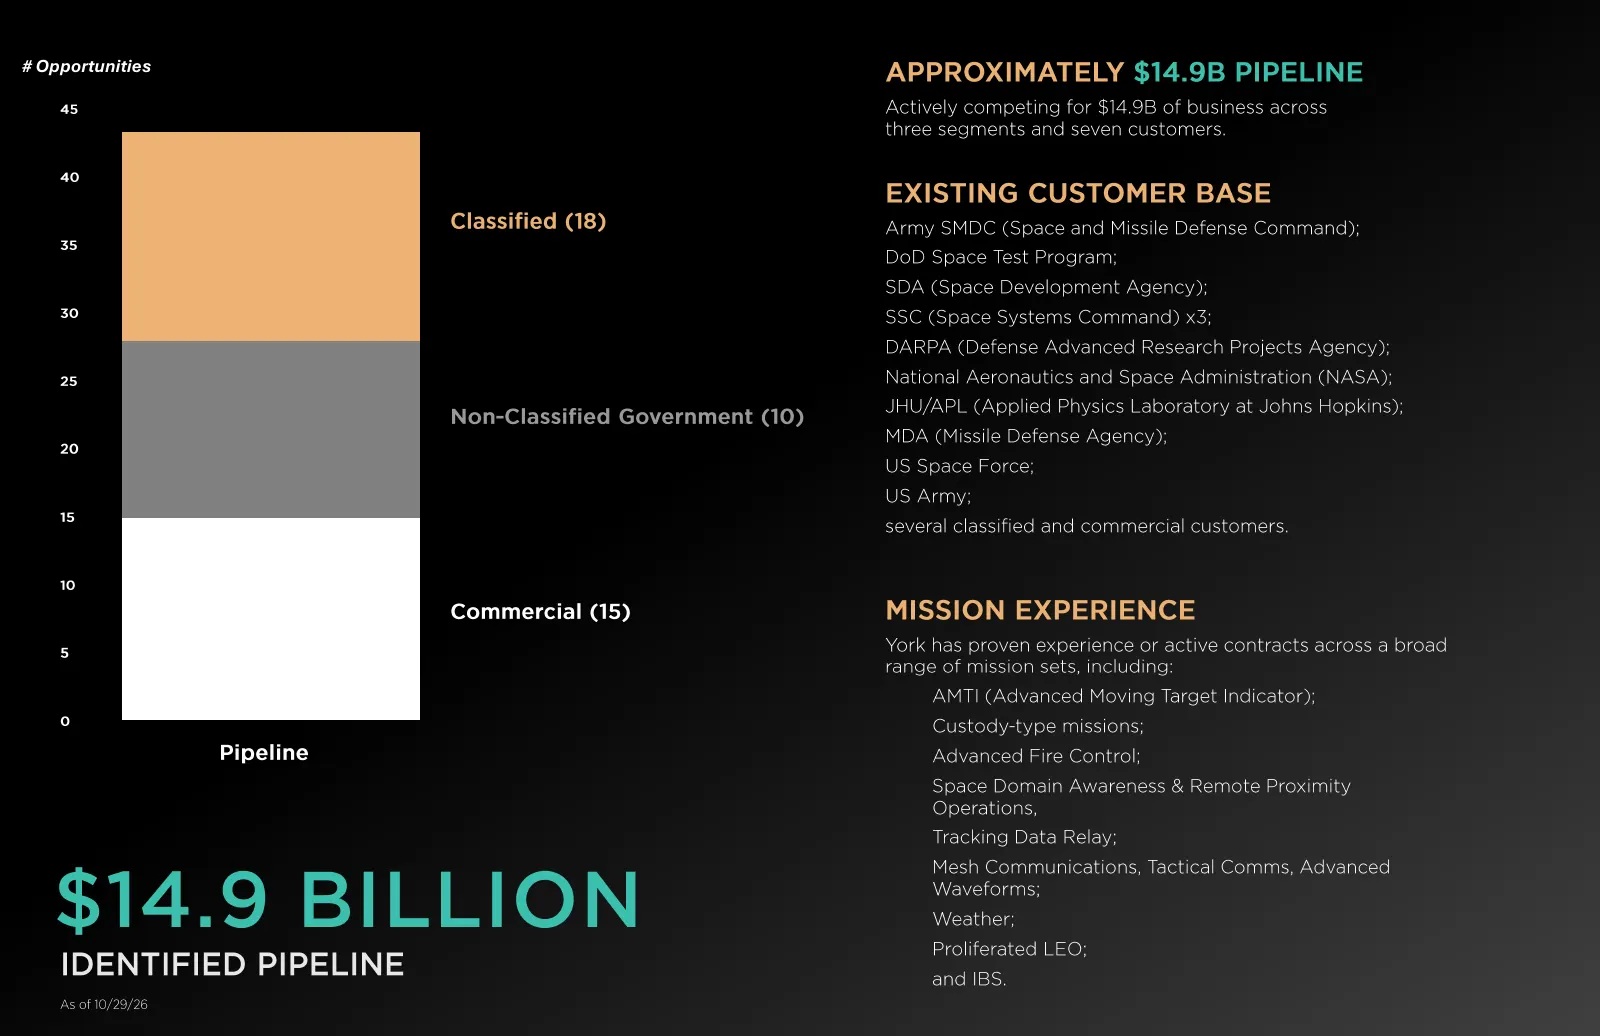
# Opportunities APPROXIMATELY $14.9B PIPELINE 45 Actively competing for $14.9B of business across three segments and seven customers. 40 EXISTING CUSTOMER BASE Classified (18) Army SMDC (Space and Missile Defense Command); 35 DoD Space Test Program; SDA (Space Development Agency); 30 SSC (Space Syst
Slide 23: ~$14.9B Contract Awards Pipeline
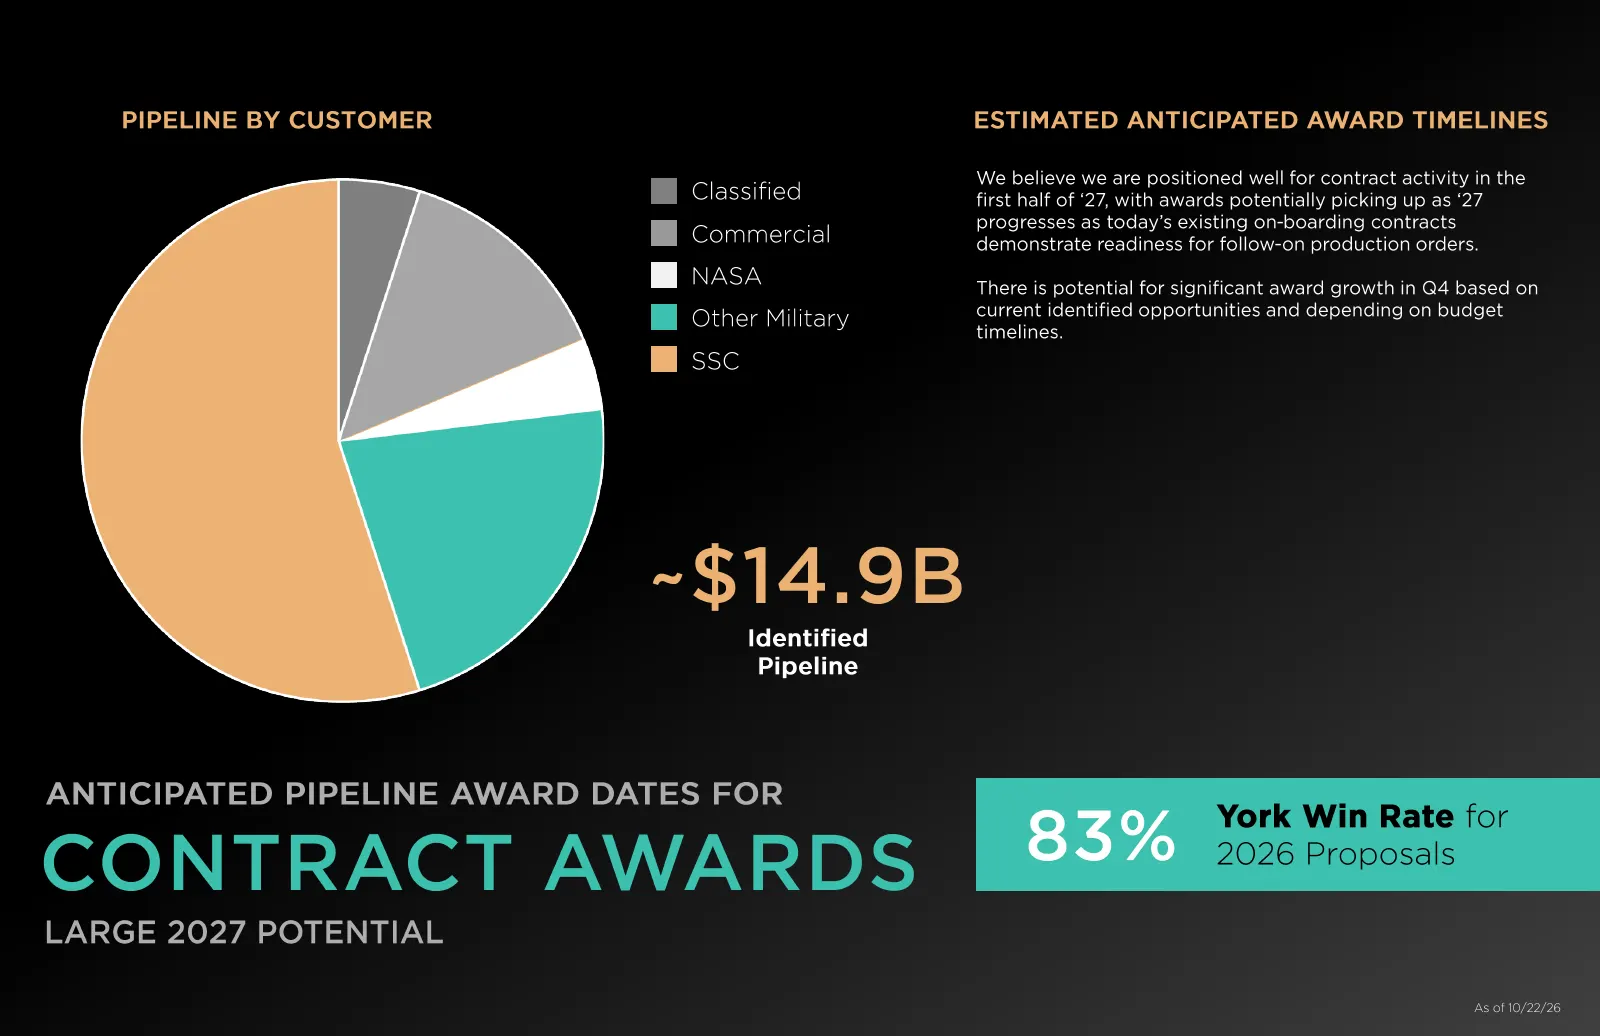
PIPELINE BY CUSTOMER ESTIMATED ANTICIPATED AWARD TIMELINES We believe we are positioned well for contract activity in the Classified first half of ‘27, with awards potentially picking up as ‘27 progresses as today’s existing on - boarding contracts Commercial demonstrate readiness for follow - on pr
Slide 24: FY2027 President's Budget Request by Mission Area
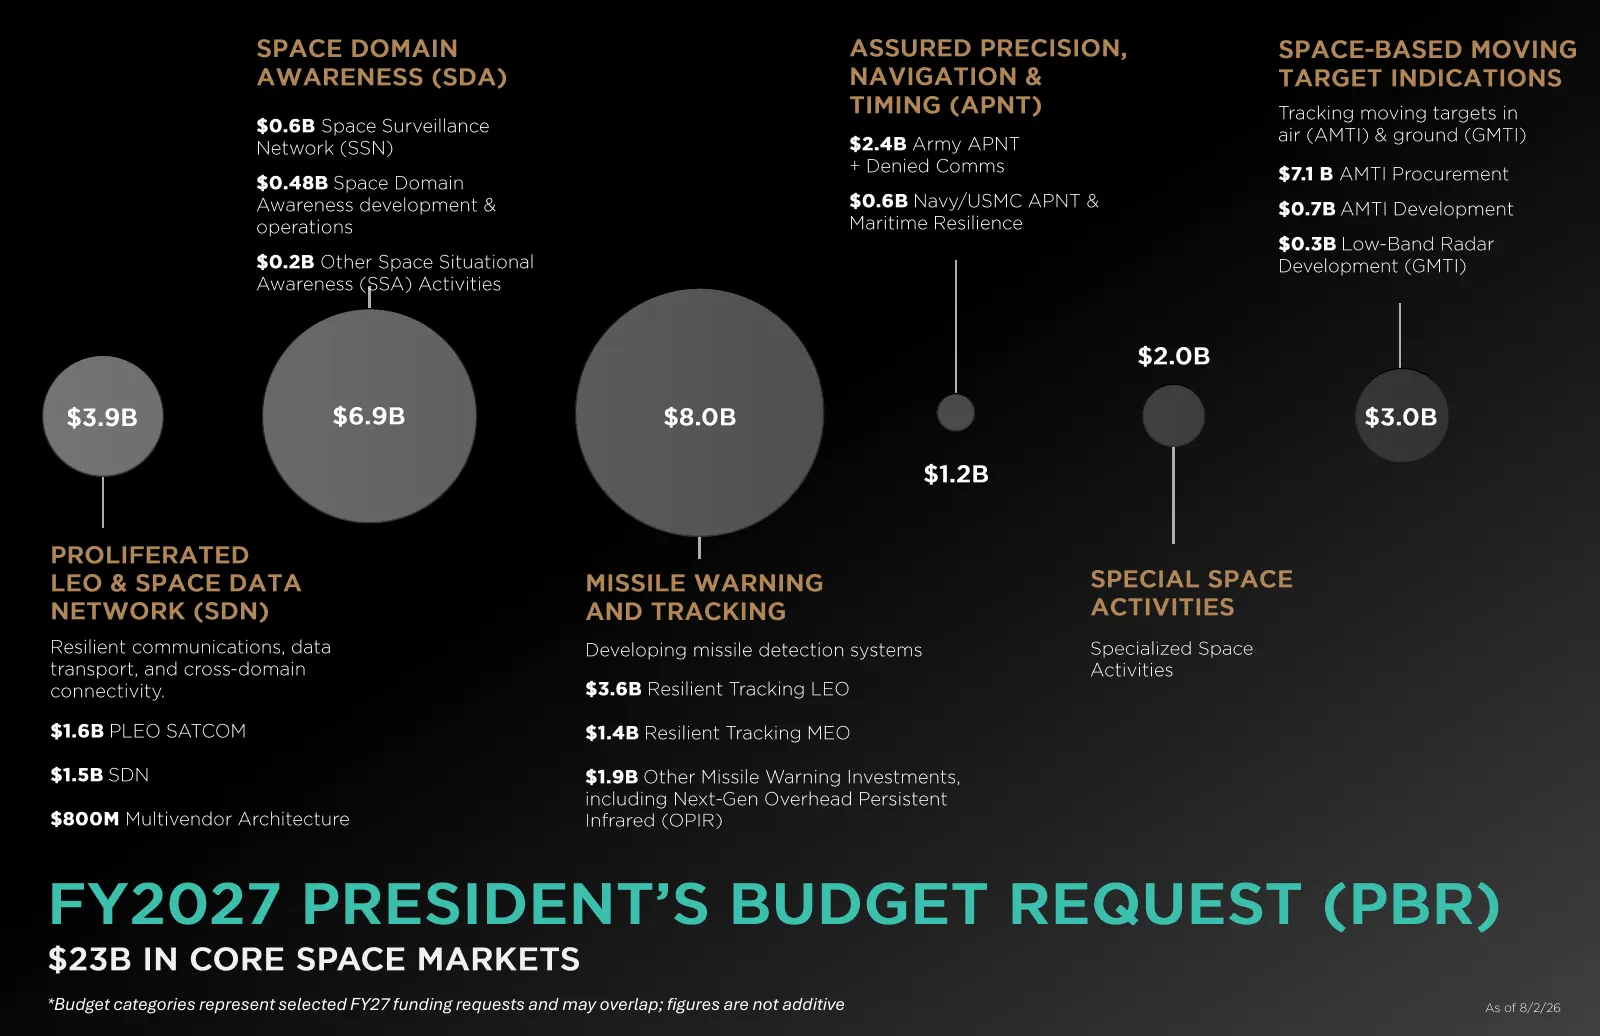
SPACE DOMAIN ASSURED PRECISION, SPACE - BASED MOVING AWARENESS (SDA) NAVIGATION & TARGET INDICATIONS TIMING (APNT) Tracking moving targets in $0.6B Space Surveillance air (AMTI) & ground (GMTI) Network (SSN) $2.4B Army APNT + Denied Comms $7.1 B AMTI Procurement $0.48B Space Domain Awareness develop
Slide 25: Awarded Contracts
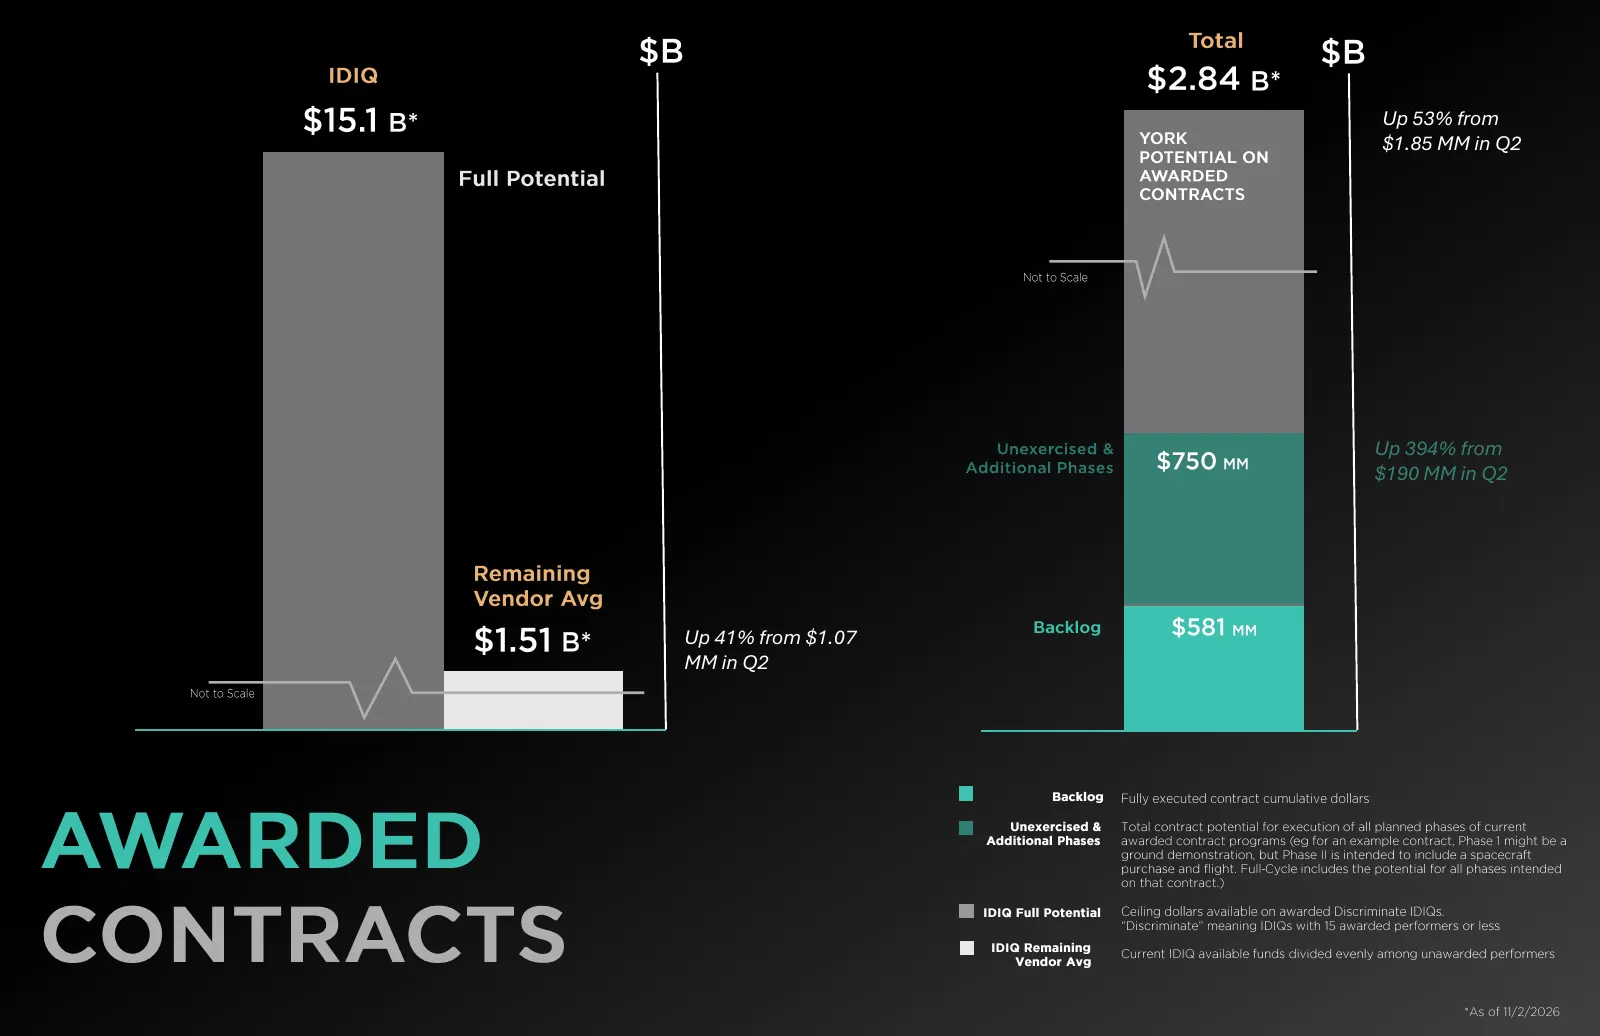
Total $B $B IDIQ $2.84 B* $15.1 B* Up 53% from YORK $1.85 MM in Q2 POTENTIAL ON Full Potential AWARDED CONTRACTS Not to Scale Up 394% from $750 MM $190 MM in Q2 Remaining Vendor Avg Up 41% from $1.07 Backlog $581 MM $1.51 B* MM in Q2 Not to Scale Backlog Fully executed contract cumulative dollars AW
Slide 26: Financials
FINANCIALS
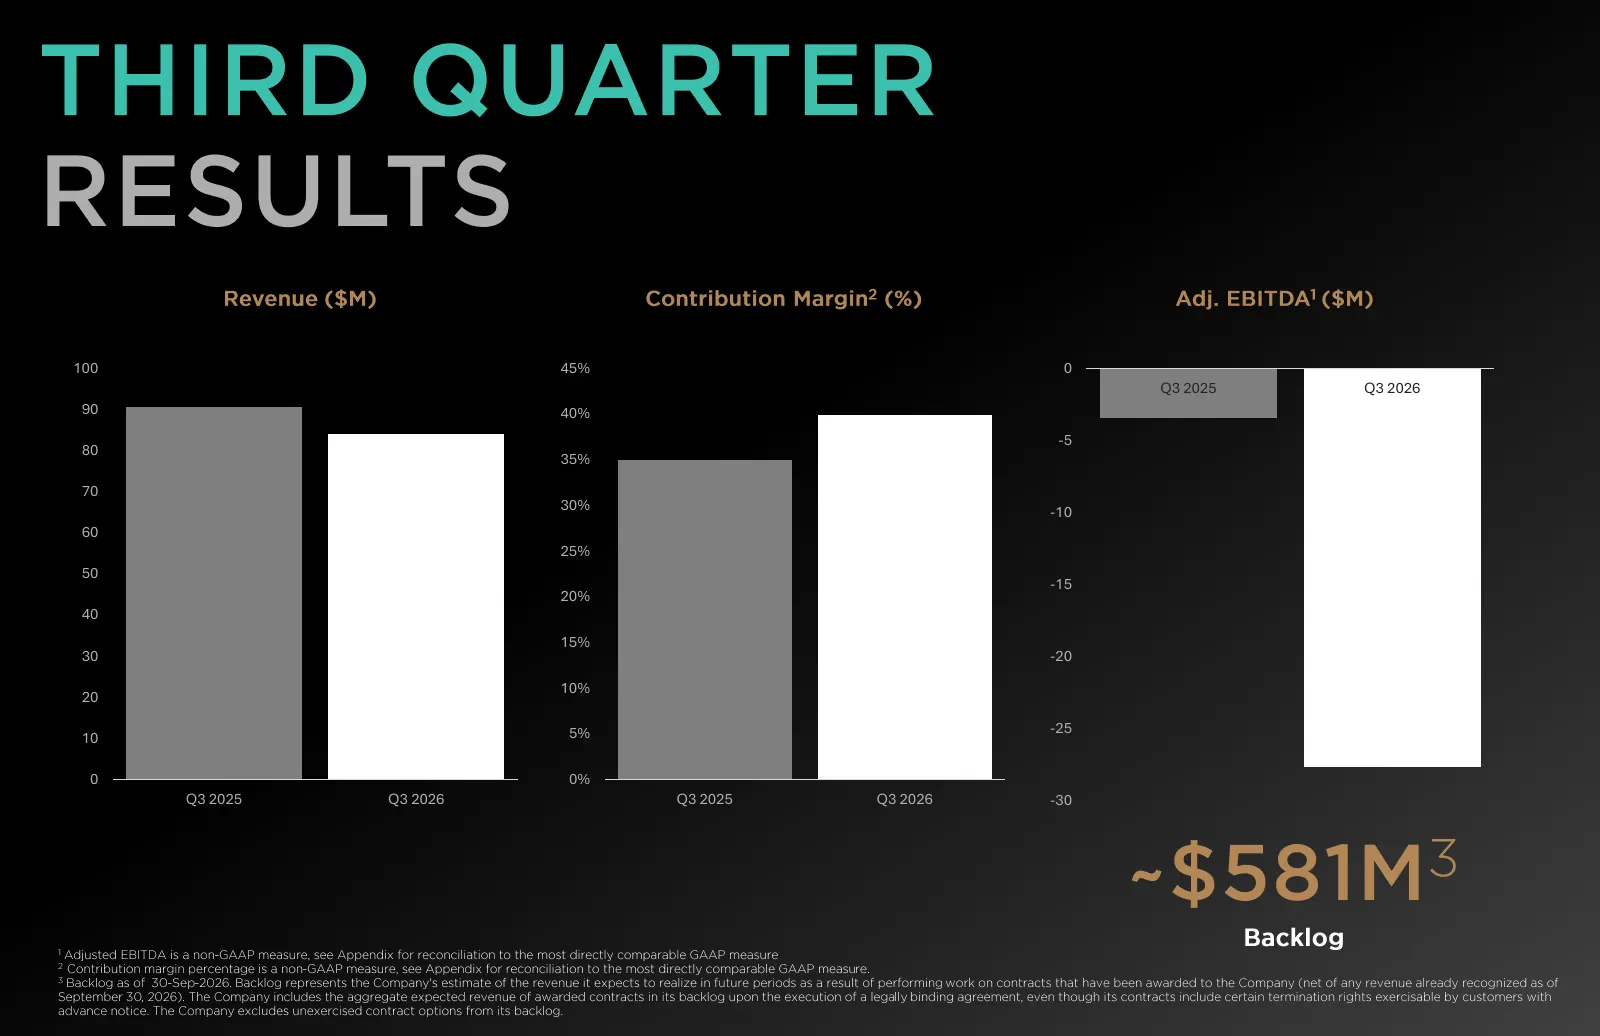
Slide 27: Third Quarter Results
THIRD QUARTER RESULTS Revenue ($M) Contribution Margin 2 (%) Adj. EBITDA 1 ($M) 100 45% 0 Q3 2025 Q3 2026 90 40% -5 80 35% 70 30% -10 60 25% 50 -15 20% 40 15% 30 -20 10% 20 5% -25 10 0 0% Q3 2025 Q3 2026 Q3 2025 Q3 2026 -30 ~$581M 3 1 Adjusted EBITDA is a non Backlog - GAAP measure, see Appendix for
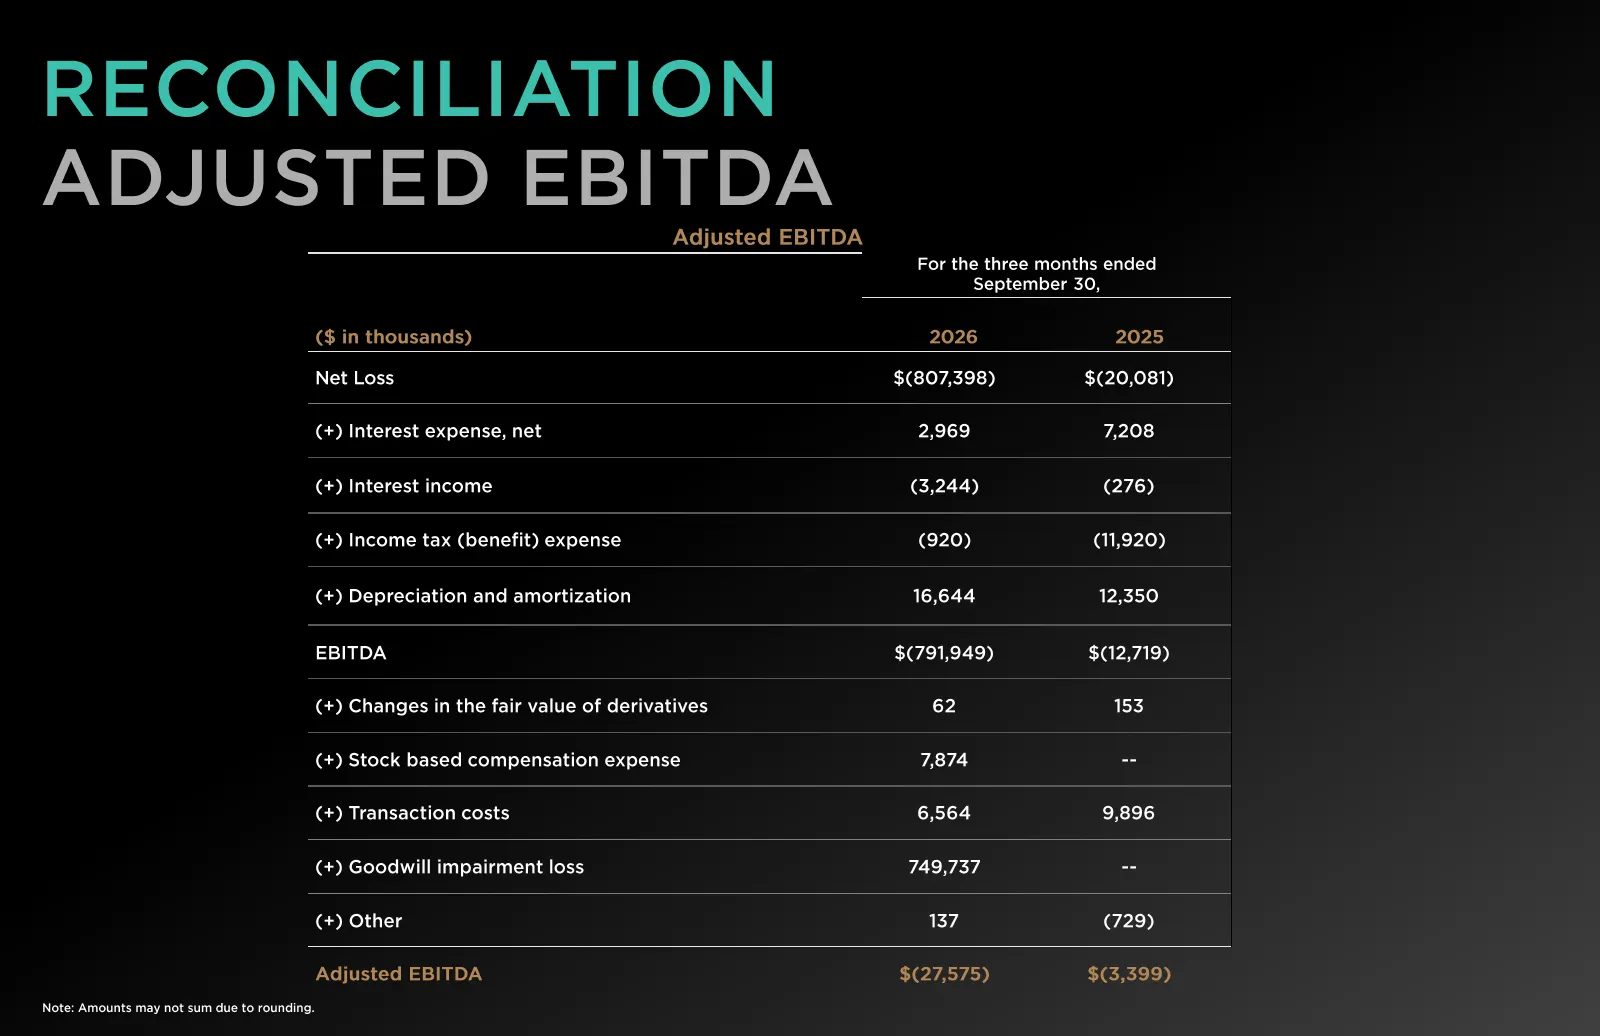
Slide 28: Reconciliation: Adjusted EBITDA
RECONCILIATION ADJUSTED EBITDA Adjusted EBITDA For the three months ended September 30, ($ in thousands) 2026 2025 Net Loss $(807,398) $(20,081) (+) Interest expense, net 2,969 7,208 (+) Interest income (3,244) (276) (+) Income tax (benefit) expense (920) (11,920) (+) Depreciation and amortization 1
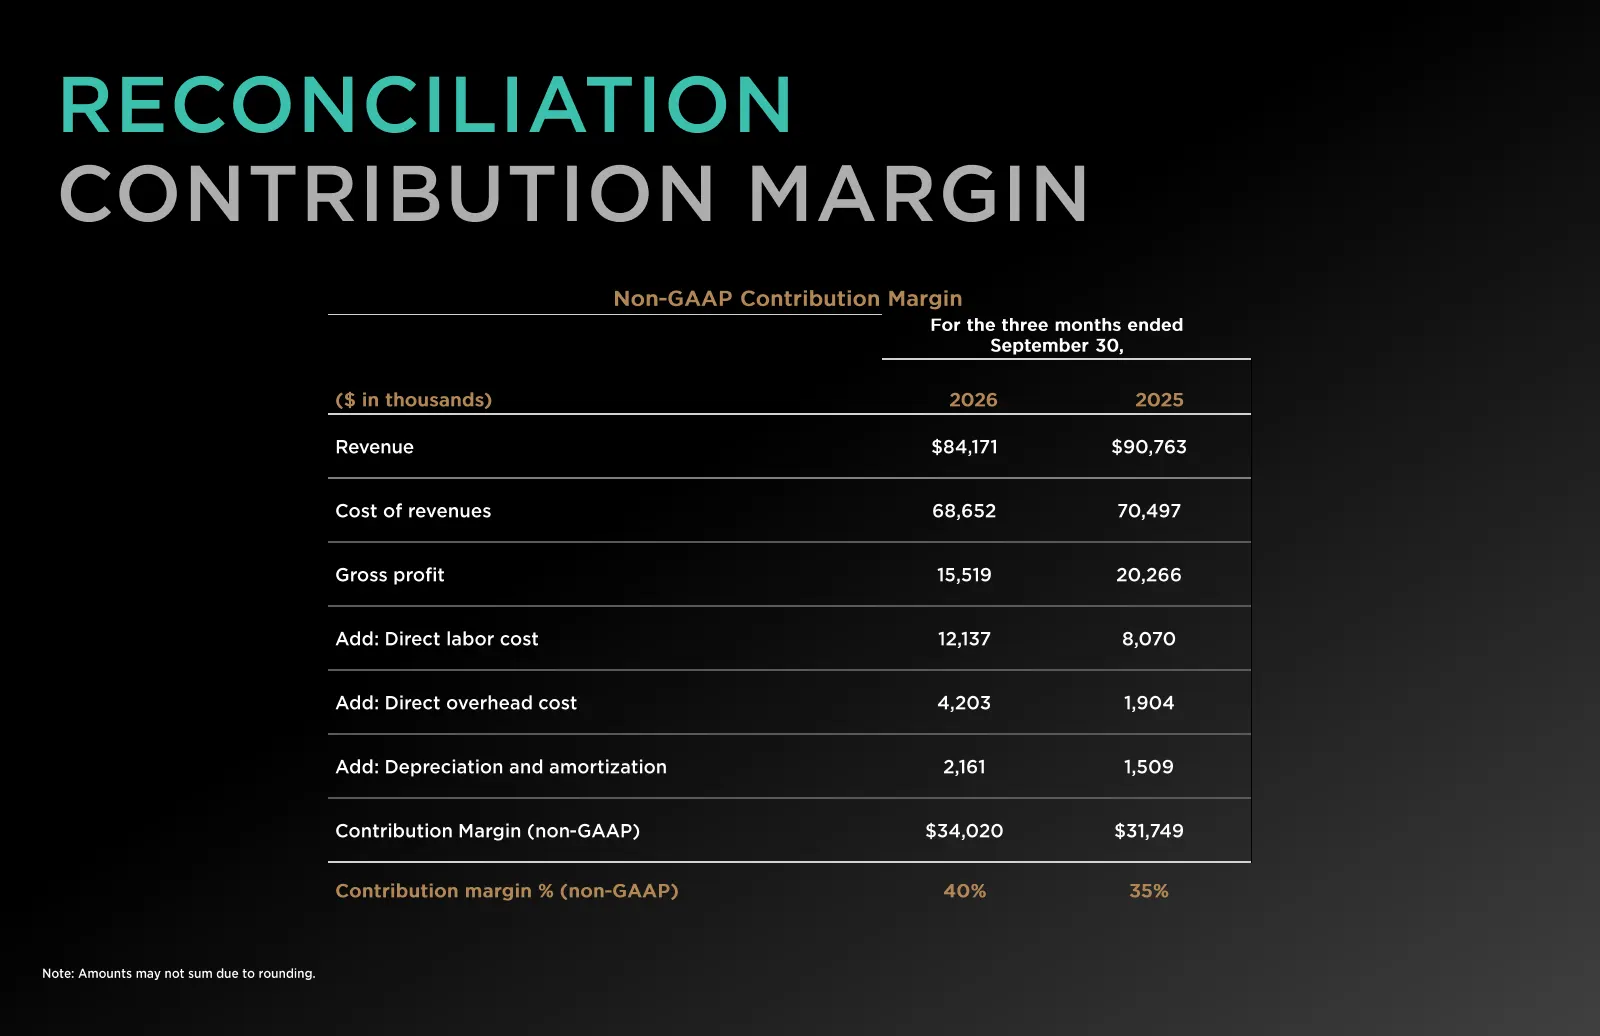
Slide 29: Reconciliation: Contribution Margin
RECONCILIATION CONTRIBUTION MARGIN Non - GAAP Contribution Margin For the three months ended September 30, ($ in thousands) 2026 2025 Revenue $84,171 $90,763 Cost of revenues 68,652 70,497 Gross profit 15,519 20,266 Add: Direct labor cost 12,137 8,070 Add: Direct overhead cost 4,203 1,904 Add: Depre
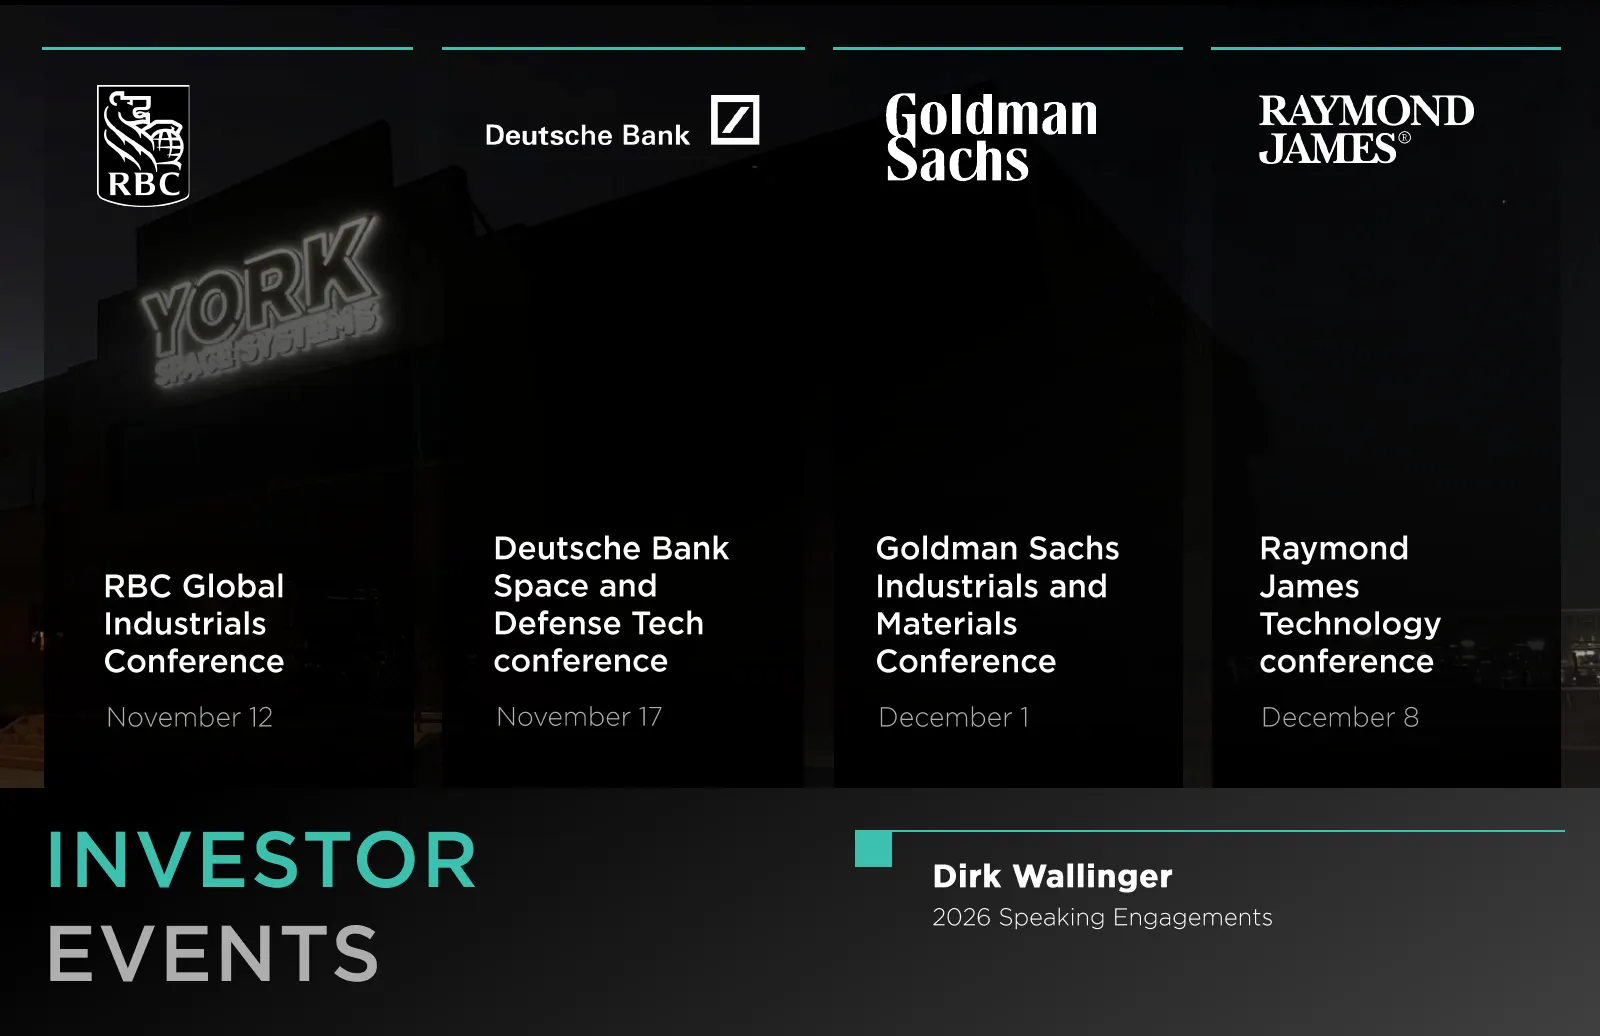
Slide 30: Investor Events
Deutsche Bank Goldman Sachs Raymond RBC Global Space and Industrials and James Industrials Defense Tech Materials Technology Conference conference Conference conference November 12 November 17 December 1 December 8 INVESTOR Dirk Wallinger 2026 Speaking Engagements EVENTS
Source: 6ix earnings call