GAIN Capital — Merger or Acquisition (October 2014)
24 slides from GAIN Capital's merger presentation, Oct 31, 2014
Slide 1: Safe Harbor Statement
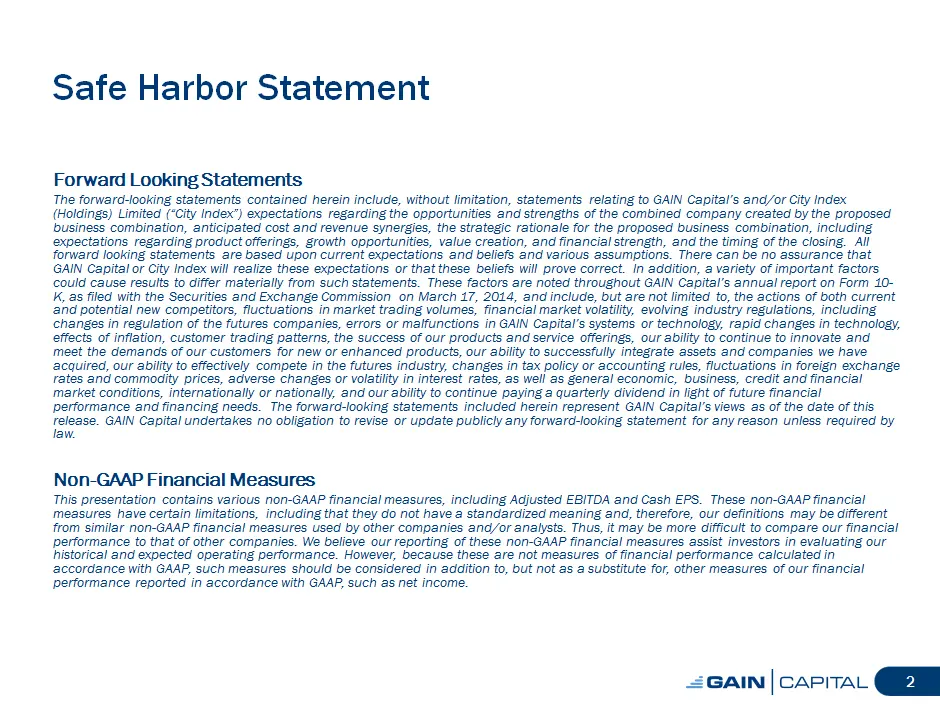
Safe Harbor Statement Forward Looking Statements The forward -looking statements contained herein include, without limitation, statements relating to GAIN Capital's and/or City Index (Holdings) Limited ("City Index") expectations regarding the opportunities and strengths of the combined company crea
Slide 2: Presenter: Glenn Stevens, CEO, GAIN Capital
and Glenn Stevens CEO, GAIN Capital 3
Slide 3: GAIN Capital + City Index: Creating A Global Leader in Online Trading
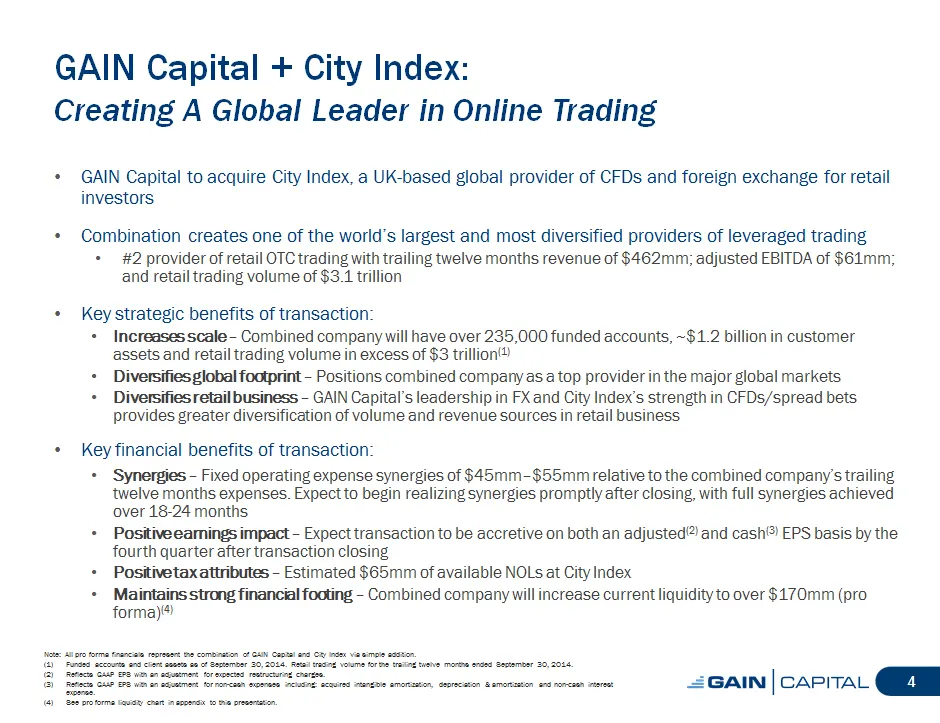
GAIN Capital + City Index: Creating A Global Leader in Online Trading [] GAIN Capital to acquire City Index, a UK-based global provider of CFDs and foreign exchange for retail investors [] Combination creates one of the world's largest and most diversified providers of leveraged trading [] #2 provid
Slide 4: Summary of Transaction
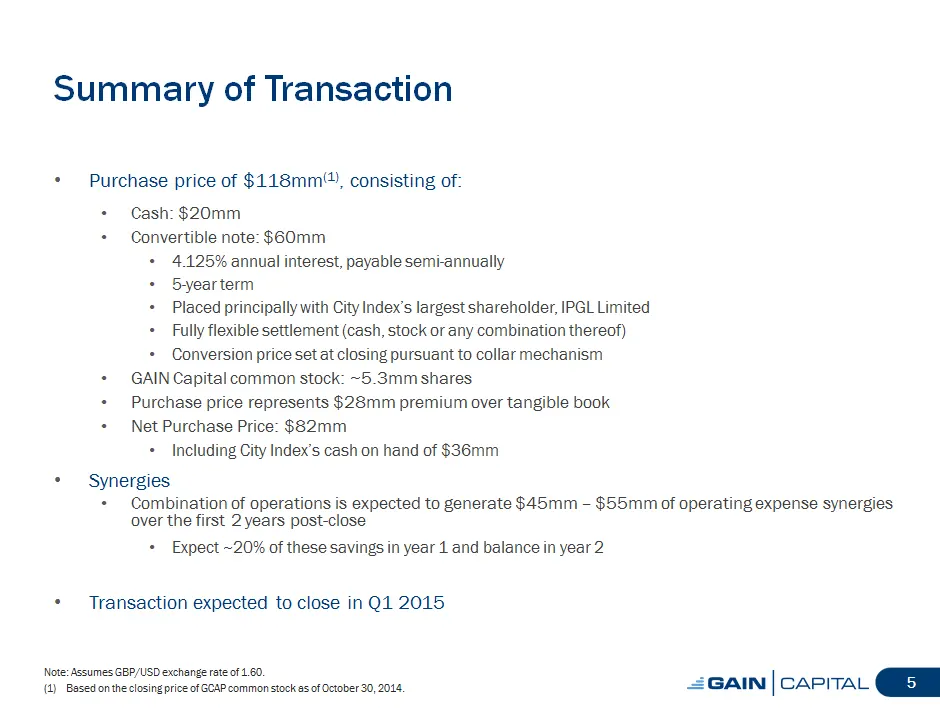
Summary of Transaction [] Purchase price of $118mm (1) , consisting of: [] Cash: $20mm [] Convertible note: $60mm [] 4.125% annual interest, payable semi-annually [] 5-year term [] Placed principally with City Index's largest shareholder, IPGL Limited [] Fully flexible settlement (cash, stock or any
Slide 5: City Index Overview
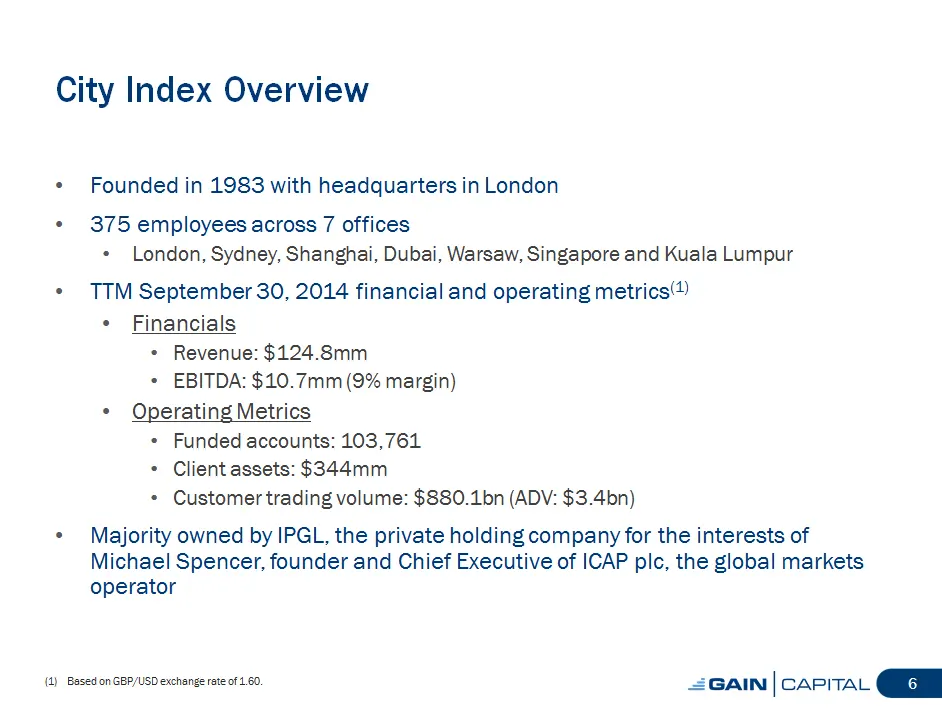
City Index Overview [] Founded in 1983 with headquarters in London [] 375 employees across 7 offices [] London, Sydney, Shanghai, Dubai, Warsaw, Singapore and Kuala Lumpur [] TTM September 30, 2014 financial and operating metrics (1) [] Financials [] Revenue: $124.8mm [] EBITDA: $10.7mm (9% margin)
Slide 6: City Index Overview (cont.)
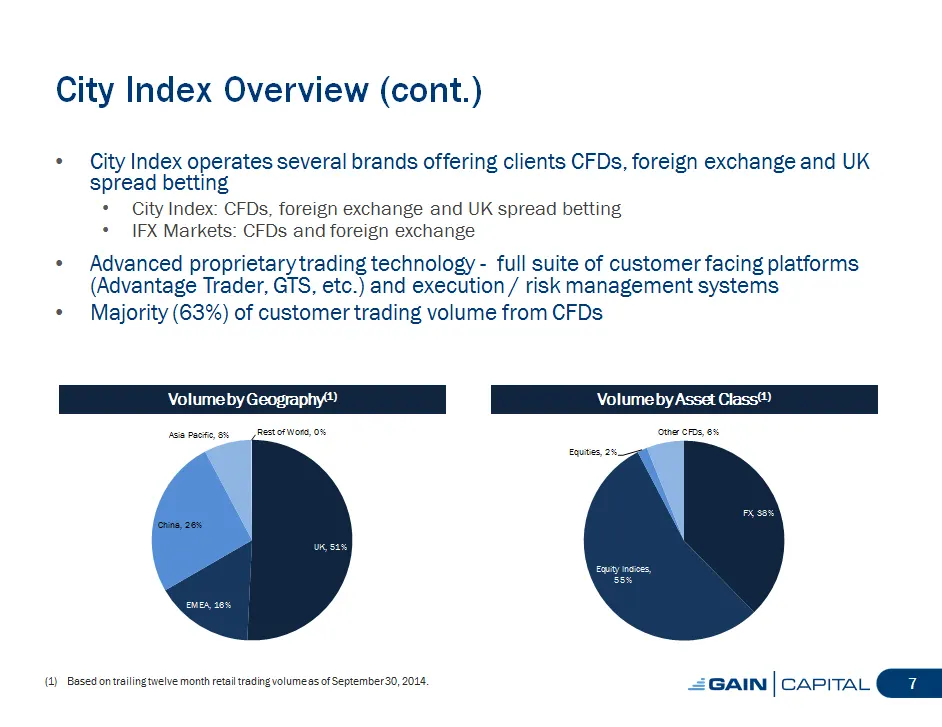
City Index Overview (cont. ) [] City Index operates several brands offering clients CFDs, foreign exchange and UK spread betting [] City Index: CFDs, foreign exchange and UK spread betting [] IFX Markets: CFDs and foreign exchange [] Advanced proprietary trading technology - full suite of customer f
Slide 7: City Index Historical Financials and Operating Metrics
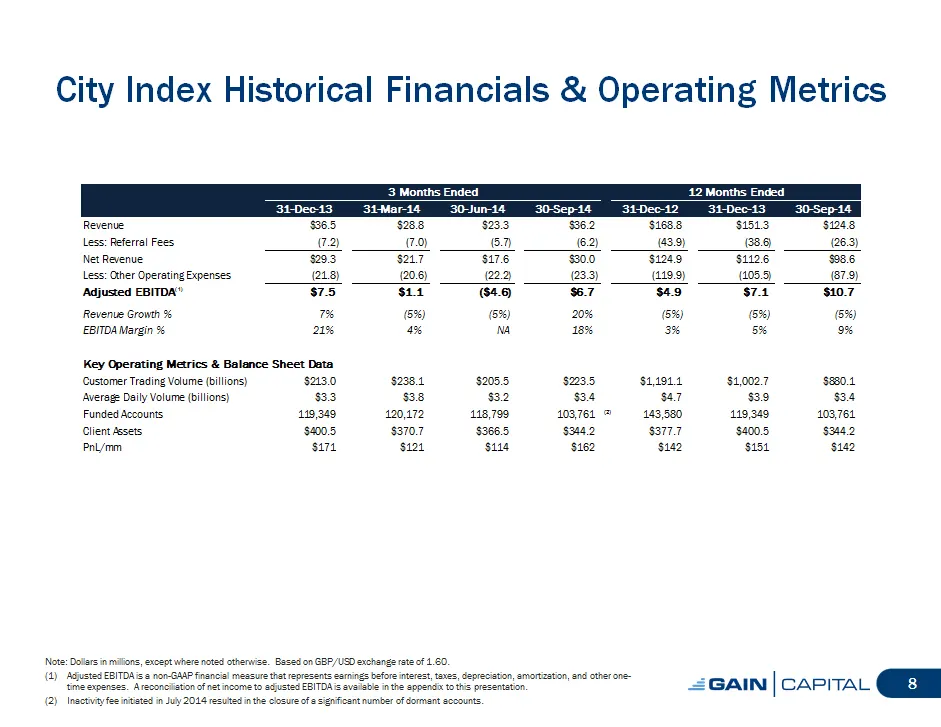
City Index Historical Financials and Operating Metrics 3 Months Ended 31- Dec - 13 31- Mar - 14 30- Jun - 14 Revenue $36.5 $28.8 $23.3 Less: Referral Fees (7.2) (7.0) (5.7) =============== =============== ============= Net Revenue $29.3 $21.7 $17.6 Less: Other Operating Expenses (21.8) (20.6) (22.2)
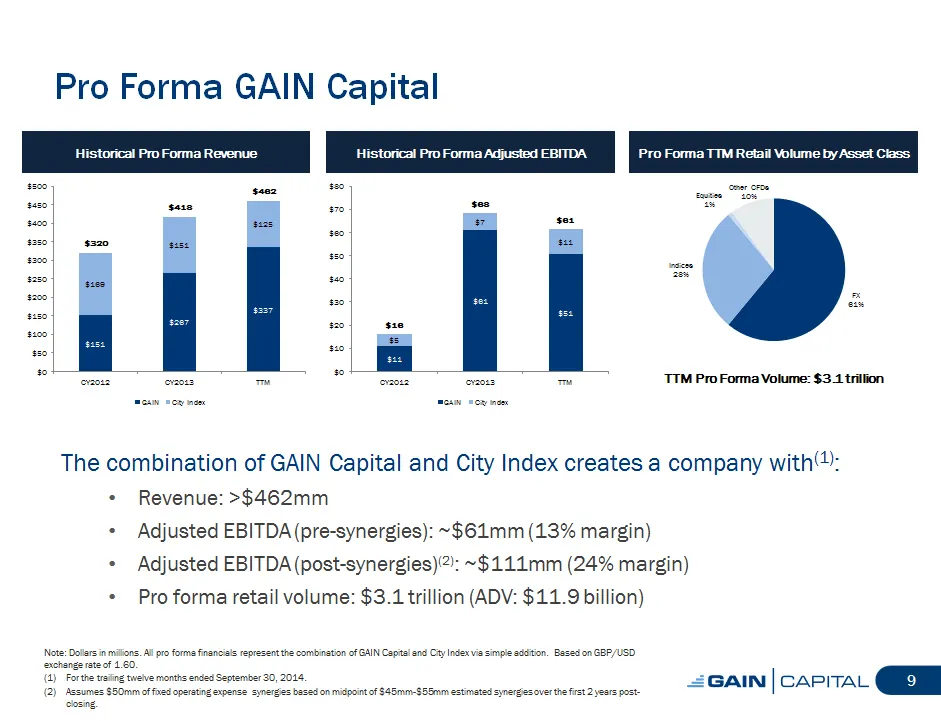
Slide 8: Pro Forma GAIN Capital Historical Pro Forma
Pro Forma GAIN Capital Historical Pro Forma Revenue $500 $462 $450 $418 $400 $125 $350 $320 $151 $300 $250 $169 $200 $337 $150 $267 $100 $151 $50 $0 CY2012 CY2013 TTM GAIN City Index Historical Pro Forma Adjusted EBITDA $80 $68 $70 $7 $61 $60 $11 $50 $40 $30 $61 $51 $20 $16 $5 $10 $11 $0 CY2012 CY20
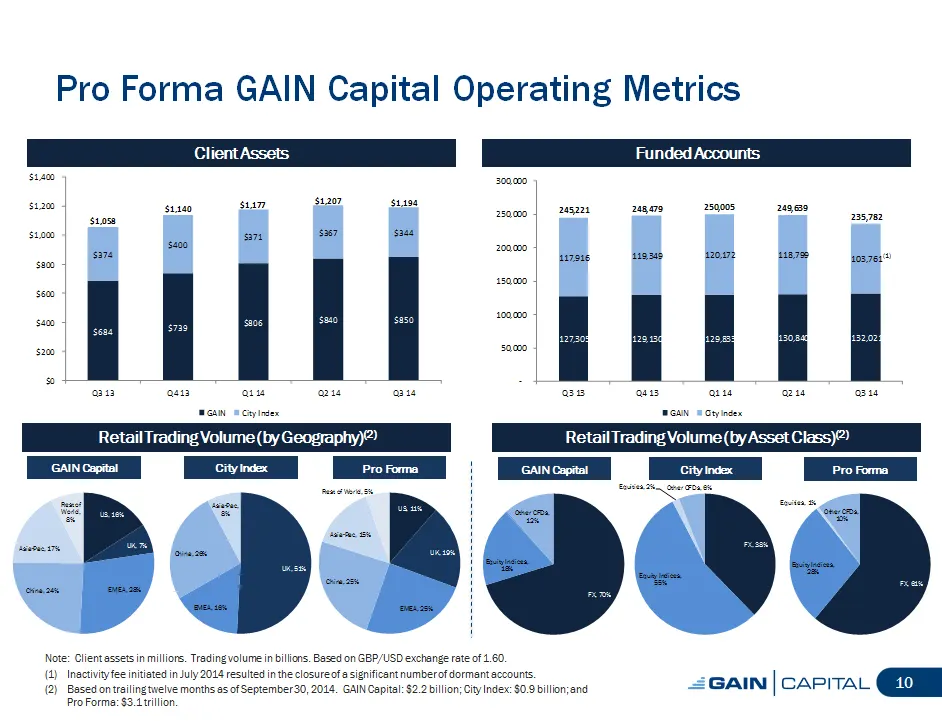
Slide 9: Pro Forma GAIN Capital Operating Metrics
Pro Forma GAIN Capital Operating Metrics Client Assets $1,400 $1,177 $1,207 $1,194 $1,200 $1,140 $1,058 $1,000 $367 $344 $371 $400 $374 $800 $600 $400 $806 $840 $850 $739 $684 $200 $0 Q3 13 Q4 13 Q1 14 Q2 14 Q3 14 GAIN City Index Funded Accounts 300,000 245,221 248,479 250,005 249,639 250,000 235,78
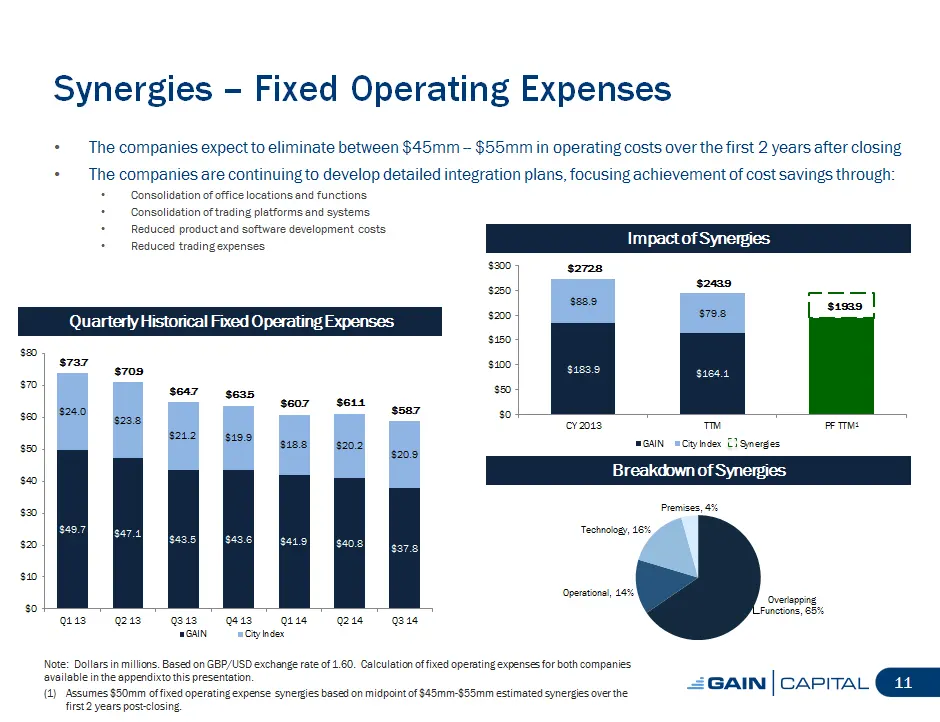
Slide 10: Synergies -- Fixed Operating Expenses
Synergies -- Fixed Operating Expenses [] The companies expect to eliminate between $45mm -- $55mm in operating costs over the first 2 years after closing [] The companies are continuing to develop detailed integration plans, focusing achievement of cost savings through: [] Consolidation of office lo
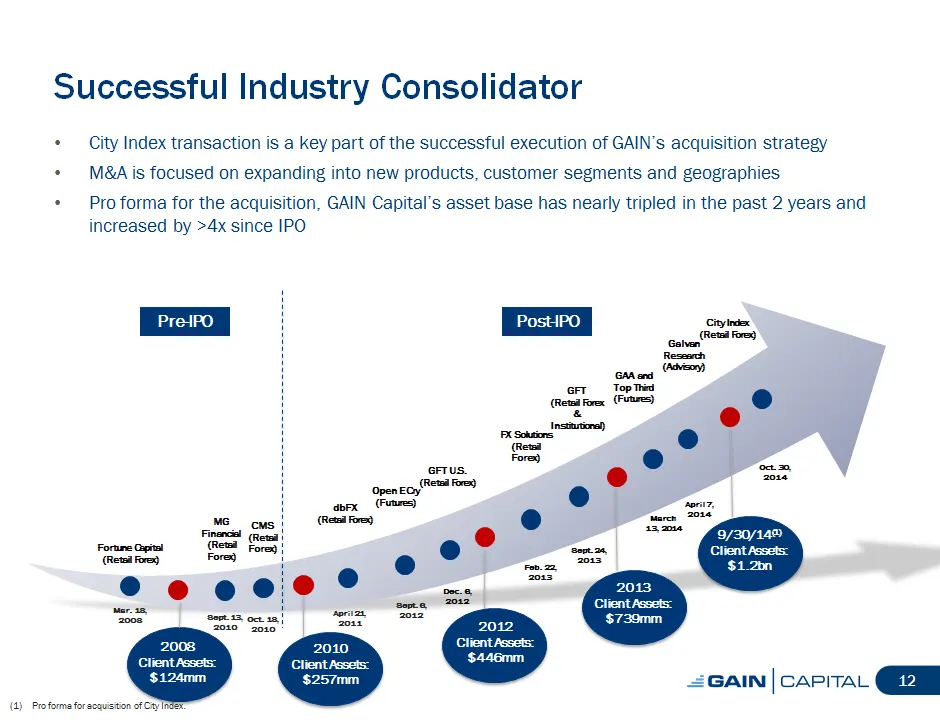
Slide 11: Successful Industry Consolidator
Successful Industry Consolidator [] City Index transaction is a key part of the successful execution of GAIN's acquisition strategy [] MandA is focused on expanding into new products, customer segments and geographies [] Pro forma for the acquisition, GAIN Capital's asset base has nearly tripled in
Slide 12: Pro Forma Industry Landscape
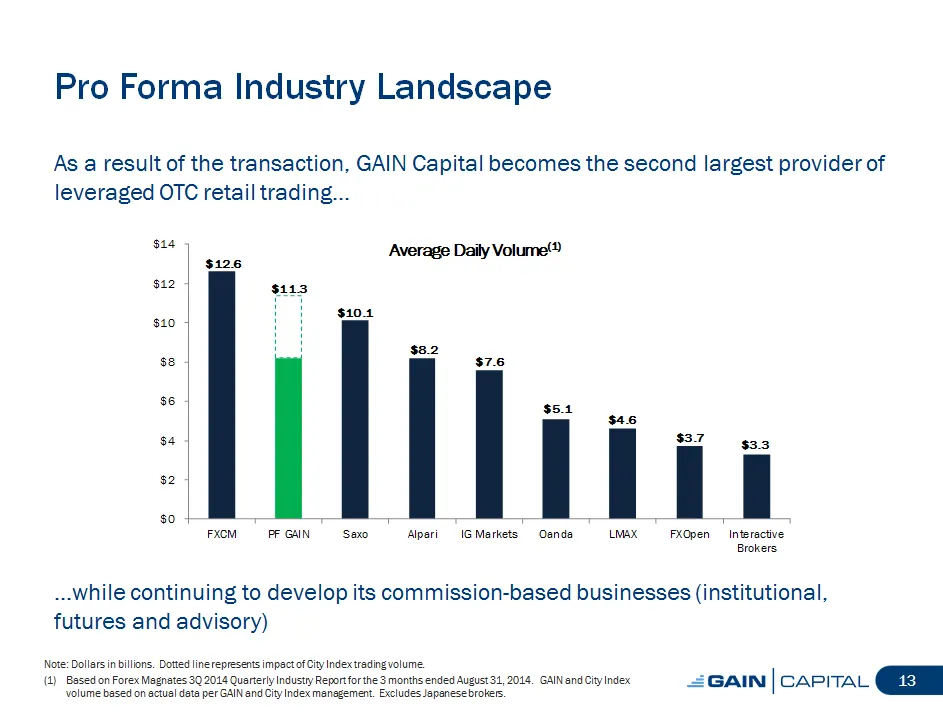
Pro Forma Industry Landscape As a result of the transaction, GAIN Capital becomes the second largest provider of leveraged OTC retail trading[] $14 Average Daily Volume (1) $ 12.6 $12 $11.3 $10.1 $10 $8 .2 $8 $7.6 $6 $5.1 $4 .6 $4 $3.7 $3 .3 $2 $0 FXCM PF GAIN Saxo Alpari IG Markets Oanda LMAX FXOpe
Slide 13: Q3 2014 GAIN Capital Flash Results
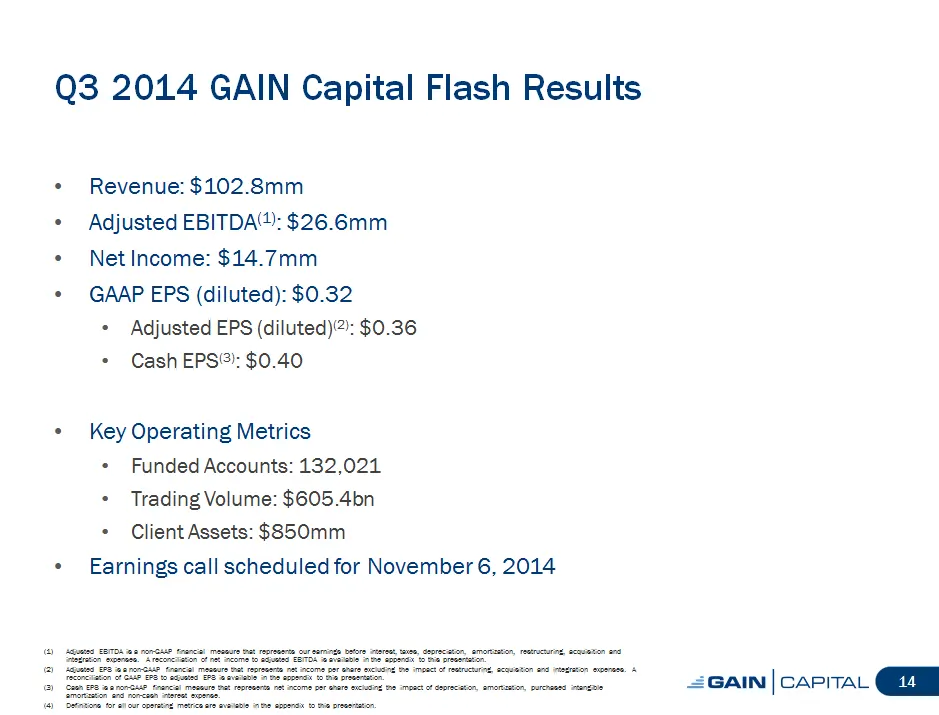
Q3 2014 GAIN Capital Flash Results [] Revenue: $102.8mm [] Adjusted EBITDA (1): $26.6mm [] Net Income: $14.7mm [] GAAP EPS (diluted): $0.32 [] Adjusted EPS (diluted) (2): $0.36 [] Cash EPS(3): $0.40 [] Key Operating Metrics [] Funded Accounts: 132,021 [] Trading Volume: $605.4bn [] Client Assets: $8
Slide 14: Closing Remarks
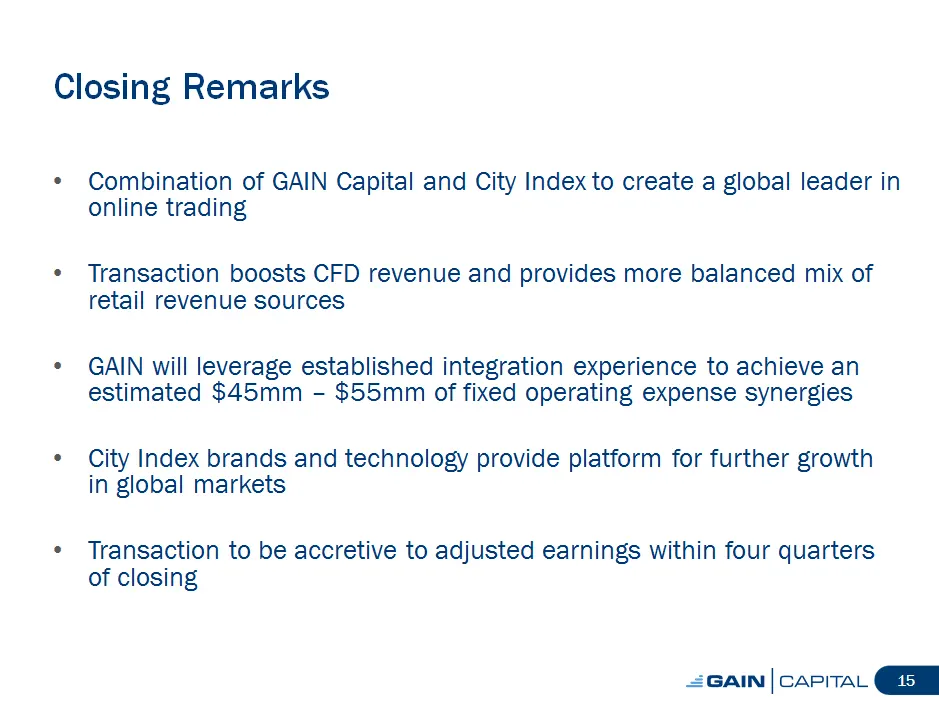
Closing Remarks [] Combination of GAIN Capital and City Index to create a global leader in online trading [] Transaction boosts CFD revenue and provides more balanced mix of retail revenue sources [] GAIN will leverage established integration experience to achieve an estimated $45mm -- $55mm of fixe
Slide 15: Closing Remarks
Closing Remarks * Combination of GAIN Capital and City Index to create a global leader in online trading * Transaction boosts CFD revenue and provides more balanced mix of retail revenue sources * GAIN will leverage established integration experience to achieve an estimated $45mm - $55mm of fixed op
Slide 16: Pro Forma Liquidity
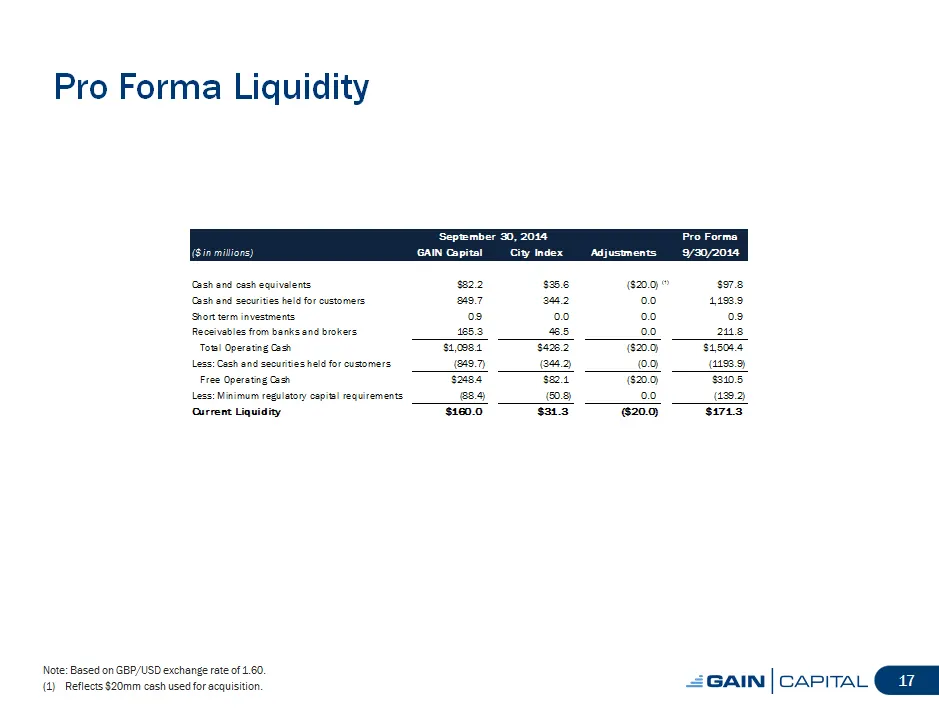
Pro Forma Liquidity September 30, 2014 ($ in millions) GAIN Capital City Index Cash and cash equivalents $82.2 $35.6 Cash and securities held for customers 849.7 344.2 Short term investments 0.9 0.0 Receivables from banks and brokers 165.3 46.5 ================ ============== Total Operating Cash $1
Slide 17: Fixed Operating Expenses Reconciliation (City Index and GAIN Capital)
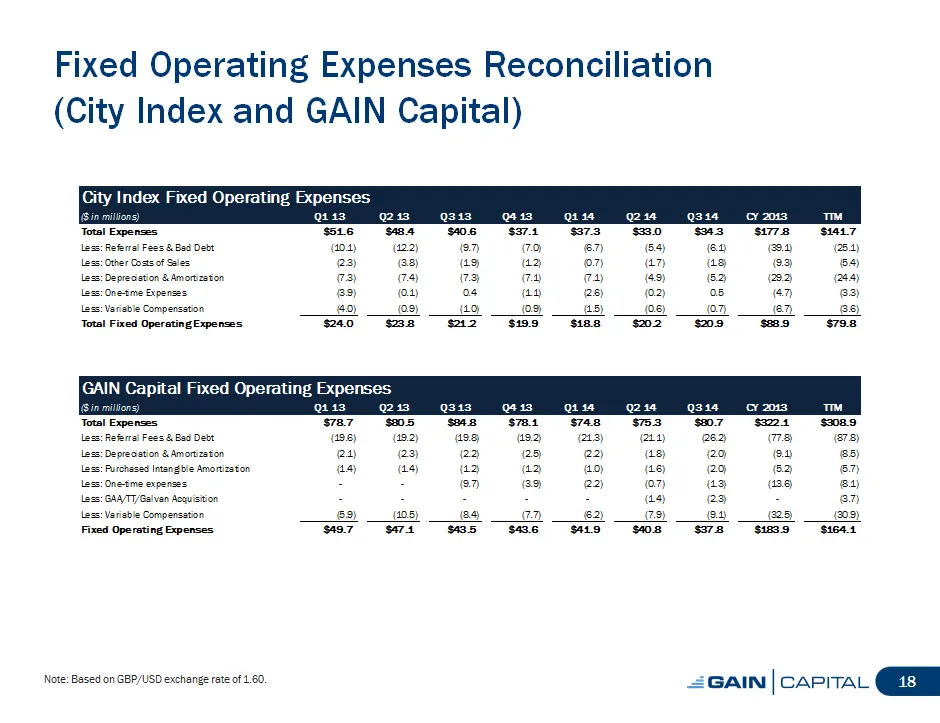
Fixed Operating Expenses Reconciliation (City Index and GAIN Capital) City Index Fixed Operating Expenses ($ in millions) Q1 13 Q2 13 Total Expenses $51. 6 $48.4 Less: Referral Fees and Bad Debt (10.1) (12.2) Less: Other Costs of Sales (2.3) (3.8) Less: Depreciation and Amortization (7.3) (7.4) Less
Slide 18: Net Income to Adjusted EBITDA Reconciliation (GAIN Capital)
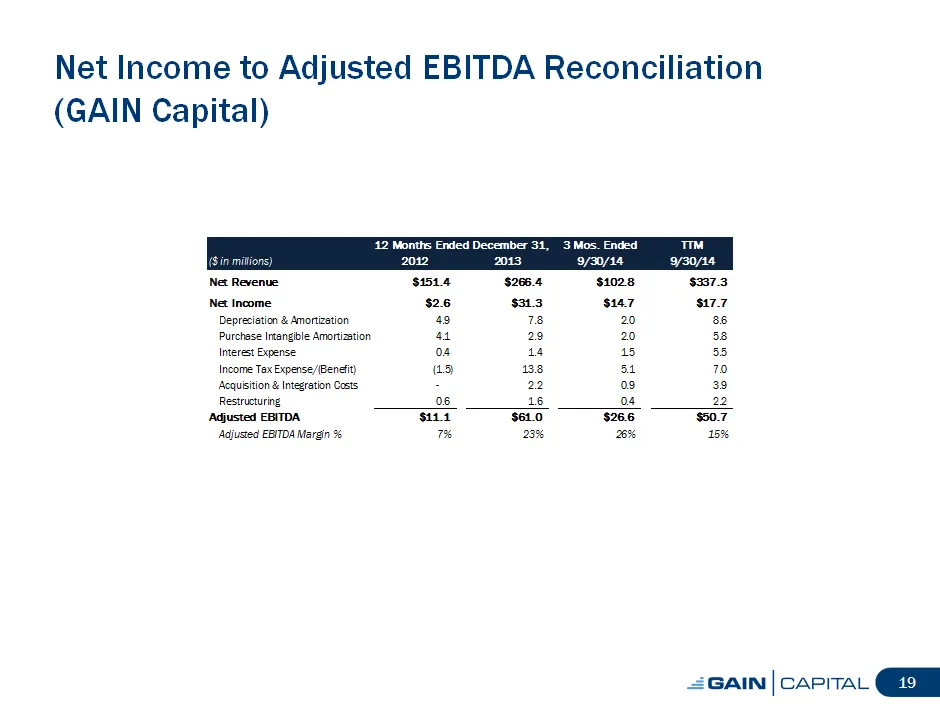
Net Income to Adjusted EBITDA Reconciliation (GAIN Capital) 12 Months Ended December 31, ($ in millions) 2012 2013 Net Revenue $151.4 $266.4 Net Income $2.6 $31.3 Depreciation and Amortization 4.9 7.8 Purchase Intangible Amortization 4.1 2.9 Interest Expense 0.4 1.4 Income Tax Expense/(Benefit) (1.5
Slide 19: Net Income to Adjusted EBITDA Reconciliation (City Index)
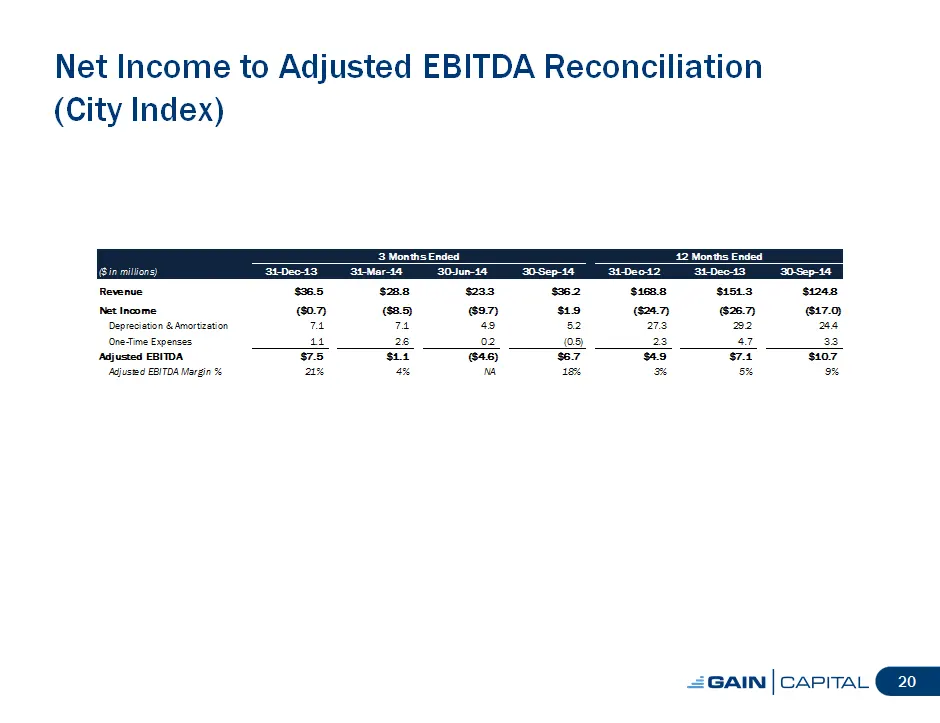
Net Income to Adjusted EBITDA Reconciliation (City Index) 3 Months Ended ($ in millions) 31-Dec-13 31-Mar -14 30-Jun-14 Revenue $36.5 $28.8 $23.3 Net Income ($0.7) ($8.5) ($9.7) Depreciation and Amortization 7.1 7.1 4.9 One-Time Expenses 1.1 2.6 0.2 ============= ============= ============= Adjusted
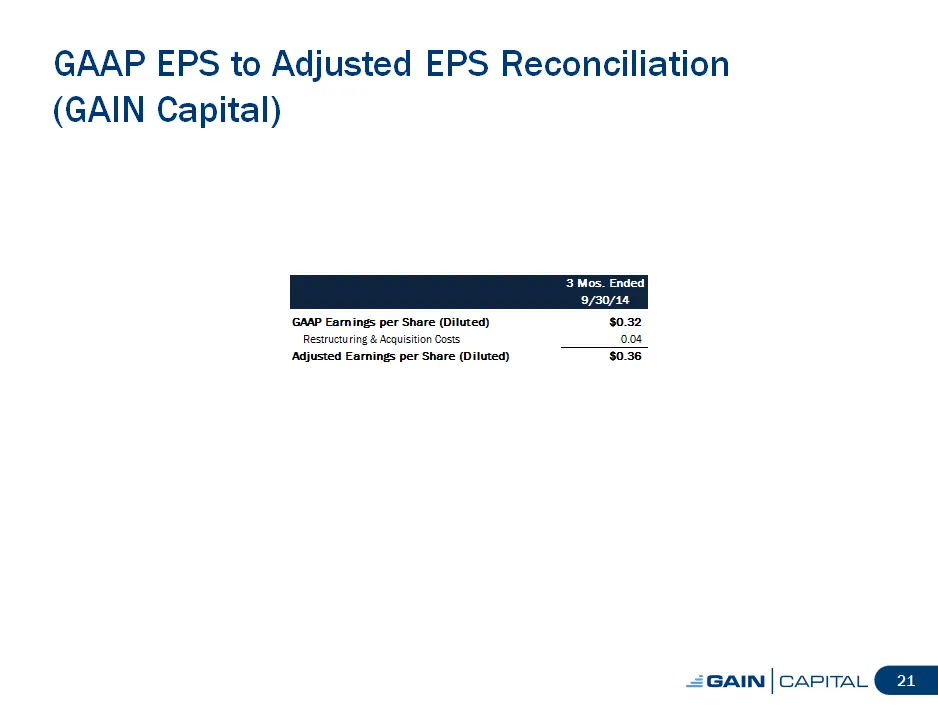
Slide 20: GAAP EPS to Adjusted EPS Reconciliation (GAIN Capital)
GAAP EPS to Adjusted EPS Reconciliation (GAIN Capital) 3 Mos . Ended 9/30/14 GAAP Earnings per Share (Diluted) $0.32 Restructuring and Acquisition Costs 0.04 ================= Adjusted Earnings per Share (Diluted) $0.36 21
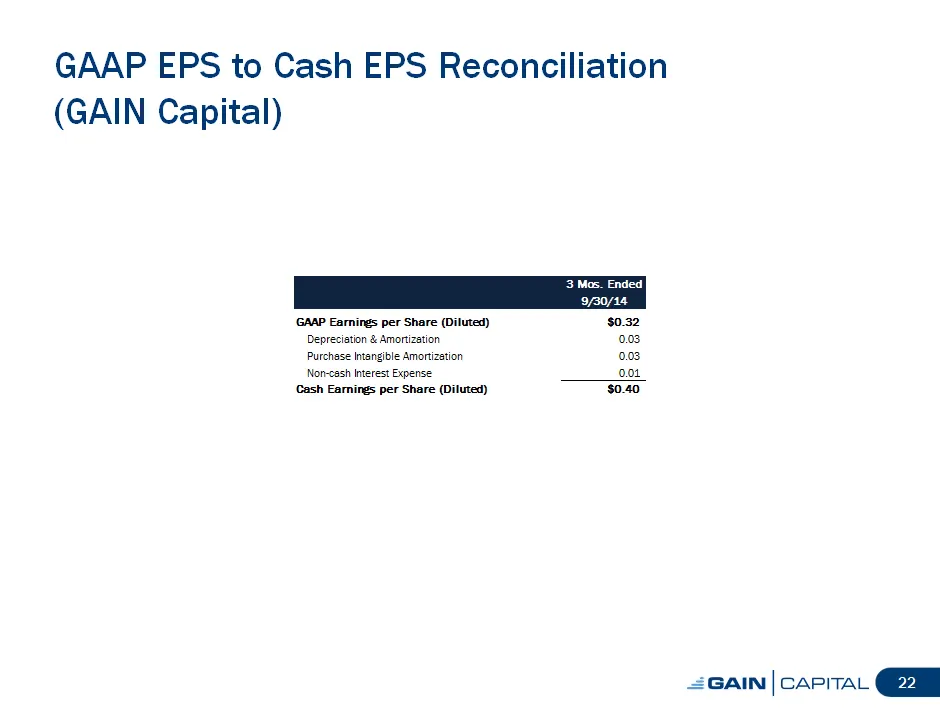
Slide 21: GAAP EPS to Cash EPS Reconciliation (GAIN Capital)
GAAP EPS to Cash EPS Reconciliation (GAIN Capital) 3 Mos. Ended 9/30/14 GAAP Ear ni ngs per Share (Diluted) $0. 32 Depreciation and Amortization 0.03 Purchase Intangible Amortization 0.03 Non-cash Interest Expense 0.01 ================ Cash Earnings per Share (Diluted) $0.40 22
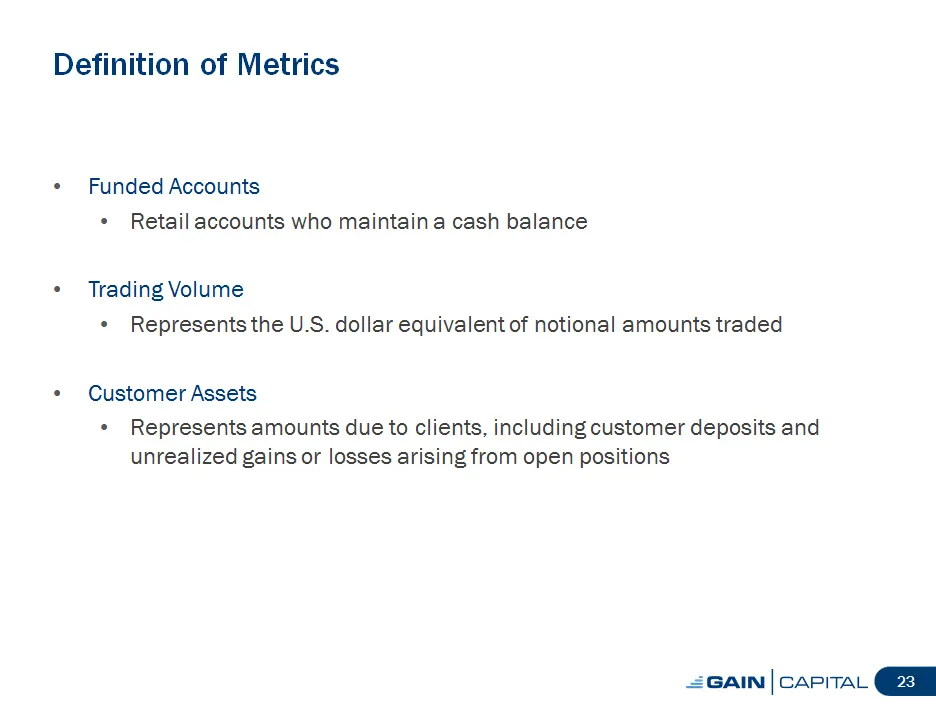
Slide 22: Definition of Metrics
Definition of Metrics [] Funded Accounts [] Retail accounts who maintain a cash balance [] Trading Volume [] Represents the U. S. dollar equivalent of notional amounts traded [] Customer Assets [] Represents amounts due to clients, including customer deposits and unrealized gains or losses arising f
Slide 23: GAIN Capital to Acquire City Index
GAIN Capital to Acquire City Index Creating a Global Leader in Online Trading October 31, 2014 24
Slide 24: GAIN Capital to Acquire City Index
= GAIN | CAPITAL GAIN Capital to Acquire City Index Creating a Global Leader in Online Trading October 31, 2014
Source: SEC EDGAR · 8-K filed Oct 31, 2014
More decks from GAIN Capital Holdings Inc
 Q2 2020 Earnings Presentation24 slides · Jul 23, 2020
 Merger or Acquisition (May 2020)10 slides · May 15, 2020
 Q1 2020 Earnings Presentation25 slides · Apr 23, 2020
 FY2019 Earnings Presentation35 slides · Feb 27, 2020
 Q3 2019 Earnings Presentation32 slides · Oct 25, 2019
 Q2 2019 Earnings Presentation33 slides · Jul 25, 2019