Kona Grill — Investor Presentation (February 2014)
43 slides from Kona Grill's investor presentation, Feb 26, 2014
Slide 1: Kona Grill
Kona GRILL kitchen ¢ sushi « cocktails
Slide 2: Important Cautions Regarding Forward-Looking Statements
Important Cautions Regarding KonaGru Forward-Looking Statements serena This presentation contains forward-looking statements. These statements relate to future events or expectations regarding our future financial performance. These statements are only predictions and involve known and unknown risks
Slide 3: Who We Are...
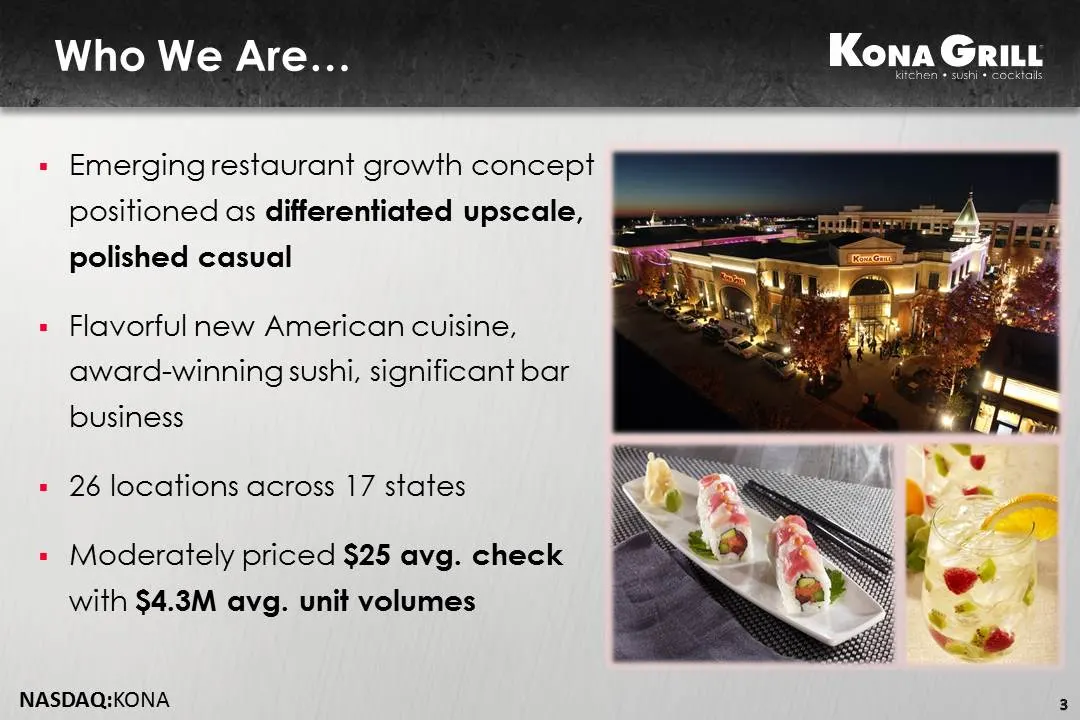
Who We Are... Kona Grit Emerging restaurant growth concept positioned as differentiated upscale, polished casual Flavorful new American cuisine, award-winning sushi, significant bar business 26 locations across 17 states Moderately priced $25 avg. check with $4.3M avg. unit volumes NASDAQ:KONA 3
Slide 4: What Sets Us Apart?
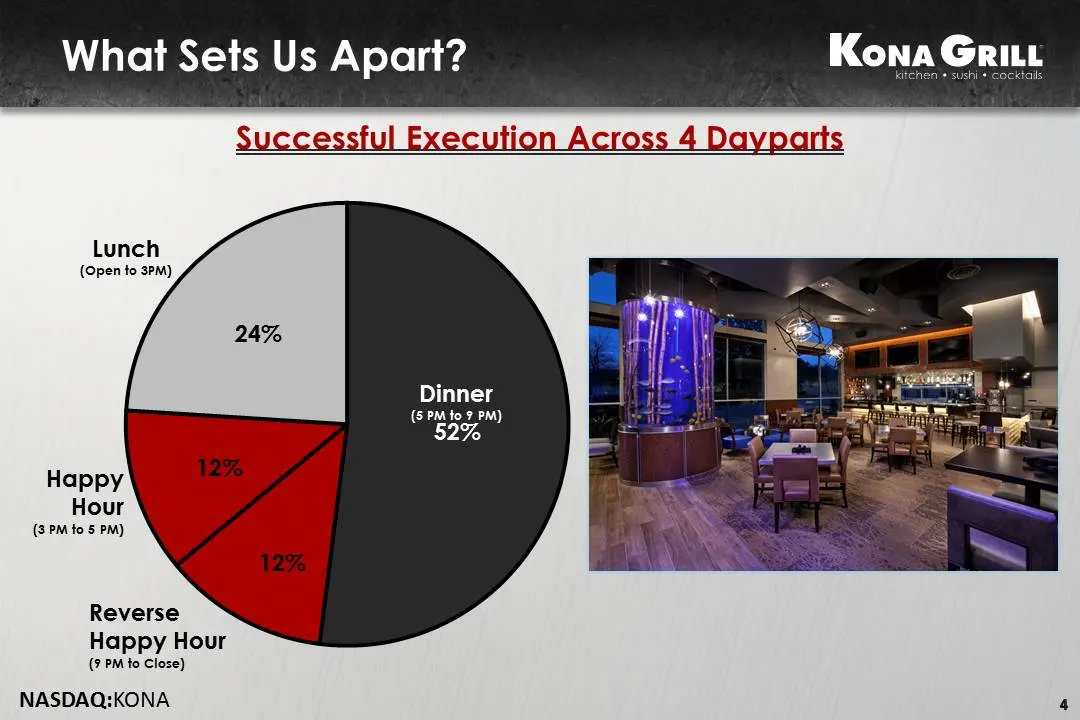
What Sets Us Apart? Kona Grit Lunch (Open to 3PM) Dinner (5PM to 7 PM) 7% Happy Hour (3 PM to 5 PM) Reverse Happy Hour (9 PM to Close) NASDAQ:KONA
Slide 5: What Sets Us Apart
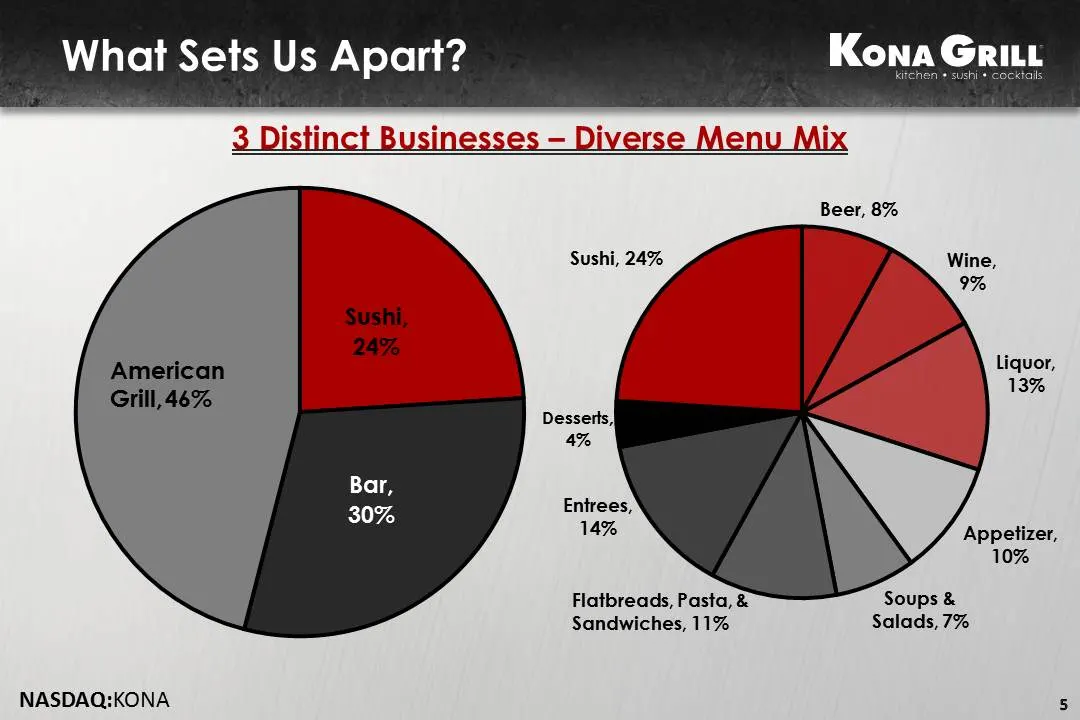
What Sets Us Apart Kona Grit Beer, 8% Sushi, 24% Wine, Liquor, 13% Appetizer, 10% Flatbreads, Pasta, & Soups & Sandwiches, 11% Salads, 7% NASDAQ:KONA 5
Slide 6: Differentiated Menu Options
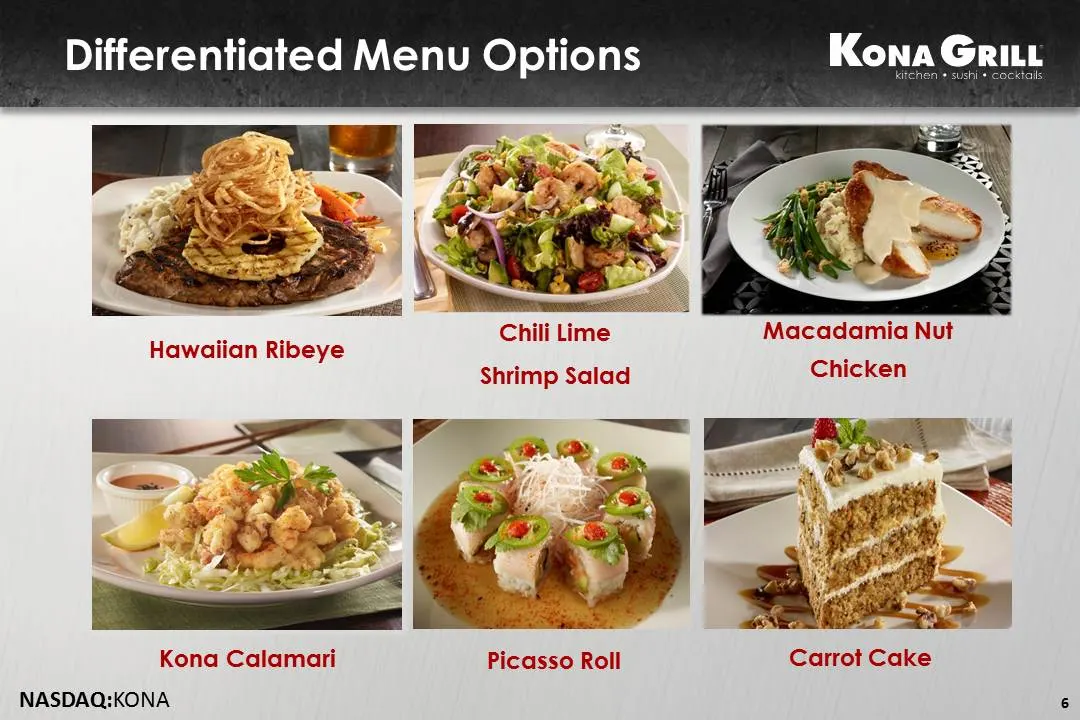
Differentiated Menu Options Kona Grit NASDAQ:KONA 6
Slide 7: Focused on Growth
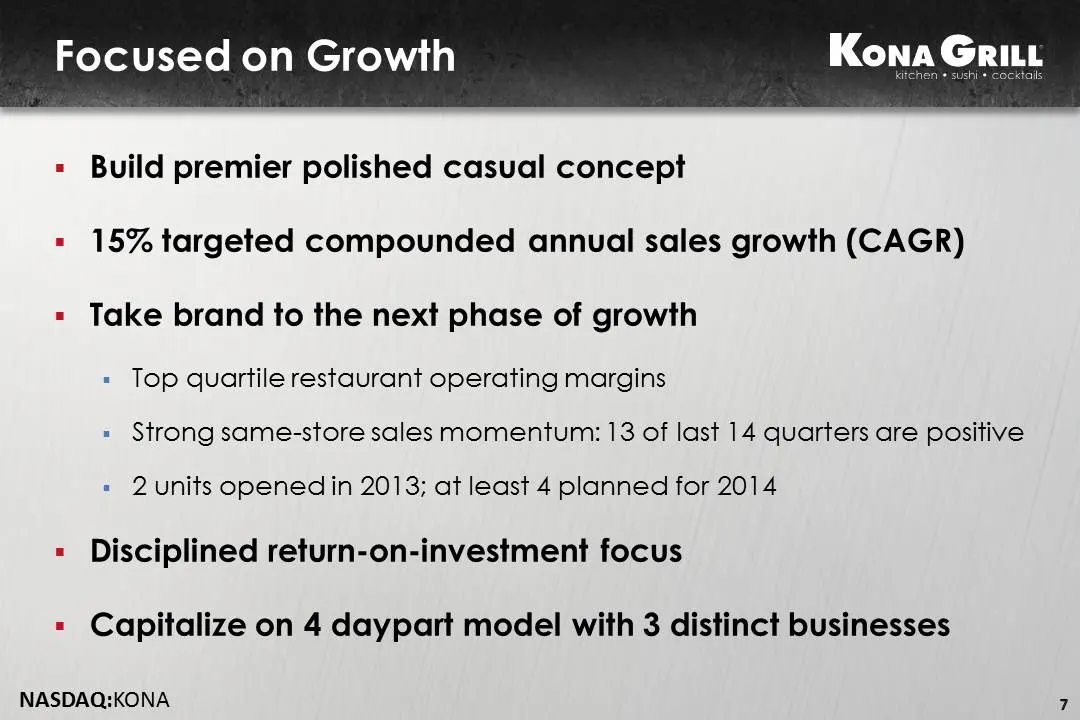
Focused on Growth Kona Grit Build premier polished casual concept 15% targeted compounded annual sales growth (CAGR) Take brand to the next phase of growth «= Top quartile restaurant operating margins = Strong same-store sales momentum: 13 of last 14 quarters are positive = 2units openedin 2013; at
Slide 8: Room to Grow
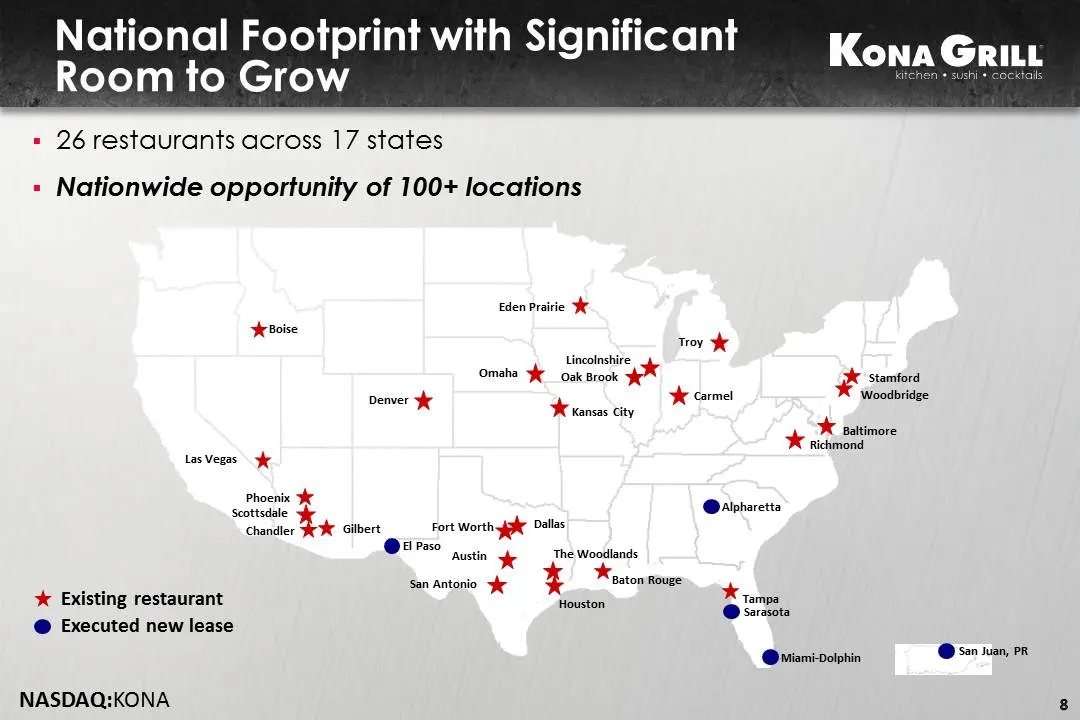
Room to Grow National Footprint with Significant KonaGri = 26 restaurants across 17 states » Nationwide opportunity of 100+ locations Eden Prairie Je Jc Boise Troy Jr Lincolnshire omens eos eck OH i simi Denver HK carmel Woodbridge * eras ey de IK pattimore Richmond Las Vegas yr Phoenix Scottsdale *
Slide 9: Substantial Growth Opportunity
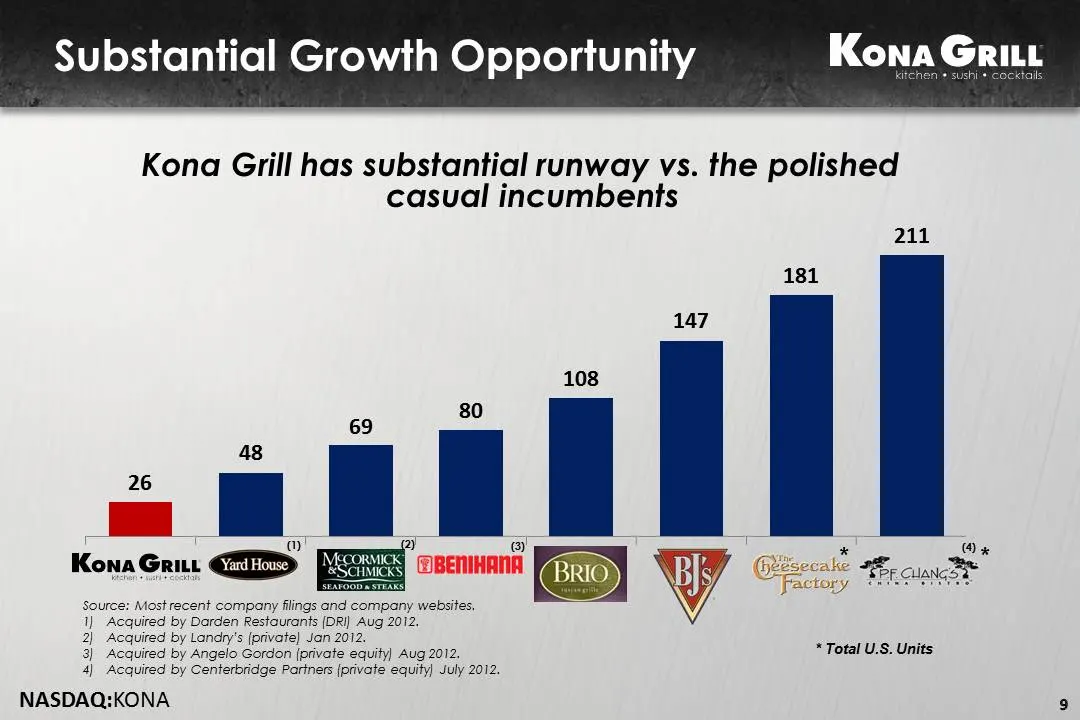
Substantial Growth Opportunity Kona Grit kitchen » sushi Kona Grill has substantial runway vs. the polished casual incumbents 80 69 48 7 [| a) 2) @ Source: Mostrecent company filings and company websites. 1) Acquired by Darden Restaurants (DRI) Aug 2012. 2) Acquired by Landry's (private) Jan 2012. 3
Slide 10: Target: Units
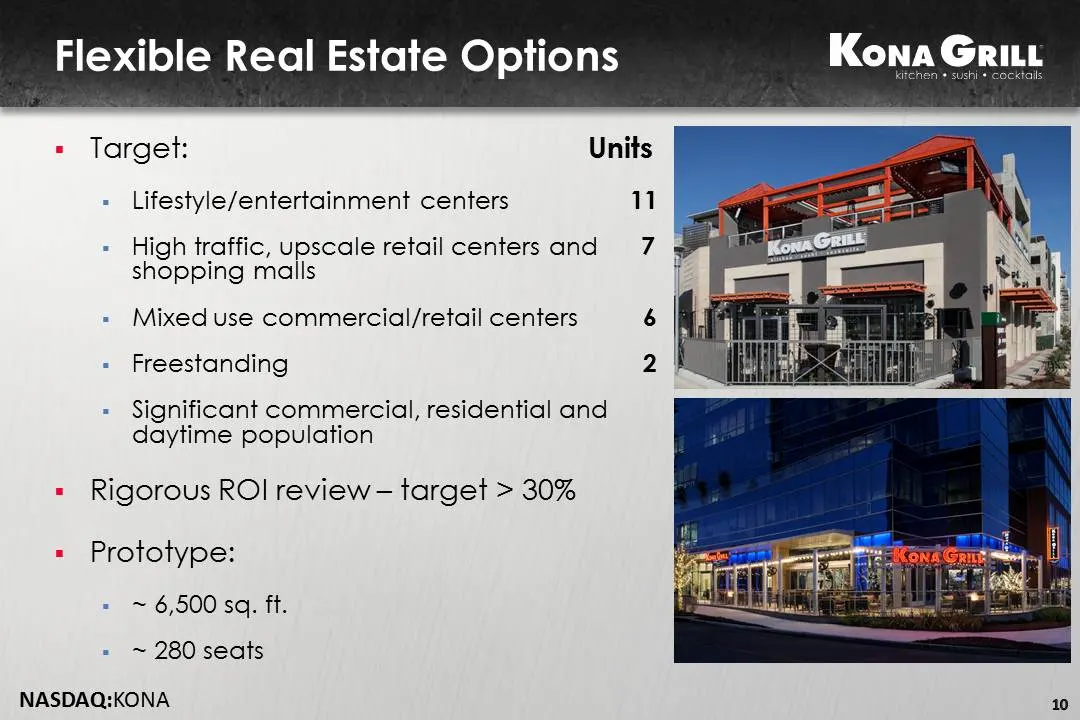
« Target: Units | Lifestyle/entertainment centers High traffic, upscale retail centers and shopping malls Mixed use commercial/retail centers Freestanding Significant commercial, residential and daytime population » Rigorous ROI review — target > 30% = Prototype: ~ 6,500 sq. ft. ~ 280 seats NASDAQ:K
Slide 11: $600 mil. mixed use development
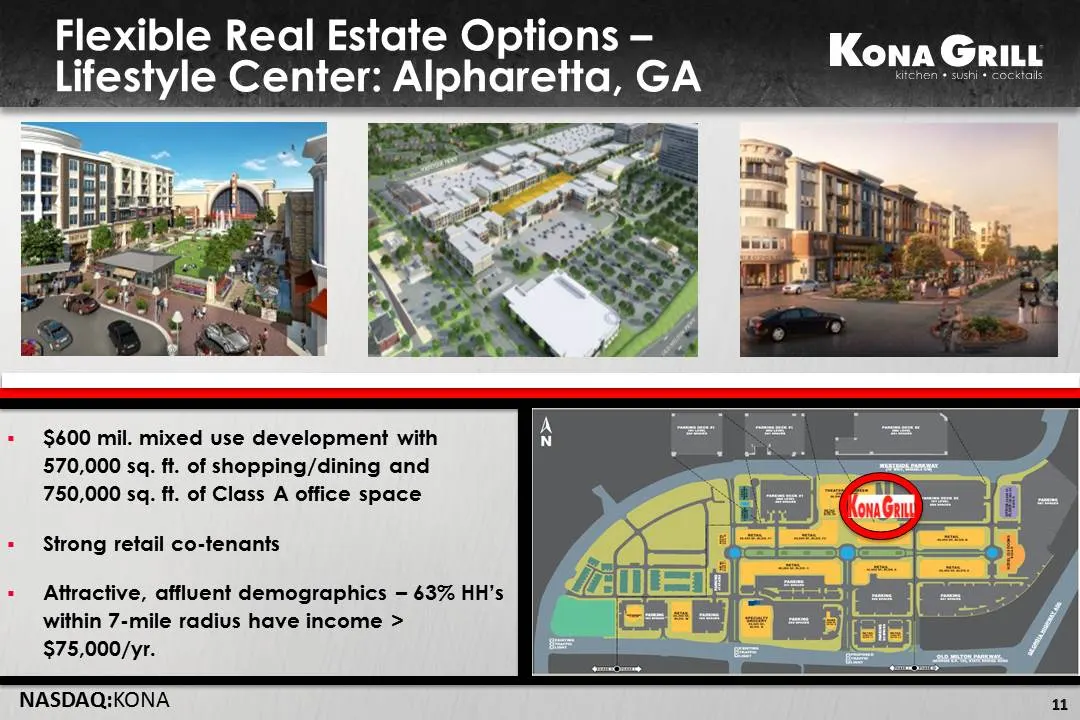
$600 mil. mixed use development with 570,000 sq. ft. of shopping/dining and 750,000 sq. ft. of Class A office space = Strong retail co-tenants = Attractive, affluent demographics - 63% HH’s within 7-mile radius have income > $75,000/yr. NASDAQ:KONA
Slide 12: Flexible Real Estate Options — Mall: Miami/Dolphin
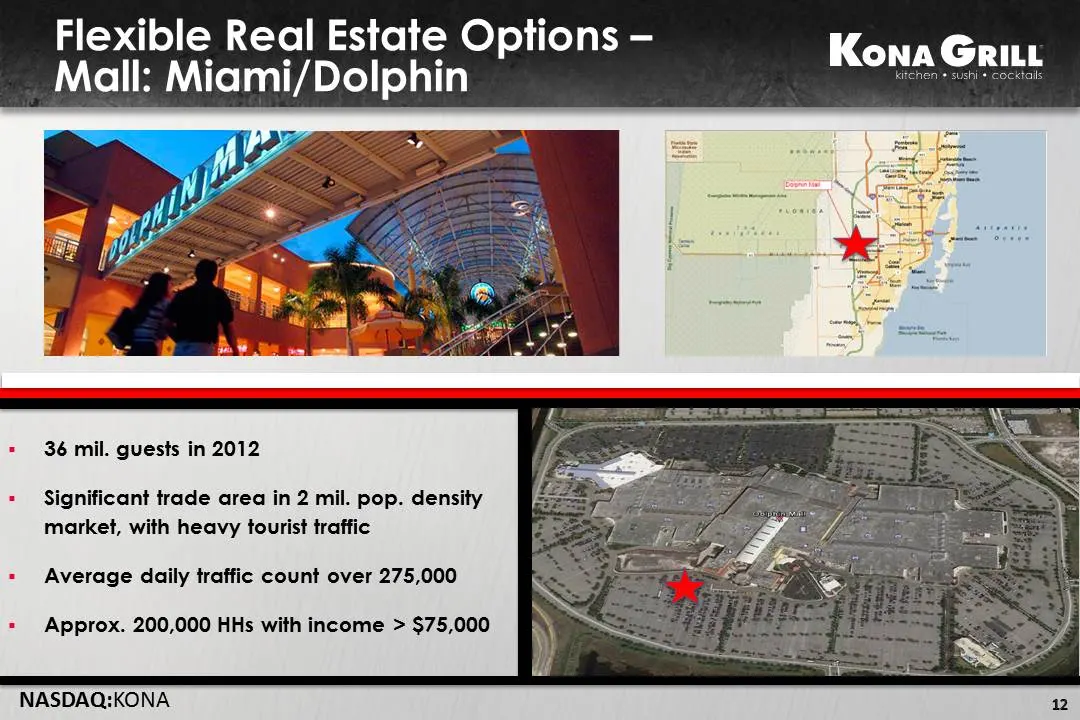
Flexible Real Estate Options — Mall: Miami/Dolphin Kous Gant 36 mil. guests in 2012 Significant trade area in 2 mil. pop. density market, with heavy tourist traffic Average daily traffic count over 275,000 Approx. 200,000 HHs with income > $75,000 NASDAQ:KONA
Slide 13: Flexible Real Estate Options — Mixed Use/Office: The Woodlands
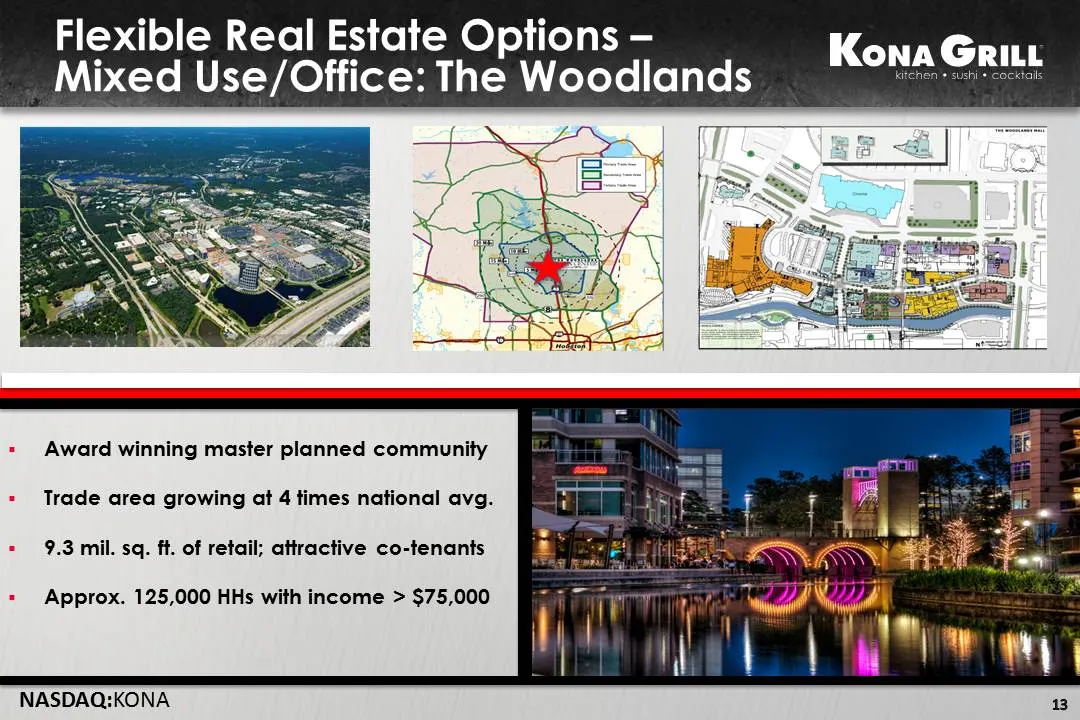
Flexible Real Estate Options — Mixed Use/Office: The Woodlands Kona Grit Award winning master planned community Trade area growing at 4 times national avg. 9.3 mil. sq. ft. of retail; attractive co-tenants Approx. 125,000 HHs with income > $75,000 NASDAQ:KONA
Slide 14: Flexible Real Estate Options — Mixed Use/Retail: Fort Worth
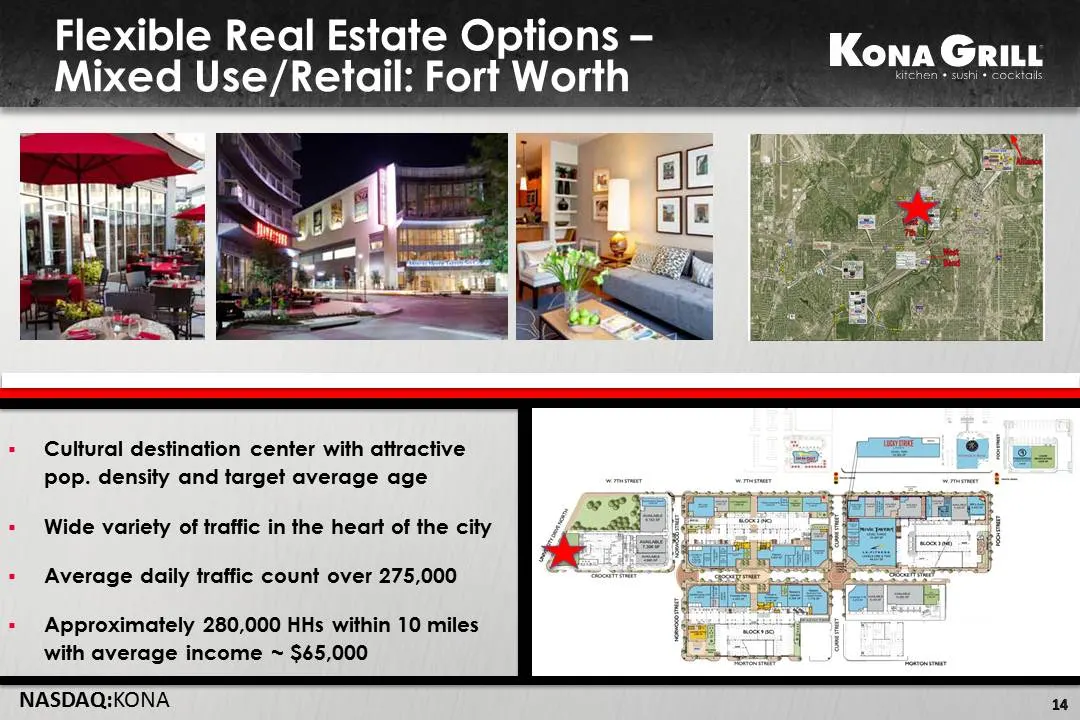
Flexible Real Estate Options — Mixed Use/Retail: Fort Worth Kona Grit Cultural destination center with attractive pop. density and target average age Wide variety of traffic in the heart of the city Average daily traffic count over 275,000 Approximately 280,000 HHs within 10 miles with average incom
Slide 15: Target Market
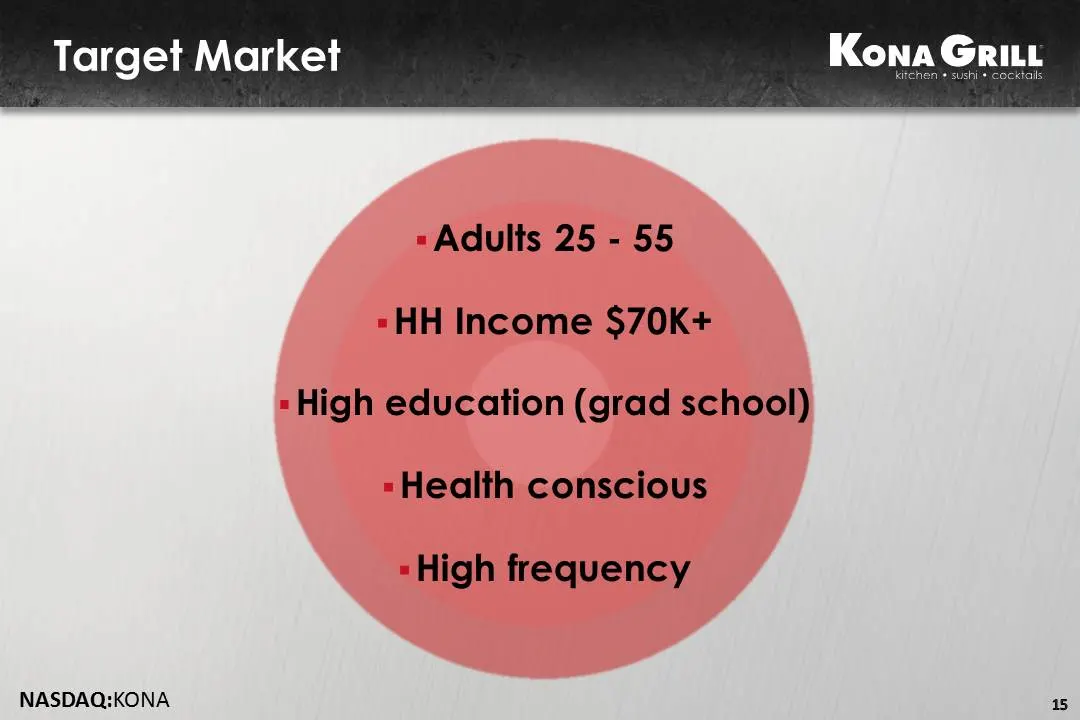
Target Market Adults 25 - 55 HH Income $70K+ High education (grad school) Health conscious High frequency NASDAQ:KONA 15
Slide 16: New Design Panoramic Tour
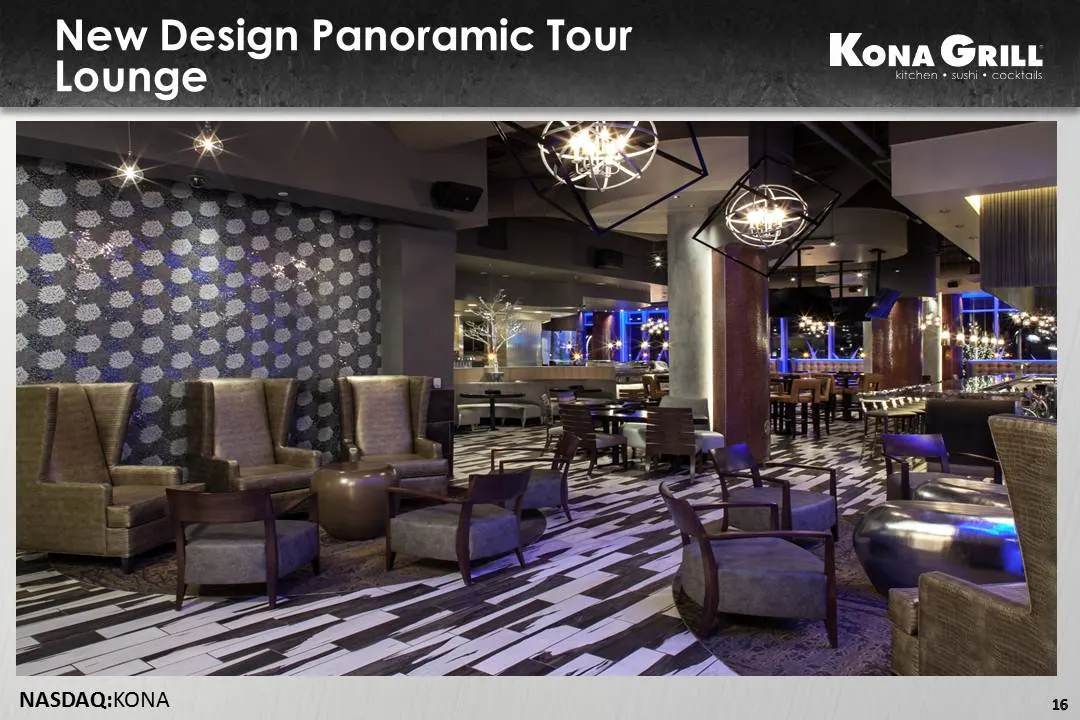
New Design Panoramic Tour Kona Grit eas NASDAQ:KONA
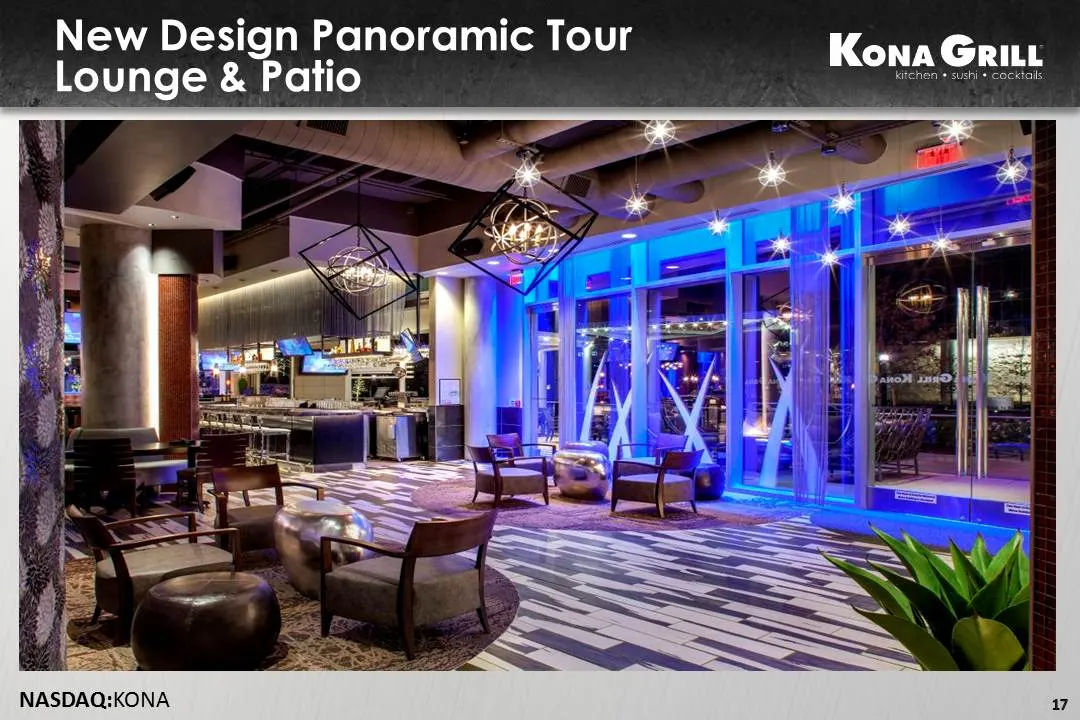
Slide 17: New Design Panoramic Tour: Lounge & Patio
New Design Panoramic Tour Lounge & Patio Kona Grit 2ERS NASDAQ:KONA
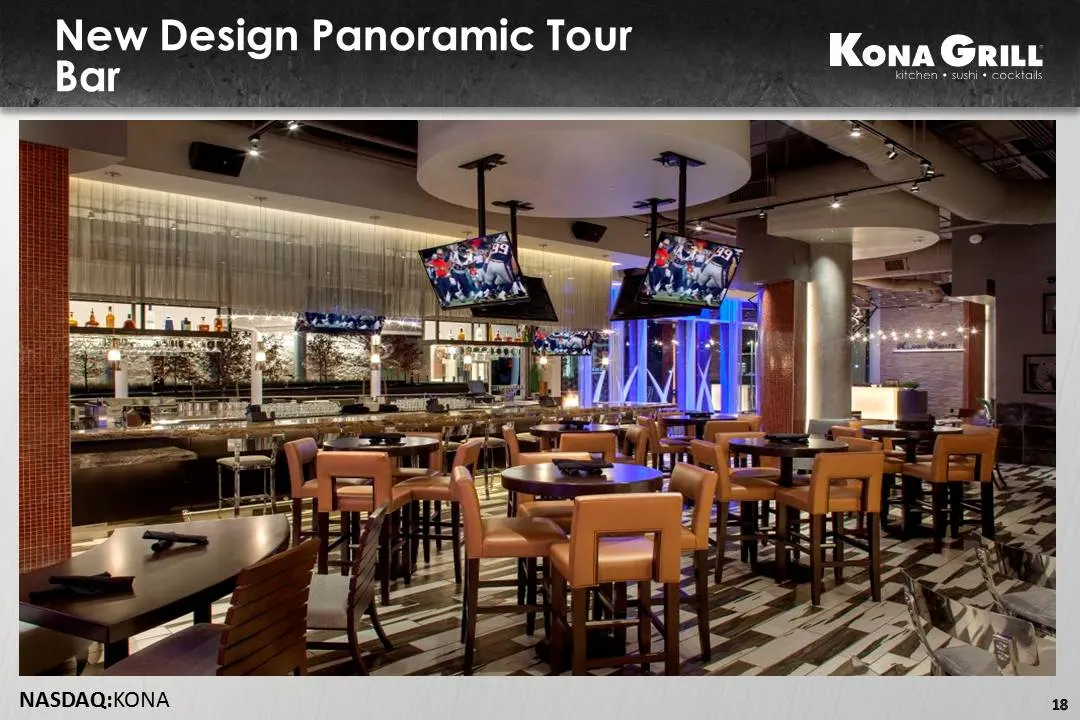
Slide 18: NASDAQ:KONA
NASDAQ:KONA
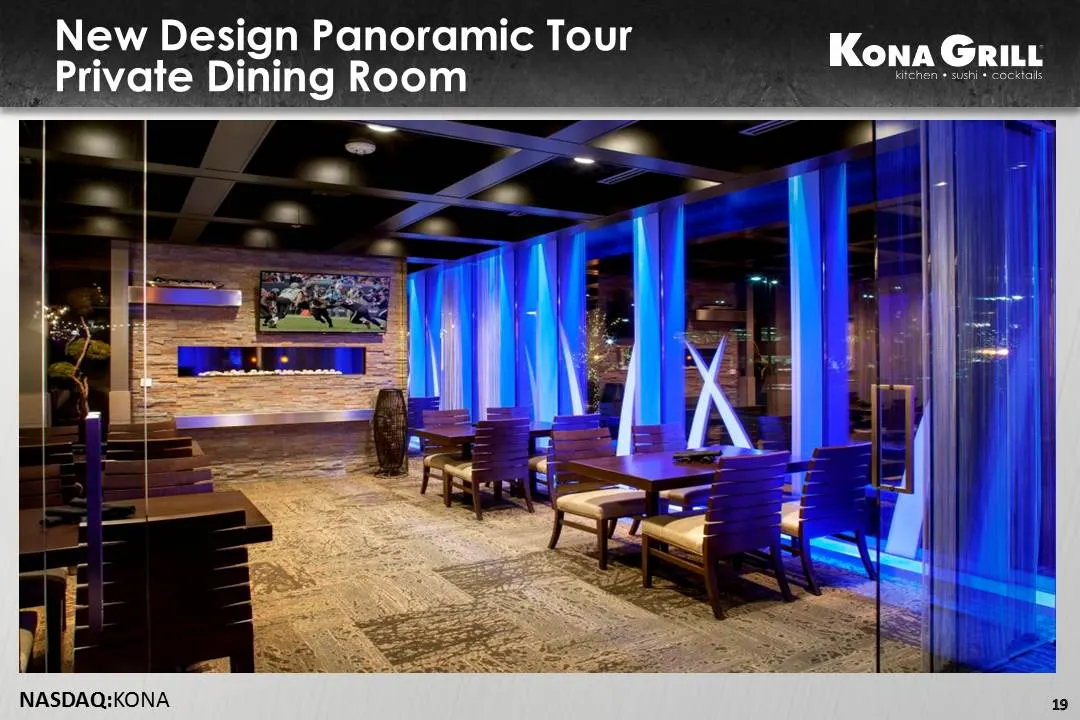
Slide 19: New Design Panoramic Tour: Private Dining Room
New Design Panoramic Tour : 2, Kona Grit Private Dining Room ee ay NASDAQ:KONA
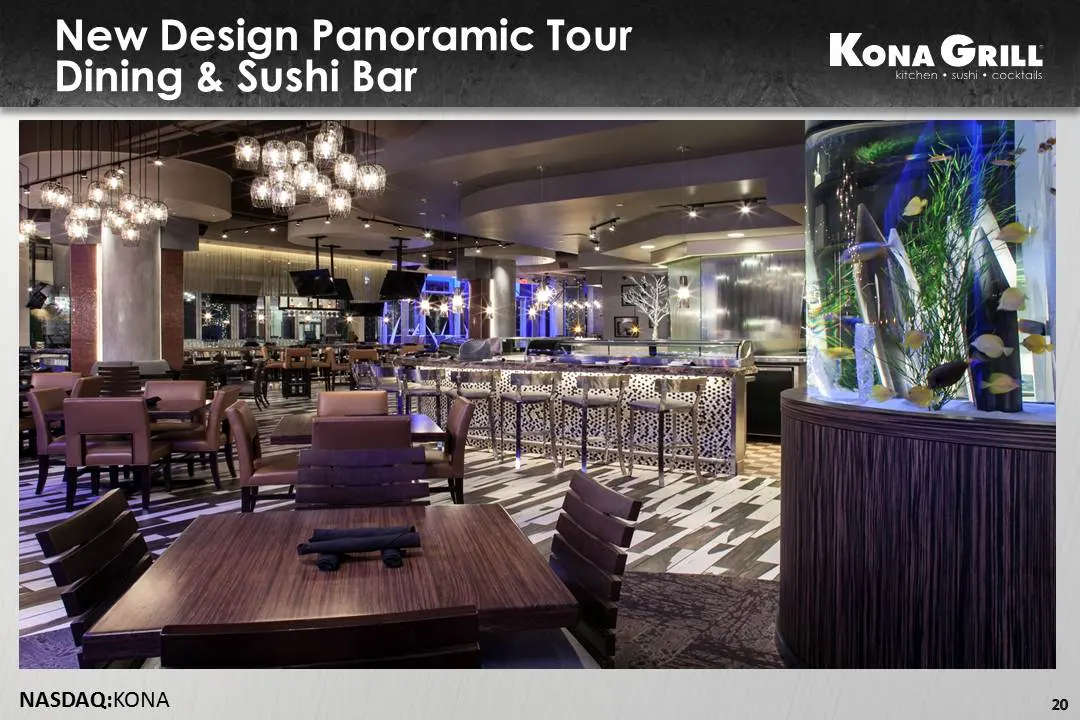
Slide 20: New Design Panoramic Tour: Dining & Sushi Bar
New Design Panoramic Tour Dining & Sushi Bar Kons Gams NASDAQ:KONA
Slide 21: New Design Panoramic Tour: Sushi Bar
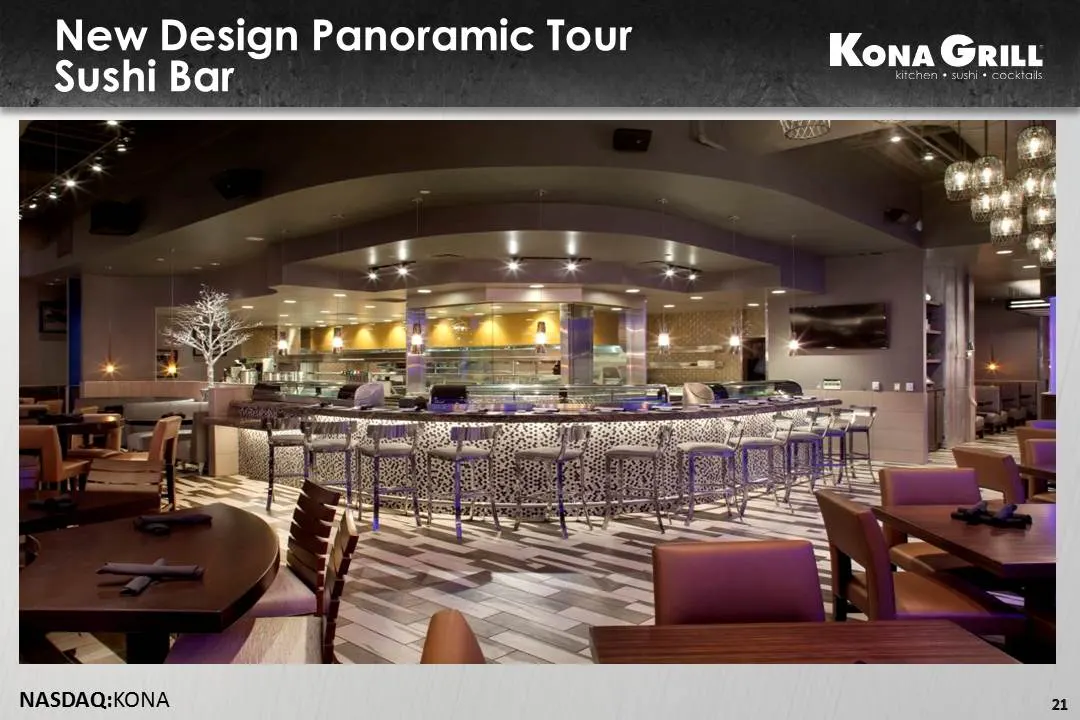
New Design Panoramic Tour 3 Kona Grit Sushi Bar Metis NASDAQ:KONA
Slide 22: New Design Panoramic Tour: Patio
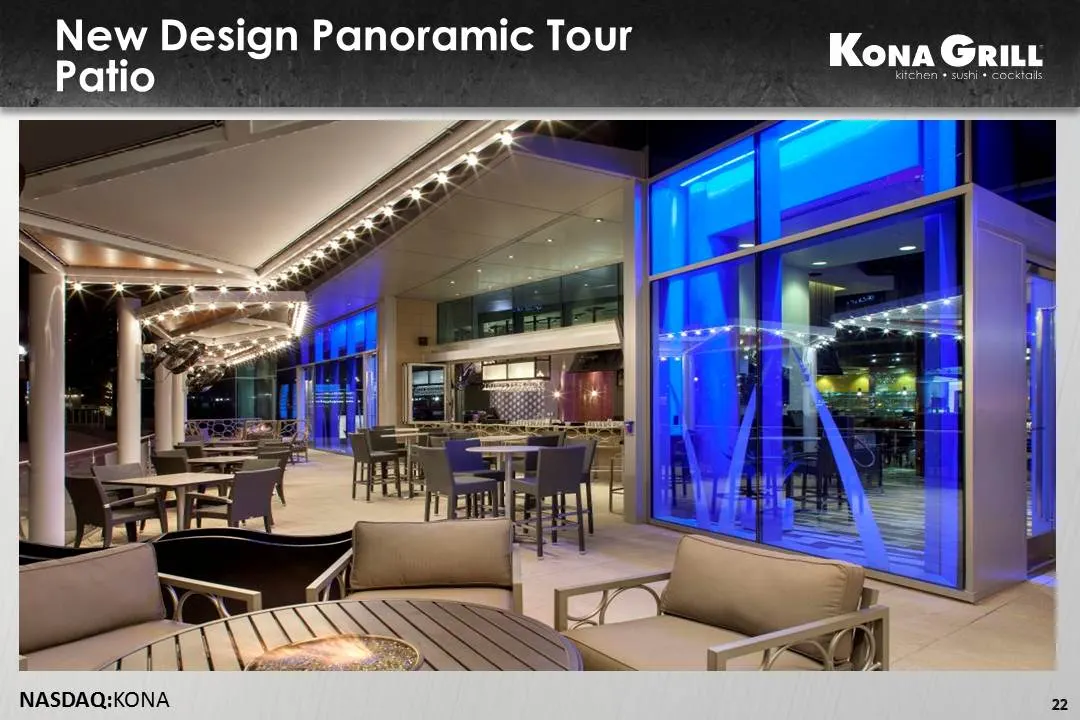
New Design Panoramic Tour : Kona Grit Patio Metis NASDAQ:KONA
Slide 23: Exceptional Dining Experience
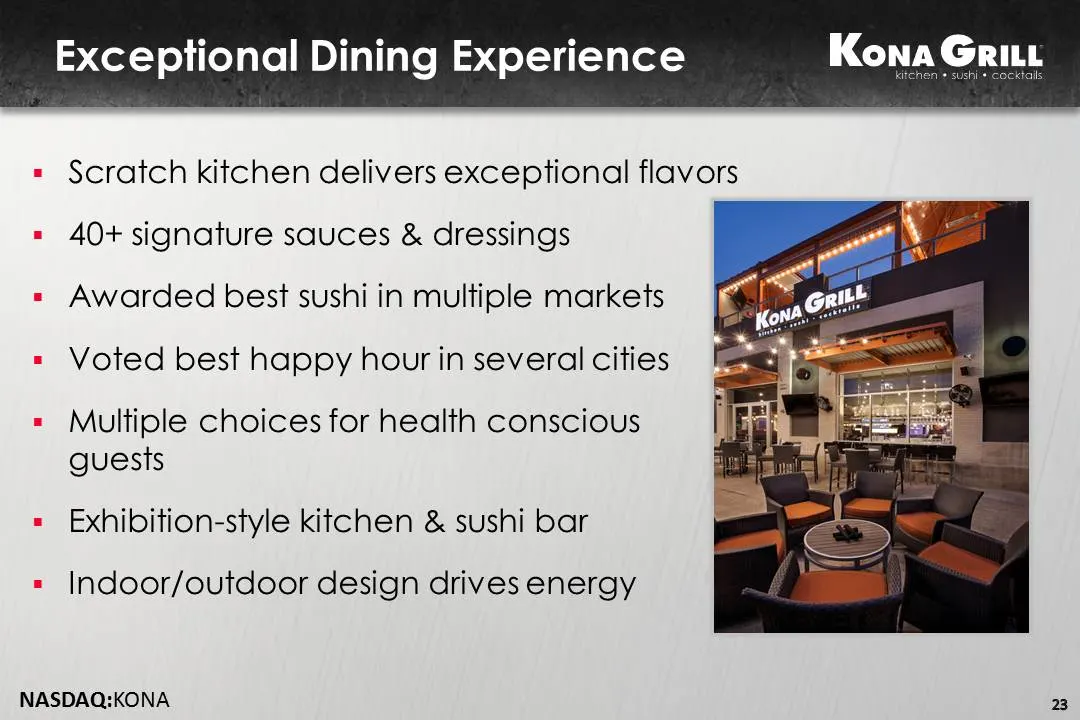
Exceptional Dining Experience Scratch kitchen delivers exceptional flavors 40+ signature sauces & dressings Awarded best sushi in multiple markets Voted best happy hour in several cities Multiple choices for health conscious guests Exhibition-style kitchen & sushi bar Indoor/outdoor design drives en
Slide 24: Loyal User Base
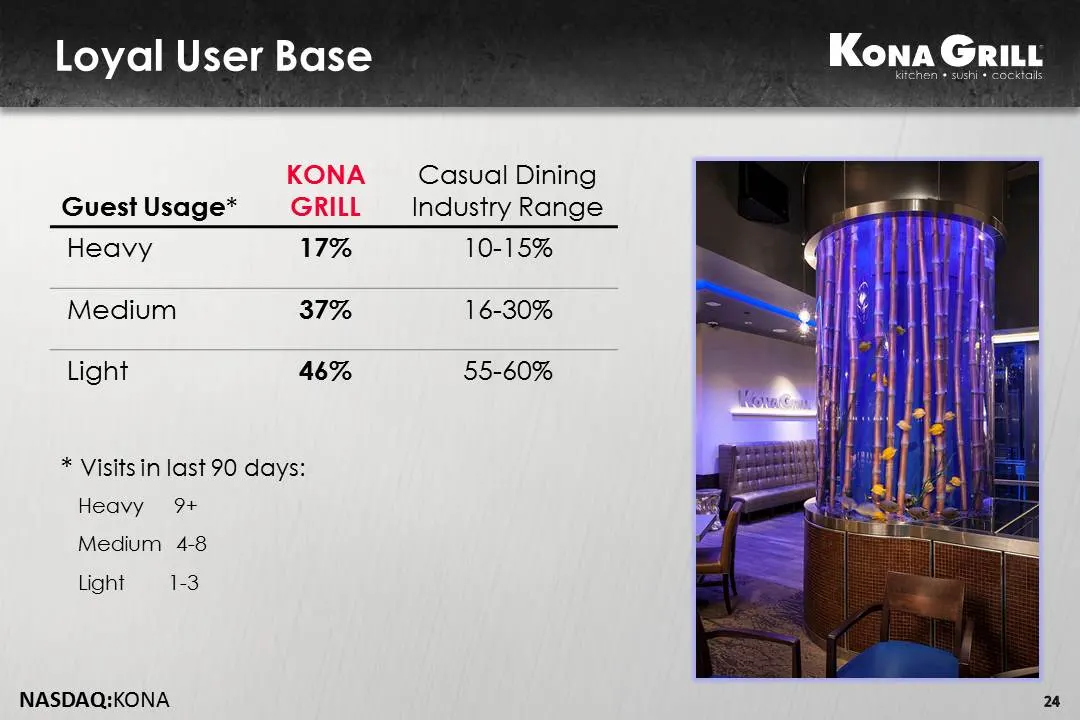
Loyal User Base Kona Gari KONA Casual Dining Guest Usage* GRILL Industry Range Heavy 17% 10-15% Medium 37% 16-30% Light 46% 55-60% * Visits in last 90 days: Heavy 9+ Medium 4-8 light 1-3 NASDAQ:KONA 24
Slide 25: Grass Roots Marketing Strategy
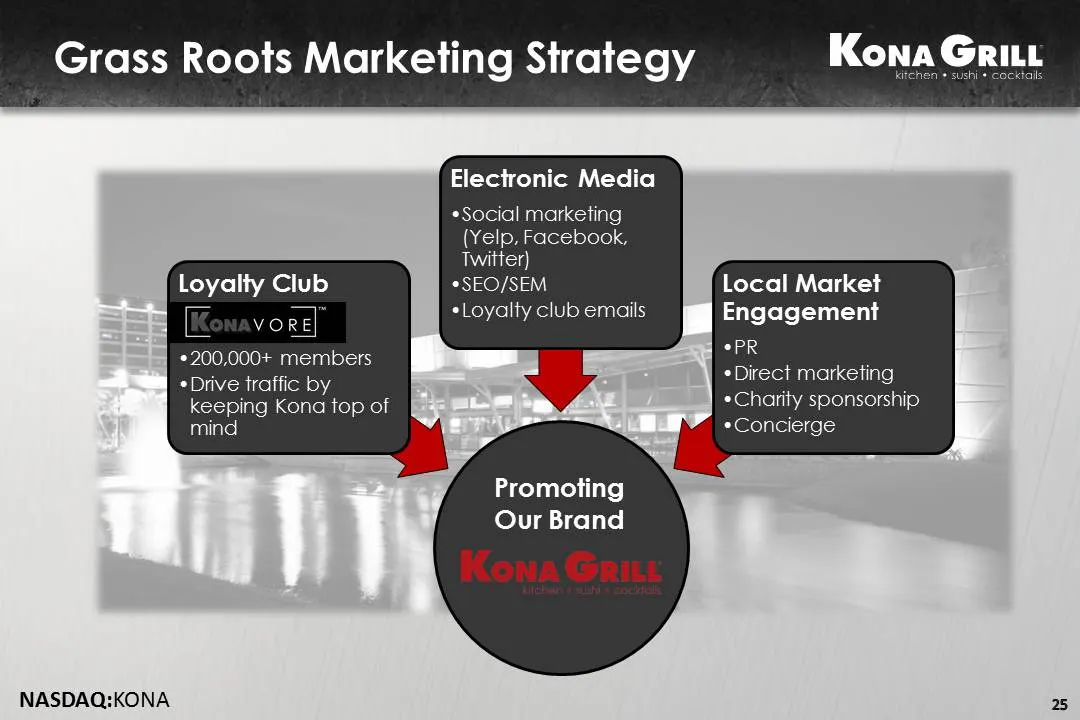
Grass Roots Marketing Strategy Kona Grit Electronic Media *Social marketing (Yelp, Facebook, Twitter) Loyalty Club *SEO/SEM Local Market IK 7 *Loyalty club emails Engagement *200,000+ members i t keti *Drive traffic by Piet ASIANA) keeping Kona top of Charity sponsorship mind Concierge Promoting Our
Slide 26: Loyalty Program
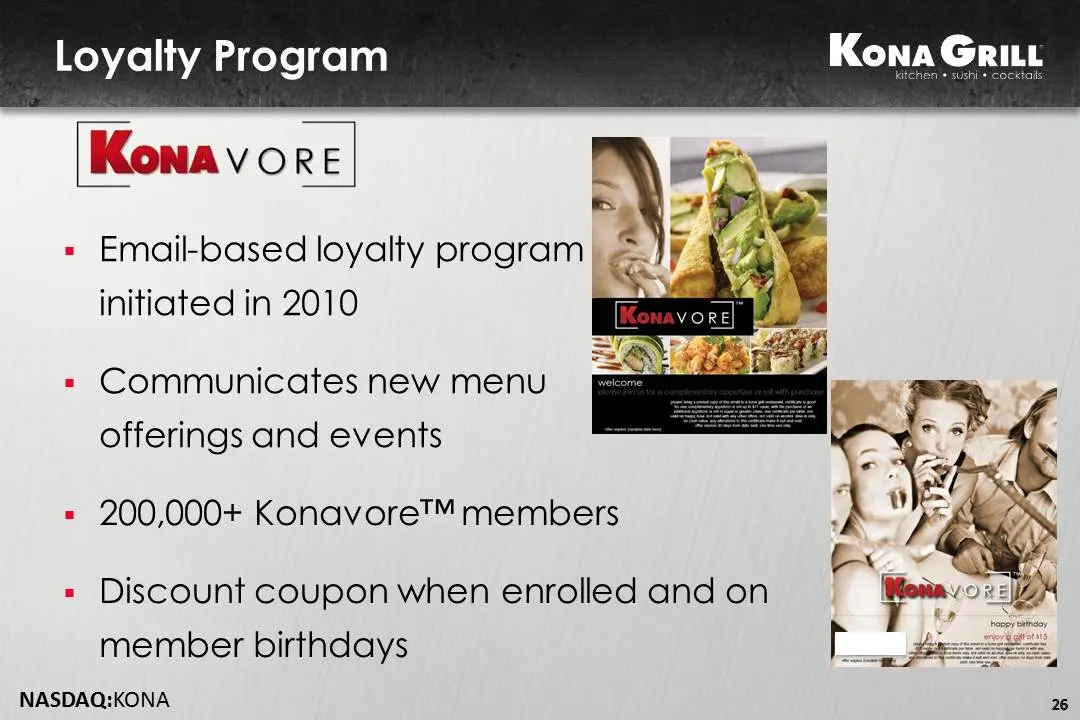
Loyalty Program [Kona vore| Email-based loyalty program initiated in 2010 = Communicates new menu offerings and events = 200,000+ Konavore™ members = Discount coupon when enrolled and on member birthdays NASDAQ:KONA 26
Slide 27: Compelling Offerings
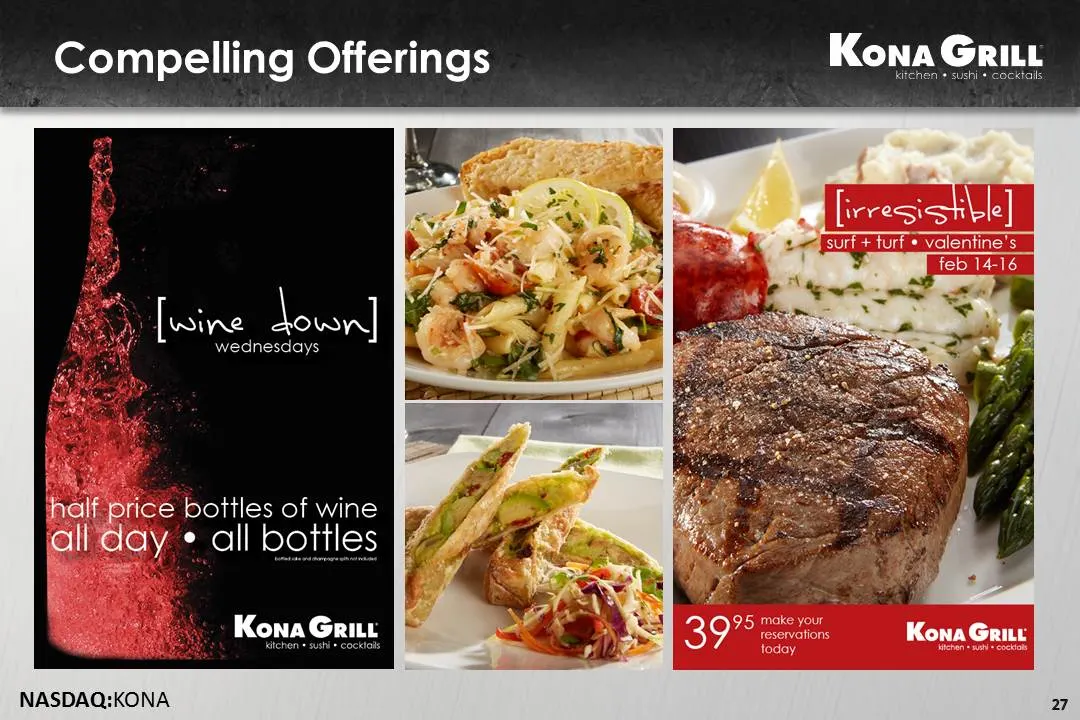
i+ cocktails Compelling Offerings Kona Gru tsa é lirresishle] 4 surf + turf * valentine's [wine el wednesdays half price bottles of wine y iall day « all bottles ly 4, * KonaGrut fy ‘ »s orate NASDAQ:KONA
Slide 28: Experienced Senior Leadership Team
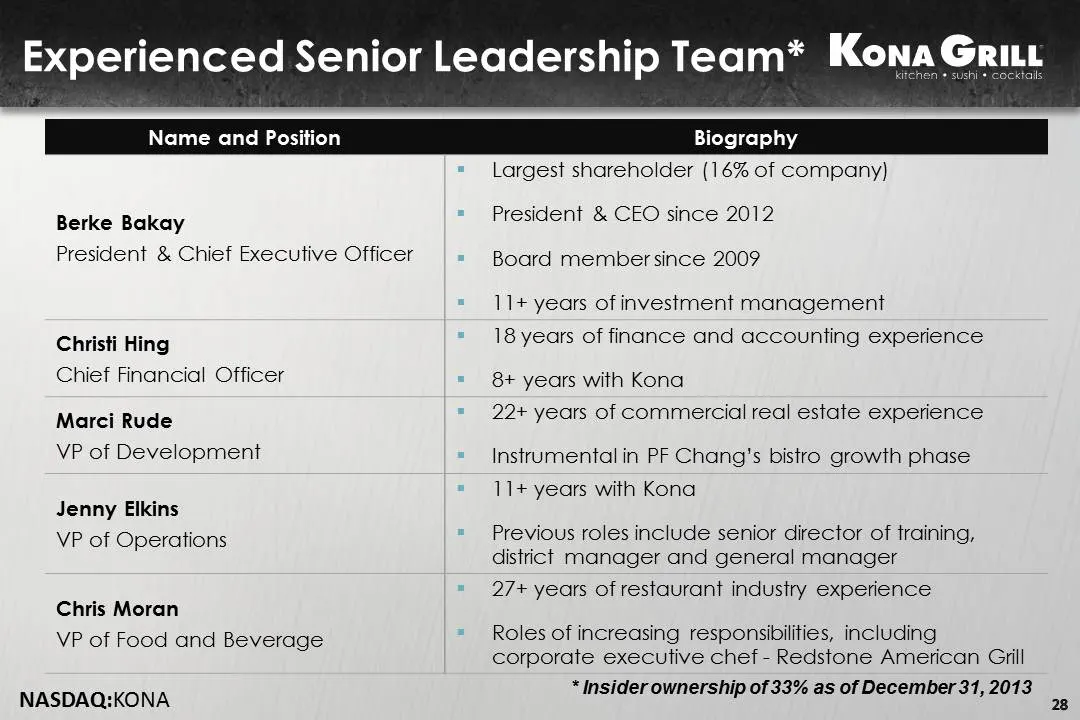
Experienced Senior Leadership Team* KonaG Name and Po: Berke Bakay President & Chief Executive Officer Christi Hing Chief Financial Officer Marci Rude VP of Development Jenny Elkins VP of Operations Chris Moran VP of Food and Beverage NASDAQ:KONA kitchen » sushi + Biography Largest shareholder (16%
Slide 29: Financial Overview
Kona Grit kitchen * sushi * cocktails FINANCIAL OVERVIEW
Slide 30: Affordable Dining Experience
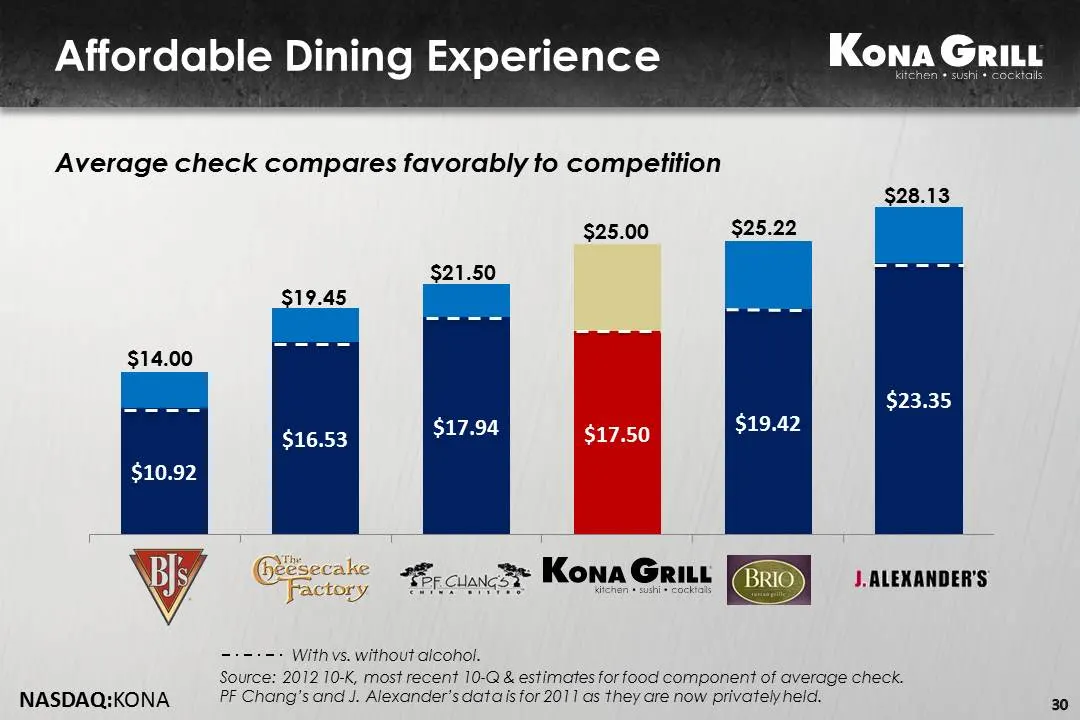
Affordable Dining Experience Average check compares favorably to competition $25.00 $25.22 . ALEXANDER'S 26 cnc Kona Grit gust eeanehce wiicnen + sushi» eackrale aeneee With vs. without alcohol. Source: 2012 10-K, most recent 10-Q & estimates for food component of average check. NASDAQ:KONA PF Chang
Slide 31: 5-Year 15% CAGR Sales Target
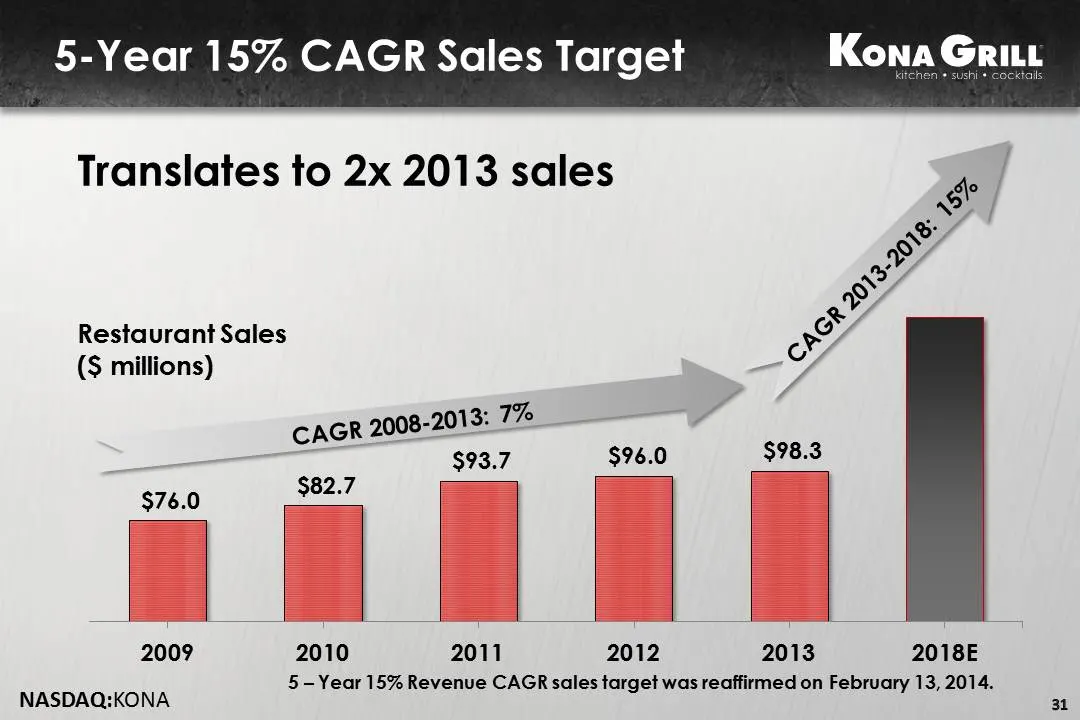
5-Year 15% CAGR Sales Target Translates to 2x 2013 sales é uD ‘ s Ry Pe Restaurant Sales oe’ (S millions) ye : 1% GR 2008-2013: Sh $93.7 $96.0 $98.3 $76.0 || 2009 2010 2011 2012 2013 2018E 5 -Year 15% Revenue CAGR sales target was reaffirmed on February 13, 2014. NASDAQ:KONA 31
Slide 32: Relative Growth Rate vs. SSS
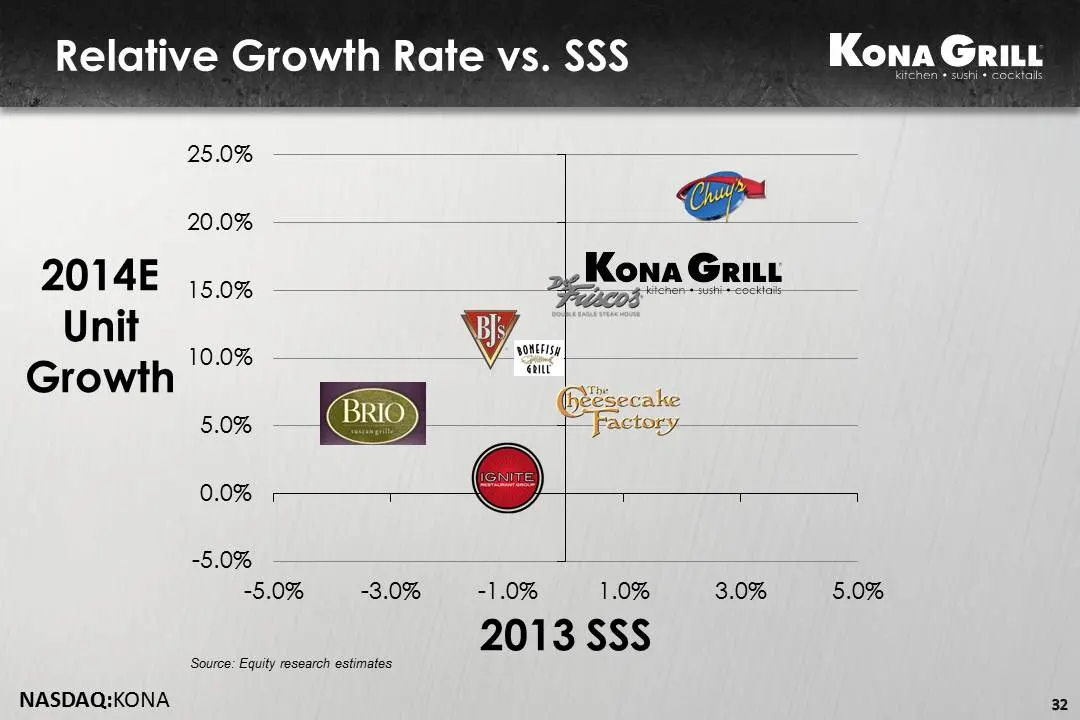
Relative Growth Rate vs. SSS Kona Grit Unit Vv. 10.0% - = \ = ne ria Growth GD) i ecale 5.0% pemesaees a 0.0% @ -5.0% | -5.0% -3.0% -1.0% 1.0% 3.0% 5.0% 2013 SSS Source: Equity research estimates NASDAQ:KONA 32
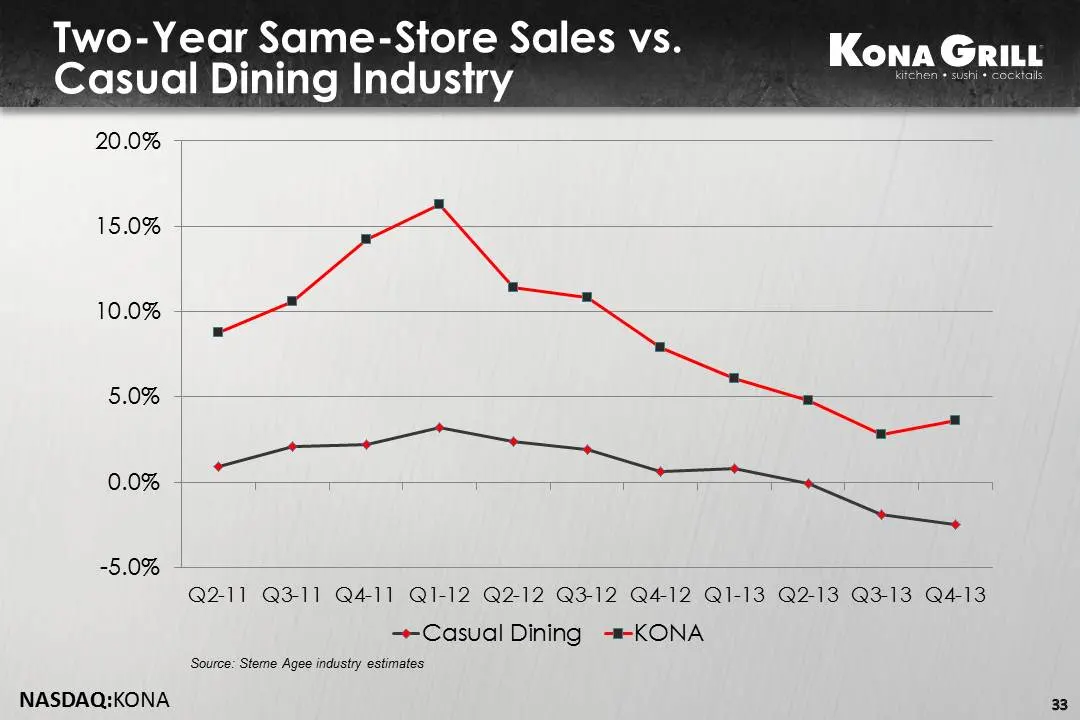
Slide 33: Two-Year Same-Store Sales vs. Casual Dining Industry
Two-Year Same-Store Sales vs. Casual Dining Industry 20.0% 1 8 re ie 15.0% >— 10.0% §~— HOE) 0.0% | =0.0%) == 7) Q211 Q3-11 Q411 QI-12 Q212 Q3-12 Q412 QI-13 Q213 Q3-13 Q413 --Casual Dining -+KONA Source: Steme Agee industry estimates NASDAQ:KONA 33
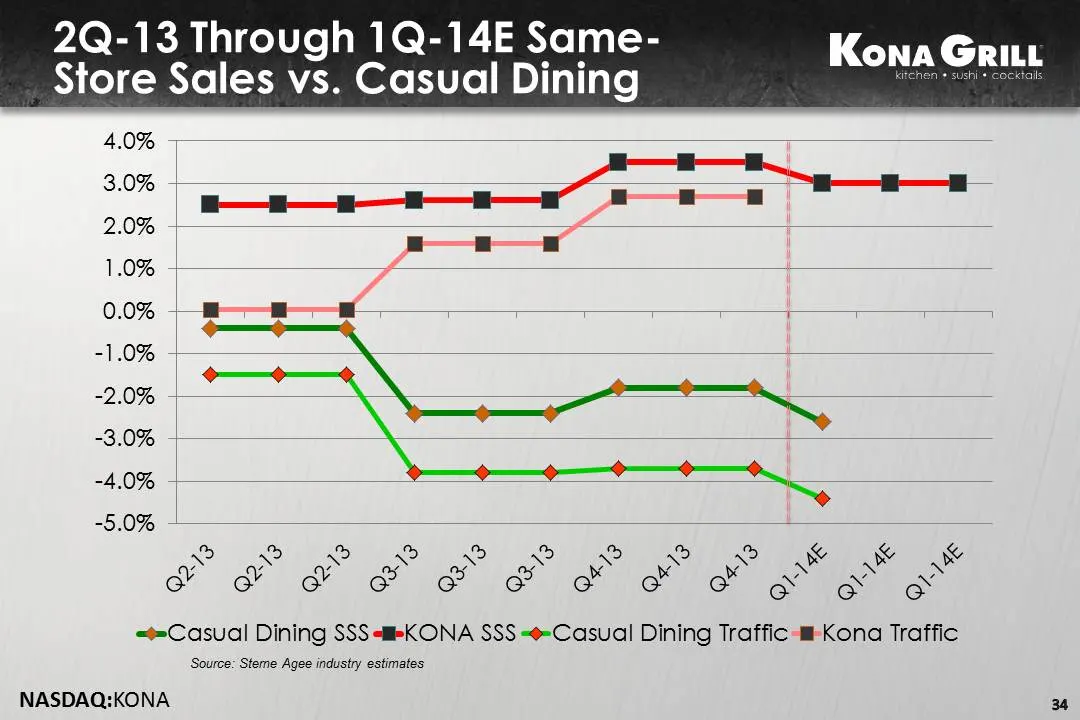
Slide 34: 2Q-13 Through 1Q-14E Same-Store Sales vs. Casual Dining
2Q-13 Through 1Q-14E Same- MouaGuiis Store Sales vs. Casual Dining 4.0% 3.0% 2.0% — 1.0% 0.0% 1.0% = -2.0% 53076 aia Oy -5.0% - =Casual Dining SSS -eKONA SSS =@=Casual Dining Traffic Kona Traffic Source: Steme Agee industry estimates NASDAQ:KONA 34
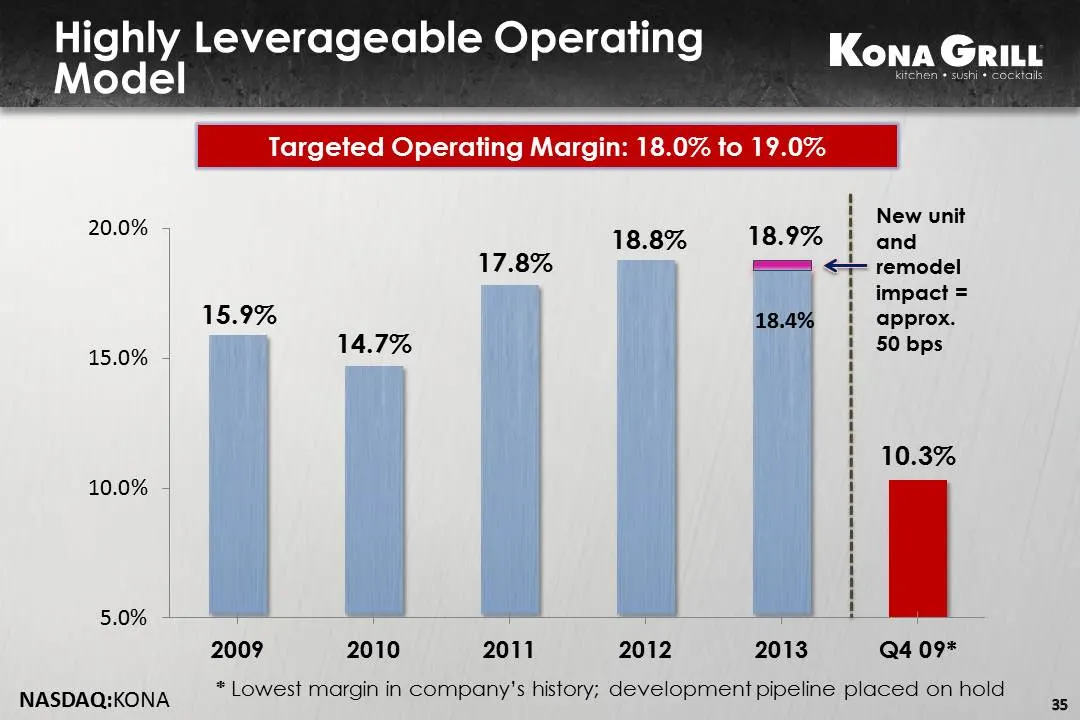
Slide 35: Highly Leverageable Operating Model
Highly Leverageable Operating Kona Grit Model 2 : 9 i N it 20.0% 18.8% 18.9% | and 17.8% === <+- remodel H impact = 15.9% 18.4% H approx. 1s ose 14.7% | 50 bps | 10.3% 10.0% i 5.0% ! 2009 2010 2011 2012 2013 Q4 09* NASDAQ:KONA * Lowest margin in company's history; development pipeline placed on hold
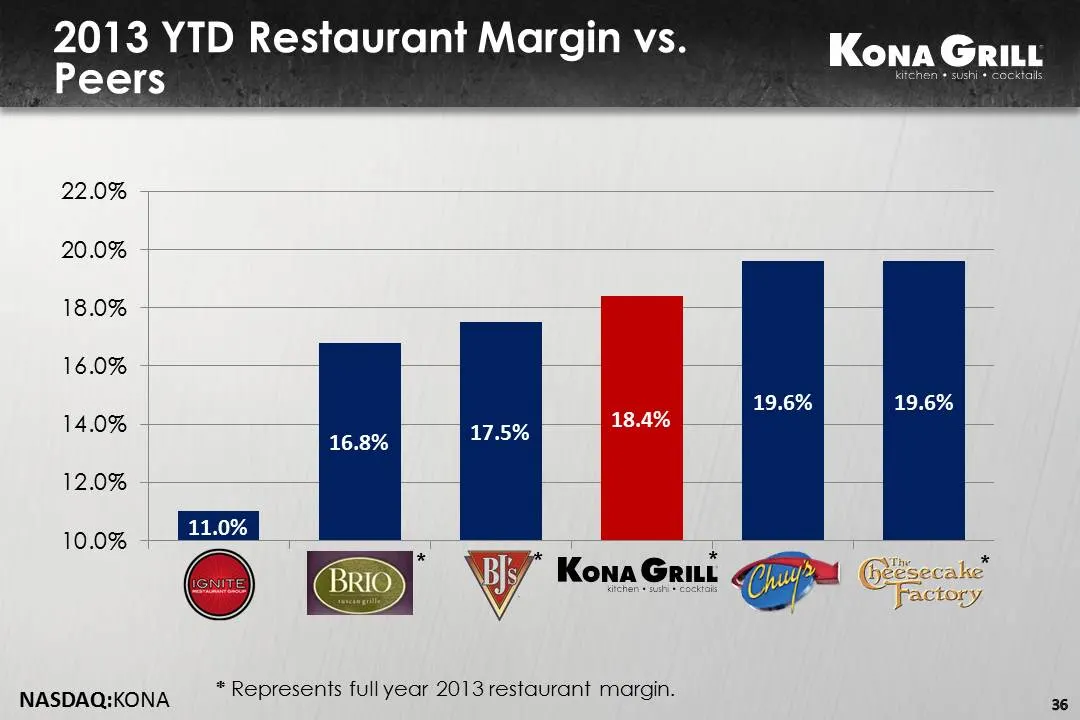
Slide 36: 2013 YTD Restaurant Margin vs. Peers
2013 YTD Restaurant Margin vs. Peers 22.0% 20.0% 18.0% 16.0% 19.6% 14.0% 12.0% 10.0% NASDAQ:KONA * Represents full year 2013 restaurant margin. -
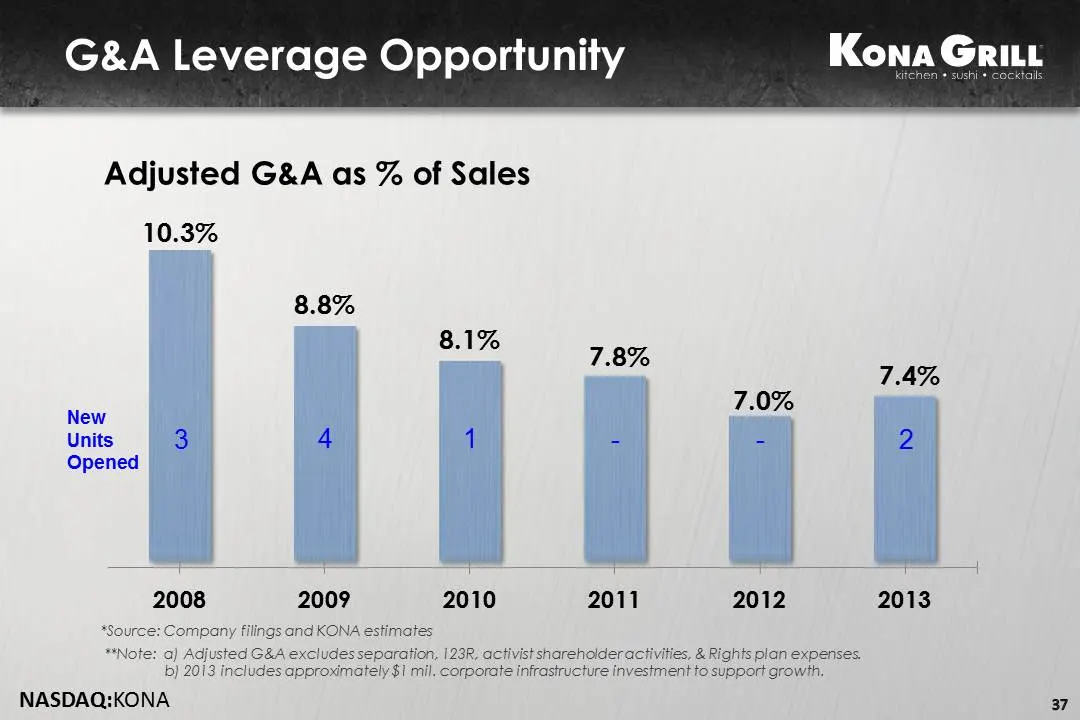
Slide 37: G&A Leverage Opportunity
G&A Leverage Opportunity Adjusted G&A as % of Sales 10.3% 8.8% 8.1% 7.8% 2009 2010 2011 2012 2013 37
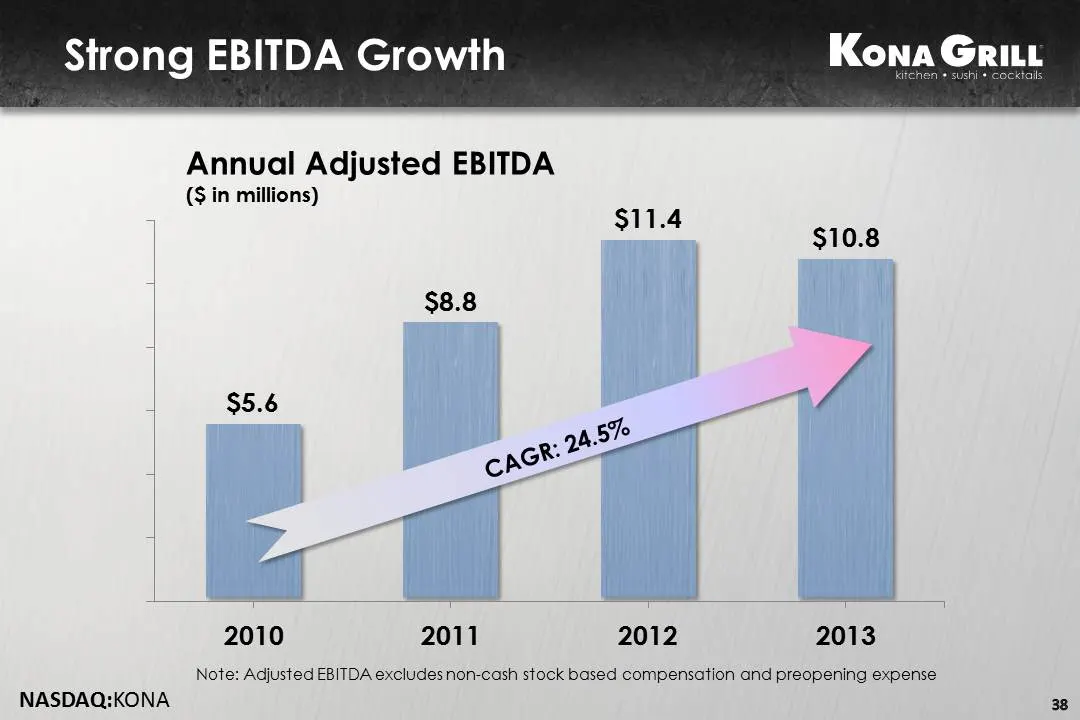
Slide 38: Strong EBITDA Growth
Strong EBITDA Growth Annual Adjusted EBITDA ($ in millions) 11.4 : $10.8 $8.8 $5.6 1 y 2010 2011 2012 2013 Note: Adjusted EBITDA excludes non-cash stock based compensation and preopening expense NASDAQ:KONA
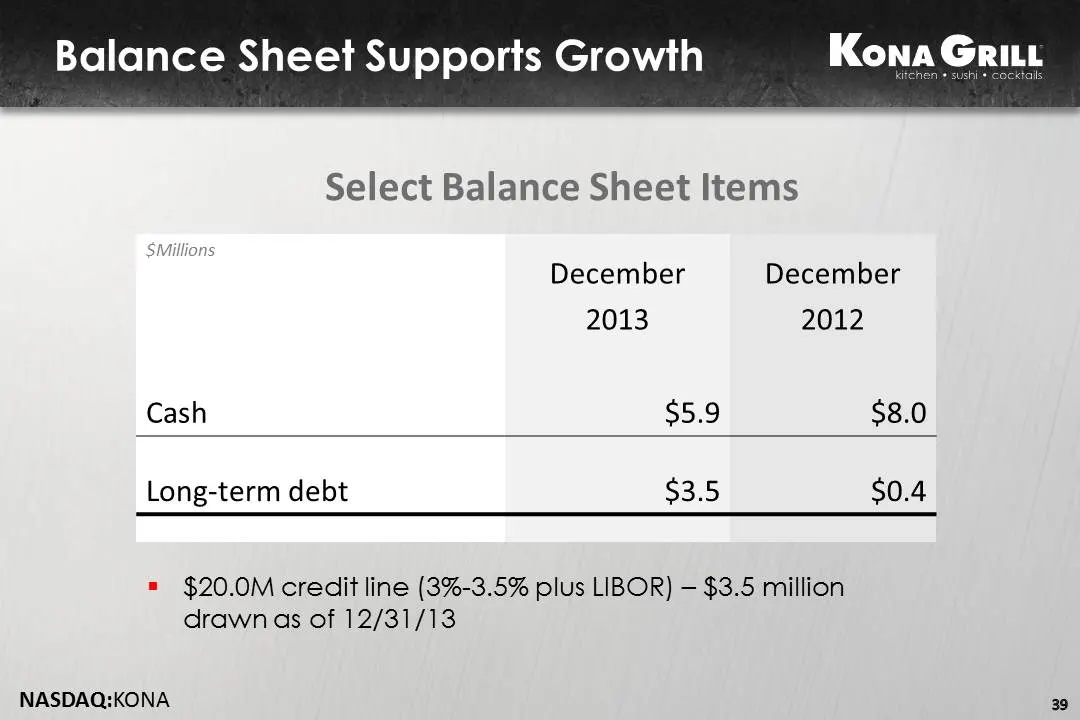
Slide 39: Balance Sheet Supports Growth
Balance Sheet Supports Growth Kona Select Balance Sheet Items December December 2013 2012 Cash $5.9 $8.0 Long-term debt $3.5 $0.4 = $20.0M credit line (3%-3.5% plus LIBOR) — $3.5 million drawn as of 12/31/13 NASDAQ:KONA 39
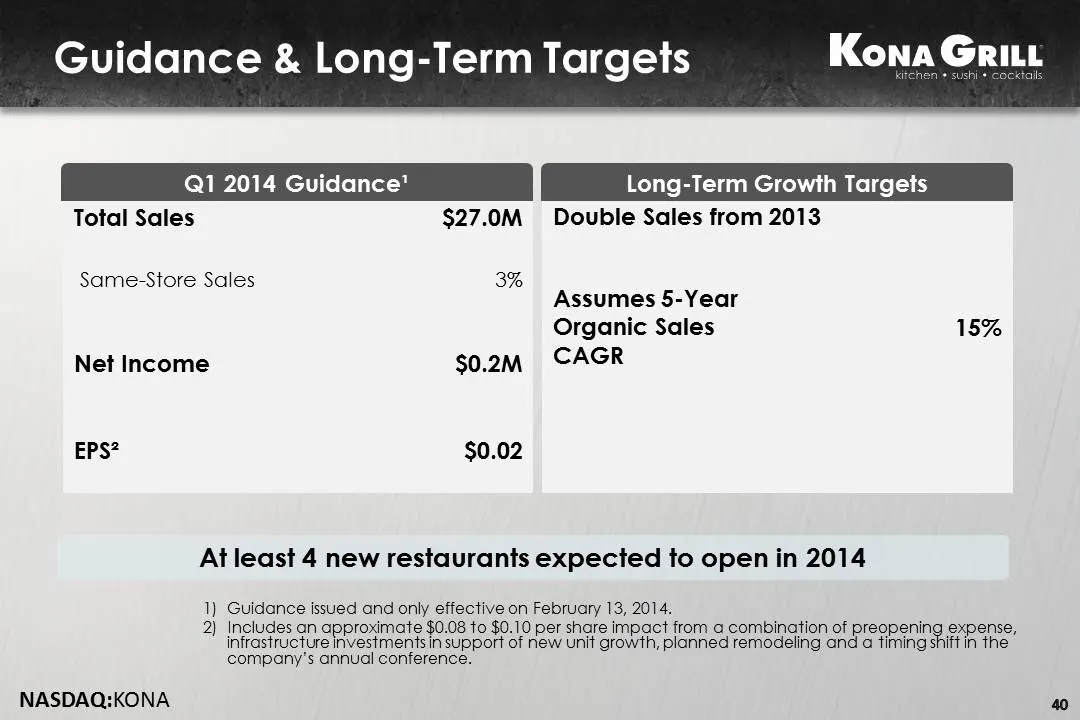
Slide 40: Guidance & Long-Term Targets
Guidance & Long-Term Targets Kona Grit Q1 2014 Guidance’ Long-Term Growth Targets Total Sales $27.0M Double Sales from 2013 Same-Store Sales 3% Assumes 5-Year Organic Sales 15% Net Income $0.2M CAGR EPS? $0.02 At least 4 new restaurants expected to open in 2014 1) Guidance issued and only effective
Slide 41: Compelling Unit Level Economics
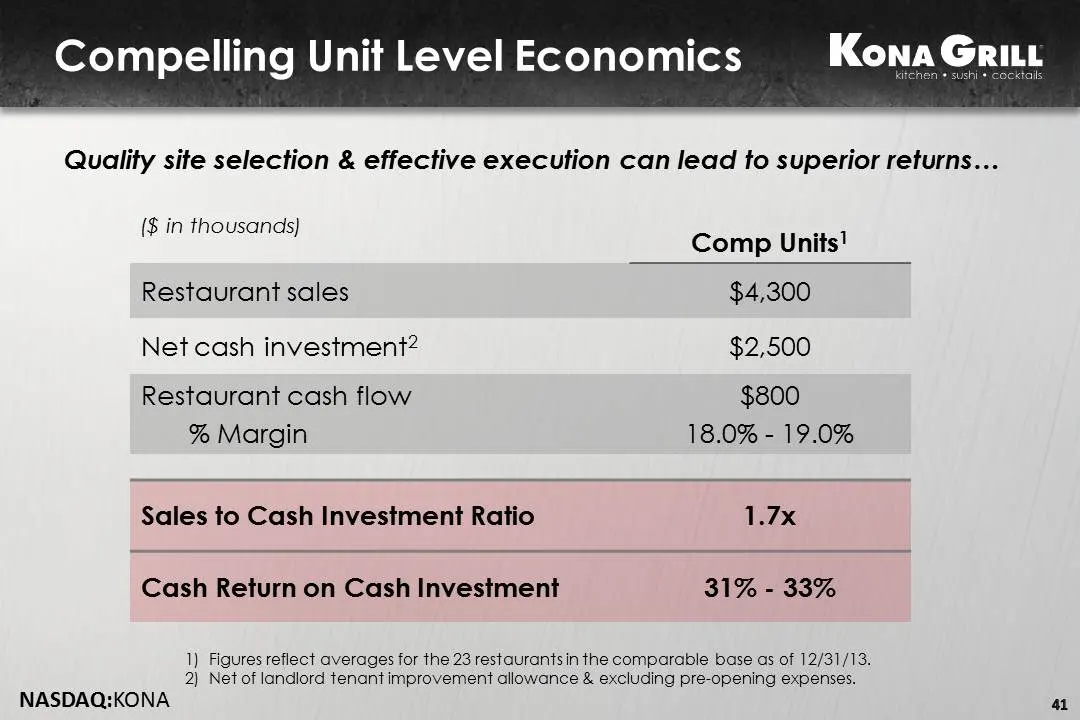
Compelling Unit Level Economics KonaG Quality site selection & effective execution can lead fo superior returns... ($ in thousands) ome Units! Restaurant sales $4,300 Net cash investment? $2,500 Restaurant cash flow $800 % Margin 18.0% - 19.0% Sales to Cash Investment Ratio 1.7x Cash Return on Cash
Slide 42: Key Take-Aways
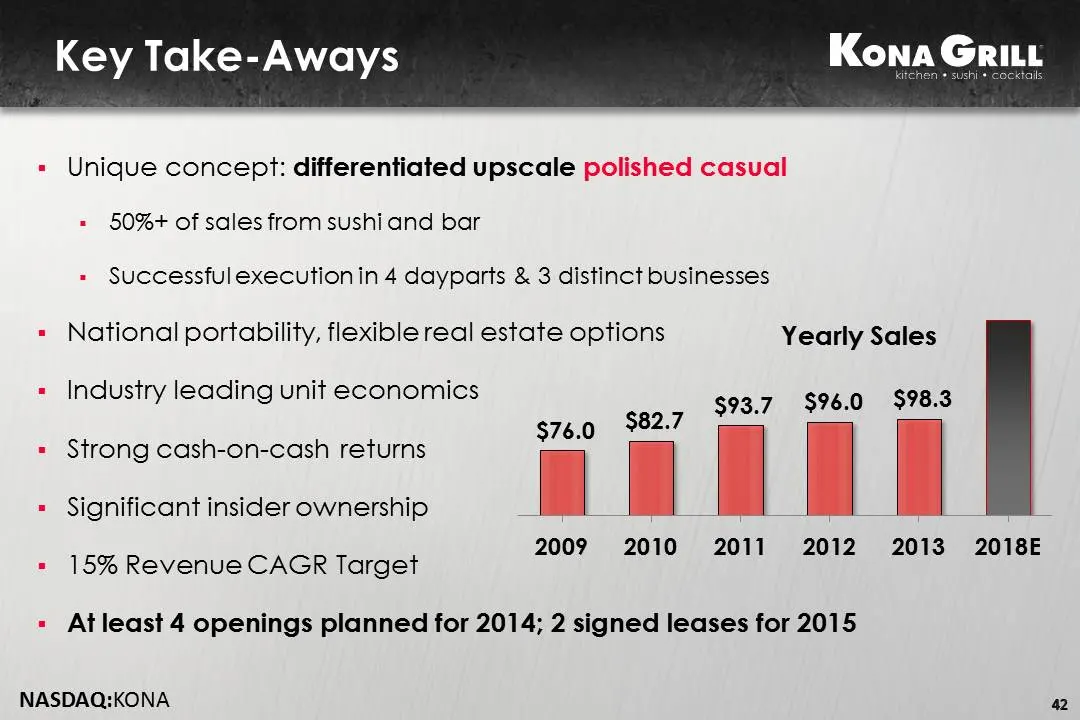
Key Take-Aways Unique concept: differentiated upscale polished casual 50%+ of sales from sushi and bar = Successfulexecutionin 4 dayparts & 3 distinct businesses = National portability, flexible real estate options Yearly Sales » Industry leading unit economics al $93.7 $96.0 $98.3 76.0 = Strong cas
Slide 43: Kona Grill Contacts
Kona Grill Contacts Kona Grill, Inc. 7150 East Camelback Road, #220 Scottsdale, AZ 85251 Tel (480) 922-8100 Company Contact Berke Bakay, CEO Christi Hing, CFO Investor Relations Liolios Group Cody Slach Tel (949) 574-3860 KONA@liolios.com NASDAQ:KONA 43
Source: SEC EDGAR · 8-K filed Feb 26, 2014
More decks from Kona Grill Inc
 Investor Presentation (January 2019)27 slides · Jan 14, 2019
 ICR Conference 201639 slides · Jan 12, 2016
 Investor Presentation (December 2015)41 slides · Dec 9, 2015
 Piper Jaffray 35th Annual Consumer Conference 201543 slides · Jun 10, 2015
 Investor Presentation (May 2015)42 slides · May 6, 2015
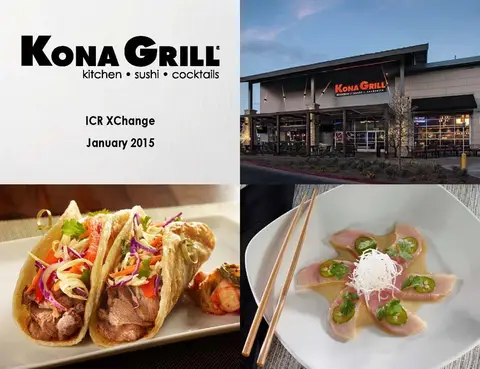 ICR XChange 201538 slides · Jan 12, 2015