LSL Property Services plc · LSE:LSL
LSL Property Services — H1 2025 Earnings Presentation
26 slides from LSL Property Services's earnings presentation, Sep 17, 2025

Slide 1: 2025 Interim Results
2025 Interim Results 17 September 2025
Slide 2: Agenda
Agenda Key Highlights Adam Castleton, Group CEO Financial Highlights David Wolffe, Group CFO (Interim) Outlook and Summary Adam Castleton, Group CEO 2

Slide 3: Key Highlights
Key Highlights Adam Castleton, Group CEO
Slide 4: In-line results, continued operational progress
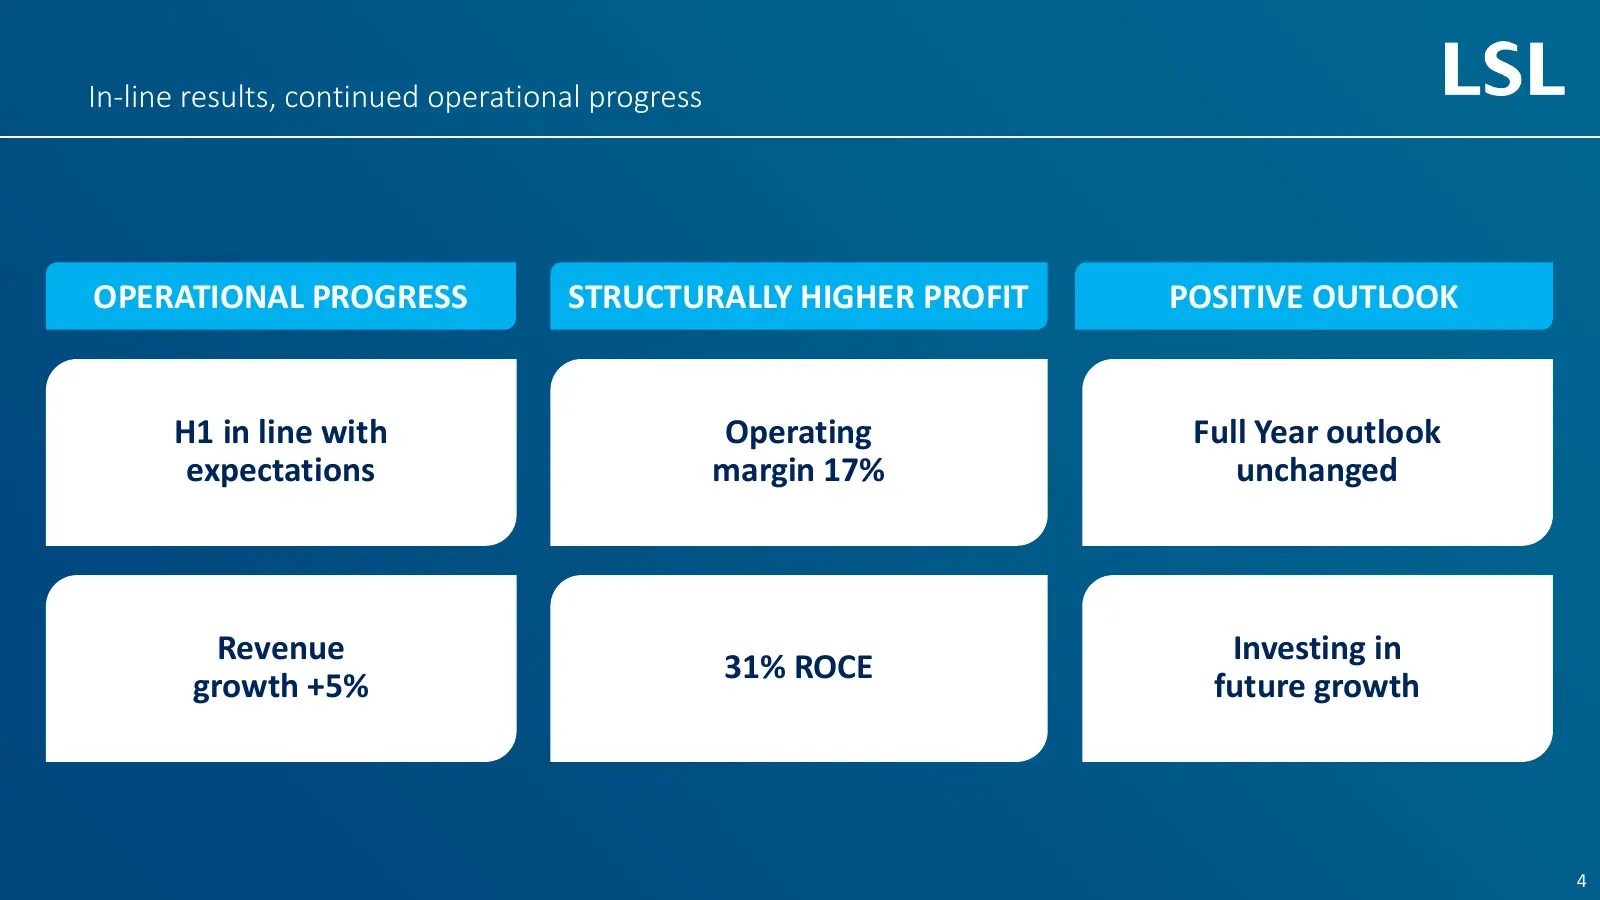
In-line results, continued operational progress OPERATIONAL PROGRESS STRUCTURALLY HIGHER PROFIT POSITIVE OUTLOOK H1 in line with Operating Full Year outlook expectations margin 17% unchanged Revenue Investing in 31% ROCE growth +5% future growth 4
Slide 5: Revenue and profit growth, maintained high operating margin
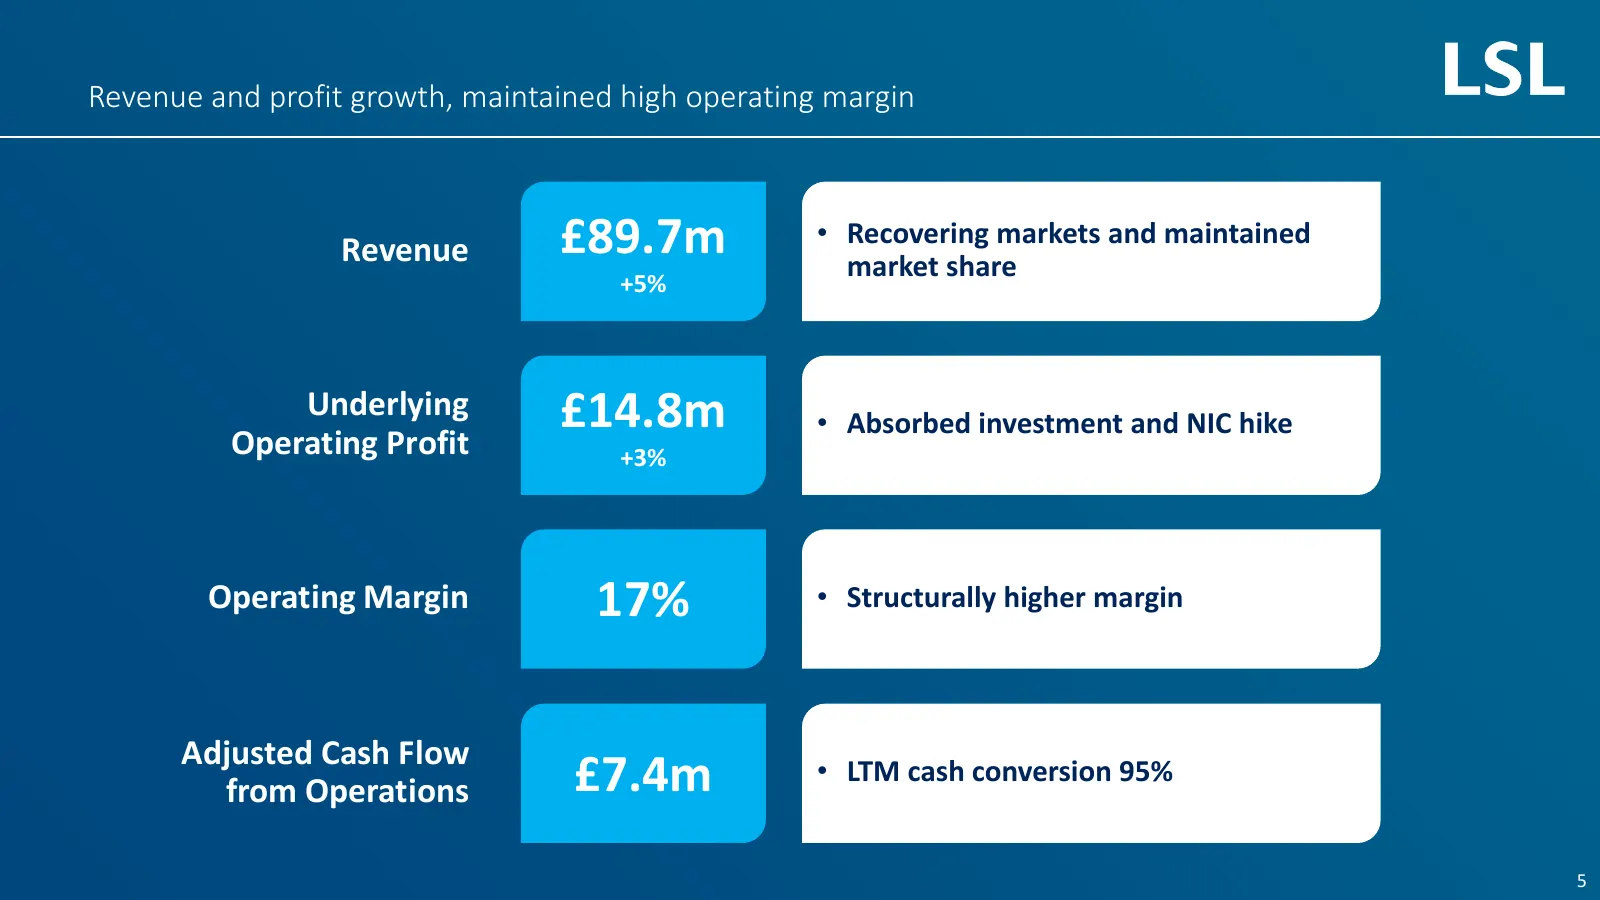
Revenue and profit growth, maintained high operating margin Revenue £89.7m • Recovering markets and maintained market share +5% Underlying £14.8m • Absorbed investment and NIC hike Operating Profit +3% Operating Margin 17% • Structurally higher margin Adjusted Cash Flow from Operations £7.4m • LTM c
Slide 6: Positive performance in recovering markets
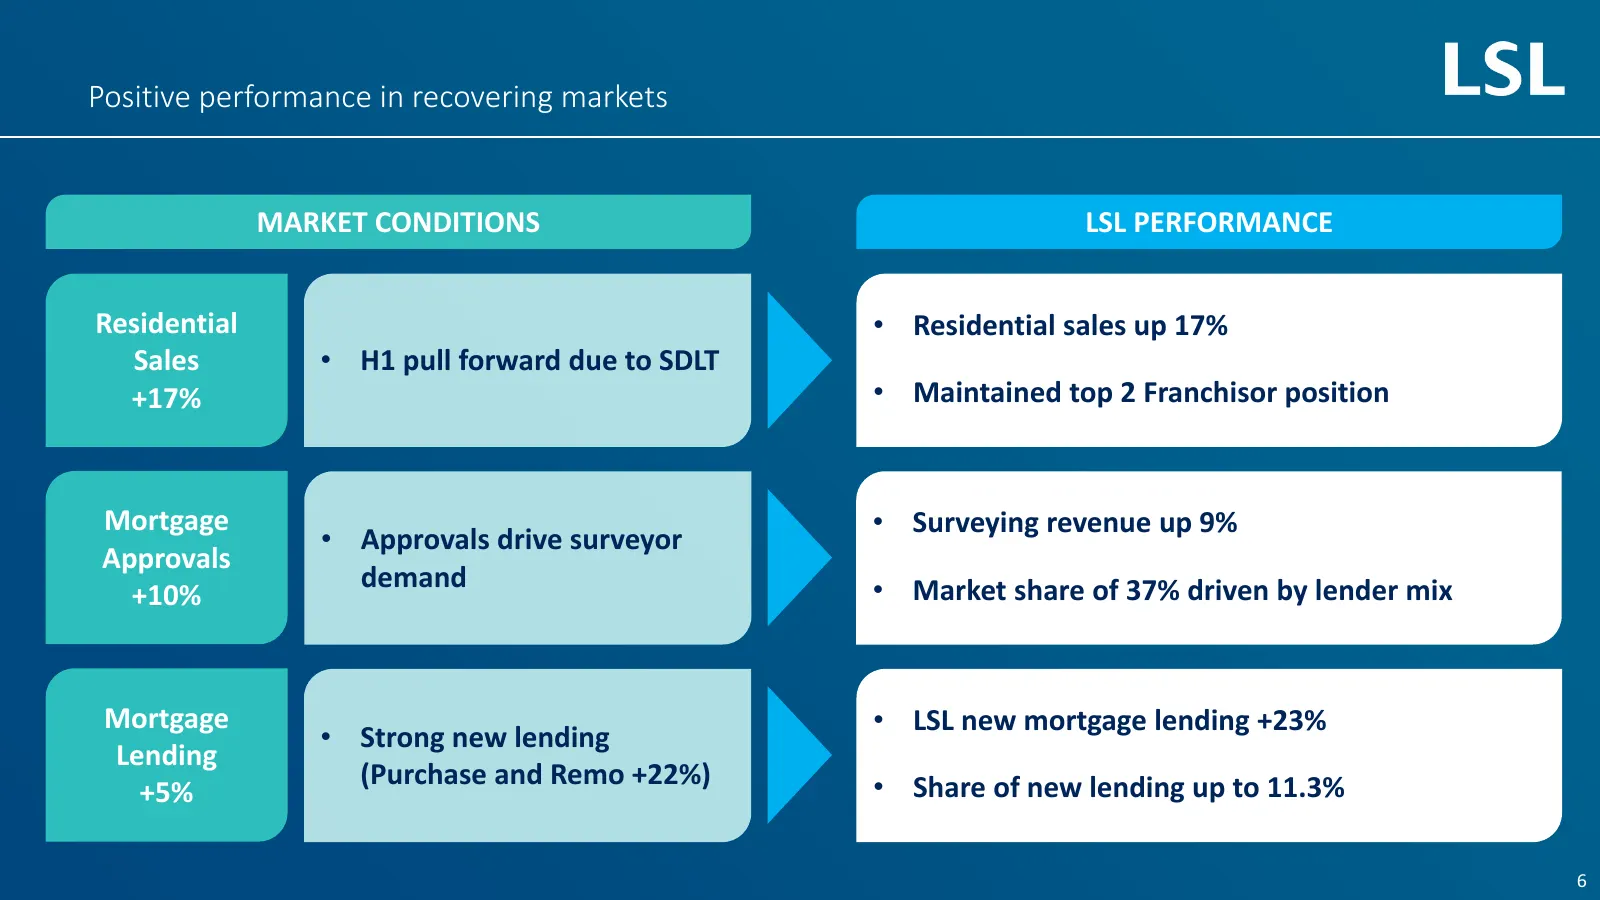
Positive performance in recovering markets MARKET CONDITIONS LSL PERFORMANCE Residential • Residential sales up 17% Sales • H1 pull forward due to SDLT +17% • Maintained top 2 Franchisor position Mortgage • Surveying revenue up 9% • Approvals drive surveyor Approvals demand • Market share of 37% dri
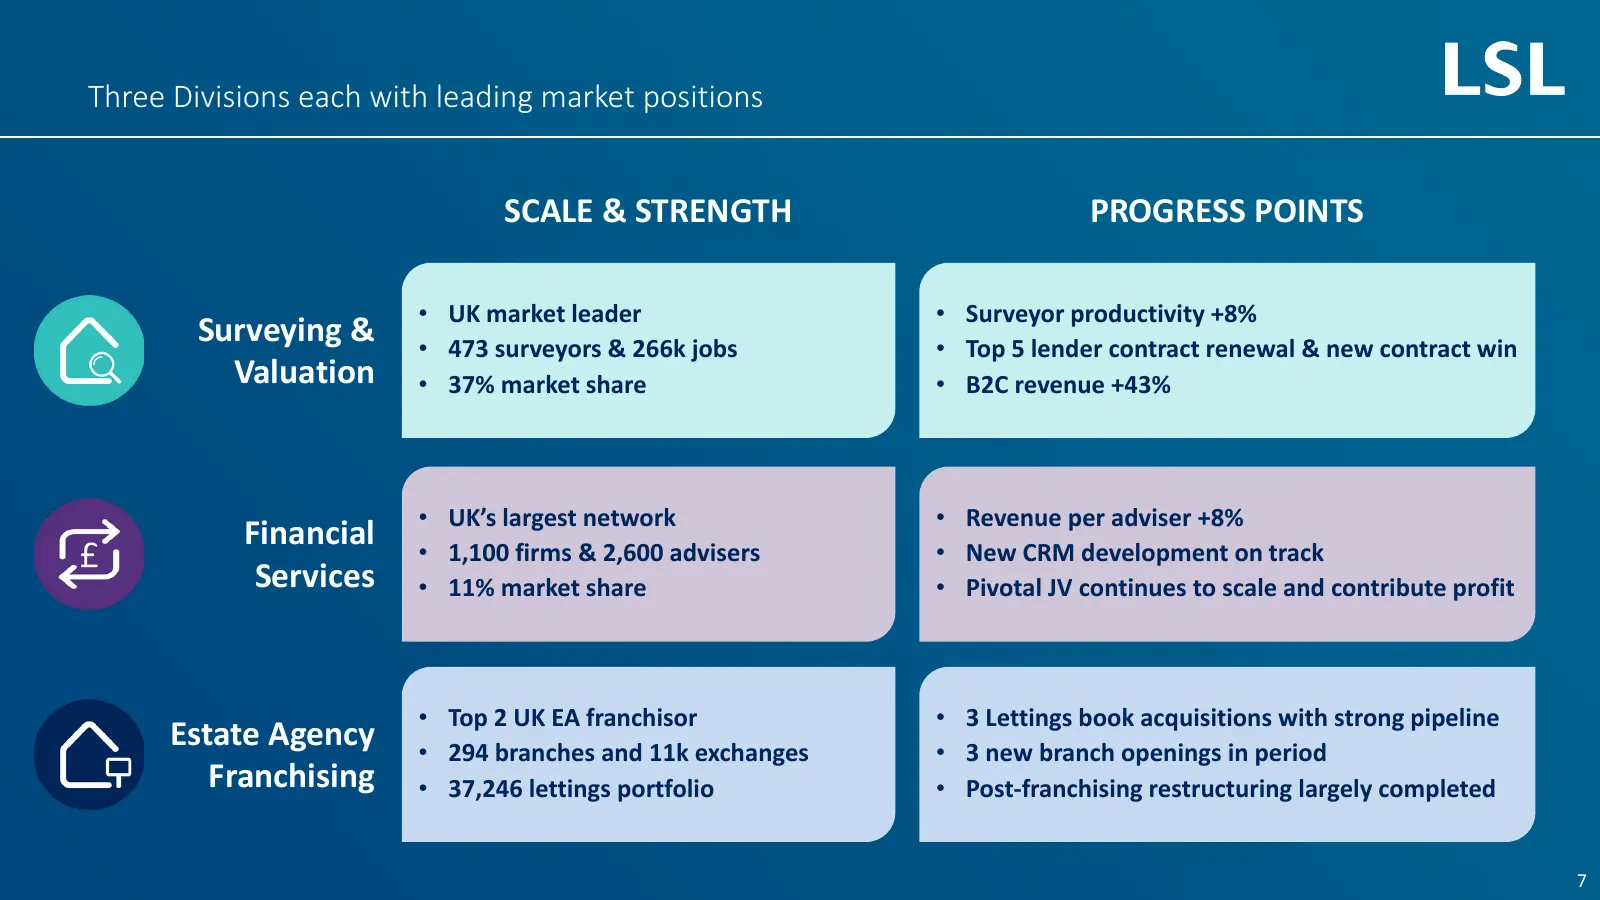
Slide 7: Three Divisions each with leading market positions
Three Divisions each with leading market positions SCALE & STRENGTH PROGRESS POINTS • UK market leader • Surveyor productivity +8% Surveying & • 473 surveyors & 266k jobs • Top 5 lender contract renewal & new contract win Valuation • 37% market share • B2C revenue +43% • UK’s largest network • Reven
Slide 8: Financial Highlights
Financial Highlights David Wolffe, Group CFO (Interim)
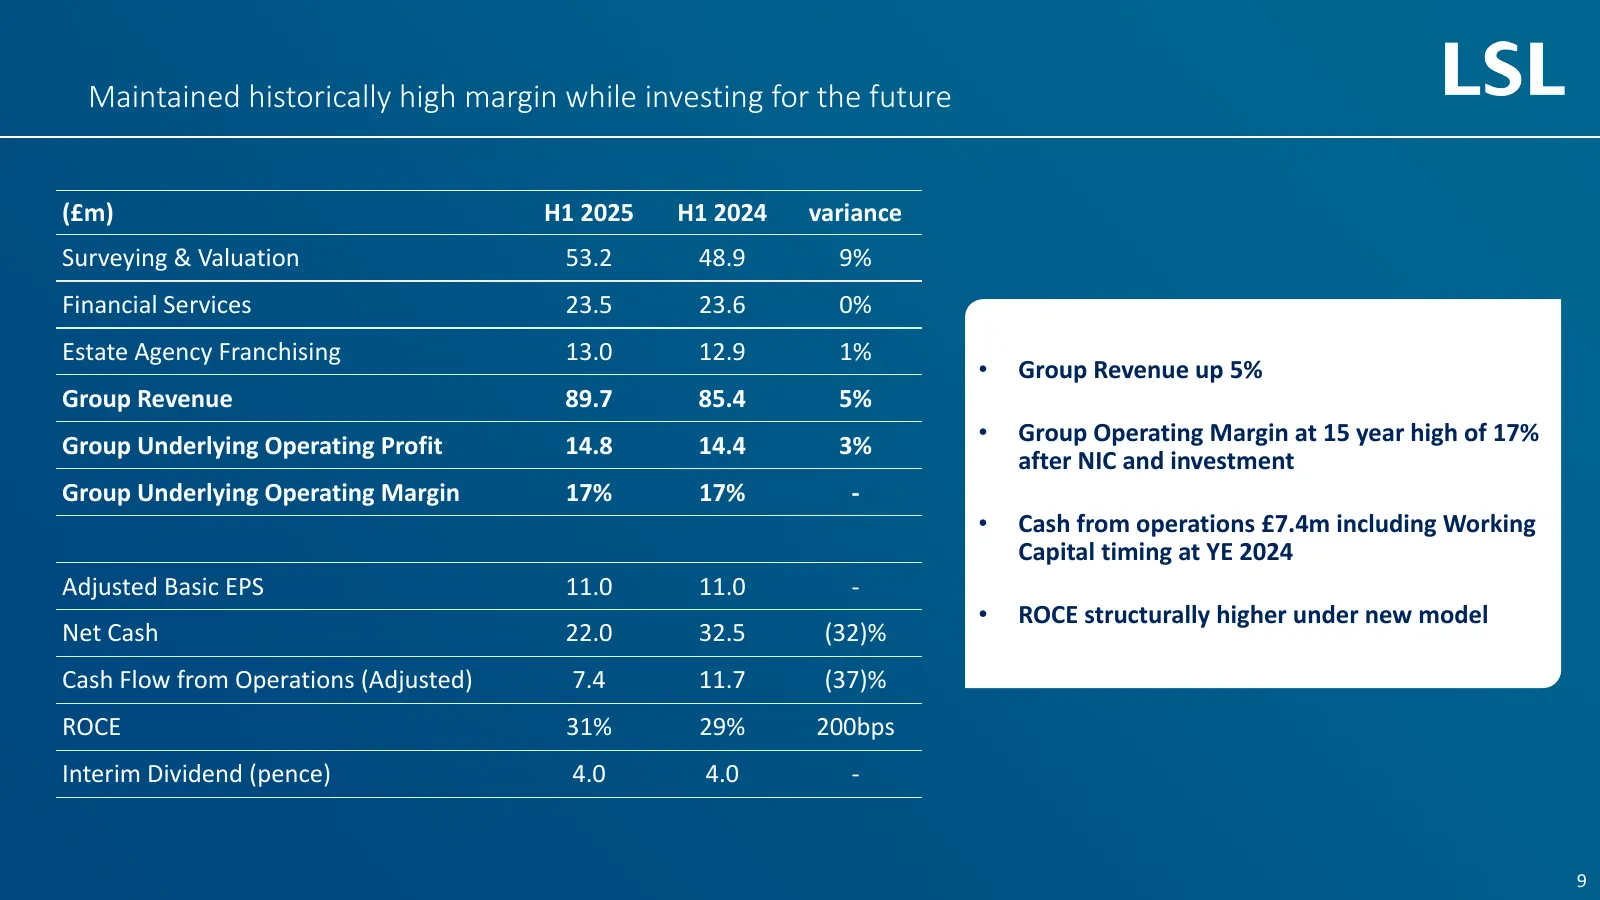
Slide 9: Maintained historically high margin while investing for the future
Maintained historically high margin while investing for the future (£m) H1 2025 H1 2024 variance Surveying & Valuation 53.2 48.9 9% Financial Services 23.5 23.6 0% Estate Agency Franchising 13.0 12.9 1% • Group Revenue up 5% Group Revenue 89.7 85.4 5% Group Underlying Operating Profit 14.8 14.4 3% •
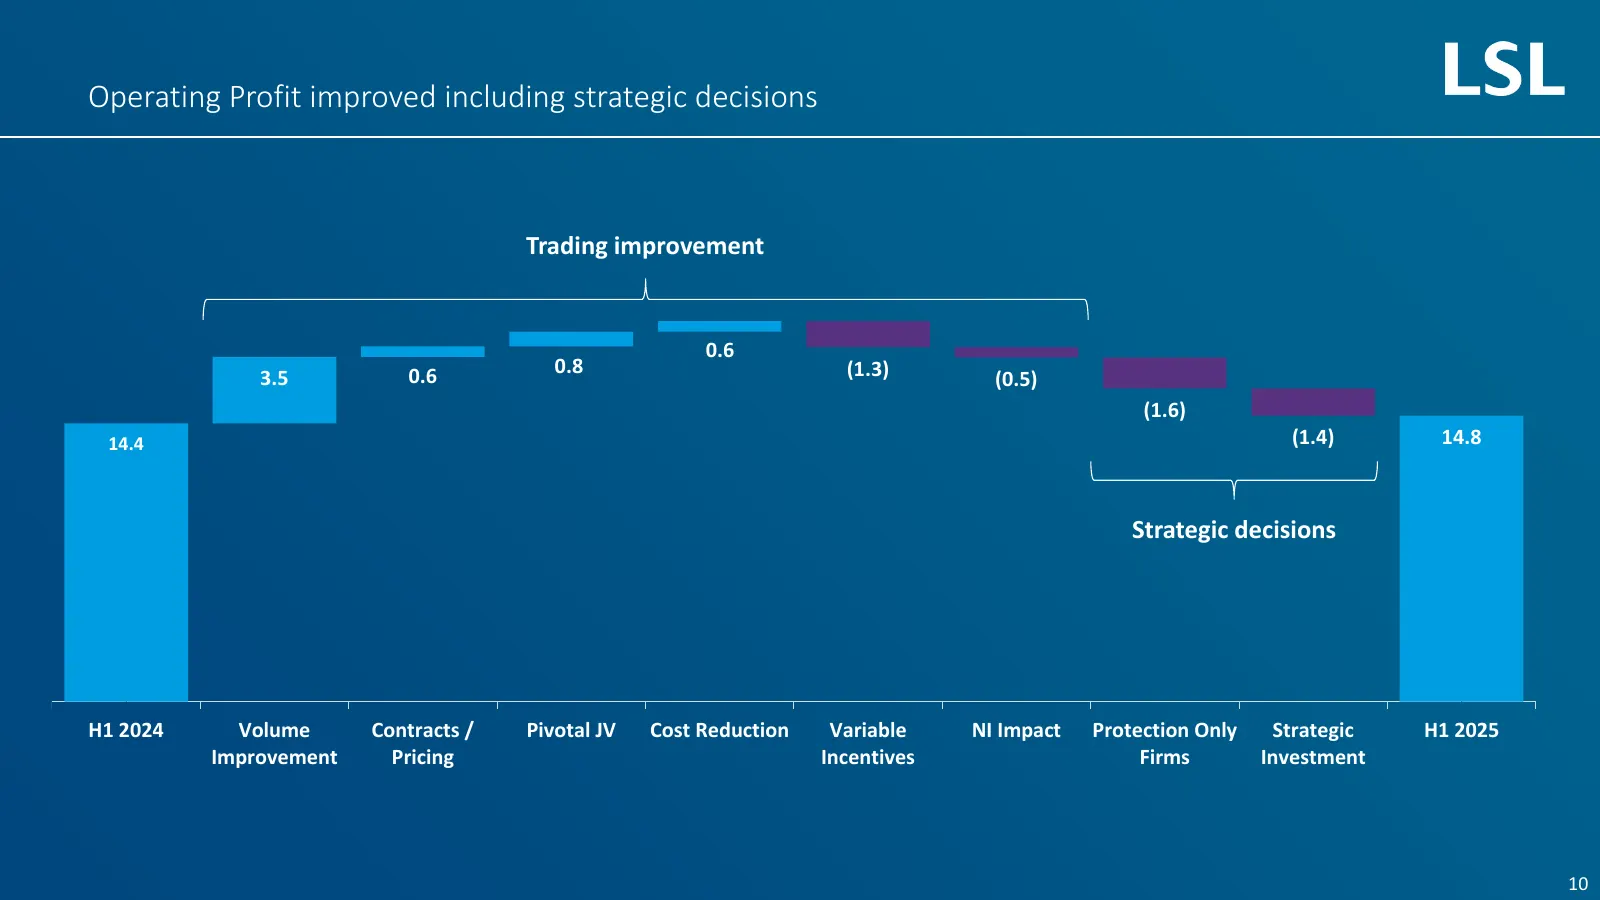
Slide 10: Operating Profit improved including strategic decisions
Operating Profit improved including strategic decisions Trading improvement 0.6 0.6 0.8 (1.3) 3.5 (0.5) (1.6) 14.4 (1.4) 14.8 Strategic decisions H1 2024 Volume Contracts / Pivotal JV Cost Reduction Variable NI Impact Protection Only Strategic H1 2025 Improvement Pricing Incentives Firms Investment
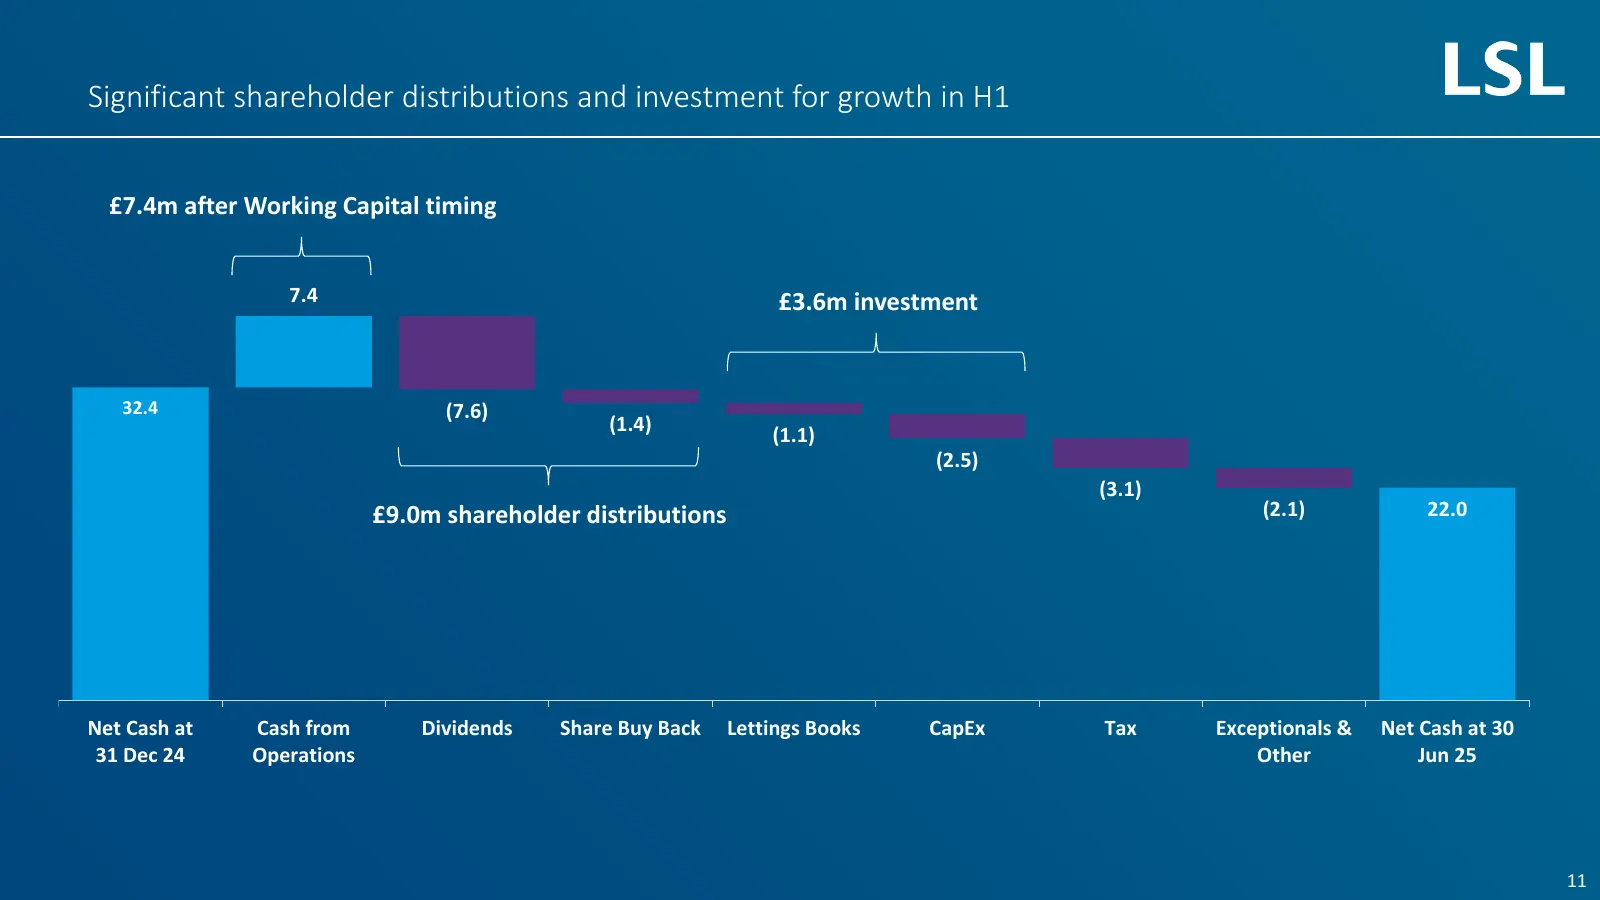
Slide 11: Significant shareholder distributions and investment for growth in H1
Significant shareholder distributions and investment for growth in H1 £7.4m after Working Capital timing 7.4 £3.6m investment 32.4 (7.6) (1.4) (1.1) (2.5) (3.1) £9.0m shareholder distributions (2.1) 22.0 Net Cash at Cash from Dividends Share Buy Back Lettings Books CapEx Tax Exceptionals & Net Cash
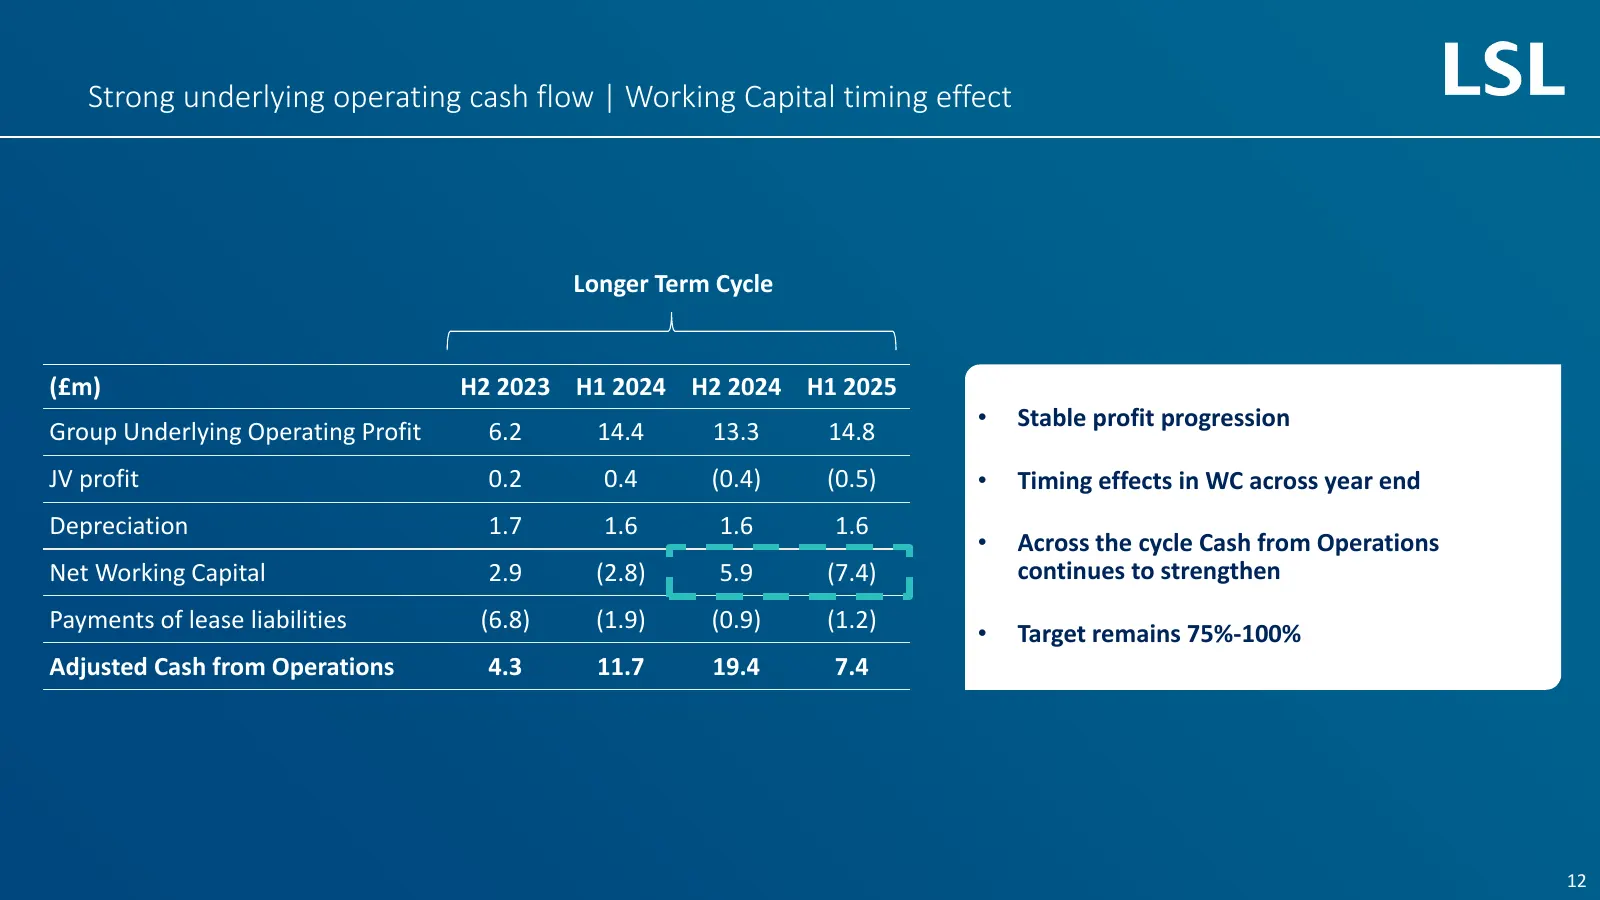
Slide 12: Strong underlying operating cash flow
Strong underlying operating cash flow | Working Capital timing effect Longer Term Cycle (£m) H2 2023 H1 2024 H2 2024 H1 2025 • Stable profit progression Group Underlying Operating Profit 6.2 14.4 13.3 14.8 JV profit 0.2 0.4 (0.4) (0.5) • Timing effects in WC across year end Depreciation 1.7 1.6 1.6
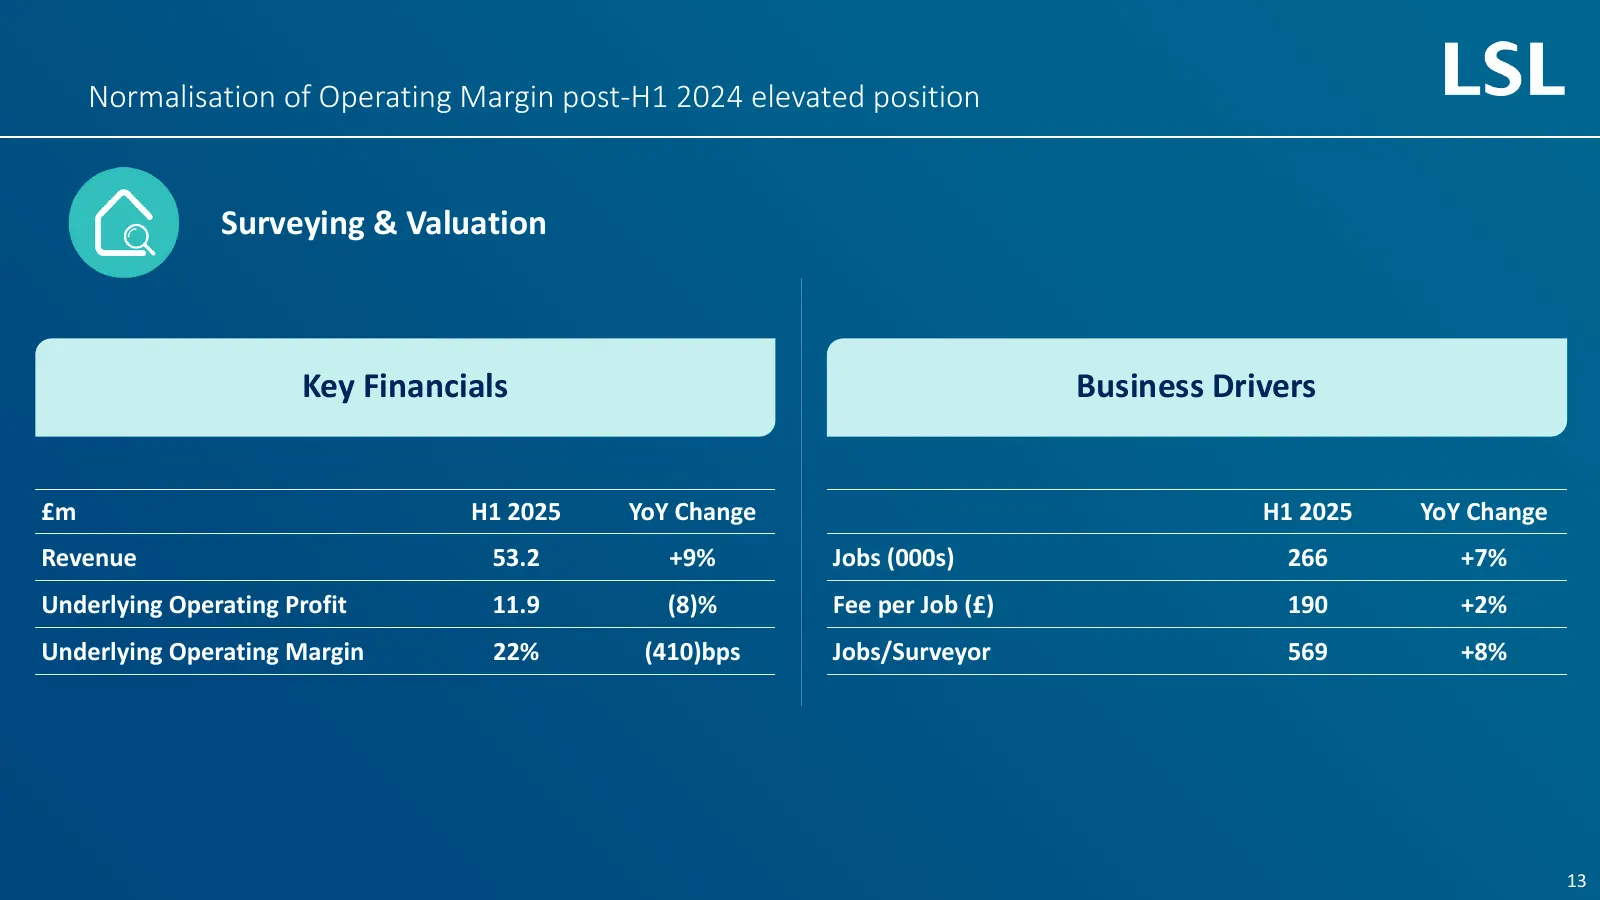
Slide 13: Normalisation of Operating Margin post-H1 2024 elevated position
Normalisation of Operating Margin post-H1 2024 elevated position Surveying & Valuation Key Financials Business Drivers £m H1 2025 YoY Change H1 2025 YoY Change Revenue 53.2 +9% Jobs (000s) 266 +7% Underlying Operating Profit 11.9 (8)% Fee per Job (£) 190 +2% Underlying Operating Margin 22% (410)bps
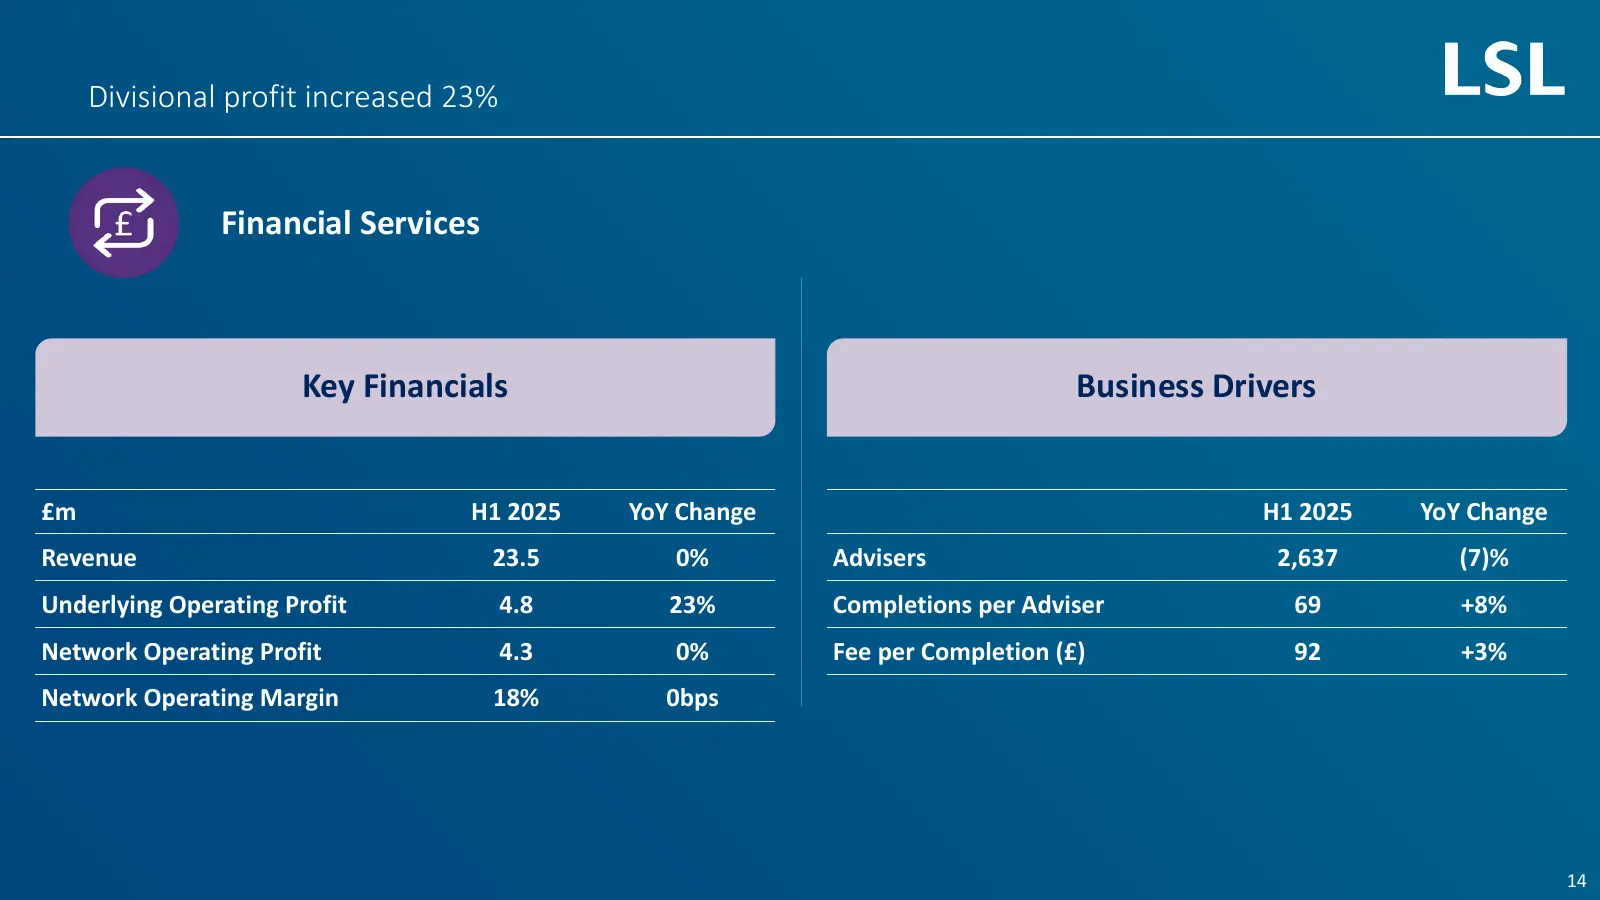
Slide 14: Divisional profit increased 23%
Divisional profit increased 23% Financial Services Key Financials Business Drivers £m H1 2025 YoY Change H1 2025 YoY Change Revenue 23.5 0% Advisers 2,637 (7)% Underlying Operating Profit 4.8 23% Completions per Adviser 69 +8% Network Operating Profit 4.3 0% Fee per Completion (£) 92 +3% Network Ope
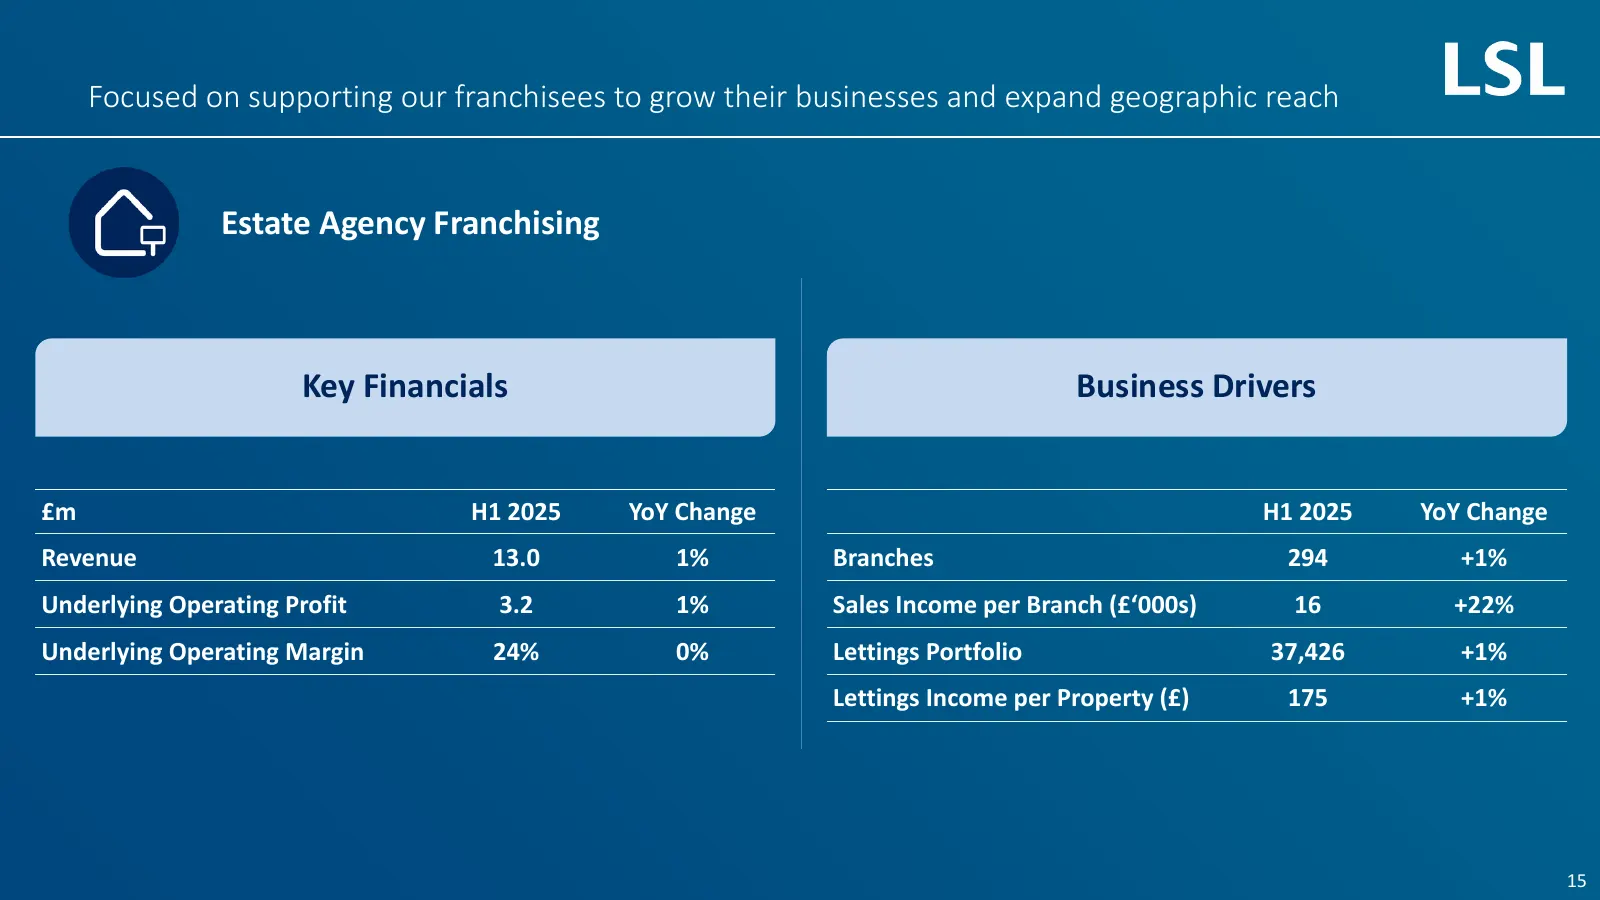
Slide 15: Focused on supporting our franchisees to grow their businesses
Focused on supporting our franchisees to grow their businesses and expand geographic reach Estate Agency Franchising Key Financials Business Drivers £m H1 2025 YoY Change H1 2025 YoY Change Revenue 13.0 1% Branches 294 +1% Underlying Operating Profit 3.2 1% Sales Income per Branch (£‘000s) 16 +22% U

Slide 16: Outlook & Summary
Outlook & Summary Adam Castleton, Group CEO
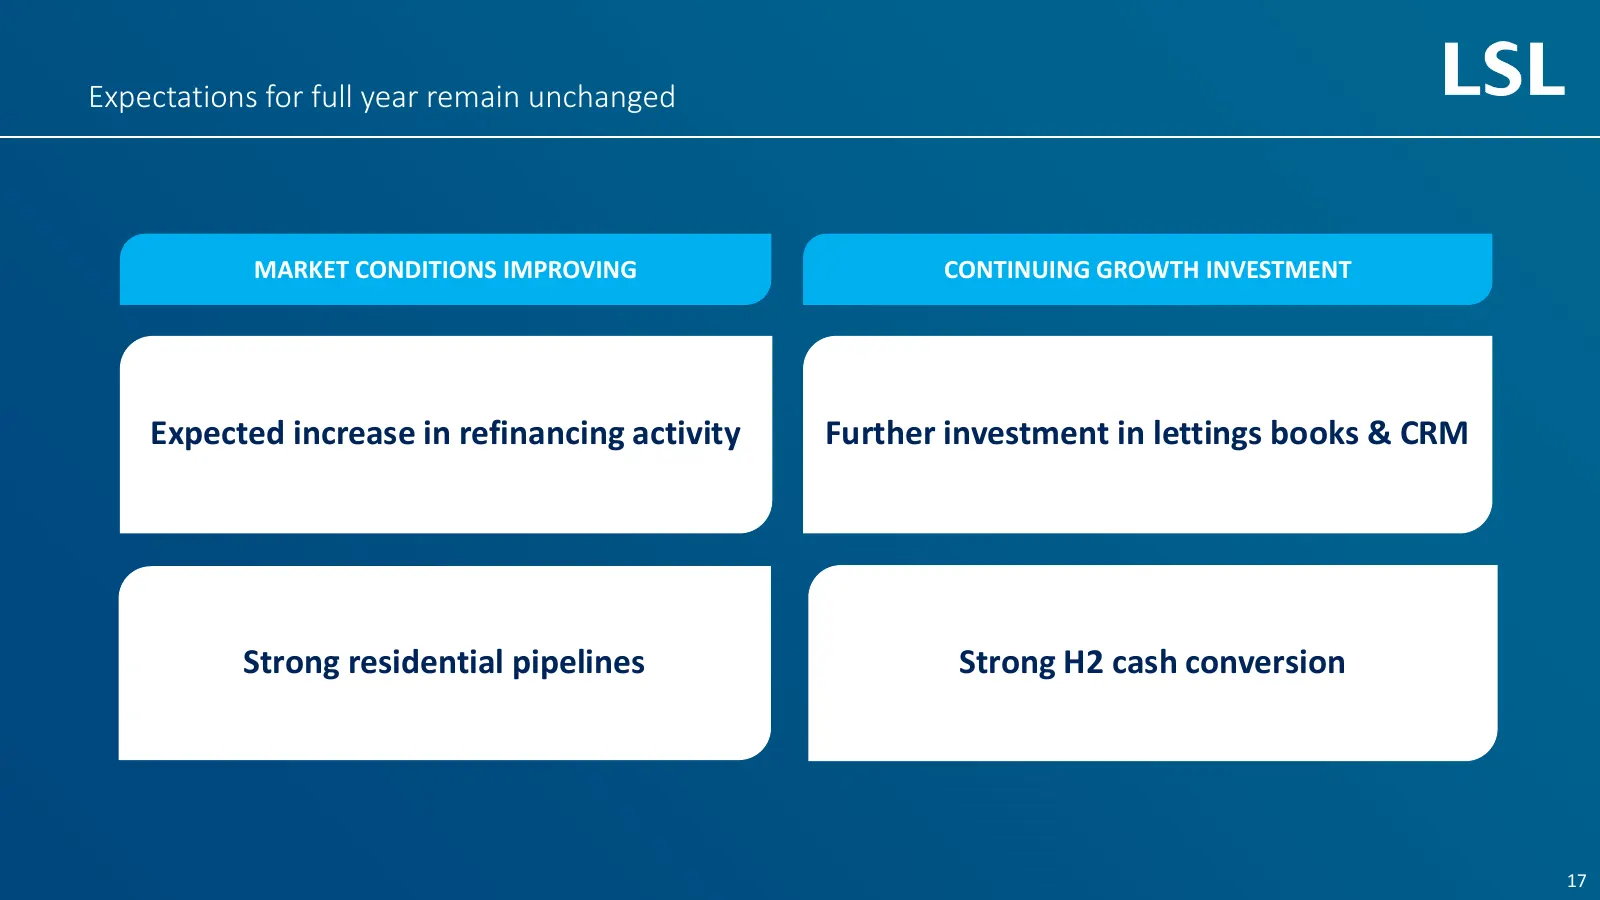
Slide 17: Expectations for full year remain unchanged
Expectations for full year remain unchanged MARKET CONDITIONS IMPROVING CONTINUING GROWTH INVESTMENT Expected increase in refinancing activity Further investment in lettings books & CRM Strong residential pipelines Strong H2 cash conversion 17
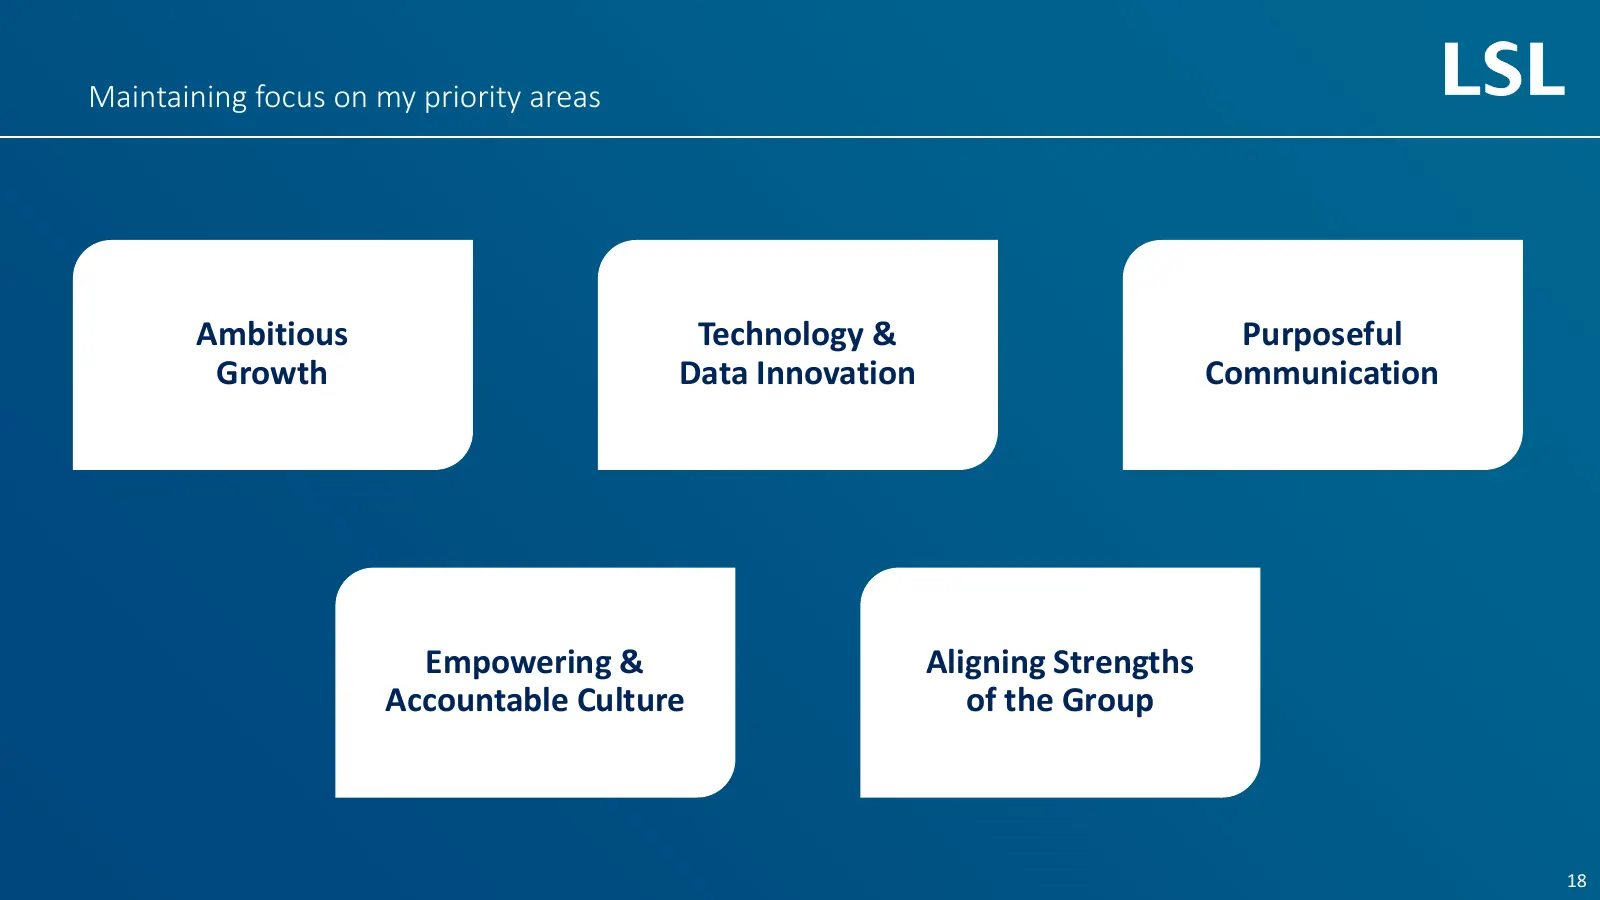
Slide 18: Maintaining focus on my priority areas
Maintaining focus on my priority areas Ambitious Technology & Purposeful Growth Data Innovation Communication Empowering & Aligning Strengths Accountable Culture of the Group 18
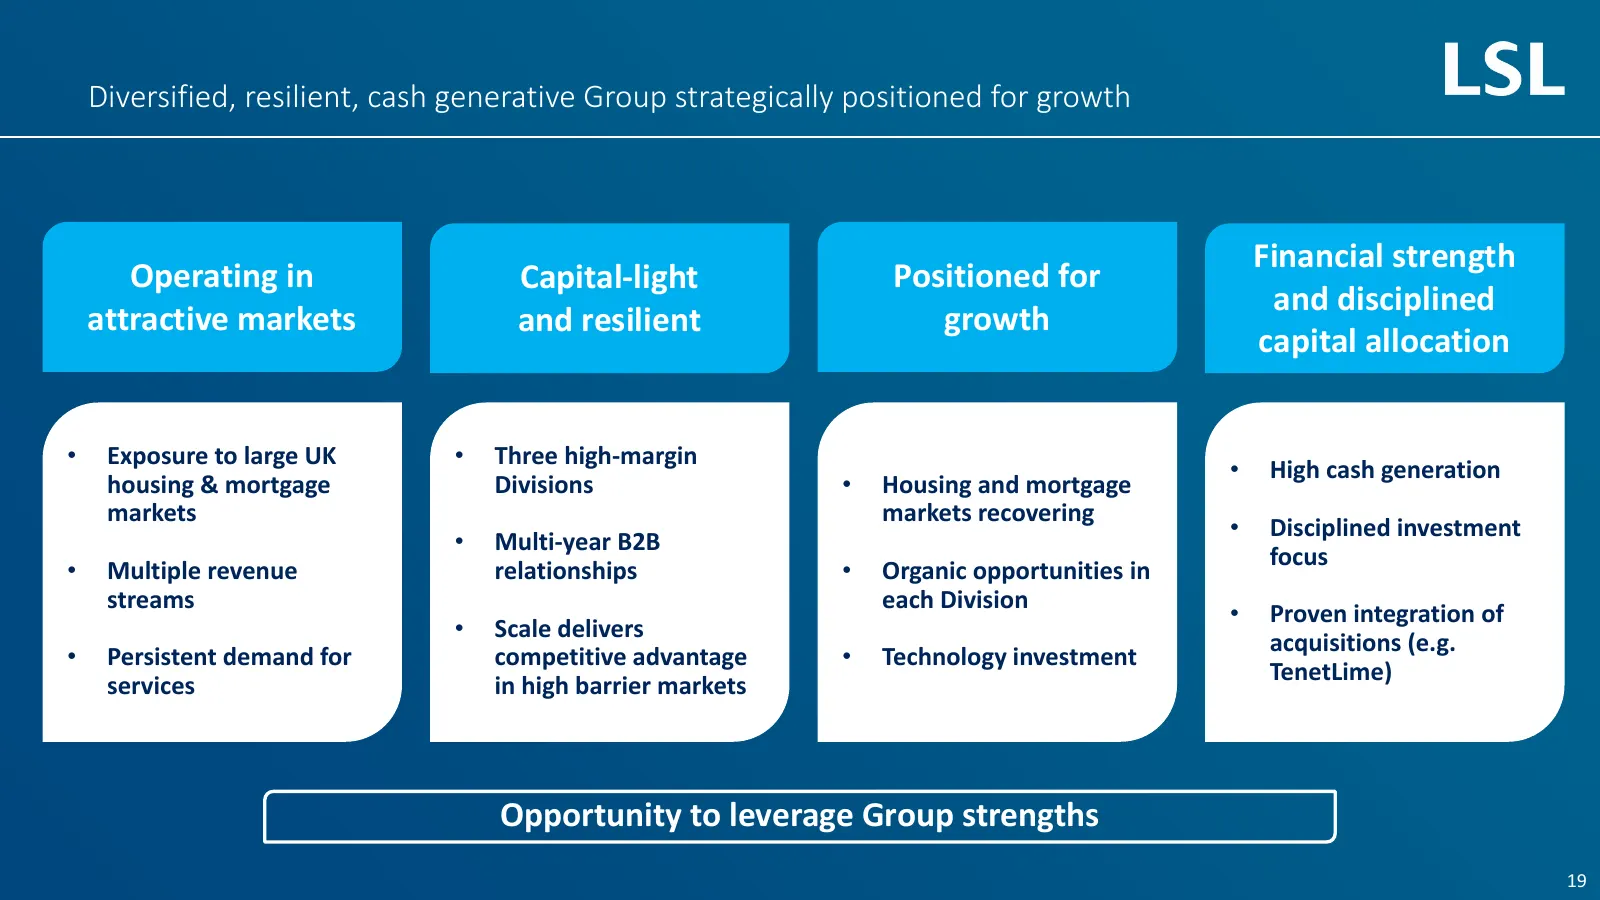
Slide 19: Diversified, resilient, cash generative Group strategically positioned for growth
Diversified, resilient, cash generative Group strategically positioned for growth Financial strength Operating in Capital-light Positioned for and disciplined attractive markets and resilient growth capital allocation • Exposure to large UK • Three high-margin • High cash generation housing & mortga

Slide 20: Thank you Q&A
Thank you Q&A

Slide 21: Appendices
Appendices
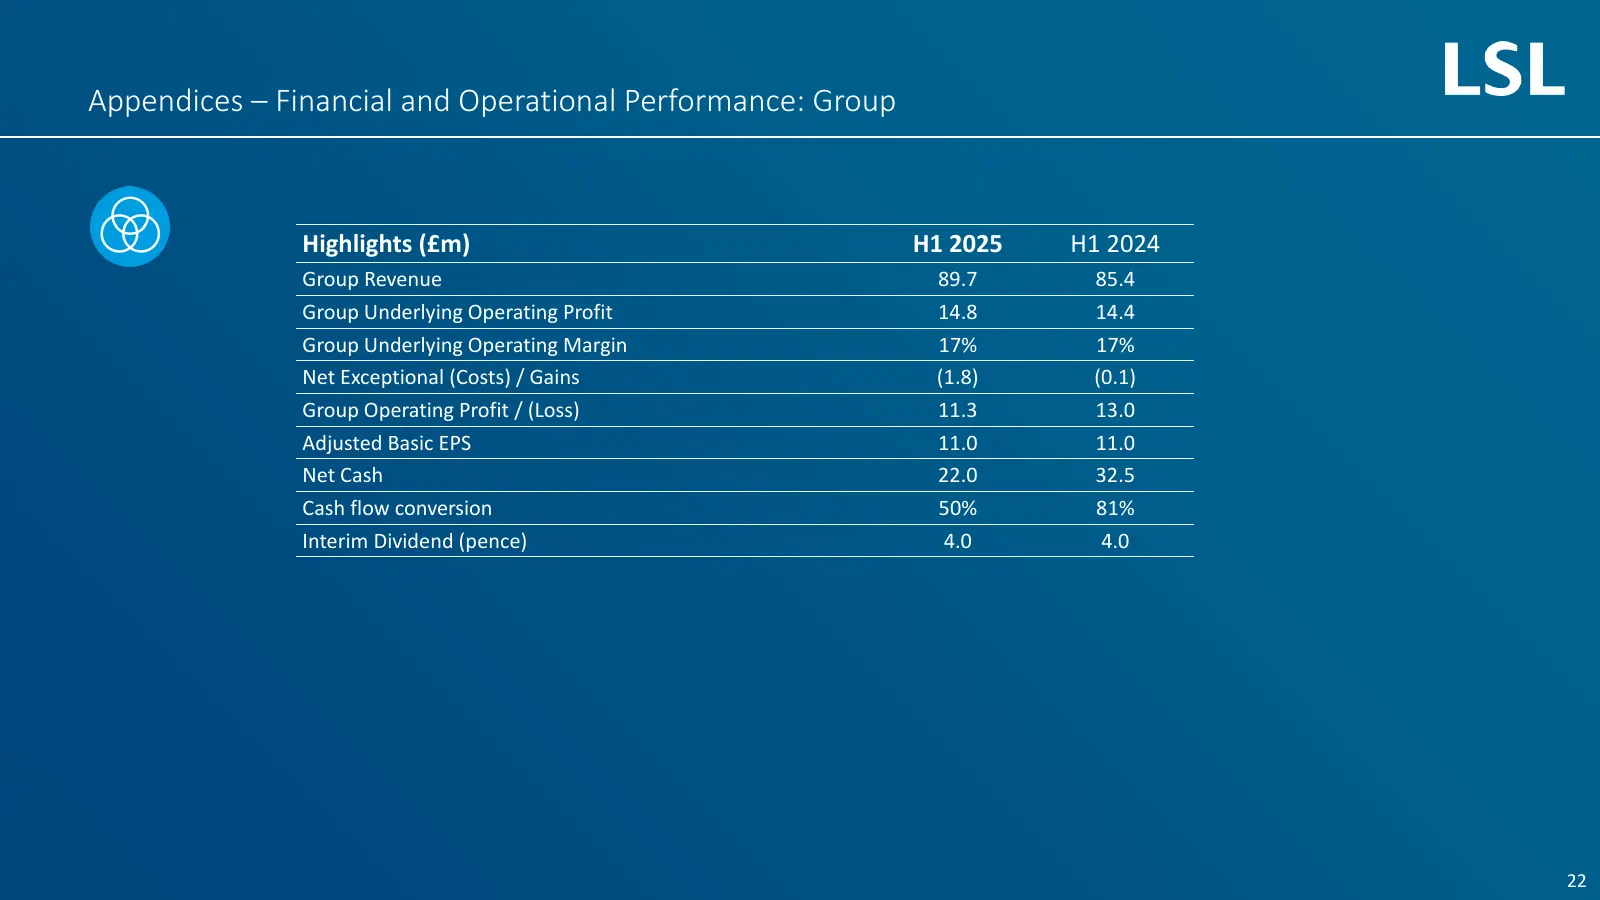
Slide 22: Appendices – Financial and Operational Performance: Group
Appendices – Financial and Operational Performance: Group Highlights (£m) H1 2025 H1 2024 Group Revenue 89.7 85.4 Group Underlying Operating Profit 14.8 14.4 Group Underlying Operating Margin 17% 17% Net Exceptional (Costs) / Gains (1.8) (0.1) Group Operating Profit / (Loss) 11.3 13.0 Adjusted Basic
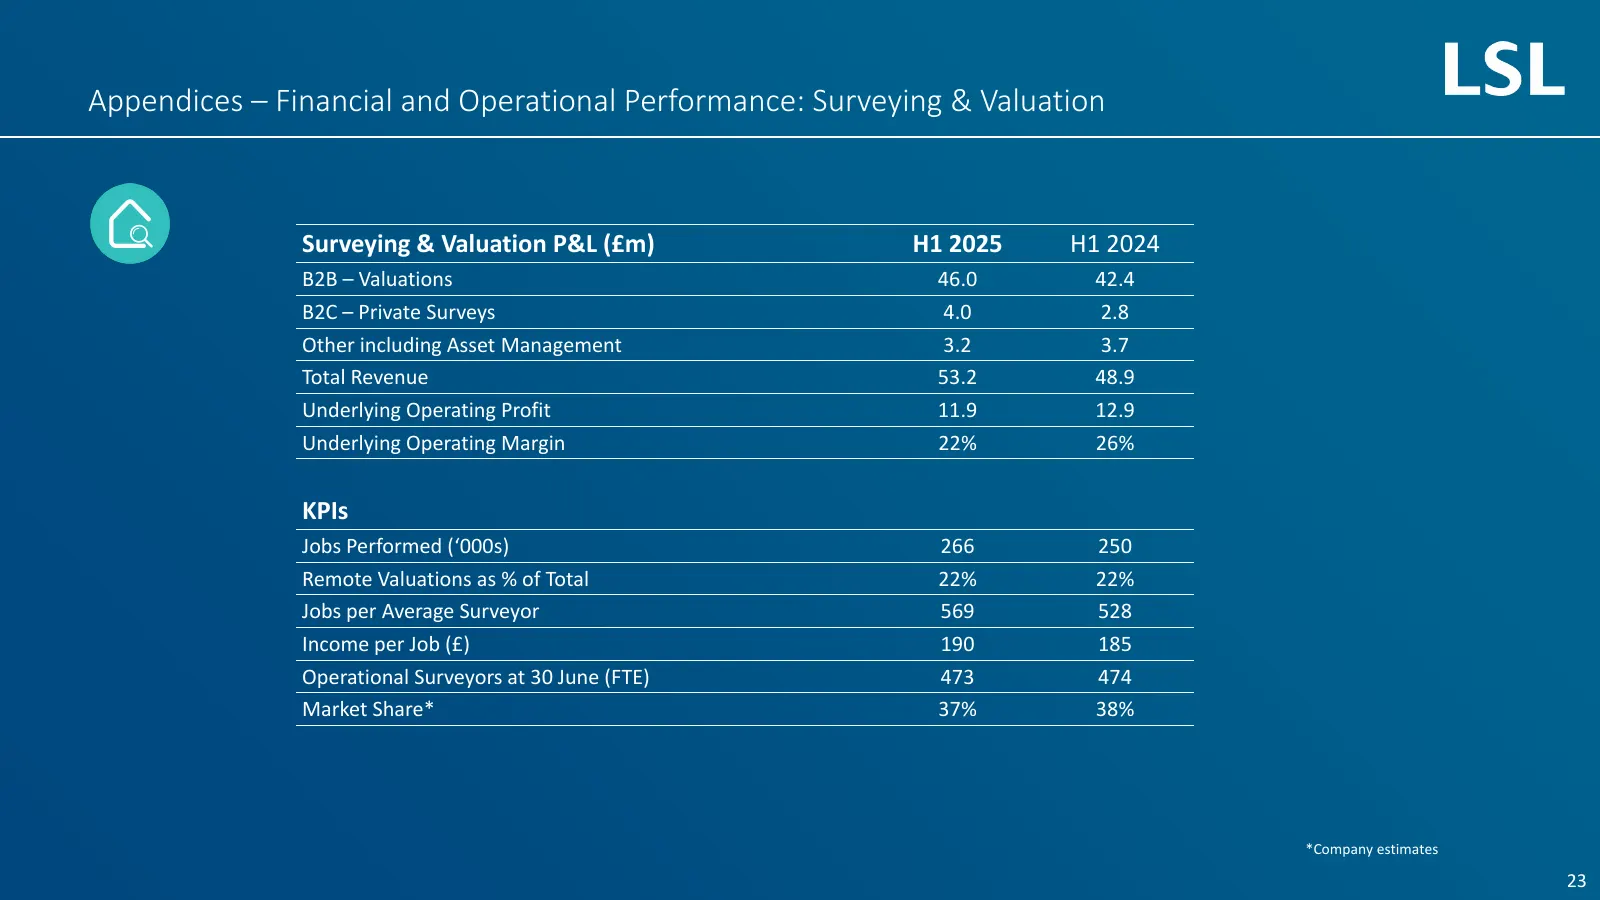
Slide 23: Appendices – Financial and Operational Performance: Surveying & Valuation
Appendices – Financial and Operational Performance: Surveying & Valuation Surveying & Valuation P&L (£m) H1 2025 H1 2024 B2B – Valuations 46.0 42.4 B2C – Private Surveys 4.0 2.8 Other including Asset Management 3.2 3.7 Total Revenue 53.2 48.9 Underlying Operating Profit 11.9 12.9 Underlying Operatin
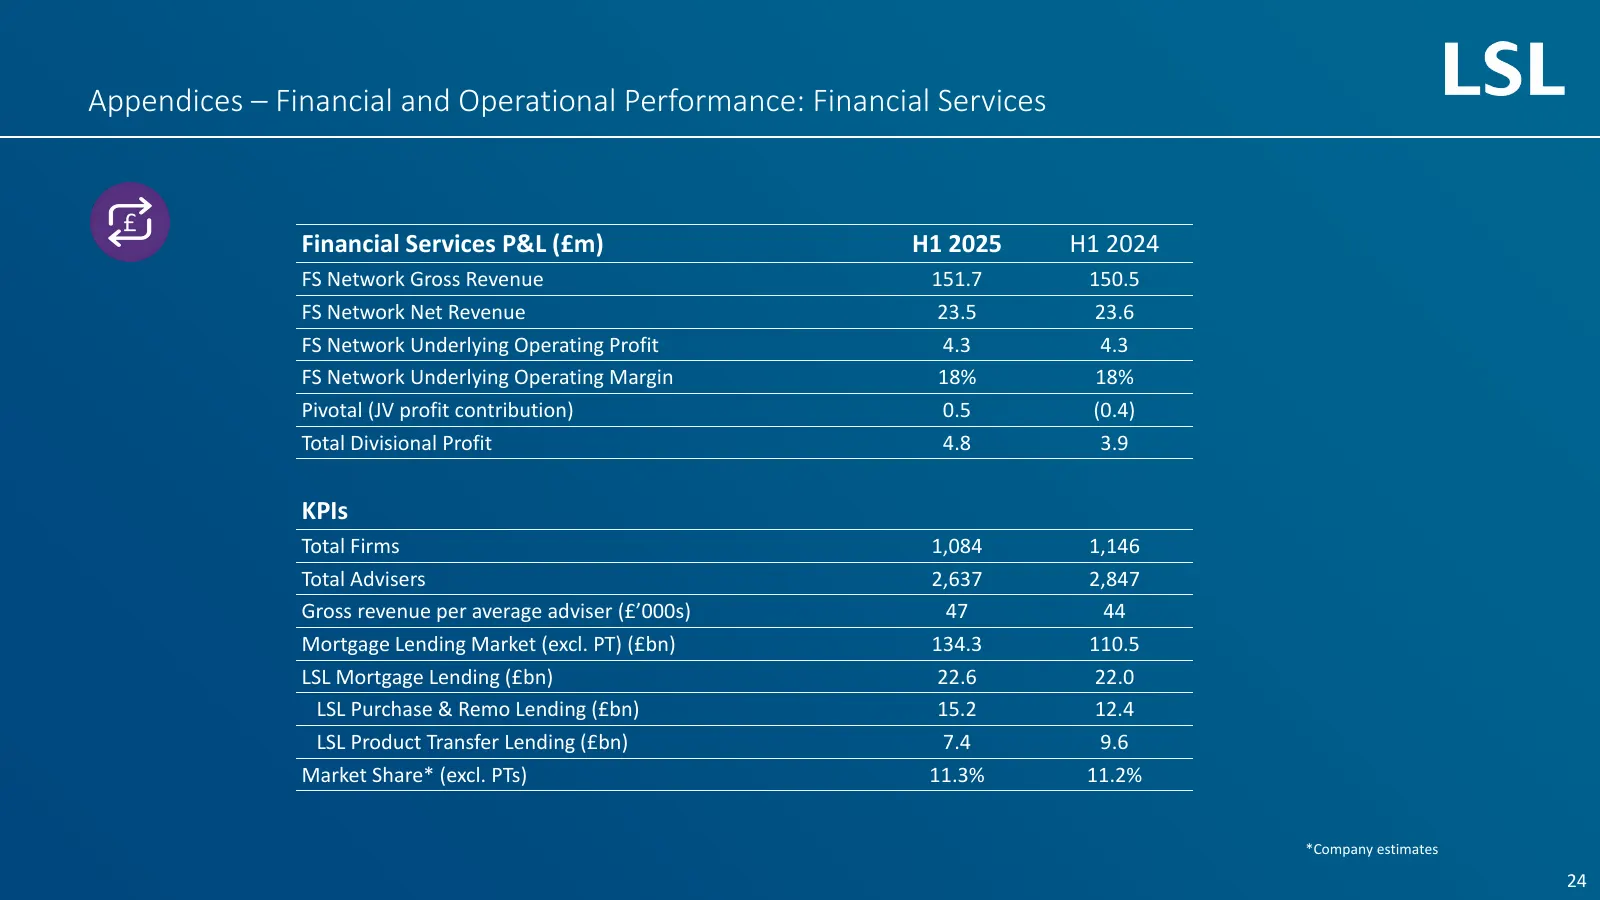
Slide 24: Appendices – Financial and Operational Performance: Financial Services
Appendices – Financial and Operational Performance: Financial Services Financial Services P&L (£m) H1 2025 H1 2024 FS Network Gross Revenue 151.7 150.5 FS Network Net Revenue 23.5 23.6 FS Network Underlying Operating Profit 4.3 4.3 FS Network Underlying Operating Margin 18% 18% Pivotal (JV profit co
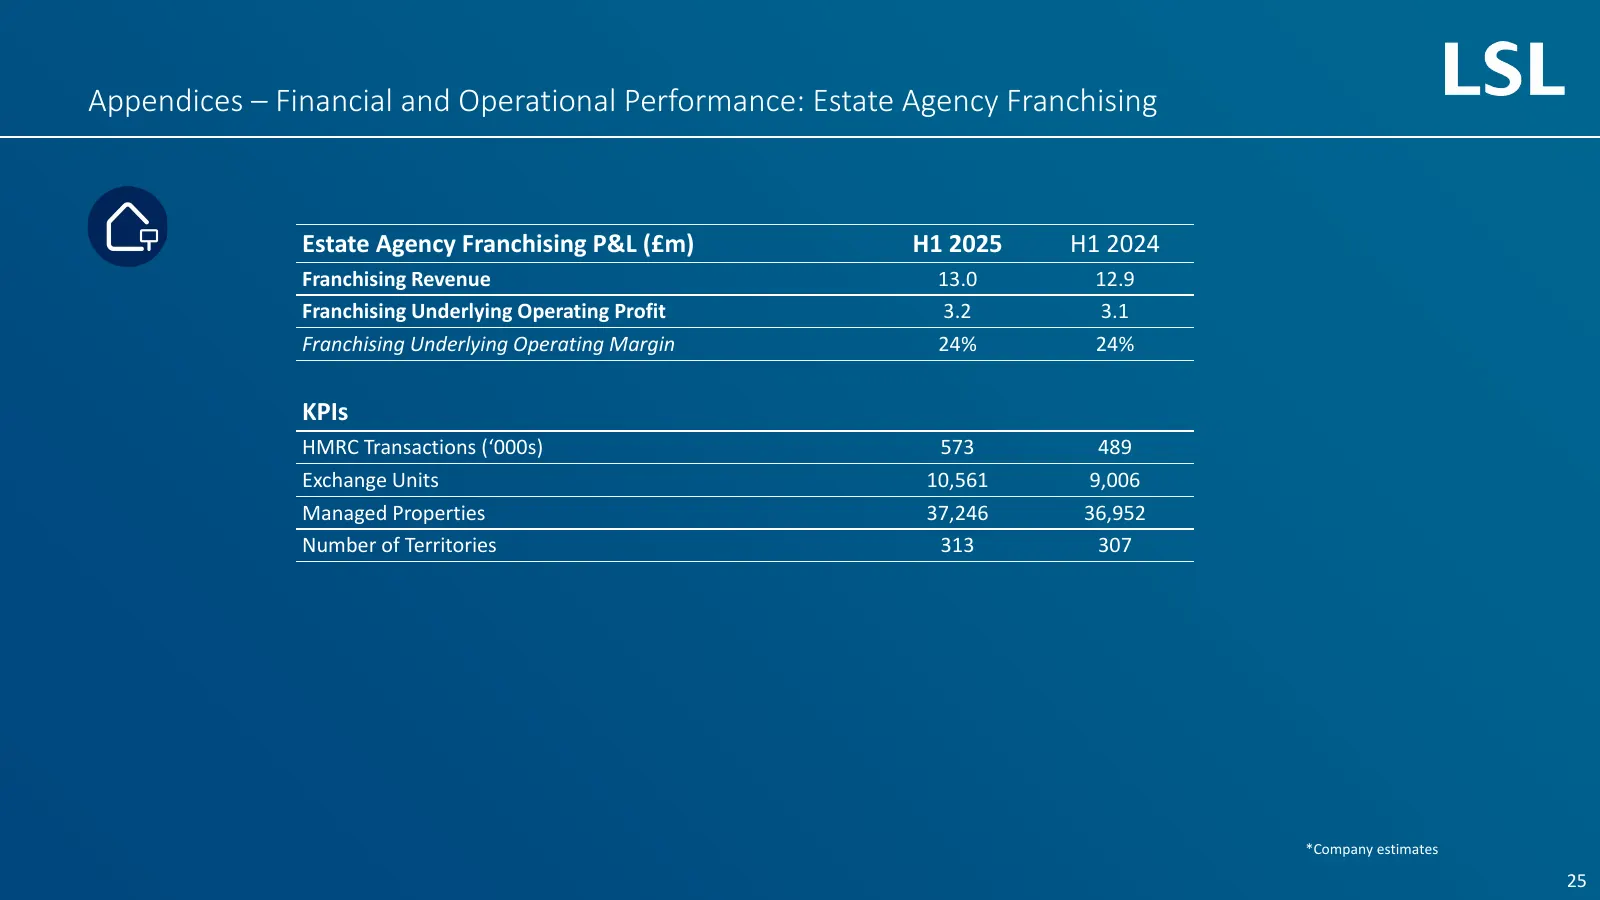
Slide 25: Appendices – Financial and Operational Performance: Estate Agency Franchising
Appendices – Financial and Operational Performance: Estate Agency Franchising Estate Agency Franchising P&L (£m) H1 2025 H1 2024 Franchising Revenue 13.0 12.9 Franchising Underlying Operating Profit 3.2 3.1 Franchising Underlying Operating Margin 24% 24% KPIs HMRC Transactions (‘000s) 573 489 Exchan
Slide 26: Forward Looking Statements
Appendices Forward Looking Statements This document contains certain statements that are forward-looking statements. They appear in a number of places throughout this document and include statements regarding our intentions, beliefs or current expectations and those of our officers, directors and em
More decks from LSL Property Services plc
 H1 2026 Earnings Presentation25 slides · September 2026
 FY2025 Earnings Presentation25 slides · Mar 19, 2026
 Investor Presentation (November 2025)15 slides · November 2025
 H1 2024 Earnings Presentation16 slides · Sep 18, 2024
 H1 2023 Earnings Presentation21 slides · September 2023
 H1 2022 Earnings Presentation29 slides · Aug 3, 2022